Report on global status of statistical business register ... · Report on global status of...
55
Report on global status of statistical business register programmes Report on global status of statistical business register programmes UN Department of Economic and Social Affairs Statistics Division, Trade Statistics Branch August 2014 Abstract The first part of this Report provides an overview of the role of Statistical Business Register programmes in supporting an integrated approach to the compilation of official economic statistics, and an introduction to some of the main recommendations and good practices for the development, maintenance and use of SBRs. Its second part contrasts these recommen- dations and good practices with the results of a Global Survey conducted by the United Nations Statistics Division (UNSD), with the objective of assessing the current status of SBR programmes across countries in different regions of the world and with different degrees of economic development. A. Introduction 1. Role of Statistical Business Registers in official economic statistics. Statistical Business Registers (SBRs) are an essential part of a country’s statistical infrastructure required for the compilation of official economic statistics, along with economic censuses, which are conducted approximately every five to ten years, and regular economic surveys, which are conducted more frequently. The development and maintenance of SBRs are directly related to the implementation of the recommendations for the System of National Accounts 2008 (SNA 2008) 1 , the International Recommendations for Industrial Statistics 2008 (IRIS 2008), 2 and the Guidelines on Integrated Economic Statistics adopted by the United Nations Statistical Commission at its forty-second session in 2011. 3 2. Importance of the SBR to improve survey coordination and reduction of survey-response burden. An SBR constitutes a crucial resource for the adequate planning, conduction and coordination of statistical surveys of enterprises and other economic units. An up-to-date business survey frame is required for the efficient selection of samples, and provides an efficient way for managing and coordinating surveys which are applied at different points 1 Available from http://unstats.un.org/unsd/nationalaccount/sna2008.asp 2 Available from http://unstats.un.org/unsd/EconStatKB/Attachment387.aspx 3 See http://unstats.un.org/unsd/nationalaccount/ies/ 1
Transcript of Report on global status of statistical business register ... · Report on global status of...

Report on global status of statistical business register programmes
Report on global status of statistical businessregister programmes
UN Department of Economic and Social AffairsStatistics Division, Trade Statistics Branch
August 2014
Abstract
The first part of this Report provides an overview of the role of Statistical Business Registerprogrammes in supporting an integrated approach to the compilation of official economicstatistics, and an introduction to some of the main recommendations and good practices forthe development, maintenance and use of SBRs. Its second part contrasts these recommen-dations and good practices with the results of a Global Survey conducted by the UnitedNations Statistics Division (UNSD), with the objective of assessing the current status of SBRprogrammes across countries in different regions of the world and with different degrees ofeconomic development.
A. Introduction
1. Role of Statistical Business Registers in official economic statistics. Statistical BusinessRegisters (SBRs) are an essential part of a country’s statistical infrastructure requiredfor the compilation of official economic statistics, along with economic censuses, whichare conducted approximately every five to ten years, and regular economic surveys,which are conducted more frequently. The development and maintenance of SBRs aredirectly related to the implementation of the recommendations for the System of NationalAccounts 2008 (SNA 2008)1, the International Recommendations for Industrial Statistics2008 (IRIS 2008),2 and the Guidelines on Integrated Economic Statistics adopted by theUnited Nations Statistical Commission at its forty-second session in 2011.3
2. Importance of the SBR to improve survey coordination and reduction of survey-responseburden. An SBR constitutes a crucial resource for the adequate planning, conduction andcoordination of statistical surveys of enterprises and other economic units. An up-to-datebusiness survey frame is required for the efficient selection of samples, and provides anefficient way for managing and coordinating surveys which are applied at different points
1Available from http://unstats.un.org/unsd/nationalaccount/sna2008.asp2Available from http://unstats.un.org/unsd/EconStatKB/Attachment387.aspx3See http://unstats.un.org/unsd/nationalaccount/ies/
1

Report on global status of statistical business register programmes
in time or across different domains or geographic areas. This is particularly true in thecase of sub-annual surveys, where the need to ensure an overlap of sampled units fromperiod to period needs to be balanced against the need to avoid imposing an excessiveresponse burden on individual economic units.
3. Increasing need for multi-dimensional and detailed information about economic units. Nationalstatistical systems are increasingly asked to provide information about the relationshipbetween the economic activity in a country or region and the characteristics of its eco-nomic units. For example, users are often interested in the analysis of issues such asbusiness demographics, international trade flows by enterprise characteristics, the indus-trial organization and internationalization of supply chains, and the impact of evolvingrelationships of ownership and control on the concentration of production factors. In thisconnection, SBRs are increasingly viewed not only as providing a sample framework anda tool for survey design and coordination, but as a source of business demographic andstructural information in their own right.
4. International harmonization of statistical business registers. To produce official economicstatistics which are consistent and comparable both across countries and across statisticaldomains, it is necessary to develop a common framework for the harmonization of nationalstatistical business registers, so as to ensure the use of standard classifications, definitionsand processes to the maximum extent possible. The development and standardizationof SBRs can thus make a significant contribution for the improvement of the quality ofstatistical outputs. Further, one of the main aims of the harmonization of SBRs acrosscountries is to enable the creation of regional or global registers of multinational enterprisegroups (such as the EuroGroups Register for the European Union).The harmonization ofSBR definitions refers to both the statistical units and of their characteristics. Similarly,the harmonization of SBR updating and maintenance processes and rules includes suchprocedures as those employed for creating or modifying individual records for new andexisting statistical units, for establishing the relationships between different units, and forensuring the quality of the SBR.
5. Need to adapt to the specific situation of the statistical infrastructure in different countries. Acentral, general-purpose business register provides a uniquely identified list of statisticalunits to which all statistical processes or products make reference. To ensure, amongother things, the standardization of data collections in terms of coverage, definitionand classification of statistical units, the frame for all enterprise surveys used in thecompilation of official economic statistics should ideally be derived from a central SBR. Inpractice, however, many countries do not have such a central SBR as part of their basicstatistical infrastructure, and rely instead on ad-hoc or stand-alone listings of enterprisesfor their different statistical compilations. In this connection, the most pressing issuesfaced by many developed countries in the development and maintenance of SBRs are oftenvery different from those of more developed countries. Therefore, in the development ofinternational guidelines and standards for business registers it is important to addressthe specific needs of less developed countries.
2

Report on global status of statistical business register programmes
6. Characteristics of statistical units. Regardless of the level of complexity and sophisticationof a country’s SBR programme, at a minimum it must maintain up-to-date and sufficientcontact information (e.g., name, postal address, telephone number and e-mail address),and keep track of additional information that allows for the classification of economicunits according to their institutional sector, economic activity, and size (e.g., in terms ofemployment).
7. Coverage of SBR. One of the main criteria to assess the quality of a SBR is the com-prehensiveness of its coverage. Ideally, a country’s SBR should record all the enterprises(and their associated legal units and local units), as well as the domestic component ofenterprise groups that contribute to the generation of GDP. However, it is impossible tomaintain an SBR that reflects the exact population of all the economic units that contributeto the GDP at any given point in time. Notwithstanding, the agencies responsible for thedevelopment and maintenance of SBRs should continuously assess whether the omissionof any specific group of units is significant and whether it is admissible in light of itsrelative economic or analytic importance.
8. For instance, some economies may have a large number of households engaged inproduction agricultural products other than for own consumption, making it necessary toconduct special area surveys and studies in order to ensure an adequate coverage of thehousehold sector within of the SBR. Similarly, access to specific administrative recordsmay need to be developed in order to cover units of the government sector in the SBR, soas to ensure that the statistics on the economic activity of government units are consistentwith other those of other sectors in terms of classifications, definitions, and coverage.
9. Confidentiality issues. Often, the identifiers used in business registers are not purelyrandom numbers, as they usually contain some embedded information that can beinterpreted by anyone familiar with the identification system. However, seeminglyinconsequential information included in an identifier can sometimes be used to discoverconfidential information about individual units. Therefore, the safest identifiers arerandom character strings containing no information whatsoever. De-identification is theprocess of removing “name-linking information”, i.e., information from a data record thatcan potentially be used to link the record to the public name of the record’s unit. Themost obvious items to be removed in the de-identification process are the unit’s legal orcommercial name, its address (which could be linked to the name), and date of birth (incase of natural persons acting as economic units).
10. Management of an SBR programmes. Managing an SBR programmes is a complexendeavors that requires a substantive initial investment in order to develop the necessaryset of skills and infrastructure. For instance, registration of new statistical units needs tobe carried out by trained specialists well versed in the registration policies and who haveenough background knowledge as to be able to authenticate the identity of the units beingregistered. Also, the SBR programme must be supported by an information system thatallows to manage the characteristics and interrelationships of the units being registered.
3
Report on global status of statistical business register programmes
B. Global assessment report
B.1. Introduction
11. Timeframe and geographic coverage of the Global Assessment Survey questionnaire. Thissection presents the results of a Global Assessment Survey on the current status ofStatistical Business Register programmes, conducted between May and July 2013 by theUnited Nations Statistics Division. This Global Survey was oriented to all countries,regardless of their position along the spectrum of SBR development, from those thatrely on ad-hoc lists of enterprises to those that have a highly sophisticated SBR at thecore of their national statistical systems. While the survey was addressed directly tothe National Statistical Offices of more than 200 countries and areas, respondents wereencouraged to consult with other agencies of their respective National Statistical Systemswhen producing their answers. A total of 116 countries and areas responded to thequestionnaire, as detailed in Table 1.4
Table 1: Number of respondents to the questionnaire, by region
No. ofRegion respondents
Developed countries 39Developing countries 77
Africa 23CIS 8Eastern, South-Eastern, Southern Asia 17Latin America and the Caribbean 18Oceania 1South-Eastern Europe 5Western Asia 5
Non-OECD 84OECD 32Total 116
12. Topics covered by the Global Assessment Survey questionnaire. Countries were able torespond to the Global Assessment Survey through an on-line version of the questionnaireor by submitting their responses via e-mail. The questionnaire, which was identical inboth versions, is included in Annex 2 of this report. It addressed the following topics:
• Coverage of the different industrial sectors• Types of statistical units included in the SBR
4See Appendix 1 for the composition of geographic and economic groups used in this report for analyticpurposes.
4

Report on global status of statistical business register programmes
• Classification of economic activities used in the SBR• Coverage of public sector, private sector, and self-employed units• Coverage in terms of minimum number of employees and other cut-off points• Data sources used for different unit characteristics• Frequency of updates for different unit characteristics• Availability of cross-references among units of the SBR• Time gap between register updates and sample selection• Documentation of error handling• Availability of an identity number• Linking of SBR records with external sources• Aspects of the maintenance and updating of the SBR mandated by a legal act• Continuity rules• Compilation of business demographics• SBR documentation• Access of SBR data to external users
13. Current regional initiatives for the development of SBRs. The Global Assessment Surveywas conducted at a time when various regional initiatives on the development of SBRsare coming to fruition. These include, among others:
(1) The development of Guidelines for Building Statistical Business Registers in Africa,commissioned by the African Development Bank within the framework of its Statis-tical Capacity Building Program.
(2) The creation of a UNECE Task Force, within the frame of the Conference of EuropeanStatisticians, to produce a set of international guidelines and recommendations ofgood practices on statistical business registers with the aim of helping countriesdevelop and maintain their registers and improve their international comparability.5
(3) A multi-year project, funded by the Inter-American Development Bank under theauspices of the Statistical Conference of the Americas, in which 11 Latin Americancountries took part with the aim of defining a regional strategy for the design,implementation and management of Statistical Business Registers, as well as aregional action plan for the execution of this strategy.6
(4) The endorsement by UNESCAP Committee on Statistics of the Regional programmefor the improvement of economic statistics in Asia and the Pacific and the Implemen-tation plan for the regional programme at its sessions in 2010 and 2012 respectively,
5See See http://www.unece.org/statshome/areas-of-work/statsarchiveact02e/statsarchive0210be/task-force-business-registers.html
6See http://www.eclac.cl/deype/noticias/documentosdetrabajo/7/51327/LCL3707i.pdf
5
Report on global status of statistical business register programmes
which recognize the need to establish and improve SBRs in Asia and the Pacific as atop regional priority for statistical development.7
B.2. Legal framework and institutional arrangements
14. Importance of the legal and institutional framework. The legal framework and institutionalarrangements facilitate the effective development, maintenance and use of a statisticalbusiness register. All aspects the SBR programme depend upon them—from determiningwhich data sources are available for its construction and maintenance, to establishing therange of valid users and uses of the information derived from it.
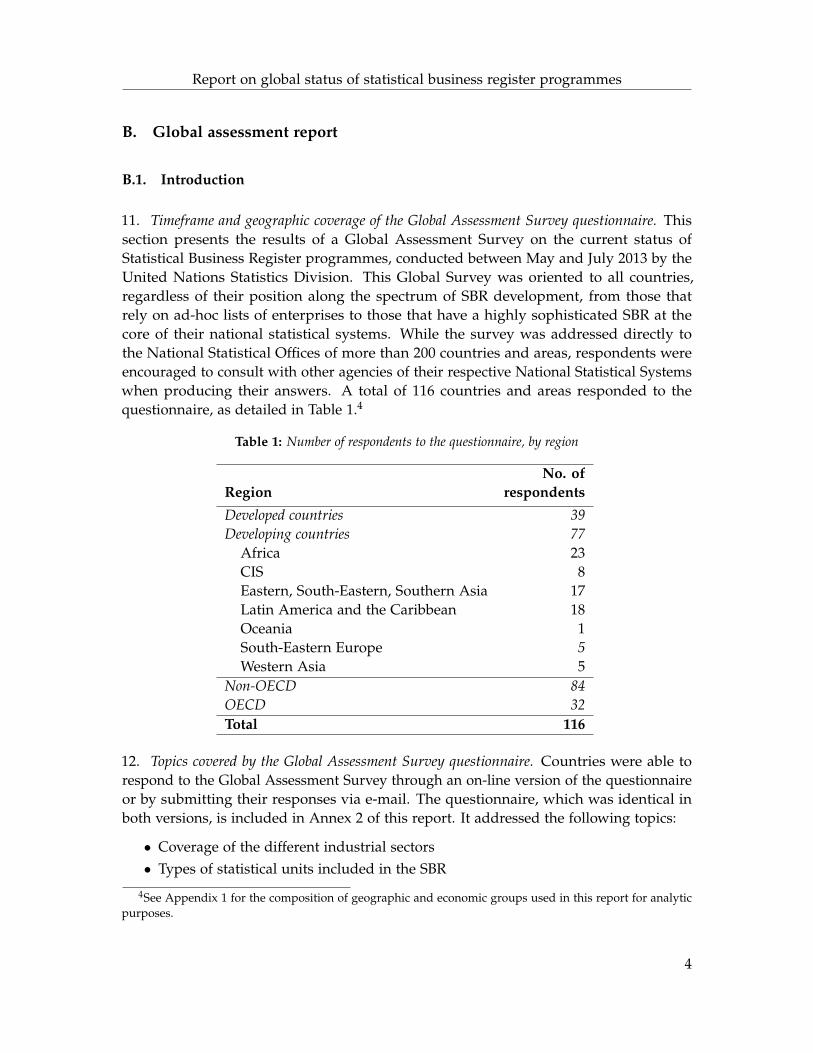
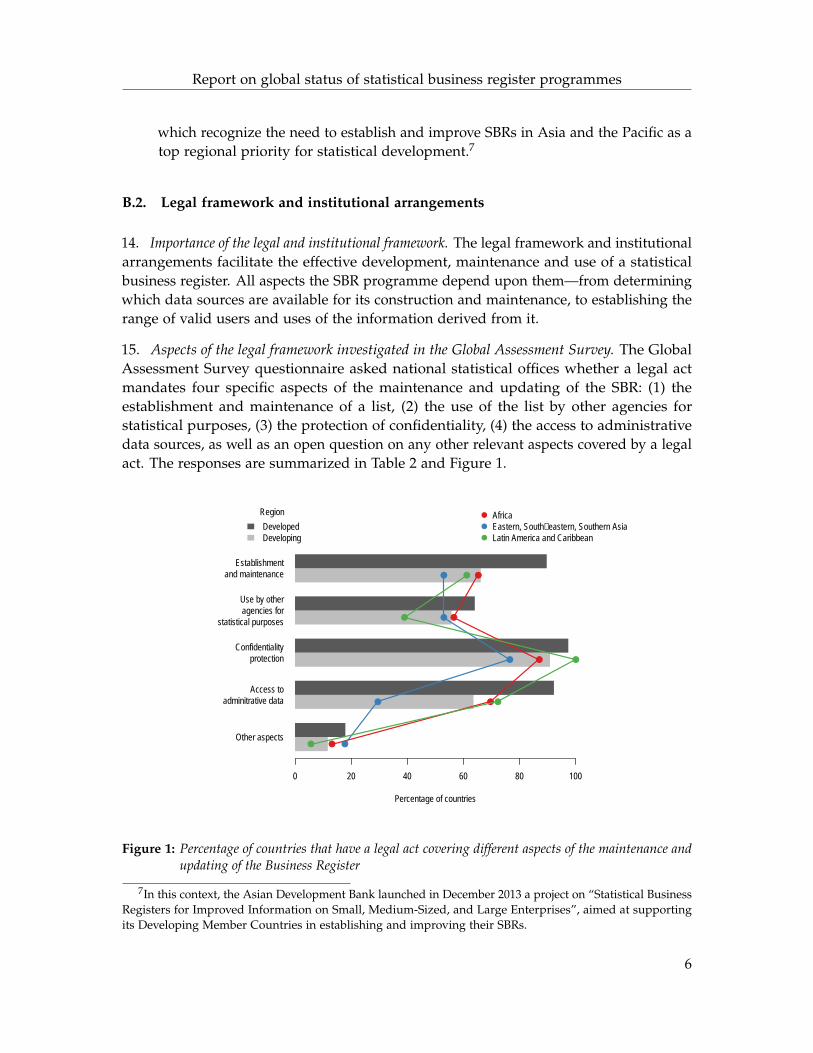
15. Aspects of the legal framework investigated in the Global Assessment Survey. The GlobalAssessment Survey questionnaire asked national statistical offices whether a legal actmandates four specific aspects of the maintenance and updating of the SBR: (1) theestablishment and maintenance of a list, (2) the use of the list by other agencies forstatistical purposes, (3) the protection of confidentiality, (4) the access to administrativedata sources, as well as an open question on any other relevant aspects covered by a legalact. The responses are summarized in Table 2 and Figure 1.
Other aspects
Access toadminitrative data
Confidentialityprotection
Use by otheragencies for
statistical purposes
Establishmentand maintenance
Percentage of countries
0 20 40 60 80 100
Region
DevelopedDeveloping
●
●
●
●
●
●
●
●
●
●
●
●
●
●
●
●
●
●
AfricaEastern, South−eastern, Southern AsiaLatin America and Caribbean
Figure 1: Percentage of countries that have a legal act covering different aspects of the maintenance andupdating of the Business Register
7In this context, the Asian Development Bank launched in December 2013 a project on “Statistical BusinessRegisters for Improved Information on Small, Medium-Sized, and Large Enterprises”, aimed at supportingits Developing Member Countries in establishing and improving their SBRs.
6
Report on global status of statistical business register programmes
Establish-ment and
mainte-nance
Use byother
agenciesfor
statisticalpurposes
Confiden-tiality
protection
Access toadminis-
trativedata
Otheraspects
Developed 89.7 64.1 97.4 92.3 17.9
Developing 66.2 55.8 90.9 63.6 11.7
Africa 65.2 56.5 87.0 69.6 13.0
Eastern, South-eastern,Southern Asia
52.9 52.9 76.5 29.4 17.6
Latin America andCaribbean
61.1 38.9 100.0 72.2 5.6
Other developing 84.2 73.7 100.0 78.9 10.5
CIS 87.5 87.5 100.0 100.0 12.5
Oceania 0.0 100.0 100.0 100.0 100.0
South-Eastern Europe 100.0 40.0 100.0 80.0 0.0
Western Asia 80.0 80.0 100.0 40.0 0.0
Non-OECD 65.5 57.1 91.7 65.5 11.9
OECD 96.9 62.5 96.9 93.8 18.8
Total 74.1 58.6 93.1 73.3 13.8
Table 2: Percentage of countries that have a legal act covering different aspects of the maintenance andupdating of the Business Register
16. In general terms, the proportion of countries that report having a legal framework tosupport their SBR programmes is larger among developed than among developing countries. Thisis particularly true for the presence of a legal mandates to establish and maintain anSBR and to enable the access to administrative data, where the difference between thetwo groups of countries is considerable. However, the contrast between developed anddeveloping countries is not as strong for the protection of confidentiality and regardingthe use of SBR data by other agencies for statistical purposes.
17. Many developing countries lack an explicit legal mandate for the establishment and mainte-nance of an SBR. Although 74.1 percent of all respondents reported having a legal mandateto establish and maintain an SBR, the difference between developed and developingcountries is substantial. While most developed countries (89.7 percent) have this mandate,only 66.2 percent of developing countries do. In particular, the developing countries orareas in Eastern, South-Eastern, and Southern Asia, in Latin America and the Caribbean,and in Africa, are the least likely to have a legal mandate to establish and maintain an
7

Report on global status of statistical business register programmes
SBR (with 52.9 percent 61.1 percent, and 65.2 percent, respectively). This is in contrast toother developing countries from South-Eastern Europe, Western Asia, and the CIS region(of which 84.2 percent report a positive answer). It is also worth noting that only oneOECD member lacks a legal mandate for the establishment and maintenance of the SBR.
18. A substantial number of developing countries lack the legal mandate to access administrativedata sources to maintain and update their SBRs. This is particularly true for countries inEastern, South-eastern and Southern Asia, and in Western Asia, where only 29 percentand 40 percent, respectively, provided a positive answer. This situation may be to multiplefactors, including the fact that in many developing countries administrative informationsystems are less widespread.
19. A large proportion of countries lack a legal framework regulating the use of SBR data by otheragencies. Among all respondents, only 58.6 percent of countries have a legal frameworkallowing the use of SBR data by other agencies for statistical purposes. Nevertheless,while the proportion of developed countries that allowed this (64.1 percent) was higherthan in the case of developing countries (55.8 percent), the gap between developed anddeveloping countries was not as large as in the other aspects discussed in the precedingtwo paragraphs. The regions that had the lowest proportion of countries with a legalframework allowing the use of SBR data by other agencies were Latin America andCaribbean (38.9 percent), South-Eastern Europe (40.0 percent), and the Eastern, SouthEastern and South Asia region (52.9 percent)
20. The vast majority of countries have a legal framework for the protection of confidentialityconfidentiality. As shown by the responses to the Global Assessment Survey, there is a highlevel of awareness among most countries, both developed and developing, with respect tothe protection of confidentiality, with 97.4 percent of developed countries and 90.0 percentof developing countries declaring to have a legal mandate in this regard. Nevertheless,there are a few countries still lagging in this dimension. In particular, the legal protectionof confidentiality is less common in Eastern, South Eastern and Southern Asia (with only76 percent of countries of this region providing a positive response to this question).
21. Some of the legal rules related to the maintenance and updating of the SBR might haveconflicting objectives. For instance, allowing for the exchange of data between agencies forstatistical purposes may be in contradiction with the need to protect confidentiality. Theresponses to the Global Survey reveal this difficulty, and highlight the need to exploreways, technical or otherwise, in which the access of SBR data can be extended whilesimultaneously protecting confidentiality. Also, the results underscore the need to explorefurther the hierarchy of the legal instruments that have an impact on the SBR programmesagainst the priorities of set forth by the National Statistical System for the compilation ofofficial economic statistics.
22. Different aspects of the legal framework are closely interrelated. For instance, countries thathave legal mandates for the establishment and maintenance of a list are also more likely
8

Report on global status of statistical business register programmes
to have legal mandates for accessing administrative data sources for the maintenanceof the SBR, as well as for the use of SBR data by other agencies for statistical purposes.Similarly, countries that have legal acts for protection of confidentiality are also likely tohave legal provisions for use by other agencies and access to administrative data. Theselegal provisions, therefore, seem to come together in a “bundle”—having one makes itlikely to have another.
23. Most countries have a legal framework covering at least some aspects of the maintenance andupdating of an SBR. Of a total of 116 countries, only four—Morocco, Ethiopia, Bhutan,India, and Maldives—responded that they do not have a legal framework in place forany of the four aspects included in the Global Survey. However, even countries that donot have any specific legislation mandating the establishment of a business register (forinstance, Bhutan) may have some regulatory framework in place enabling the creation andmaintenance of business registers (e.g., in the form of broad executive orders to compilenational accounts statistics, conduct sectorial surveys, etc.) Open-ended responses alsosuggest that most countries have a multitude of legal instruments in place, ranging fromspecific Business Register acts to broader instruments such as legal acts on the compilationof National Accounts, income tax laws, and cooperation agreements on data transfer,which provide the basis for maintaining and running an SBR programme.
B.3. Classification of economic activities
24. Importance of using a standard industrial classification in the SBR. The use of a standardindustrial classification is indispensable to describe in a comparable and consistent mannerthe kind of economic activities carried out by the statistical units included in the SBR. Theclassification of economic activities is not only important as a stratification variable forthe adequate selection of samples from the SBR (in its role as a statistical framework foreconomic surveys), but crucially enables the SBR to become a powerful instrument in thestatistical infrastructure of a country for the integration of economic statistics, includingwithin the framework of the System of National Accounts.
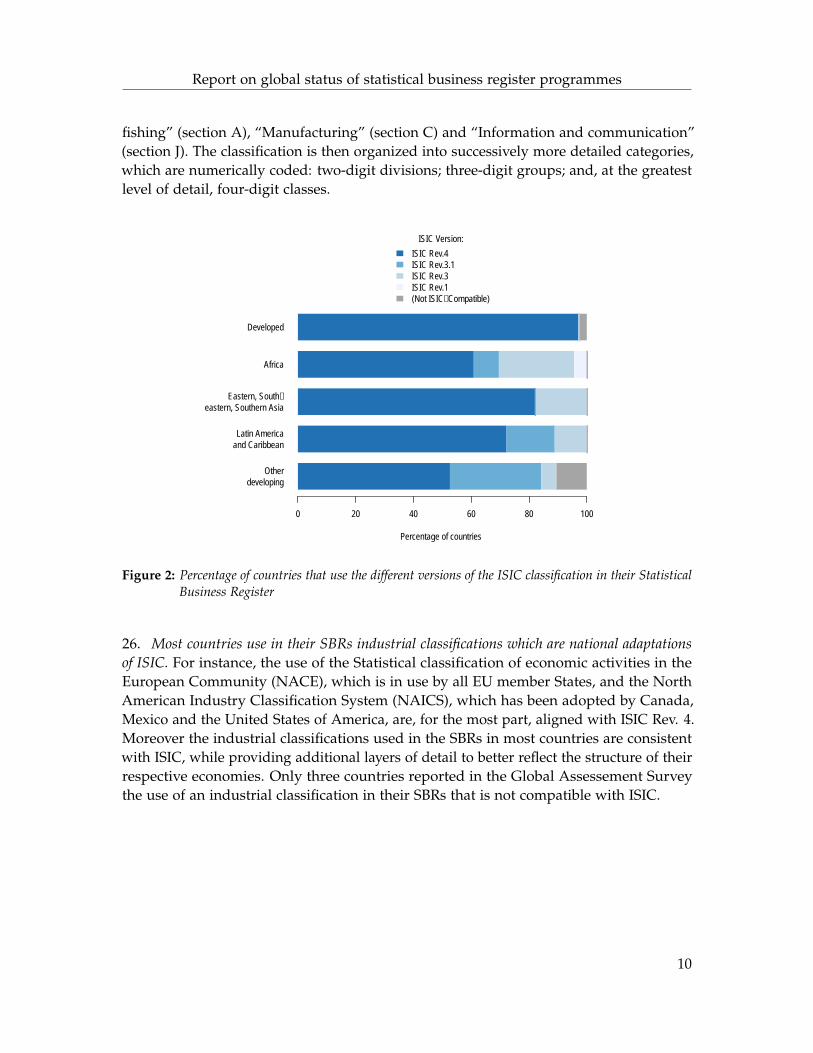
25. The International Standard Industrial Classification of all Economic Activities (ISIC) as thepreferred classification for economic units in the SBR. The System of National Accounts (SNA2008) recommends the use of the International Standard Industrial Classification of allEconomic Activities (ISIC) in the compilation of the production account and the generationof income accounts by industry. The fourth and most recent revision, ISIC, Rev.4, is theoutcome of a review process that spanned several years and involved contributions frommany classifications experts and users around the world. The economic activities in ISICare subdivided in a hierarchical, four-level structure of mutually exclusive categories.The categories at the highest level are called sections, which are alphabetically codedcategories intended to facilitate economic analysis. The sections subdivide the entirespectrum of productive activities into broad groupings, such as “Agriculture, forestry and
9
Report on global status of statistical business register programmes
fishing” (section A), “Manufacturing” (section C) and “Information and communication”(section J). The classification is then organized into successively more detailed categories,which are numerically coded: two-digit divisions; three-digit groups; and, at the greatestlevel of detail, four-digit classes.
Otherdeveloping
Latin Americaand Caribbean
Eastern, South−eastern, Southern Asia
Africa
Developed
Percentage of countries
0 20 40 60 80 100
ISIC Version:
ISIC Rev.4ISIC Rev.3.1ISIC Rev.3ISIC Rev.1(Not ISIC−Compatible)
Figure 2: Percentage of countries that use the different versions of the ISIC classification in their StatisticalBusiness Register
26. Most countries use in their SBRs industrial classifications which are national adaptationsof ISIC. For instance, the use of the Statistical classification of economic activities in theEuropean Community (NACE), which is in use by all EU member States, and the NorthAmerican Industry Classification System (NAICS), which has been adopted by Canada,Mexico and the United States of America, are, for the most part, aligned with ISIC Rev. 4.Moreover the industrial classifications used in the SBRs in most countries are consistentwith ISIC, while providing additional layers of detail to better reflect the structure of theirrespective economies. Only three countries reported in the Global Assessement Surveythe use of an industrial classification in their SBRs that is not compatible with ISIC.
10

Report on global status of statistical business register programmes
Not ISIC-compatible
classification
ISICRev.1
ISICRev.3
ISICRev.3.1
ISICRev.4
Developed 2.6 0.0 0.0 0.0 97.4
Developing 2.6 1.3 15.6 14.3 66.2
Africa 0.0 4.3 26.1 8.7 60.9
CIS 12.5 0.0 12.5 37.5 37.5
Eastern, South- eastern,Southern Asia
0.0 0.0 17.6 0.0 82.4
Latin America andCaribbean
0.0 0.0 11.1 16.7 72.2
Oceania 0.0 0.0 0.0 100.0 0.0
South-Eastern Europe 20.0 0.0 0.0 0.0 80.0
Western Asia 0.0 0.0 0.0 40.0 60.0
Non-OECD 2.4 1.2 14.3 13.1 69.0
OECD 3.1 0.0 0.0 0.0 96.9
Total 2.6 0.9 10.3 9.5 76.7
Table 3: Percentage of countries that use the different versions of the ISIC classification in their StatisticalBusiness Register
27. While ISIC Rev.4 has been adopted by most developed countries, one third of developingcountries still use an earlier version. Thirty eight out of the thirty nine developed countriesincluded in the survey reported using in their SBR a classification of economics activitiesthat is compatible with the most recent version of ISIC (ISIC Rev. 4). Of these countries,ten use the NACE or NAICS classification. In contrast, among developing countries only66.2 per cent use a classification which compatible with ISIC Rev. 4, with 14.3 and 15.6percent using ISIC Rev. 3.1, and and ISIC Rev. 3, respecdtively. Four non-OECD countriesare using the NACE classification. Figure 2 shows the proportion of countries or areasthat has adopted each of the different ISIC revisions in their statistical business registers.
28. The classification of units in the SBR by economic activity is usually detailed at least atthe 4-digit level of ISIC. Among the countries that participated in the Global AssessmentSurvey, the most frequent level of detail in the classification of economic activities is atfour digits, with only ten countries classifying the economic activity of statistical units atthe Section, Division or Group levels (see Table 4). Western Asia and Oceania are the onlytwo regions where the average level of detail was less than that global mode (3-digits),while in Latin America and the Caribbean the average level of detail was 5 digits.
11

Report on global status of statistical business register programmes
Region Finest Average∗ Mostfrequent
Developed 6 4 4
Developing 7 4 4
Africa 6 4 4
Eastern, South-eastern,Southern Asia
6 4 4
Western Asia 4 3 4
CIS 5 4 NA
South-Eastern Europe 4 4 4
Latin America andCaribbean
7 5 4
Oceania 3 3 3
OECD 6 5 4
Non-OECD 7 4 4
Total 7 4 4
∗ Rounded to the nearest integer value
Table 4: Level of detail (number of digits) of the industrial classifications used in the Statistical BusinessRegister
B.4. Definition of statistical units
29. Criteria for the definition of statistical units. Statistical units may be defined followingmany criteria, namely: legal, accounting or organizational criteria; geographical criteria;and economic criteria. The relative importance of these criteria depends on the type ofunit concerned.
30. Need to define and identify sufficiently homogeneous statistical units for the collection of basicstatistics. When considering the economic activity of a unit, a distinction is normally madebetween principal, secondary, and ancillary activities. The principal activity determinesthe classification of the units in the SBR, although secondary and ancillary activitiesmay also be recorded. Ideally, the classification of units by economic activity should bemade at the level of detail in which individual units are sufficiently homogeneous—thus,classification by economic activity is ideally carried out at the level of establishmentand/or kind-of-activity unit.
31. Need to define and identify statistical units to compile economic statistics in the framework ofthe System of National Accounts. The systematic description of the economy, as representedby SNA, analyses two interrelated types of transactors and transactions that require twolevels of statistical units. The establishment, in combination with ISIC and CPC, is used for
12

Report on global status of statistical business register programmes
the analysis of transactions in goods and services and for compilation of the productionaccount. The enterprise is used as the statistical unit for compilation of income accounts,accumulation accounts and balance sheet accounts, as well as in the institutional sectorclassification of economic entities.
Box 1: Definition of different statistical units
EnterpriseAn institutional unit in its capacity as a producer of goods and services is known asan enterprise. An enterprise is an economic transactor with autonomy in respect offinancial and investment decision-making, as well as authority and responsibility forallocating resources for the production of goods and services. It may be engaged inone or more productive activities.
EstablishmentSNA describes the statistical unit to be defined and delineated for industrial or pro-duction statistics as the establishment. The establishment is defined as an enterpriseor part of an enterprise that is situated in a single location and in which only a single(non-ancillary) productive activity is carried out or in which the principal productiveactivity accounts for most of the value added.
Kind-of-activity unitA kind-of-activity unit is an enterprise or part of an enterprise that engages in onlyone kind of productive activity or in which the principal productive activity accountsfor most of the value added. Compared with the establishment, in the case of such aunit, there is no restriction on the geographic area in which the activity is carried outbut it is characterized by homogeneity of activity.
Local unitEnterprises often engage in productive activity at more than one location, and forsome purposes it may be useful to partition them accordingly. Thus, a local unit isdefined as an enterprise or a part of an enterprise (for example, a workshop, factory,warehouse, office, mine or depot) which engages in productive activity at or fromone location. The definition has only one dimension, in that it does not refer to thekind of activity that is carried out.
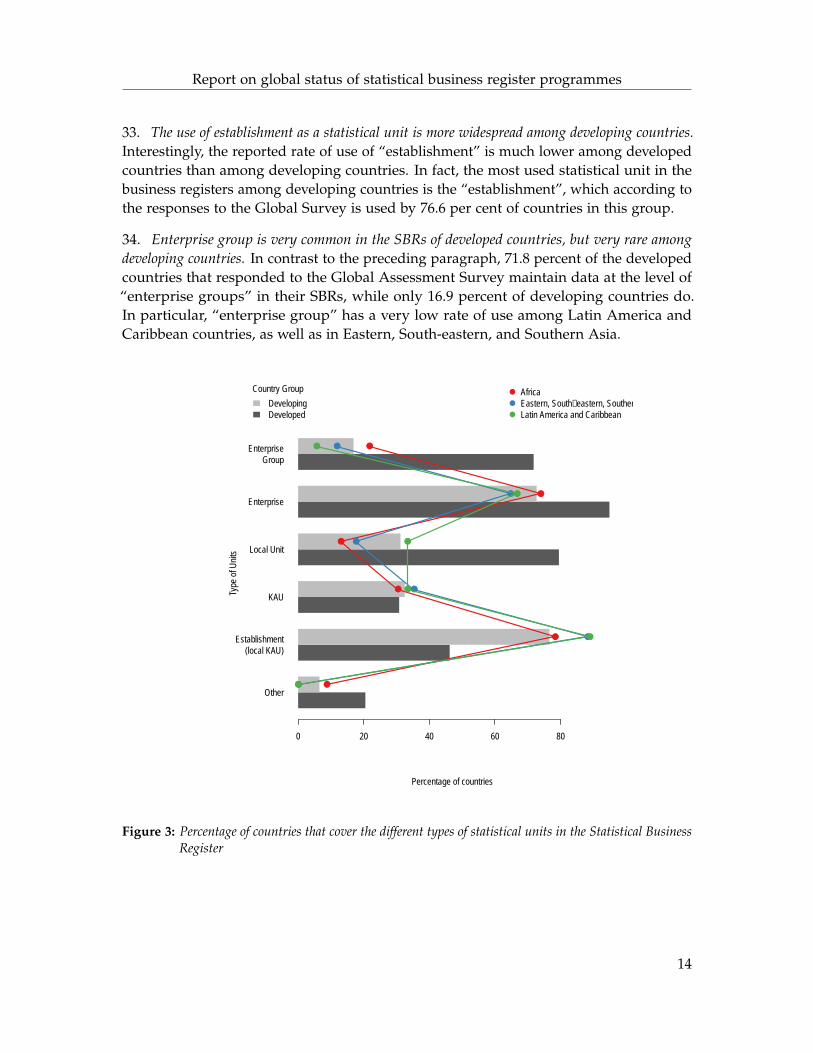
32. The enterprise as the most frequently used statistical unit in the SBR. According to theresponses to the Global Survey, the most frequent statistical unit used in the SBRs is the“enterprise" (as Table 5 shows, 80 per cent of all countries report using this type of unit).There are noticeable differences, however, between developed and developing countries.More concretely, 94.4 percent of developed countries report the use “enterprise" in therSBRs, while this figure is 72.7 per cent among developing countries.
13
Report on global status of statistical business register programmes
33. The use of establishment as a statistical unit is more widespread among developing countries.Interestingly, the reported rate of use of “establishment” is much lower among developedcountries than among developing countries. In fact, the most used statistical unit in thebusiness registers among developing countries is the “establishment”, which according tothe responses to the Global Survey is used by 76.6 per cent of countries in this group.
34. Enterprise group is very common in the SBRs of developed countries, but very rare amongdeveloping countries. In contrast to the preceding paragraph, 71.8 percent of the developedcountries that responded to the Global Assessment Survey maintain data at the level of“enterprise groups” in their SBRs, while only 16.9 percent of developing countries do.In particular, “enterprise group” has a very low rate of use among Latin America andCaribbean countries, as well as in Eastern, South-eastern, and Southern Asia.
Other
Establishment(local KAU)
KAU
Local Unit
Enterprise
EnterpriseGroup
Percentage of countries
Type
of U
nits
0 20 40 60 80
Country Group
DevelopingDeveloped
●
●
●
●
●
●
●
●
●
●
●
●
●
●
●
●
●
●
●
●
●
AfricaEastern, South−eastern, Southern AsiaLatin America and Caribbean
Figure 3: Percentage of countries that cover the different types of statistical units in the Statistical BusinessRegister
14
Report on global status of statistical business register programmes
Group EnterpriseGroup
Enterprise Local Unit K.A.U. Establish-ment (local
K.A.U.)
Other∗
Developed 71.8 94.9 79.5 30.8 46.2 20.5
Developing 16.9 72.7 31.2 32.5 76.6 6.5
Africa 21.7 73.9 13.0 30.4 78.3 8.7
Eastern,South-eastern,Southern Asia
11.8 64.7 17.6 35.3 88.2 0.0
Western Asia 20.0 40.0 0.0 40.0 100.0 0.0
CIS 37.5 100.0 87.5 37.5 50.0 37.5
South-EasternEurope
20.0 100.0 100.0 0.0 20.0 0.0
Latin America andCaribbean
5.6 66.7 33.3 33.3 88.9 0.0
Oceania 0.0 100.0 0.0 100.0 0.0 0.0
Non-OECD 22.6 76.2 39.3 36.9 77.4 7.1
OECD 68.8 90.6 68.8 18.8 37.5 21.9
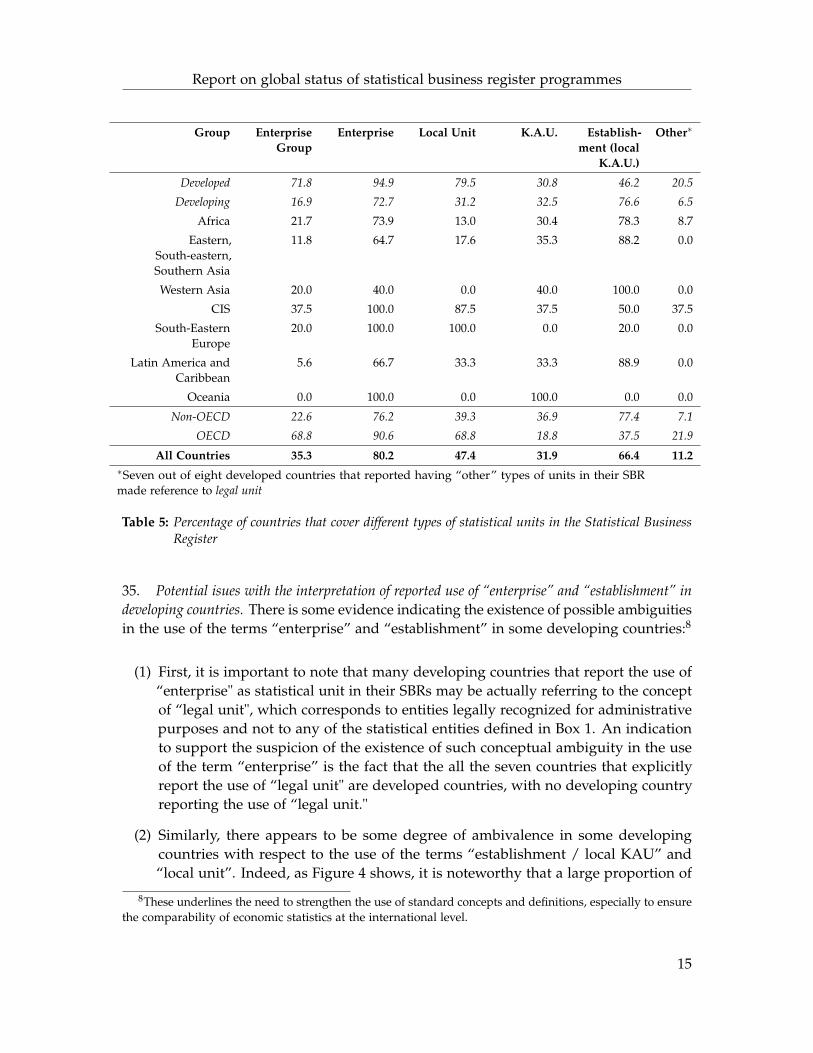
All Countries 35.3 80.2 47.4 31.9 66.4 11.2∗Seven out of eight developed countries that reported having “other” types of units in their SBRmade reference to legal unit
Table 5: Percentage of countries that cover different types of statistical units in the Statistical BusinessRegister
35. Potential isues with the interpretation of reported use of “enterprise” and “establishment” indeveloping countries. There is some evidence indicating the existence of possible ambiguitiesin the use of the terms “enterprise” and “establishment” in some developing countries:8
(1) First, it is important to note that many developing countries that report the use of“enterprise" as statistical unit in their SBRs may be actually referring to the conceptof “legal unit", which corresponds to entities legally recognized for administrativepurposes and not to any of the statistical entities defined in Box 1. An indicationto support the suspicion of the existence of such conceptual ambiguity in the useof the term “enterprise” is the fact that the all the seven countries that explicitlyreport the use of “legal unit" are developed countries, with no developing countryreporting the use of “legal unit."
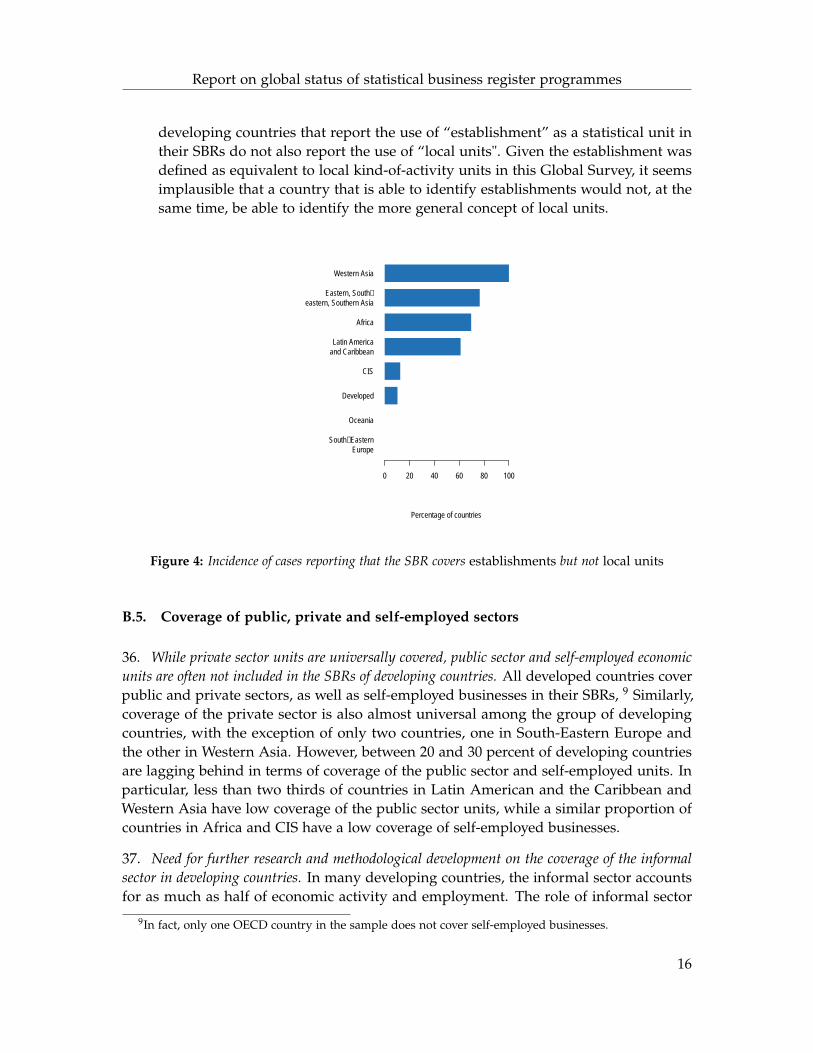
(2) Similarly, there appears to be some degree of ambivalence in some developingcountries with respect to the use of the terms “establishment / local KAU” and“local unit”. Indeed, as Figure 4 shows, it is noteworthy that a large proportion of
8These underlines the need to strengthen the use of standard concepts and definitions, especially to ensurethe comparability of economic statistics at the international level.
15
Report on global status of statistical business register programmes
developing countries that report the use of “establishment” as a statistical unit intheir SBRs do not also report the use of “local units". Given the establishment wasdefined as equivalent to local kind-of-activity units in this Global Survey, it seemsimplausible that a country that is able to identify establishments would not, at thesame time, be able to identify the more general concept of local units.
South−EasternEurope
Oceania
Developed
CIS
Latin Americaand Caribbean
Africa
Eastern, South−eastern, Southern Asia
Western Asia
Percentage of countries
0 20 40 60 80 100
Figure 4: Incidence of cases reporting that the SBR covers establishments but not local units
B.5. Coverage of public, private and self-employed sectors
36. While private sector units are universally covered, public sector and self-employed economicunits are often not included in the SBRs of developing countries. All developed countries coverpublic and private sectors, as well as self-employed businesses in their SBRs, 9 Similarly,coverage of the private sector is also almost universal among the group of developingcountries, with the exception of only two countries, one in South-Eastern Europe andthe other in Western Asia. However, between 20 and 30 percent of developing countriesare lagging behind in terms of coverage of the public sector and self-employed units. Inparticular, less than two thirds of countries in Latin American and the Caribbean andWestern Asia have low coverage of the public sector units, while a similar proportion ofcountries in Africa and CIS have a low coverage of self-employed businesses.
37. Need for further research and methodological development on the coverage of the informalsector in developing countries. In many developing countries, the informal sector accountsfor as much as half of economic activity and employment. The role of informal sector
9In fact, only one OECD country in the sample does not cover self-employed businesses.
16

Report on global status of statistical business register programmes
Region Public Sector PrivateSector
Self-employed
Developed 100.0 100.0 100.0
Developing 77.9 97.4 70.1
Africa 82.6 100.0 60.9
Eastern, South- eastern,Southern Asia
94.1 100.0 82.4
Latin America andCaribbean
61.1 100.0 72.2
Other developing 83.3 94.4 75.0
CIS 75.0 100.0 62.5
Oceania 100.0 100.0 0.0
South-Eastern Europe 80.0 80.0 80.0
Western Asia 60.0 80.0 80.0
Non-OECD 79.8 97.6 73.8
OECD 100.0 100.0 96.9
Total 85.3 98.3 80.2
Table 6: Percentage of countries that cover the public, private and self-employed sectors in their StatisticalBusiness Register
in the business register is therefore an interesting issue that should be further studied.Capturing the informal sector in a business register would appear difficult in manycountries; however there are countries such as Dominica which also include the informalsector in their SBR.
B.6. Coverage of economic activities in the SBR
38. Almost all countries include statistical units dedicated to industrial activities in their SBR,especially manufacturing. As shown in Figure 6 (and detailed in Table 7) the responses tothe Global Assessment Survey reveal that SBRs cover the industrial sector in the majorityof countries, as defined by IRIS 2008.10 However, while the manufacturing sector (sect.C of ISIC, Rev. 4) is almost universally represented in the SBRs of both developing anddeveloped countries, the remaining industrial activities (sections B, D, and E of ISIC, Rev.4) are not covered in approximately 8 to 9 percent of all developing countries. Moreover,
10The International Recommendations for Industrial Statistics 2008 define the scope and structure of theindustrial sector to include the following economic activities:
• Mining and quarrying (sect. B of ISIC, Rev.4);
• Manufacturing (sect. C of ISIC, Rev.4);
• Electricity, gas, steam and air-conditioning supply (sect. D of ISIC, Rev.4); and
• Water supply; sewerage, waste management and remediation activities (sect. E of ISIC, Rev.4).
17

Report on global status of statistical business register programmes
Other developing
Latin Americaand Caribbean
Eastern, South−eastern, Southern Asia
Africa
Developed
Percentage of countries
0 20 40 60 80 100
Sector:
Self−EmployedPrivate SectorPublic Sector
Figure 5: Percentage of countries that cover the public, private and self-employed sectors in their StatisticalBusiness Register
between 12 and 20 percent of the developing countries in both Eastern, South-eastern, andSouthern Asia and in Western Asia, lack coverage of units engaged in mining activities orthe supply of electricity, gas, etc. (sections B and E of ISIC, Rev. 4). The latter activities(sect. E) are not represented in around 17 percent of African countries.
39. SBR coverage of units in the agriculture and government sectors is less frequent in developingcountries. Two sectors which are not included or under-represented in the SBRs of manydeveloping countries are agriculture, forestry and fishing (sect. A of ISIC, Rev.4) andpublic administration and defence and compulsory social security (sect. O of ISIC Rev.4).In particular, approximately 25 percent of developing countries do not include statisticalunits from the agricultural sector in their SBRs, while 35 percent do not include publicadministration, defence and compulsory social security.
40. Productive activities of household units and extraterritorial organizations are in general notcovered by the SBR. Not surprisingly, the SBRs in most countries, both developing anddeveloped, do not cover units whose main economic activity corresponds to the activitiesof households as employers or to undifferentiated productive activities of households forown use (sect. T of ISIC, Rev.4), or to the activities of extraterritorial organizations andbodies (sect. U of ISIC, Rev.4). While ideally the SBR should cover all the economic unitsthat contribute to the GDP of a country, these two sectors are generally considered tohave lower priority in the development and maintenance of the SBR.
18

Report on global status of statistical business register programmes
41. Need to develop more accurate metrics of SBR coverage of the different economic activities.It is important to note that the above figures regarding the extent to which SBRs coverdifferent economic activities are based on the responses to a set of binary “yes"/“no"questions of the Global Survey. Therefore, “coverage” and “lack of coverage” rates shouldbe interpreted here as lower and upper limits, respectively, of the actual status of SBRprogrammes. In particular, it is important to look at these figures in the context of anysector-specific thresholds of minimum unit size.
U
T
S
R
Q
P
O
N
M
L
K
J
I
H
G
F
E
D
C
B
A
Percentage of countries
ISIC
Sec
tion
0 20 40 60 80 100
Country Group
DevelopingDeveloped
●
●
●
●
●
●
●
●
●
●
●
●
●
●
●
●
●
●
●
●
●
●
●
●
●
●
●
●
●
●
●
●
●
●
●
●
●
●
●
●
●
●
●
●
●
●
●
●
●
●
●
●
●
●
●
●
●
●
●
●
●
●
●
●
●
●
AfricaEastern, South−eastern, Southern AsiaLatin America and Caribbean
Figure 6: Percentage of countries that cover the various ISIC sections in the Statistical Business Register
19
Report on global status of statistical business register programmes
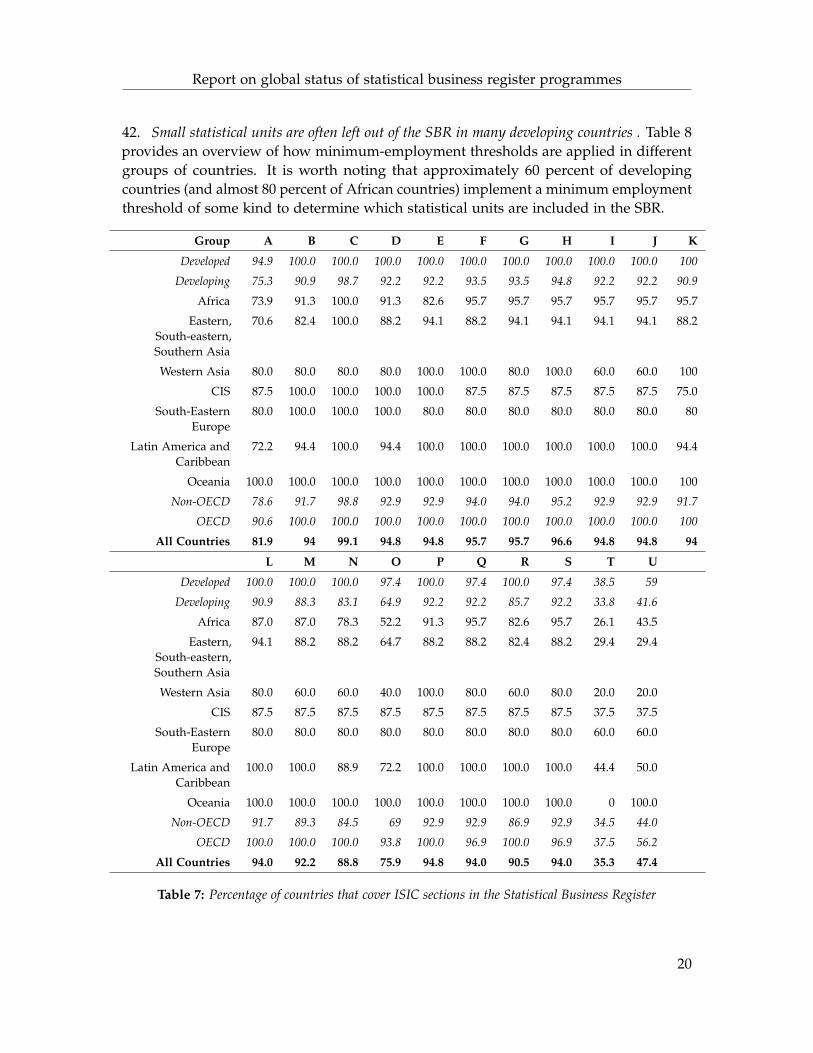
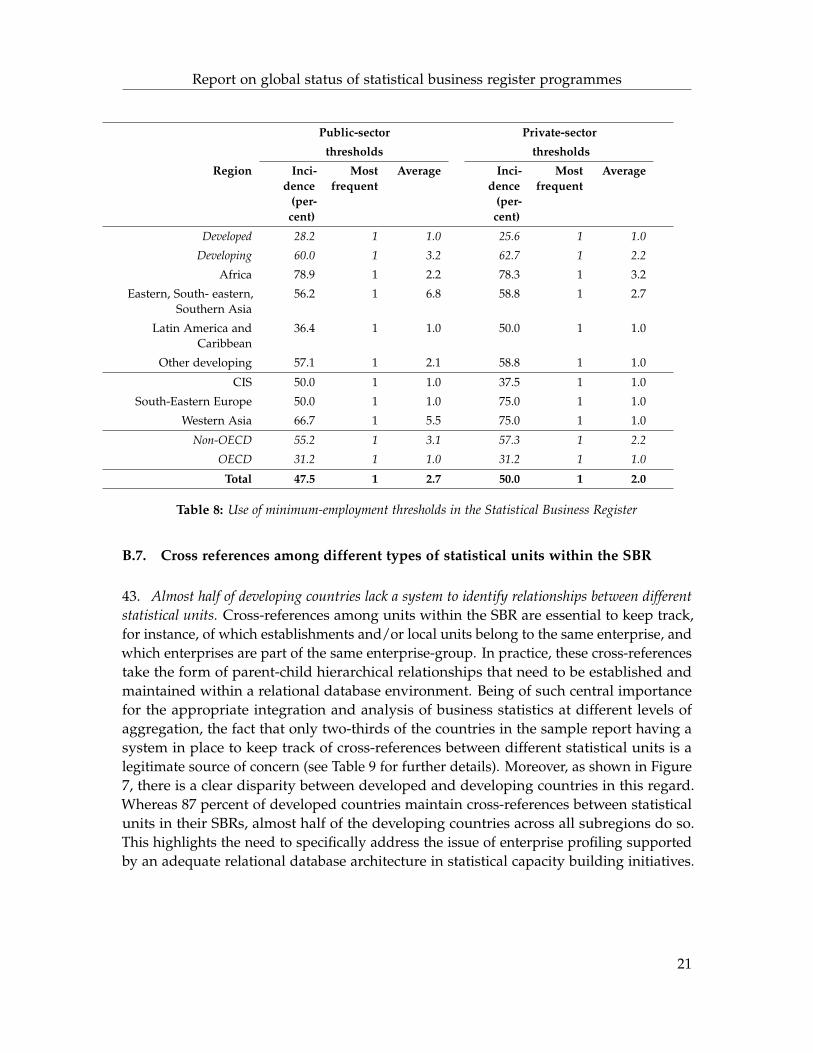
42. Small statistical units are often left out of the SBR in many developing countries . Table 8provides an overview of how minimum-employment thresholds are applied in differentgroups of countries. It is worth noting that approximately 60 percent of developingcountries (and almost 80 percent of African countries) implement a minimum employmentthreshold of some kind to determine which statistical units are included in the SBR.
Group A B C D E F G H I J K
Developed 94.9 100.0 100.0 100.0 100.0 100.0 100.0 100.0 100.0 100.0 100
Developing 75.3 90.9 98.7 92.2 92.2 93.5 93.5 94.8 92.2 92.2 90.9
Africa 73.9 91.3 100.0 91.3 82.6 95.7 95.7 95.7 95.7 95.7 95.7
Eastern,South-eastern,Southern Asia
70.6 82.4 100.0 88.2 94.1 88.2 94.1 94.1 94.1 94.1 88.2
Western Asia 80.0 80.0 80.0 80.0 100.0 100.0 80.0 100.0 60.0 60.0 100
CIS 87.5 100.0 100.0 100.0 100.0 87.5 87.5 87.5 87.5 87.5 75.0
South-EasternEurope
80.0 100.0 100.0 100.0 80.0 80.0 80.0 80.0 80.0 80.0 80
Latin America andCaribbean
72.2 94.4 100.0 94.4 100.0 100.0 100.0 100.0 100.0 100.0 94.4
Oceania 100.0 100.0 100.0 100.0 100.0 100.0 100.0 100.0 100.0 100.0 100
Non-OECD 78.6 91.7 98.8 92.9 92.9 94.0 94.0 95.2 92.9 92.9 91.7
OECD 90.6 100.0 100.0 100.0 100.0 100.0 100.0 100.0 100.0 100.0 100
All Countries 81.9 94 99.1 94.8 94.8 95.7 95.7 96.6 94.8 94.8 94
L M N O P Q R S T U
Developed 100.0 100.0 100.0 97.4 100.0 97.4 100.0 97.4 38.5 59
Developing 90.9 88.3 83.1 64.9 92.2 92.2 85.7 92.2 33.8 41.6
Africa 87.0 87.0 78.3 52.2 91.3 95.7 82.6 95.7 26.1 43.5
Eastern,South-eastern,Southern Asia
94.1 88.2 88.2 64.7 88.2 88.2 82.4 88.2 29.4 29.4
Western Asia 80.0 60.0 60.0 40.0 100.0 80.0 60.0 80.0 20.0 20.0
CIS 87.5 87.5 87.5 87.5 87.5 87.5 87.5 87.5 37.5 37.5
South-EasternEurope
80.0 80.0 80.0 80.0 80.0 80.0 80.0 80.0 60.0 60.0
Latin America andCaribbean
100.0 100.0 88.9 72.2 100.0 100.0 100.0 100.0 44.4 50.0
Oceania 100.0 100.0 100.0 100.0 100.0 100.0 100.0 100.0 0 100.0
Non-OECD 91.7 89.3 84.5 69 92.9 92.9 86.9 92.9 34.5 44.0
OECD 100.0 100.0 100.0 93.8 100.0 96.9 100.0 96.9 37.5 56.2
All Countries 94.0 92.2 88.8 75.9 94.8 94.0 90.5 94.0 35.3 47.4
Table 7: Percentage of countries that cover ISIC sections in the Statistical Business Register
20
Report on global status of statistical business register programmes
Public-sector Private-sector
thresholds thresholds
Region Inci-dence
(per-cent)
Mostfrequent
Average Inci-dence
(per-cent)
Mostfrequent
Average
Developed 28.2 1 1.0 25.6 1 1.0
Developing 60.0 1 3.2 62.7 1 2.2
Africa 78.9 1 2.2 78.3 1 3.2
Eastern, South- eastern,Southern Asia
56.2 1 6.8 58.8 1 2.7
Latin America andCaribbean
36.4 1 1.0 50.0 1 1.0
Other developing 57.1 1 2.1 58.8 1 1.0
CIS 50.0 1 1.0 37.5 1 1.0
South-Eastern Europe 50.0 1 1.0 75.0 1 1.0
Western Asia 66.7 1 5.5 75.0 1 1.0
Non-OECD 55.2 1 3.1 57.3 1 2.2
OECD 31.2 1 1.0 31.2 1 1.0
Total 47.5 1 2.7 50.0 1 2.0
Table 8: Use of minimum-employment thresholds in the Statistical Business Register
B.7. Cross references among different types of statistical units within the SBR
43. Almost half of developing countries lack a system to identify relationships between differentstatistical units. Cross-references among units within the SBR are essential to keep track,for instance, of which establishments and/or local units belong to the same enterprise, andwhich enterprises are part of the same enterprise-group. In practice, these cross-referencestake the form of parent-child hierarchical relationships that need to be established andmaintained within a relational database environment. Being of such central importancefor the appropriate integration and analysis of business statistics at different levels ofaggregation, the fact that only two-thirds of the countries in the sample report having asystem in place to keep track of cross-references between different statistical units is alegitimate source of concern (see Table 9 for further details). Moreover, as shown in Figure7, there is a clear disparity between developed and developing countries in this regard.Whereas 87 percent of developed countries maintain cross-references between statisticalunits in their SBRs, almost half of the developing countries across all subregions do so.This highlights the need to specifically address the issue of enterprise profiling supportedby an adequate relational database architecture in statistical capacity building initiatives.
21

Report on global status of statistical business register programmes
Frequency ofcross-references
Developed 87.2
Developing 55.8
Africa 56.5
Eastern, South-eastern, Southern Asia 58.8
Latin America and Caribbean 55.6
Other developing 52.6
CIS 62.5
Oceania 0.0
South-Eastern Europe 60.0
Western Asia 40.0
Non-OECD 60.7
OECD 81.2
Total 66.4
Table 9: Percentage of countries that maintain cross-references between statistical units in the SBR
Other developing
Latin Americaand Caribbean
Eastern, South−eastern,Southern Asia
Africa
Developed
Percentage of countries
0 20 40 60 80 100
Figure 7: Percentage of countries that maintain cross-references among statistical units in their SBR
B.8. Linking of SBR records with external sources
44. Almost half of developing countries are unable to link their SBR with external sources bymatching ID numbers. Every SBR requires an adequate system of record identifiers andID mappings in order to match, merge, and cross-validate data from different sourcesthat pertain to the same same unit. The proportion of countries where it is possibleto cross-link the identity number used in the SBR for the statistical units with external
22

Report on global status of statistical business register programmes
identity numbers used in other sources is, overall, 61 percent. However, this is an aspectin which the gap between developed and developing countries is significant: whereasmore than 80 percent of the developed countries are able to link data from the SBR withexternal sources using their identification numbers, only half of the developing countriesare in a position to do so (see Table 10 for further details).
45. In Africa, only 26 percent of the countries have the opportunity to cross-link the identitynumber for statistical units with external identify numbers. Having to rely on the use ofquasi-identifiers, such as the legal or commercial name in combination with other unitcharacteristics, in order to link to other sources, often leads to lower matching rates,whereby the probability of obtaining both false positives and false negatives is far fromnegligible. In Zambia for example, information on economic activity is combined withother identifiers such as geo-codes and physical location to link SBR data with othersources, and it is estimated that this strategy yields matching rate below 75 percent.
Frequency
Developed 82.1
Developing 50.6
Africa 26.1
Eastern, South-eastern, Southern Asia 58.8
Latin America and Caribbean 55.6
Other developing 68.4
CIS 75.0
Oceania 0.0
South-Eastern Europe 80.0
Western Asia 60.0
Non-OECD 54.8
OECD 78.1
Total 61.2
Table 10: Percentage of countries that can cross-link the identity number for statistical units with externalidentity numbers used in other sources
23

Report on global status of statistical business register programmes
Other developing
Latin Americaand Caribbean
Eastern, South−eastern,Southern Asia
Africa
Developed
Percentage of countries
0 20 40 60 80 100
Figure 8: Percentage of countries that can cross-link the identity number for statistical units with externalidentity numbers used in other sources
B.9. Data sources and update protocols
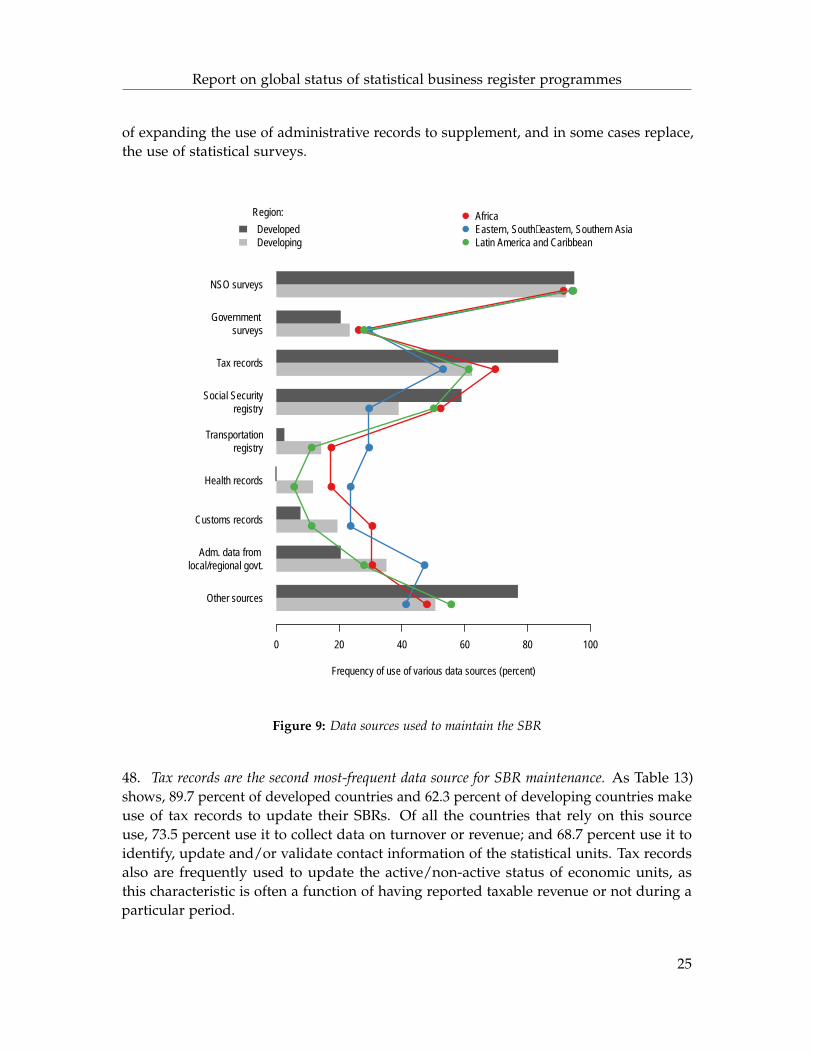
46. Most countries employ multiple sources to update the information of the SBR. Businessregisters capture a variety of information on businesses, and it is important to understandwhere all this information is derived from. The results from the Global AssessmentSurvey suggest that countries use different types of sources to collect data on differentbusiness characteristics. However, while some sources are more used than others forcertain characteristics, countries usually combine the use multiple sources to maximizedata coverage and allow for data quality checking through cross-validation. The relativeuse of various data sources to update the information on characteristics of the SBR unitsis shown in Figure 9.
47. Surveys conducted by the National Statistical Office are the most frequently used source ofdata for SBR maintenance. Both in developed and developing countries, NSO surveys arethe most common data source for SBR updates, although this trait is slightly more markedamongst the latter. As shown in Table 11, this type of data source is mainly used to updatethe contact information of the statistical units, to classify them according to their maineconomic activity, and (especially in the case of developing countries) to collect data onthe number of employees. The use of surveys, however, may present certain shortcomingswhich should be addressed in order to design an optimal SBR maintenance strategy. Forinstance, it is important to take into account the budget and logistic constraints involvedin conducting and processing statistical surveys, as well as the burden the impose onrespondents. Indeed, the extent to which surveys impose a heavy response burden maynegatively impact the reliability of the data derived from them. In this regard, the officesresponsible for developing and operating SBR programmes should consider the possibility
24
Report on global status of statistical business register programmes
of expanding the use of administrative records to supplement, and in some cases replace,the use of statistical surveys.
Other sources
Adm. data from local/regional govt.
Customs records
Health records
Transportationregistry
Social Securityregistry
Tax records
Government surveys
NSO surveys
Frequency of use of various data sources (percent)
0 20 40 60 80 100
Region:
DevelopedDeveloping
●
●
●
●
●
●
●
●
●
●
●
●
●
●
●
●
●
●
●
●
●
●
●
●
●
●
●
●
●
●
AfricaEastern, South−eastern, Southern AsiaLatin America and Caribbean
Figure 9: Data sources used to maintain the SBR
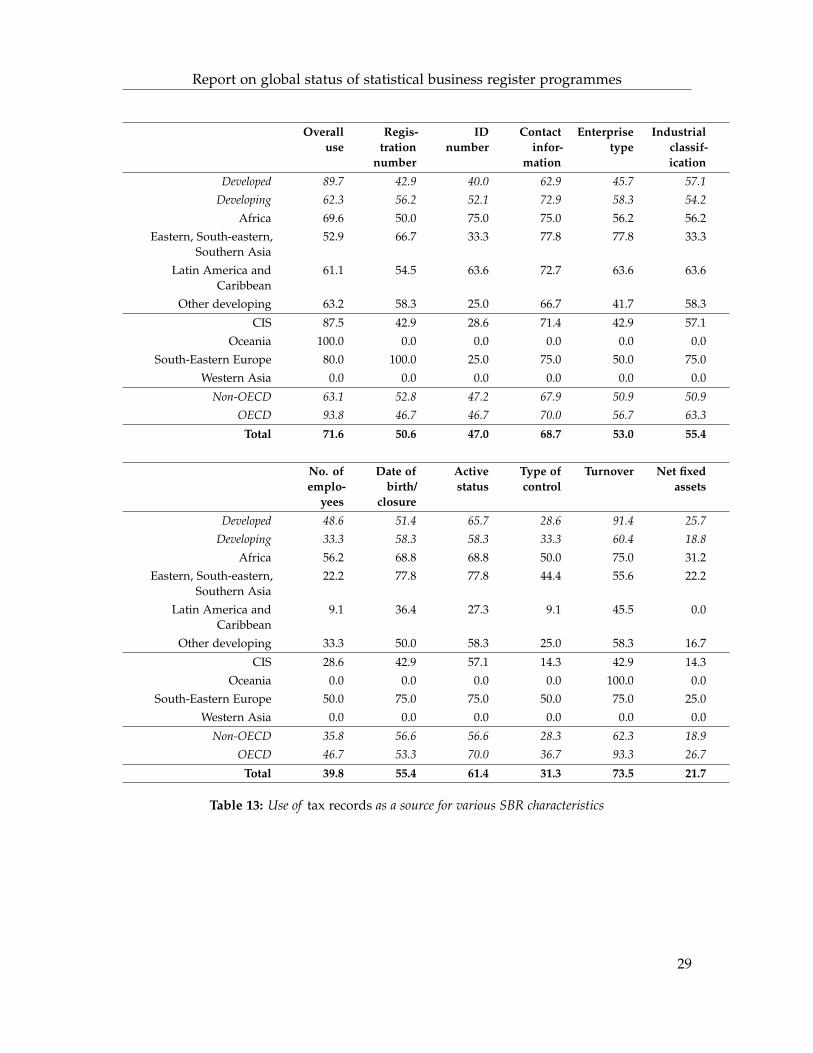
48. Tax records are the second most-frequent data source for SBR maintenance. As Table 13)shows, 89.7 percent of developed countries and 62.3 percent of developing countries makeuse of tax records to update their SBRs. Of all the countries that rely on this sourceuse, 73.5 percent use it to collect data on turnover or revenue; and 68.7 percent use it toidentify, update and/or validate contact information of the statistical units. Tax recordsalso are frequently used to update the active/non-active status of economic units, asthis characteristic is often a function of having reported taxable revenue or not during aparticular period.
25

Report on global status of statistical business register programmes
49. Need to strengthen access to tax records for SBR maintenance. The fact that fewer de-veloping countries make use of tax records to update and maintain their SBRs, is oftenattributed to the lack of adequate legal framework and/or institutional arrangementsgranting access to such source for statistical purposes. Given that the use of administrativerecords, and in particular tax records are usually more reliable than surveys to collectaccurate revenue information, it is important to support national statistical authoritiesin their efforts to gain adequate access to this source for the maintenance of the SBR.However, even in the case of developed countries, it is necessary to take into account thefact that tax records are usually obtained with a lag, which may result in sub-optimaldata quality in terms of timeliness.
50. The third most-frequently used source are records from Social Security administrations.Overall, about 45 percent of all countries make use of this records from the Social Securityadministration to update and maintain their SBRs. In particular, almost 60 percent of alldeveloped countries, and slightly more than 50 percent of African and Latin Americanand Caribbean countries rely on this source to update and maintain their SBRs. While thissource is mostly used to collect data on the number of employees of the statistical units(see Table 14), it also if frequently used to identify and update their contact information.
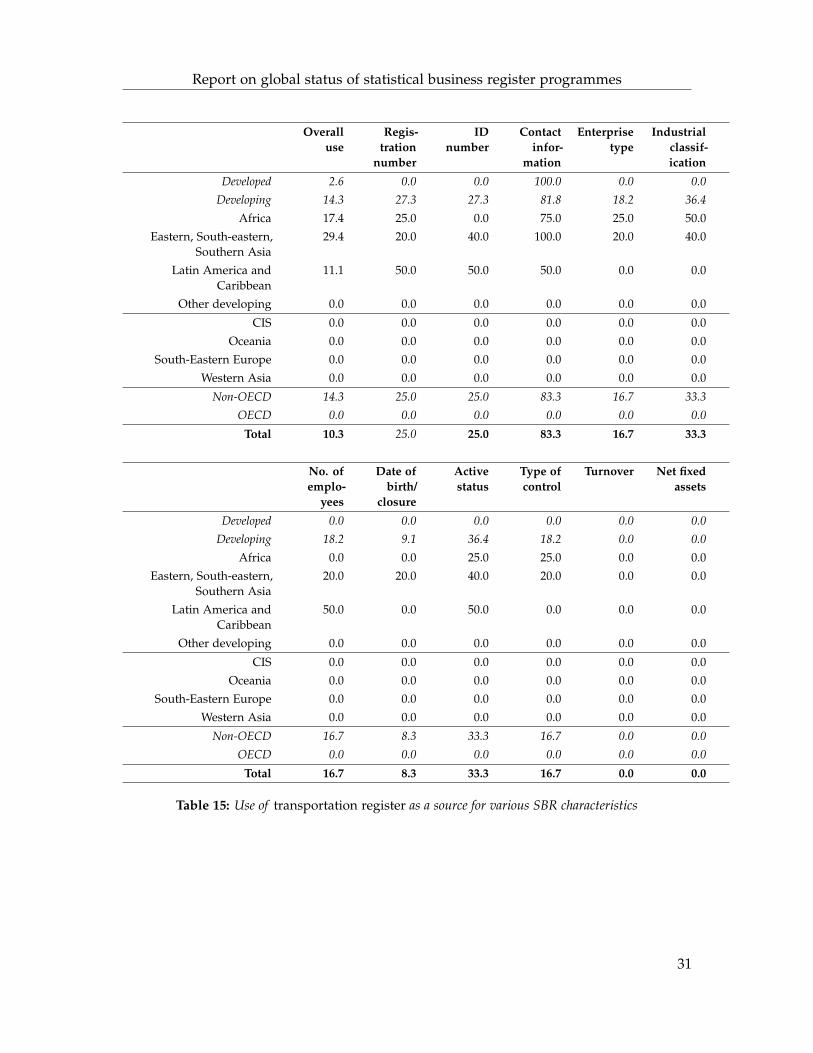
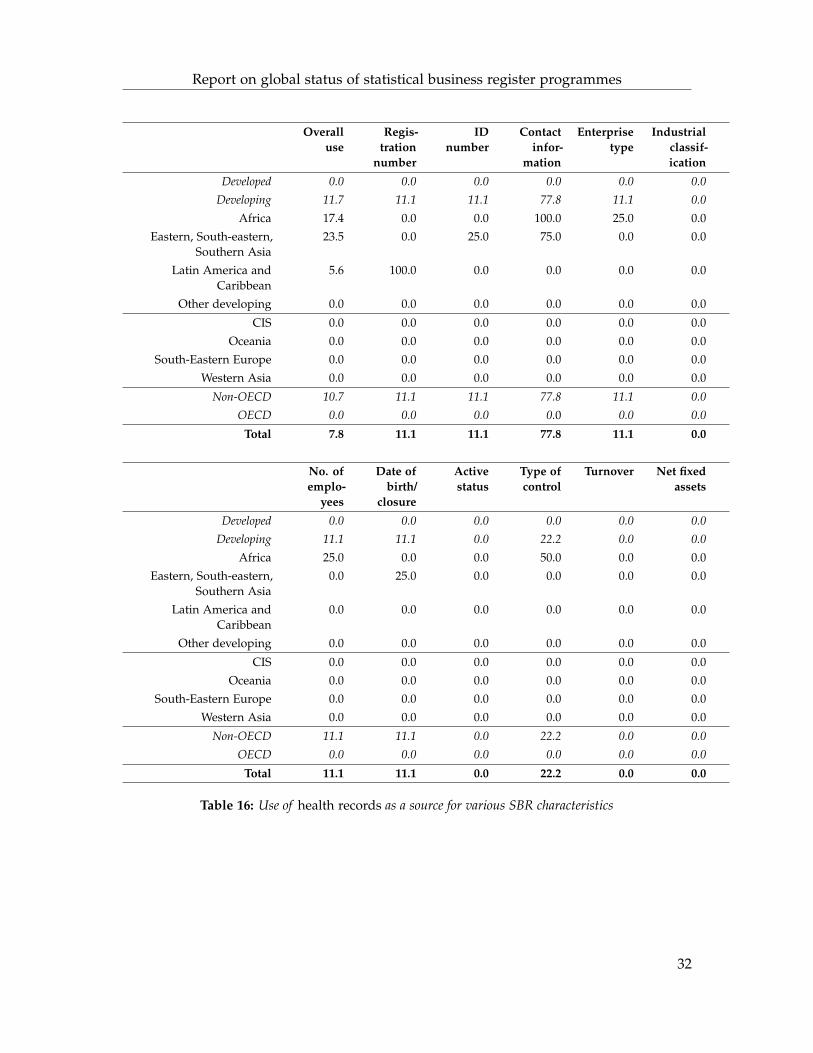
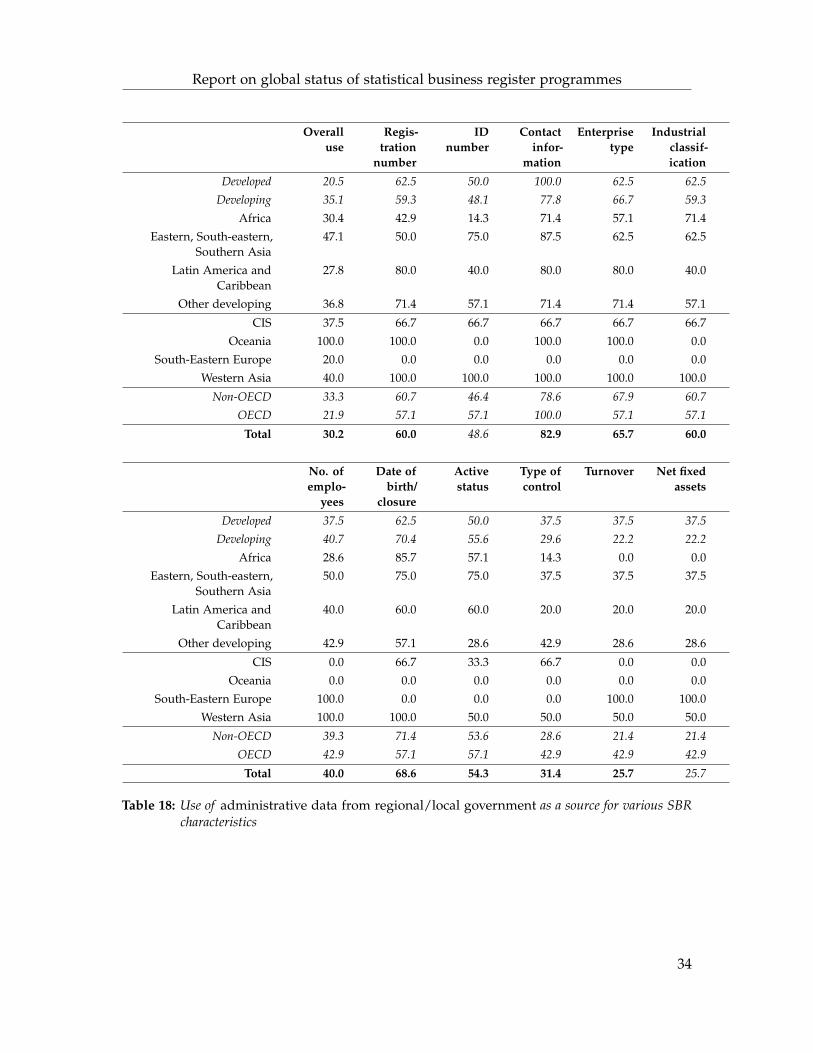
51. Developing countries rely on a wider variety of administrative sources, mostly to update thecontact information and validate ID numbers of the SBR units. One interesting insight thatcan be drawn from Figure 9 is the fact that other administrative records, such as thosefrom the transportation registry, health records, custom records, and administrative datafrom local governments, are used more often by developing than by developed countries.In particular, their rate of use in developing countries ranges from 11 percent (healthrecords) to 35 percent (local government records), while in developed countries their rateof use is between zero (health records) to 20 percent (local government records). Amongthe countries that use the transportation register or health or customs records as sourcesfor their SBRs, the primary purpose is to collect contact information of the statistical units(see Tables 15 to 17)). However, it is also worth noting that customs records are often usedto obtain and/or validate the identification numbers of statistical or legal units. On theother hand, while administrative records from local governments are also used to updatecontact information, they typically constitute a more rich source of information, fromwhich a wide range of characteristics such as enterprise type, industrial classification,date of birth and closure, as well as active/inactive status, can be obtained (see Table 18).
26

Report on global status of statistical business register programmes
Overalluse
Regis-tration
number
IDnumber
Contactinfor-
mation
Enterprisetype
Industrialclassif-ication
Developed 94.9 21.6 21.6 81.1 37.8 91.9Developing 92.2 36.6 53.5 85.9 73.2 88.7
Africa 91.3 33.3 57.1 85.7 81.0 95.2
Eastern, South-eastern,Southern Asia
94.1 56.2 56.2 93.8 75.0 100.0
Latin America andCaribbean
94.4 29.4 58.8 94.1 88.2 88.2
Other developing 89.5 29.4 41.2 70.6 47.1 70.6
CIS 100.0 12.5 37.5 62.5 50.0 50.0
Oceania 100.0 0.0 0.0 0.0 0.0 100.0
South-Eastern Europe 80.0 0.0 0.0 75.0 0.0 75.0
Western Asia 80.0 100.0 100.0 100.0 100.0 100.0
Non-OECD 91.7 35.1 48.1 83.1 68.8 89.6OECD 96.9 22.6 29.0 87.1 41.9 90.3
Total 93.1 31.5 42.6 84.3 61.1 89.8
No. ofemplo-
yees
Date ofbirth/
closure
Activestatus
Type ofcontrol
Turnover Net fixedassets
Developed 70.3 43.2 73.0 54.1 59.5 29.7Developing 91.5 66.2 69.0 46.5 64.8 39.4
Africa 95.2 81.0 66.7 71.4 76.2 57.1
Eastern, South-eastern,Southern Asia
100.0 62.5 68.8 37.5 75.0 56.2
Latin America andCaribbean
82.4 64.7 58.8 23.5 41.2 5.9
Other developing 88.2 52.9 82.4 47.1 64.7 35.3
CIS 100.0 12.5 75.0 50.0 100.0 50.0
Oceania 100.0 100.0 100.0 0.0 100.0 100.0
South-Eastern Europe 50.0 75.0 100.0 50.0 25.0 0.0
Western Asia 100.0 100.0 75.0 50.0 25.0 25.0
Non-OECD 90.9 64.9 72.7 50.6 64.9 40.3OECD 67.7 41.9 64.5 45.2 58.1 25.8
Total 84.3 58.3 70.4 49.1 63.0 36.1
Table 11: Use of NSO surveys as a source for various SBR characteristics
27

Report on global status of statistical business register programmes
Overalluse
Regis-tration
number
IDnumber
Contactinfor-
mation
Enterprisetype
Industrialclassif-ication
Developed 20.5 12.5 37.5 37.5 37.5 50.0Developing 23.4 33.3 33.3 72.2 44.4 61.1
Africa 26.1 33.3 16.7 83.3 50.0 66.7
Eastern, South-eastern,Southern Asia
29.4 20.0 40.0 60.0 20.0 60.0
Latin America andCaribbean
27.8 20.0 20.0 60.0 40.0 40.0
Other developing 10.5 100.0 100.0 100.0 100.0 100.0
CIS 0.0 0.0 0.0 0.0 0.0 0.0
Oceania 0.0 0.0 0.0 0.0 0.0 0.0
South-Eastern Europe 0.0 0.0 0.0 0.0 0.0 0.0
Western Asia 40.0 100.0 100.0 100.0 100.0 100.0
Non-OECD 22.6 31.6 31.6 68.4 42.1 57.9OECD 21.9 14.3 42.9 42.9 42.9 57.1
Total 22.4 26.9 34.6 61.5 42.3 57.7
No. ofemplo-
yees
Date ofbirth/
closure
Activestatus
Type ofcontrol
Turnover Net fixedassets
Developed 50.0 25.0 50.0 50.0 37.5 0.0Developing 66.7 33.3 33.3 16.7 22.2 16.7
Africa 66.7 50.0 33.3 16.7 16.7 0.0
Eastern, South-eastern,Southern Asia
80.0 20.0 40.0 20.0 40.0 40.0
Latin America andCaribbean
40.0 0.0 20.0 0.0 0.0 0.0
Other developing 100.0 100.0 50.0 50.0 50.0 50.0
CIS 0.0 0.0 0.0 0.0 0.0 0.0
Oceania 0.0 0.0 0.0 0.0 0.0 0.0
South-Eastern Europe 0.0 0.0 0.0 0.0 0.0 0.0
Western Asia 100.0 100.0 50.0 50.0 50.0 50.0
Non-OECD 68.4 31.6 36.8 15.8 26.3 15.8OECD 42.9 28.6 42.9 57.1 28.6 0.0
Total 61.5 30.8 38.5 26.9 26.9 11.5
Table 12: Use of other government surveys as a source for various SBR characteristics
28
Report on global status of statistical business register programmes
Overalluse
Regis-tration
number
IDnumber
Contactinfor-
mation
Enterprisetype
Industrialclassif-ication
Developed 89.7 42.9 40.0 62.9 45.7 57.1Developing 62.3 56.2 52.1 72.9 58.3 54.2
Africa 69.6 50.0 75.0 75.0 56.2 56.2
Eastern, South-eastern,Southern Asia
52.9 66.7 33.3 77.8 77.8 33.3
Latin America andCaribbean
61.1 54.5 63.6 72.7 63.6 63.6
Other developing 63.2 58.3 25.0 66.7 41.7 58.3
CIS 87.5 42.9 28.6 71.4 42.9 57.1
Oceania 100.0 0.0 0.0 0.0 0.0 0.0
South-Eastern Europe 80.0 100.0 25.0 75.0 50.0 75.0
Western Asia 0.0 0.0 0.0 0.0 0.0 0.0
Non-OECD 63.1 52.8 47.2 67.9 50.9 50.9OECD 93.8 46.7 46.7 70.0 56.7 63.3
Total 71.6 50.6 47.0 68.7 53.0 55.4
No. ofemplo-
yees
Date ofbirth/
closure
Activestatus
Type ofcontrol
Turnover Net fixedassets
Developed 48.6 51.4 65.7 28.6 91.4 25.7Developing 33.3 58.3 58.3 33.3 60.4 18.8
Africa 56.2 68.8 68.8 50.0 75.0 31.2
Eastern, South-eastern,Southern Asia
22.2 77.8 77.8 44.4 55.6 22.2
Latin America andCaribbean
9.1 36.4 27.3 9.1 45.5 0.0
Other developing 33.3 50.0 58.3 25.0 58.3 16.7
CIS 28.6 42.9 57.1 14.3 42.9 14.3
Oceania 0.0 0.0 0.0 0.0 100.0 0.0
South-Eastern Europe 50.0 75.0 75.0 50.0 75.0 25.0
Western Asia 0.0 0.0 0.0 0.0 0.0 0.0
Non-OECD 35.8 56.6 56.6 28.3 62.3 18.9OECD 46.7 53.3 70.0 36.7 93.3 26.7
Total 39.8 55.4 61.4 31.3 73.5 21.7
Table 13: Use of tax records as a source for various SBR characteristics
29

Report on global status of statistical business register programmes
Overalluse
Regis-tration
number
IDnumber
Contactinfor-
mation
Enterprisetype
Industrialclassif-ication
Developed 59.0 26.1 39.1 52.2 30.4 34.8Developing 39.0 20.0 43.3 66.7 30.0 26.7
Africa 52.2 25.0 41.7 75.0 33.3 16.7
Eastern, South-eastern,Southern Asia
29.4 20.0 20.0 80.0 40.0 20.0
Latin America andCaribbean
50.0 22.2 55.6 77.8 33.3 55.6
Other developing 21.1 0.0 50.0 0.0 0.0 0.0
CIS 25.0 0.0 50.0 0.0 0.0 0.0
Oceania 100.0 0.0 100.0 0.0 0.0 0.0
South-Eastern Europe 20.0 0.0 0.0 0.0 0.0 0.0
Western Asia 0.0 0.0 0.0 0.0 0.0 0.0
Non-OECD 41.7 22.9 45.7 65.7 34.3 28.6OECD 56.2 22.2 33.3 50.0 22.2 33.3
Total 45.7 22.6 41.5 60.4 30.2 30.2
No. ofemplo-
yees
Date ofbirth/
closure
Activestatus
Type ofcontrol
Turnover Net fixedassets
Developed 87.0 30.4 47.8 0.0 4.3 0.0Developing 80.0 26.7 33.3 6.7 0.0 0.0
Africa 83.3 33.3 33.3 8.3 0.0 0.0
Eastern, South-eastern,Southern Asia
40.0 20.0 20.0 20.0 0.0 0.0
Latin America andCaribbean
100.0 33.3 33.3 0.0 0.0 0.0
Other developing 75.0 0.0 50.0 0.0 0.0 0.0
CIS 50.0 0.0 50.0 0.0 0.0 0.0
Oceania 100.0 0.0 100.0 0.0 0.0 0.0
South-Eastern Europe 100.0 0.0 0.0 0.0 0.0 0.0
Western Asia 0.0 0.0 0.0 0.0 0.0 0.0
Non-OECD 80.0 31.4 28.6 5.7 0.0 0.0OECD 88.9 22.2 61.1 0.0 5.6 0.0
Total 83.0 28.3 39.6 3.8 1.9 0.0
Table 14: Use of social security register as a source for various SBR characteristics
30
Report on global status of statistical business register programmes
Overalluse
Regis-tration
number
IDnumber
Contactinfor-
mation
Enterprisetype
Industrialclassif-ication
Developed 2.6 0.0 0.0 100.0 0.0 0.0Developing 14.3 27.3 27.3 81.8 18.2 36.4
Africa 17.4 25.0 0.0 75.0 25.0 50.0
Eastern, South-eastern,Southern Asia
29.4 20.0 40.0 100.0 20.0 40.0
Latin America andCaribbean
11.1 50.0 50.0 50.0 0.0 0.0
Other developing 0.0 0.0 0.0 0.0 0.0 0.0
CIS 0.0 0.0 0.0 0.0 0.0 0.0
Oceania 0.0 0.0 0.0 0.0 0.0 0.0
South-Eastern Europe 0.0 0.0 0.0 0.0 0.0 0.0
Western Asia 0.0 0.0 0.0 0.0 0.0 0.0
Non-OECD 14.3 25.0 25.0 83.3 16.7 33.3OECD 0.0 0.0 0.0 0.0 0.0 0.0
Total 10.3 25.0 25.0 83.3 16.7 33.3
No. ofemplo-
yees
Date ofbirth/
closure
Activestatus
Type ofcontrol
Turnover Net fixedassets
Developed 0.0 0.0 0.0 0.0 0.0 0.0Developing 18.2 9.1 36.4 18.2 0.0 0.0
Africa 0.0 0.0 25.0 25.0 0.0 0.0
Eastern, South-eastern,Southern Asia
20.0 20.0 40.0 20.0 0.0 0.0
Latin America andCaribbean
50.0 0.0 50.0 0.0 0.0 0.0
Other developing 0.0 0.0 0.0 0.0 0.0 0.0
CIS 0.0 0.0 0.0 0.0 0.0 0.0
Oceania 0.0 0.0 0.0 0.0 0.0 0.0
South-Eastern Europe 0.0 0.0 0.0 0.0 0.0 0.0
Western Asia 0.0 0.0 0.0 0.0 0.0 0.0
Non-OECD 16.7 8.3 33.3 16.7 0.0 0.0OECD 0.0 0.0 0.0 0.0 0.0 0.0
Total 16.7 8.3 33.3 16.7 0.0 0.0
Table 15: Use of transportation register as a source for various SBR characteristics
31
Report on global status of statistical business register programmes
Overalluse
Regis-tration
number
IDnumber
Contactinfor-
mation
Enterprisetype
Industrialclassif-ication
Developed 0.0 0.0 0.0 0.0 0.0 0.0Developing 11.7 11.1 11.1 77.8 11.1 0.0
Africa 17.4 0.0 0.0 100.0 25.0 0.0
Eastern, South-eastern,Southern Asia
23.5 0.0 25.0 75.0 0.0 0.0
Latin America andCaribbean
5.6 100.0 0.0 0.0 0.0 0.0
Other developing 0.0 0.0 0.0 0.0 0.0 0.0
CIS 0.0 0.0 0.0 0.0 0.0 0.0
Oceania 0.0 0.0 0.0 0.0 0.0 0.0
South-Eastern Europe 0.0 0.0 0.0 0.0 0.0 0.0
Western Asia 0.0 0.0 0.0 0.0 0.0 0.0
Non-OECD 10.7 11.1 11.1 77.8 11.1 0.0OECD 0.0 0.0 0.0 0.0 0.0 0.0
Total 7.8 11.1 11.1 77.8 11.1 0.0
No. ofemplo-
yees
Date ofbirth/
closure
Activestatus
Type ofcontrol
Turnover Net fixedassets
Developed 0.0 0.0 0.0 0.0 0.0 0.0Developing 11.1 11.1 0.0 22.2 0.0 0.0
Africa 25.0 0.0 0.0 50.0 0.0 0.0
Eastern, South-eastern,Southern Asia
0.0 25.0 0.0 0.0 0.0 0.0
Latin America andCaribbean
0.0 0.0 0.0 0.0 0.0 0.0
Other developing 0.0 0.0 0.0 0.0 0.0 0.0
CIS 0.0 0.0 0.0 0.0 0.0 0.0
Oceania 0.0 0.0 0.0 0.0 0.0 0.0
South-Eastern Europe 0.0 0.0 0.0 0.0 0.0 0.0
Western Asia 0.0 0.0 0.0 0.0 0.0 0.0
Non-OECD 11.1 11.1 0.0 22.2 0.0 0.0OECD 0.0 0.0 0.0 0.0 0.0 0.0
Total 11.1 11.1 0.0 22.2 0.0 0.0
Table 16: Use of health records as a source for various SBR characteristics
32

Report on global status of statistical business register programmes
Overalluse
Regis-tration
number
IDnumber
Contactinfor-
mation
Enterprisetype
Industrialclassif-ication
Developed 7.7 66.7 33.3 33.3 33.3 0.0Developing 19.5 40.0 53.3 73.3 40.0 46.7
Africa 30.4 42.9 57.1 71.4 57.1 57.1
Eastern, South-eastern,Southern Asia
23.5 25.0 50.0 100.0 25.0 50.0
Latin America andCaribbean
11.1 50.0 50.0 50.0 50.0 0.0
Other developing 10.5 50.0 50.0 50.0 0.0 50.0
CIS 12.5 100.0 0.0 100.0 0.0 100.0
Oceania 100.0 0.0 100.0 0.0 0.0 0.0
South-Eastern Europe 0.0 0.0 0.0 0.0 0.0 0.0
Western Asia 0.0 0.0 0.0 0.0 0.0 0.0
Non-OECD 17.9 40.0 53.3 73.3 40.0 46.7OECD 9.4 66.7 33.3 33.3 33.3 0.0
Total 15.5 44.4 50.0 66.7 38.9 38.9
No. ofemplo-
yees
Date ofbirth/
closure
Activestatus
Type ofcontrol
Turnover Net fixedassets
Developed 0.0 0.0 0.0 0.0 33.3 0.0Developing 6.7 13.3 13.3 13.3 13.3 0.0
Africa 14.3 14.3 14.3 28.6 14.3 0.0
Eastern, South-eastern,Southern Asia
0.0 25.0 25.0 0.0 0.0 0.0
Latin America andCaribbean
0.0 0.0 0.0 0.0 0.0 0.0
Other developing 0.0 0.0 0.0 0.0 50.0 0.0
CIS 0.0 0.0 0.0 0.0 100.0 0.0
Oceania 0.0 0.0 0.0 0.0 0.0 0.0
South-Eastern Europe 0.0 0.0 0.0 0.0 0.0 0.0
Western Asia 0.0 0.0 0.0 0.0 0.0 0.0
Non-OECD 6.7 13.3 13.3 13.3 13.3 0.0OECD 0.0 0.0 0.0 0.0 33.3 0.0
Total 5.6 11.1 11.1 11.1 16.7 0.0
Table 17: Use of customs records as a source for various SBR characteristics
33
Report on global status of statistical business register programmes
Overalluse
Regis-tration
number
IDnumber
Contactinfor-
mation
Enterprisetype
Industrialclassif-ication
Developed 20.5 62.5 50.0 100.0 62.5 62.5Developing 35.1 59.3 48.1 77.8 66.7 59.3
Africa 30.4 42.9 14.3 71.4 57.1 71.4
Eastern, South-eastern,Southern Asia
47.1 50.0 75.0 87.5 62.5 62.5
Latin America andCaribbean
27.8 80.0 40.0 80.0 80.0 40.0
Other developing 36.8 71.4 57.1 71.4 71.4 57.1
CIS 37.5 66.7 66.7 66.7 66.7 66.7
Oceania 100.0 100.0 0.0 100.0 100.0 0.0
South-Eastern Europe 20.0 0.0 0.0 0.0 0.0 0.0
Western Asia 40.0 100.0 100.0 100.0 100.0 100.0
Non-OECD 33.3 60.7 46.4 78.6 67.9 60.7OECD 21.9 57.1 57.1 100.0 57.1 57.1
Total 30.2 60.0 48.6 82.9 65.7 60.0
No. ofemplo-
yees
Date ofbirth/
closure
Activestatus
Type ofcontrol
Turnover Net fixedassets
Developed 37.5 62.5 50.0 37.5 37.5 37.5Developing 40.7 70.4 55.6 29.6 22.2 22.2
Africa 28.6 85.7 57.1 14.3 0.0 0.0
Eastern, South-eastern,Southern Asia
50.0 75.0 75.0 37.5 37.5 37.5
Latin America andCaribbean
40.0 60.0 60.0 20.0 20.0 20.0
Other developing 42.9 57.1 28.6 42.9 28.6 28.6
CIS 0.0 66.7 33.3 66.7 0.0 0.0
Oceania 0.0 0.0 0.0 0.0 0.0 0.0
South-Eastern Europe 100.0 0.0 0.0 0.0 100.0 100.0
Western Asia 100.0 100.0 50.0 50.0 50.0 50.0
Non-OECD 39.3 71.4 53.6 28.6 21.4 21.4OECD 42.9 57.1 57.1 42.9 42.9 42.9
Total 40.0 68.6 54.3 31.4 25.7 25.7
Table 18: Use of administrative data from regional/local government as a source for various SBRcharacteristics
34

Report on global status of statistical business register programmes
Overalluse
Regis-tration
number
IDnumber
Contactinfor-
mation
Enterprisetype
Industrialclassif-ication
Developed 76.9 63.3 53.3 80.0 66.7 46.7Developing 50.6 56.4 56.4 79.5 48.7 43.6
Africa 47.8 45.5 54.5 72.7 45.5 45.5
Eastern, South-eastern,Southern Asia
41.2 42.9 42.9 71.4 42.9 42.9
Latin America andCaribbean
55.6 40.0 50.0 80.0 30.0 30.0
Other developing 57.9 90.9 72.7 90.9 72.7 54.5
CIS 75.0 83.3 66.7 83.3 66.7 33.3
Oceania 0.0 0.0 0.0 0.0 0.0 0.0
South-Eastern Europe 60.0 100.0 66.7 100.0 66.7 66.7
Western Asia 40.0 100.0 100.0 100.0 100.0 100.0
Non-OECD 53.6 60.0 55.6 77.8 53.3 42.2OECD 75.0 58.3 54.2 83.3 62.5 50.0
Total 59.5 59.4 55.1 79.7 56.5 44.9
No. ofemplo-
yees
Date ofbirth/
closure
Activestatus
Type ofcontrol
Turnover Net fixedassets
Developed 16.7 63.3 43.3 63.3 10.0 10.0Developing 23.1 53.8 35.9 30.8 23.1 10.3
Africa 18.2 45.5 36.4 27.3 18.2 0.0
Eastern, South-eastern,Southern Asia
14.3 57.1 28.6 42.9 28.6 14.3
Latin America andCaribbean
30.0 40.0 30.0 10.0 30.0 10.0
Other developing 27.3 72.7 45.5 45.5 18.2 18.2
CIS 0.0 50.0 33.3 50.0 0.0 16.7
Oceania 0.0 0.0 0.0 0.0 0.0 0.0
South-Eastern Europe 33.3 100.0 66.7 33.3 33.3 0.0
Western Asia 100.0 100.0 50.0 50.0 50.0 50.0
Non-OECD 17.8 55.6 37.8 35.6 20.0 6.7OECD 25.0 62.5 41.7 62.5 12.5 16.7
Total 20.3 58.0 39.1 44.9 17.4 10.1
Table 19: Use of other sources for various SBR characteristics
35
Report on global status of statistical business register programmes
B.10. Updates to the register
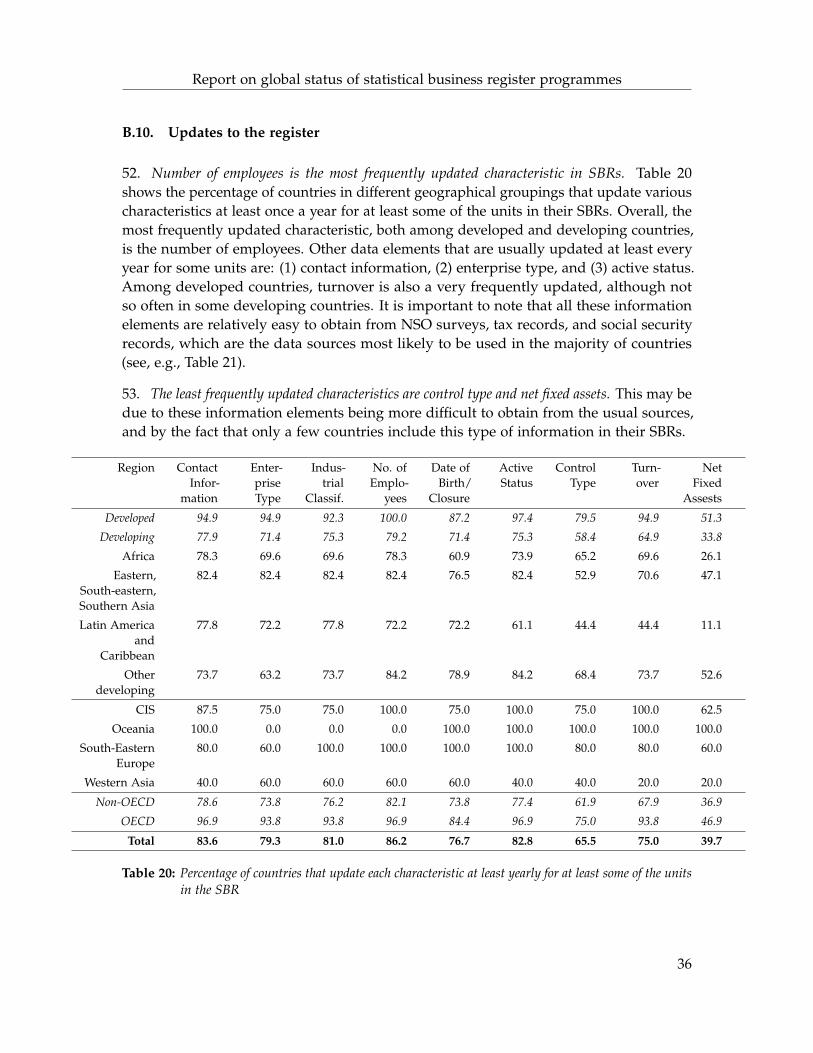
52. Number of employees is the most frequently updated characteristic in SBRs. Table 20shows the percentage of countries in different geographical groupings that update variouscharacteristics at least once a year for at least some of the units in their SBRs. Overall, themost frequently updated characteristic, both among developed and developing countries,is the number of employees. Other data elements that are usually updated at least everyyear for some units are: (1) contact information, (2) enterprise type, and (3) active status.Among developed countries, turnover is also a very frequently updated, although notso often in some developing countries. It is important to note that all these informationelements are relatively easy to obtain from NSO surveys, tax records, and social securityrecords, which are the data sources most likely to be used in the majority of countries(see, e.g., Table 21).
53. The least frequently updated characteristics are control type and net fixed assets. This may bedue to these information elements being more difficult to obtain from the usual sources,and by the fact that only a few countries include this type of information in their SBRs.
Region ContactInfor-
mation
Enter-priseType
Indus-trial
Classif.
No. ofEmplo-
yees
Date ofBirth/
Closure
ActiveStatus
ControlType
Turn-over
NetFixed
Assests
Developed 94.9 94.9 92.3 100.0 87.2 97.4 79.5 94.9 51.3
Developing 77.9 71.4 75.3 79.2 71.4 75.3 58.4 64.9 33.8
Africa 78.3 69.6 69.6 78.3 60.9 73.9 65.2 69.6 26.1
Eastern,South-eastern,Southern Asia
82.4 82.4 82.4 82.4 76.5 82.4 52.9 70.6 47.1
Latin Americaand
Caribbean
77.8 72.2 77.8 72.2 72.2 61.1 44.4 44.4 11.1
Otherdeveloping
73.7 63.2 73.7 84.2 78.9 84.2 68.4 73.7 52.6
CIS 87.5 75.0 75.0 100.0 75.0 100.0 75.0 100.0 62.5
Oceania 100.0 0.0 0.0 0.0 100.0 100.0 100.0 100.0 100.0
South-EasternEurope
80.0 60.0 100.0 100.0 100.0 100.0 80.0 80.0 60.0
Western Asia 40.0 60.0 60.0 60.0 60.0 40.0 40.0 20.0 20.0
Non-OECD 78.6 73.8 76.2 82.1 73.8 77.4 61.9 67.9 36.9
OECD 96.9 93.8 93.8 96.9 84.4 96.9 75.0 93.8 46.9
Total 83.6 79.3 81.0 86.2 76.7 82.8 65.5 75.0 39.7
Table 20: Percentage of countries that update each characteristic at least yearly for at least some of the unitsin the SBR
36

Report on global status of statistical business register programmes
Most frequently Second most-frequentlyCharacteristic reported data source reported data sourceContact NSO Survey (84 percent) Tax Records (66 percent)Enterprise Type Tax Records (53 percent) Other Sources (47 percent)Industrial Classification NSO Survey (80 percent) Tax Records (59 percent)Number of Employees NSO Survey (66 percent) Soc. Sec. Registry (50 percent)Date of Birth/Closure Tax Records (50 percent) Other Sources (47 percent)Active Status Tax Records (66 percent) NSO Survey (63 percent)Turnover Tax Records (88 percent) NSO Survey (56 percent)
Table 21: Characteristics that 70 percent or more countries indicated were updated “countinuously orregularly for all units”
B.11. Time gap between register updates and sample selection
54. The time gap between the last update of the SBR and its use in the selection can be longerthan one year in a significant number of developing countries. While the time gap betweenSBR update and sample selection is no longer than than one year for 92.3 percent of alldeveloped countries (with 56 percent having a time gap of three months or less), about72.6 percent of developing countries use the SBR for sample selection one year or lessafter its most recent update (and only 22.1 percent have a time gap of three months orless). Among the developing regions, Western Asia has some of the the longest gapsbetween SBR update and its use for sample selection, followed by Eastern, South-easternand Southern Asia.
37
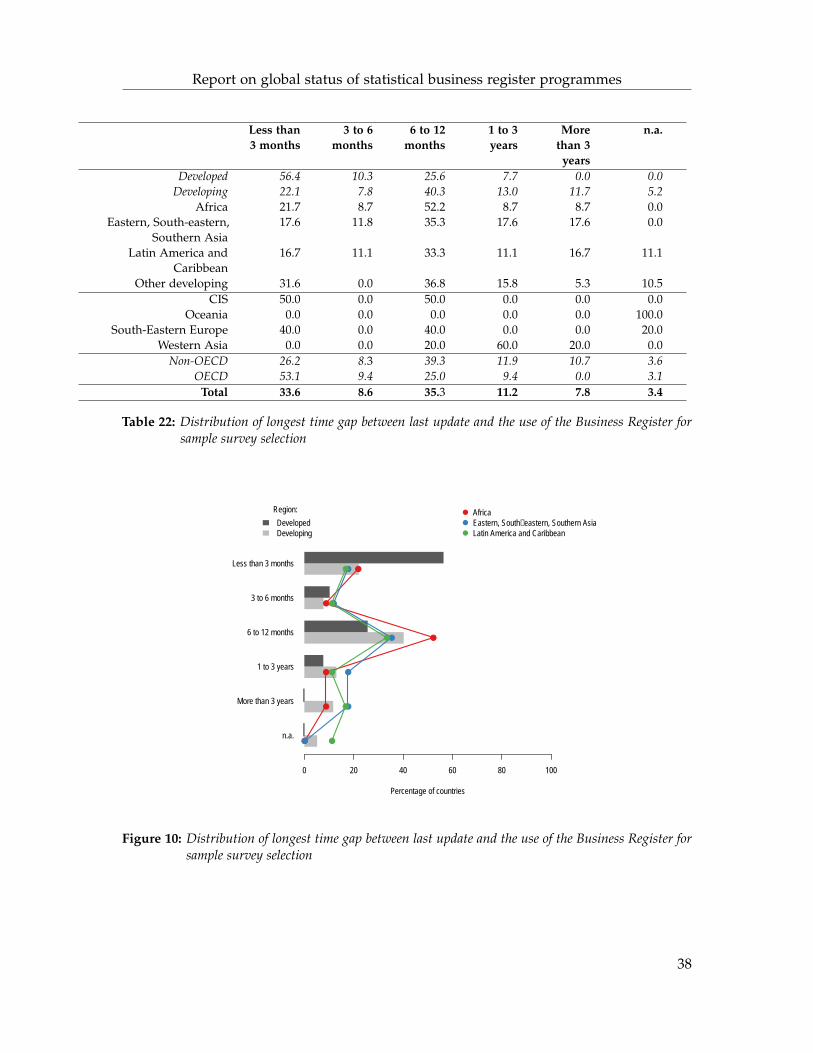
Report on global status of statistical business register programmes
Less than3 months
3 to 6months
6 to 12months
1 to 3years
Morethan 3years
n.a.
Developed 56.4 10.3 25.6 7.7 0.0 0.0Developing 22.1 7.8 40.3 13.0 11.7 5.2
Africa 21.7 8.7 52.2 8.7 8.7 0.0Eastern, South-eastern,
Southern Asia17.6 11.8 35.3 17.6 17.6 0.0
Latin America andCaribbean
16.7 11.1 33.3 11.1 16.7 11.1
Other developing 31.6 0.0 36.8 15.8 5.3 10.5CIS 50.0 0.0 50.0 0.0 0.0 0.0
Oceania 0.0 0.0 0.0 0.0 0.0 100.0South-Eastern Europe 40.0 0.0 40.0 0.0 0.0 20.0
Western Asia 0.0 0.0 20.0 60.0 20.0 0.0Non-OECD 26.2 8.3 39.3 11.9 10.7 3.6
OECD 53.1 9.4 25.0 9.4 0.0 3.1Total 33.6 8.6 35.3 11.2 7.8 3.4
Table 22: Distribution of longest time gap between last update and the use of the Business Register forsample survey selection
n.a.
More than 3 years
1 to 3 years
6 to 12 months
3 to 6 months
Less than 3 months
Percentage of countries
0 20 40 60 80 100
Region:
DevelopedDeveloping
●
●
●
●
●
●
●
●
●
●
●
●
●
●
●
●
●
●
●
●
●
AfricaEastern, South−eastern, Southern AsiaLatin America and Caribbean
Figure 10: Distribution of longest time gap between last update and the use of the Business Register forsample survey selection
38
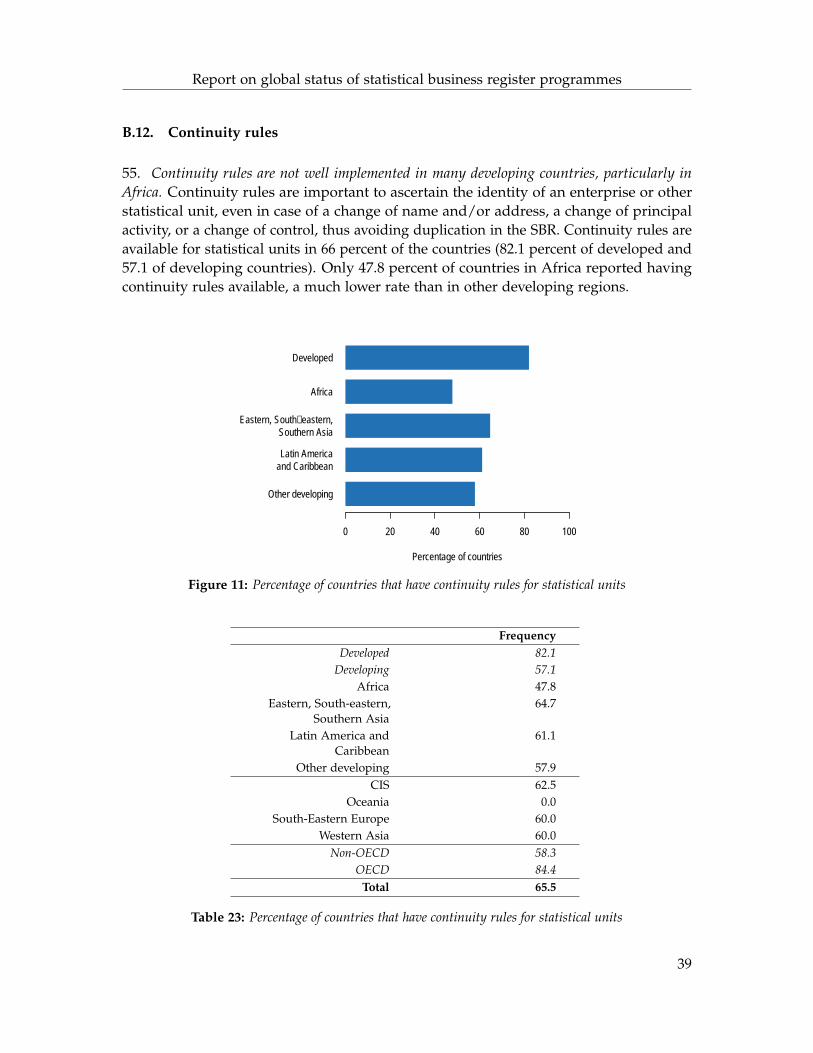
Report on global status of statistical business register programmes
B.12. Continuity rules
55. Continuity rules are not well implemented in many developing countries, particularly inAfrica. Continuity rules are important to ascertain the identity of an enterprise or otherstatistical unit, even in case of a change of name and/or address, a change of principalactivity, or a change of control, thus avoiding duplication in the SBR. Continuity rules areavailable for statistical units in 66 percent of the countries (82.1 percent of developed and57.1 of developing countries). Only 47.8 percent of countries in Africa reported havingcontinuity rules available, a much lower rate than in other developing regions.
Other developing
Latin Americaand Caribbean
Eastern, South−eastern,Southern Asia
Africa
Developed
Percentage of countries
0 20 40 60 80 100
Figure 11: Percentage of countries that have continuity rules for statistical units
FrequencyDeveloped 82.1
Developing 57.1Africa 47.8
Eastern, South-eastern,Southern Asia
64.7
Latin America andCaribbean
61.1
Other developing 57.9CIS 62.5
Oceania 0.0South-Eastern Europe 60.0
Western Asia 60.0Non-OECD 58.3
OECD 84.4Total 65.5
Table 23: Percentage of countries that have continuity rules for statistical units
39
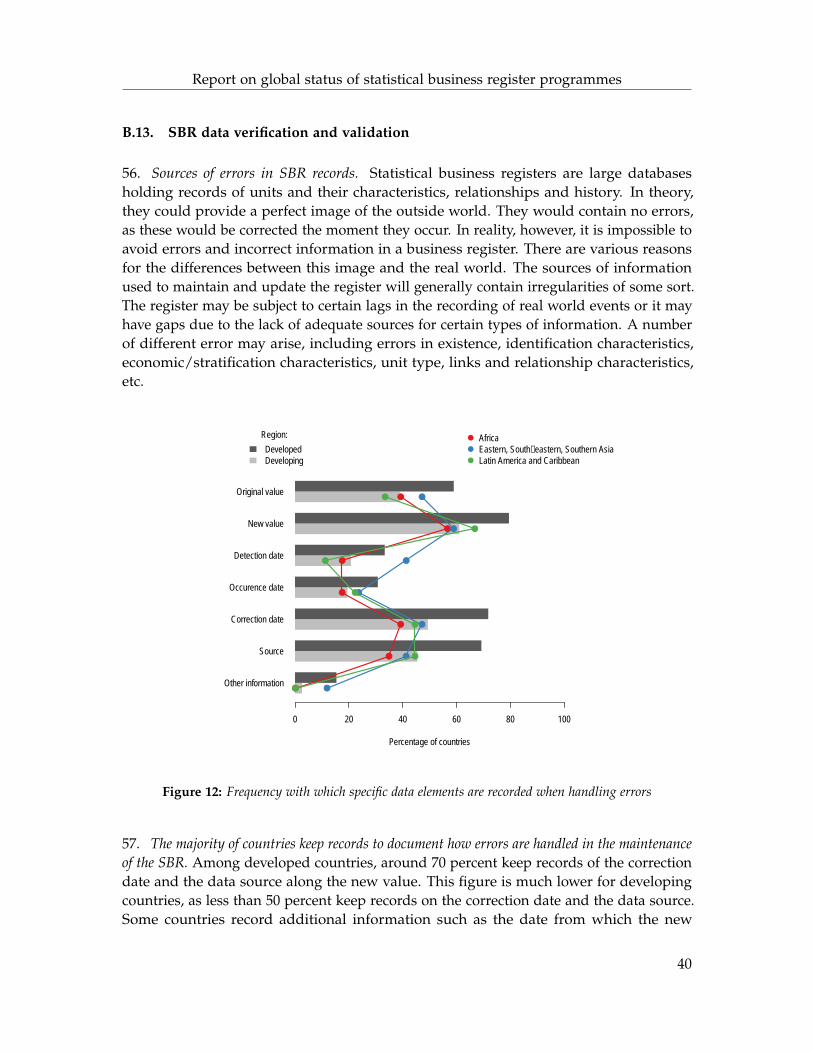
Report on global status of statistical business register programmes
B.13. SBR data verification and validation
56. Sources of errors in SBR records. Statistical business registers are large databasesholding records of units and their characteristics, relationships and history. In theory,they could provide a perfect image of the outside world. They would contain no errors,as these would be corrected the moment they occur. In reality, however, it is impossible toavoid errors and incorrect information in a business register. There are various reasonsfor the differences between this image and the real world. The sources of informationused to maintain and update the register will generally contain irregularities of some sort.The register may be subject to certain lags in the recording of real world events or it mayhave gaps due to the lack of adequate sources for certain types of information. A numberof different error may arise, including errors in existence, identification characteristics,economic/stratification characteristics, unit type, links and relationship characteristics,etc.
Other information
Source
Correction date
Occurence date
Detection date
New value
Original value
Percentage of countries
0 20 40 60 80 100
Region:
DevelopedDeveloping
●
●
●
●
●
●
●
●
●
●
●
●
●
●
●
●
●
●
●
●
●
●
●
●
AfricaEastern, South−eastern, Southern AsiaLatin America and Caribbean
Figure 12: Frequency with which specific data elements are recorded when handling errors
57. The majority of countries keep records to document how errors are handled in the maintenanceof the SBR. Among developed countries, around 70 percent keep records of the correctiondate and the data source along the new value. This figure is much lower for developingcountries, as less than 50 percent keep records on the correction date and the data source.Some countries record additional information such as the date from which the new
40

Report on global status of statistical business register programmes
Originalvalue
Newvalue
Detec-tiondate
Occur-encedate
Correc-tiondate
Source Otherinfor-
mation
Developed 59.0 79.5 33.3 30.8 71.8 69.2 15.4
Developing 39.0 61.0 20.8 19.5 49.4 45.5 2.6
Africa 39.1 56.5 17.4 17.4 39.1 34.8 0.0
Eastern, South-eastern,Southern Asia
47.1 58.8 41.2 23.5 47.1 41.2 11.8
Latin America andCaribbean
33.3 66.7 11.1 22.2 44.4 44.4 0.0
Other developing 36.8 63.2 15.8 15.8 68.4 63.2 0.0
CIS 50.0 62.5 12.5 12.5 62.5 50.0 0.0
Oceania 100.0 100.0 0.0 0.0 100.0 100.0 0.0
South-Eastern Europe 20.0 60.0 0.0 0.0 80.0 60.0 0.0
Western Asia 20.0 60.0 40.0 40.0 60.0 80.0 0.0
Non-OECD 38.1 61.9 21.4 19.0 52.4 47.6 1.2
OECD 65.6 81.2 34.4 34.4 68.8 68.8 21.9
Total 45.7 67.2 25.0 23.3 56.9 53.4 6.9
Table 24: Frequency with which specific data elements are recorded when handling errors (percent)
information was valid in reality and the name of the person (user of the BR) in case ifdata was corrected manually.
58. Towards a more systematic recording and management of error detection in SBRs. Oneapproach to more systematically handle errors is to set up a specific database to recordthese details. The structure and functionality of such a database should depend on theprocedures agreed for handling errors. For example, Republic of Korea are planning toconstruct the error management system from 2013.
B.14. Dissemination
59. Dissemination of SBR data to external users is less restricted in developing countries. Table?? shows that, while almost two thirds of the developed countries (64.1 percent) do notallow any kind of access to external users, half of the developing countries (50.6 percent)that responded to the survey do. Full access is granted only in 2 OECD and 2 non-OECDcountries. In most cases, dissemination of SBR data to external users is restricted tocertain variables and for specific purposes. In those countries where access to SBR data isallowed, users include universities and research institutions, academic researchers, andother government entities such as the central bank.
41
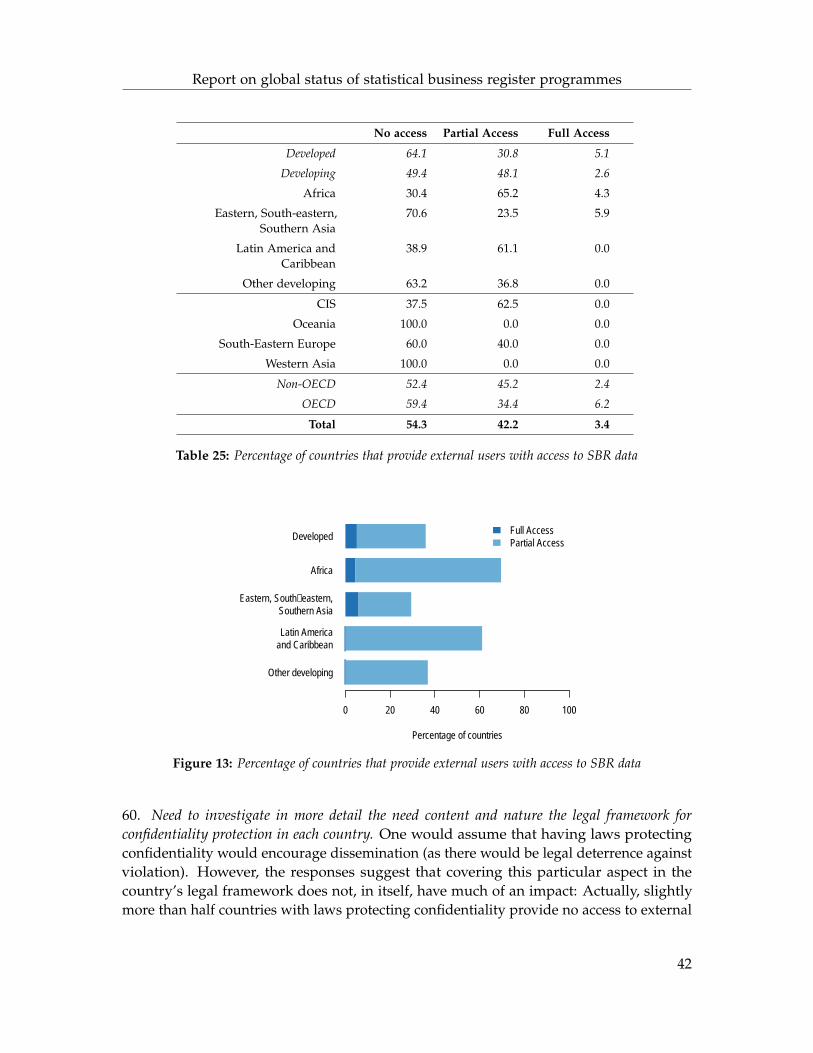
Report on global status of statistical business register programmes
No access Partial Access Full Access
Developed 64.1 30.8 5.1
Developing 49.4 48.1 2.6
Africa 30.4 65.2 4.3
Eastern, South-eastern,Southern Asia
70.6 23.5 5.9
Latin America andCaribbean
38.9 61.1 0.0
Other developing 63.2 36.8 0.0
CIS 37.5 62.5 0.0
Oceania 100.0 0.0 0.0
South-Eastern Europe 60.0 40.0 0.0
Western Asia 100.0 0.0 0.0
Non-OECD 52.4 45.2 2.4
OECD 59.4 34.4 6.2
Total 54.3 42.2 3.4
Table 25: Percentage of countries that provide external users with access to SBR data
Other developing
Latin Americaand Caribbean
Eastern, South−eastern,Southern Asia
Africa
Developed
Percentage of countries
0 20 40 60 80 100
Full AccessPartial Access
Figure 13: Percentage of countries that provide external users with access to SBR data
60. Need to investigate in more detail the need content and nature the legal framework forconfidentiality protection in each country. One would assume that having laws protectingconfidentiality would encourage dissemination (as there would be legal deterrence againstviolation). However, the responses suggest that covering this particular aspect in thecountry’s legal framework does not, in itself, have much of an impact: Actually, slightlymore than half countries with laws protecting confidentiality provide no access to external
42

Report on global status of statistical business register programmes
users. This may have to do with the fact that confidentiality protection is covered in thelegal framework of almost every country, and suggest the need to qualitatively examinethe content of confidentiality laws. For instance, it would be important to elucidate whichtypes of confidentiality-protection rules encourage the dissemination and use of SBR databy establishing appropriate mechanisms for ensuring trust and accountability, and whichrules produce the opposite effect, protecting confidentiality at the risk of making the SBRdata less useful.
61. Relationship between legal framework and SBR data dissemination policy. Table 26 revealsthe existence of a general a positive relationship between the availability of a legalframework regulating the various aspects of SBR compilation and dissemination, andthe provision of access of SBR data to external users. For instance, all the countries thatprovide full access to external users have a legal framework covering the four dimensionsof legal framework covered in the Global Survey. In contrast, countries that do not provideany kind of access to external users are less likely to have a legal framework in place foreach of the dimensions covered in the Global Survey. An important insight from Table26 is that although countries in Africa, CIS, Latin America and the Caribbean countries,provide, on average, more access to external users (see Figure 25), the underlying reasonsfor this vary from one country to another.
Groups of countries byextent of access toexternal users
Share of countries in each row that cover this aspect in theirlegal framework (percent)
Establishmentand
maintenanceof SBR
Use of SBRdata by other
agencies
Confidential-ity
protection
Access toadministrative
sources
Full (4 countries) 100.0 100.0 100.0 100.0
Partial (49 countries) 81.6 65.3 98.0 77.6
No access (63 countries) 66.7 50.8 88.9 68.3
Table 26: Relationship between legal framework and access to external users
B.15. Business demographics
62. The SBR is used as a data source in its own right for the compilation of Business Demographicstatistics in most developed countries. There is a growing demand for information onthe structure and demography of the business population, including the number andcharacteristics of business starts and closings over time. While in most countries the SBRis primarily a tool for preparing and coordinating statistical surveys, in n several countriesit is also one of the sources (and often the main source) of data for preparing BusinessDemographics statistics. In 87.2 percent of developed countries, business demographics
43
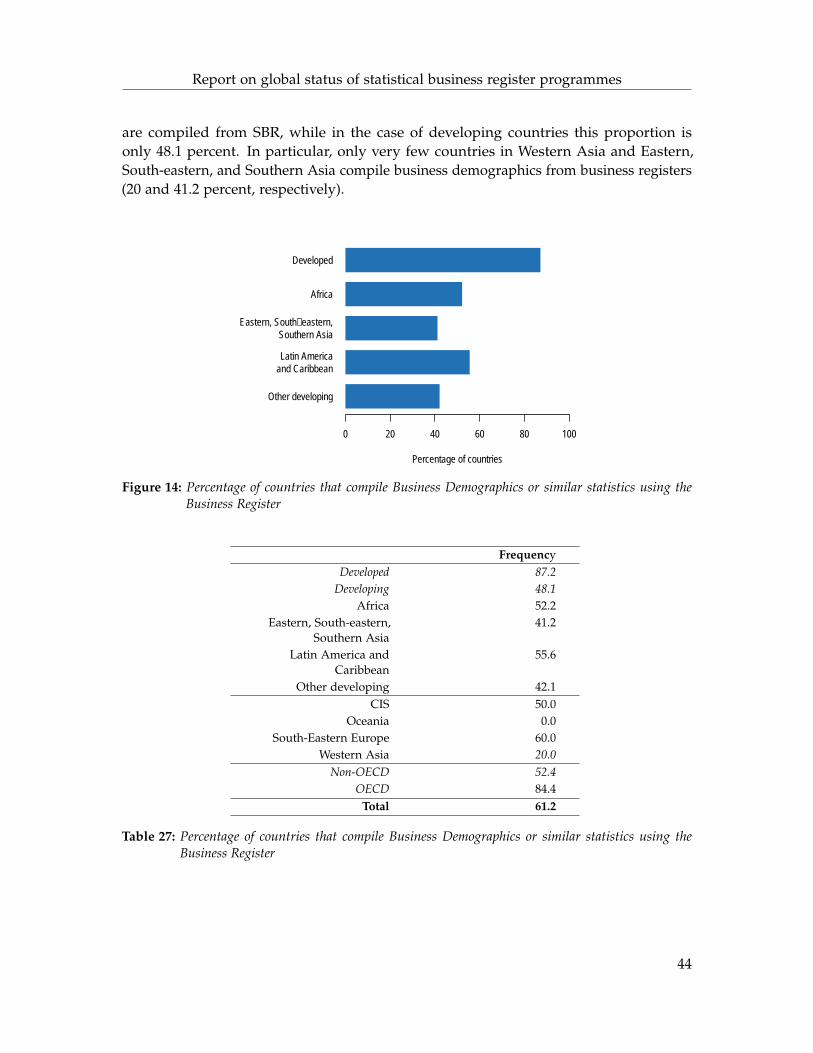
Report on global status of statistical business register programmes
are compiled from SBR, while in the case of developing countries this proportion isonly 48.1 percent. In particular, only very few countries in Western Asia and Eastern,South-eastern, and Southern Asia compile business demographics from business registers(20 and 41.2 percent, respectively).
Other developing
Latin Americaand Caribbean
Eastern, South−eastern,Southern Asia
Africa
Developed
Percentage of countries
0 20 40 60 80 100
Figure 14: Percentage of countries that compile Business Demographics or similar statistics using theBusiness Register
FrequencyDeveloped 87.2
Developing 48.1Africa 52.2
Eastern, South-eastern,Southern Asia
41.2
Latin America andCaribbean
55.6
Other developing 42.1CIS 50.0
Oceania 0.0South-Eastern Europe 60.0
Western Asia 20.0Non-OECD 52.4
OECD 84.4Total 61.2
Table 27: Percentage of countries that compile Business Demographics or similar statistics using theBusiness Register
44
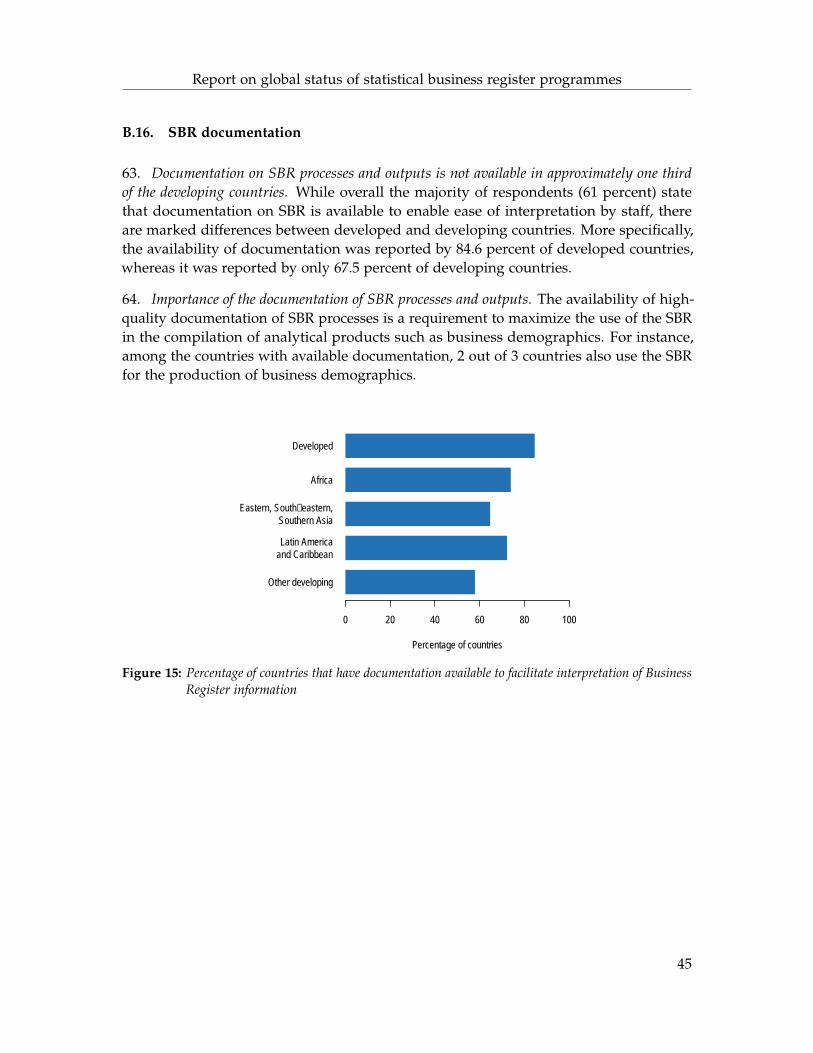
Report on global status of statistical business register programmes
B.16. SBR documentation
63. Documentation on SBR processes and outputs is not available in approximately one thirdof the developing countries. While overall the majority of respondents (61 percent) statethat documentation on SBR is available to enable ease of interpretation by staff, thereare marked differences between developed and developing countries. More specifically,the availability of documentation was reported by 84.6 percent of developed countries,whereas it was reported by only 67.5 percent of developing countries.
64. Importance of the documentation of SBR processes and outputs. The availability of high-quality documentation of SBR processes is a requirement to maximize the use of the SBRin the compilation of analytical products such as business demographics. For instance,among the countries with available documentation, 2 out of 3 countries also use the SBRfor the production of business demographics.
Other developing
Latin Americaand Caribbean
Eastern, South−eastern,Southern Asia
Africa
Developed
Percentage of countries
0 20 40 60 80 100
Figure 15: Percentage of countries that have documentation available to facilitate interpretation of BusinessRegister information
45
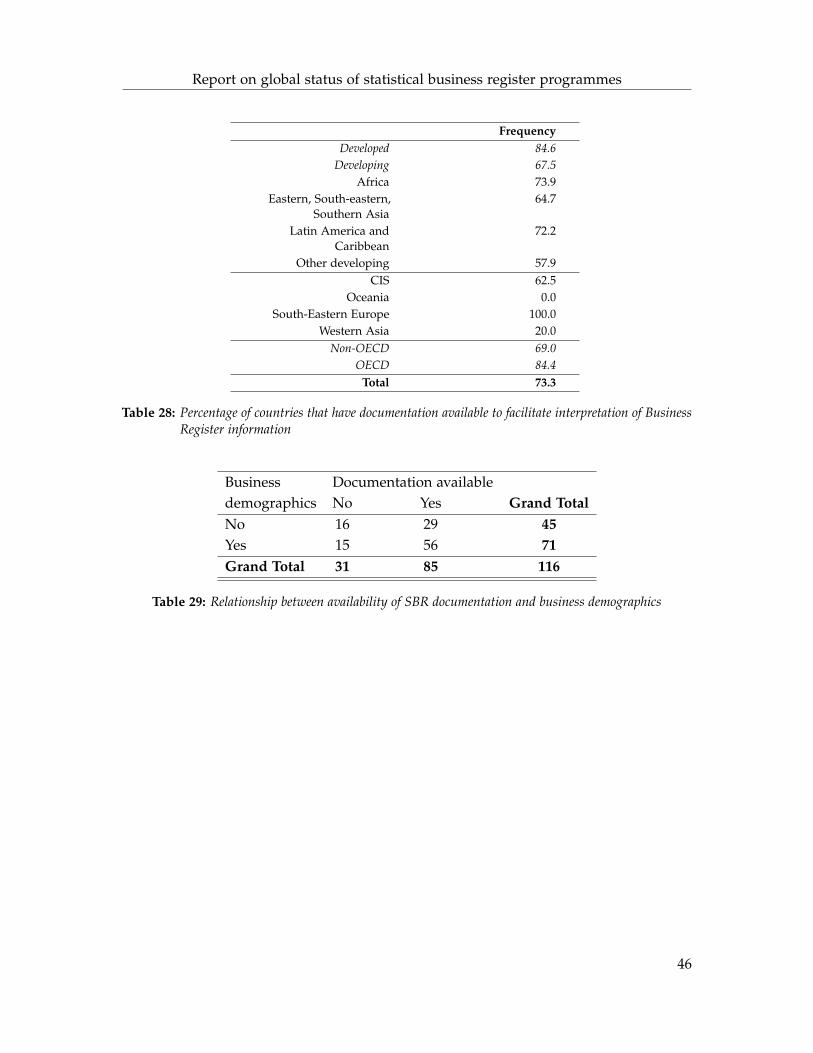
Report on global status of statistical business register programmes
FrequencyDeveloped 84.6
Developing 67.5Africa 73.9
Eastern, South-eastern,Southern Asia
64.7
Latin America andCaribbean
72.2
Other developing 57.9CIS 62.5
Oceania 0.0South-Eastern Europe 100.0
Western Asia 20.0Non-OECD 69.0
OECD 84.4Total 73.3
Table 28: Percentage of countries that have documentation available to facilitate interpretation of BusinessRegister information
Business Documentation availabledemographics No Yes Grand TotalNo 16 29 45Yes 15 56 71Grand Total 31 85 116
Table 29: Relationship between availability of SBR documentation and business demographics
46
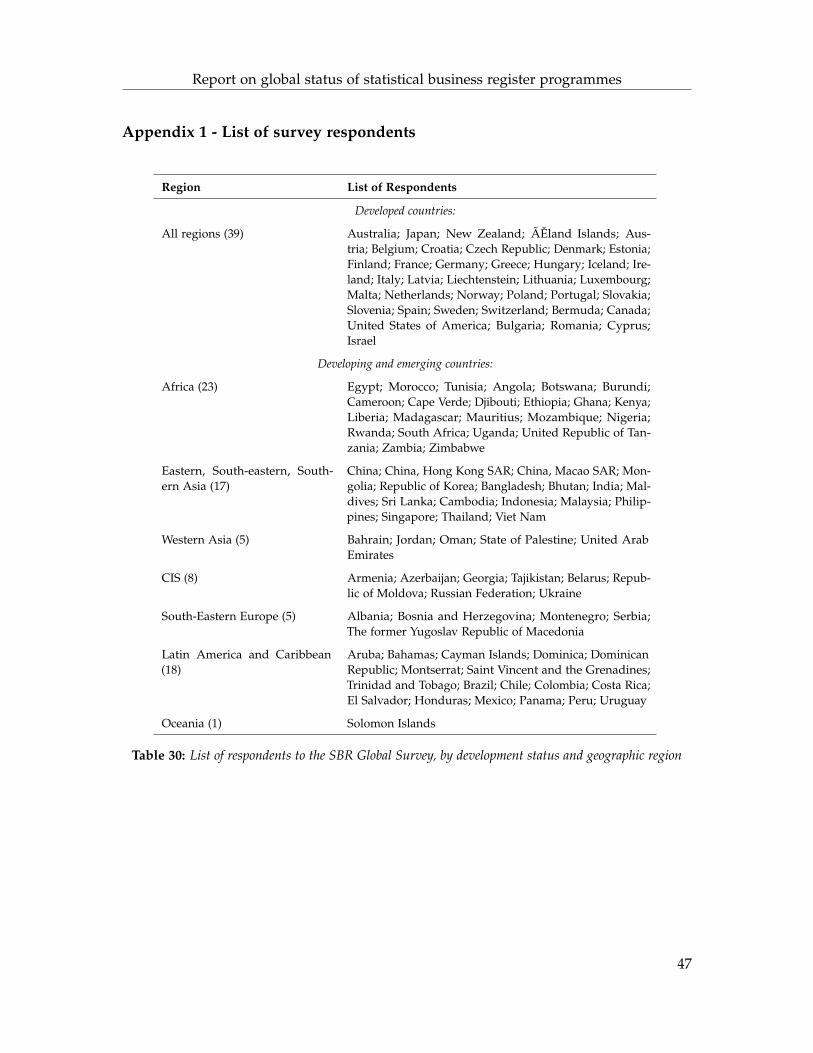
Report on global status of statistical business register programmes
Appendix 1 - List of survey respondents
Region List of Respondents
Developed countries:
All regions (39) Australia; Japan; New Zealand; ÃEland Islands; Aus-tria; Belgium; Croatia; Czech Republic; Denmark; Estonia;Finland; France; Germany; Greece; Hungary; Iceland; Ire-land; Italy; Latvia; Liechtenstein; Lithuania; Luxembourg;Malta; Netherlands; Norway; Poland; Portugal; Slovakia;Slovenia; Spain; Sweden; Switzerland; Bermuda; Canada;United States of America; Bulgaria; Romania; Cyprus;Israel
Developing and emerging countries:
Africa (23) Egypt; Morocco; Tunisia; Angola; Botswana; Burundi;Cameroon; Cape Verde; Djibouti; Ethiopia; Ghana; Kenya;Liberia; Madagascar; Mauritius; Mozambique; Nigeria;Rwanda; South Africa; Uganda; United Republic of Tan-zania; Zambia; Zimbabwe
Eastern, South-eastern, South-ern Asia (17)
China; China, Hong Kong SAR; China, Macao SAR; Mon-golia; Republic of Korea; Bangladesh; Bhutan; India; Mal-dives; Sri Lanka; Cambodia; Indonesia; Malaysia; Philip-pines; Singapore; Thailand; Viet Nam
Western Asia (5) Bahrain; Jordan; Oman; State of Palestine; United ArabEmirates
CIS (8) Armenia; Azerbaijan; Georgia; Tajikistan; Belarus; Repub-lic of Moldova; Russian Federation; Ukraine
South-Eastern Europe (5) Albania; Bosnia and Herzegovina; Montenegro; Serbia;The former Yugoslav Republic of Macedonia
Latin America and Caribbean(18)
Aruba; Bahamas; Cayman Islands; Dominica; DominicanRepublic; Montserrat; Saint Vincent and the Grenadines;Trinidad and Tobago; Brazil; Chile; Colombia; Costa Rica;El Salvador; Honduras; Mexico; Panama; Peru; Uruguay
Oceania (1) Solomon Islands
Table 30: List of respondents to the SBR Global Survey, by development status and geographic region
47
Report on global status of statistical business register programmes
Appendix 2 - Suvery Questionnaire
Organizational Information
• Name of organization:
• Country:
• Point of contact:
– Name:– Position:– E-mail:
Coverage
• What is the coverage of the industrial sectors in the Business Register? (Markall that apply)
2 A: Agriculture, forestry and fishing2 B: Mining and quarrying2 C: Manufacturing2 D: Electricity, gas, steam and air conditioning supply2 E: Water supply, sewerage, waste management and remediation activities2 F: Construction2 G: Wholesale and retail trade, repair of motor vehicles and motorcycles2 H: Transportation and storage2 I: Accommodation and food service activities2 J: Information and communication2 K: Financial and insurance activities2 L: Real estate activities2 M: Professional, scientific and technical activities2 N: Administrative and support service activities2 O: Public administration and defence, compulsory social security2 P: Education2 Q: Human health and social work activities2 R: Arts, entertainment and recreation2 S: Other service activities2 T: Activities of households as employers, undifferentiated goods and Ser-
vices producing activities of households for own use2 U: Activities of extraterritorial organizations and bodies
48

Report on global status of statistical business register programmes
Statistical units
• What are the statistical units in the Business Register? (Mark all that apply)
2 Enterprise group2 Enterprise2 Establishment2 Kind-of-Activity unit (KAU)2 Local unit2 Other (please specify)
Classification of economic activities
• Is the classification by industry, which is used in the Business Register, consis-tent with ISIC (International Standard Industrial Classification)?
2 Yes2 No
ISIC version and level of detail
• Which version of ISIC is used?
2 ISIC Rev. 42 ISIC Rev. 3.12 ISIC Rev. 32 ISIC Rev. 22 ISIC Rev. 1
Additional comments:
• What is the most detailed level of the industrial classification for which unitsare coded?
2 Section level (A,B,...)2 Division (2-digit level)2 Group (3-digit level)2 Class (4-digit level)2 Other (please specify):
ISIC implementation plans
• Is there a plan to develop a classification consistent with ISIC? (please explain)
49

Report on global status of statistical business register programmes
Types of units covered and minimum number of employees
The following four questions refer to the types of units included in the Business Register. For
every type of unit in which your answer is "Yes", please also specify any cutoff point (in terms
of minimum number of employees). For instance, if only businesses with 5 employees or more
are considered, the cutoff point is 5.
• Are public sector enterprises/establishments included in the Business Register?
2 No2 Yes. Please specify the cut-off point:
• Are private sector enterprises/establishments included in the Business Regis-ter?
2 No2 Yes. Please specify the cut-off point:
• Are self-employed businesses included in the Business Register?
2 No2 Yes. Please specify the cut-off point:
• Please specify any other thresholds applied to other types of businesses:
50

Report on global status of statistical business register programmes
Data sources
• Which data sources are used for which characteristics? (Check all that apply)Survey(s) Survey(s) Admin.conducted conducted data from
by National by other Social Regional/ OtherStatistical government Tax Security Trasport Health Customs Local data
Office agencies Records Register Registers Records Records Government sources∗
RegistrationNumber (Admin.
code)
2 2 2 2 2 2 2 2 2
IdentificationNumber
2 2 2 2 2 2 2 2 2
Name / Address /Telephone no.
2 2 2 2 2 2 2 2 2
Enterprise type∗∗ 2 2 2 2 2 2 2 2 2
Industrialclassification
2 2 2 2 2 2 2 2 2
Number ofemployees
2 2 2 2 2 2 2 2 2
Date ofBirth/Closure
2 2 2 2 2 2 2 2 2
Code whether unitis active or not
2 2 2 2 2 2 2 2 2
Type of control∗∗∗ 2 2 2 2 2 2 2 2 2
Turnover/ Revenue 2 2 2 2 2 2 2 2 2
Net fixed assets 2 2 2 2 2 2 2 2 2
∗ Other data sources (e.g., other administrative records maintained by the NSO or other nationalgovernment agencies, or data from chambers of commerce and other associations) - Please specify:∗∗ Specifically:
• incorporated enterprise except cooperative and limited liability partnerships, and nonprofitinstitutions
• cooperative and limited liability partnerships
• nonprofit institution, and
• unincorporated enterprise
∗∗∗ National private controlled sector, public sector controlled sector, or foreign controlled sector
51

Report on global status of statistical business register programmes
Frequency of updates
• With which frequency are the following characteristics updated in the businessregister?
Continuouslyor regularly for
all units - atleast yearly
Continuouslyor regularly forat least part ofthe units - atleast yearly
Occasionally -less frequently
than yearly
Never - nochange has
been made tothe list since it
was established
Not applicable(characteristicis not available
in businessregister)
RegistrationNumber
(Admin. code)2 2 2 2 2
IdentificationNumber
2 2 2 2 2
Name /Address /
Telephone no.2 2 2 2 2
Enterprise type 2 2 2 2 2
Industrialclassification
2 2 2 2 2
Number ofemployees
2 2 2 2 2
Date of Birth /Closure
2 2 2 2 2
Code whetherunit is active or
not2 2 2 2 2
Type of control 2 2 2 2 2
Turnover /Revenue
2 2 2 2 2
Net fixed assets 2 2 2 2 2
Relationships between units
• Does your country have cross-references* among units within the BusinessRegister?
2 No2 Yes, please specify:
52
Report on global status of statistical business register programmes
Time gap between register updates and sample selection
• What is the longest time gap between last update and the use of BusinessRegister for sample survey selection?
2 Less than 3 months2 Between 3 months and 6 months2 Between 6 months and a year2 Between a year and 3 years2 More than 3 years
Additional comments:
Error handling
• Does your country record the handling of errors∗ which were detected duringupdating?
2 No2 Yes
∗ An error in this case is only relevant for the classification variables, namely Industrial
classification, Size class (number of employees), Date of birth/death, Whether unit is active or
not, Whether unit is private, public or foreign controlled. An error in a SBR is a difference in
the information presented in the register and the actual situation, e.g. units are recorded as
economically active, but actually are no longer active. Please disregard for this question errors
in name, address and telephone numbers
• Please indicate what kinds of information are recorded when handling errors?(Mark all that apply)
2 The original value (the wrong one)2 The new value (the correct one)2 The date of detection2 The date of occurrence2 The date of correction2 The source of the corrected value2 Other (please specify)
Identity number
• Is there an identity number (IN)* for statistical units?
2 Yes2 No
∗ An identity number must be independent of other characteristics and not be changed through-
out the life of the unit.
53

Report on global status of statistical business register programmes
Data linking
• Is it possible to cross-link the identity number for statistical units with externalidentity numbers used in other sources?
2 Yes2 No2 Additional comments:
• Please explain how to link the data from different sources (e.g., using legalname):
Legal framework
• Are the following aspects of the maintenance and updating of the BusinessRegister mandated by a legal act?
– Establishment and maintenance of a list2 Yes2 No
– Use of list by other agencies for statistical purposes2 Yes2 No
– Protection/Safeguard of confidentiality of the data2 Yes2 No
– Access to administrative data2 Yes2 No
• Please specify any other aspects which are mandated by a legal act or offi-cial statistical framework in relation to the maintenance and updating of theBusiness Register:
Continuity rules
• Does your country have any continuity rules* for a statistical unit?
2 No2 Yes (please specify):
∗ Continuity rules to keep the same enterprise, even in case of a change of name and/or address,
a change of principal activity, or a change of control.
54

Report on global status of statistical business register programmes
Business demographics
• Does your country compile Business Demographics or similar statistics usingthe Business Register?
2 Yes2 No
• If you compile the BDS using other source, please specify:
• Please provide details about the Business Demographics or similar statisticsthat are compiled in your country using the Business Register:
– Name of Statistics:– Point of Contact:– Date of first compilation:
Documentation
• Is documentation available on the Business Register to enable ease of interpre-tation of register information by staff working in the area?
2 No2 Yes
• If you answered yes, and this documentation is available on-line, please providethe link information:
Users
• To what kind of users is the Business Register available?
2 Internal* users only2 External users also
∗ Internal use refers to use by the national statistical system only
• Who are the major external users/customers of the Business Register?
• What is the scope of access* for external users?
2 Full2 Partial
Additional comments∗ Even if access is granted for external use, it is possible that due to confidentiality considerations
some of the variables cannot be provided
55