Report of the Malaysian National Neonatal Registry … Muar, Johor Dr. Angeline Wan KUP Siti Rabsah...
81
Report of the Malaysian National Neonatal Registry EDITOR: Neoh Siew Hong WITH CONTRIBUTIONS FROM: Irene Cheah Guat Sim Chee Seok Chiong Jimmy Lee Kok Foo Soo Thian Lia Boo Nem Yun Zuraidah Bt Abdul Latif P e r i n a t a l S o c i e t y o f M a l a y s i a 2013 A Study of Critically Ill Babies in Neonatal Intensive Care Units A Study of Critically Ill Babies in Neonatal Intensive Care Units
Transcript of Report of the Malaysian National Neonatal Registry … Muar, Johor Dr. Angeline Wan KUP Siti Rabsah...
Report of theMalaysian National Neonatal Registry
EDITOR:
Neoh Siew Hong
WITH CONTRIBUTIONS FROM:
Irene Cheah Guat Sim Chee Seok Chiong Jimmy Lee Kok Foo Soo Thian Lia Boo Nem Yun Zuraidah Bt Abdul Latif
Perinatal Society of Malays
ia
2013A Study of Critically Ill Babies in Neonatal Intensive Care UnitsA Study of Critically Ill Babies in Neonatal Intensive Care Units
2
Report of the
Malaysian NationalNeonatal Registry
2013
A STUDY OF CRITICALLY ILL BABIES
IN NEONATAL INTENSIVE CARE UNITS
Editor:Neoh Siew Hong
With contributions from:Boo Nem Yun, Irene Cheah Guat Sim, Chee Seok Chiong,Jimmy Lee Kok Foo, Soo Thian Lian, Zuraidah Abdul Latif
Perinatal Society of Malays
ia
3
Published by the:
Malaysian National Neonatal Registry (MNNR) Unit 2.4 (Suite 3), Level 2 Enterprise 3B, Technology Park Malaysia Lebuhraya Sungei Besi – Puchong Bukit Jalil 57000 Kuala Lumpur Malaysia
Important information
This report is copyrighted. Reproduction and dissemination of this report in part or in whole for research, educational or
other non-commercial purposes are not authorized without any prior written permission from the copyright holders
unless the source is fully acknowledged. Suggested citation is: Malaysian National Neonatal Registry and Clinical
Research Centre, Ministry of Health Malaysia, Kuala Lumpur 2017.
Disclaimer There is a potential that data for previous years printed in this report are different from what were printed in previous reports. This is because analysis for this report is based on latest dataset in the web which may have been updated by SDP.
August 2017
© Malaysian National Neonatal Registry, Malaysia
Direct Line : (603)-8996 4505 Fax : (603)- 8996 4505 E-mail : [email protected] Website : http://www.acrm.org.my/mnnr

4
ACKNOWLEDGEMENTS
The Malaysian National Neonatal Registry would like to express its sincere thanks and appreciation to all who have
supported and contributed to this report.
We thank the following for their support:
The Ministry of Health, Malaysia.
Y.Bhg. Datuk Dr. Noor Hisham Abdullah, Director General of Health, Malaysia for his kind permission for
publication
Dr. Goh Pik Pin, Director, Network of Clinical Research Centre
Members of the MNNR Steering Committee for their contributions to the registry
Our 38 source data providers from the Government Hospitals which comprise of doctors and nurses working in
the NICUs
Clinical Research Centre, Ministry of Health, Malaysia
CRC statisticians, En. Adam Bin Bujang, En. Tengku Mohd Ikhwan, En. Shahrul Aiman and En. Muhammad Firdaus
Puan ‘Aisyah Binti Ruslan, former Registry Manager, MNNR
Ms. Thinisha a/p Mohan, Registry Manager, MNNR
Pn. Ain Bt Hamdan, Assistant Registry Manager, MNNR
Other sponsors and supporters from the professional bodies, industries and institutions as listed below:
Perinatal Society of Malaysia
AbbVie (M) Sdn Bhd
5
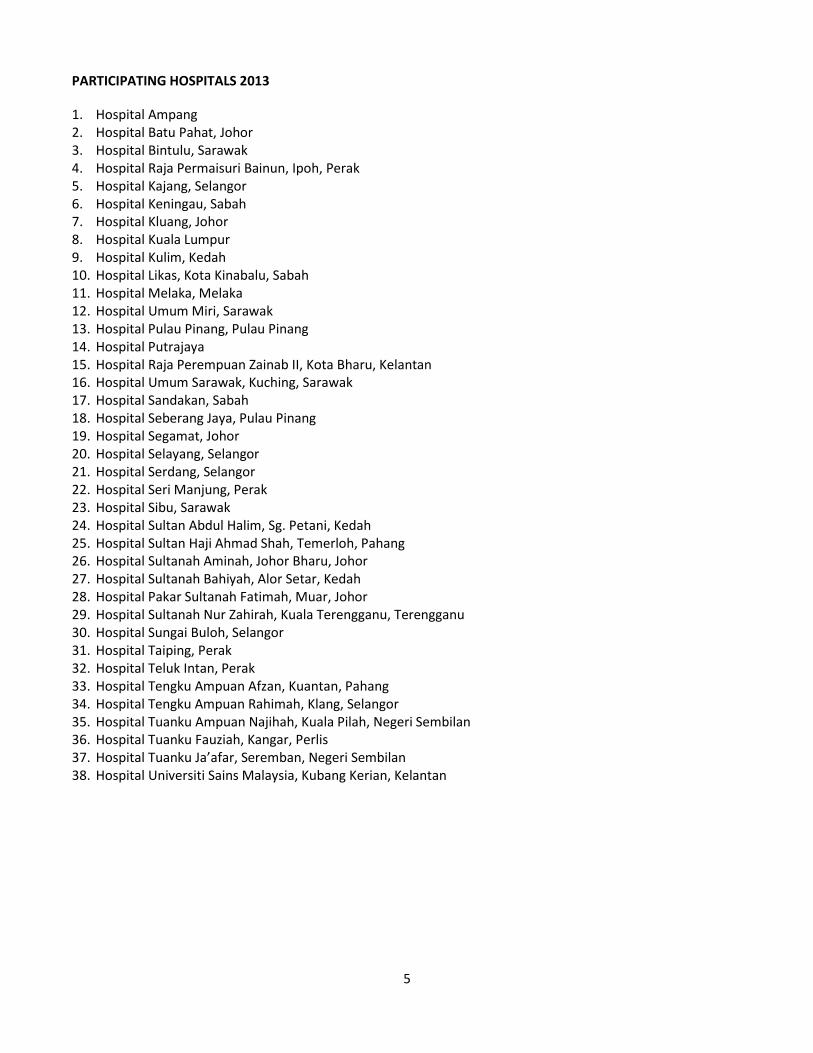
PARTICIPATING HOSPITALS 2013
1. Hospital Ampang 2. Hospital Batu Pahat, Johor 3. Hospital Bintulu, Sarawak 4. Hospital Raja Permaisuri Bainun, Ipoh, Perak 5. Hospital Kajang, Selangor 6. Hospital Keningau, Sabah 7. Hospital Kluang, Johor 8. Hospital Kuala Lumpur 9. Hospital Kulim, Kedah 10. Hospital Likas, Kota Kinabalu, Sabah 11. Hospital Melaka, Melaka 12. Hospital Umum Miri, Sarawak 13. Hospital Pulau Pinang, Pulau Pinang 14. Hospital Putrajaya 15. Hospital Raja Perempuan Zainab II, Kota Bharu, Kelantan 16. Hospital Umum Sarawak, Kuching, Sarawak 17. Hospital Sandakan, Sabah 18. Hospital Seberang Jaya, Pulau Pinang 19. Hospital Segamat, Johor 20. Hospital Selayang, Selangor 21. Hospital Serdang, Selangor 22. Hospital Seri Manjung, Perak 23. Hospital Sibu, Sarawak 24. Hospital Sultan Abdul Halim, Sg. Petani, Kedah 25. Hospital Sultan Haji Ahmad Shah, Temerloh, Pahang 26. Hospital Sultanah Aminah, Johor Bharu, Johor 27. Hospital Sultanah Bahiyah, Alor Setar, Kedah 28. Hospital Pakar Sultanah Fatimah, Muar, Johor 29. Hospital Sultanah Nur Zahirah, Kuala Terengganu, Terengganu 30. Hospital Sungai Buloh, Selangor 31. Hospital Taiping, Perak 32. Hospital Teluk Intan, Perak 33. Hospital Tengku Ampuan Afzan, Kuantan, Pahang 34. Hospital Tengku Ampuan Rahimah, Klang, Selangor 35. Hospital Tuanku Ampuan Najihah, Kuala Pilah, Negeri Sembilan 36. Hospital Tuanku Fauziah, Kangar, Perlis 37. Hospital Tuanku Ja’afar, Seremban, Negeri Sembilan 38. Hospital Universiti Sains Malaysia, Kubang Kerian, Kelantan
6
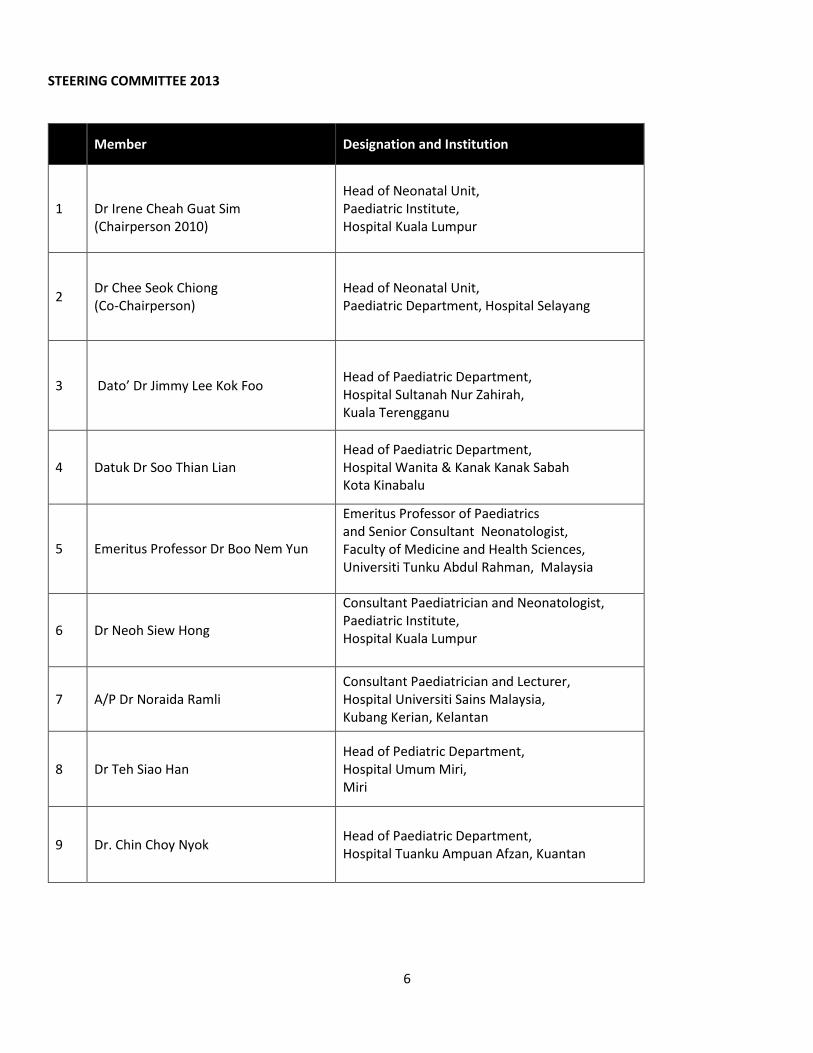
STEERING COMMITTEE 2013
Member Designation and Institution
1 Dr Irene Cheah Guat Sim (Chairperson 2010)
Head of Neonatal Unit, Paediatric Institute, Hospital Kuala Lumpur
2 Dr Chee Seok Chiong (Co-Chairperson)
Head of Neonatal Unit, Paediatric Department, Hospital Selayang
3 Dato’ Dr Jimmy Lee Kok Foo
Head of Paediatric Department, Hospital Sultanah Nur Zahirah, Kuala Terengganu
4 Datuk Dr Soo Thian Lian Head of Paediatric Department, Hospital Wanita & Kanak Kanak Sabah Kota Kinabalu
5 Emeritus Professor Dr Boo Nem Yun
Emeritus Professor of Paediatrics and Senior Consultant Neonatologist, Faculty of Medicine and Health Sciences, Universiti Tunku Abdul Rahman, Malaysia
6 Dr Neoh Siew Hong
Consultant Paediatrician and Neonatologist, Paediatric Institute, Hospital Kuala Lumpur
7 A/P Dr Noraida Ramli Consultant Paediatrician and Lecturer, Hospital Universiti Sains Malaysia, Kubang Kerian, Kelantan
8 Dr Teh Siao Han Head of Pediatric Department, Hospital Umum Miri, Miri
9 Dr. Chin Choy Nyok Head of Paediatric Department, Hospital Tuanku Ampuan Afzan, Kuantan
7
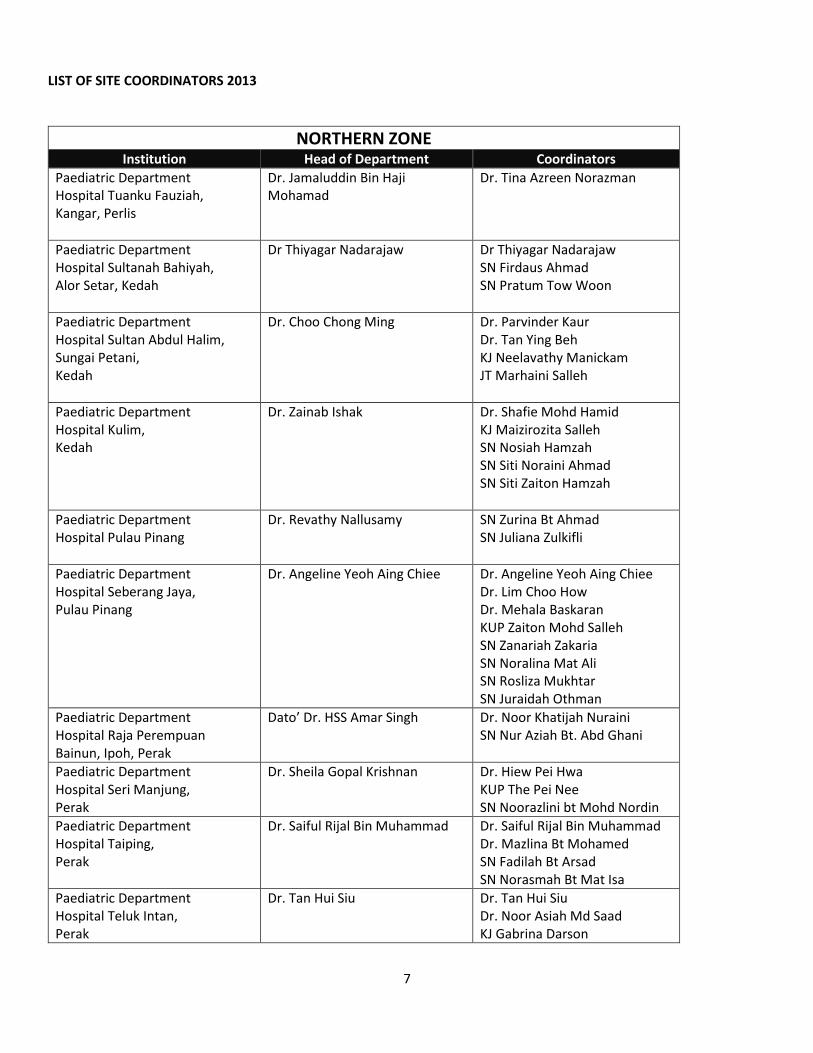
LIST OF SITE COORDINATORS 2013
NORTHERN ZONE Institution Head of Department Coordinators
Paediatric Department Hospital Tuanku Fauziah, Kangar, Perlis
Dr. Jamaluddin Bin Haji Mohamad
Dr. Tina Azreen Norazman
Paediatric Department Hospital Sultanah Bahiyah, Alor Setar, Kedah
Dr Thiyagar Nadarajaw Dr Thiyagar Nadarajaw SN Firdaus Ahmad SN Pratum Tow Woon
Paediatric Department Hospital Sultan Abdul Halim, Sungai Petani, Kedah
Dr. Choo Chong Ming Dr. Parvinder Kaur Dr. Tan Ying Beh KJ Neelavathy Manickam JT Marhaini Salleh
Paediatric Department Hospital Kulim, Kedah
Dr. Zainab Ishak Dr. Shafie Mohd Hamid KJ Maizirozita Salleh SN Nosiah Hamzah SN Siti Noraini Ahmad SN Siti Zaiton Hamzah
Paediatric Department Hospital Pulau Pinang
Dr. Revathy Nallusamy SN Zurina Bt Ahmad SN Juliana Zulkifli
Paediatric Department Hospital Seberang Jaya, Pulau Pinang
Dr. Angeline Yeoh Aing Chiee Dr. Angeline Yeoh Aing Chiee Dr. Lim Choo How Dr. Mehala Baskaran KUP Zaiton Mohd Salleh SN Zanariah Zakaria SN Noralina Mat Ali SN Rosliza Mukhtar SN Juraidah Othman
Paediatric Department Hospital Raja Perempuan Bainun, Ipoh, Perak
Dato’ Dr. HSS Amar Singh Dr. Noor Khatijah Nuraini SN Nur Aziah Bt. Abd Ghani
Paediatric Department Hospital Seri Manjung, Perak
Dr. Sheila Gopal Krishnan Dr. Hiew Pei Hwa KUP The Pei Nee SN Noorazlini bt Mohd Nordin
Paediatric Department Hospital Taiping, Perak
Dr. Saiful Rijal Bin Muhammad Dr. Saiful Rijal Bin Muhammad Dr. Mazlina Bt Mohamed SN Fadilah Bt Arsad SN Norasmah Bt Mat Isa
Paediatric Department Hospital Teluk Intan, Perak
Dr. Tan Hui Siu
Dr. Tan Hui Siu Dr. Noor Asiah Md Saad KJ Gabrina Darson
8
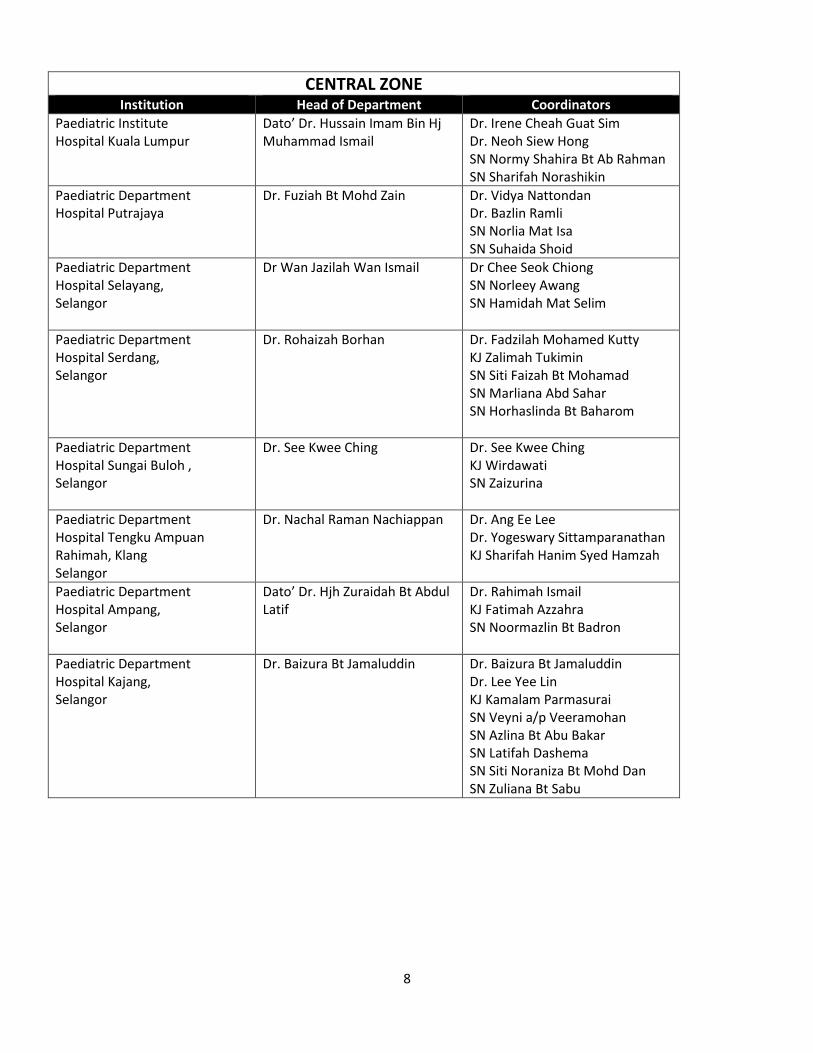
CENTRAL ZONE Institution Head of Department Coordinators
Paediatric Institute Hospital Kuala Lumpur
Dato’ Dr. Hussain Imam Bin Hj Muhammad Ismail
Dr. Irene Cheah Guat Sim Dr. Neoh Siew Hong SN Normy Shahira Bt Ab Rahman SN Sharifah Norashikin
Paediatric Department Hospital Putrajaya
Dr. Fuziah Bt Mohd Zain
Dr. Vidya Nattondan Dr. Bazlin Ramli SN Norlia Mat Isa SN Suhaida Shoid
Paediatric Department Hospital Selayang, Selangor
Dr Wan Jazilah Wan Ismail Dr Chee Seok Chiong SN Norleey Awang SN Hamidah Mat Selim
Paediatric Department Hospital Serdang, Selangor
Dr. Rohaizah Borhan Dr. Fadzilah Mohamed Kutty KJ Zalimah Tukimin SN Siti Faizah Bt Mohamad SN Marliana Abd Sahar SN Horhaslinda Bt Baharom
Paediatric Department Hospital Sungai Buloh , Selangor
Dr. See Kwee Ching Dr. See Kwee Ching KJ Wirdawati SN Zaizurina
Paediatric Department Hospital Tengku Ampuan Rahimah, Klang Selangor
Dr. Nachal Raman Nachiappan Dr. Ang Ee Lee Dr. Yogeswary Sittamparanathan KJ Sharifah Hanim Syed Hamzah
Paediatric Department Hospital Ampang, Selangor
Dato’ Dr. Hjh Zuraidah Bt Abdul Latif
Dr. Rahimah Ismail KJ Fatimah Azzahra SN Noormazlin Bt Badron
Paediatric Department Hospital Kajang, Selangor
Dr. Baizura Bt Jamaluddin Dr. Baizura Bt Jamaluddin Dr. Lee Yee Lin KJ Kamalam Parmasurai SN Veyni a/p Veeramohan SN Azlina Bt Abu Bakar SN Latifah Dashema SN Siti Noraniza Bt Mohd Dan SN Zuliana Bt Sabu
9
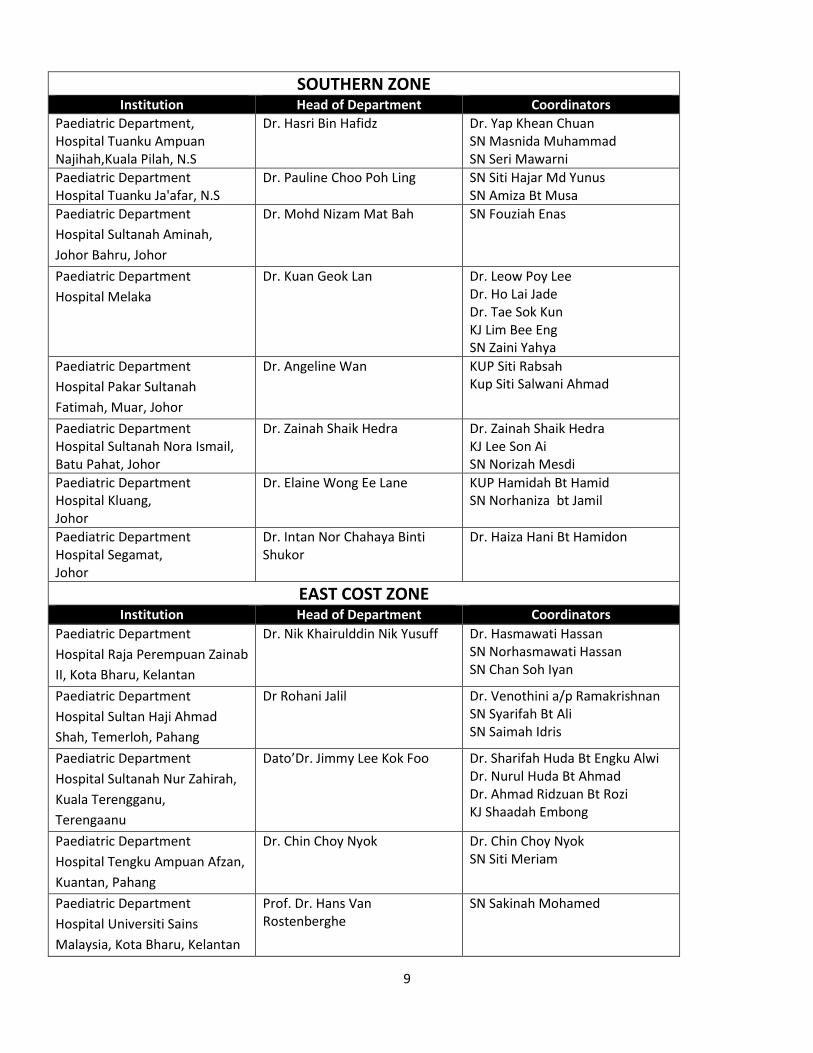
SOUTHERN ZONE Institution Head of Department Coordinators
Paediatric Department, Hospital Tuanku Ampuan Najihah,Kuala Pilah, N.S
Dr. Hasri Bin Hafidz Dr. Yap Khean Chuan SN Masnida Muhammad SN Seri Mawarni
Paediatric Department Hospital Tuanku Ja'afar, N.S
Dr. Pauline Choo Poh Ling SN Siti Hajar Md Yunus SN Amiza Bt Musa
Paediatric Department
Hospital Sultanah Aminah,
Johor Bahru, Johor
Dr. Mohd Nizam Mat Bah SN Fouziah Enas
Paediatric Department
Hospital Melaka
Dr. Kuan Geok Lan Dr. Leow Poy Lee Dr. Ho Lai Jade Dr. Tae Sok Kun KJ Lim Bee Eng SN Zaini Yahya
Paediatric Department
Hospital Pakar Sultanah
Fatimah, Muar, Johor
Dr. Angeline Wan KUP Siti Rabsah Kup Siti Salwani Ahmad
Paediatric Department Hospital Sultanah Nora Ismail, Batu Pahat, Johor
Dr. Zainah Shaik Hedra Dr. Zainah Shaik Hedra KJ Lee Son Ai SN Norizah Mesdi
Paediatric Department Hospital Kluang, Johor
Dr. Elaine Wong Ee Lane KUP Hamidah Bt Hamid SN Norhaniza bt Jamil
Paediatric Department Hospital Segamat, Johor
Dr. Intan Nor Chahaya Binti Shukor
Dr. Haiza Hani Bt Hamidon
EAST COST ZONE Institution Head of Department Coordinators
Paediatric Department
Hospital Raja Perempuan Zainab
II, Kota Bharu, Kelantan
Dr. Nik Khairulddin Nik Yusuff Dr. Hasmawati Hassan SN Norhasmawati Hassan SN Chan Soh Iyan
Paediatric Department
Hospital Sultan Haji Ahmad
Shah, Temerloh, Pahang
Dr Rohani Jalil Dr. Venothini a/p Ramakrishnan SN Syarifah Bt Ali SN Saimah Idris
Paediatric Department
Hospital Sultanah Nur Zahirah,
Kuala Terengganu,
Terengaanu
Dato’Dr. Jimmy Lee Kok Foo Dr. Sharifah Huda Bt Engku Alwi Dr. Nurul Huda Bt Ahmad Dr. Ahmad Ridzuan Bt Rozi KJ Shaadah Embong
Paediatric Department
Hospital Tengku Ampuan Afzan,
Kuantan, Pahang
Dr. Chin Choy Nyok Dr. Chin Choy Nyok SN Siti Meriam
Paediatric Department
Hospital Universiti Sains
Malaysia, Kota Bharu, Kelantan
Prof. Dr. Hans Van Rostenberghe
SN Sakinah Mohamed
10
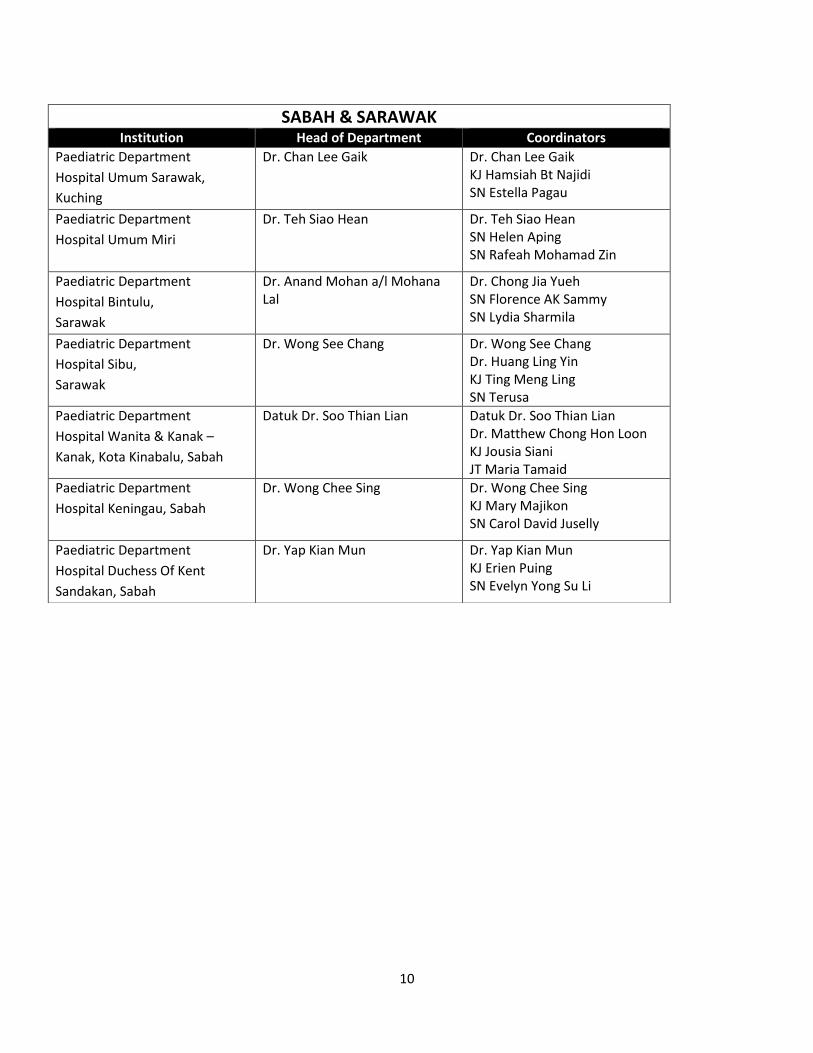
SABAH & SARAWAK Institution Head of Department Coordinators
Paediatric Department
Hospital Umum Sarawak,
Kuching
Dr. Chan Lee Gaik Dr. Chan Lee Gaik KJ Hamsiah Bt Najidi SN Estella Pagau
Paediatric Department
Hospital Umum Miri
Dr. Teh Siao Hean Dr. Teh Siao Hean SN Helen Aping SN Rafeah Mohamad Zin
Paediatric Department
Hospital Bintulu,
Sarawak
Dr. Anand Mohan a/l Mohana Lal
Dr. Chong Jia Yueh SN Florence AK Sammy SN Lydia Sharmila
Paediatric Department
Hospital Sibu,
Sarawak
Dr. Wong See Chang Dr. Wong See Chang Dr. Huang Ling Yin KJ Ting Meng Ling SN Terusa
Paediatric Department
Hospital Wanita & Kanak –
Kanak, Kota Kinabalu, Sabah
Datuk Dr. Soo Thian Lian Datuk Dr. Soo Thian Lian Dr. Matthew Chong Hon Loon KJ Jousia Siani JT Maria Tamaid
Paediatric Department
Hospital Keningau, Sabah
Dr. Wong Chee Sing Dr. Wong Chee Sing KJ Mary Majikon SN Carol David Juselly
Paediatric Department
Hospital Duchess Of Kent
Sandakan, Sabah
Dr. Yap Kian Mun Dr. Yap Kian Mun KJ Erien Puing SN Evelyn Yong Su Li
11
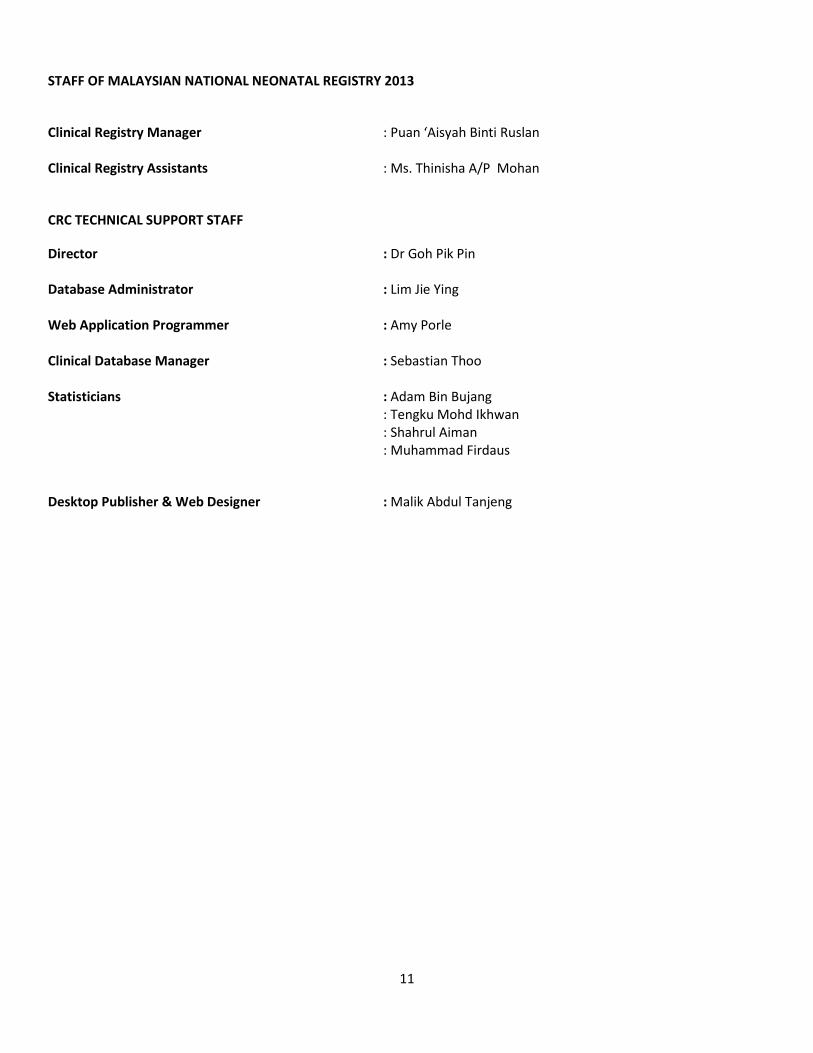
STAFF OF MALAYSIAN NATIONAL NEONATAL REGISTRY 2013
Clinical Registry Manager : Puan ‘Aisyah Binti Ruslan Clinical Registry Assistants : Ms. Thinisha A/P Mohan
CRC TECHNICAL SUPPORT STAFF
Director : Dr Goh Pik Pin Database Administrator : Lim Jie Ying Web Application Programmer : Amy Porle Clinical Database Manager : Sebastian Thoo Statisticians : Adam Bin Bujang : Tengku Mohd Ikhwan : Shahrul Aiman : Muhammad Firdaus
Desktop Publisher & Web Designer : Malik Abdul Tanjeng
12
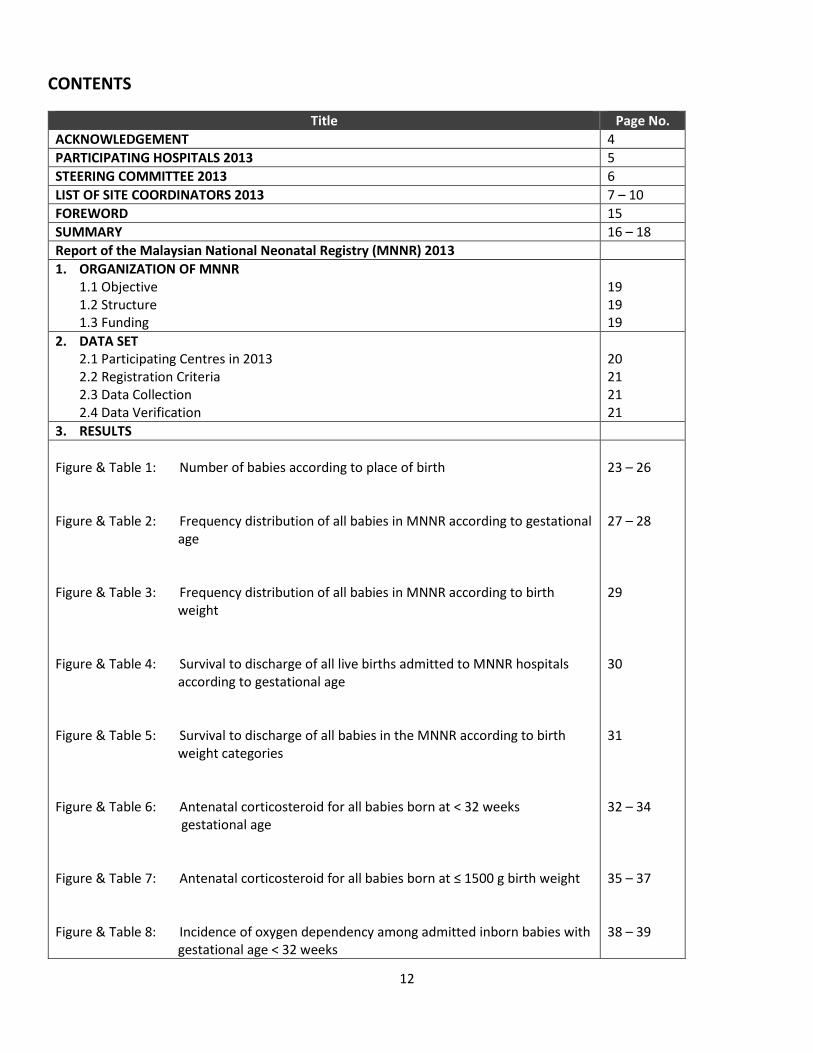
CONTENTS
Title Page No.
ACKNOWLEDGEMENT 4
PARTICIPATING HOSPITALS 2013 5
STEERING COMMITTEE 2013 6
LIST OF SITE COORDINATORS 2013 7 – 10
FOREWORD 15
SUMMARY 16 – 18
Report of the Malaysian National Neonatal Registry (MNNR) 2013
1. ORGANIZATION OF MNNR 1.1 Objective 1.2 Structure 1.3 Funding
19 19 19
2. DATA SET 2.1 Participating Centres in 2013 2.2 Registration Criteria 2.3 Data Collection 2.4 Data Verification
20 21 21 21
3. RESULTS
Figure & Table 1: Number of babies according to place of birth Figure & Table 2: Frequency distribution of all babies in MNNR according to gestational age Figure & Table 3: Frequency distribution of all babies in MNNR according to birth weight Figure & Table 4: Survival to discharge of all live births admitted to MNNR hospitals according to gestational age Figure & Table 5: Survival to discharge of all babies in the MNNR according to birth weight categories Figure & Table 6: Antenatal corticosteroid for all babies born at < 32 weeks gestational age Figure & Table 7: Antenatal corticosteroid for all babies born at ≤ 1500 g birth weight Figure & Table 8: Incidence of oxygen dependency among admitted inborn babies with gestational age < 32 weeks
23 – 26 27 – 28 29 30 31 32 – 34 35 – 37 38 – 39
13
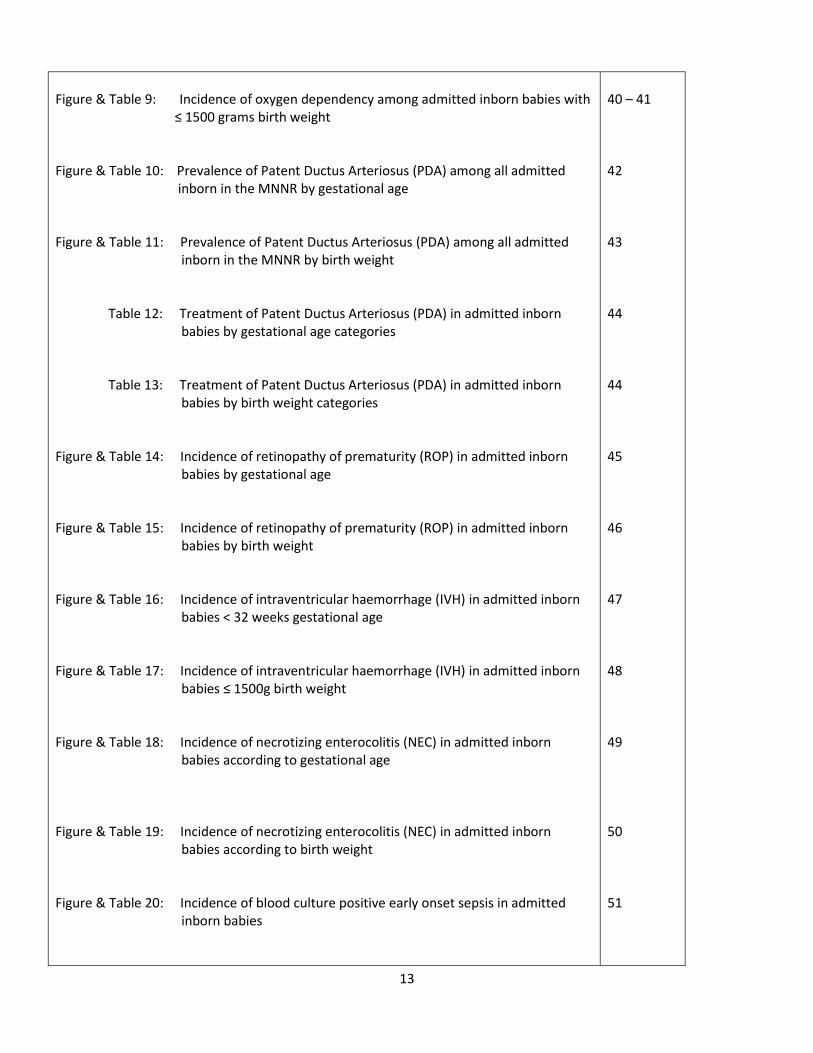
Figure & Table 9: Incidence of oxygen dependency among admitted inborn babies with ≤ 1500 grams birth weight Figure & Table 10: Prevalence of Patent Ductus Arteriosus (PDA) among all admitted inborn in the MNNR by gestational age Figure & Table 11: Prevalence of Patent Ductus Arteriosus (PDA) among all admitted inborn in the MNNR by birth weight Table 12: Treatment of Patent Ductus Arteriosus (PDA) in admitted inborn babies by gestational age categories Table 13: Treatment of Patent Ductus Arteriosus (PDA) in admitted inborn babies by birth weight categories Figure & Table 14: Incidence of retinopathy of prematurity (ROP) in admitted inborn babies by gestational age Figure & Table 15: Incidence of retinopathy of prematurity (ROP) in admitted inborn babies by birth weight Figure & Table 16: Incidence of intraventricular haemorrhage (IVH) in admitted inborn babies < 32 weeks gestational age Figure & Table 17: Incidence of intraventricular haemorrhage (IVH) in admitted inborn babies ≤ 1500g birth weight Figure & Table 18: Incidence of necrotizing enterocolitis (NEC) in admitted inborn babies according to gestational age Figure & Table 19: Incidence of necrotizing enterocolitis (NEC) in admitted inborn babies according to birth weight Figure & Table 20: Incidence of blood culture positive early onset sepsis in admitted inborn babies
40 – 41 42 43 44 44 45 46 47 48 49 50 51
14
Figure & Table 21: Incidence of blood culture positive late onset sepsis in admitted inborn babies (by gestational age) Figure & Table 22: Incidence of blood culture positive late onset sepsis in admitted inborn babies (by birth weight) Table 23a: Gestational age specific mortality or significant morbidity in admitted inborn babies (five morbidities) Table 23b: Birth weight specific mortality or significant morbidity in admitted inborn babies (five morbidities)
52 53 54 55
4. APPENDICES
Appendix 1 Level of Neonatal Care Appendix 2 Data Definitions Appendix 3 Census Form
Appendix 4 Case Report Form (CRF) Appendix 4a Supplemetary Form Appendix 5 Presentation
57 58 – 72 73 – 74 75 – 78 79 80
15
FOREWORD
This is the tenth printed edition for the annual report of the Malaysian National Neonatal Registry (MNNR) for the study
year 2013. The registry in the year 2013 comprised 37 NICUs in Ministry of Health hospitals, and one from a university
hospital.
The steering committee would like to thank the Director General of Health Datuk Dr. Noor Hisham bin Abdullah, the head
of Paediatric Service, Dr. Hishamshah bin Mohd Ibrahim, the immediate past head of Pediatric Service, Dato’ Dr Hussain
Imam bin Haji Muhammad Ismail, and the head of Clinical Research Centre, Dr. Goh Pik Pin for their constant support.
The commitment and hard work of the individual staff of the participating centres to key in the data online and the MNNR
secretariat are to be highly commended.
The MNNR has enabled the readily available data for epidemiology, workload and outcomes to be readily accessible and
having an online system data entry that has been updated with data entry rules over the years has made data cleaning
easier. Thus, it is hope that future reports will be timelier.
Several papers from MNNR data have been published and quality intervention workshops have been held where
improvement is required based on the registry findings. All the NICUs in this registry have access to their performance as
compared to the benchmark and continue to strive to provide better care through audit and quality improvement.
Dr. Irene Cheah Guat Sim
Chairman,
Malaysian National Neonatal Registry

16
SUMMARY
The inclusion criteria for this study in 2013 were all preterm babies below 32 weeks gestational age, those of birth weight below or equal to 1500 g, all babies who required mechanical ventilation and/or nasal continuous positive airway pressure (nCPAP), all babies with hypoxic ischaemic encephalopathy (HIE) and all neonatal deaths (babies < 28 days old who died in Neonatal Unit, Obstetric Department and other wards). Both inborn and outborn babies were included.
Results:
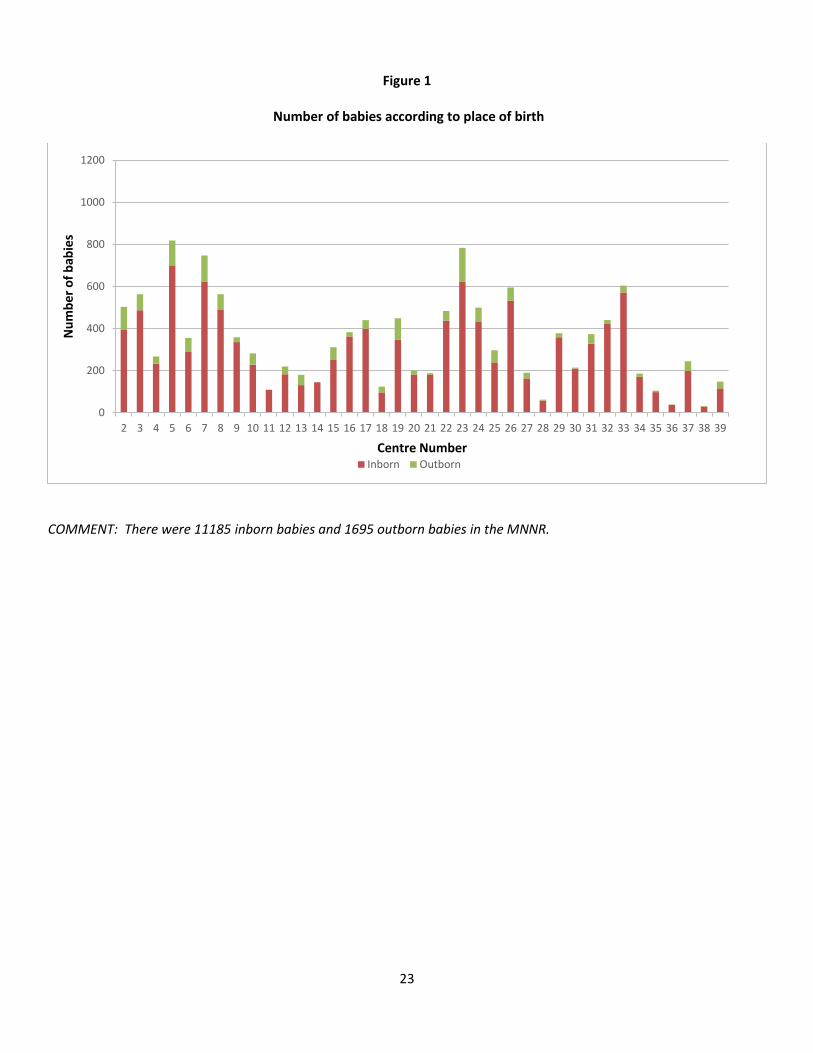
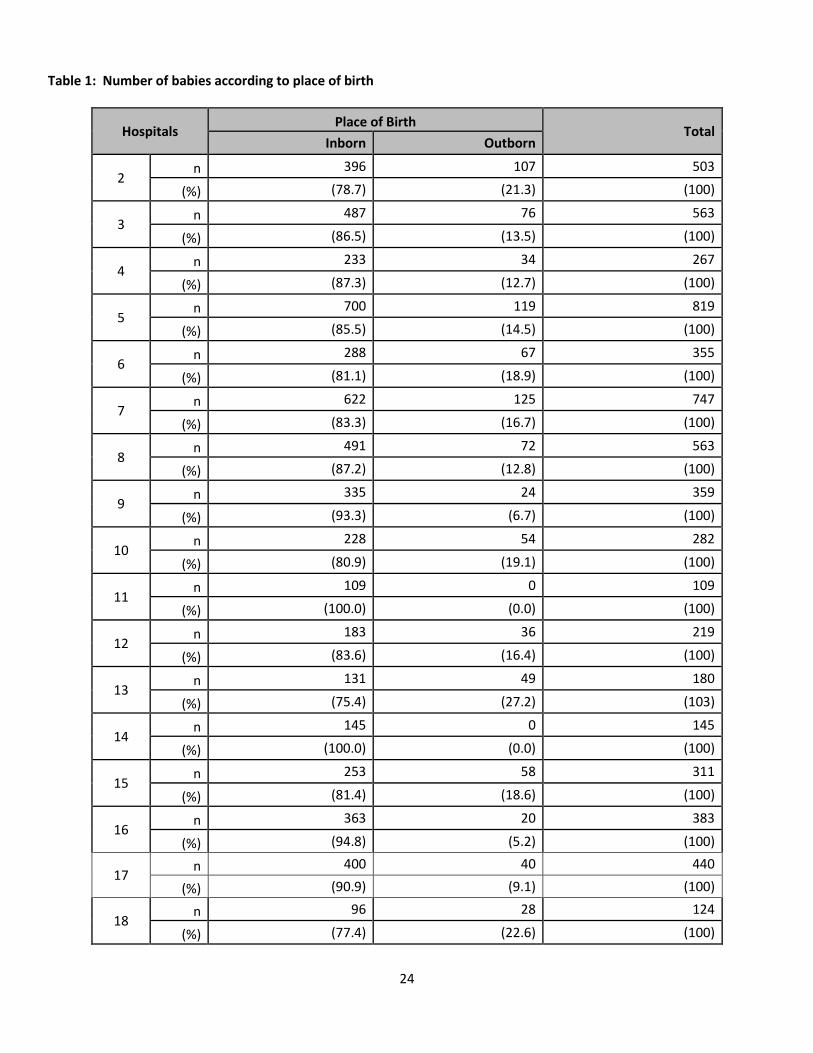
In 2013, there were 38 participating hospitals with a total livebirths of 292695. A total of 12880 babies who were in level III NICUs met the study criteria, 11185 (86.8%) were inborn whilst 1695 (13.2%) were outborn babies (Figure 1 & Table 1).
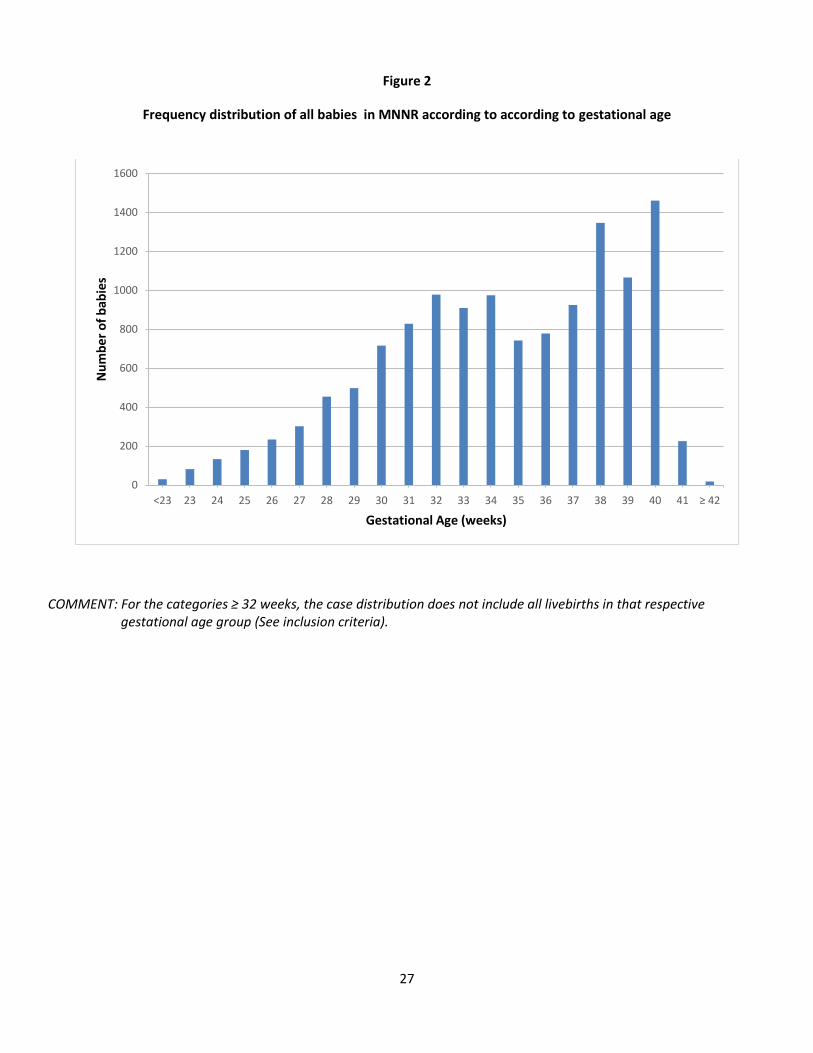
There were 3456 babies (26.8%) below 32 weeks gestational age (Figure 2 and Table 2).
Three thousand eight hundred and fourteen babies (29.6%) were of birth weights of 1500 g and below (Figure 3 and Table 3).
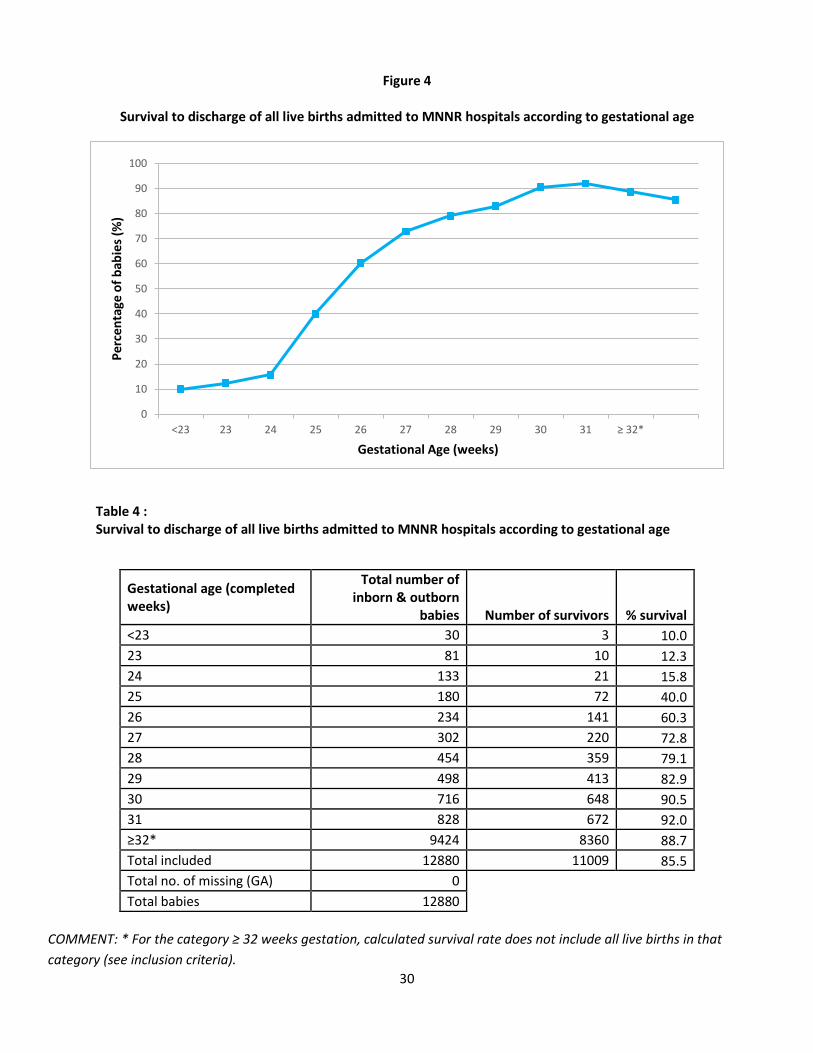
The survival rates of very preterm babies admitted to the MNNR were 15.5% for 24 weeks, 40.0% for 25 weeks, 60.3% for 26 weeks, 72.8% for 27 weeks, 79.1% for 28 weeks, 82.9% for 29 weeks, 90.5% for 30 weeks and 92.0% for 31 weeks (Figure 4 and Table 4).
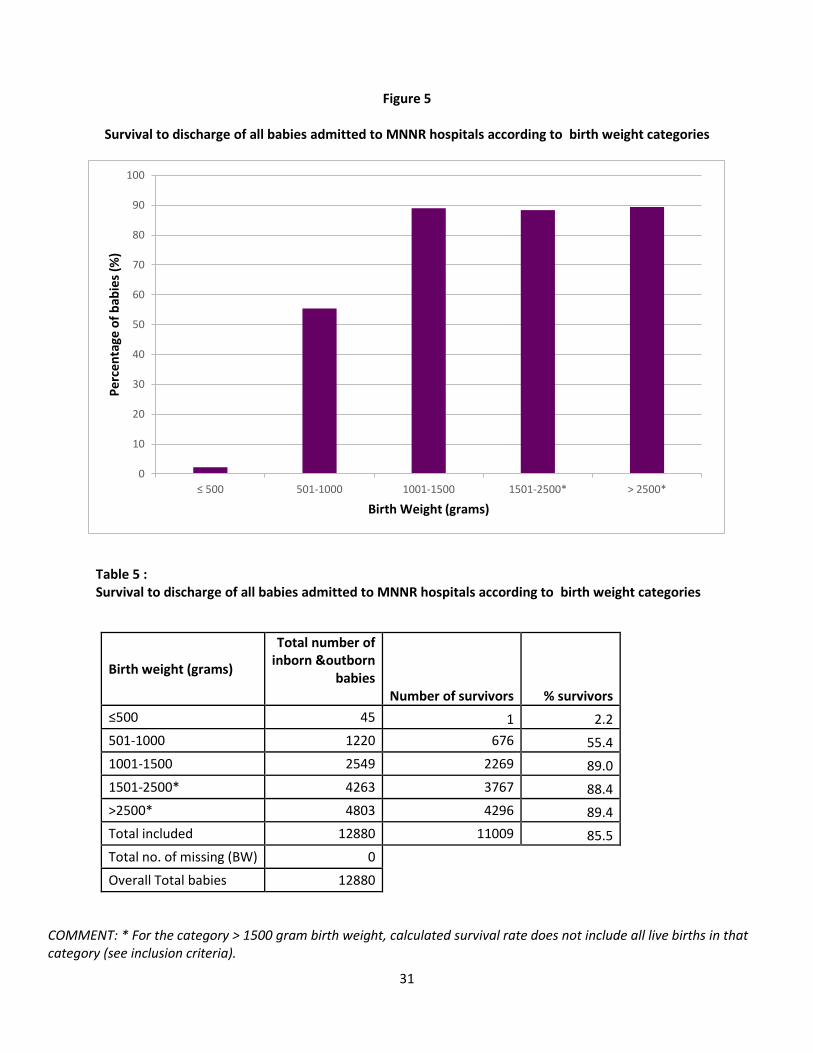
The survival rates of babies with birth weight between 501-1000 g and 1001-1500 g were 55.4% and 89.0%
respectively (Figure 5 and Table 5).
Thirty four centres met the standard (> 85%) for key performance indicator (KPI) for survival rate of inborn babies between 1000-1499 g birth weight with no lethal congenital abnormalities. Data for this indicator was not available for 2 centres.
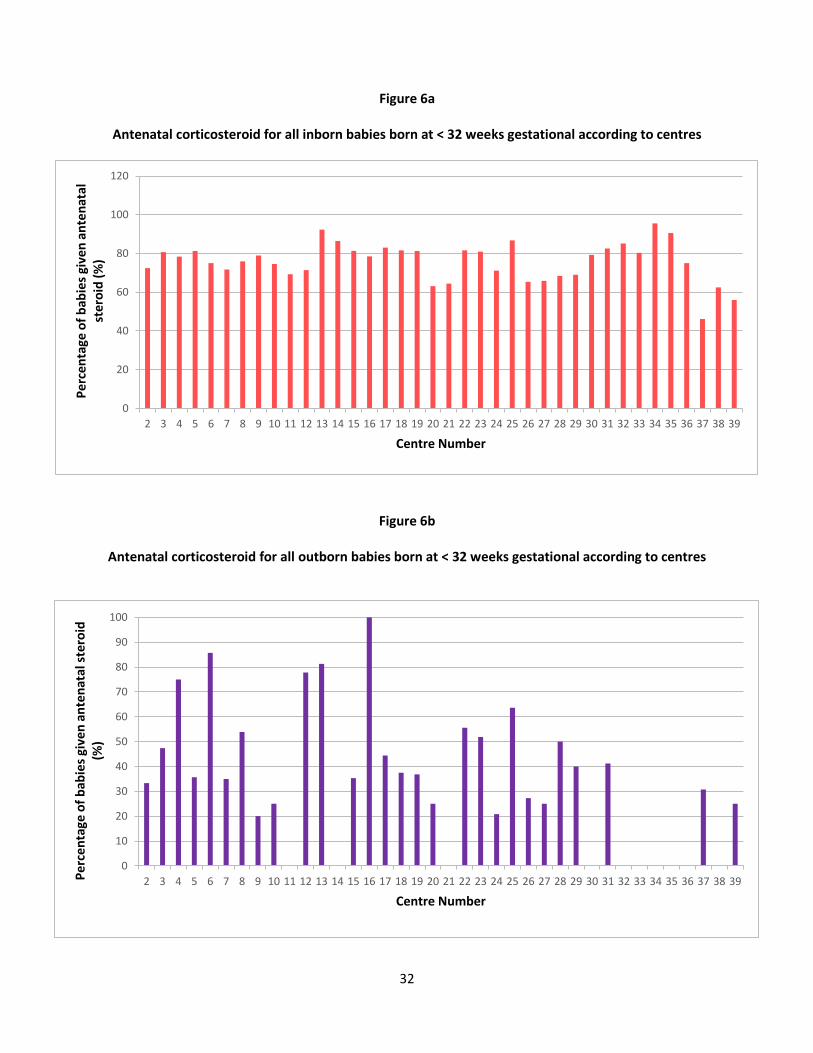
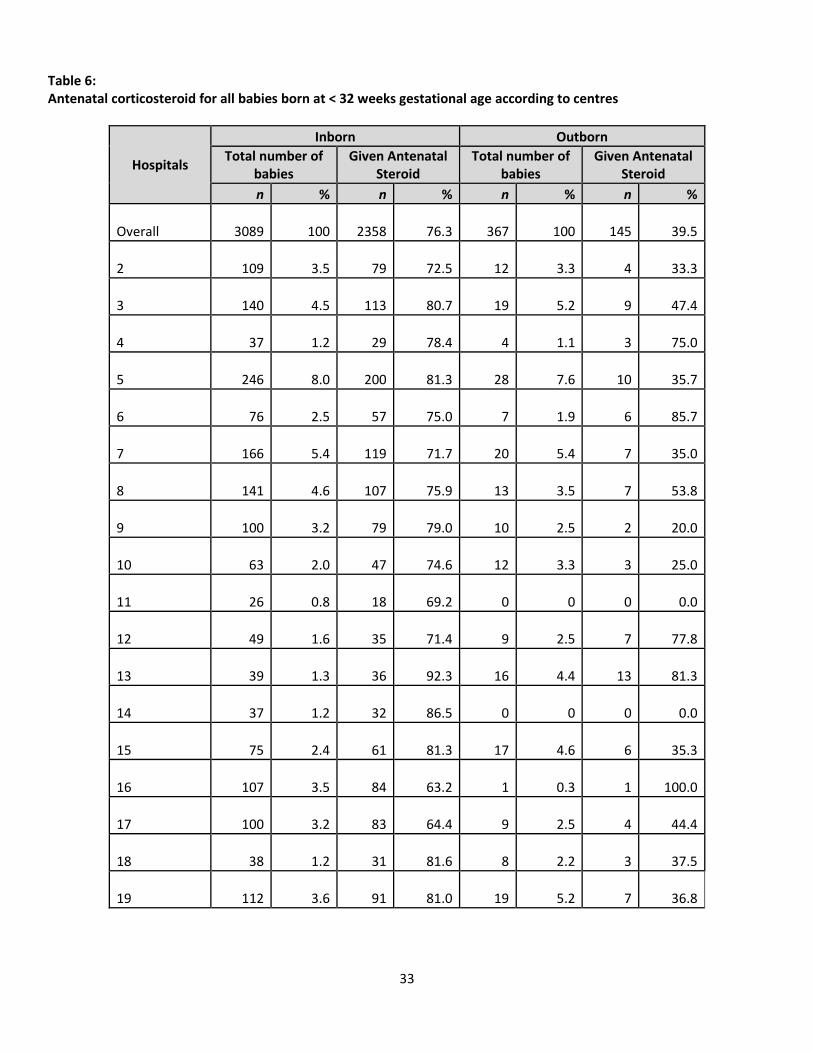
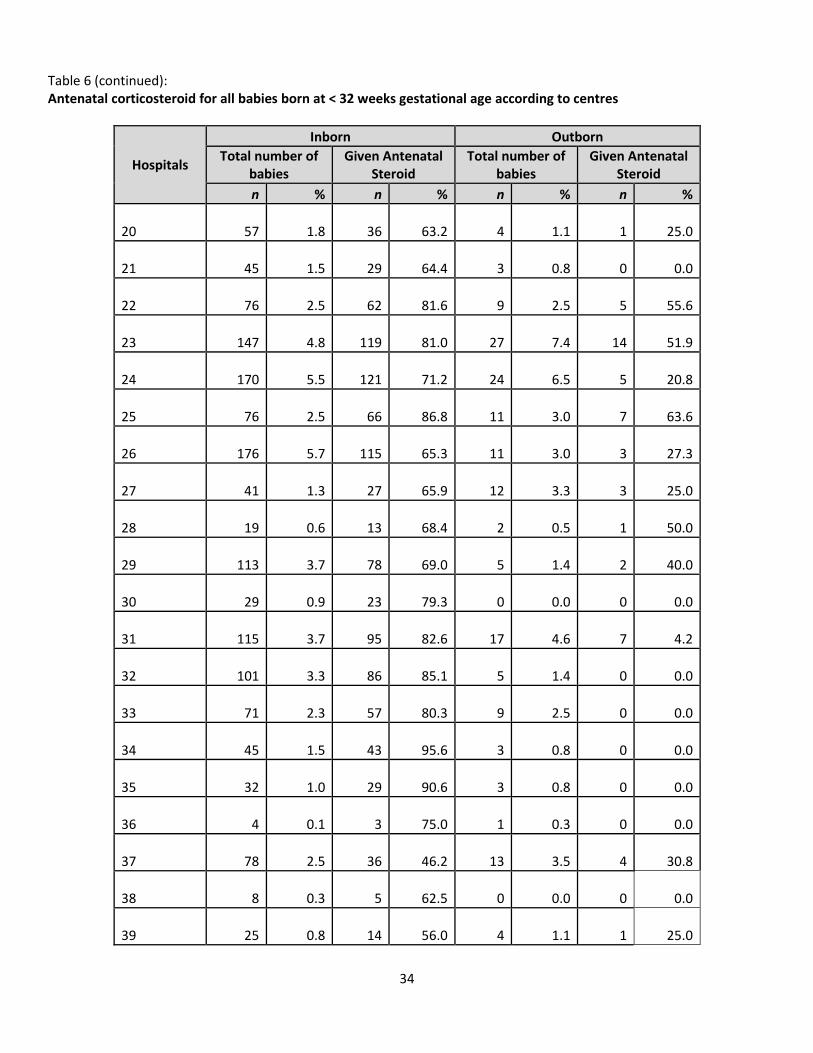
In 2013, 72.4% of mothers who were less than 32 weeks’ gestation received antenatal steroids. It was given to
mothers of 76.3% of inborn babies and 39.5% of outborn babies below 32 weeks’ gestation (Figures 6a, 6b & Table 6). There were marked differences in the use of antenatal steroids across centres for inborns who were less than 32 weeks’ gestation, varying from 46.2% to 95.6% (Figures 6a, Table 6)
Eleven thousand eight hundred and fifty two babies (92.0% of the overall cohort) required respiratory support. Of these, 7845 (66.2%) received invasive ventilation. A total of 8430 babies received nasal continuous positive airway pressure (nCPAP). nCPAP as the only mode of respiratory support was given to 3965 babies.
Eighty six percent (3198/3718) of babies with birth weight of 1500 g and below required respiratory support, 22.6% (841/3718) had nCPAP as the only mode of respiratory support.
Early nCPAP after birth was given to 34.7% of inborn babies <32 weeks gestational age. In the larger inborn preterm babies between 32-36 weeks gestational age, 35.9% were stabilised with early nCPAP after delivery.
Surfactant was given to a total of 3294 babies. Fifty five percent of babies with birth weight of 1500 g and below were treated with surfactant for respiratory distress syndrome. Sixty two percent of preterm babies below 32 weeks gestational age and 24% between 32 and 36 weeks gestational age in the cohort had surfactant therapy.
17
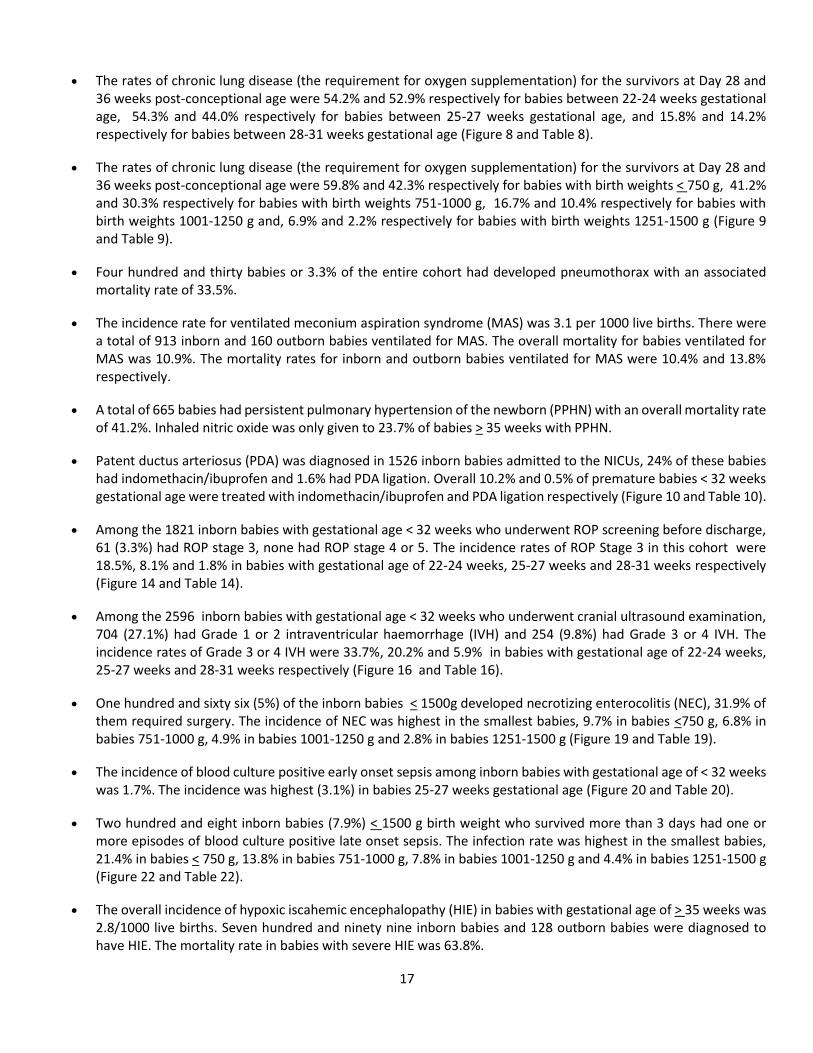
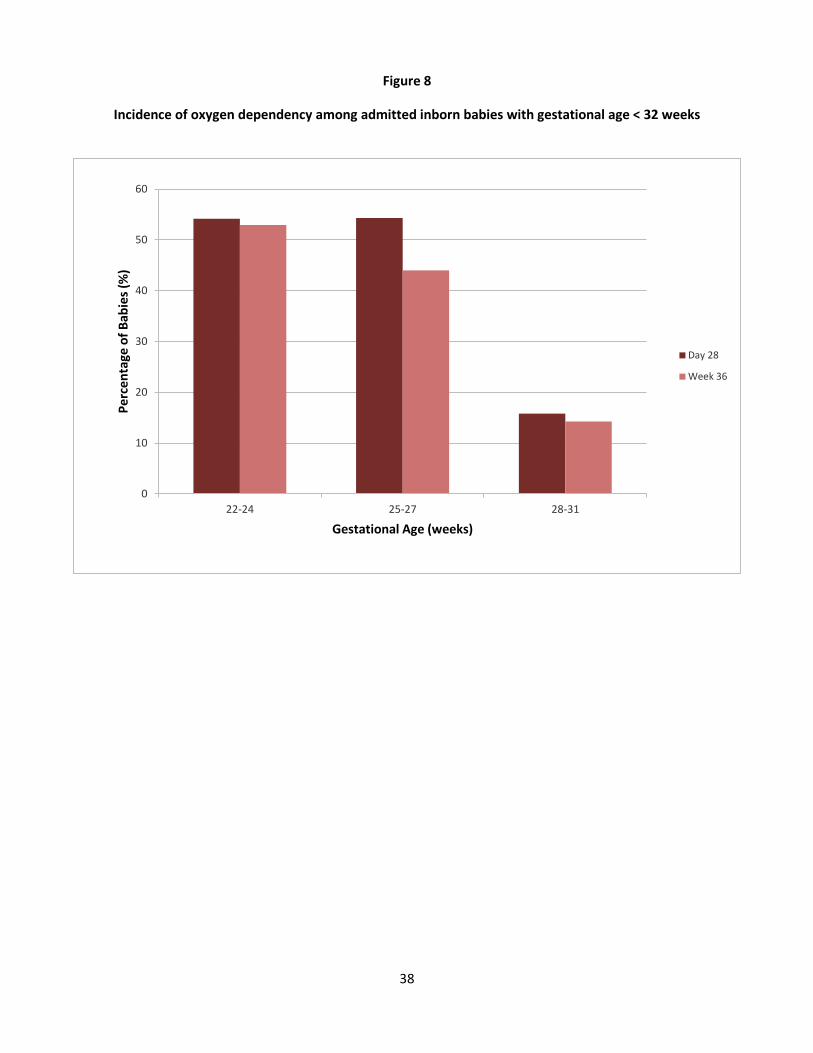
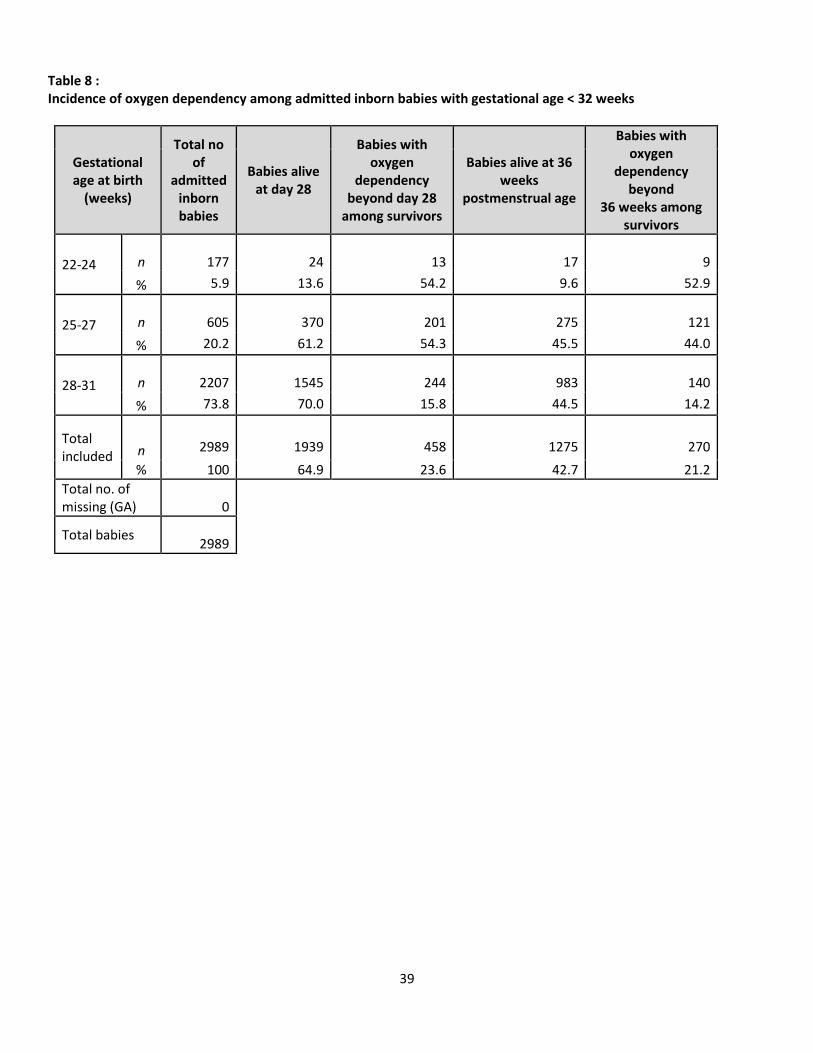
The rates of chronic lung disease (the requirement for oxygen supplementation) for the survivors at Day 28 and 36 weeks post-conceptional age were 54.2% and 52.9% respectively for babies between 22-24 weeks gestational age, 54.3% and 44.0% respectively for babies between 25-27 weeks gestational age, and 15.8% and 14.2% respectively for babies between 28-31 weeks gestational age (Figure 8 and Table 8).
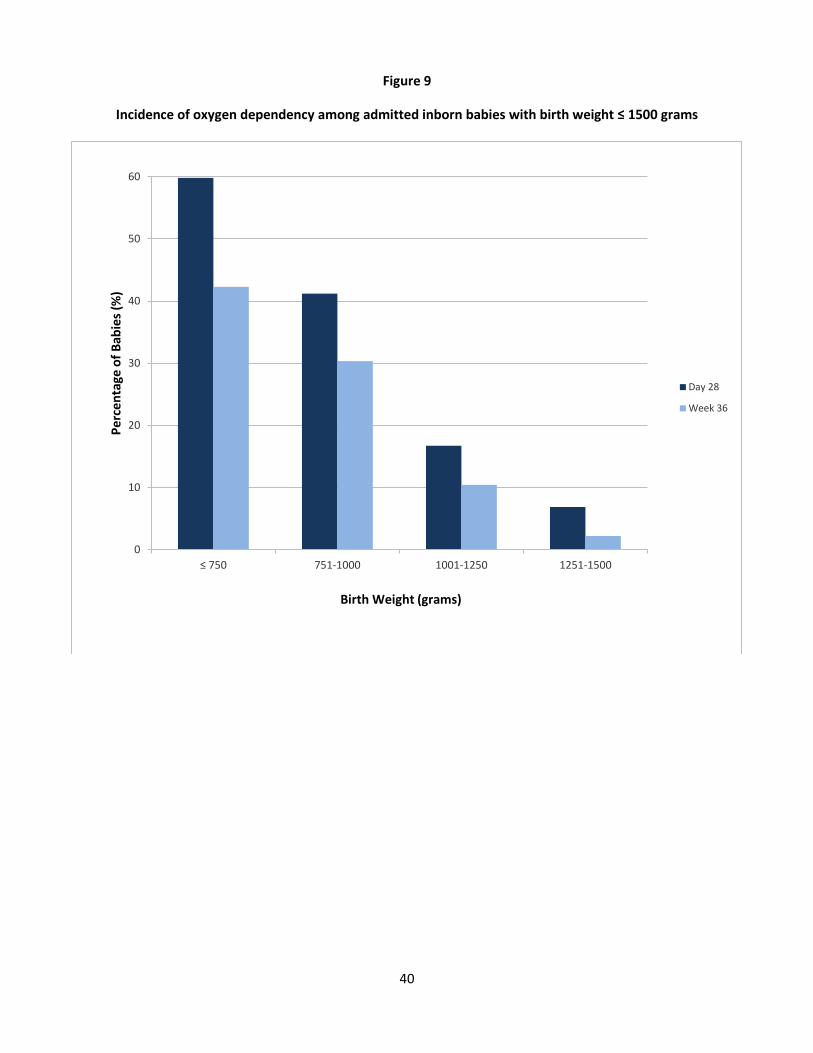
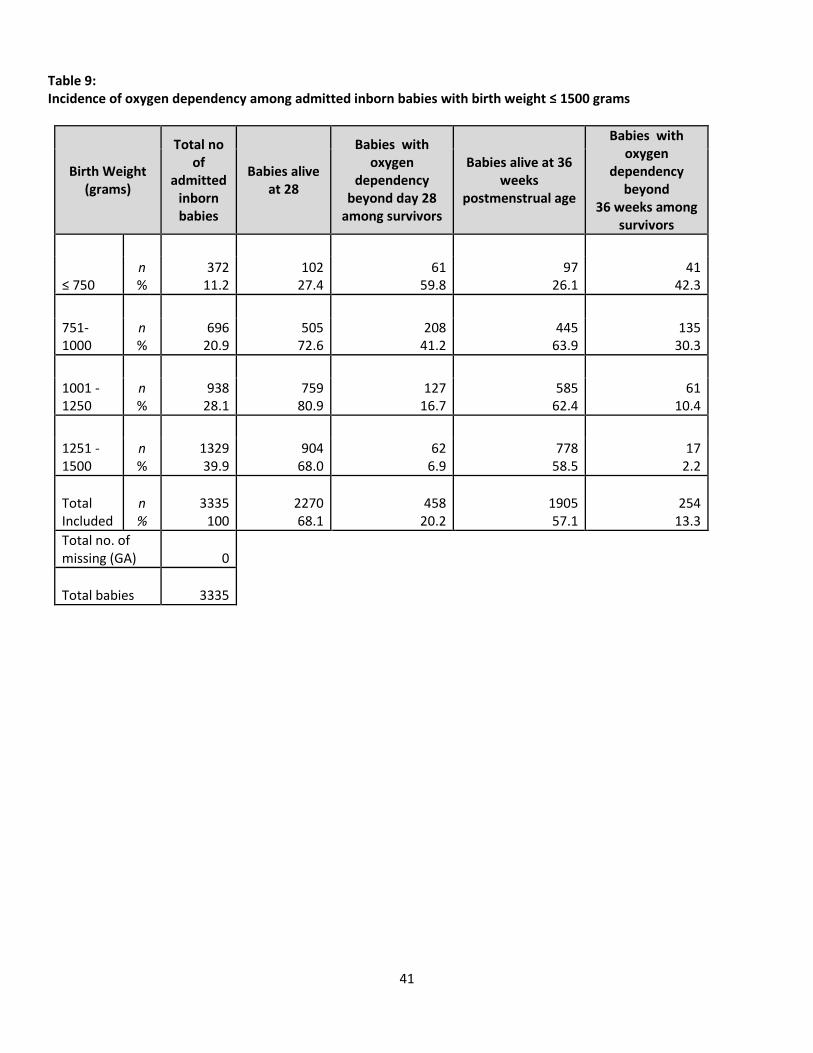
The rates of chronic lung disease (the requirement for oxygen supplementation) for the survivors at Day 28 and 36 weeks post-conceptional age were 59.8% and 42.3% respectively for babies with birth weights < 750 g, 41.2% and 30.3% respectively for babies with birth weights 751-1000 g, 16.7% and 10.4% respectively for babies with birth weights 1001-1250 g and, 6.9% and 2.2% respectively for babies with birth weights 1251-1500 g (Figure 9 and Table 9).
Four hundred and thirty babies or 3.3% of the entire cohort had developed pneumothorax with an associated mortality rate of 33.5%.
The incidence rate for ventilated meconium aspiration syndrome (MAS) was 3.1 per 1000 live births. There were a total of 913 inborn and 160 outborn babies ventilated for MAS. The overall mortality for babies ventilated for MAS was 10.9%. The mortality rates for inborn and outborn babies ventilated for MAS were 10.4% and 13.8% respectively.
A total of 665 babies had persistent pulmonary hypertension of the newborn (PPHN) with an overall mortality rate of 41.2%. Inhaled nitric oxide was only given to 23.7% of babies > 35 weeks with PPHN.
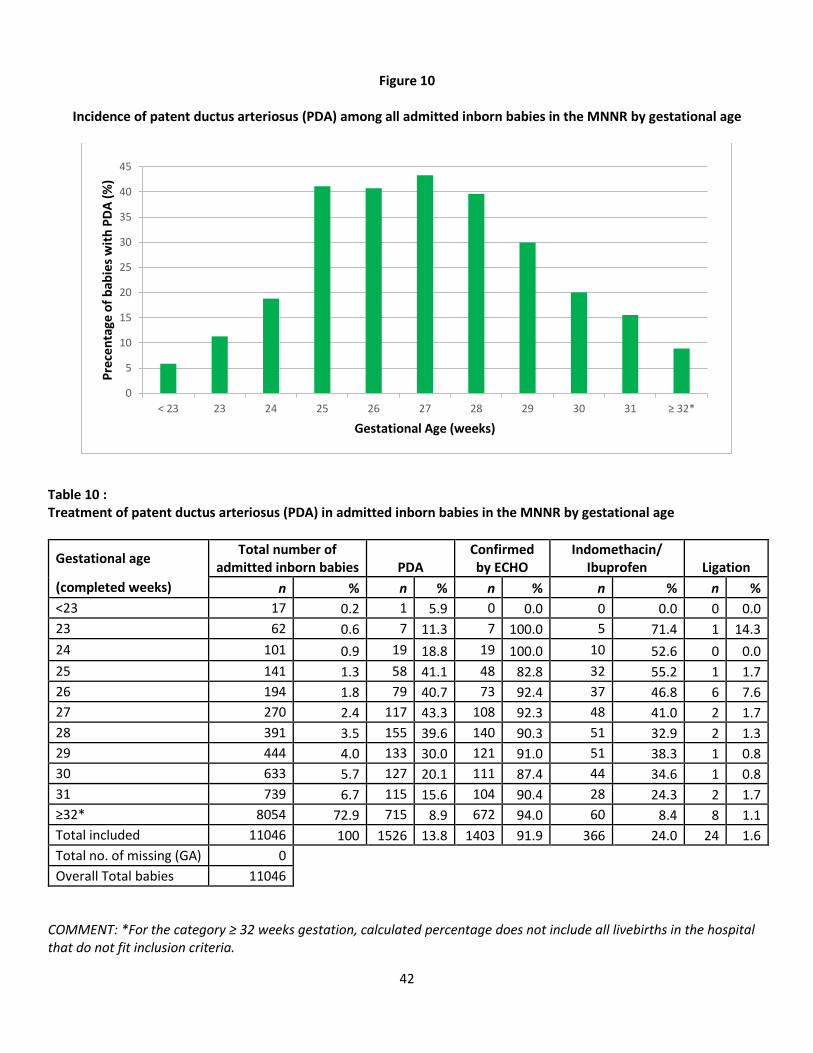
Patent ductus arteriosus (PDA) was diagnosed in 1526 inborn babies admitted to the NICUs, 24% of these babies had indomethacin/ibuprofen and 1.6% had PDA ligation. Overall 10.2% and 0.5% of premature babies < 32 weeks gestational age were treated with indomethacin/ibuprofen and PDA ligation respectively (Figure 10 and Table 10).
Among the 1821 inborn babies with gestational age < 32 weeks who underwent ROP screening before discharge, 61 (3.3%) had ROP stage 3, none had ROP stage 4 or 5. The incidence rates of ROP Stage 3 in this cohort were 18.5%, 8.1% and 1.8% in babies with gestational age of 22-24 weeks, 25-27 weeks and 28-31 weeks respectively (Figure 14 and Table 14).
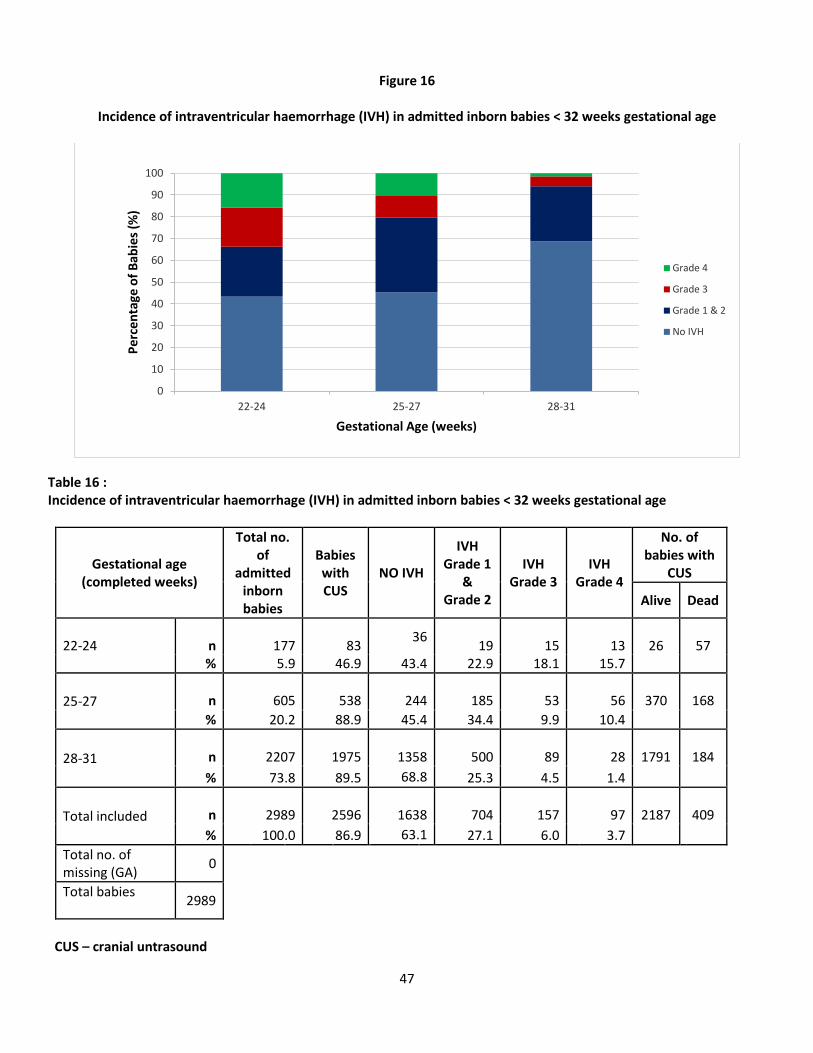
Among the 2596 inborn babies with gestational age < 32 weeks who underwent cranial ultrasound examination, 704 (27.1%) had Grade 1 or 2 intraventricular haemorrhage (IVH) and 254 (9.8%) had Grade 3 or 4 IVH. The incidence rates of Grade 3 or 4 IVH were 33.7%, 20.2% and 5.9% in babies with gestational age of 22-24 weeks, 25-27 weeks and 28-31 weeks respectively (Figure 16 and Table 16).
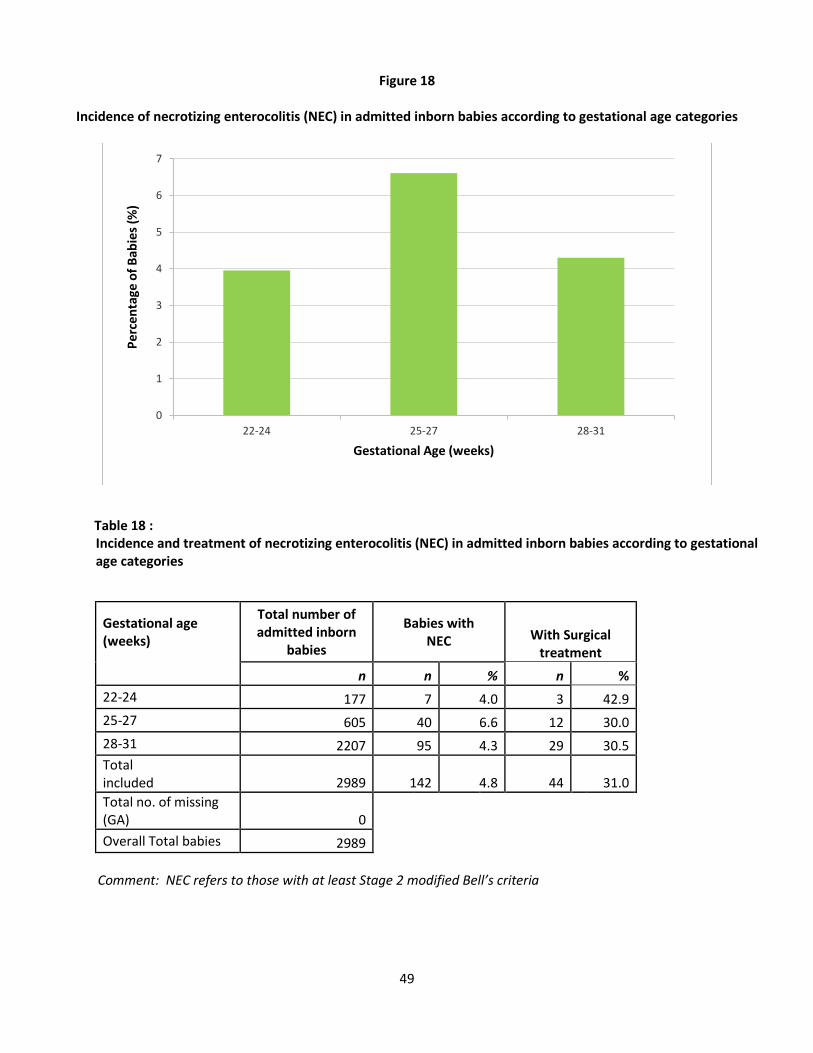
One hundred and sixty six (5%) of the inborn babies < 1500g developed necrotizing enterocolitis (NEC), 31.9% of them required surgery. The incidence of NEC was highest in the smallest babies, 9.7% in babies <750 g, 6.8% in babies 751-1000 g, 4.9% in babies 1001-1250 g and 2.8% in babies 1251-1500 g (Figure 19 and Table 19).
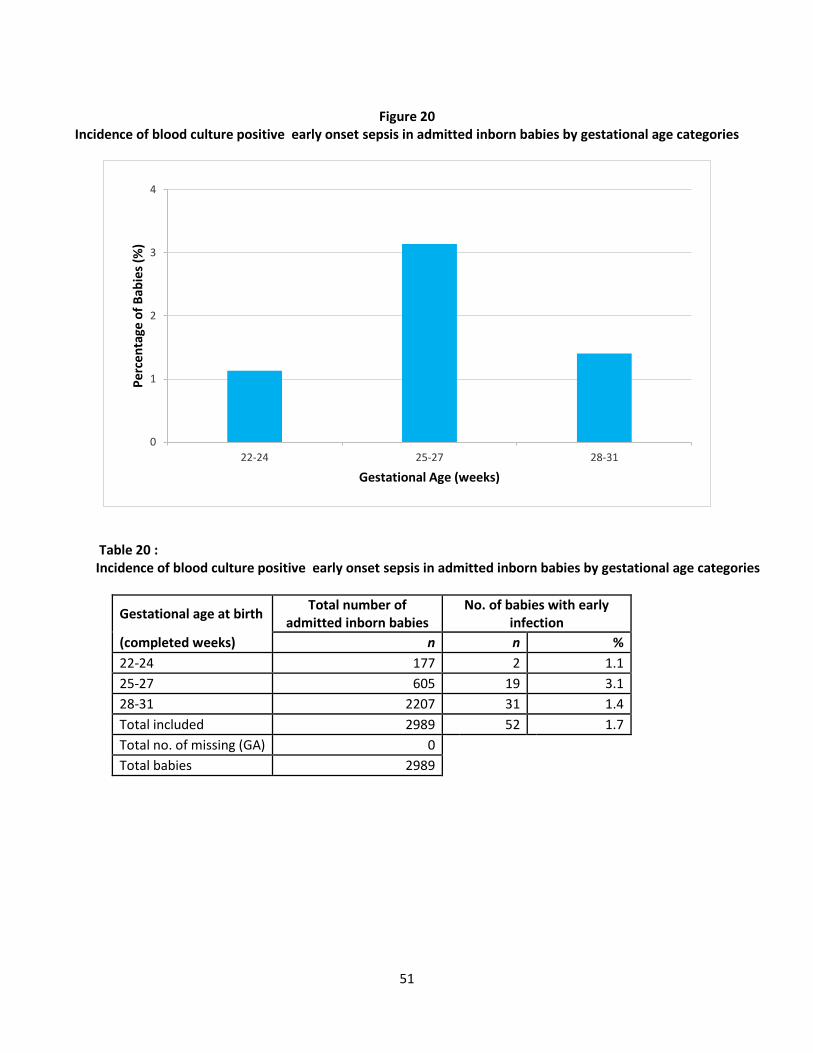
The incidence of blood culture positive early onset sepsis among inborn babies with gestational age of < 32 weeks was 1.7%. The incidence was highest (3.1%) in babies 25-27 weeks gestational age (Figure 20 and Table 20).
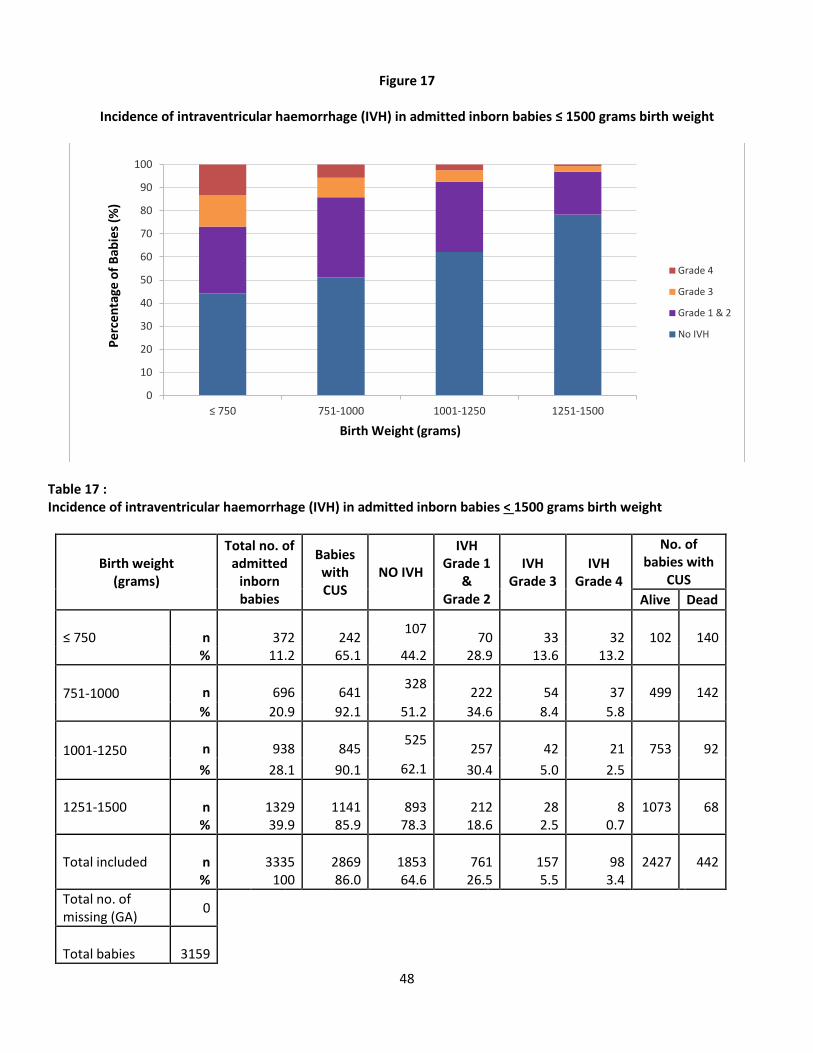
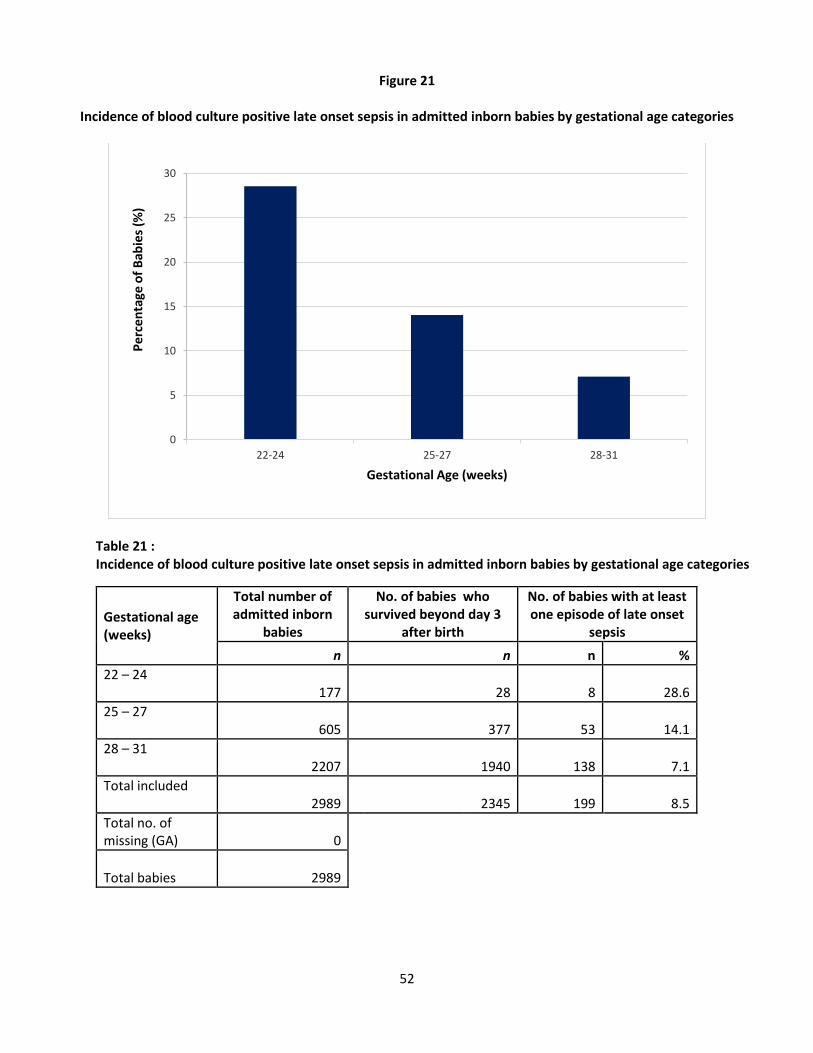
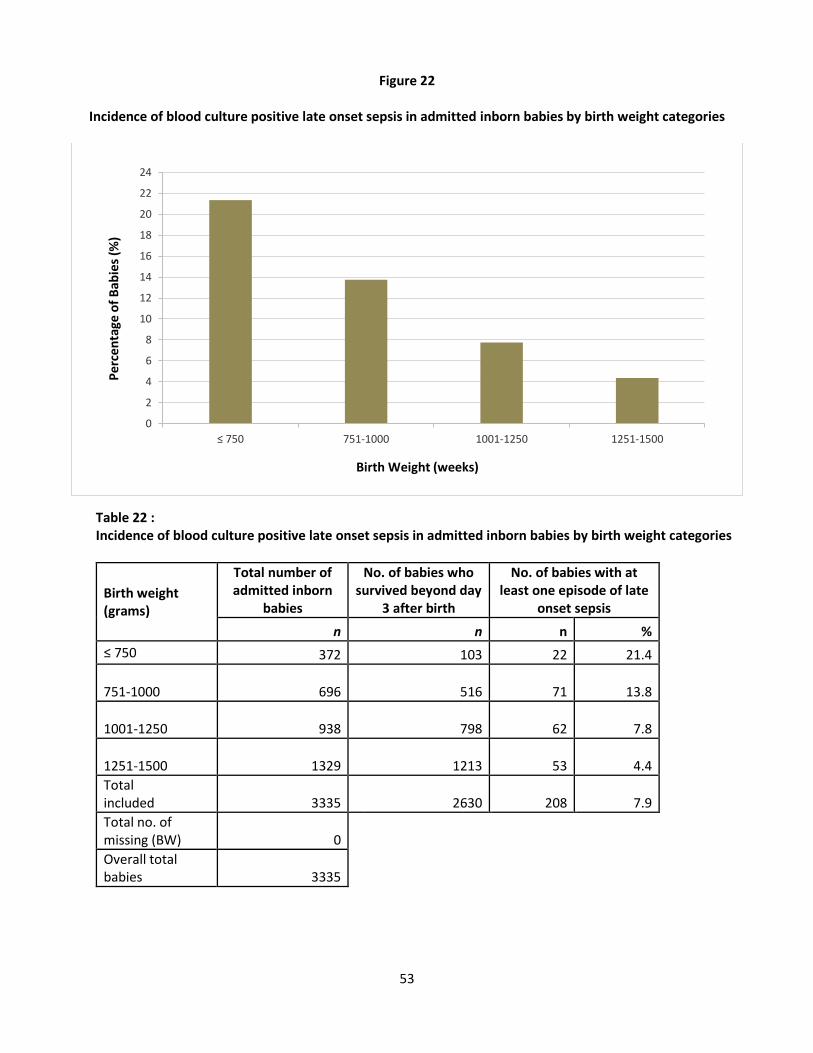
Two hundred and eight inborn babies (7.9%) < 1500 g birth weight who survived more than 3 days had one or more episodes of blood culture positive late onset sepsis. The infection rate was highest in the smallest babies, 21.4% in babies < 750 g, 13.8% in babies 751-1000 g, 7.8% in babies 1001-1250 g and 4.4% in babies 1251-1500 g (Figure 22 and Table 22).
The overall incidence of hypoxic iscahemic encephalopathy (HIE) in babies with gestational age of > 35 weeks was 2.8/1000 live births. Seven hundred and ninety nine inborn babies and 128 outborn babies were diagnosed to have HIE. The mortality rate in babies with severe HIE was 63.8%.

18
10.2% (1323/12880) of babies in the total cohort had major congenital anomalies. The mortality rate for babies > 35 weeks with major congenital anomalies was 44.6%.
Study recommendations include collaboration with Obstetrics and Primary Healthcare staff:
To enhance the use of antenatal steroids and continue with in-utero transfer of high-risk pregnancies. To reduce the number of post term deliveries and to reduce the risk of thick meconium stained liquor. To review preventable causes of HIE. To enhance antenatal detection of congenital abnormalities and to provide counselling to parents.
And in the NICUs:
To continue to promote the use of nasal continuous positive airway pressure as early as possible after birth to reduce the need for mechanical ventilation for the spontaneously breathing preterm babies.
To reduce the risk of pneumothorax. To enhance infection control in the NICUs. To increase availability of nitric oxide in state hospitals to reduce mortality from PPHN. To increase ROP screening before or soon after discharge
19
Report of the Malaysian National Neonatal Registry (MNNR) 2013
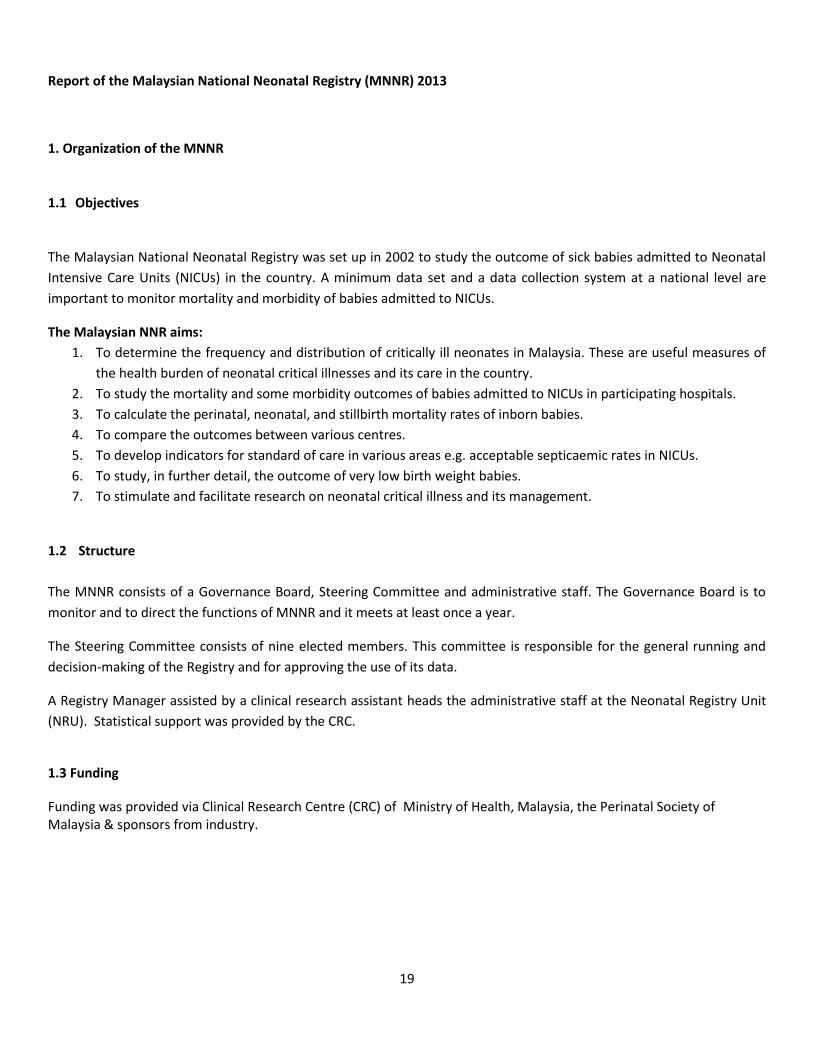
1. Organization of the MNNR
1.1 Objectives
The Malaysian National Neonatal Registry was set up in 2002 to study the outcome of sick babies admitted to Neonatal
Intensive Care Units (NICUs) in the country. A minimum data set and a data collection system at a national level are
important to monitor mortality and morbidity of babies admitted to NICUs.
The Malaysian NNR aims:
1. To determine the frequency and distribution of critically ill neonates in Malaysia. These are useful measures of
the health burden of neonatal critical illnesses and its care in the country.
2. To study the mortality and some morbidity outcomes of babies admitted to NICUs in participating hospitals.
3. To calculate the perinatal, neonatal, and stillbirth mortality rates of inborn babies.
4. To compare the outcomes between various centres.
5. To develop indicators for standard of care in various areas e.g. acceptable septicaemic rates in NICUs.
6. To study, in further detail, the outcome of very low birth weight babies.
7. To stimulate and facilitate research on neonatal critical illness and its management.
1.2 Structure
The MNNR consists of a Governance Board, Steering Committee and administrative staff. The Governance Board is to
monitor and to direct the functions of MNNR and it meets at least once a year.
The Steering Committee consists of nine elected members. This committee is responsible for the general running and
decision-making of the Registry and for approving the use of its data.
A Registry Manager assisted by a clinical research assistant heads the administrative staff at the Neonatal Registry Unit
(NRU). Statistical support was provided by the CRC.
1.3 Funding
Funding was provided via Clinical Research Centre (CRC) of Ministry of Health, Malaysia, the Perinatal Society of Malaysia & sponsors from industry.

20
2. Data Set 2.1 Participating Centres in 2013:
39. Hospital Ampang
40. Hospital Batu Pahat, Johor
41. Hospital Bintulu, Sarawak
42. Hospital Raja Permaisuri Bainun, Ipoh, Perak
43. Hospital Kajang, Selangor
44. Hospital Keningau, Sabah
45. Hospital Kluang, Johor
46. Hospital Kuala Lumpur
47. Hospital Kulim, Kedah
48. Hospital Likas, Kota Kinabalu, Sabah
49. Hospital Melaka, Melaka
50. Hospital Umum Miri, Sarawak
51. Hospital Pulau Pinang, Pulau Pinang
52. Hospital Putrajaya
53. Hospital Raja Perempuan Zainab II, Kota Bharu, Kelantan
54. Hospital Umum Sarawak, Kuching, Sarawak
55. Hospital Sandakan, Sabah
56. Hospital Seberang Jaya, Pulau Pinang
57. Hospital Segamat, Johor
58. Hospital Selayang, Selangor
59. Hospital Serdang, Selangor
60. Hospital Seri Manjung, Perak
61. Hospital Sibu, Sarawak
62. Hospital Sultan Abdul Halim, Sg. Petani, Kedah
63. Hospital Sultan Haji Ahmad Shah, Temerloh, Pahang
64. Hospital Sultanah Aminah, Johor Bharu, Johor
65. Hospital Sultanah Bahiyah, Alor Setar, Kedah
66. Hospital Pakar Sultanah Fatimah, Muar, Johor
67. Hospital Sultanah Nur Zahirah, Kuala Terengganu, Terengganu
68. Hospital Sungai Buloh, Selangor
69. Hospital Taiping, Perak
70. Hospital Teluk Intan, Perak
71. Hospital Tengku Ampuan Afzan, Kuantan, Pahang
72. Hospital Tengku Ampuan Rahimah, Klang, Selangor
73. Hospital Tuanku Ampuan Najihah, Kuala Pilah, Negeri Sembilan
74. Hospital Tuanku Fauziah, Kangar, Perlis
75. Hospital Tuanku Ja’afar, Seremban, Negeri Sembilan
76. Hospital Universiti Sains Malaysia, Kubang Kerian, Kelantan
Centre numbers allocated to centers were different from the numbers above.
21
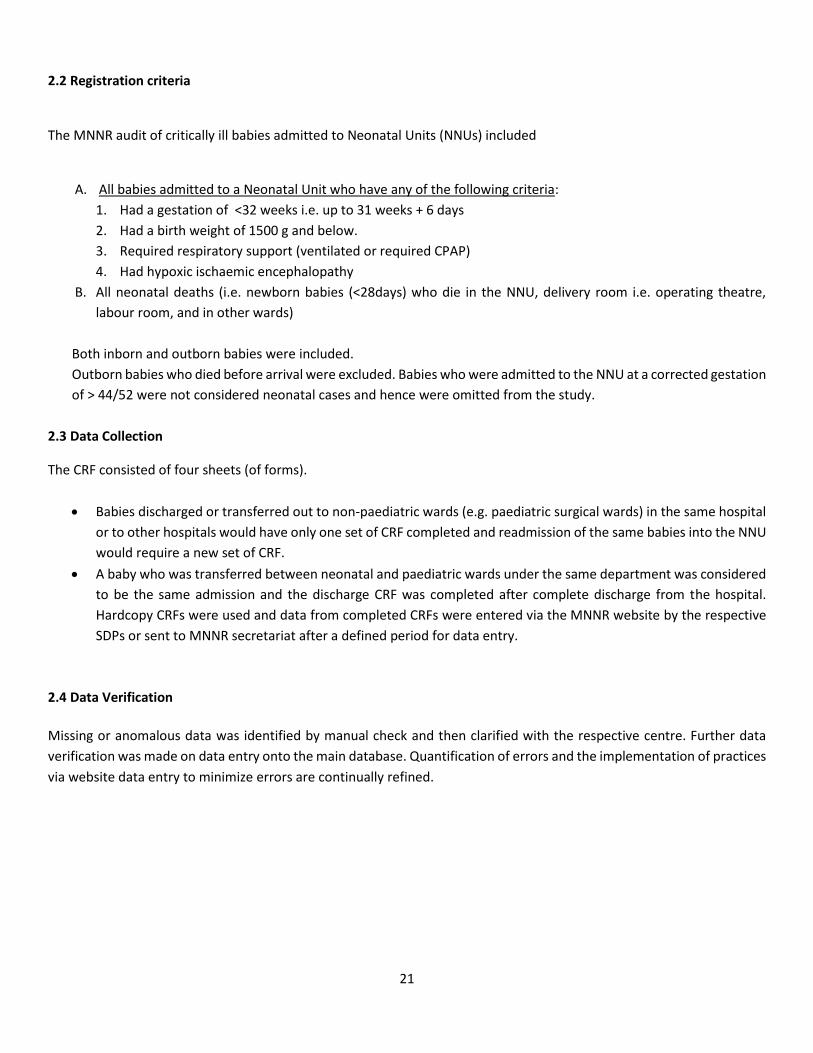
2.2 Registration criteria
The MNNR audit of critically ill babies admitted to Neonatal Units (NNUs) included
A. All babies admitted to a Neonatal Unit who have any of the following criteria:
1. Had a gestation of <32 weeks i.e. up to 31 weeks + 6 days
2. Had a birth weight of 1500 g and below.
3. Required respiratory support (ventilated or required CPAP)
4. Had hypoxic ischaemic encephalopathy
B. All neonatal deaths (i.e. newborn babies (<28days) who die in the NNU, delivery room i.e. operating theatre,
labour room, and in other wards)
Both inborn and outborn babies were included.
Outborn babies who died before arrival were excluded. Babies who were admitted to the NNU at a corrected gestation
of > 44/52 were not considered neonatal cases and hence were omitted from the study.
2.3 Data Collection
The CRF consisted of four sheets (of forms).
Babies discharged or transferred out to non-paediatric wards (e.g. paediatric surgical wards) in the same hospital
or to other hospitals would have only one set of CRF completed and readmission of the same babies into the NNU
would require a new set of CRF.
A baby who was transferred between neonatal and paediatric wards under the same department was considered
to be the same admission and the discharge CRF was completed after complete discharge from the hospital.
Hardcopy CRFs were used and data from completed CRFs were entered via the MNNR website by the respective
SDPs or sent to MNNR secretariat after a defined period for data entry.
2.4 Data Verification
Missing or anomalous data was identified by manual check and then clarified with the respective centre. Further data
verification was made on data entry onto the main database. Quantification of errors and the implementation of practices
via website data entry to minimize errors are continually refined.

22
RESULTS
23
Figure 1
Number of babies according to place of birth
COMMENT: There were 11185 inborn babies and 1695 outborn babies in the MNNR.
0
200
400
600
800
1000
1200
2 3 4 5 6 7 8 9 10 11 12 13 14 15 16 17 18 19 20 21 22 23 24 25 26 27 28 29 30 31 32 33 34 35 36 37 38 39
Nu
mb
er o
f b
abie
s
Centre NumberInborn Outborn
24
Table 1: Number of babies according to place of birth
Hospitals Place of Birth
Total Inborn Outborn
2 n 396 107 503
(%) (78.7) (21.3) (100)
3 n 487 76 563
(%) (86.5) (13.5) (100)
4 n 233 34 267
(%) (87.3) (12.7) (100)
5 n 700 119 819
(%) (85.5) (14.5) (100)
6 n 288 67 355
(%) (81.1) (18.9) (100)
7 n 622 125 747
(%) (83.3) (16.7) (100)
8 n 491 72 563
(%) (87.2) (12.8) (100)
9 n 335 24 359
(%) (93.3) (6.7) (100)
10 n 228 54 282
(%) (80.9) (19.1) (100)
11 n 109 0 109
(%) (100.0) (0.0) (100)
12 n 183 36 219
(%) (83.6) (16.4) (100)
13 n 131 49 180
(%) (75.4) (27.2) (103)
14 n 145 0 145
(%) (100.0) (0.0) (100)
15 n 253 58 311
(%) (81.4) (18.6) (100)
16 n 363 20 383
(%) (94.8) (5.2) (100)
17 n 400 40 440
(%) (90.9) (9.1) (100)
18 n 96 28 124
(%) (77.4) (22.6) (100)

25
Table 1: Number of babies according to place of birth (continued)
Hospitals Place of Birth
Total Inborn Outborn
19 n 346 103 449
(%) (77.1) (22.9) (100)
20 n 181 19 200
(%) (90.5) (9.5) (100)
21 n 180 8 188
(%) (95.7) (4.3) (100)
22 n 437 46 483
(%) (90.5) (9.5) (100)
23 n 621 163 784
(%) (79.2) (20.8) (100)
24 n 431 68 499
(%) (86.4) (13.6) (100)
25 n 239 58 297
(%) (80.5) (19.5) (100)
26 n 532 63 595
(%) (89.4) (10.6) (100)
27 n 163 27 190
(%) (85.8) (14.2) (100)
28 n 58 4 62
(%) (93.5) (6.5) (100)
29 n 359 19 378
(%) (95.0) (5.0) (100)
30 n 209 5 214
(%) (97.7) (2.3) (100)
31 n 328 45 373
(%) (87.9) (12.1) (100)
32 n 422 19 441
(%) (95.7) (4.3) (100)
33 n 571 33 604
(%) (94.5) (5.5) (100)
34 n 170 16 186
(%) (91.4) (8.6) (100)
35 n 98 7 105
(%) (93.3) (6.7) (100)
26
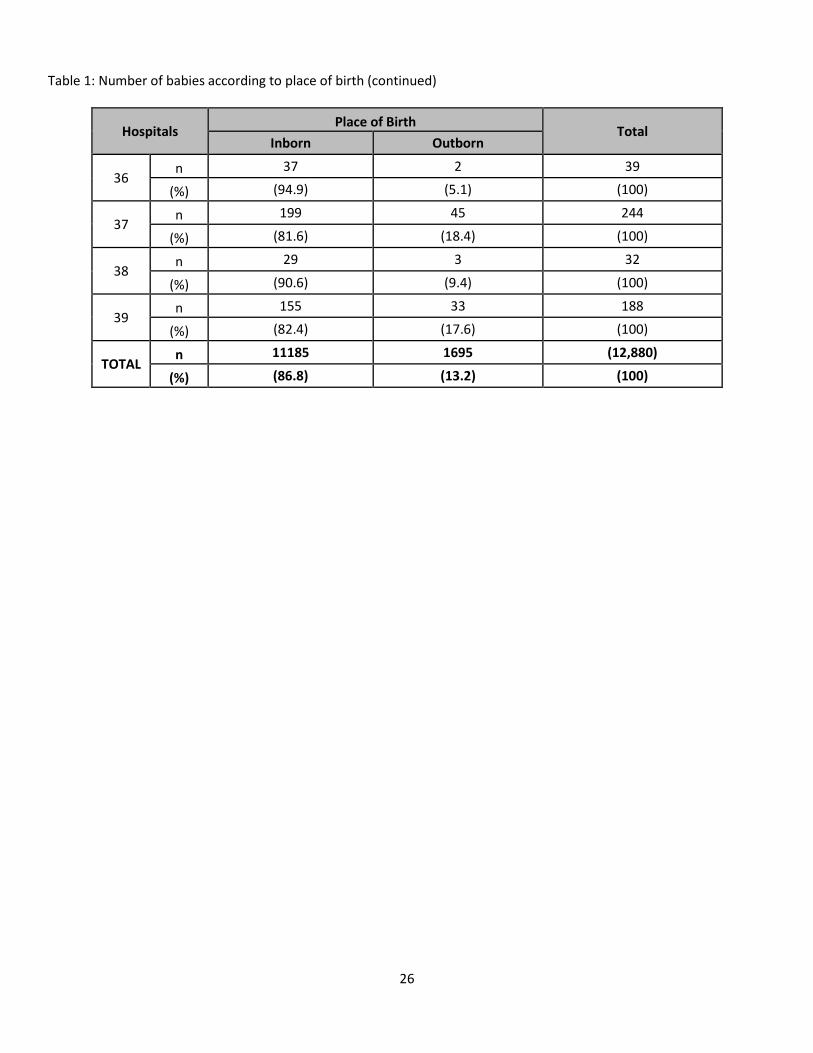
Table 1: Number of babies according to place of birth (continued)
Hospitals Place of Birth
Total Inborn Outborn
36 n 37 2 39
(%) (94.9) (5.1) (100)
37 n 199 45 244
(%) (81.6) (18.4) (100)
38 n 29 3 32
(%) (90.6) (9.4) (100)
39 n 155 33 188
(%) (82.4) (17.6) (100)
TOTAL n 11185 1695 (12,880)
(%) (86.8) (13.2) (100)
27
Figure 2
Frequency distribution of all babies in MNNR according to according to gestational age
COMMENT: For the categories ≥ 32 weeks, the case distribution does not include all livebirths in that respective gestational age group (See inclusion criteria).
0
200
400
600
800
1000
1200
1400
1600
<23 23 24 25 26 27 28 29 30 31 32 33 34 35 36 37 38 39 40 41 ≥ 42
Nu
mb
er o
f b
abie
s
Gestational Age (weeks)

28
Table 2 : Frequency distribution of all babies in MNNR according to gestational age
Gestational age in completed weeks at birth Frequency Percent
< 23 30 0.2
23 81 0.6
24 133 1.0
25 180 1.4
26 234 1.8
27 302 2.3
28 454 3.5
29 498 3.9
30 716 5.6
31 828 6.4
32 978 7.6
33 909 7.1
34 975 7.6
35 742 5.8
36 778 6.0
37 925 7.2
38 1346 10.5
39 1066 8.3
40 1461 11.3
41 226 1.8
≥ 42 18 0.1
Total included 12880 100
Total no. of babies with missing gestational age 0
Total no. of babies 12880

29
Figure 3
Frequency distribution of all babies in MNNR according to birth weight categories
Table 3 : Frequency distribution of all babies in MNNR according to birth weight (BW) categories
Birth weight (grams) Frequency Percent from total number of babies
≤ 500 45 0.3
501-1000 1220 9.5
1001-1500 2549 19.8
1501-2500* 4263 33.1
< 2500 4803 37.3
Total included 12880 100.0
Total no. of babies with missing birth weight
0
Total no.of babies 12880
0
5
10
15
20
25
30
35
40
≤ 500 501-1000 1001-1500 1501-2500* > 2500*
Pe
rce
nta
ge o
f b
abie
s (%
)
Birth weight (grams)
30
Figure 4
Survival to discharge of all live births admitted to MNNR hospitals according to gestational age
Table 4 : Survival to discharge of all live births admitted to MNNR hospitals according to gestational age
Gestational age (completed weeks)
Total number of inborn & outborn
babies Number of survivors % survival
<23 30 3 10.0
23 81 10 12.3
24 133 21 15.8
25 180 72 40.0
26 234 141 60.3
27 302 220 72.8
28 454 359 79.1
29 498 413 82.9
30 716 648 90.5
31 828 672 92.0
≥32* 9424 8360 88.7
Total included 12880 11009 85.5
Total no. of missing (GA) 0
Total babies 12880
COMMENT: * For the category ≥ 32 weeks gestation, calculated survival rate does not include all live births in that
category (see inclusion criteria).
0
10
20
30
40
50
60
70
80
90
100
<23 23 24 25 26 27 28 29 30 31 ≥ 32*
Pe
rce
nta
ge o
f b
abie
s (%
)
Gestational Age (weeks)
31
Figure 5
Survival to discharge of all babies admitted to MNNR hospitals according to birth weight categories
Table 5 : Survival to discharge of all babies admitted to MNNR hospitals according to birth weight categories
Birth weight (grams)
Total number of inborn &outborn
babies Number of survivors % survivors
≤500 45 1 2.2
501-1000 1220 676 55.4
1001-1500 2549 2269 89.0
1501-2500* 4263 3767 88.4
>2500* 4803 4296 89.4
Total included 12880 11009 85.5
Total no. of missing (BW) 0 Overall Total babies 12880
COMMENT: * For the category > 1500 gram birth weight, calculated survival rate does not include all live births in that category (see inclusion criteria).
0
10
20
30
40
50
60
70
80
90
100
≤ 500 501-1000 1001-1500 1501-2500* > 2500*
Pe
rce
nta
ge o
f b
abie
s (%
)
Birth Weight (grams)
32
Figure 6a
Antenatal corticosteroid for all inborn babies born at < 32 weeks gestational according to centres
Figure 6b
Antenatal corticosteroid for all outborn babies born at < 32 weeks gestational according to centres
0
20
40
60
80
100
120
2 3 4 5 6 7 8 9 10 11 12 13 14 15 16 17 18 19 20 21 22 23 24 25 26 27 28 29 30 31 32 33 34 35 36 37 38 39
Pe
rce
nta
ge o
f b
abie
s gi
ven
an
ten
atal
st
ero
id (
%)
Centre Number
0
10
20
30
40
50
60
70
80
90
100
2 3 4 5 6 7 8 9 10 11 12 13 14 15 16 17 18 19 20 21 22 23 24 25 26 27 28 29 30 31 32 33 34 35 36 37 38 39Pe
rce
nta
ge o
f b
abie
s gi
ven
an
ten
atal
ste
roid
(%
)
Centre Number
33
Table 6: Antenatal corticosteroid for all babies born at < 32 weeks gestational age according to centres
Hospitals
Inborn Outborn
Total number of babies
Given Antenatal Steroid
Total number of babies
Given Antenatal Steroid
n % n % n % n %
Overall 3089 100 2358 76.3 367 100 145 39.5
2 109 3.5 79 72.5 12 3.3 4 33.3
3 140 4.5 113 80.7 19 5.2 9 47.4
4 37 1.2 29 78.4 4 1.1 3 75.0
5 246 8.0 200 81.3 28 7.6 10 35.7
6 76 2.5 57 75.0 7 1.9 6 85.7
7 166 5.4 119 71.7 20 5.4 7 35.0
8 141 4.6 107 75.9 13 3.5 7 53.8
9 100 3.2 79 79.0 10 2.5 2 20.0
10 63 2.0 47 74.6 12 3.3 3 25.0
11 26 0.8 18 69.2 0 0 0 0.0
12 49 1.6 35 71.4 9 2.5 7 77.8
13 39 1.3 36 92.3 16 4.4 13 81.3
14 37 1.2 32 86.5 0 0 0 0.0
15 75 2.4 61 81.3 17 4.6 6 35.3
16 107 3.5 84 63.2 1 0.3 1 100.0
17 100 3.2 83 64.4 9 2.5 4 44.4
18 38 1.2 31 81.6 8 2.2 3 37.5
19 112 3.6 91 81.0 19 5.2 7 36.8
34
Table 6 (continued): Antenatal corticosteroid for all babies born at < 32 weeks gestational age according to centres
Hospitals
Inborn Outborn
Total number of babies
Given Antenatal Steroid
Total number of babies
Given Antenatal Steroid
n % n % n % n %
20 57 1.8 36 63.2 4 1.1 1 25.0
21 45 1.5 29 64.4 3 0.8 0 0.0
22 76 2.5 62 81.6 9 2.5 5 55.6
23 147 4.8 119 81.0 27 7.4 14 51.9
24 170 5.5 121 71.2 24 6.5 5 20.8
25 76 2.5 66 86.8 11 3.0 7 63.6
26 176 5.7 115 65.3 11 3.0 3 27.3
27 41 1.3 27 65.9 12 3.3 3 25.0
28 19 0.6 13 68.4 2 0.5 1 50.0
29 113 3.7 78 69.0 5 1.4 2 40.0
30 29 0.9 23 79.3 0 0.0 0 0.0
31 115 3.7 95 82.6 17 4.6 7 4.2
32 101 3.3 86 85.1 5 1.4 0 0.0
33 71 2.3 57 80.3 9 2.5 0 0.0
34 45 1.5 43 95.6 3 0.8 0 0.0
35 32 1.0 29 90.6 3 0.8 0 0.0
36 4 0.1 3 75.0 1 0.3 0 0.0
37 78 2.5 36 46.2 13 3.5 4 30.8
38 8 0.3 5 62.5 0 0.0 0 0.0
39 25 0.8 14 56.0 4 1.1 1 25.0
35
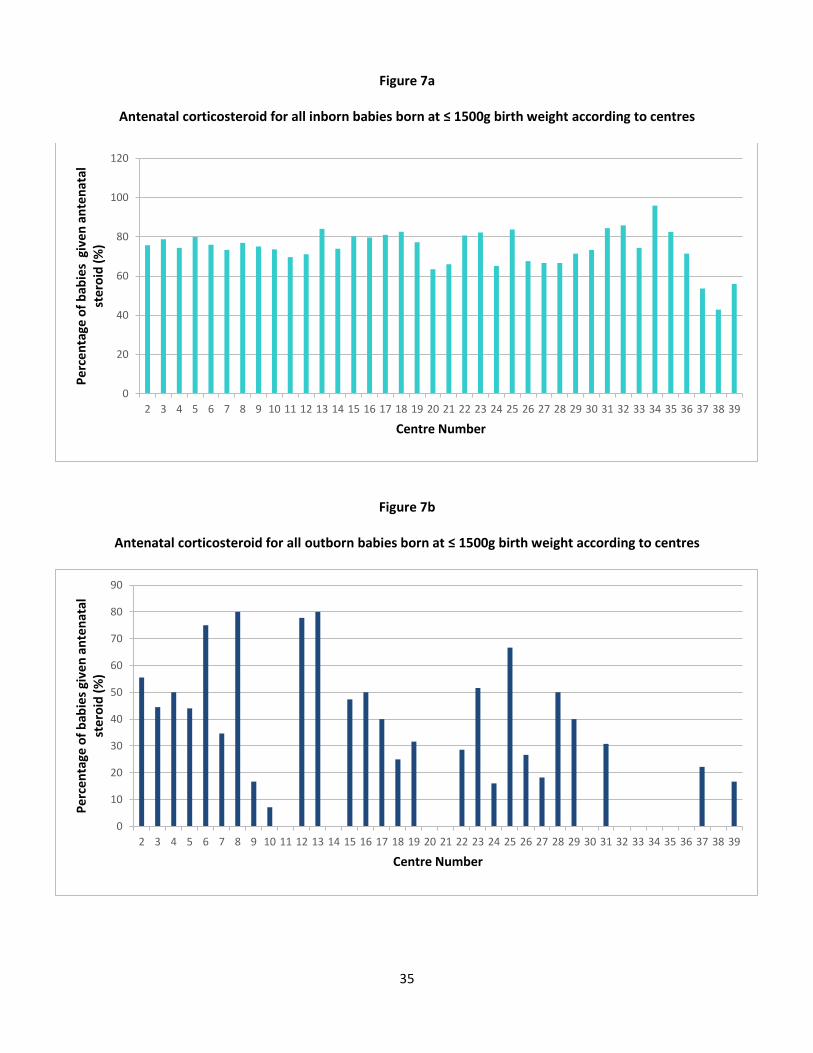
Figure 7a
Antenatal corticosteroid for all inborn babies born at ≤ 1500g birth weight according to centres
Figure 7b
Antenatal corticosteroid for all outborn babies born at ≤ 1500g birth weight according to centres
0
20
40
60
80
100
120
2 3 4 5 6 7 8 9 10 11 12 13 14 15 16 17 18 19 20 21 22 23 24 25 26 27 28 29 30 31 32 33 34 35 36 37 38 39
Pe
rce
nta
ge o
f b
abie
s g
ive
n a
nte
nat
al
ste
roid
(%
)
Centre Number
0
10
20
30
40
50
60
70
80
90
2 3 4 5 6 7 8 9 10 11 12 13 14 15 16 17 18 19 20 21 22 23 24 25 26 27 28 29 30 31 32 33 34 35 36 37 38 39
Pe
rce
nta
ge o
f b
abie
s gi
ven
an
ten
atal
st
ero
id (
%)
Centre Number
36
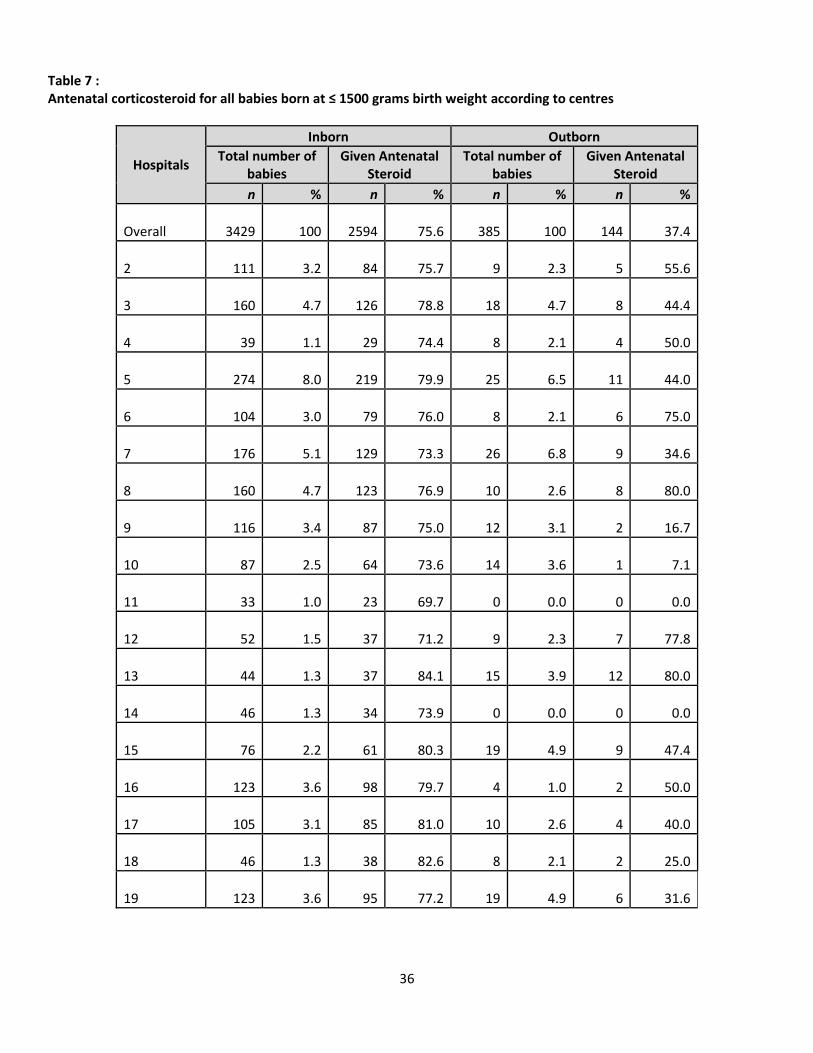
Table 7 : Antenatal corticosteroid for all babies born at ≤ 1500 grams birth weight according to centres
Hospitals
Inborn Outborn
Total number of babies
Given Antenatal Steroid
Total number of babies
Given Antenatal Steroid
n % n % n % n %
Overall 3429 100 2594 75.6 385 100 144 37.4
2 111 3.2 84 75.7 9 2.3 5 55.6
3 160 4.7 126 78.8 18 4.7 8 44.4
4 39 1.1 29 74.4 8 2.1 4 50.0
5 274 8.0 219 79.9 25 6.5 11 44.0
6 104 3.0 79 76.0 8 2.1 6 75.0
7 176 5.1 129 73.3 26 6.8 9 34.6
8 160 4.7 123 76.9 10 2.6 8 80.0
9 116 3.4 87 75.0 12 3.1 2 16.7
10 87 2.5 64 73.6 14 3.6 1 7.1
11 33 1.0 23 69.7 0 0.0 0 0.0
12 52 1.5
37 71.2 9 2.3 7 77.8
13 44 1.3 37 84.1 15 3.9 12 80.0
14 46 1.3 34 73.9 0 0.0 0 0.0
15 76 2.2 61 80.3 19 4.9 9 47.4
16 123 3.6 98 79.7 4 1.0 2 50.0
17 105 3.1 85 81.0 10 2.6 4 40.0
18 46 1.3 38 82.6 8 2.1 2 25.0
19 123 3.6 95 77.2 19 4.9 6 31.6

37
Table 7 (continued): Antenatal corticosteroid for all babies born at ≤ 1500 grams birth weight according to centres
Hospitals
Inborn Outborn
Total number of babies
Given Antenatal Steroid
Total number of babies
Given Antenatal Steroid
n % n % n % n %
20 63 1.8 40 63.5 4 1.0 0 0.0
21 50 1.5 33 66.0 2 0.5 0 0.0
22 93 2.7 75 80.6 7 1.8 2 28.6
23 152 4.4 125 82.2 31 8.1 16 51.6
24 178 5.2 116 65.2 25 6.5 4 16.0
25 80 2.3 67 83.8 12 3.1 8 66.7
26 201 5.9 136 67.7 15 3.9 4 26.7
27 42 1.2 28 66.7 11 2.9 2 18.2
28 27 0.8 18 66.7 2 0.5 1 50.0
29 112 3.3 80 71.4 5 1.3 2 40.0
30 30 0.9 22 73.3 1 0.3 0 0.0
31 122 3.6 103 84.4 13 3.4 4 30.8
32 113 3.3 97 85.8 4 1.0 0 0.0
33 82 2.4 61 74.4 8 2.1 0 0.0
34 48 1.4 46 95.8 4 1.0 0 0.0
35 40 1.2 33 82.5 2 0.5 0 0.0
36 7 0.2 5 71.4 1 0.3 0 0.0
37 82 2.4 44 53.7 18 4.7 4 22.2
38 7 0.2 3 42.9 0 0.0 0 0.0
39 25 0.7 14 56.0 6 1.6 1 16.7
38
Figure 8
Incidence of oxygen dependency among admitted inborn babies with gestational age < 32 weeks
0
10
20
30
40
50
60
22-24 25-27 28-31
Pe
rce
nta
ge o
f B
abie
s (%
)
Gestational Age (weeks)
Day 28
Week 36
39
Table 8 : Incidence of oxygen dependency among admitted inborn babies with gestational age < 32 weeks
Gestational age at birth
(weeks)
Total no of
admitted inborn babies
Babies alive at day 28
Babies with oxygen
dependency beyond day 28
among survivors
Babies alive at 36 weeks
postmenstrual age
Babies with oxygen
dependency beyond
36 weeks among survivors
22-24 n
177
24
13
17
9
% 5.9 13.6 54.2 9.6 52.9
25-27 n
605
370
201
275
121
% 20.2 61.2 54.3 45.5 44.0
28-31 n
2207
1545
244
983
140
% 73.8 70.0 15.8 44.5 14.2
Total included n
2989
1939
458
1275
270
% 100 64.9 23.6 42.7 21.2
Total no. of missing (GA) 0
Total babies
2989
40
Figure 9
Incidence of oxygen dependency among admitted inborn babies with birth weight ≤ 1500 grams
0
10
20
30
40
50
60
≤ 750 751-1000 1001-1250 1251-1500
Pe
rce
nta
ge o
f B
abie
s (%
)
Birth Weight (grams)
Day 28
Week 36
41
Table 9: Incidence of oxygen dependency among admitted inborn babies with birth weight ≤ 1500 grams
Birth Weight (grams)
Total no of
admitted inborn babies
Babies alive at 28
Babies with oxygen
dependency beyond day 28
among survivors
Babies alive at 36 weeks
postmenstrual age
Babies with oxygen
dependency beyond
36 weeks among survivors
≤ 750 n %
372 11.2
102 27.4
61 59.8
97 26.1
41 42.3
751- 1000
n %
696 20.9
505 72.6
208 41.2
445 63.9
135 30.3
1001 - 1250
n %
938 28.1
759 80.9
127 16.7
585 62.4
61 10.4
1251 - 1500
n %
1329 39.9
904 68.0
62 6.9
778 58.5
17 2.2
Total Included
n %
3335 100
2270 68.1
458 20.2
1905 57.1
254 13.3
Total no. of missing (GA) 0 Total babies 3335
42
Figure 10
Incidence of patent ductus arteriosus (PDA) among all admitted inborn babies in the MNNR by gestational age
Table 10 : Treatment of patent ductus arteriosus (PDA) in admitted inborn babies in the MNNR by gestational age
Gestational age Total number of
admitted inborn babies PDA Confirmed by ECHO
Indomethacin/ Ibuprofen Ligation
(completed weeks) n % n % n % n % n %
<23 17 0.2 1 5.9 0 0.0 0 0.0 0 0.0
23 62 0.6 7 11.3 7 100.0 5 71.4 1 14.3
24 101 0.9 19 18.8 19 100.0 10 52.6 0 0.0
25 141 1.3 58 41.1 48 82.8 32 55.2 1 1.7
26 194 1.8 79 40.7 73 92.4 37 46.8 6 7.6
27 270 2.4 117 43.3 108 92.3 48 41.0 2 1.7
28 391 3.5 155 39.6 140 90.3 51 32.9 2 1.3
29 444 4.0 133 30.0 121 91.0 51 38.3 1 0.8
30 633 5.7 127 20.1 111 87.4 44 34.6 1 0.8
31 739 6.7 115 15.6 104 90.4 28 24.3 2 1.7
≥32* 8054 72.9 715 8.9 672 94.0 60 8.4 8 1.1
Total included 11046 100 1526 13.8 1403 91.9 366 24.0 24 1.6
Total no. of missing (GA) 0 Overall Total babies 11046
COMMENT: *For the category ≥ 32 weeks gestation, calculated percentage does not include all livebirths in the hospital that do not fit inclusion criteria.
0
5
10
15
20
25
30
35
40
45
< 23 23 24 25 26 27 28 29 30 31 ≥ 32*
Pre
cen
tage
of
bab
ies
wit
h P
DA
(%
)
Gestational Age (weeks)
43
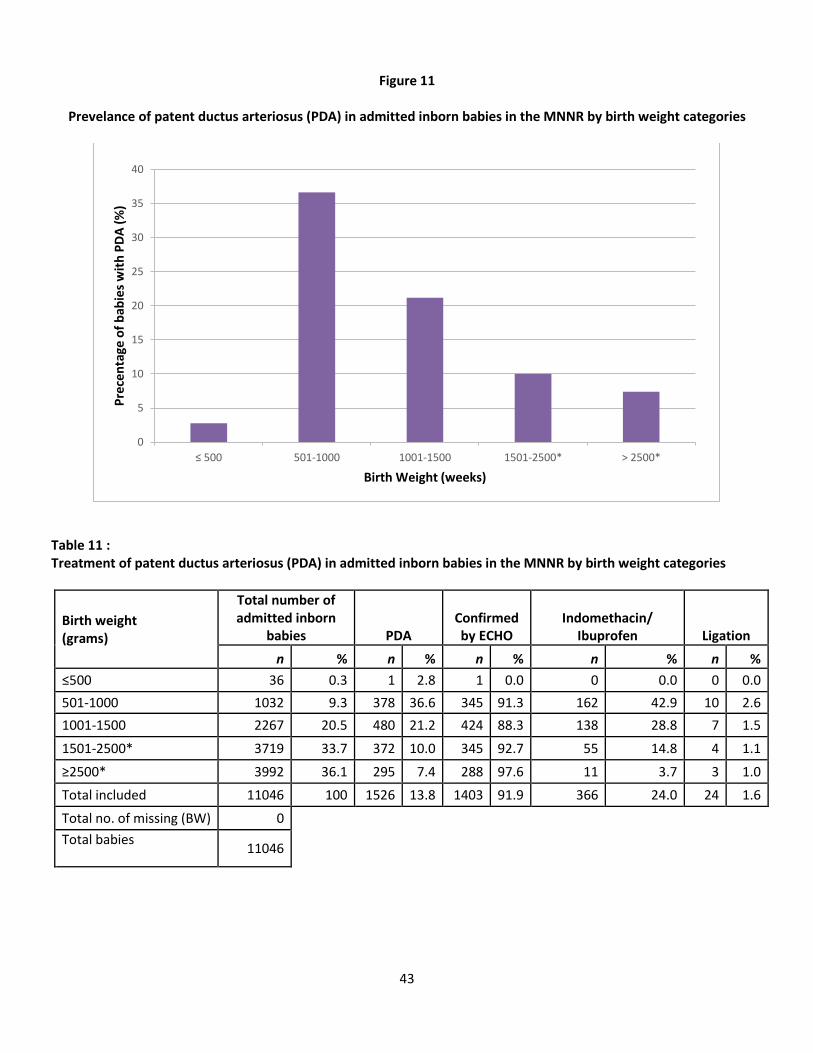
Figure 11
Prevelance of patent ductus arteriosus (PDA) in admitted inborn babies in the MNNR by birth weight categories
Table 11 : Treatment of patent ductus arteriosus (PDA) in admitted inborn babies in the MNNR by birth weight categories
Birth weight (grams)
Total number of admitted inborn
babies PDA Confirmed by ECHO
Indomethacin/ Ibuprofen Ligation
n % n % n % n % n %
≤500 36 0.3 1 2.8 1 0.0 0 0.0 0 0.0
501-1000 1032 9.3 378 36.6 345 91.3 162 42.9 10 2.6
1001-1500 2267 20.5 480 21.2 424 88.3 138 28.8 7 1.5
1501-2500* 3719 33.7 372 10.0 345 92.7 55 14.8 4 1.1
≥2500* 3992 36.1 295 7.4 288 97.6 11 3.7 3 1.0
Total included 11046 100 1526 13.8 1403 91.9 366 24.0 24 1.6
Total no. of missing (BW) 0
Total babies
11046
0
5
10
15
20
25
30
35
40
≤ 500 501-1000 1001-1500 1501-2500* > 2500*
Pre
cen
tage
of
bab
ies
wit
h P
DA
(%
)
Birth Weight (weeks)
44
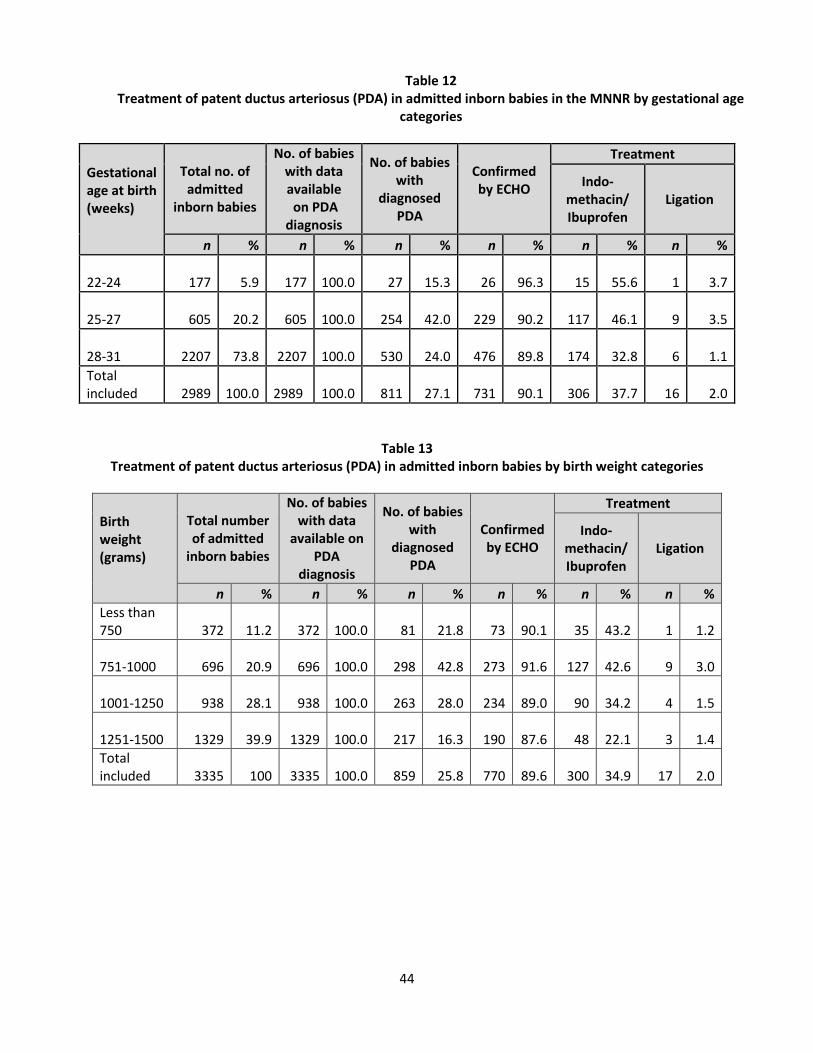
Table 12 Treatment of patent ductus arteriosus (PDA) in admitted inborn babies in the MNNR by gestational age
categories
Gestational age at birth (weeks)
Total no. of admitted
inborn babies
No. of babies with data available on PDA
diagnosis
No. of babies with
diagnosed PDA
Confirmed by ECHO
Treatment
Indo-methacin/ Ibuprofen
Ligation
n % n % n % n % n % n %
22-24 177 5.9 177 100.0 27 15.3 26 96.3 15 55.6 1 3.7
25-27 605 20.2 605 100.0 254 42.0 229 90.2 117 46.1 9 3.5
28-31 2207 73.8 2207 100.0 530 24.0 476 89.8 174 32.8 6 1.1
Total included 2989 100.0 2989 100.0 811 27.1 731 90.1 306 37.7 16 2.0
Table 13 Treatment of patent ductus arteriosus (PDA) in admitted inborn babies by birth weight categories
Birth weight (grams)
Total number of admitted
inborn babies
No. of babies with data
available on PDA
diagnosis
No. of babies with
diagnosed PDA
Confirmed by ECHO
Treatment
Indo-methacin/ Ibuprofen
Ligation
n % n % n % n % n % n %
Less than 750 372 11.2 372 100.0 81 21.8 73 90.1 35 43.2 1 1.2
751-1000 696 20.9 696 100.0 298 42.8 273 91.6 127 42.6 9 3.0
1001-1250 938 28.1 938 100.0 263 28.0 234 89.0 90 34.2 4 1.5
1251-1500 1329 39.9 1329 100.0 217 16.3 190 87.6 48 22.1 3 1.4
Total included 3335 100 3335 100.0 859 25.8 770 89.6 300 34.9 17 2.0

45
Figure 14
Incidence of retinopathy of prematurity (ROP) in admitted inborn babies by gestational age categories
Table 14 : Incidence of retinopathy of prematurity (ROP) in admitted inborn babies in the MNNR by gestational age categories
Gestational age at birth (weeks)
Total number
of admitted
inborn babies
No. of babies alive at 6 weeks
No. of babies with
eye examination
Retinopathy of prematurity Therapy
No ROP ROP
Stage 1 & 2 ROP
Stage 3
ROP Stage 4 &
5 Cryo Laser
n n n % n % n % n % n %
22-24 177 33 27 81.8 10 37.0 12 44.4 5 18.5 0 0.0 0 5
25-27 605 398 371 93.2 230 62.0 111 29.9 30 8.1 0 0.0 1 27
28-31 2207 1975 1423 72.1 1247 87.6 150 10.5 26 1.8 0 0.0 0 18
Total Included 2989 2406 1821 75.7 1487 81.7 273 15.0 61 3.3 0 0.0 1 50
Comment: Screening refers to those screened during the ward admission
0
20
40
60
80
100
22-24 25-27 28-31
Pe
rce
nta
ge o
f B
abie
s (%
)
Gestational Age ( weeks)
Stage 4
Stage 3
Stage 1 & 2
No ROP

46
Figure 15
Incidence of retinopathy of prematurity (ROP) in admitted inborn babies by birth weight categories
Table 15 : Incidence of retinopathy of prematurity (ROP) in admitted inborn babies in the MNNR by birth weight categories
Birth weight (grams)
Total no of
admitted inborn babies
No. of babies alive at 6 weeks
No. of babies with
eye examination
Retinopathy of prematurity Therapy
No ROP
ROP
Stage 1 & 2
ROP
Stage 3
ROP Stage 4 & 5
Cryo Laser
n n n % n % n % n % n %
≤ 750 372 116 107 92.2 59 55.1 32 29.9 16 15.0 0 0.0 0 12
751-1000 696 533 502 94.2 345 68.7 134 26.7 23 4.6 0 0.0 0 21
1001-1250 938 818 676 82.6 583 86.2 74 10.9 19 2.8 0 0.0 1 13
1251-1500 1329 1231 733 59.5 722 98.5 44 6.0 7 1.0 0 0.0 0 4
Total included 3335 2698 2018 74.8 1709 84.7 284 14.1 65 3.2 0 0.0 1 50
Comment: Screening refers to those screened during the ward admission
0
20
40
60
80
100
≤ 750 751-1000 1001-1250 1251-1500
Pe
rce
nta
ge o
f B
abie
s (%
)
Birth Weight (grams)
Stage 4
Stage 3
Stage 1 & 2
No IVH
47
Figure 16
Incidence of intraventricular haemorrhage (IVH) in admitted inborn babies < 32 weeks gestational age
Table 16 : Incidence of intraventricular haemorrhage (IVH) in admitted inborn babies < 32 weeks gestational age
Gestational age (completed weeks)
Total no. of
admitted inborn babies
Babies with CUS
NO IVH
IVH Grade 1
& Grade 2
IVH Grade 3
IVH Grade 4
No. of babies with
CUS
Alive Dead
22-24 n 177 83
36 19 15 13
26
57
% 5.9 46.9 43.4 22.9 18.1 15.7
25-27
n 605 538
244 185 53 56
370
168
% 20.2 88.9 45.4 34.4 9.9 10.4
28-31
n
2207 1975
1358 500 89 28
1791
184
% 73.8 89.5 68.8 25.3 4.5 1.4
Total included
n
2989 2596
1638 704 157 97
2187
409
% 100.0 86.9 63.1 27.1 6.0 3.7
Total no. of missing (GA)
0
Total babies
2989
CUS – cranial untrasound
0
10
20
30
40
50
60
70
80
90
100
22-24 25-27 28-31
Pe
rce
nta
ge o
f B
abie
s (%
)
Gestational Age (weeks)
Grade 4
Grade 3
Grade 1 & 2
No IVH
48
Figure 17
Incidence of intraventricular haemorrhage (IVH) in admitted inborn babies ≤ 1500 grams birth weight
Table 17 : Incidence of intraventricular haemorrhage (IVH) in admitted inborn babies < 1500 grams birth weight
Birth weight (grams)
Total no. of admitted
inborn babies
Babies with CUS
NO IVH
IVH Grade 1
& Grade 2
IVH Grade 3
IVH Grade 4
No. of babies with
CUS
Alive Dead
≤ 750 n 372 242
107 70 33 32
102 140
% 11.2 65.1 44.2 28.9 13.6 13.2
751-1000
n 696 641
328 222 54 37
499 142
% 20.9 92.1 51.2 34.6 8.4 5.8
1001-1250
n 938 845
525 257 42 21
753 92
% 28.1 90.1 62.1 30.4 5.0 2.5
1251-1500
n %
1329 39.9
1141 85.9
893 78.3
212 18.6
28 2.5
8 0.7
1073 68
Total included
n %
3335 100
2869 86.0
1853 64.6
761 26.5
157 5.5
98 3.4
2427 442
Total no. of missing (GA)
0
Total babies 3159
0
10
20
30
40
50
60
70
80
90
100
≤ 750 751-1000 1001-1250 1251-1500
Per
cen
tage
of
Bab
ies
(%)
Birth Weight (grams)
Grade 4
Grade 3
Grade 1 & 2
No IVH
49
Figure 18
Incidence of necrotizing enterocolitis (NEC) in admitted inborn babies according to gestational age categories
Table 18 : Incidence and treatment of necrotizing enterocolitis (NEC) in admitted inborn babies according to gestational age categories
Gestational age (weeks)
Total number of admitted inborn
babies
Babies with NEC With Surgical
treatment
n n % n %
22-24 177 7 4.0 3 42.9
25-27 605 40 6.6 12 30.0
28-31 2207 95 4.3 29 30.5
Total included 2989 142 4.8 44 31.0
Total no. of missing (GA) 0
Overall Total babies 2989
Comment: NEC refers to those with at least Stage 2 modified Bell’s criteria
0
1
2
3
4
5
6
7
22-24 25-27 28-31
Pe
rce
nta
ge o
f B
abie
s (%
)
Gestational Age (weeks)

50
Figure 19
Incidence of necrotizing enterocolitis (NEC) in admitted inborn babies according to birth weight categories
Table 19 :
Incidence and treatment of necrotizing enterocolitis (NEC) in admitted inborn babies according to birth weight categories
Birth weight (grams)
Total number admitted of inborn
babies
Babies with NEC
With Surgical treatment
n n % n %
≤ 750 372 36 9.7 11 30.6
751-1000 696 47 6.8 14 29.8
1001-1250 938 46 4.9 15 32.6
1251 - 1500 1329 37 2.8 13 35.1
Total included 3335 166 5.0 53 31.9
Total no. of missing (BW) 0
Overall total babies 3335
Comment: NEC refers to those with at least Stage 2 modified Bell’s criteria
0
1
2
3
4
5
6
7
8
≤ 750 751-1000 1001-1250 1251-1500
Pe
rce
nta
ge o
f B
abie
s (%
)
Birth Weight (weeks)
51
Figure 20 Incidence of blood culture positive early onset sepsis in admitted inborn babies by gestational age categories
Table 20 : Incidence of blood culture positive early onset sepsis in admitted inborn babies by gestational age categories
Gestational age at birth Total number of
admitted inborn babies No. of babies with early
infection
(completed weeks) n n %
22-24 177 2 1.1
25-27 605 19 3.1
28-31 2207 31 1.4
Total included 2989 52 1.7
Total no. of missing (GA) 0
Total babies 2989
0
1
2
3
4
22-24 25-27 28-31
Pe
rce
nta
ge o
f B
abie
s (%
)
Gestational Age (weeks)
52
Figure 21
Incidence of blood culture positive late onset sepsis in admitted inborn babies by gestational age categories
Table 21 : Incidence of blood culture positive late onset sepsis in admitted inborn babies by gestational age categories
Gestational age (weeks)
Total number of admitted inborn
babies
No. of babies who survived beyond day 3
after birth
No. of babies with at least one episode of late onset
sepsis
n n n %
22 – 24 177 28 8 28.6
25 – 27 605 377 53 14.1
28 – 31 2207 1940 138 7.1
Total included 2989 2345 199 8.5
Total no. of missing (GA) 0
Total babies 2989
0
5
10
15
20
25
30
22-24 25-27 28-31
Pe
rce
nta
ge o
f B
abie
s (%
)
Gestational Age (weeks)
53
Figure 22
Incidence of blood culture positive late onset sepsis in admitted inborn babies by birth weight categories
Table 22 : Incidence of blood culture positive late onset sepsis in admitted inborn babies by birth weight categories
Birth weight (grams)
Total number of admitted inborn
babies
No. of babies who survived beyond day
3 after birth
No. of babies with at least one episode of late
onset sepsis
n n n %
≤ 750 372 103 22 21.4
751-1000 696 516 71 13.8
1001-1250 938 798 62 7.8
1251-1500 1329 1213 53 4.4
Total included 3335 2630 208 7.9
Total no. of missing (BW) 0
Overall total babies 3335
0
2
4
6
8
10
12
14
16
18
20
22
24
≤ 750 751-1000 1001-1250 1251-1500
Pe
rce
nta
ge o
f B
abie
s (%
)
Birth Weight (weeks)
54
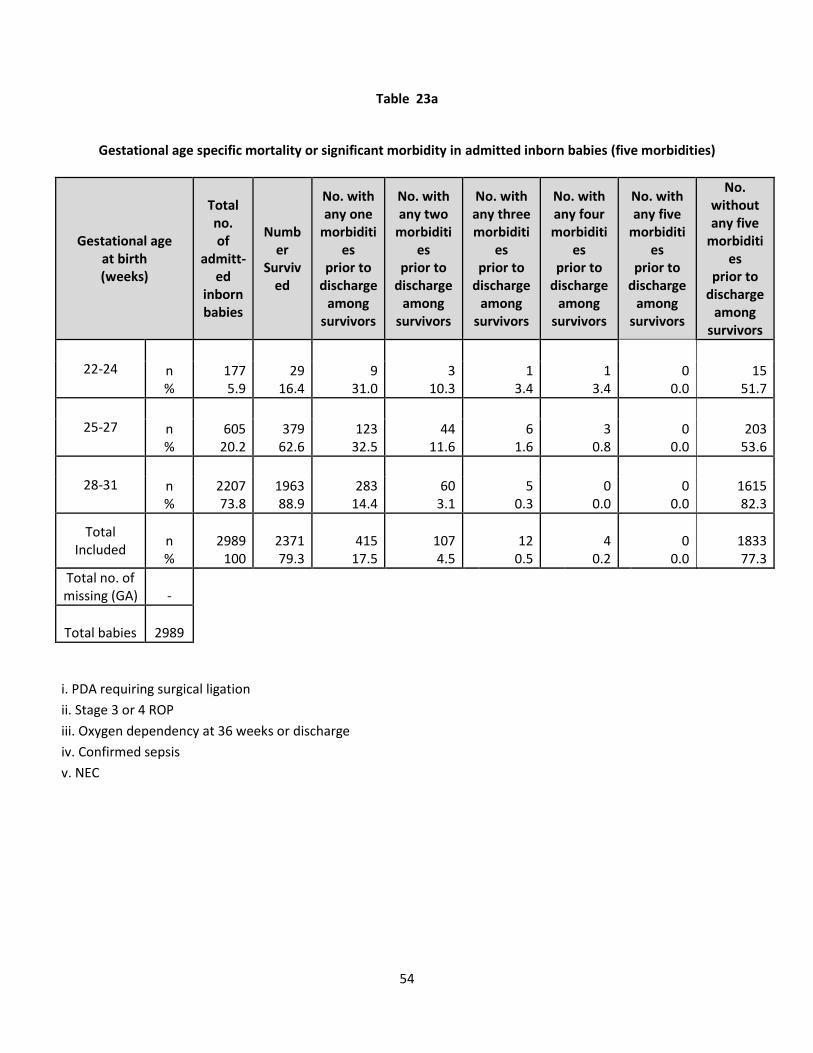
Table 23a
Gestational age specific mortality or significant morbidity in admitted inborn babies (five morbidities)
Gestational age at birth (weeks)
Total no. of
admitt-ed
inborn babies
Number
Survived
No. with any one
morbidities
prior to discharge
among survivors
No. with any two
morbidities
prior to discharge
among survivors
No. with any three morbiditi
es prior to
discharge among
survivors
No. with any four morbiditi
es prior to
discharge among
survivors
No. with any five
morbidities
prior to discharge
among survivors
No. without any five
morbidities
prior to discharge
among survivors
22-24
n %
177 5.9
29 16.4
9 31.0
3 10.3
1 3.4
1 3.4
0 0.0
15 51.7
25-27
n %
605 20.2
379 62.6
123 32.5
44 11.6
6 1.6
3 0.8
0 0.0
203 53.6
28-31
n %
2207 73.8
1963 88.9
283 14.4
60 3.1
5 0.3
0 0.0
0 0.0
1615 82.3
Total Included
n %
2989
100 2371 79.3
415 17.5
107 4.5
12 0.5
4 0.2
0
0.0 1833 77.3
Total no. of missing (GA) -
Total babies 2989
i. PDA requiring surgical ligation ii. Stage 3 or 4 ROP iii. Oxygen dependency at 36 weeks or discharge
iv. Confirmed sepsis v. NEC
55
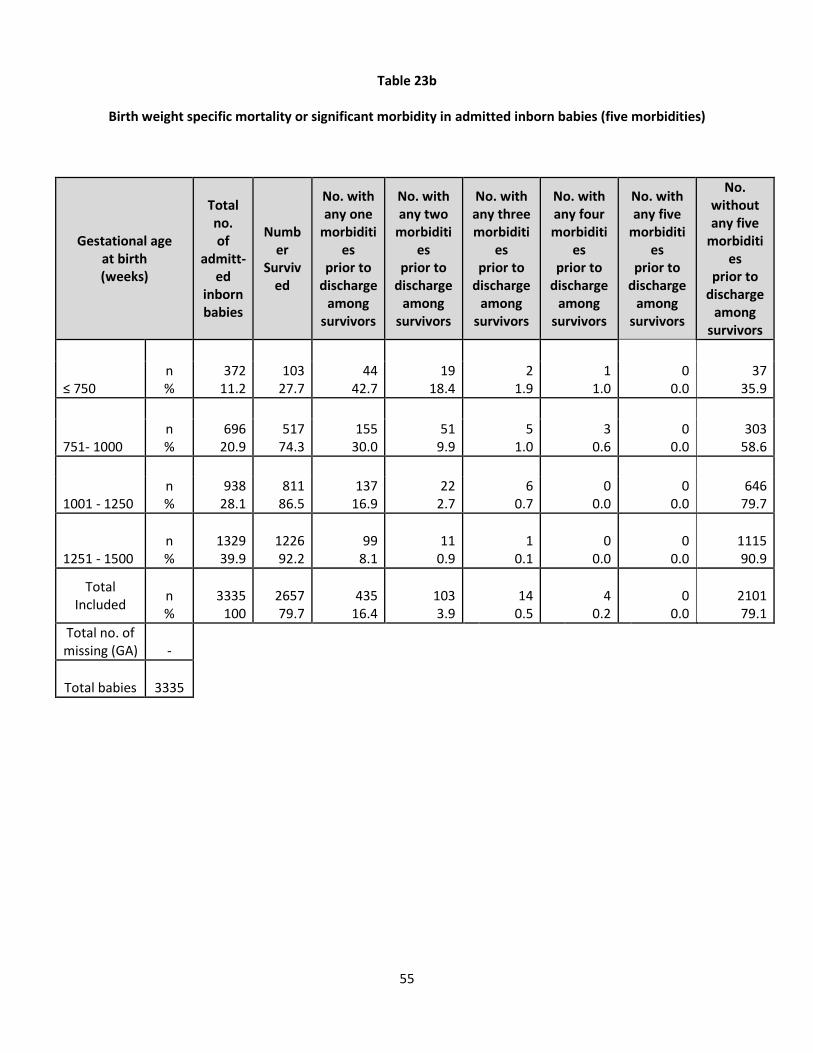
Table 23b
Birth weight specific mortality or significant morbidity in admitted inborn babies (five morbidities)
Gestational age at birth (weeks)
Total no. of
admitt-ed
inborn babies
Number
Survived
No. with any one
morbidities
prior to discharge
among survivors
No. with any two
morbidities
prior to discharge
among survivors
No. with any three morbiditi
es prior to
discharge among
survivors
No. with any four morbiditi
es prior to
discharge among
survivors
No. with any five
morbidities
prior to discharge
among survivors
No. without any five
morbidities
prior to discharge
among survivors
≤ 750
n %
372 11.2
103 27.7
44 42.7
19 18.4
2 1.9
1 1.0
0 0.0
37 35.9
751- 1000
n %
696 20.9
517 74.3
155 30.0
51 9.9
5 1.0
3 0.6
0 0.0
303 58.6
1001 - 1250
n %
938 28.1
811 86.5
137 16.9
22 2.7
6 0.7
0 0.0
0 0.0
646 79.7
1251 - 1500
n %
1329 39.9
1226 92.2
99 8.1
11 0.9
1 0.1
0 0.0
0
0.0 1115 90.9
Total Included
n %
3335 100
2657 79.7
435 16.4
103 3.9
14 0.5
4 0.2
0
0.0 2101 79.1
Total no. of missing (GA) -
Total babies 3335

56
APPENDICES
57
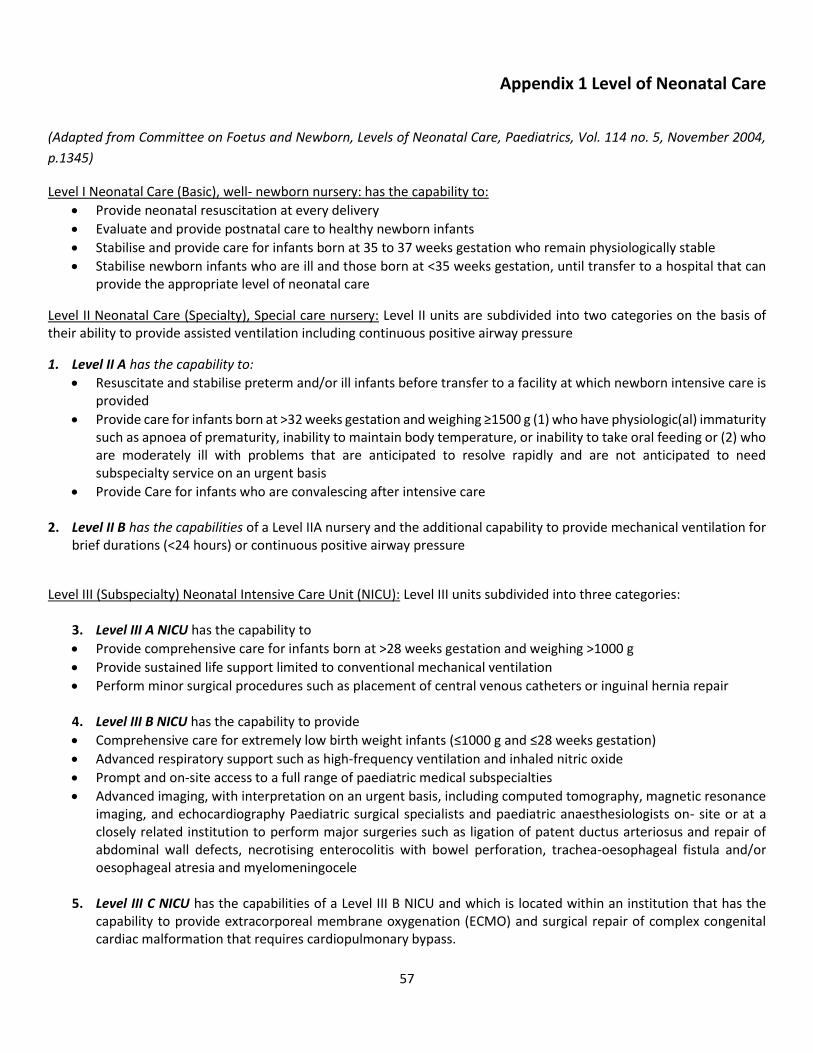
Appendix 1 Level of Neonatal Care
(Adapted from Committee on Foetus and Newborn, Levels of Neonatal Care, Paediatrics, Vol. 114 no. 5, November 2004,
p.1345)
Level I Neonatal Care (Basic), well- newborn nursery: has the capability to:
Provide neonatal resuscitation at every delivery
Evaluate and provide postnatal care to healthy newborn infants
Stabilise and provide care for infants born at 35 to 37 weeks gestation who remain physiologically stable
Stabilise newborn infants who are ill and those born at <35 weeks gestation, until transfer to a hospital that can provide the appropriate level of neonatal care
Level II Neonatal Care (Specialty), Special care nursery: Level II units are subdivided into two categories on the basis of their ability to provide assisted ventilation including continuous positive airway pressure
1. Level II A has the capability to:
Resuscitate and stabilise preterm and/or ill infants before transfer to a facility at which newborn intensive care is provided
Provide care for infants born at >32 weeks gestation and weighing ≥1500 g (1) who have physiologic(al) immaturity such as apnoea of prematurity, inability to maintain body temperature, or inability to take oral feeding or (2) who are moderately ill with problems that are anticipated to resolve rapidly and are not anticipated to need subspecialty service on an urgent basis
Provide Care for infants who are convalescing after intensive care
2. Level II B has the capabilities of a Level IIA nursery and the additional capability to provide mechanical ventilation for brief durations (<24 hours) or continuous positive airway pressure
Level III (Subspecialty) Neonatal Intensive Care Unit (NICU): Level III units subdivided into three categories:
3. Level III A NICU has the capability to
Provide comprehensive care for infants born at >28 weeks gestation and weighing >1000 g
Provide sustained life support limited to conventional mechanical ventilation
Perform minor surgical procedures such as placement of central venous catheters or inguinal hernia repair
4. Level III B NICU has the capability to provide
Comprehensive care for extremely low birth weight infants (≤1000 g and ≤28 weeks gestation)
Advanced respiratory support such as high-frequency ventilation and inhaled nitric oxide
Prompt and on-site access to a full range of paediatric medical subspecialties
Advanced imaging, with interpretation on an urgent basis, including computed tomography, magnetic resonance imaging, and echocardiography Paediatric surgical specialists and paediatric anaesthesiologists on- site or at a closely related institution to perform major surgeries such as ligation of patent ductus arteriosus and repair of abdominal wall defects, necrotising enterocolitis with bowel perforation, trachea-oesophageal fistula and/or oesophageal atresia and myelomeningocele
5. Level III C NICU has the capabilities of a Level III B NICU and which is located within an institution that has the
capability to provide extracorporeal membrane oxygenation (ECMO) and surgical repair of complex congenital cardiac malformation that requires cardiopulmonary bypass.
58
Appendix 2 Data Definitions
DATA DEFINITIONS AND CRITERIA
Centre Name*: Name of participating hospital Date of Admission (dd/mm/yy): Date of first admission to the participating site State if it is a new case, or a readmission and to specify the referring centre (Referral from :) if relevant. Case Status: ‘New case’: First time admission to the NNU concerned will be considered as a new case. ‘Readmission’: Subsequent admission of the same baby to the same NNU will be considered as a readmission. ‘Transfer from’: Case transferred from another hospital and being admitted to NNU for first time.
SECTION 1: Patient Particulars
1. Name of mother: Name as in hospital record
2. Name of baby (optional): Name as in hospital record, if relevant
3. RN of baby: Registration Number at participating hospital. If the baby dies in Labour room and has no RN, then
use the mother’s RN.
4. Mother’s I/C Number: MyKad number or Other ID document no. If “Other” please specify type
of document.
5. a) Date of Birth: dd/mm/yy b) Time of Birth: To state 24-hour format (mandatory for death cases) Estimate
time of death if patient died at home and time accurately not known as in home delivery
6. Ethnic group: Malay / Chinese / Indian / Orang Asli / Bumiputra Sabah / Bumiputra Sarawak / Other Malaysian/
Non-citizen (specific country). If Bumiputra Sabah or Bumiputra Sarawak please specify the indigenous group.
7. Maternal Age: Age in completed years.
8. GPA: Gravida, Para, Abortion (of current pregnancy before delivery of this child). to state number of ectopic
pregnancies (Ectopic pregnancy also considered as an abortion). Multiple pregnancy considered as ONE para (e.g
twins)
9. Maternal Diabetes: State ‘yes’ or ‘no’ if mother had diabetes (regardless of whether it is gestational or pre-
gestational) State ‘unknown’ if so
10. Maternal Hypertension: State ‘yes’ or ‘no’ if mother had hypertension (regardless of whether it is chronic or
pregnancy induced) State ‘unknown’ if so
11. Maternal Chorioamnionitis: State ‘yes’ or ‘no’ if mother had chorioamnionitis. State ‘unknown’ if so.
59
12. Maternal Eclampsia: State ‘yes’ or ‘no’. State ‘unknown’ if so.
13. Maternal Anaemia: State ‘yes’, ‘no’ or ‘unknown’. Mother’s Hb level < 11 g/dL or noted to have anaemia of
pregnancy by O&G.
14. Maternal abruptio placenta: State ‘yes’ or ‘no’.
15. Maternal bleeding placenta praevia: State ‘yes’ or ‘no’.
16. Cord prolapse: State ‘yes’ or ‘no’.
SECTION 2: Birth History
17. Antenatal steroids: State ‘yes’ if this has been given (regardless of number of doses or when it was given) or ‘no’
if this has not been given. If yes, state whether ONE or TWO doses given. State ‘unknown’ if so
18. Intrapartum antibiotics: State ‘Yes’ if systematic antibiotics (enteral or parenteral) were given to mothers in the
24 hours prior to delivery. State ‘unknown’ if so
19. Birth weight (grams): Weight in grams at birth hospital. If there are discrepant values, use the birth hospital value
for outborn babies. If birth weight is unavailable, use the first weight taken up to 24 hours of life. If birth weight
only listed as an estimate, record the estimate, but make a note on the CRF that this is an approximate birth
weight.
20. a) Gestation (weeks): Best estimate of gestational age at birth given in full weeks. Preferences among estimates
should be 1) obstetric estimate according to delivering obstetrician. (Ultrasound date selected if done earlier than
25 weeks and there is a discrepancy with the Last Menstrual Period (LMP) dates. Otherwise, use LMP dates. 2)
New expanded Ballard scoring. If there is no definite estimate but baby referred to as term baby, enter 40.
b) Gestional age based on: LMP, Ultrasound, Neonatal assessment or unknown – mandatory if patient died.
21. Growth status: based on Intrauterine Growth Curves (Composite Male / Female) chart. SGA <10th centile; AGA
10-90th centile; LGA >90th centile.
22. Gender: Indicate Male, Female or Ambiguous/Indeterminate.
23. Place of birth:
Inborn – born in the same hospital as the participating site. If born within the wards of participating hospital also considered as inborn. (unless in ambulance – born before arrival BBA as outborn)
60
Outborn – Born in another place (includes BBA) and transferred after birth to NNU of the participating site. Includes those born in hospital compound but not wards.
Home
Health Clinic
Government Hospital with specialist – General/District
Government Hospital without specialist
University Hospital
Private Hospital/maternity home<50 beds with/without specialist
Private Hospital/maternity home>50 beds
Alternative Birthing Centre (ABC) – Urban/Rural
Enroute / During transport
Others (please specify)
Unknown
24. Multiplicity: To indicate as singleton, twins, triplets or others i.e. quadruplets, etc.
25. Mode of Delivery: Tick as relevant. All caesarians are considered as such without differentiation into upper or lower segment. For breech presentation in caesarian sections, tick Caesarian only. Tick as ‘emergency’ if there is a reason for the Caesarian section that has an emergency indication, not whether it is listed as ‘semi emergency’ or ‘emergency’ in the OT list.
26. Apgar Score at 1 min and 5 min: Enter the apgar score at 1 min and 5 min as noted in the labour and delivery record. Score even if baby was intubated by 5 minutes of life. Tick ‘unknown’ if so, not because it was not scored once baby intubated. Apgar score can be ‘0’ at 1 minute & 5 minutes.
27. Initial Resuscitation (for inborn babies only): Tick ‘Yes’ for all intervention that apply at birth for inborn cases only a) Oxygen b) Bag-mask vent c) Endotracheal Tube Ventilation d) Cardiac Compression e) Adrenaline
28. Admission Temperature: Temperature on admission to one decimal point in degree Celsius. Mandatory field for
admission to Neonatal Ward. Does not include babies who die in delivery room.
61
SECTION 3: Neonatal Events
29. Respiratory support: Tick ‘Yes’ if any respiratory support was given a) CPAP – if infant given Continuous Positive Airway Pressure (CPAP) applied through nose at any time of birth
e.g. by Neopuff
b) Conventional Ventilation – intermittent positive pressure ventilation through an endotracheal tube a conventional ventilator (IMV rate < 240/min) at any time after leaving the delivery room.
c) HFJ/ HFOV – High frequency ventilation
d) Nitric oxide – gas delivered via a ventilator at any time after leaving the delivery room.
30. Total number of days on ventilation support at your centre: Total number of days on conventional ventilation and high frequency ventilation. Do not include days on CPAP.
31. Surfactant: Indicate whether exogenous surfactant given or not. If ‘yes’ indicate whether given at < 1 hour, 1 -2 hours or > 2 hours postnatal age.
32. Parenteral Nutrition: Nutrition given intravenously. Parenteral nutrition must include amino acids with or without
fats, hence plain dextrose saline infusion in not parenteral nutrition.
SECTION 4: Problems / Diagnoses
Mandatory fields are included for some diagnoses/procedures that are very important in the care of VLBW and sick infants. Definitions of these conditions are as shown below (AFTER SECTION 5). Other diagnoses or problems not given in the list can be referred to ‘WHO 1992 ICD-10; Volume 1 document’ and to be written in the space provided under ‘Others’. NA in the CRF means data is not applicable or not available. There should not be too many ‘Not available’ data
SECTION 5: Outcome
48a. Date of discharge/transfer/death: Enter the exact date 48b. Time of death: State as 24-hour format – used to auto calculate age at discharge. Mandatory for death cases – give best-estimated time if of death if exact time not known. 49. Weight (grams) and growth status on discharge/ death: a) Weight in grams. For weight on death is the last weight taken when the baby was alive
b) Indicate growth status as per Intrauterine Growth Curves (Composite Male / Female)
50. Feeding at discharge/death: Refers to feeding received at the time of discharge

62
‘Never Fed’ – if infants did not received any enteral feeding at discharge either formula milk or human milk. ‘Human milk only’ – if infants was discharge receiving human milk either by breast-fed and/or expressed breast milk. ‘Formula only’ – if infants was discharge receiving formula milk at discharge ‘Human milk with formula’ –if infants was discharge receiving received both human milk and formula milk at discharge.
50. Total Duration of hospital stay (Neonatal/Paeds Care): State to next complete day i.e. < 24 hours is 1 day and 10 days 6 hours is 11 days.
50. Outcome: Alive or Dead – Alive at discharge or died before discharge.
If child alive, state Place of discharge to: Home, Other Non-Paeds Ward, Social Welfare home ‘Still hospitalised as of 1st birthday’ or ‘Transferred to other hospitals’. If transferred to other hospitals, specify the name of hospital transferred to. If a case is transferred to another hospital in the MNNR network, complete the CRF up to current status and send photocopy of the form with the baby to assist the referral hospital in obtaining the patient particulars and birth history. The referring hospital still need to key in the original form into the system. The referral centre will open and complete a new CRF and this will be analysed together with the CRF of the referring hospital.
Post- transfer disposition: If the case is transferred to another hospital out of the NNR network, the referring unit must get the final ‘outcome’ of the baby from the unit that the case was referred to. This includes ROP findings after discharge.
If child died, tick ‘Yes’ or ‘No’ whether the infant died within 12 hours or less from the time of admission to the NICU.
Place of Death: Labour Room/OT, In Transit Neonatal Unit or others, specify.
SUPPLEMENTARY FORM

63
Filled whenever there is neonatal death in accordance to the Modified Wigglesworth Classification of Perinatal
Mortality:
An additional data to that collected in the main CRF for neonatal deaths.
1. Centre’ Name: State name of reporting hospitals
2. Name: State mother’s name
3. RN of baby: RN at participating hospital. If the baby dies in Labour Room and has no RN, use mother’s RN.
4. Mother’s new IC number or passport: whichever applicable
Immediate Cause of Death (Modified Wigglesworth):
(Adapted from Garis panduan Penggunaan Format PNM 1/97 (Pindaan 2000) bagi Melapor Kematian Perinatal, Jun
2000, Bahagian Pembangunan Kesihatan Keluarga, Kementarian Kesihatan Malaysia)
a. Lethal Congenital Malformation (LCM)/defect Severe or lethal malformation that contribute to death. If ‘Yes’, tick specifically the cause of death.
b. Gestation < 37 or ≥ 37 weeks
c. Immaturity This includes only livebirths < 37 weeks gestation after excluding LCM. Tick immediate secondary cause of death e.g. severe IVH, pulmonary haemorrhage
d. Asphyxial conditions All term babies who died from birth asphyxia or meconium aspiration syndrome or PPHN
e. Infection This refers to term babies (. 37 weeks gestation) whose primary cause of death is an infection. Some examples includes meningitis, group B streptococcal infection, intrauterine infections, etc.
f. Other specific causes Specify any course of death not included in the above classification. This includes kernicterus, haemorrhagic shock/inborn error of metabolism/pneumothorax/pulmonary haemorrhage.
g. Unknown Where cause of death is not known.
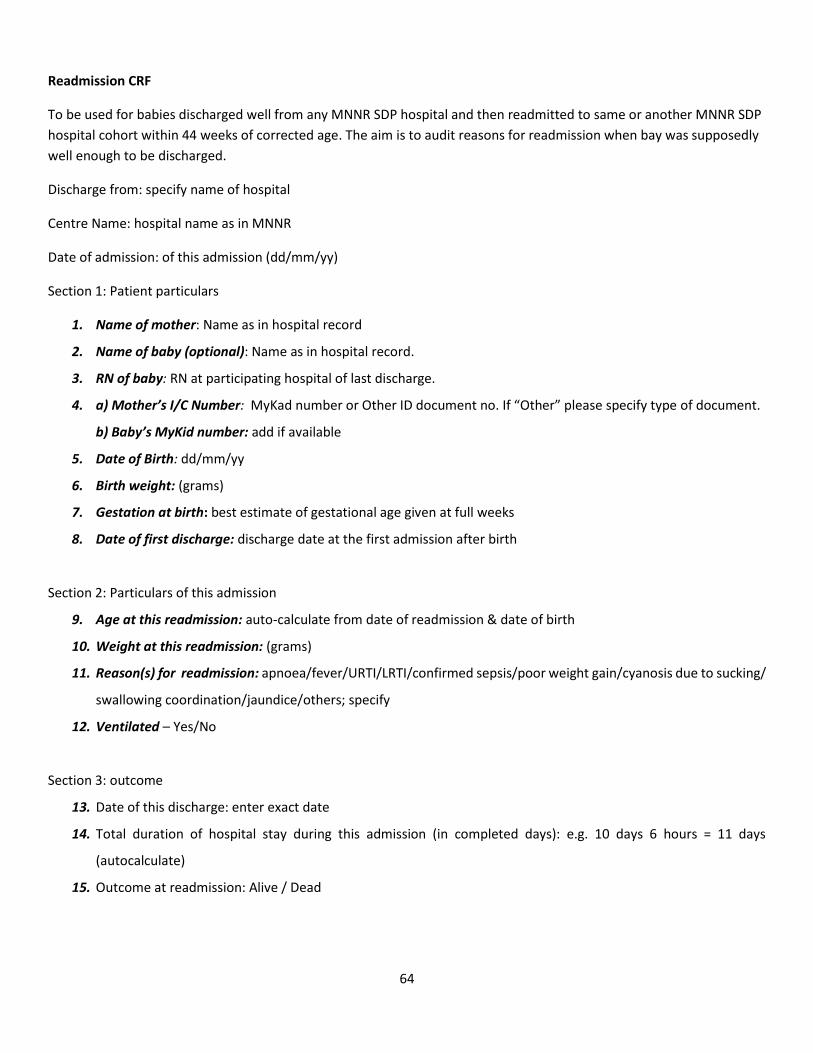
64
Readmission CRF
To be used for babies discharged well from any MNNR SDP hospital and then readmitted to same or another MNNR SDP
hospital cohort within 44 weeks of corrected age. The aim is to audit reasons for readmission when bay was supposedly
well enough to be discharged.
Discharge from: specify name of hospital
Centre Name: hospital name as in MNNR
Date of admission: of this admission (dd/mm/yy)
Section 1: Patient particulars
1. Name of mother: Name as in hospital record
2. Name of baby (optional): Name as in hospital record.
3. RN of baby: RN at participating hospital of last discharge.
4. a) Mother’s I/C Number: MyKad number or Other ID document no. If “Other” please specify type of document.
b) Baby’s MyKid number: add if available
5. Date of Birth: dd/mm/yy
6. Birth weight: (grams)
7. Gestation at birth: best estimate of gestational age given at full weeks
8. Date of first discharge: discharge date at the first admission after birth
Section 2: Particulars of this admission
9. Age at this readmission: auto-calculate from date of readmission & date of birth
10. Weight at this readmission: (grams)
11. Reason(s) for readmission: apnoea/fever/URTI/LRTI/confirmed sepsis/poor weight gain/cyanosis due to sucking/
swallowing coordination/jaundice/others; specify
12. Ventilated – Yes/No
Section 3: outcome
13. Date of this discharge: enter exact date
14. Total duration of hospital stay during this admission (in completed days): e.g. 10 days 6 hours = 11 days
(autocalculate)
15. Outcome at readmission: Alive / Dead
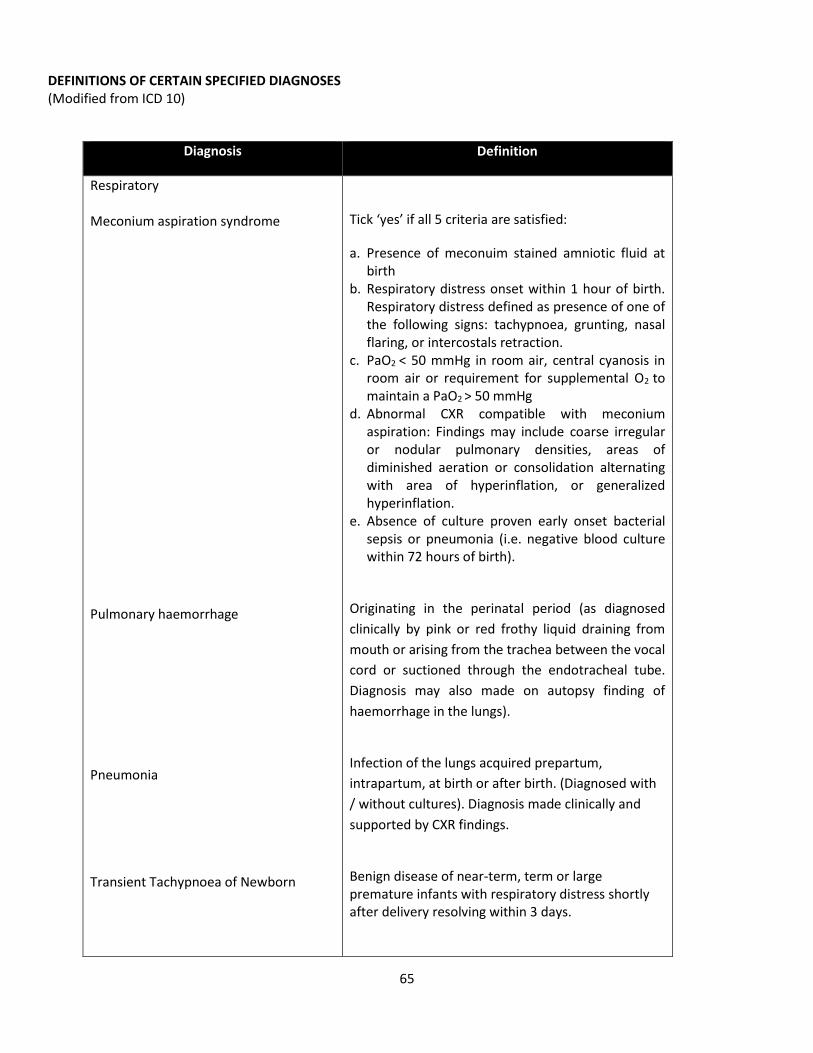
65
DEFINITIONS OF CERTAIN SPECIFIED DIAGNOSES (Modified from ICD 10)
Diagnosis Definition
Respiratory Meconium aspiration syndrome Pulmonary haemorrhage Pneumonia Transient Tachypnoea of Newborn
Tick ‘yes’ if all 5 criteria are satisfied:
a. Presence of meconuim stained amniotic fluid at birth
b. Respiratory distress onset within 1 hour of birth. Respiratory distress defined as presence of one of the following signs: tachypnoea, grunting, nasal flaring, or intercostals retraction.
c. PaO2 < 50 mmHg in room air, central cyanosis in room air or requirement for supplemental O2 to maintain a PaO2 > 50 mmHg
d. Abnormal CXR compatible with meconium aspiration: Findings may include coarse irregular or nodular pulmonary densities, areas of diminished aeration or consolidation alternating with area of hyperinflation, or generalized hyperinflation.
e. Absence of culture proven early onset bacterial sepsis or pneumonia (i.e. negative blood culture within 72 hours of birth).
Originating in the perinatal period (as diagnosed
clinically by pink or red frothy liquid draining from
mouth or arising from the trachea between the vocal
cord or suctioned through the endotracheal tube.
Diagnosis may also made on autopsy finding of
haemorrhage in the lungs).
Infection of the lungs acquired prepartum,
intrapartum, at birth or after birth. (Diagnosed with
/ without cultures). Diagnosis made clinically and
supported by CXR findings.
Benign disease of near-term, term or large premature infants with respiratory distress shortly after delivery resolving within 3 days.
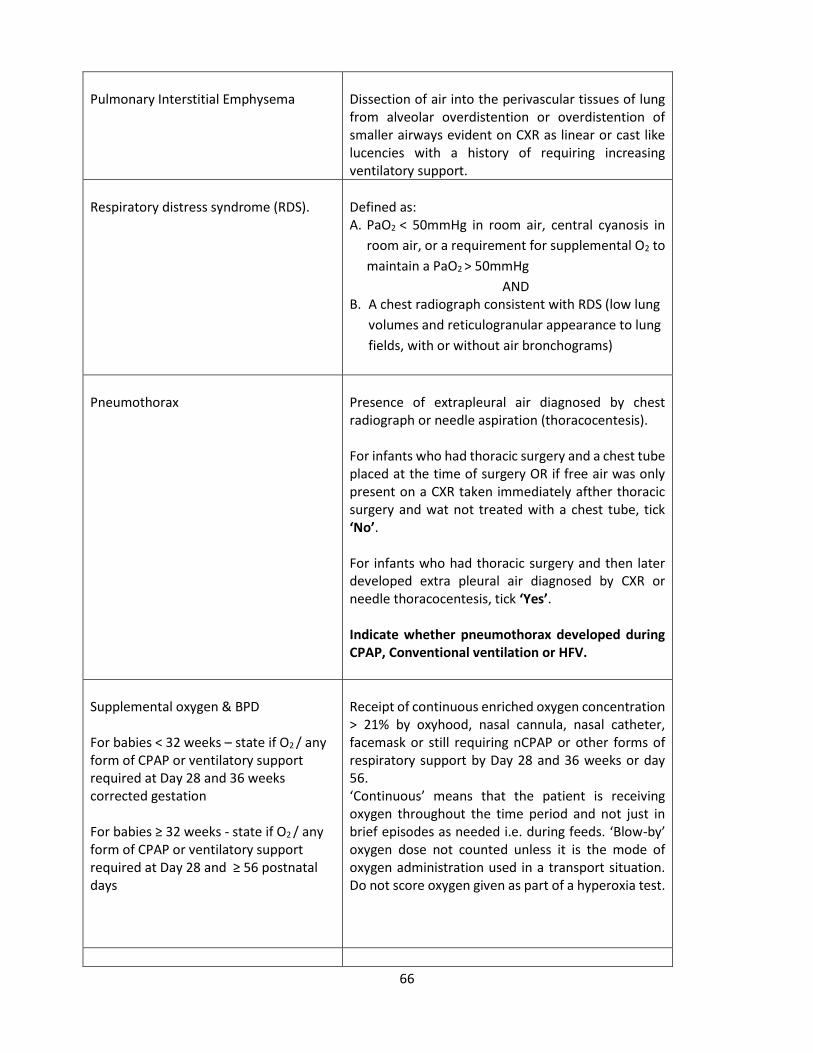
66
Pulmonary Interstitial Emphysema
Dissection of air into the perivascular tissues of lung from alveolar overdistention or overdistention of smaller airways evident on CXR as linear or cast like lucencies with a history of requiring increasing ventilatory support.
Respiratory distress syndrome (RDS).
Defined as: A. PaO2 < 50mmHg in room air, central cyanosis in
room air, or a requirement for supplemental O2 to
maintain a PaO2 > 50mmHg
AND B. A chest radiograph consistent with RDS (low lung
volumes and reticulogranular appearance to lung
fields, with or without air bronchograms)
Pneumothorax
Presence of extrapleural air diagnosed by chest radiograph or needle aspiration (thoracocentesis). For infants who had thoracic surgery and a chest tube placed at the time of surgery OR if free air was only present on a CXR taken immediately afther thoracic surgery and wat not treated with a chest tube, tick ‘No’. For infants who had thoracic surgery and then later developed extra pleural air diagnosed by CXR or needle thoracocentesis, tick ‘Yes’. Indicate whether pneumothorax developed during CPAP, Conventional ventilation or HFV.
Supplemental oxygen & BPD For babies < 32 weeks – state if O2 / any form of CPAP or ventilatory support required at Day 28 and 36 weeks corrected gestation For babies ≥ 32 weeks - state if O2 / any form of CPAP or ventilatory support required at Day 28 and ≥ 56 postnatal days
Receipt of continuous enriched oxygen concentration > 21% by oxyhood, nasal cannula, nasal catheter, facemask or still requiring nCPAP or other forms of respiratory support by Day 28 and 36 weeks or day 56. ‘Continuous’ means that the patient is receiving oxygen throughout the time period and not just in brief episodes as needed i.e. during feeds. ‘Blow-by’ oxygen dose not counted unless it is the mode of oxygen administration used in a transport situation. Do not score oxygen given as part of a hyperoxia test.
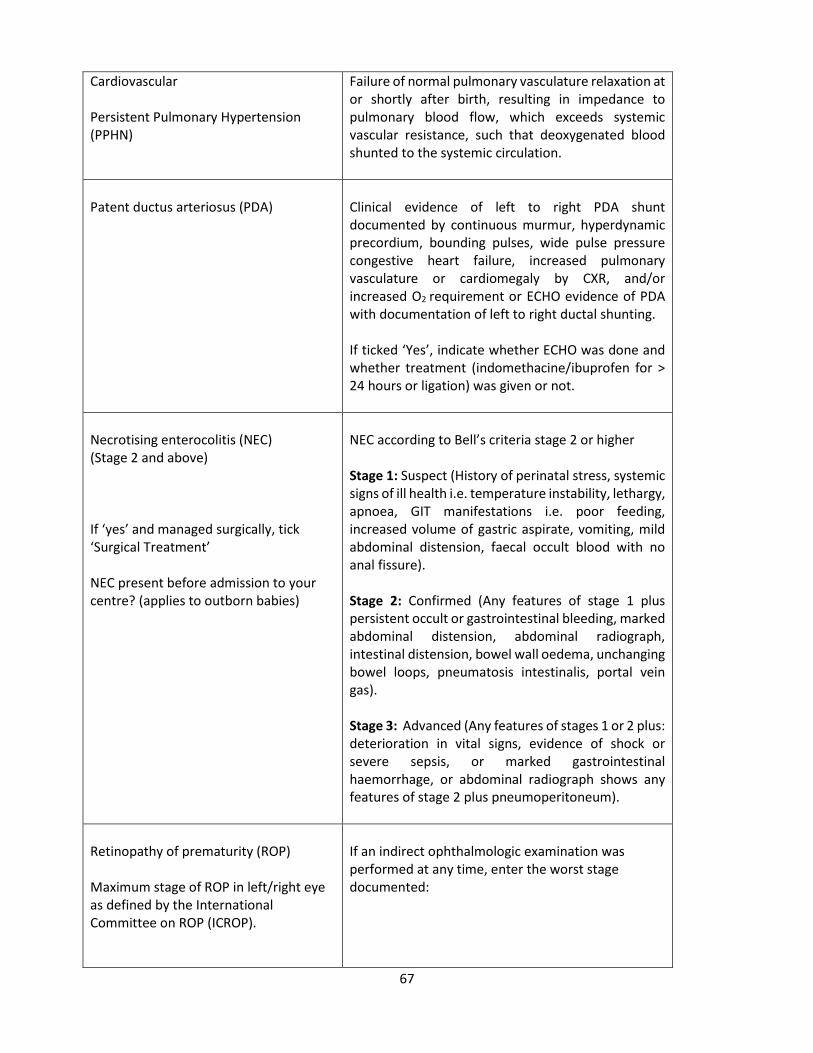
67
Cardiovascular Persistent Pulmonary Hypertension (PPHN)
Failure of normal pulmonary vasculature relaxation at or shortly after birth, resulting in impedance to pulmonary blood flow, which exceeds systemic vascular resistance, such that deoxygenated blood shunted to the systemic circulation.
Patent ductus arteriosus (PDA)
Clinical evidence of left to right PDA shunt documented by continuous murmur, hyperdynamic precordium, bounding pulses, wide pulse pressure congestive heart failure, increased pulmonary vasculature or cardiomegaly by CXR, and/or increased O2 requirement or ECHO evidence of PDA with documentation of left to right ductal shunting. If ticked ‘Yes’, indicate whether ECHO was done and whether treatment (indomethacine/ibuprofen for > 24 hours or ligation) was given or not.
Necrotising enterocolitis (NEC) (Stage 2 and above) If ‘yes’ and managed surgically, tick ‘Surgical Treatment’ NEC present before admission to your centre? (applies to outborn babies)
NEC according to Bell’s criteria stage 2 or higher Stage 1: Suspect (History of perinatal stress, systemic signs of ill health i.e. temperature instability, lethargy, apnoea, GIT manifestations i.e. poor feeding, increased volume of gastric aspirate, vomiting, mild abdominal distension, faecal occult blood with no anal fissure). Stage 2: Confirmed (Any features of stage 1 plus persistent occult or gastrointestinal bleeding, marked abdominal distension, abdominal radiograph, intestinal distension, bowel wall oedema, unchanging bowel loops, pneumatosis intestinalis, portal vein gas). Stage 3: Advanced (Any features of stages 1 or 2 plus: deterioration in vital signs, evidence of shock or severe sepsis, or marked gastrointestinal haemorrhage, or abdominal radiograph shows any features of stage 2 plus pneumoperitoneum).
Retinopathy of prematurity (ROP) Maximum stage of ROP in left/right eye as defined by the International Committee on ROP (ICROP).
If an indirect ophthalmologic examination was performed at any time, enter the worst stage documented:
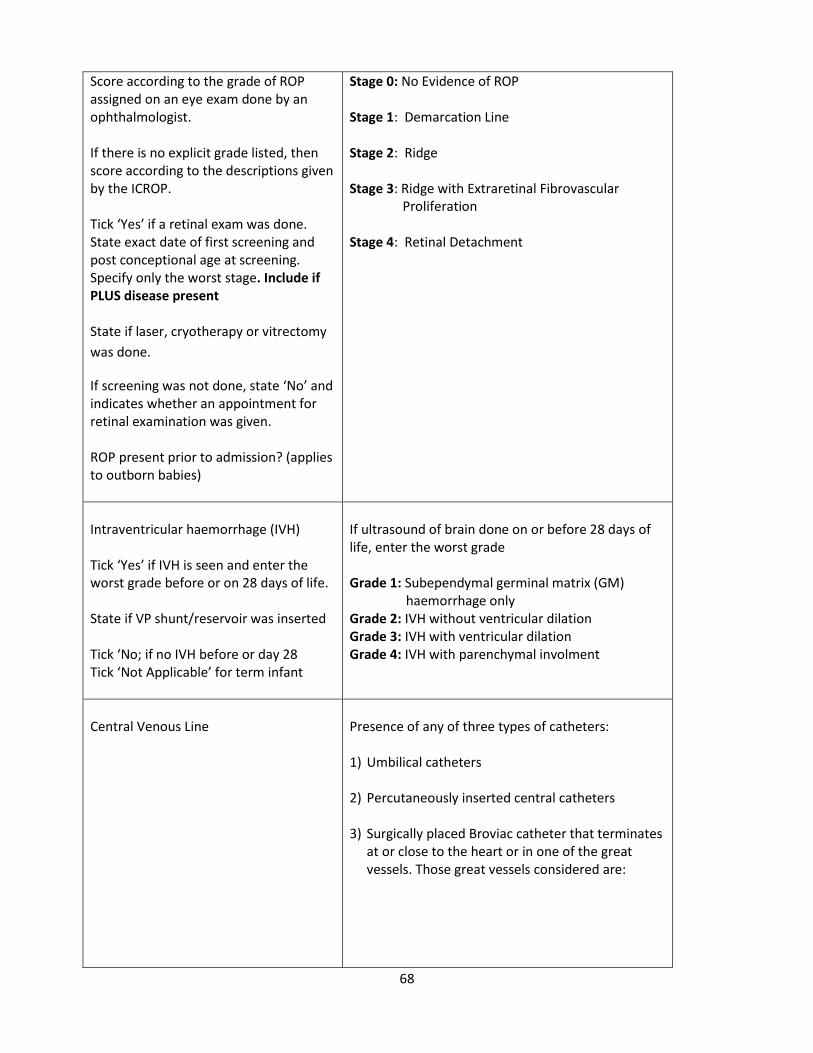
68
Score according to the grade of ROP assigned on an eye exam done by an ophthalmologist. If there is no explicit grade listed, then score according to the descriptions given by the ICROP. Tick ‘Yes’ if a retinal exam was done. State exact date of first screening and post conceptional age at screening. Specify only the worst stage. Include if PLUS disease present State if laser, cryotherapy or vitrectomy
was done.
If screening was not done, state ‘No’ and indicates whether an appointment for retinal examination was given. ROP present prior to admission? (applies to outborn babies)
Stage 0: No Evidence of ROP Stage 1: Demarcation Line Stage 2: Ridge Stage 3: Ridge with Extraretinal Fibrovascular Proliferation Stage 4: Retinal Detachment
Intraventricular haemorrhage (IVH) Tick ‘Yes’ if IVH is seen and enter the worst grade before or on 28 days of life. State if VP shunt/reservoir was inserted Tick ‘No; if no IVH before or day 28 Tick ‘Not Applicable’ for term infant
If ultrasound of brain done on or before 28 days of life, enter the worst grade Grade 1: Subependymal germinal matrix (GM) haemorrhage only Grade 2: IVH without ventricular dilation Grade 3: IVH with ventricular dilation Grade 4: IVH with parenchymal involment
Central Venous Line
Presence of any of three types of catheters: 1) Umbilical catheters
2) Percutaneously inserted central catheters 3) Surgically placed Broviac catheter that terminates
at or close to the heart or in one of the great vessels. Those great vessels considered are:
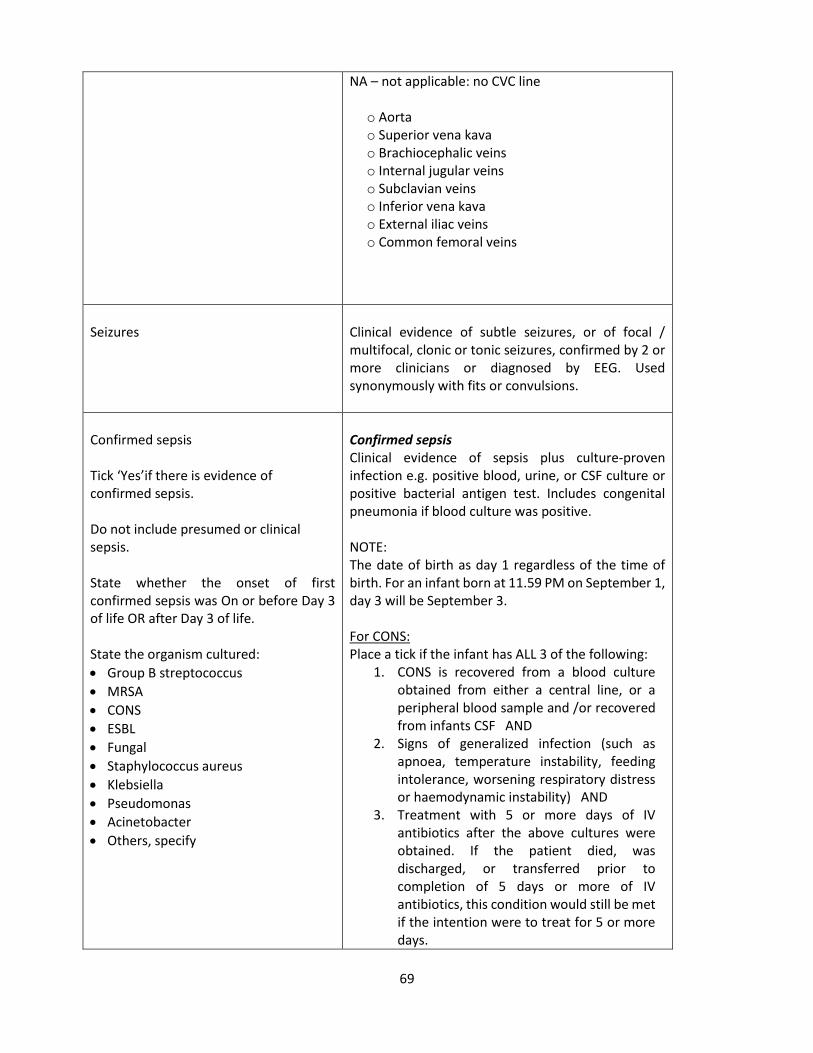
69
NA – not applicable: no CVC line o Aorta o Superior vena kava o Brachiocephalic veins o Internal jugular veins o Subclavian veins o Inferior vena kava o External iliac veins o Common femoral veins
Seizures
Clinical evidence of subtle seizures, or of focal / multifocal, clonic or tonic seizures, confirmed by 2 or more clinicians or diagnosed by EEG. Used synonymously with fits or convulsions.
Confirmed sepsis Tick ‘Yes’if there is evidence of confirmed sepsis. Do not include presumed or clinical sepsis. State whether the onset of first confirmed sepsis was On or before Day 3 of life OR after Day 3 of life. State the organism cultured:
Group B streptococcus
MRSA
CONS
ESBL
Fungal
Staphylococcus aureus
Klebsiella
Pseudomonas
Acinetobacter
Others, specify
Confirmed sepsis Clinical evidence of sepsis plus culture-proven infection e.g. positive blood, urine, or CSF culture or positive bacterial antigen test. Includes congenital pneumonia if blood culture was positive. NOTE: The date of birth as day 1 regardless of the time of birth. For an infant born at 11.59 PM on September 1, day 3 will be September 3. For CONS: Place a tick if the infant has ALL 3 of the following:
1. CONS is recovered from a blood culture obtained from either a central line, or a peripheral blood sample and /or recovered from infants CSF AND
2. Signs of generalized infection (such as apnoea, temperature instability, feeding intolerance, worsening respiratory distress or haemodynamic instability) AND
3. Treatment with 5 or more days of IV antibiotics after the above cultures were obtained. If the patient died, was discharged, or transferred prior to completion of 5 days or more of IV antibiotics, this condition would still be met if the intention were to treat for 5 or more days.
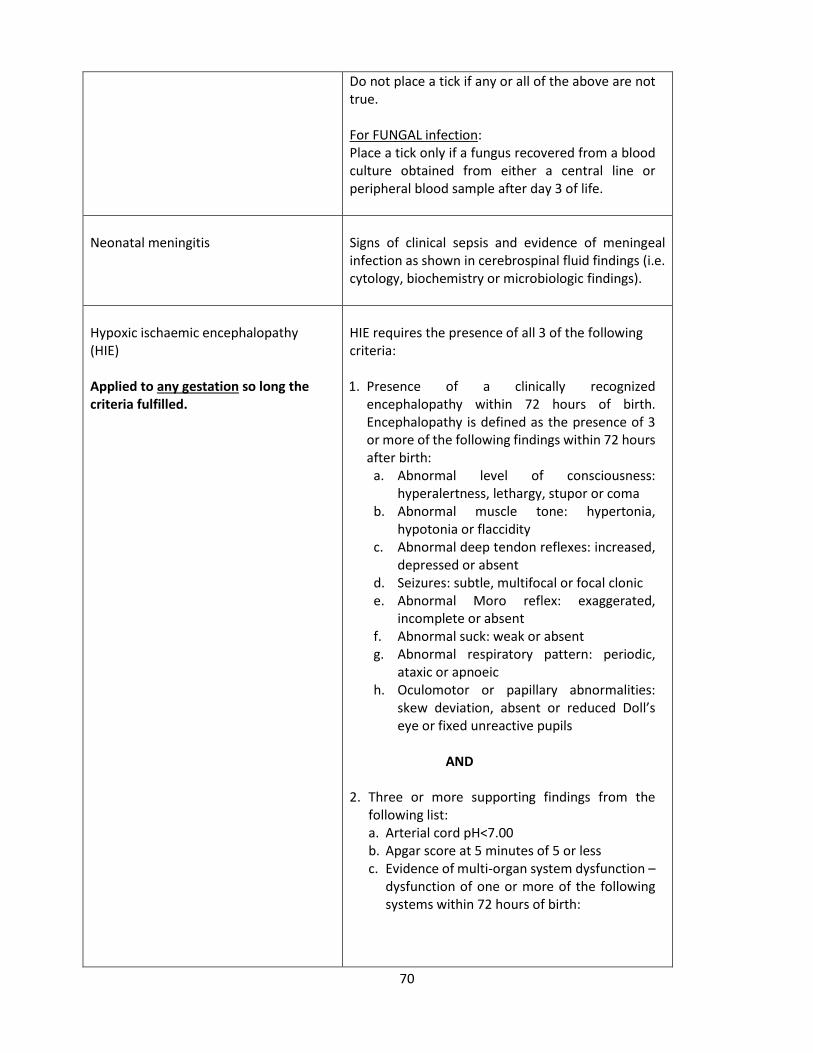
70
Do not place a tick if any or all of the above are not true.
For FUNGAL infection: Place a tick only if a fungus recovered from a blood culture obtained from either a central line or peripheral blood sample after day 3 of life.
Neonatal meningitis
Signs of clinical sepsis and evidence of meningeal infection as shown in cerebrospinal fluid findings (i.e. cytology, biochemistry or microbiologic findings).
Hypoxic ischaemic encephalopathy (HIE) Applied to any gestation so long the criteria fulfilled.
HIE requires the presence of all 3 of the following criteria: 1. Presence of a clinically recognized
encephalopathy within 72 hours of birth. Encephalopathy is defined as the presence of 3 or more of the following findings within 72 hours after birth:
a. Abnormal level of consciousness: hyperalertness, lethargy, stupor or coma
b. Abnormal muscle tone: hypertonia, hypotonia or flaccidity
c. Abnormal deep tendon reflexes: increased, depressed or absent
d. Seizures: subtle, multifocal or focal clonic e. Abnormal Moro reflex: exaggerated,
incomplete or absent f. Abnormal suck: weak or absent g. Abnormal respiratory pattern: periodic,
ataxic or apnoeic h. Oculomotor or papillary abnormalities:
skew deviation, absent or reduced Doll’s eye or fixed unreactive pupils
AND 2. Three or more supporting findings from the
following list: a. Arterial cord pH<7.00 b. Apgar score at 5 minutes of 5 or less c. Evidence of multi-organ system dysfunction –
dysfunction of one or more of the following systems within 72 hours of birth:
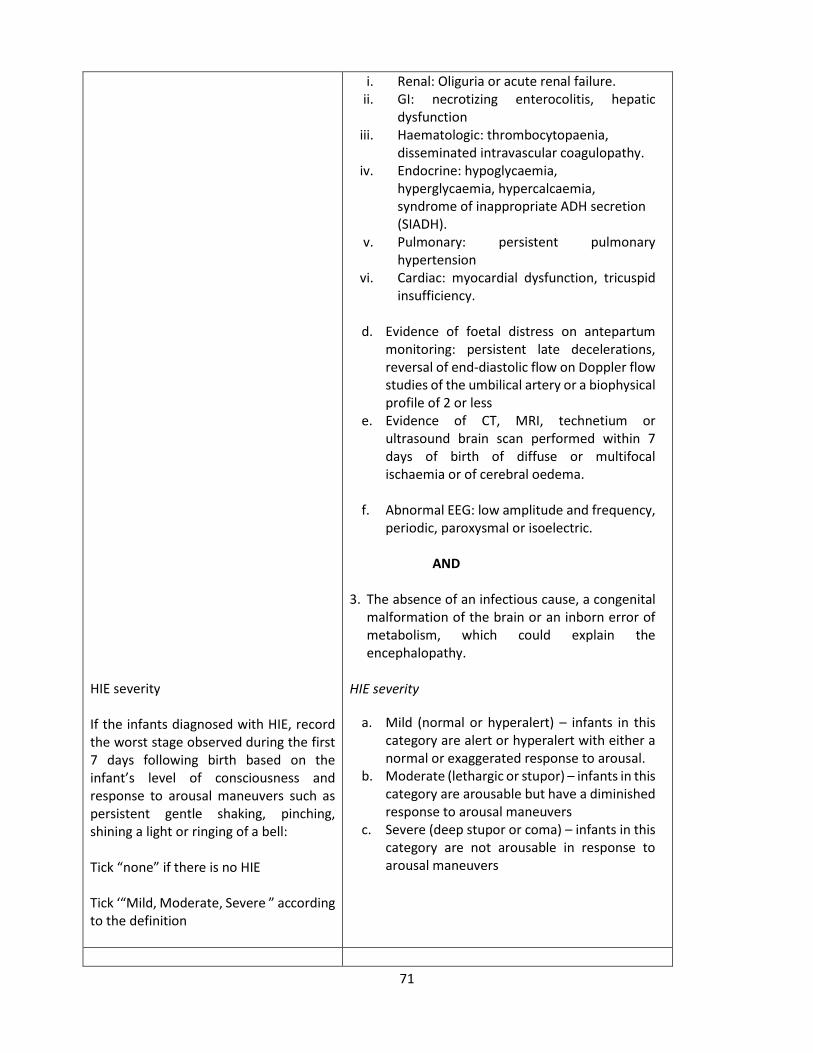
71
HIE severity If the infants diagnosed with HIE, record the worst stage observed during the first 7 days following birth based on the infant’s level of consciousness and response to arousal maneuvers such as persistent gentle shaking, pinching, shining a light or ringing of a bell: Tick “none” if there is no HIE Tick ‘“Mild, Moderate, Severe ” according to the definition
i. Renal: Oliguria or acute renal failure. ii. GI: necrotizing enterocolitis, hepatic
dysfunction iii. Haematologic: thrombocytopaenia,
disseminated intravascular coagulopathy. iv. Endocrine: hypoglycaemia,
hyperglycaemia, hypercalcaemia, syndrome of inappropriate ADH secretion (SIADH).
v. Pulmonary: persistent pulmonary hypertension
vi. Cardiac: myocardial dysfunction, tricuspid insufficiency.
d. Evidence of foetal distress on antepartum monitoring: persistent late decelerations, reversal of end-diastolic flow on Doppler flow studies of the umbilical artery or a biophysical profile of 2 or less
e. Evidence of CT, MRI, technetium or ultrasound brain scan performed within 7 days of birth of diffuse or multifocal ischaemia or of cerebral oedema.
f. Abnormal EEG: low amplitude and frequency, periodic, paroxysmal or isoelectric.
AND 3. The absence of an infectious cause, a congenital
malformation of the brain or an inborn error of metabolism, which could explain the encephalopathy.
HIE severity
a. Mild (normal or hyperalert) – infants in this category are alert or hyperalert with either a normal or exaggerated response to arousal.
b. Moderate (lethargic or stupor) – infants in this category are arousable but have a diminished response to arousal maneuvers
c. Severe (deep stupor or coma) – infants in this category are not arousable in response to arousal maneuvers
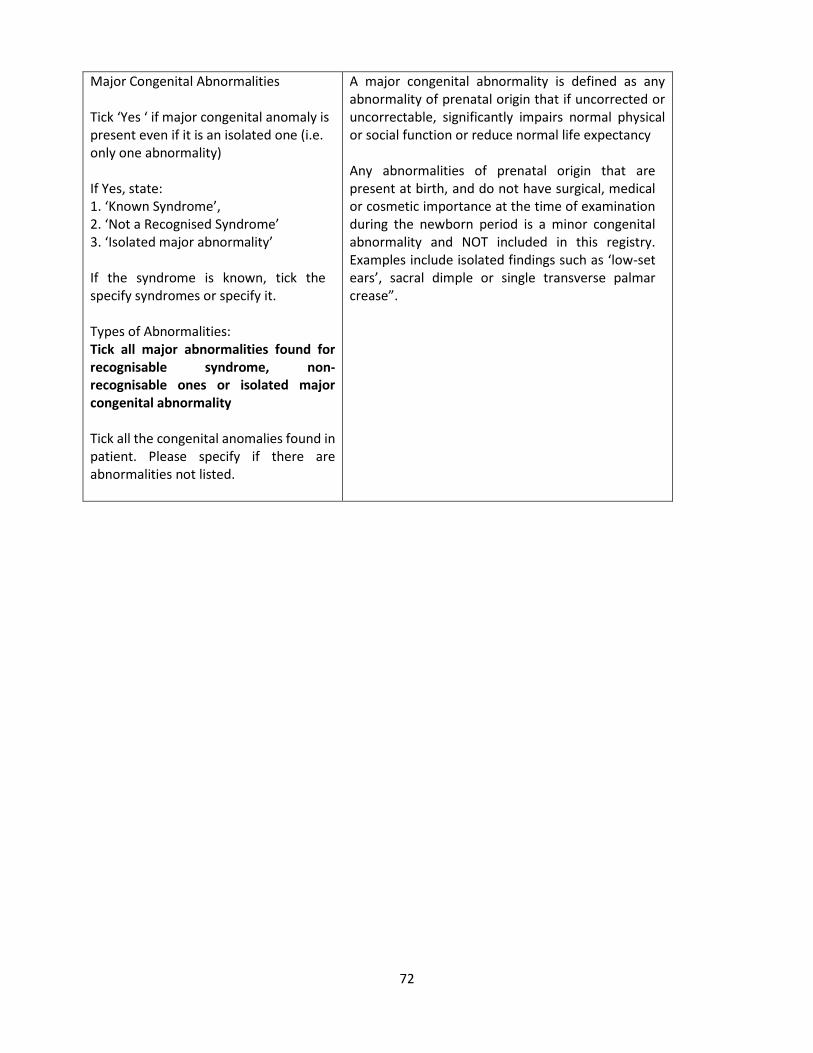
72
Major Congenital Abnormalities Tick ‘Yes ‘ if major congenital anomaly is present even if it is an isolated one (i.e. only one abnormality) If Yes, state: 1. ‘Known Syndrome’, 2. ‘Not a Recognised Syndrome’ 3. ‘Isolated major abnormality’ If the syndrome is known, tick the specify syndromes or specify it. Types of Abnormalities: Tick all major abnormalities found for recognisable syndrome, non-recognisable ones or isolated major congenital abnormality Tick all the congenital anomalies found in patient. Please specify if there are abnormalities not listed.
A major congenital abnormality is defined as any abnormality of prenatal origin that if uncorrected or uncorrectable, significantly impairs normal physical or social function or reduce normal life expectancy Any abnormalities of prenatal origin that are present at birth, and do not have surgical, medical or cosmetic importance at the time of examination during the newborn period is a minor congenital abnormality and NOT included in this registry. Examples include isolated findings such as ‘low-set ears’, sacral dimple or single transverse palmar crease”.
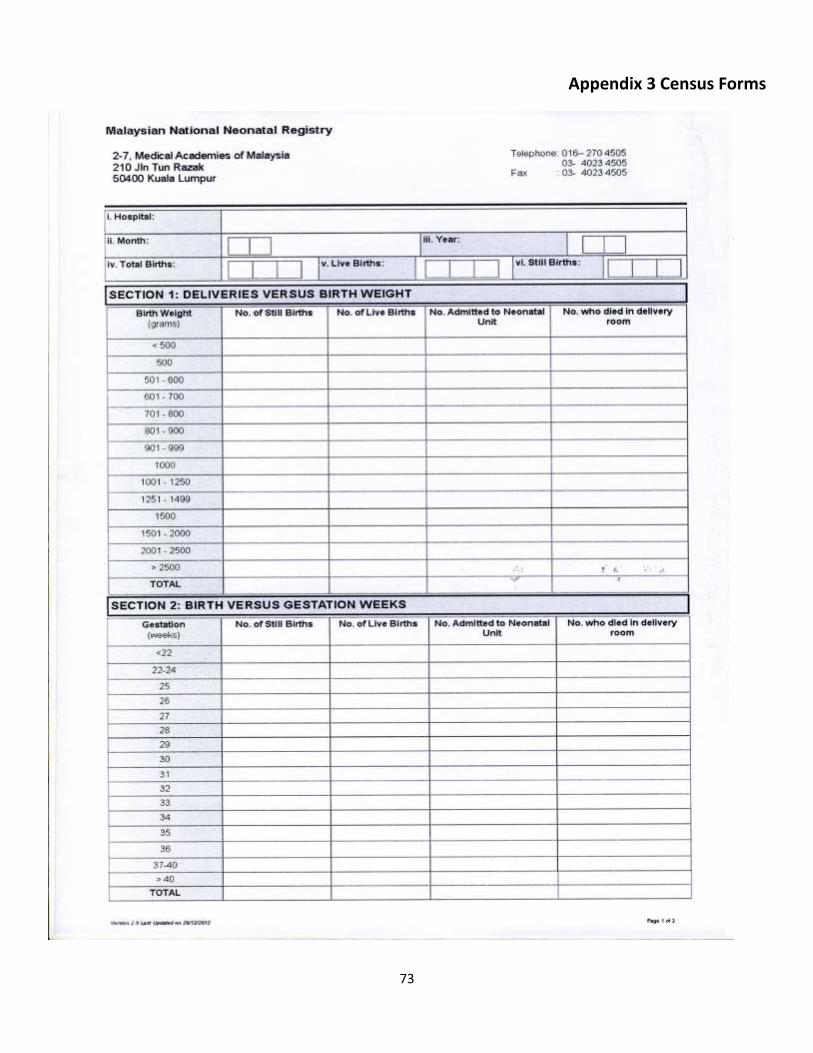
73
Appendix 3 Census Forms
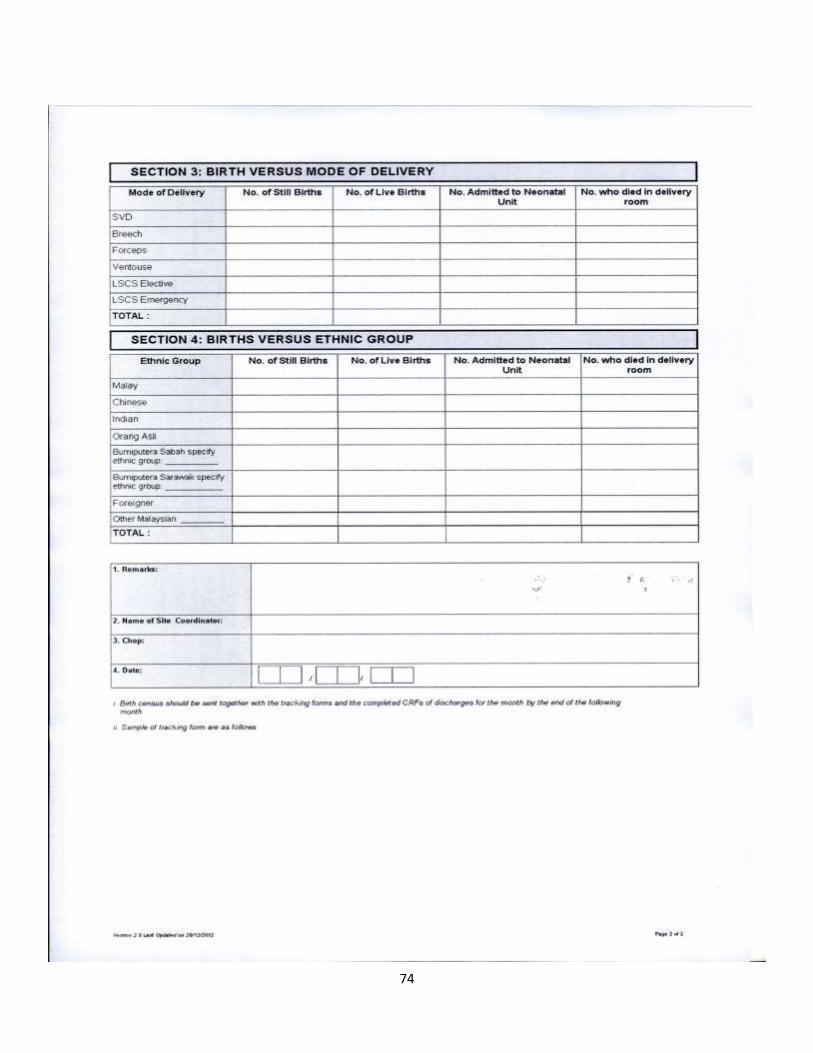
74
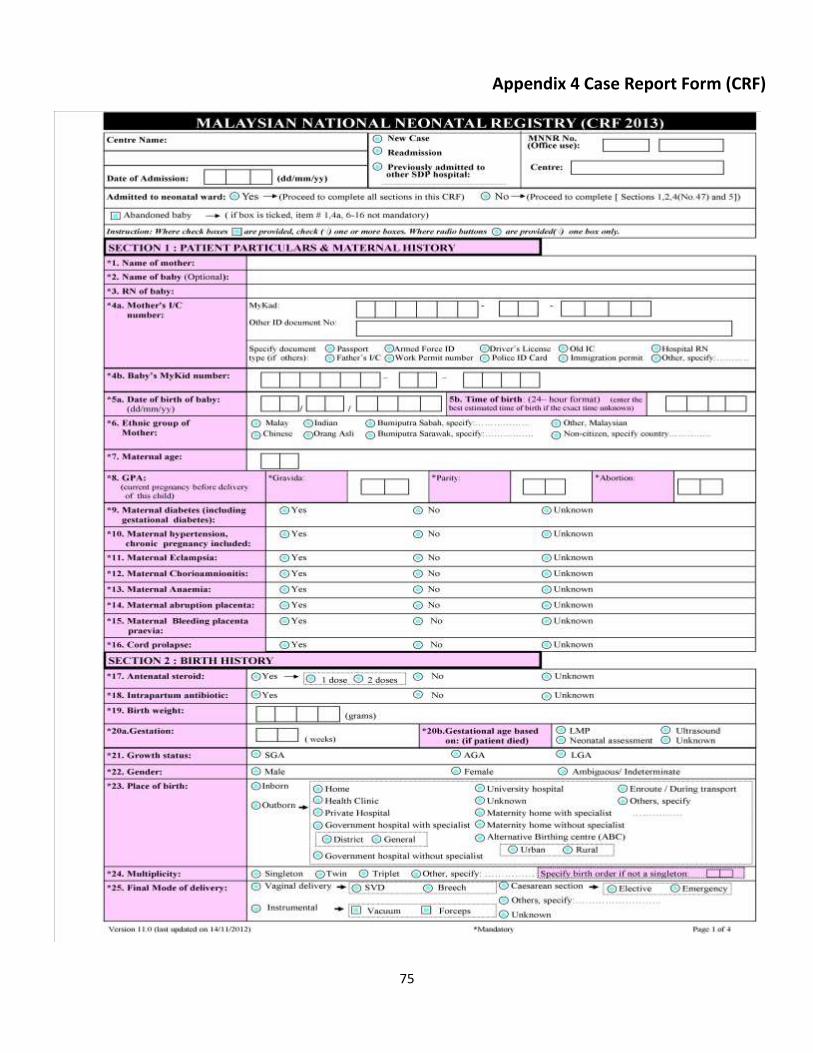
75
Appendix 4 Case Report Form (CRF)
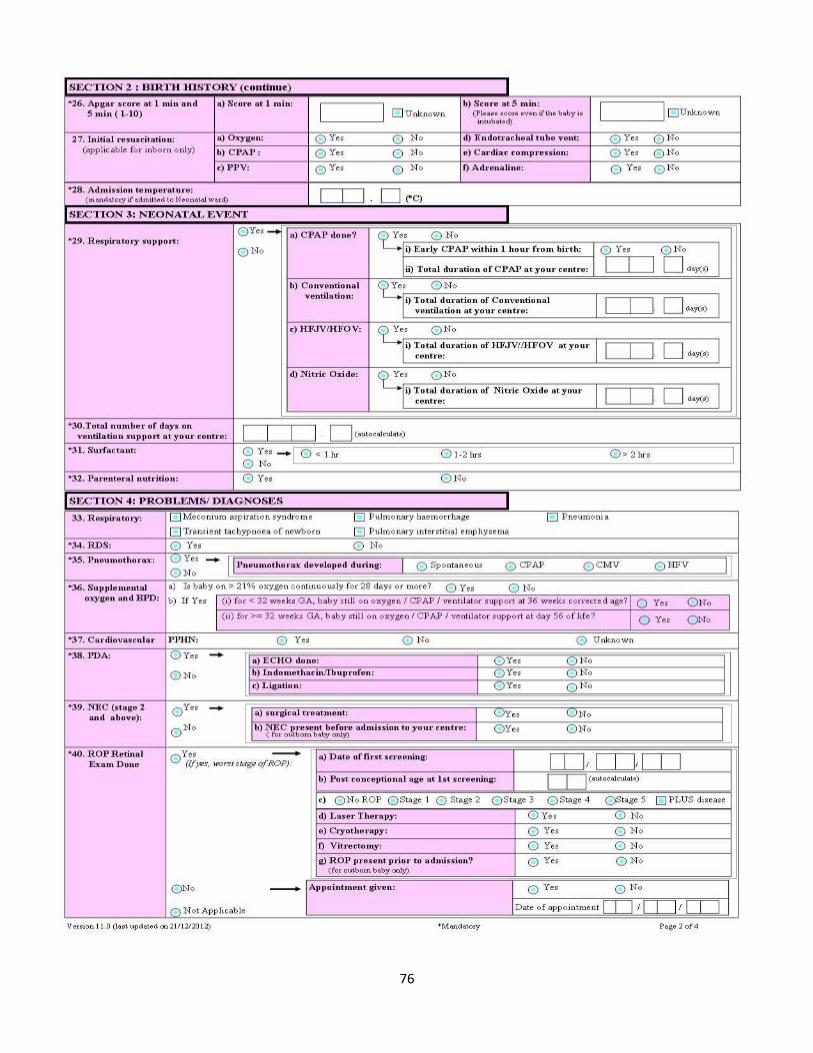
76
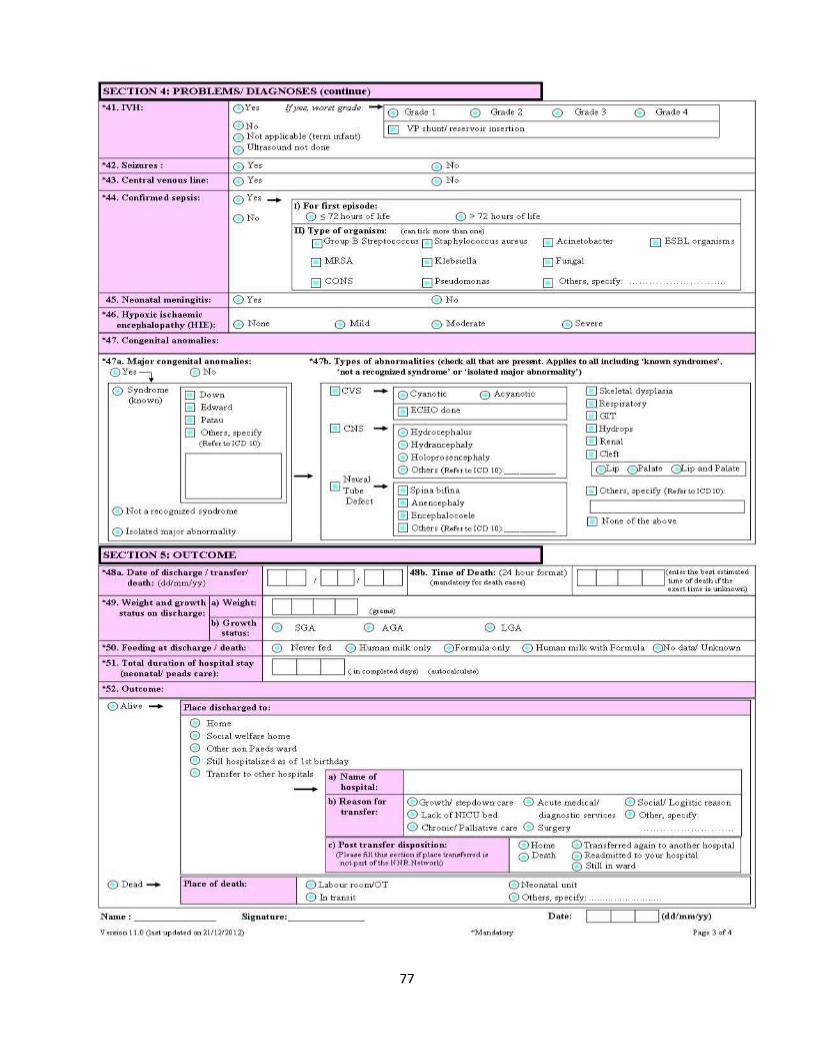
77
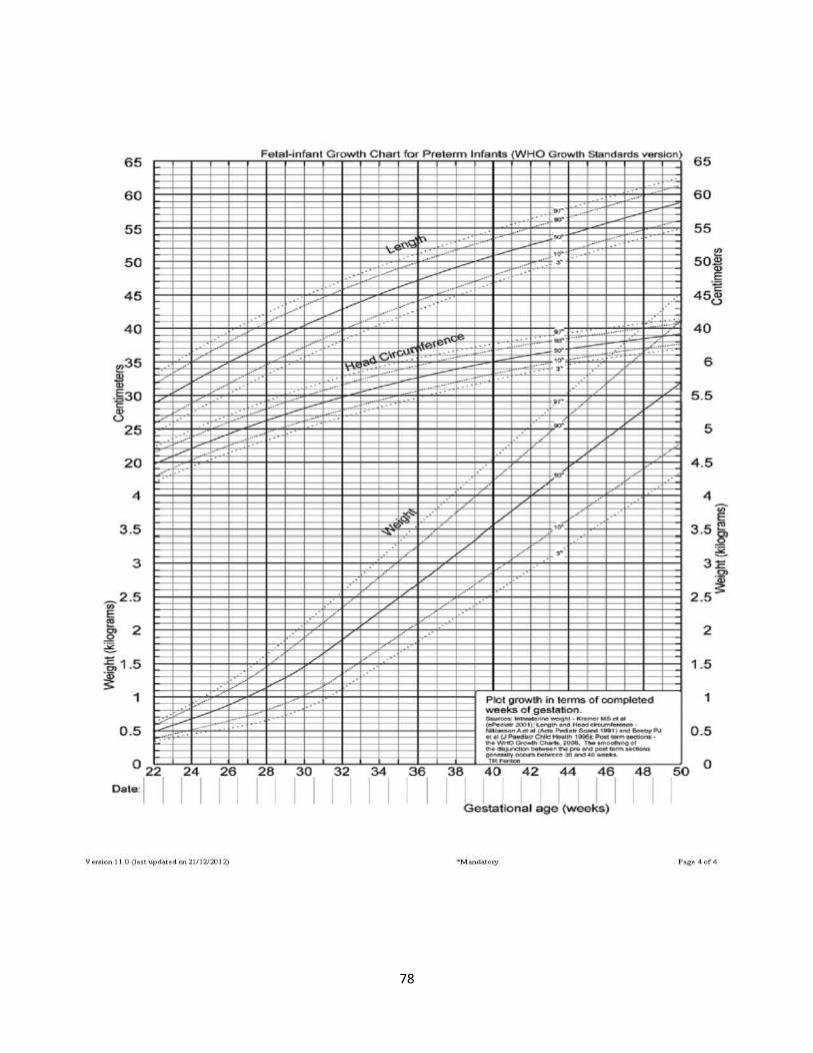
78
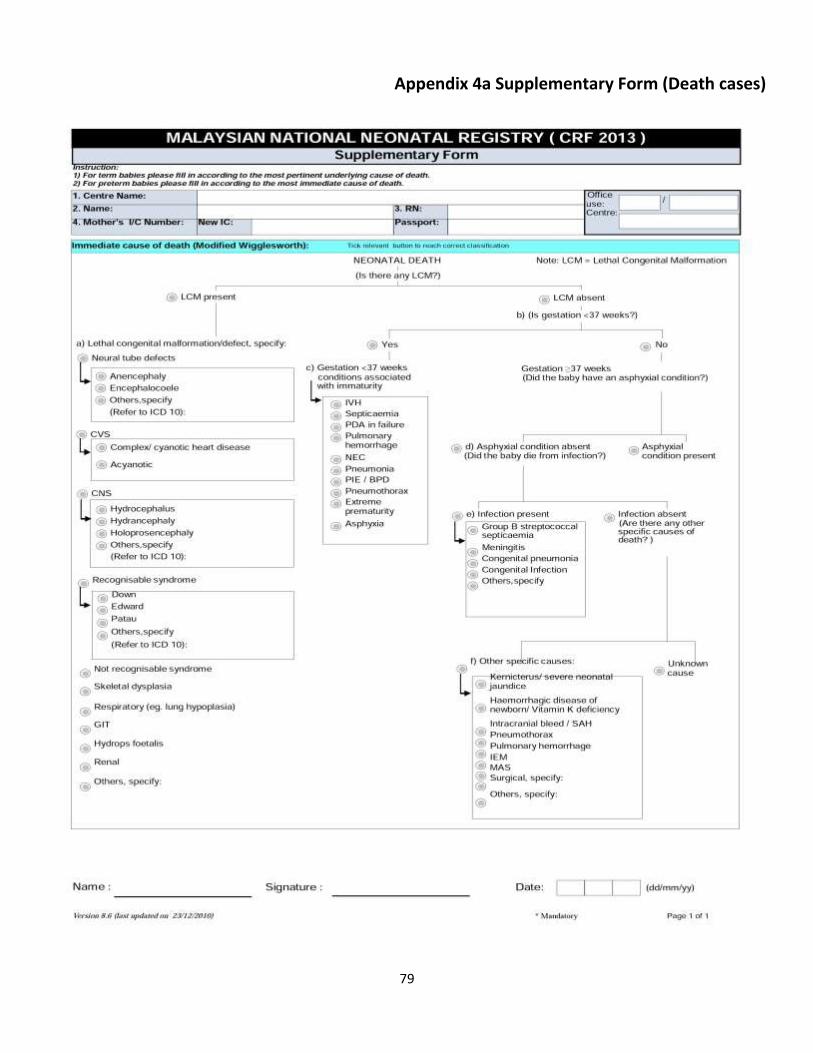
79
Appendix 4a Supplementary Form (Death cases)
80
Appendix 5 Presentations
POSTER, ABSTRACT AND PAPER PRESENTIONS
1. Neoh SH. Survival of VLBW 2013. Presented at the MNNR SDP Meeting, Selayang Hospital, Selangor, Malaysia,
2014
2. Neoh SH. Hypothermic theraphy for HIE. Presented at the MNNR SDP Meeting, Selayang Hospital, Selangor, Malaysia, 2014
3. Boo NY. HIE 2013. Presented at the MNNR SDP Meeting, Selayang Hospital, Selangor, Malaysia, 2014
4. Chee SC. IVH 2013.Presented at the MNNR SDP Meeting, Selayang Hospital, Selangor, Malaysia, 2014
5. Lee JKF. MAS and pneumothorax 2013. Presented at the MNNR SDP Meeting, Selayang Hospital, Selangor, Malaysia, 2014
6. Teh SH. Hypothermia 2013. Presented at the MNNR SDP Meeting, Selayang Hospital, Selangor, Malaysia, 2013
7. Cheah IGS. Congenital anomalies 2013. Presented at the MNNR SDP Meeting, Selayang Hospital, Selangor, Malaysia, 2014
8. Soo TL. Confirmed sepsis 2013. Presented at the MNNR SDP Meeting, Selayang Hospital, Selangor, Malaysia, 2014
9. Chin CY. NEC 2013. Presented at the MNNR SDP Meeting, Selayang Hospital, Selangor, Malaysia, 2014