REPORT OF THE BOARD OF DIRECTORS AND FINANCIAL 2015 … · Kronans Apotek Lindhagensgatan 120, 7...
85
REPORT OF THE BOARD OF DIRECTORS AND FINANCIAL STATEMENTS 2015
Transcript of REPORT OF THE BOARD OF DIRECTORS AND FINANCIAL 2015 … · Kronans Apotek Lindhagensgatan 120, 7...

ORIO ORPORATIONOrionintie 5, P.O Box 8
FI-02101 Espoowww.oriola-kd.com
12
REPORT OF THE BOARD OF DIRECTORS AND
FINANCIAL STATEMENTS
2015
Kronans ApotekLindhagensgatan 120, 7 floor, S-104 25 Stockholm, SwedenP.O.Box 30094Tel.+ 46 10 240 60 [email protected] information of the Kronans Apotek pharmacies in www.kdapotek.se
Oriola Oy, EspooOrionintie 5, FI-02200 Espoo, FinlandP.O.Box 8, FI-02101 Espoo, FinlandTel. +358 10 429 99Fax +358 10 429 [email protected]
Oriola Oy, OuluIskontie 3, FI-90570 Oulu, FinlandP.O.Box 51, FI-90101 Oulu, FinlandTel. +358 10 42 999Fax +358 10 429 [email protected]
AS Oriola, EstoniaTammsaare tee 47, EST-11316 Tallinn, Estonia Kungla 2, EST-76505 Saue, Harjumaa, Estonia (warehouse)Tel. +372 6 515 100Fax +372 6 515 [email protected]
SIA Oriola Riga, LatviaDzelzavas iela 120 M, LV-1021 Riga, LatviaTel. +371 67 802 450Fax + 371 67 802 [email protected]
UAB Oriola Vilnius, LithuaniaLaisves pr. 75, LT-06144 Vilnius, LithuaniaTel. +370 5 2688 401Fax +370 5 2688 [email protected]
Oriola AB, MölnlyckeFibervägen SolstenP.O.Box 252, S-43525, Mölnlycke, SwedenTel. +46 31 887 000Fax +46 31 338 [email protected]
Oriola-KD CorporationOrionintie 5, FI-02200 Espoo, FinlandP.O.Box 8, FI-02101 Espoo, FinlandTel. +358 10 429 99Fax +358 10 429 [email protected]
Oriola AB, EnköpingKvartsgatan 7 P.O.Box 900, S-74525 Enköping, SwedenTel. +46 171 41 49 00Fax +46 171 41 49 [email protected]
Oriola AB, StockholmSlöjdgatan 9P.O.Box 7532, S-10393 Stockholm, SwedenTel. +46 8 402 38 [email protected]
Contact informationInformation for Shareholders
Analysts following Oriola-KD
The banks and investment service companies listed below have published investment reports on the Oriola-KD Corporation. The analysts’ contact details are listed on the Oriola-Kd website.
Carnegie Investment BankDanske MarketsEnskilda Equity ResearchEvli Pankki PlcInderes LtdHandelsbanken Capital MarketsNordea MarketsPohjola Bank Plc
Annual General Meeting 2016
The 2016 Annual General Meeting of shareholders of Oriola-KD Corporation will be held on Monday, 14 March 2016 at 2 pm at the Helsinki Exhibition and Convention Centre, address Helsinki Exhibition and Convention Centre, Conference Wing, Rautatieläisenkatu 3, 00520 Helsinki, Finland. The notice to convene is available on the company’s web site at www.oriola-kd.com and it will be published in Helsingin sanomat on 19 February 2016.
Shareholders register and insider register
The company’s shareholder register as well as the insider re-gister are available at Euroclear Finland Ltd at the following address:
Euroclear Finland LtdUrho Kekkosen katu 5 C00100 Helsinki, Finland
The shareholders are requested to make their change of address to the Account Operator who attends to the shareholder’s book-entry account.

Year 2015 Year 2015
Content
4 Report of the Board of Directors
12 Consolidated Statement of Comprehensive Income (IFRS)
13 Consolidated Statement of Financial Position (IFRS)
14 Consolidated Statement of Cash Flows (IFRS)
15 Consolidated Statement of Changes in Equity
16 Notes to the Consolidated Financial Statements
51 Key Financial Figures
52 Share-Related Key Figures
53 Calculation of Key Ratios
54 Parent Company Income Statement (FAS)
55 Parent Company Balance Sheet (FAS)
57 Parent Company Cash Flow Statement (FAS)
58 Notes to the Parent Company Financial Statements (FAS)
66 Shares and Shareholders
68 Proposal for Profit Distribution, Signatures for the Board of Directors’ Report and the Financial Statements and Auditor’s Note
69 Auditors’ Report
70 Corporate Governance Statement 2015
79 Members of the Board of Directors 2015-2016
81 Group Management Team 2015
83 Stock Exchange Releases in 2015
84 Contact Information
Oriola-KD provides an effective and reliable link between pharmaceutical companies and consum-ers in Sweden, Finland, Estonia, Latvia and Lithuania. Oriola-KD provides pharmaceutical companies an effective access to markets and improves consumers’ wellbeing by ensuring that pharmaceu-ticals, health products and services are delivered in a safe and customer-friendly manner. In 2015, Oriola-KD’s net sales were approximately EUR 1.6 billion and the number of the personnel was 2.353.
Oriola-KD is listed on NASDAQ Helsinki Ltd. For more information, visit www.oriola-kd.com.

4
Year 2015Report of the Board of Directors
Report of the Board of Directors
Year 2015 was successful for Oriola-KD Group (hereinafter Oriola-KD) and the company managed to grow the volumes especially in the wholesale business despite of the slow growth in the market.
Oriola-KD was able to further increase the margin of OTC medi-cines and the sales and margin of traded goods in the Swedish retail business. Operating profit in euros remained at the level of previous year, due to above all price cuts in the generics and unfavourable development of the Swedish Krona. The combined effect resulted in a significant decline in parallel imports from the previous year.
The business volume in the Swedish wholesale increased signifi-cantly which also resulted in an improved profitability compared to previous year. In Finland Oriola-KD renewed important, multi-annual pharmaceutical company agreements and improved efficiency. As a result of a successful rights-issue and strong cash flow the balance sheet strengthened significantly.
Oriola-KD renewed its strategy and operating model in the second half of the year 2015 and signed an agreement to acquire Svensk Dos, a Swedish company specialising in dose dispensing of pharma-ceuticals.
The financial statements have been prepared in accordance with the International Financial Reporting Standards (IFRS). These finan-
cial statements comprise of the continuing operations of the Com-pany unless otherwise stated. The results for the Russian businesses sold in December 2014 are presented as discontinued operations separately from the results from continuing operations. The con-solidated statement of cash flows for the comparative period 2014 includes net cash flow of discontinued operations.
Changes in the Group Structure in 2015The following subsidiary mergers have been completed during the final quarter of 2015 in order to simplify Oriola-KD Group structure: SIA Rigas Elizabetes aptieka merged into SIA Panpharmacy, Aloiro AB merged into Oriola Oy, Oriola-KD Holding Sverige AB merged into Oriola-KD Holding Oy after which Oriola-KD Holding Oy merged into Oriola-KD Oyj.
Oriola-KD agreed on 2 December 2015 to acquire the shares in Svensk Dos AB. Svensk Dos is a Swedish pharmacy company spe-cialised in dose dispensing of pharmaceuticals. In 2014, the net sales of Svensk dos were approximately EUR 25 million and estimated market share was 13 per cent. Svensk dos has approximately 60 employees and is based in Uppsala.
Oriola-KD’s net sales and result Oriola-KD’s net sales increased by 0.9 (decreased by 0.5) per cent to EUR 1,626.3 (1,612.3) million and operating profit excluding non-recurring items increased by 3.0 (59.5) per cent to EUR 60.8 (59.1) mil-lion. Operating profit was EUR 62.6 (65.0) million. Operating profit in 2015 increased due to a non-recurring revaluation of the contingent consideration for Medstop acquisition of EUR 3.4 million and in 2014
due to non-recurring gain of EUR 7.5 million resulting from a sale-and-leaseback transaction of the Mölnlycke warehouse property.
The depreciation of the Swedish Krona from the corresponding period negatively affected the euro denominated operating profit by approximately EUR 1.2 million.
Profit after financial items was EUR 56.1 (57.1) million and profit for the period was EUR 44.5 (46.5) million. Oriola-KD’s net financial
Key Figures 2015 2014 1)
Goodwill, EUR million 256.5 250.9
Equity, EUR million 1) 194.6 111.5
Interest-bearing debt, EUR million 128.6 193.9
Net interest-bearing debt, EUR million 6.6 102.4
Total assets, EUR million 946.9 874.0
Equity ratio, % 1) 21.1 13.1
Return on equity (ROE), % 1) 29.1 23.9
Return on capital employed (ROCE), % 19.9 14.4
Gearing, % 1) 3.4 91.8
Net debt / 12-month EBITDA from continuing operations 0.1 1.2
Equity per share, EUR 1.07 0.69
Earnings per share, continuing operations, EUR 2) 0.25 0.28
Earnings per share, incl. discontinued operations, EUR 2) 0.25 -1.33
Average number of shares, 1000 pcs 2) 3) 177,502 160,741
Average number of personnel, continuing operations 2,327 2,377
Number of personnel at the end of the period, continuing operations 2,353 2,356
Gross investments, continuing operations, EUR million 20.4 25.71) Equity-related key figures restated as a result of correction of an error relating to previous financial periods. The correction increased the amount of deferred tax liability and decreased the amount of equity by EUR 2.1 million.2) Calculated based on the rights issue -adjusted weighted average number of shares, comparative figures adjusted accordingly.3) Treasury shares held by the company not included.

5
Year 2015 Year 2015Report of the Board of Directors
Pharmaceutical Trade Sweden
Key FiguresEUR million 2015 2014 Change %Invoicing 2,098.5 1,955.1 7.3
Retail business 769.3 757.5 1.6
Wholesale business 1,661.2 1,526.6 8.8
Net Sales 1,190.1 1,176.4 1.2
Retail business 752.8 744.2 1.2
Wholesale business 769.3 761.2 1.1
Operating profit excluding non-recurring items 46.4 44.0 5.6
Retail business 33.9 33.8 0.3
Wholesale business 12.6 10.4 20.9
Operating profit 46.4 50.5 -8.0
Retail business 33.9 32.8 3.4
Wholesale business 12.6 17.9 -29.7
Operating profit % excluding non-recurring items 3.9 3.7
Retail business 4.5 4.5
Wholesale business 1.6 1.4
Operating profit % 3.9 4.3
Retail business 4.5 4.4
Wholesale business 1.6 2.4
Number of personnel at the end of period 1,831 1,792
Retail business 1,555 1,524
Wholesale business 276 268
expenses were EUR 6.5 (7.8) million. Income taxes were 11.5 (10.7) which corresponds to effective tax rate of 20.6 (18.7) per cent. Earn-ings per share for the full year were EUR 0.25 (0.28).
On 25 September 2015 Oriola-KD decided to transfer the manage-ment of its Finnish companies’ statutory occupational pensions and associated pension portfolio from Oriola Pension Fund to Ilmarinen Mutual Pension Insurance Company and supplementary pension benefits and the associated pension portfolio to OP Life Assurance Company Ltd. The transfer took place on 31 December 2015.
Reportable segmentsOriola-KD’s reportable segments are Pharmaceutical Trade Sweden and Pharmaceutical Trade Finland and Baltics. Oriola-KD has formed
its reportable segments by combining its operating segments. The Pharmaceutical Trade Sweden reporting segment comprises the Swedish pharmaceutical retail and Swedish pharmaceutical whole-sale operating segments. The Pharmaceutical Trade Finland and Baltics reporting segment comprises the Finnish pharmaceutical wholesale business, the Consumer Health and the Pharmaceutical Trade Baltics operating segments.
In December 2014 Oriola-KD sold its Russian businesses and as a result classifies the Pharmaceutical Trade Russia reportable segment as discontinued operations.
The pharmaceutical market in Sweden grew by 6.7 (4.2) per cent (source: IMS Health) and the retail market for OTC products and trad-ed goods grew by 7.1 (4.0) per cent (source: Apoteksföreningen) in 2015. Parallel imports’ share of the Swedish pharmaceutical market was 11 (17) per cent (source: IMS Health).
Invoicing, indicating the business volume of the Oriola-KD Phar-maceutical Trade Sweden, grew from the previous year by 10.3 (4.5) per cent in Swedish Krona. Retail volume grew by 4.4 (17.8) per cent and wholesale by 11.9 (6.4) per cent, in Swedish Krona. Oriola-KD’s market share of the pharmaceutical retail market in 2015 was 19 (19) per cent (source: Apoteksföreningen) and the share of the Swedish pharmaceutical wholesale market was approximately 39 (36) per cent (Oriola-KD estimate). Number of pharmacies in Sweden in-creased by 29 pharmacies in 2015 and at the end of December 2015 there were 1,358 pharmacies in Sweden. At the end of the reporting period Oriola-KD had a total of 309 (304) pharmacies in Sweden.
The net sales of Pharmaceutical Trade Sweden in 2015 increased by 1.2 (decreased by 1.5) per cent to EUR 1,190.1 (1,176.4) million, and
on a constant currency basis, net sales increased by 4.0 (3.6) per cent. Retail business net sales were EUR 752.8 (744.2) million and wholesale business net sales totalled EUR 769.3 (761.2) million. On a constant currency basis retail business net sales increased by 4.0 (16.9) per cent and wholesale business net sales increased by 3.9 (7.7) per cent.
The Swedish retail business’ EBITDA excluding non-recurring items in 2015 was EUR 50.2 (49.4) million and EBITDA was EUR 50.2 (48.4) million in 2015. The EBITDA percentage excluding non-recurring items and the group management fee for the retail business was 6.9 (6.9) per cent. The wholesale business’ EBITDA excluding non-recurring items was EUR 14.3 (12.8) million and EBITDA was EUR 14.3 (20.3) million.
Pharmaceutical Trade Sweden’s operating profit excluding non-re-curring items increased by 5.6 (82.6) per cent to EUR 46.4 (44.0) million. On a constant currency basis operating profit excluding non-recurring items increased by 8.6 (92.1) per cent. Operating profit was EUR 46.4 (50.5) million. Operating profit excluding non-recurring items for the Swedish retail business totalled EUR 33.9 (33.8) million and operating

6
Year 2015Report of the Board of Directors
profit was EUR 33.9 (32.8) million. Operating profit excluding non-re-curring items for the Swedish wholesale business was EUR 12.6 (10.4) million and operating profit was EUR 12.6 (17.9) million.
Profitability of the Swedish retail business was supported by in-creased sales of traded goods and good cost control. Operating profit was negatively affected by significant decrease of parallel im-port from the corresponding period and price cuts set by Swedish authorities in fourth quarter of 2014 and in second quarter of 2015. Weak seasonal sales in the summer led into increased competition and campaign discounts in retail trade. Increased sales of the new expensive prescription medicine with low margins negatively af-
fected the relative profitability of the Swedish retail business. The relative share of OTC and traded goods from the net sales was 26 (27) per cent. Oriola-KD opened web shop in Sweden in the third quar-ter. The product assortment of the web shop represents the entire Kronans Apotek’s product assortment. In 2015 five new pharmacies were opened of which two were new care & beauty concept stores.
Positive development of the Swedish wholesale business was sup-ported by the new agreements with pharmaceutical companies signed in 2014, increased efficiency and improved profitability in logistic services for retail.
EUR million 2015 2014Pharmaceutical Trade Sweden
Restructuring costs - -1.0
Gain on sale of property - 7.5
Pharmaceutical Trade Finland and Baltics
Restructuring costs -0.9 -
Service award arrangement - -0.5
Group items
Restructuring costs -0.5 -
Revaluation of contingent consideration 3.4 -
Service award arrangement - -0.1
Pensions -0.3 -
Other -0.1 -
Continuing Operations Total 1.8 5.9
Pharmaceutical Trade Finland and Baltics
Non-recurring items included in Operating Profit, continuing operations
Key FiguresEUR million 2015 2014 Change %Invoicing 1,163.7 1,105.0 5.3
Pharmaceutical wholesale in Finland 1,069.8 1,015.7 5.3
Pharmaceutical wholesale in Baltics 51.4 48.6 5.6
Consumer Health 43.2 41.1 5.1
Net Sales 436.4 435.9 0.1
Pharmaceutical wholesale in Finland 344.8 348.7 -1.1
Pharmaceutical wholesale in Baltics 49.1 46.6 5.3
Consumer Health 43.0 40.9 5.1
Operating profit % excluding non-recurring items 20.5 19.6 4.4
Operating profit 19.5 19.2 1.8
Operating profit % excluding non-recurring items 4.7 4.5
Operating profit % 4.5 4.4
Number of personnel at the end of period 488 523
The Finnish pharmaceutical market grew by 3.3 (4.7) per cent in 2015 (source: IMS Express). Oriola-KD’s share of the Finnish pharma-ceutical wholesale market was 46 (46) per cent (source: ATY).
Invoicing, indicating the business volume, of the Finnish wholesale business increased from previous year by 5.3 (decreased 0.7) per cent to EUR 1,069.8 (1,015.7) million. The net sales of Pharmaceutical Trade Finland and Baltics increased by 0.1 (2.5) per cent to EUR 436.4 (435.9) million. Operating profit excluding non-recurring items increased by 4.4 (4.3) per cent to EUR 20.5 (19.6) million. Operating profit increased by 1.8 (1.9) per cent to EUR 19.5 (19.2) million. In 2015 Oriola-KD rec-ognised EUR 0.9 (-) million non-recurring items related to co-operative negotiations concerning Oriola-KD’s personnel in Finland. Non-recur-ring items recognised in in 2014 totalled EUR 0.5 million.
The EBITDA excluding non-recurring items of Pharmaceutical Trade Finland and Baltics was EUR 24.8 (23.7) million and EBITDA was EUR 23.8 (23.2) million.
In Finnish wholesale business Oriola-KD renewed long term co-operation agreements among others with Orion, MSD and Orifarm in 2015. Positive development of invoicing was supported by an increase in sales of the key pharmaceutical companies in the Finnish wholesale business. Service sales to the pharmaceutical companies continued to grow in Finnish wholesale business. The sales of Orio-lashop.fi increased but profitability of Consumer Health business de-creased from the corresponding period due to increased discounts given as a result of continued tight competitive environment.

7
Year 2015 Year 2015Report of the Board of Directors
Non-recurring itemsA non-recurring item is an income or expense arising from non-recurring or rare events. Gains or losses from the sale or discontinu-ation of business operations or assets, gains or losses from restruc-turing business operations, and impairment losses of goodwill and other non-current assets are recognised by Oriola-KD as non-recur-ring items. In addition, changes in estimates regarding the realisa-tion of contingent consideration arising from business acquisitions are presented within non-recurring items.
Non-recurring items reported in 2015 relate to restructuring charges in Finnish pharmaceutical wholesale business, Consumer Health and Group functions. In addition, non-recurring items within Group items include the revaluation of a contingent consideration related to the Medstop acquisition and an expense of EUR 0.4 (-) million related to the forthcoming pension reform in Finland and a settlement gain of EUR 0.2 (-) million from the transfer of the management of Finnish companies’ statutory occupational pensions and associated pension portfolio. Non-recurring items reported in 2014 relate to restructuring charges in Pharmaceutical Trade Sweden and a gain on sale from a sale-and-leaseback transaction of the Mölnlycke warehouse property.
Balance sheet, financing and cash flowOriola-KD’s total assets at 31 December 2015 were EUR 946.9 (874.0) million. Cash and cash equivalents totalled EUR 121.9 (91.5) million and equity was EUR 194.6 (111.5) million. The equity ratio was 21.1 (13.1) per cent and gearing was 3.4 (91.8) per cent.
Oriola-KD rearranged its long-term revolving credit facility and term loan agreement on 11 June 2015. The approximately EUR 175 million agreement replaced the previous financing agreement that was signed on 15 May 2013. The new financing agreement con-sists of EUR 100 million revolving credit facility and Swedish crown denominated approximately EUR 75 million amortized term loan agreement. Revolving credit facility and term loan agreement will mature in May 2018.
During the first quarter of 2015 Oriola-KD completed a rights offer-ing. From the offering Oriola-KD raised gross proceeds of EUR 75.6 million and net proceeds of EUR 73.7 million.
Oriola-KD redeemed its EUR 40 million hybrid bond issued on 20 February 2014 in its entirety together with accrued interest. The bond was redeemed in accordance with its terms and conditions on 20 April 2015 with 103 per cent of its nominal value.
Oriola-KD’s goodwill of EUR 256.5 (250.9) million has been allo-cated in impairment testing to the cash-generating units consist-ing of the Group’s operating segments. Goodwill is tested annu-ally, in accordance with the timetable of its strategy and planning process. At the end of December 2015, EUR 230.3 (225.3) million of the goodwill was allocated to the Swedish pharmaceutical retail business, EUR 26.0 (25.4) million to the Swedish pharmaceutical wholesale business and EUR 0.2 (0.2) million to the Pharmaceuti-cal Trade Baltics.
At the end of December 2015, interest-bearing debt was EUR 128.6 (193.9) million of which syndicated bank loans totalled EUR 76.2 (102.2) million, commercial papers EUR 13.0 (51.8) million, advance payments from pharmacies EUR 23.9 (20.6) million, a contingent consideration related to Medstop-acquisition EUR 12.4 (14.7) million and finance lease liabilities EUR 3.2 (4.5) million. Long-term interest bearing-liabilities were EUR 66.9 (98.5) million and short-term inter-est-bearing liabilities were EUR 61.7 (95.4) million. Interest-bearing
net debt was EUR 6.6 (102.4) million. The non-recourse trade re-ceivables sales programmes were continued in the Pharmaceutical Trade Sweden in 2015. At the end of December 2015, a total of EUR 114.6 (100.1) million in trade receivables had been sold. Oriola-KD’s long term revolving credit facility and term loan agreement includes financial covenants that are based on Net Debt to EBITDA –ratio and on Gearing.
Oriola-KD’s committed long-term credit facility of EUR 100.0 mil-lion and EUR 35.4 million of short-term credit account limits with banks were unused at the end of December 2015.
Net cash flow from operations in 2015 including discontinued op-erations was EUR 85.6 (-10.8) million, of which changes in working capital accounted for EUR 11.2 (-42.5) million. Net cash flow from investing activities was EUR -19.9 (40.3) million.
InvestmentsGross investments in January–December 2015 totalled EUR 20.4 (25.7) million and consisted of investments related to the opening of new pharmacies, information systems and improvements in lo-gistics efficiency.
Personnel At the end of 2015, Oriola-KD had 2,353 (2,356) employees, 77.8 (76.1) per cent of whom worked in Sweden and 22.2 (23.9) per cent in Finland and the Baltics. Personnel numbers consist of members of staff in active employment.
AdministrationOriola-KD Corporation’s Board of Directors:• Anssi Vanjoki, Chairman• Jukka Alho, Vice Chairman• Eva Nilsson Bågenholm• Per Båtelson• Anja Korhonen• Kuisma Niemelä• Matti Rihko• Staffan Simberg
Oriola-KD Corporation’s Board’s Audit Committee members are: Anja Korhonen (Chairman), Kuisma Niemelä and Staffan Simberg. Board’s Remuneration Committee members are: Jukka Alho (Chairman), Per Båtelson, Eva Nilsson Bågenholm and Matti Rihko.
Oriola-KD’s Group Management Team:• Eero Hautaniemi, President and CEO• Sari Aitokallio, CFO (as of 9 April , 2015)• Lars Birkeland, Vice President, Pharmaceutical Retail, Sweden• Thomas Gawell, Vice President, Pharmaceutical Wholesale,
Sweden (as of 6 February, 2015) • Jukka Mäkelä, Vice President, Development• Teija Silver, Vice President, HR• Kimmo Virtanen, Executive Vice President, Pharmaceutical
Wholesale, Finland, Sweden and the Baltics
Tuomas Itkonen, former CFO and member of the Group Manage-ment Team, left the company on 1 April, 2015.
Oriola-KD applies the Finnish Corporate Governance Code which was issued by the Securities Market Association on 15 June 2010 and

8
Year 2015Report of the Board of Directors
which entered into force on 1 October 2010, with the exception that the company’s Nomination Committee may also have members who are not members of the company’s Board of Directors. The purpose of this deviation from Recommendation 22 of the Corporate Govern-ance Code (Appointment of members to the committees) is to allow the election of major shareholders in the company to the Nomination Committee to ensure that their opinions are heard well before the Annual General Meeting. The Nomination Committee is a body es-tablished by the Board for the purpose of preparing and presenting to the Board a recommendation for the proposal to be put to the Annual General Meeting concerning the composition and remuneration of the Board. The Corporate Governance Statement and the Remunera-tion Statement for 2015 can be viewed on the company’s website at: www.oriola-kd.com/en/Corporate-Governance/.
Oriola-KD Corporations Board appointed on 25 September 2015 members of the company’s Nomination Committee: Pekka Pajamo (chairman), Peter Immonen, Timo Leino, Mikko Mursula and Into Ylppö.
The auditor of Oriola-KD Corporation as elected by the Annual General Meeting, PricewaterhouseCoopers Oy, will designate Ylva Eriksson APA as the principal auditor as of July 16, 2015.
Board authorisationsThe Annual General Meeting (AGM), held on 30 March 2015, author-ised the Board of Directors to decide on a share issue against pay-ment in one or more issues. The authorisation comprises the right to issue new shares or assign treasury shares held by the company. The authorisation covers a maximum of 5,650,000 Class A shares and 12,500,000 Class B shares and includes the right to derogate from the shareholders’ pre-emptive subscription right. Pursuant to the au-thorisation, shares held by the company as treasury shares may also be sold through trading on a regulated market organised by NAS-DAQ OMX Helsinki Ltd. The authorisation is in effect for a period of eighteen months from the decision of the Annual General Meeting.
The AGM on 30 March 2015 authorised the Board of Directors to decide on a share issue against payment in one or more issues. The authorisation comprises the right to issue new class B shares or as-sign class B treasury shares held by the company. The authorisation covers a combined maximum of 18,000,000 class B shares of the company and includes the right to derogate from the shareholders’ pre-emptive subscription right. Pursuant to the authorisation, class B shares held by the Company as treasury shares may also be sold on regulated market organised by NASDAQ OMX Helsinki Ltd. The authorisation is in effect for a period of eighteen months from the decision of the Annual General Meeting.
The authorisation revokes all previous share issue authorisations given to the Board of Directors apart from the authorisation given to the Board of Directors by the Annual General Meeting held on 20
March 2013, pursuant to which the Board of Directors may decide upon directed share issues against or without a payment concern-ing no more than 1,715,000 class B shares in order to execute the share-based incentive plan for the Oriola-KD Group’s executives and the share savings plan for the Oriola-KD Group’s key personnel.
The AGM on 30 March 2015 also authorised the Board of Directors to decide on repurchasing of the company’s own class B shares. The authorisation entitles the Board of Directors to decide on the repurchase of no more than 18,000,000 of the company’s own class B shares in a proportion other than in which shares are owned by the shareholders. The authorisation to repurchase own shares is in force for a period of not more than eighteen months from the decision of the Annual General Meeting. Shares may be repurchased to develop the company’s capital structure, to execute corporate transactions or other business arrangements, to finance investments, to be used as a part of the company’s incentive schemes or to be otherwise relinquished, held by the company or cancelled.
Related partiesRelated parties in the Oriola-KD Group are deemed to comprise the members of the Board of Directors and the President and CEO of Oriola-KD Corporation, the other members of the Group Manage-ment Team of the Oriola-KD Group, the immediate family of the aforementioned persons, the companies controlled by the afore-mentioned persons, and the Oriola Pension Fund until 31 December 2015 The Group has no significant business transactions with related parties, except for pension expenses arising from defined benefit plans with the Oriola Pension Fund.
Oriola-KD Corporation sharesOriola-KD completed a rights offering in the first quarter of 2015. The subscription period of the offering ended on 3 March 2015. In the offering 9,429,742 new A Shares and 20,798,643 new B Shared were subscribed. As a result, the total number of shares of Oriola-KD increased to 181,486,213 shares. The subscription price was EUR 2.50 per offered share. Oriola-KD raised gross proceeds of EUR 75.6 million through the offering. Oriola-KD recognised gross proceeds and the transaction costs less taxes, in total of EUR 73.7 million, in the invested unrestricted equity fund.
Oriola-KD Corporation’s market capitalisation on 31 December 2015 was EUR 779.6 (524.4) million.
In the review period, the traded volume of Oriola-KD Corporation shares, excluding treasury shares, corresponded to 21.9 (30.5) per cent of the total number of shares. The traded volume of class A shares amounted to 5.5 (15.7) per cent of the average stock, and that of class B shares, excluding treasury shares, to 29.3 (37.2) per cent of the average stock.
2015 2014 Trading volume 1) Class A Class B Class A Class BTrading volume, million 3.0 35.8 7.9 41.2
Trading volume, EUR million 11.9 140.1 18.6 101.5
Highest price, EUR 4.52 4.60 3.31 3.30
Lowest price, EUR 2.93 2.84 1.89 1.98
Closing quotation, end of period, EUR 4.24 4.32 3.26 3.271) Adjusted by the impact of rights issue, comparative figures adjusted accordingly.

9
Year 2015 Year 2015Report of the Board of Directors
At the end of September 2015, the company had a total of 181,486,213 (160,876,788) shares, of which 55,484,648 (50,147,044) were class A shares and 126,001,565 (110,729,744) were class B shares. The company has 124,024 (139,752) treasury shares (includ-ing treasury shares held by third-party service provider), all of which are class B shares. They account for 0.07 (0.09) per cent of the com-pany’s shares and 0.01 (0.01) per cent of the votes.
Under Article 3 of the Articles of Association, a shareholder may demand conversion of class A shares into class B shares. During the period 1 January – 31 December 2015, 1,093,804 (0) class A shares were converted into class B shares.
On 19 December 2012, Oriola-KD Corporation’s Board of Directors decided on a share incentive scheme for the Group’s senior manage-ment for the years 2013-2015. The scheme covers six persons. The company’s Board of Directors will determine the earnings criteria for the earning period and the targets to be set for these at the start of each earning period. The bonus for the 2015 earning period is based on the Oriola-KD Group’s earnings per share (EPS) calculated from the earnings excluding non-recurring items and taxes. The rewards to be paid on the basis of the performance period 2015 will corre-spond to the value of a maximum total of 1,010,000 Oriola-KD Cor-poration class B shares (also including the proportion to be paid in cash), of which approximately 625,500 Oriola-KD Corporation class B shares (also including the proportion to be paid in cash) have been allocated to the current participants.
On 4 December 2015 the Board of Directors of Oriola-KD Cor-poration resolved to establish a new share-based incentive plan directed to the Group key personnel (the Plan). Approximately 20 key persons, including the members of the Group Management Team, participate in the Plan. The Plan includes three performance periods, calendar years 2016, 2017 and 2018, and three vesting pe-riods, calendar years 2017, 2018 and 2019, respectively. The Board of Directors of the Company will resolve on the Plan’s performance criteria and on the required performance level for each criterion at the beginning of a performance period.
The prerequisite for participation in the Plan and for receipt of re-ward on the basis of the Plan is that a key person has enrolled in the OKShares and makes the monthly saving from his or her fixed gross monthly salary, in accordance with the Rules of the OKShares in force. The aim is also to harmonize the Company’s incentive plans into a One-Platform Plan where the Company’s Key Personnel Share Sav-ings Plan (the OKShares) and Long-Term Incentive Plan are combined.
The potential reward of from the performance period 2016 will be based on the Group’s Earnings per Share (EPS). The rewards to be paid on the basis of the performance period 2016 correspond to the value of an approximate maximum total of 800,000 Oriola-KD Corporation Class B shares (including also the proportion to be paid in cash). The potential reward will be paid partly in Oriola-KD Corporation Class B shares and partly in cash in 2018. The cash pro-portion is intended to cover taxes and tax-related costs arising from the reward to a key person.
The member of the Group Management Team must hold 50 per cent of the net shares given on the basis of the entire Plan, until his or her shareholding in the Company in total equals the value of his or her gross annual salary. Such number of shares must be held as long as the key person holds a position as a Group Management Team member.
On 28 May 2013 the Board of Directors of Oriola-KD Corporation decided to launch a key personnel share savings plan. A total of 34 key employees participated in the plan during a savings period 1 October 2013 – 30 September 2014. A total of 39 key employees participated in the plan during a savings period 1 October 2014 – 30 September 2015. For both savings plans the maximum and mini-mum monthly savings amounted to 10 and 2 per cent, respectively, of each participant’s fixed gross monthly salary.
On 18 June 2015 the Board of Directors of Oriola-KD Corporation de-cided to launch a new savings period 2015-2016. This savings period begun on 1 October 2015 and will end on 31 December 2016. The maximum monthly saving is 8.3 percent and the minimum is 2 percent of each participant’s fixed monthly gross salary. During the final quarter in 2015, a total of about 50 key employees participate in the plan.
The accumulated savings will be used for purchasing Oriola-KD’s class B shares for the participants at market prices. In return, each participant will receive two free class B matching shares for every three acquired savings shares. Matching shares will be delivered to a participant if the participant holds the acquired shares from the sav-ings period until the end of the designated holding period and the employment has not terminated by the last day of the holding pe-riod. Matching shares will be paid partly in Oriola-KD’s class B shares and partly in cash. The cash proportion is intended for covering taxes and tax-related payments arising from the reward to a key person.
During 2015, in total 24,314 company’s class B shares were granted under the savings period 2013 - 2014. The savings of plan 2014-2015 correspond to approximately 48,600 savings shares and 32,400 matching shares estimated at the share price level of the year end.Oriola-KD Corporation has an agreement with a third-party service provider concerning administration of the share-based incentive program. At the end of the reporting period, the amount of treasury shares held by the third-party service provider was 27,202 (42,930).
Liquidity guaranteeThere is no liquidity guarantee in effect for the shares of Oriola-KD Corporation.
Flagging announcementsOriola-KD Corporation received from Mariatorp Oy (business ID
1948056-9) on 30 April 2015 a disclosure, according to which Mari-atorp Oy on 30 April 2015 had signed a demerger plan. Following the completion of the demerger the Oriola-KD shares owned by Mariatorp Oy, a company controlled by Niklas Herlin, would be transfer to a newly established company Mariatorp Oy.
Oriola-KD has on 31 August2015 received from Mariatorp Oy (busi-ness ID 1948056-9) (“Demerged Company”) a disclosure according to which Mariatorp Oy on 31 August2015 has registered execution of a demerger. All Oriola-KD shares owned by the Demerged Com-pany will transfer to a newly established company Mariatorp Oy (business ID 2690035-7). After the execution of the demerger, the ownership of the new Mariatorp Oy of Oriola-KD Corporation’s share capital is 7.76 per cent and total number of voting rights is 7.92 per cent comprising a total of 14,075,000 shares of which 4,500,000 A shares and 9,575,000 B shares.
RisksOriola-KD’s Board of Directors has approved the company’s risk man-agement policy in which the risk management operating model,
10
Year 2015Report of the Board of Directors
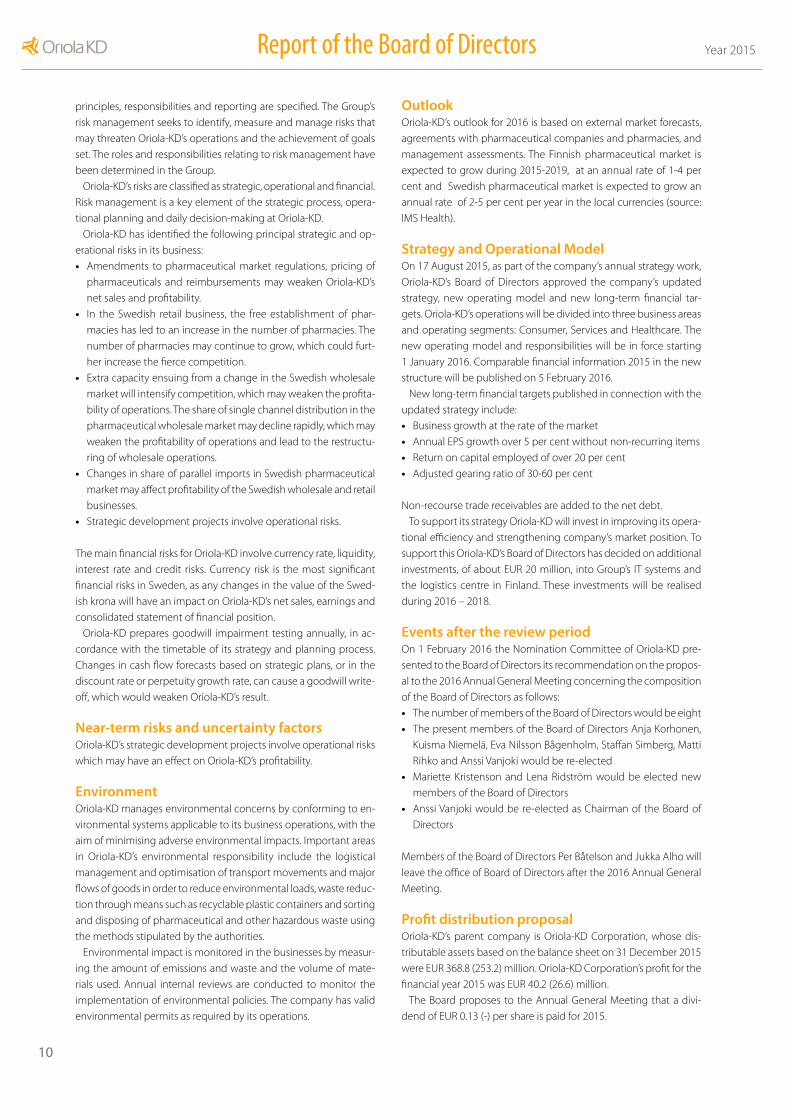
principles, responsibilities and reporting are specified. The Group’s risk management seeks to identify, measure and manage risks that may threaten Oriola-KD’s operations and the achievement of goals set. The roles and responsibilities relating to risk management have been determined in the Group.
Oriola-KD’s risks are classified as strategic, operational and financial. Risk management is a key element of the strategic process, opera-tional planning and daily decision-making at Oriola-KD.
Oriola-KD has identified the following principal strategic and op-erational risks in its business: • Amendments to pharmaceutical market regulations, pricing of
pharmaceuticals and reimbursements may weaken Oriola-KD’s net sales and profitability.
• In the Swedish retail business, the free establishment of phar-macies has led to an increase in the number of pharmacies. The number of pharmacies may continue to grow, which could furt-her increase the fierce competition.
• Extra capacity ensuing from a change in the Swedish wholesale market will intensify competition, which may weaken the profita-bility of operations. The share of single channel distribution in the pharmaceutical wholesale market may decline rapidly, which may weaken the profitability of operations and lead to the restructu-ring of wholesale operations.
• Changes in share of parallel imports in Swedish pharmaceutical market may affect profitability of the Swedish wholesale and retail businesses.
• Strategic development projects involve operational risks.
The main financial risks for Oriola-KD involve currency rate, liquidity, interest rate and credit risks. Currency risk is the most significant financial risks in Sweden, as any changes in the value of the Swed-ish krona will have an impact on Oriola-KD’s net sales, earnings and consolidated statement of financial position.
Oriola-KD prepares goodwill impairment testing annually, in ac-cordance with the timetable of its strategy and planning process. Changes in cash flow forecasts based on strategic plans, or in the discount rate or perpetuity growth rate, can cause a goodwill write-off, which would weaken Oriola-KD’s result.
Near-term risks and uncertainty factorsOriola-KD’s strategic development projects involve operational risks which may have an effect on Oriola-KD’s profitability.
EnvironmentOriola-KD manages environmental concerns by conforming to en-vironmental systems applicable to its business operations, with the aim of minimising adverse environmental impacts. Important areas in Oriola-KD’s environmental responsibility include the logistical management and optimisation of transport movements and major flows of goods in order to reduce environmental loads, waste reduc-tion through means such as recyclable plastic containers and sorting and disposing of pharmaceutical and other hazardous waste using the methods stipulated by the authorities.
Environmental impact is monitored in the businesses by measur-ing the amount of emissions and waste and the volume of mate-rials used. Annual internal reviews are conducted to monitor the implementation of environmental policies. The company has valid environmental permits as required by its operations.
OutlookOriola-KD’s outlook for 2016 is based on external market forecasts, agreements with pharmaceutical companies and pharmacies, and management assessments. The Finnish pharmaceutical market is expected to grow during 2015-2019, at an annual rate of 1-4 per cent and Swedish pharmaceutical market is expected to grow an annual rate of 2-5 per cent per year in the local currencies (source: IMS Health).
Strategy and Operational ModelOn 17 August 2015, as part of the company’s annual strategy work, Oriola-KD’s Board of Directors approved the company’s updated strategy, new operating model and new long-term financial tar-gets. Oriola-KD’s operations will be divided into three business areas and operating segments: Consumer, Services and Healthcare. The new operating model and responsibilities will be in force starting 1 January 2016. Comparable financial information 2015 in the new structure will be published on 5 February 2016.
New long-term financial targets published in connection with the updated strategy include:• Business growth at the rate of the market• Annual EPS growth over 5 per cent without non-recurring items• Return on capital employed of over 20 per cent• Adjusted gearing ratio of 30-60 per cent
Non-recourse trade receivables are added to the net debt.To support its strategy Oriola-KD will invest in improving its opera-
tional efficiency and strengthening company’s market position. To support this Oriola-KD’s Board of Directors has decided on additional investments, of about EUR 20 million, into Group’s IT systems and the logistics centre in Finland. These investments will be realised during 2016 – 2018.
Events after the review periodOn 1 February 2016 the Nomination Committee of Oriola-KD pre-sented to the Board of Directors its recommendation on the propos-al to the 2016 Annual General Meeting concerning the composition of the Board of Directors as follows:• The number of members of the Board of Directors would be eight• The present members of the Board of Directors Anja Korhonen,
Kuisma Niemelä, Eva Nilsson Bågenholm, Staffan Simberg, Matti Rihko and Anssi Vanjoki would be re-elected
• Mariette Kristenson and Lena Ridström would be elected new members of the Board of Directors
• Anssi Vanjoki would be re-elected as Chairman of the Board of Directors
Members of the Board of Directors Per Båtelson and Jukka Alho will leave the office of Board of Directors after the 2016 Annual General Meeting.
Profit distribution proposalOriola-KD’s parent company is Oriola-KD Corporation, whose dis-tributable assets based on the balance sheet on 31 December 2015 were EUR 368.8 (253.2) million. Oriola-KD Corporation’s profit for the financial year 2015 was EUR 40.2 (26.6) million.
The Board proposes to the Annual General Meeting that a divi-dend of EUR 0.13 (-) per share is paid for 2015.

11
Year 2015 Year 2015Report of the Board of Directors
Annual General MeetingOriola-KD Corporation’s Annual General Meeting will be held on 14 March 2016 at 2 p.m. at the Helsinki Fair Centre. The matters specified in article 10 of the Articles of Association and other proposals of the Board of Directors, if any, will be dealt with at the meeting. The Board of Directors will decide on the notice of the Annual General Meet-ing and the proposals contained in it at a later date. The notice of the Annual General Meeting will be published in Helsingin Sanomat newspaper on 19 February 2016.
Espoo, 4 February 2016 Board of Directors of Oriola-KD Corporation
Eero HautaniemiPresident and CEO

12
Year 2015Consolidated Statement of Comprehensive Income (IFRS)
Consolidated Statement of Comprehensive Income (IFRS)
1) Calculated based on the rights issue -adjusted weighted average number of shares, comparative figures adjusted accordingly.
EUR million Note 2015 2014
Continuing operations
Net sales 1,2 1,626.3 1,612.3 Other operating income 5 14.9 21.0
Cost of goods sold 16 -1,298.4 -1,287.9
Employee benefit expenses 7 -143.8 -143.8
Other operating expenses 5 -113.9 -114.5
Gross profit 85.1 87.2 Depreciation, amortisation and impairments 1,6,12,13 -22.6 -22.2
Operating profit 1 62.6 65.0 Financial income and expenses 9 -6.5 -7.8
Profit before taxes 56.1 57.1 Income taxes 10 -11.5 -10.7
Profit for the period from continuing operations 44.5 46.5 Profit for the period from discontinued operations 4 0.1 -258.8
Profit for the period 44.6 -212.3
Other comprehensive income
Items which may be reclassified subsequently to profit or loss:Translation differences recognised in comprehensive income during the reporting period 3.6 -52.1
Translation differences transferred to Profit for the period from discontinued operations 4 - 74.3
Cash flow hedge 0.1 -1.4
Income tax relating to other comprehensive income -0.0 0.3
3.7 21.1
Items which will not be reclassified to profit or loss:Actuarial gains/losses on defined benefit plans 14 5.6 -16.5
Income tax relating to other comprehensive income 10 -1.1 3.3
4.4 -13.1
Total comprehensive income for the period 52.8 -204.3
Profit attributable toParent company shareholders 44.6 -212.3
Total comprehensive income attributable toParent company shareholders 52.8 -204.3
Earnings per share attributable to parent company shareholders:Basic earnings per share, EUR1)
From continuing operations 11 0.25 0.28
From discontinued operations 11 0.00 -1.61
From profit for the period 11 0.25 -1.33
Diluted earnings per share, EUR1)
From continuing operations 11 0.25 0.28
From discontinued operations 11 0.00 -1.61
From profit for the period 11 0.25 -1.33
Year 2015
13
Year 2015Consolidated Statement of Financial Position (IFRS)
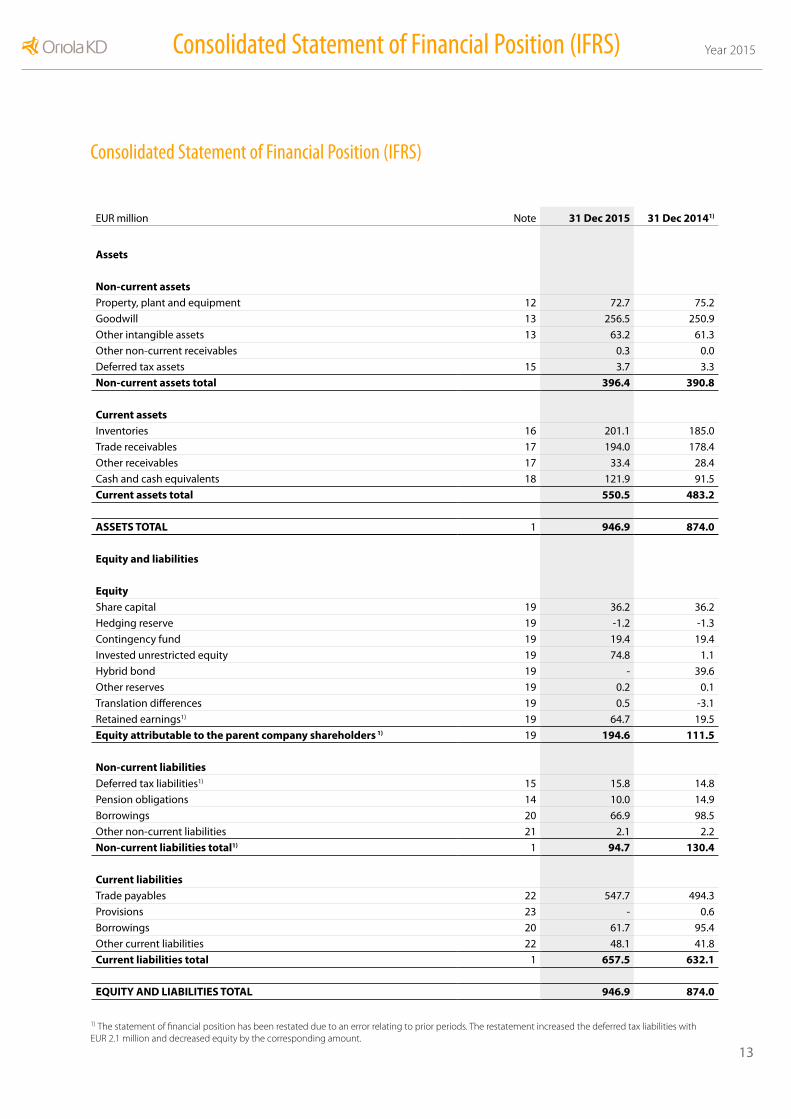
Consolidated Statement of Financial Position (IFRS)
EUR million Note 31 Dec 2015 31 Dec 20141)
Assets
Non-current assetsProperty, plant and equipment 12 72.7 75.2
Goodwill 13 256.5 250.9
Other intangible assets 13 63.2 61.3
Other non-current receivables 0.3 0.0
Deferred tax assets 15 3.7 3.3
Non-current assets total 396.4 390.8
Current assetsInventories 16 201.1 185.0
Trade receivables 17 194.0 178.4
Other receivables 17 33.4 28.4
Cash and cash equivalents 18 121.9 91.5
Current assets total 550.5 483.2
ASSETS TOTAL 1 946.9 874.0
Equity and liabilities
EquityShare capital 19 36.2 36.2
Hedging reserve 19 -1.2 -1.3
Contingency fund 19 19.4 19.4
Invested unrestricted equity 19 74.8 1.1
Hybrid bond 19 - 39.6
Other reserves 19 0.2 0.1
Translation differences 19 0.5 -3.1
Retained earnings1) 19 64.7 19.5
Equity attributable to the parent company shareholders 1) 19 194.6 111.5
Non-current liabilitiesDeferred tax liabilities1) 15 15.8 14.8
Pension obligations 14 10.0 14.9
Borrowings 20 66.9 98.5
Other non-current liabilities 21 2.1 2.2
Non-current liabilities total1) 1 94.7 130.4
Current liabilitiesTrade payables 22 547.7 494.3
Provisions 23 - 0.6
Borrowings 20 61.7 95.4
Other current liabilities 22 48.1 41.8
Current liabilities total 1 657.5 632.1
EQUITY AND LIABILITIES TOTAL 946.9 874.0
1) The statement of financial position has been restated due to an error relating to prior periods. The restatement increased the deferred tax liabilities with EUR 2.1 million and decreased equity by the corresponding amount.

14
Year 2015Consolidated Statement of Cash Flows (IFRS)
Consolidated Statement of Cash Flows (IFRS)
EUR million Note 2015 2014 1)
Net cash flow from operating activitiesOperating profit 62.7 -42.4
Adjustments
Depreciation and amortisation 6 22.6 26.2
Impairment 6 - 71.1
Change in pension asset and pension obligation 3.4 -3.8
Other adjustments 2.7 -5.9
91.3 45.2
Change in current receivables increase (-)/ decrease (+) -27.2 -21.6
Change in inventories increase (-)/ decrease (+) -18.8 26.7
Change in non-interest-bearing current liabilities increase (+)/ decrease (-) 57.2 -47.7
11.2 -42.5
Interest paid and other financial expenses -7.2 -12.3
Dividends received - 0.0
Interest received and other financial income -0.3 0.6
Income taxes paid -10.0 -1.8
Net cash flow from operating activities 85.6 -10.8
Net cash flow from investing activitiesInvestments in property, plant and equipment and intangible assets -11.3 -29.1
Proceeds from sales of property, plant and equipment and intangible assets -8.5 20.6
Proceeds from sale of business, net of cash disposed 4 - 49.1
Business acquisitions, net of cash acquired 3 - -0.2
Net cash flow from investing activities -19.9 40.3
Net cash flow from financing activitiesProceeds from share issue 75.6 -
Share issue expenses -1.8 -
Repayment of hybrid bond -40.0 -
Purchasing of own shares -0.1 -
Hybrid Bond 19 - 39.6
Repayment of short-term loans 2) -35.5 -327.7
Proceeds from short-term loans 2) - 269.2
Repayment of long-term loans -28.8 -61.3
Interest paid on hybrid bond -4.5 -
Net cash flow from financing activities -35.2 -80.3
Net change in cash and cash equivalents 30.6 -50.8
Cash and cash equivalents at the beginning of the period 91.5 137.3
Translation differences -0.1 5.0
Net change in cash and cash equivalents 30.6 -50.8
Cash and cash equivalents at the end of the period 18 121.9 91.5
1) Includes net cash flow from the disposed Russia business until 30 November 2014.2) Includes cash flows from commercial papers

15
Year 2015 Year 2015Consolidated Statement of Changes in Equity (IFRS)
Equity attributable to the parent company shareholders EUR million Note
Share capital Funds
Translati-on diffe-
rencesRetained earnings
Hybrid bond
Equity total
Equity 1 Jan 2014 36.2 20.4 -25.3 246.8 - 278.1 Correction of errors - - - -2.1 - -2.1Restated Equity 1 Jan 2014 36.2 20.4 -25.3 244.7 - 276.0Comprehensive income for the period
Net profit for the period - - - -212.3 - -212.3Other comprehensive income:
Cash flow hedge - -1.4 - - - -1.4Actuarial gains and losses 14 - - - -16.5 - -16.5Income tax relating to other compre-hensive income 10 - 0.3 - 3.3 - 3.6Translation difference - 0.0 22.2 - - 22.2
Comprehensive income for the period total - -1.1 22.2 -225.4 - -204.3Transactions with owners
Hybrid bond 19 - - - - 39.6 39.6Share-based incentive - - - 0.2 - 0.2Purchase of own shares - - - -0.1 - -0.1
Transactions with owners, total - - - 0.1 39.6 39.8Equity 31 Dec 2014 36.2 19.3 -3.1 19.5 39.6 111.5Comprehensive income for the period
Net profit for the period - - - 44.6 - 44.6Other comprehensive income:
Cash flow hedge - 0.1 - - - 0.1Actuarial gains and losses 14 - - - 5.6 - 5.6Income tax relating to other comprehensive income 10 - -0.0 - -1.1 - -1.2Translation difference - - 3.6 - - 3.6
Comprehensive income for the period total - -0.1 3.6 49.0 - 52.8Transactions with owners
Share issue - 73.7 - - - 73.7Hybrid bond interest 19 - - - -2.6 - -2.6Redemption of hybrid bond 19 - - - -1.3 -39.6 -41.0Share-based incentive - - - 0.3 - 0.3Transfer of own shares - - - -0.1 - -0.1Purchase of own shares - - - -0.0 - -0.0
Transactions with owners, total - 73.7 - -3.8 -39.6 30.3Equity 31 Dec 2015 36.2 93.1 0.5 64.7 - 194.6
A correction of an error relating to previous financial periods was made in the financial statements. The amount of deferred tax liability relat-ing to depreciation difference has been corrected in 2014 opening equity in accordance with retrospective correction of errors pursuant to IAS 8. The impact of the correction on opening equity was EUR -2.1 million.
Consolidated Statement of Changes in Equity (IFRS)

16
Year 2015Notes to the Consolidated Financial Statements
Notes to the Consolidated Financial Statements
Basic information on the company Oriola-KD Corporation is a Finnish, public limited company, which is domiciled in Espoo, Finland. Oriola-KD and its subsidiaries together form the consolidated Oriola-KD Group. The consolidated financial statements were approved for publication by the Board of Directors of Oriola-KD Corporation on 4 February 2016. In accordance with Finland’s Limited Liability Companies Act, the shareholders have the right to ap-prove or reject the financial statements at the General Meeting held after their publication. The General Meeting may also decide to make amendments to the financial statements. The company’s business ID is 1999215-0. Copies of the consolidated financial statements of the Oriola-KD Group are available from the head office of Oriola-KD Cor-poration at the following address: Orionintie 5, FI-02200 Espoo, Finland.
ACCOUNTING PRINCIPLES FOR THE CONSOLIDATED FINANCIAL STATEMENTS
Basis of presentationThe Oriola-KD Group’s financial statements are prepared in accord-ance with International Financial Reporting Standards including adherence with IAS and IFRS standards and SIC and IFRIC interpre-tations valid as at 31 December 2015. The International Financial Reporting Standards refer to standards and interpretations that have been approved for application in the EU in the Finnish Accounting Act and the provisions issued pursuant to it according to the proce-dures provided for in EU regulation (EC) No. 1606/2002.
The consolidated financial statements are presented for the 12-month period 1 January – 31 December 2015. The financial state-ments are presented in EUR million and they have been prepared under the historical cost convention, except for financial assets rec-ognised at fair value through profit or loss, financial assets available-for-sale, derivatives and share-based payments. The presentation of the consolidated financial statements is in millions of euro. As a re-sult of rounding differences, the figures presented in the tables may not add up to the total. Key figures have been calculated using exact figures. The Group has applied the following new and amended standards and interpretations as of 1 January 2015:• Annual improvements in IFRS standards 2010-2012 and 2011-
2013 (effective mainly in the financial years beginning on or after 1 July 2014). Through the Annual Improvement process minor and non-urgent amendments are gathered together and imple-mented once a year. The amendments do not have a material impact on the result or the financial position of the Group’s con-solidated financial statements.
• Amendment to IAS 19 Defined benefit plans: Employee contri-butions (effective in the financial years beginning on or after 1 July 2014). The amendment clarifies the accounting treatment when there is a condition in defined benefit plans for contributions by employees or a third party into the plan. The amendment does not have an impact on the consolidated financial statements.
Consolidation principles The consolidated financial statements include Oriola-KD Corpora-tion and those directly or indirectly owned subsidiaries over which Oriola-KD Corporation exercises control. Control is presumed to ex-ist when the Group through participation in an investee becomes exposed to its variable returns or is entitled to its variable returns and is able to have an influence on the returns through exercising power over the investee. Subsidiaries are consolidated from the date the Group has gained control and divested companies are consolidated until the date control is lost.
The acquisition method is used in the accounting for the elimi-nation of internal ownership. All intra-group transactions, as well as intra-group receivables, payables, dividends and unrealised in-ternal margins, are eliminated. The Group’s profit for the period is attributed to the equity holders of the parent and non-controlling interests. Identifiable assets acquired and assumed liabilities of an acquired entity are measured at their fair value as of the acquisition date. Any contingent consideration is measured at fair value at the date of acquisition and classified under other interest-bearing liabilities. Changes in the contingent consideration and acquisi-tion-related expenses are recognised as an expense in the income statement.
The share of equity applicable to the non-controlling interest is included in Group equity and is presented separately in the state-ment of changes in shareholders’ equity. The attribution of total comprehensive income for the period to the equity holders of the parent and non-controlling interests is presented within the con-solidated statement of comprehensive income. Non-controlling in-terests are measured on a case-by-case basis either at the amount which equals non-controlling interests’ proportionate share in the recognised amounts of the acquiree’s identifiable net assets or at fair value. Changes in the parent’s ownership interest in a subsidiary that do not result in a loss of control are accounted for as equity transac-tions. As at the date when control is lost, any investment retained in the former subsidiary is recognised at fair value and the difference is recorded through income statement.
Associated companies are consolidated in accordance with the equity method of accounting. Associated companies are entities over which the Group exercises significant influence. Significant influence is presumed to exist when the Group owns over 20 per cent of the voting rights of the company or when the Group oth-erwise exercises significant influence but does nor exercise control. Associated companies are consolidated from the date the company becomes an associate and divested companies are consolidated until the date of disposal.
Foreign currency denominated itemsThe consolidated financial statements have been presented in euro, which is the functional and presentation currency of the Group’s parent company. The items included in the financial statements of the subsidiaries are valued in the currency which best describes the financial operating conditions of each subsidiary.

17
Year 2015 Year 2015Notes to the Consolidated Financial Statements
Transactions in foreign currencies are translated into functional currency at the rates of exchange prevailing at the dates of trans-actions. Monetary items have been translated into functional cur-rency using the rates of exchange as at the balance sheet date and non-monetary items using the rates of exchange at the dates of transactions, excluding items measured at fair value, which have been translated using the rates of exchange on the date of valuation. Gains and losses arising from the translation are recog-nised in the profit or loss. Foreign exchange gains and losses from operations are included within the corresponding items above operating profit. Foreign exchange gains and losses from loans denominated in a foreign currency are included within financial income and expenses.
The income statements of foreign Group companies outside the Euro zone are translated into euro using the weighted aver-age rate of exchange of the financial year and the statements of financial position using the rates of exchange as at the balance sheet date. Differences resulting from the translation of the result for the period at a different rate on the income statement and on the statement of financial position are recognised as a separate item within consolidated statement of comprehensive income. Translation differences arising from the acquisition cost elimina-tion of foreign subsidiaries and from the translation of equity items accrued after acquisition date are recognised within in other com-prehensive income. When a subsidiary is sold in full or in part, related translation differences are included in the calculation of gain or loss for the sale and recognised in the profit or loss for the period. The parent company’s receivables from foreign subsidiaries are considered as part of the net investment if there is no plan for the repayment and repayment cannot be reasonably anticipated in the future. Exchange differences arising from such receivables are recognised in the consolidated financial statements in transla-tion differences within equity.
Property, plant and equipmentTangible assets are initially recognised at historical cost and they are subsequently measured at historical cost less depreciation and impairment losses. The assets are depreciated over their estimated useful life using the straight-line method. The useful life of assets is reviewed at least annually and it is adjusted if necessary. The esti-mated useful lives are as follows:• Buildings 20-50 years• Machinery and equipment 5-10 years• Other tangible assets 10 years• Other intangible assets 3-20 years
Land areas are not subject to depreciation. Repair and maintenance costs are recognised as expenses for the period. Improvement in-vestments are capitalised providing they are expected generate fu-ture economic benefits. Gains and losses resulting from the disposal of tangible assets are recognised under other operating profit.
Intangible assets
GoodwillAs of 1 January 2010, goodwill arising from business combinations is recognised as the amount by which the aggregate of the fair value of the consideration transferred, the acquisition date fair value of any previously held interest and any non-controlling interest exceeds the fair value of the net assets acquired.
Goodwill is not amortised but is tested for impairment at least annually. For the purpose of impairment testing, goodwill is allo-cated to cash-generating units. Goodwill is measured at cost less accumulated impairment losses. Impairment losses are recognised in the income statement.
Other intangible assetsOther intangible assets are initially recognised at historical cost and they are subsequently measured at historical cost less depreciation and impairment losses. Other intangible assets include sales licenc-es, trademarks, patents, software licences and product and market-ing rights. Assets with finite useful life are depreciated over their useful life, using the straight-line method. Also, Research and devel-opment costs are normally expensed as other operating expenses for the reporting period in which they are incurred. Expenditures on development is capitalised only when it relates to new products or services that are technically and commercially feasible. The majority of the Group’s development expenditure does not meet the criteria for capitalisation and are recognised as expenses as incurred.
Impairment of tangible and intangible assetsThe Group assesses at each reporting date whether there is any indication that an asset may be impaired. If any indication exists, the Group estimates the asset’s recoverable amount. The recoverable amount is the higher of the net sales price or value in use, which is the present value of the expected future cash flows expected to be derived from the asset.
The impairment loss is recognised in the income statement if the carrying amount of the asset exceeds the recoverable amount. An impairment loss is reversed if there is a change in the circumstances and the recoverable amount exceeds the carrying amount. The re-versal of impairment loss cannot exceed the asset’s carrying amount without any impairment loss.
The goodwill impairment test is conducted at least annually or more frequently if there is any indication that goodwill may be im-paired. Impairment is recognised in the income statement under Depreciation and impairments. Goodwill impairment losses are not reversed.
Trade receivablesTrade receivables are carried at their anticipated realisable value, which is the original invoice amount less an estimated valuation allowance for the impairment of these receivables. A valuation al-lowance for impairment of trade receivables is recognised when there is objective evidence that the Group will not be able to collect all amounts due according to the original terms of the receivables.

18
Year 2015Notes to the Consolidated Financial Statements
Trade receivables are classified in accordance with IFRS 7 to loans and receivables.
Leases
Group as lesseeLease agreements which transfer a significant proportion of the risks and rewards related to the ownership of an asset to the Group are classified as finance lease agreements. Finance lease agreements are recorded in the consolidated statement of financial position as an asset and a liability at the inspection of the lease at the lower of fair value of the asset or the present value of the minimum lease payments.
The assets acquired through finance lease are depreciated simi-larly to non-current assets over the shorter of useful life of the as-sets or the lease term. Finance lease liabilities are recorded under non-current and current liabilities in the consolidated statement of financial position.
If the risks and rewards associated with the ownership of the asset remain with the lessor, the lease agreement is treated as an op-erating lease. The resulting lease payments are recognised as an expense, over the entire lease term.
Non-current assets held for sale and discontinued operationsNon-current assets (or a disposal group) and assets and liabilities related to discontinued operations are classified as held for sale their carrying amounts are expected to be recovered primarily through sale rather than continuing use. The recognition criteria for an asset held for sale is met when the sale is highly probable and the as-set (or disposal group) is available for immediate sale in its present condition under usual and customary terms, the management is committed to the sale and the sale is expected to be completed within one year from the classification.
Prior to classification as held for sale, the assets or the disposal group assets and liabilities are measured in accordance with the ap-plicable IFRS standards. From the date of classification, non-current assets (or disposal group) held for sale are measured at the lower of their carrying amount and fair value less costs to sell. Deprecia-tion and amortisation on such assets is discontinued from the date of classification. Assets included in disposal groups that do not fall within the scope of the IFRS 5 measurement requirements, as well as liabilities, are measured according to the applicable IFRS standards also after the date of classification.
A discontinued operation is a component of an entity that either has been disposed of or is classified as held for sale and meets one of the following requirements:• It represents a separate major line of business or geographical
area of operations.• It is part of a single coordinated plan to dispose of a separate
major line of business or geographical area of operations.• It is a subsidiary acquired exclusively with a view to resale.
Result from discontinued operations is shown separately in the con-solidated statement of comprehensive income and the comparative
figures are revised accordingly. Assets held for sale, disposal groups, items recognised in other comprehensive income concerning assets held for sale, and liabilities included in disposal groups are presented in the consolidated statement of financial position separately from other items. The comparatives for statement of financial position are not revised.
Employee benefits
Share-based payments Share incentive plans are measured at fair value at the grant date in accordance with IFRS 2, and are recognised as expenses within the vesting period. The equity-settled component is recognised in eq-uity and the cash-settled payment in liabilities. The fair value of the cash-settled component is remeasured at each balance sheet date until the end of the vesting period, and the fair value of the liability is adjusted in accordance with the Oriola-KD Corporation share price.
Employee benefitsThe Group’s pension arrangements are in compliance with each country’s local regulations and practices. The pension arrangements of the Group companies comprise both defined contribution plans and defined benefit plans. The payments to the defined contribu-tion plans are recognised as expenses in the income statement in the period in which they incur. Under a defined benefit pension plan, the Group’s obligation is not limited to the payments made under the plan but also includes the actuarial and investment risks related to the pension plan in question.
The pension expenses related to defined benefits have been cal-culated using the projected unit credit method. Pension expenses are recognised as expenses by distributing them over the estimated period of service of the personnel concerned. The amount of the pension obligation is the present value of the estimated future pen-sions payable.
InventoriesInventories are presented in the consolidated statement of financial position at the lower of cost and net realisable value. The net realis-able value is the estimated selling price in the ordinary course of business less the estimated costs of completion and the estimated necessary direct costs of sale. The cost is determined on the basis of the FIFO principle.
Financial assets and liabilities Financial assets and liabilities of the Oriola-KD Group are classified in accordance with the standard IAS 39 Financial Instruments: Recogni-tion and Measurement, as follows:• Financial assets and liabilities recognised at fair value through
profit and loss • Loans and other receivables• Available-for-sale financial assets• Financial liabilities recognised at amortised cost.
The classification takes place at inception and is based on the pur-pose of the acquisition of the financial asset or liability. Financial in-

19
Year 2015 Year 2015Notes to the Consolidated Financial Statements
struments are recognised in the consolidated statement of financial position on the settlement date.
Money market investments and derivatives which are classified as held for trading and that do not meet the IAS 39 criteria for hedge accounting are recorded as financial assets and liabilities recognised at fair value through profit and loss. Assets within this category are short-term assets with a maturity of less than 12 months and are measured at fair value using the market price on the balance sheet date. Both realised and unrealised gains and losses arising from the changes in fair value are recognised in the consolidated statement of comprehensive income for the financial period during which they incurred. Financial assets are derecognised when the Group loses the rights to receive the contractual cash flows on the financial as-set or it transfers substantially all the risks and rewards of ownership outside the Group.
Cash and cash equivalents consist of cash in hand and cash at the bank accounts.
Loans and other receivables are non-derivative financial assets with payments that are fixed or determinable. Such receivables are not quoted in an active market, the Group does not hold them for trading purposes and they are measured at amortised cost. Receiva-bles are classified as current financial assets unless their maturity date is more than 12 months from the balance sheet date. Trade and other receivables are also included in this category. Trade re-ceivables are recognised at their original book value. A valuation allowance for impairment of trade receivables is recognised when there is objective evidence that the Group will not be able to collect all amounts due according to the original terms of the receivables. Significant financial difficulties of the debtor, the probability of the debtor’s bankruptcy, failure to pay and significant delay of payments are considered to be justified reasons for the impairment of trade re-ceivables. Impairments are recognised as an expense in consolidat-ed statement of comprehensive income. Sold non-recourse trade receivables’ credit risk and contractual rights are transferred from the Group on the selling date and related expenses are recognised as financial expenses.
Available-for-sale financial assets are non-derivative financial as-sets that are expressly classified within this category or which cannot be classified in any other category. They are included in non-current financial assets in the balance sheet unless there is an intention to sell these assets during the 12 month period following the balance sheet date.
Financial liabilities recognised at amortised cost are recognised in the consolidated statement financial position at the net value received on the date of acquisition. Transaction costs are included in the original carrying amount of borrowings. Financial liabilities are subsequently measured at amortised cost using the effective interest method. Interest expenses are recognised in the income statement using the effective interest method. Borrowings that ex-pire within 12 months from the balance sheet date, including bank overdrafts in use, are recorded within current borrowings, and those expiring in a period exceeding 12 months, are recorded within non-current borrowings.
Derivative contracts and hedge accounting Oriola-KD recognises derivative contracts in accordance with IAS 39 Financial Instruments: Recognition and Measurement. The Group has classified derivatives as derivatives held for trading, unless IAS 39 hedge accounting is applied. The fair value of currency forward and swap contracts is determined by measuring them at fair value using market rates on the balance sheet date. Positive valuation differences are recognised under trade and other receivables, and negative valuation differences are recognised under trade payables and other current liabilities in the consolidated statement of finan-cial position. Oriola-KD has not applied IAS 39 hedge accounting to currency derivatives that hedge balance sheet items in foreign currencies and forecasted cash flows. The change in the fair value of such derivative contracts is recognised either as other income or expenses or as financial income and expenses, depending on the underlying item being hedged.
Oriola-KD applies IAS 39 hedge accounting for hedging cash flows relating to the selling of non-recourse trade receivables. Fluctuating interest rate has been converted into fixed rate using interest rate swaps. When initiating hedge accounting, the relationship between the hedged item and the hedging instrument is documented along with the objectives of the Group’s risk management. Hedge effec-tiveness is tested at least quarterly. The change in the fair value of the effective portion of the derivatives is recognised in the hedge fund within equity and the ineffective portion, if any, is recognised within the financial items.
Hybrid bondHybrid bonds are recognised as an item of equity in the consolidat-ed statement of financial position. Interest on hybrid bonds are paid base on a resolution by the Board of Directors. Unpaid interest is ac-crued and presented in the financial statements only after the Board resolution regarding the payment of the interest. Unpaid interest is taken into consideration in the calculation of earnings per share.
Provisions and contingent liabilityA provision is recognised in the consolidated statement of financial position when the Group has a present legal or contractual obliga-tion as a result of a past event and it is probable that an outflow of resources embodying economic benefits will be required to settle the obligation and a reliable estimate can be made of the amount of the obligation.
A restructuring provision is recognised when the Group has a de-tailed, formal restructuring plan, has started the implementation of the plan or has informed those affected by the plan. No provision related to costs for continuing operations is recognised.
Income taxes Tax expense in the consolidated statement of comprehensive in-come consists of income taxes based on the taxable profit for the financial year, prior period adjustments, and changes in deferred tax assets and liabilities. Income tax for the taxable profit for the pe-riod is calculated based of the effective income tax rate for each tax jurisdiction. Taxes are recognised in the income statement, except when they relate to items recognised directly in equity or in other

20
Year 2015Notes to the Consolidated Financial Statements
comprehensive income, when the taxes are also recognised in eq-uity or in other comprehensive income respectively.
Revenue recognition The Group’s net sales include income from the sale of goods, dis-tribution fees and the sale of services adjusted with indirect taxes, discounts and currency translation differences resulting from sales in foreign currencies. Income from the sale of goods is recognised when the major risks and rewards of ownership of the goods have been transferred to the buyer. Income from services is recognised when the service has been performed.
Sale of goods and distribution fee - wholesaleIn circumstances where the Group owns the entire inventory of the principal, the full sales proceeds from products is recognised within net sales. In contracts based on consignment inventory and agency agreements, only distribution fee is recognised within net sales.
Sale of goods - retailThe Group has pharmacy chains that sell pharmaceuticals and healthcare products. Sale of goods is recognised when the com-pany sells the product to the customer. Retail sales are usually cash or credit card sales to consumers.
Sale of servicesServices comprise various value-added services provided by whole-sale in distribution and warehousing. Sale of services is recognised over the period during which the service is performed.
Income from royaltiesIncome from royalties is recognised on accrual-basis according to the substance of the contract.
Cost of goods soldThe cost of goods sold includes the materials, procurement and other costs related to the manufacturing and procurement.
Operating profitOperating profit is determined as net sales less cost of goods sold, less sales and distribution expenses, less administrative expenses and other operating expenses, plus other operating income. Foreign exchange differences and changes in the fair values of derivatives are recognised in operating profit, provided that they arise from items related to business operations; otherwise they are recognised within financial items.
Earnings per shareBasic earnings per share is calculated by dividing the net result attributable to owners of the parent by the weighted share-issue adjusted average number of shares outstanding during the period, excluding shares acquired by the Group and held as treasury shares When calculating diluted earnings per share, the weighted share-issue adjusted average number of shares outstanding during the period is adjusted by the effect of all dilutive potential shares.
Treasury sharesTreasury shares acquired by the company and the related costs are presented as a deduction of equity. Gain or loss on surrender of treasury shares are recorded in equity net of tax.
Dividend and other equity distributionDividends or other equity distribution includes dividends and other equity distribution. Dividends and other equity distribution pro-posed by the Board of Directors are not recorded in the financial statements until they have been approved by the shareholders at the Annual General Meeting. Dividend and other equity distribution for shareholders is recognised as a liability in the consolidated state-ment of financial position for the period during which the dividend is approved by the annual general meeting.
Non-recurring itemsA non-recurring item is an income or expense arising from non-recurring or rare events. Gains or losses from the sale or discon-tinuation of business operations or assets, gains or losses from restructuring business operations, and impairment losses on good-will and other non-current assets are recognised by the Group as non-recurring items. In addition, changes in estimates regarding the realisation of contingent consideration arising from business acquisitions are presented within non-recurring items.
Use of estimatesThe preparation of consolidated financial statements in accordance with IFRS requires the application of judgment by management in making estimates and assumptions. Such estimates and assump-tions have an impact on the assets and liabilities reported as at the end of the reporting period, and on the presentation of contingent assets and liabilities in the notes to the consolidated financial state-ments as well as on the income and expenses reported for the fi-nancial year. The estimates are based on the management’s best knowledge about the facts and as such actual results may differ from the estimates and assumptions used. Accounting estimates have been used in determining the amount of items reported in the consolidated financial statements, such as possible impairment of goodwill and other assets, determination of pension assets and pension obligations related to defined benefit pension plans, eco-nomic lives of tangible and intangible assets, provisions and taxes. The application of accounting principles also requires judgement.
Uncertainties concerning the estimatesEstimates used in the preparation of financial statements are based on the management’s best view at the end of the reporting period. These estimates are based on past experience and on probable future assumptions regarding anticipated developments in the Group’s eco-nomic operating environment in terms of sales and costs. Together with its operating units, the Group monitors the actual outcome against the factors impacting estimates and assumptions used on a regular basis, using various internal and external sources of informa-tion. Any changes in estimates and assumptions are recognised in the financial year during which the estimate or assumption is adjusted as well as in all subsequent periods. The main assumptions about the

21
Year 2015 Year 2015Notes to the Consolidated Financial Statements
future and those key uncertainties regarding estimates at the end of the accounting period that result in a significant risk of materially impacting the carrying values of the Group’s assets and liabilities dur-ing the next financial year are presented below.
Impairment testingThe Group’s assets with an indefinite useful life are subject to an-nual impairment testing and any indication of impairment of assets is assessed as described in the accounting principles below. The recoverable values used in impairment testing are discounted future cash flows that can be obtained through usage and possible sale of the assets. If the carrying amount of the asset exceeds either its recoverable amount or fair value, the difference is recognised as an impairment charge. The preparation of such calculations requires the use of estimates. Additional information regarding the sensitivity of changes in the key assumptions to the recoverable amount of the asset can be found under the Note Intangible assets.
Deferred taxesManagement estimates are required in determining the amount of recognised deferred tax assets and liabilities. The appropriate-ness for recognising deferred tax assets is assessed in connection with the preparation of consolidated financial statements. For this purpose, the Group estimates the probability of subsidiaries gener-ating recoverable taxable income against which unused tax losses and unused tax compensations can be utilised. Actual results may differ from the factors used in the estimates, which may lead to the recognition of tax expenses.
Pension assets and liabilitiesThe discounted value of pension obligation is based on several actu-arial assumptions. Changes in the assumptions have an impact on the carrying amount of the pension obligation. Discount rate used is one of the assumptions used. The interest rate used is determined at the date of measurement by reference to maturity of corporate bonds is-sued by financially sound companies that is similar to that of the pen-sion obligation. Other key assumptions impacting pension liabilities are based on the circumstances valid at the time. Further details are included within Note Post-employment and other long term benefits.
Application of new and revised accounting pronouncements under IFRSThe following new or revised standards and interpretations issued by the International Accounting Standards Board (IASB) have not yet been applied by the Group. The Group will apply each new stand-ard and interpretation from the effective date. If the effective date is other than the first day of a financial year, the Group will apply the standard or interpretation from the beginning of the following financial year. • Amendments to IAS 1 is a part of IASB project “Disclosure Ini-
tiative”. The amendments clarify guidance on materiality and aggregation, the presentation of subtotals, the structure of fi-nancial statements and the disclosure of accounting policies. The amendments do not have an impact on the consolidated financial statements.
• Annual improvements in IFRS standards 2012-2014 (effective in the financial years beginning on or after 1 January 2016). Through the Annual Improvement process minor and non-urgent amend-ments are gathered together and implemented once a year. The amendments do not have an impact on the consolidated finan-cial statements.
• Amendment to IAS 16 Property, plant and equipment and IAS 38 Intangible assets: Clarification of acceptable methods of deprecia-tion and amortisation (effective in the financial years beginning on or after 1 January 2016). The amendment forbids the use of revenue-based methods of depreciation and amortisation of tan-gible and intangible assets. The amendment does not have an impact on the consolidated financial statements.
• Amendment to IFRS 11: Joint arrangements: Accounting for ac-quisitions of interests in joint operations (effective in the financial years beginning on or after 1 January 2016). The amendment re-quires the acquirer of an interest in a joint operation in which the activity constitutes a business to apply the principles on business combinations accounting. The amendment does not have an im-pact on the consolidated financial statements.
• IFRS 15: Revenue from contracts with customers (effective in the financial years beginning on or after 1 January 2018). The new standard contains a five-step guidance on the accounting for revenue from customer contracts and replaces the existing IAS 18 and IAS 11 standards and related interpretations. Recognition of revenue can take place over time or at a point in time and the main recognition criteria is the transfer of control. The standard also increases the number of disclosures in the consolidated fi-nancial statements. The Group estimated that the new standard will have an impact on the timing and amount of certain reve-nues. The Group is currently assessing whether the new standard imposes the need to change the recognition principle of reve-nues arising from ownership inventories or the timing when such revenues are recognised. The standard has not been approved for application in the EU.
• IFRS 9 Financial instruments and the changes thereto (effecti-ve in the financial years beginning on or after 1 January 2018). The new standard replaces the current standard IAS 39 Financial instruments: Recognition and measurement. IFRS 9 modifies the classification and valuation of financial assets and contains an ex-pected credit losses model for assessing impairment on financial assets. The classification and measurement of financial liabilities is largely in line with the current requirements of IAS 39. There will continue to be three types of hedge accounting. More risk po-sitions will qualify for hedge accounting and hedge accounting principles have been harmonised with risk management. The Group is currently assessing the potential impacts of the standard. The standard has not been approved for application in the EU.
• IFRS 16 Leases (effective in the financial years beginning on or after 1 January 2019): The new standard requires lessees to re-cognise a lease liability reflecting the future lease payments and a ‘right-of-use’ asset for all long-term lease contracts. The Group is currently assessing the full impacts of the standard. The standard has not been approved for application in the EU.

22
Year 2015Notes to the Consolidated Financial Statements
Reporting segments
EUR million2015 Note
Pharma-ceutical Tra-
de Sweden
Pharma-ceutical Tra-
de Finland and Baltics Group items
Continuing operations
total
Disconti-nued
operations Group totalExternal Invoicing 2,098.4 1,163.7 - 3,262.2 - 3,262.2Internal Invoicing 0.1 0.0 -0.1 - - -Total Invoicing 2,098.5 1,163.7 -0.1 3,262.2 - 3,262.2
Sales to external customers 2 1,190.0 436.3 - 1,626.3 - 1,626.3Sales to other segments 2 0.1 0.0 -0.1 - - -Net sales 1,190.1 436.4 -0.1 1,626.3 - 1,626.3
Operating profit 46.4 19.5 -3.4 62.6 0.1 62.7Assets 650.3 163.8 132.7 946.9 - 946.9Liabilities 408.8 211.8 131.6 752.3 - 752.3Investments 12,13 13.6 3.9 2.9 20.4 - 20.4Depreciation 6 18.0 4.3 0.2 22.6 - 22.6
Average number of personnel 1,800 489 38 2,327 - 2,327
EUR million
2014External Invoicing 1,955.1 1,105.0 - 3,060.1 686.3 3,746.4Internal Invoicing 0.0 0.0 -0.1 - - -Total Invoicing 1,955.1 1,105.0 -0.1 3,060.1 686.3 3,746.4
Sales to external customers 2 1,176.5 435.8 - 1,612.3 677.8 2,290.1Sales to other segments 2 -0.0 0.0 0.0 - - -Net sales 1,176.4 435.9 0.0 1,612.3 677.8 2,290.1
Operating profit 50.5 19.2 -4.6 65.0 -107.4 -42.4Assets 624.3 150.5 99.3 874.0 - 874.0Liabilities 368.6 195.9 198.0 762.5 - 760.4Investments 12,13 21.0 4.2 0.6 25.7 8.3 34.0Depreciation 6 18.0 4.0 0.2 22.2 75.1 97.3
Average number of personnel 1,826 511 40 2,377 2,342 4,719
The chief operating decision maker of Oriola-KD is the Board of Di-rectors of Oriola-KD Corporation, who makes strategic decisions, allocates resources to the operating segments and assesses their performance.
Oriola-KD’s reportable segments are Pharmaceutical Trade Finland and Baltics and Pharmaceutical Trade Sweden. The Pharmaceutical Trade Russia reporting segment was classified as a discontinued operation in 2014, see Note 4.
Reportable segments have been combined into operating seg-ments as follows:
The Pharmaceutical Trade Finland and Baltics reportable segment comprises of Pharmaceutical Wholesale in Finland, Consumer Health and Pharmaceutical wholesale in Baltics operating segments.
1. Segment information
The Pharmaceutical Trade Sweden reportable segment comprises of Swedish retail business and Swedish wholesale business operat-ing segments.
Reportable segment results in the Oriola-KD management reports are presented without management fee.
The assets and liabilities of reportable segments include items di-rectly attributable to a segment and items which can be allocated to segments. Group items include financial items as well as items related to corporate functions. Investments are constituted by in-creases in property, plant and equipment and intangible assets.
The geographical areas of Oriola-KD’s continuing operations are Finland, Sweden, Baltic countries and other countries. Net sales are divided by the countries in which the customers are located. Assets and liabilities are divided according to the country in which they are located.
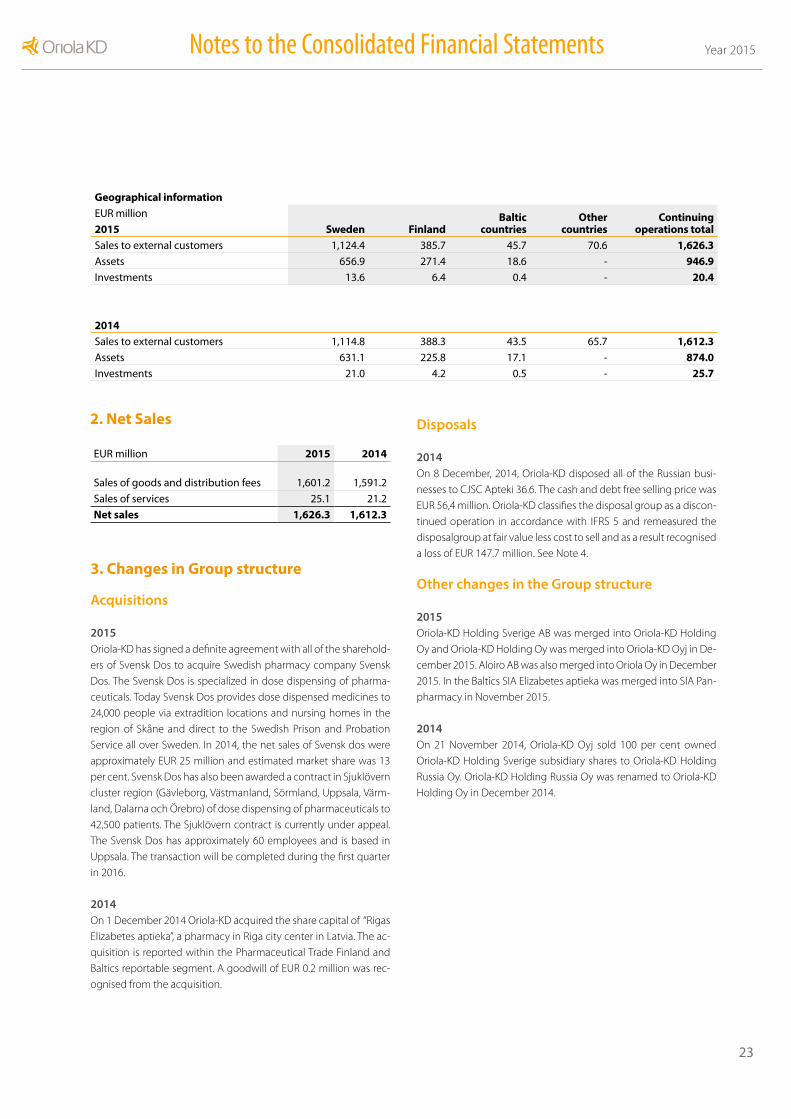
23
Year 2015 Year 2015Notes to the Consolidated Financial Statements
Geographical informationEUR million
Sweden FinlandBaltic
countriesOther
countriesContinuing
operations total2015Sales to external customers 1,124.4 385.7 45.7 70.6 1,626.3Assets 656.9 271.4 18.6 - 946.9Investments 13.6 6.4 0.4 - 20.4
2014Sales to external customers 1,114.8 388.3 43.5 65.7 1,612.3Assets 631.1 225.8 17.1 - 874.0Investments 21.0 4.2 0.5 - 25.7
3. Changes in Group structure
Acquisitions
2015Oriola-KD has signed a definite agreement with all of the sharehold-ers of Svensk Dos to acquire Swedish pharmacy company Svensk Dos. The Svensk Dos is specialized in dose dispensing of pharma-ceuticals. Today Svensk Dos provides dose dispensed medicines to 24,000 people via extradition locations and nursing homes in the region of Skåne and direct to the Swedish Prison and Probation Service all over Sweden. In 2014, the net sales of Svensk dos were approximately EUR 25 million and estimated market share was 13 per cent. Svensk Dos has also been awarded a contract in Sjuklövern cluster region (Gävleborg, Västmanland, Sörmland, Uppsala, Värm-land, Dalarna och Örebro) of dose dispensing of pharmaceuticals to 42,500 patients. The Sjuklövern contract is currently under appeal. The Svensk Dos has approximately 60 employees and is based in Uppsala. The transaction will be completed during the first quarter in 2016.
2014On 1 December 2014 Oriola-KD acquired the share capital of “Rigas Elizabetes aptieka”, a pharmacy in Riga city center in Latvia. The ac-quisition is reported within the Pharmaceutical Trade Finland and Baltics reportable segment. A goodwill of EUR 0.2 million was rec-ognised from the acquisition.
2. Net Sales
EUR million 2015 2014
Sales of goods and distribution fees 1,601.2 1,591.2
Sales of services 25.1 21.2
Net sales 1,626.3 1,612.3
Disposals
2014On 8 December, 2014, Oriola-KD disposed all of the Russian busi-nesses to CJSC Apteki 36.6. The cash and debt free selling price was EUR 56,4 million. Oriola-KD classifies the disposal group as a discon-tinued operation in accordance with IFRS 5 and remeasured the disposalgroup at fair value less cost to sell and as a result recognised a loss of EUR 147.7 million. See Note 4.
Other changes in the Group structure
2015Oriola-KD Holding Sverige AB was merged into Oriola-KD Holding Oy and Oriola-KD Holding Oy was merged into Oriola-KD Oyj in De-cember 2015. Aloiro AB was also merged into Oriola Oy in December2015. In the Baltics SIA Elizabetes aptieka was merged into SIA Pan-pharmacy in November 2015.
2014On 21 November 2014, Oriola-KD Oyj sold 100 per cent owned Oriola-KD Holding Sverige subsidiary shares to Oriola-KD Holding Russia Oy. Oriola-KD Holding Russia Oy was renamed to Oriola-KD Holding Oy in December 2014.
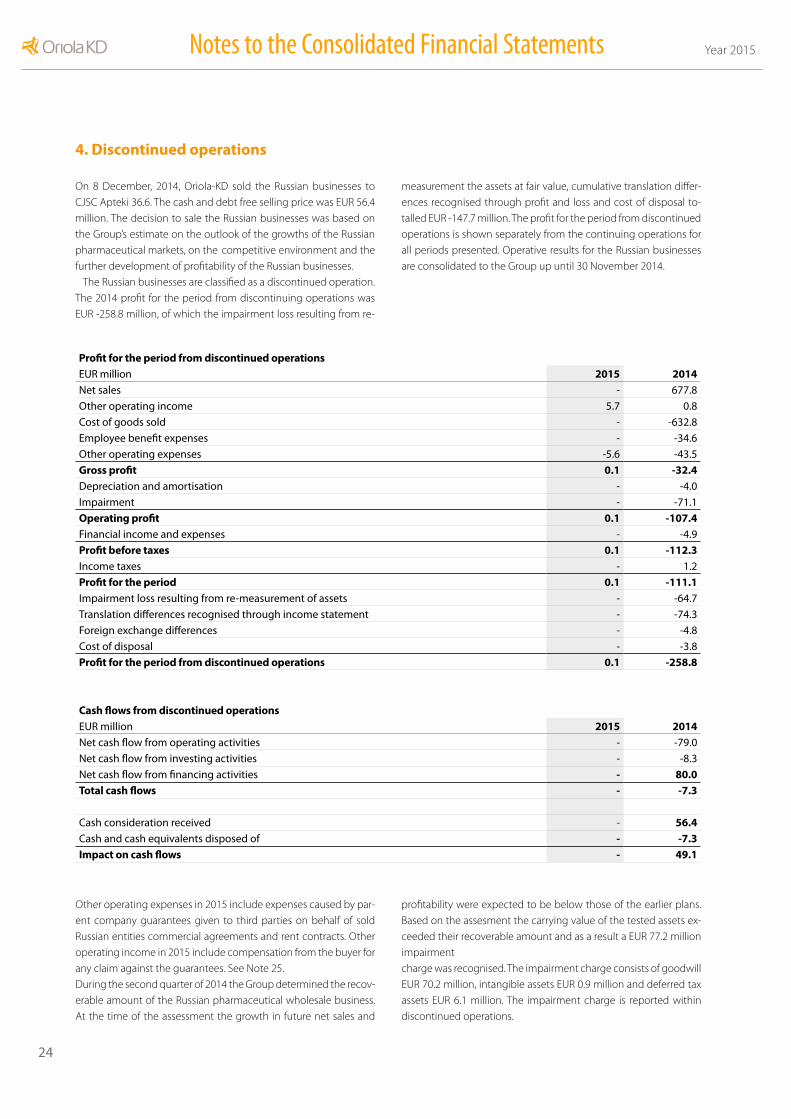
24
Year 2015Notes to the Consolidated Financial Statements
Profit for the period from discontinued operationsEUR million 2015 2014 Net sales - 677.8
Other operating income 5.7 0.8
Cost of goods sold - -632.8
Employee benefit expenses - -34.6
Other operating expenses -5.6 -43.5
Gross profit 0.1 -32.4Depreciation and amortisation - -4.0
Impairment - -71.1
Operating profit 0.1 -107.4Financial income and expenses - -4.9
Profit before taxes 0.1 -112.3Income taxes - 1.2
Profit for the period 0.1 -111.1Impairment loss resulting from re-measurement of assets - -64.7
Translation differences recognised through income statement - -74.3
Foreign exchange differences - -4.8
Cost of disposal - -3.8
Profit for the period from discontinued operations 0.1 -258.8
Cash flows from discontinued operationsEUR million 2015 2014Net cash flow from operating activities - -79.0
Net cash flow from investing activities - -8.3
Net cash flow from financing activities - 80.0Total cash flows - -7.3
Cash consideration received - 56.4Cash and cash equivalents disposed of - -7.3Impact on cash flows - 49.1
4. Discontinued operations
On 8 December, 2014, Oriola-KD sold the Russian businesses to CJSC Apteki 36.6. The cash and debt free selling price was EUR 56.4 million. The decision to sale the Russian businesses was based on the Group’s estimate on the outlook of the growths of the Russian pharmaceutical markets, on the competitive environment and the further development of profitability of the Russian businesses.
The Russian businesses are classified as a discontinued operation. The 2014 profit for the period from discontinuing operations was EUR -258.8 million, of which the impairment loss resulting from re-
measurement the assets at fair value, cumulative translation differ-ences recognised through profit and loss and cost of disposal to-talled EUR -147.7 million. The profit for the period from discontinued operations is shown separately from the continuing operations for all periods presented. Operative results for the Russian businesses are consolidated to the Group up until 30 November 2014.
Other operating expenses in 2015 include expenses caused by par-ent company guarantees given to third parties on behalf of sold Russian entities commercial agreements and rent contracts. Other operating income in 2015 include compensation from the buyer for any claim against the guarantees. See Note 25.During the second quarter of 2014 the Group determined the recov-erable amount of the Russian pharmaceutical wholesale business. At the time of the assessment the growth in future net sales and
profitability were expected to be below those of the earlier plans. Based on the assesment the carrying value of the tested assets ex-ceeded their recoverable amount and as a result a EUR 77.2 million impairmentcharge was recognised. The impairment charge consists of goodwill EUR 70.2 million, intangible assets EUR 0.9 million and deferred tax assets EUR 6.1 million. The impairment charge is reported within discontinued operations.

25
Year 2015 Year 2015Notes to the Consolidated Financial Statements
5. Other operating income and expenses
Other operating incomeEUR million 2015 2014Gain on sale of tangible and intangible assets 0.2 10.2
Rental income 0.3 0.4
Service charges 0.2 0.3
Marketing contribution 10.2 7.7
Revaluation of contingent consideration 3.4 -
Other operating income 0.6 2.4
Total 14.9 21.0
The gain on sale of tangible and intangible assets in year 2014 includes the gain on sale and leaseback agreement of Mölnlycke central warehouse in Sweden.
6. Depreciation and amortisation
EUR million 2015 2014Depreciation of tangible assets
Buildings and constructions 1.7 2.2
Machinery and equipment 10.6 10.9
Other tangible assets 2.5 1.9
Total 14.8 15.0
Amortisation of intangible assets
Intangible rights 6.7 6.3
Other capitalised expenditures 1.1 0.9
Total 7.8 7.2
Depreciation and amortisation total 22.6 22.2
Criteria applied for the amortisation is disclosed in the accounting principles of the consolidated financial statements.
Other operating expensesEUR million 2015 2014Freights and other variable costs 22.9 22.8
Marketing 14.6 13.8
IT 14.8 15.0
Office 26.3 25.4
External services 12.6 11.4
Other operating expenses 22.8 26.2
Total 113.9 114.5

26
Year 2015Notes to the Consolidated Financial Statements
9. Financial income and expenses
EUR million 2015 2014Financial incomeInterest income from loans and other receivables 0.2 0.3
Interest income for financial assets and liabilities recognised at fair value 0.1 -
Foreign exchange rate gains from financial assets and liabilities recognised at fair value - 3.2
Foreign exchange rate gains from loans and other receivables 1.9 -
Other financial income 0.0 0.0
Total 2.2 3.5
Financial expensesInterest expenses for financial assets and liabilities recognised at fair value - 0.4
Interest expenses for interest rate swaps under hedge accounting 1.0 0.5
Interest expenses for financial liabilities at amortized cost 1) 4.0 5.3
Foreign exchange rate losses from financial assets and liabilities recognised at fair value 2.3 -
Foreign exchange rate losses from loans and other receivables - 3.2
Other financial expenses 1.4 1.9
Total 8.7 11.3
Financial income and expenses total -6.5 -7.8
7. Employee benefits
EUR million 2015 2014Wages, salaries and bonuses 95.3 97.1
Share-based payments
Settlement in cash 0.3 0.0
Payment in shares 0.3 0.2
Pension costs
Defined contribution plans 31.4 32.1
Defined benefit plans 2.0 1.2
Other personnel expenses 14.6 13.2
Total 143.8 143.8
Average number of personnel 2,327 2,377
8. Audit fees
EUR million 2015 2014To member firms of PricewaterhouseCoopers Oy network
Audit 0.2 0.3
Consulting services 0.1 0.2
Total 0.3 0.6
1) Interest expenses for financial liabilities at amortised cost is adjusted according to Russian internal loan expenses EUR - (4.0) million which are presented in discontinued operations.

27
Year 2015 Year 2015Notes to the Consolidated Financial Statements
10. Income taxes
EUR million 2015 2014Taxes for current year 11.1 7.3
Taxes for previous years -0.0 0.0
Deferred taxes 0.5 3.4
Total 11.5 10.7
Taxes related to other comprehensive income
EUR million
2015 Before taxes Tax effect After taxesCash flow hedge 0.1 0.0 0.1
Actuarial gains and losses 5.5 1.1 4.4
Translation differences 3.6 - 3.6
Total 9.3 1.2 8.1
2014Cash flow hedge -1.4 -0.3 -1.1
Actuarial gains and losses -16.5 -3.3 -13.1
Translation differences 22.2 - 22.2
Total 4.3 -3.6 8.0
Reconciliation of taxes in the income statement with corporate income taxes calculated at Finnish tax rate
EUR million 2015 2014Profit before taxes 56.1 57.1
Corporate income taxes calculated at Finnish tax rate 11.2 11.4
Effect of different tax rates of foreign subsidiaries 0.7 0.7
Tax exempt income 0.0 0.0
Non-deductible expenses -0.4 -1.7
Taxes for previous years 0.0 0.0
Other items 0.0 0.3
Income taxes in the corporate income statement 11.5 10.7
Effective tax rate 20.6 % 18.7 %
Taxes entered with a positive value are recognised as expenses and taxes entered with a negative value are recognised as income.The Finnish tax rate used to calculate taxes was 20.0 per cent in the 2015 financial statements.
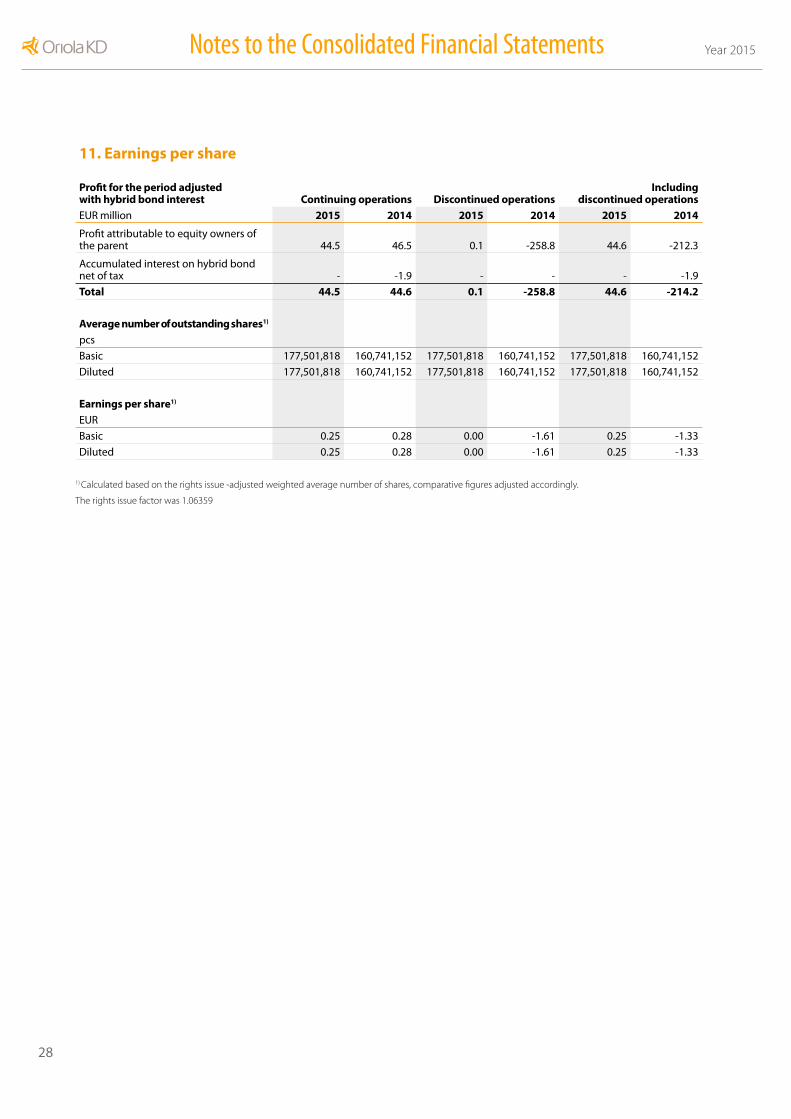
28
Year 2015Notes to the Consolidated Financial Statements
11. Earnings per share
Profit for the period adjusted with hybrid bond interest Continuing operations Discontinued operations
Including discontinued operations
EUR million 2015 2014 2015 2014 2015 2014
Profit attributable to equity owners of the parent 44.5 46.5 0.1 -258.8 44.6 -212.3
Accumulated interest on hybrid bond net of tax - -1.9 - - - -1.9
Total 44.5 44.6 0.1 -258.8 44.6 -214.2
Average number of outstanding shares1)
pcs
Basic 177,501,818 160,741,152 177,501,818 160,741,152 177,501,818 160,741,152
Diluted 177,501,818 160,741,152 177,501,818 160,741,152 177,501,818 160,741,152
Earnings per share1)
EUR
Basic 0.25 0.28 0.00 -1.61 0.25 -1.33
Diluted 0.25 0.28 0.00 -1.61 0.25 -1.33
1) Calculated based on the rights issue -adjusted weighted average number of shares, comparative figures adjusted accordingly.
The rights issue factor was 1.06359

29
Year 2015 Year 2015Notes to the Consolidated Financial Statements
12. Property, plant and equipment
EUR million 2015
Land and
water
Buildings and
constructions
Machinery and
equipment
Other tangible
assets1)
Advance payments and
constructionin progress Total
Historical cost 1 Jan 2015 2.0 49.8 75.8 24.8 1.5 153.8 Increases - 0.4 6.3 3.5 1.7 11.9 Decreases - - -3.5 -0.0 - -3.5 Reclassifications - 0.0 0.5 0.0 -0.5 0.0 Foreign exchange rate differences 0.0 0.3 1.3 0.5 0.0 2.1 Historical cost 31 Dec 2015 2.0 50.5 80.3 28.8 2.7 164.4
Accumulated depreciation 1 Jan 2015 - -30.8 -42.2 -5.7 - -78.6
Accumulated depreciation related to decreases and reclassifications - - 2.9 0.0 - 2.9 Depreciation for the financial year - -1.7 -10.6 -2.5 - -14.8 Foreign exchange rate differences - -0.2 -0.8 -0.2 - -1.1 Accumulated depreciation 31 Dec 2015 - -32.6 -50.7 -8.3 - -91.7
Carrying amount 1 Jan 2015 2.0 19.0 33.6 19.1 1.5 75.2 Carrying amount 31 Dec 2015 2.0 17.9 29.6 20.5 2.7 72.7
2014Historical cost 1 Jan 2014 6.8 71.6 76.7 20.8 4.0 179.8 Increases through acquisition of subsidiary - - 0.0 - - 0.0 Increases - 1.1 17.2 5.1 3.5 27.0 Decreases -4.5 -19.1 -4.1 - -0.0 -27.7 Divestment of business - -1.9 -15.8 - -2.9 -20.5 Reclassifications - 0.1 2.5 0.0 -2.5 0.2 Foreign exchange rate differences -0.4 -1.9 -0.8 -1.2 -0.6 -4.8 Historical cost 31 Dec 2014 2.0 49.8 75.8 24.8 1.5 153.8
Accumulated depreciation 1 Jan 2014 - -40.8 -42.1 -3.8 - -86.6
Accumulated depreciation related to decreases and reclassifications - 10.8 4.1 -0.3 - 14.6 Depreciation on disposals - 0.4 8.8 - - 9.2 Depreciation for the financial year, continuing operations - -2.2 -10.9 -1.9 - -15.0 Depreciation for the financial year, discontinued operations - -0.1 -1.2 - - -1.3 Foreign exchange rate differences - 1.0 -0.9 0.3 - 0.4 Accumulated depreciation 31 Dec 2014 - -30.8 -42.2 -5.7 - -78.6
Carrying amount 1 Jan 2014 6.8 30.8 34.6 17.0 4.0 93.1 Carrying amount 31 Dec 2014 2.0 19.0 33.6 19.1 1.5 75.2
1) The most significant share of other tangible assets is made up by refurbishment expenditures for rented premises.
Assets leased through finance lease agreements
Tangible assets include following assets leased through finance lease agreements:
EUR million 2015
Machinery and equipment Total
Historical cost 9.9 9.9Accumulated depreciation -6.8 -6.8Carrying amount 3.1 3.1
EUR million 2014
Machinery andequipment Total
Historical cost 10.1 10.1
Accumulated depreciation -5.6 -5.6
Carrying amount 4.5 4.5

30
Year 2015Notes to the Consolidated Financial Statements
13. Intangible assets
EUR million 2015 Goodwill
Intangiblerights
Otherintangible
assets 1)
Advance paymentsand construction
in progress TotalHistorical cost 1 Jan 2015 250.9 85.7 5.6 0.9 343.1 Increases - 5.6 0.5 2.5 8.5 Decreases - -1.6 -0.1 - -1.7 Reclassifications - 0.4 0.1 -0.5 -0.0 Foreign exchange rate differences 5.5 1.8 - 0.0 7.4 Historical cost 31 Dec 2015 256.5 91.9 6.0 2.9 357.2
Accumulated amortisation 1 Jan 2015 - -28.7 -2.1 - -30.8
Accumulated amortisation related to decreases and reclassifications - 1.6 0.1 - 1.7 Amortisation for the financial year - -6.7 -1.1 - -7.8 Foreign exchange rate differences - -0.7 - - -0.7 Accumulated amortisation 31 Dec 2015 - -34.5 -3.1 - -37.6
Carrying amount 1 Jan 2015 250.9 57.0 3.4 0.9 312.3 Carrying amount 31 Dec 2015 256.5 57.4 2.9 2.9 319.7
2014Historical cost 1 Jan 2014 379.0 135.6 7.6 1.8 524.0 Increases through acquisition of subsidiary 0.2 - - - 0.2 Increases - 5.4 1.1 0.3 6.8 Decreases - -3.0 -0.5 - -3.5 Divestment of business -93.9 -47.3 -2.6 - -143.9 Reclassifications - 0.2 0.8 -1.1 -0.2 Foreign exchange rate differences -34.3 -5.1 -0.9 -0.0 -40.3 Historical cost 31 Dec 2014 250.9 85.7 5.6 0.9 343.1
Accumulated amortisation 1 Jan 2014 - -68.7 -4.4 - -73.0
Accumulated amortisation related to decreases and reclassifications - 2.8 0.5 - 3.4 Accumulated amortisation and impairments on disposals 71.5 45.3 2.6 - 119.4 Amortisation for the financial year, continuing operations - -6.3 -0.9 - -7.2 Amortisation for the financial year, discontinued operations - -2.2 -0.5 - -2.7 Impairments -70.2 -0.7 -0.3 - -71.1 Foreign exchange rate differences -1.4 1.1 0.8 - 0.5 Accumulated amortisation 31 Dec 2014 - -28.7 -2.1 - -30.8
Carrying amount 1 Jan 2014 379.0 66.9 3.3 1.8 451.0 Carrying amount 31 Dec 2014 250.9 57.0 3.4 0.9 312.3
1) Other intangible assets include significant expenses for installation and specialist work related to the implementation of computer software.

31
Year 2015 Year 2015Notes to the Consolidated Financial Statements
Impairment testing of goodwill
The recoverable amount of the cash-generating units was determined in impairment testing on the basis of value-in-use calculations. Value-in-use has been determined based on discounted cash flows (DCF-model). The cash flow forecasts are based on five-year strategic plans approved by the management, which are consistent with the current business structure. Until 2014 the cash flow forecasts included also the five-year period following the strategic plans, based on the assumption that the net sales growth percentage and the operating profit percentage would normalise at the level of terminal growth. The most important assumptions in the strategic plans are estimates of overall long-term growth in the market and the market position as well as profitability of the Group companies. The Group’s investments are expected to consist of ordinary replacement investments. The foreign exchange rates used in converting the calculations into euros are those prevailing at the time of testing.
The main parameters used in the impairment testing are net sales growth percentage, operating profit percentage, terminal growth percentage and discount rate.
The five-year net sales forecasts are based on the management’s assessments of the net sales growth, market development forecasts available from external information sources (IMS) and sales growth
based on the Group’s actions. Market growth in the previous years and the Group’s growth in the previous years compared with market growth support the Group’s net sales forecasts for the coming years
The terminal growth rate used in the calculations is based on the management’s assessments of the long-term growth in cash flows. In estimating the terminal growth rate, both country-specific and business sector growth forecasts available from external informa-tion sources as well as the characteristic features of each operating segment and cash generating unit are taken into account. Terminal growth rate used for the Pharmaceutical Trade Baltics cash generat-ing unit was 2.0 per cent after 2020. The growth rate estimate for the Baltic countries by an external information source (IMS Health) for 2015-2019 is 1-4 per cent. Terminal growth rate for the Swedish cash generating units was 2.0 per cent after 2020. The growth rate esti-mate by an external information source (IMS Health) for 2015–2019 is on average 2-5 per cent.
The residual value, consisting of the discounted net present value of cash flows after year 2020, forms 81.9 (45.6) per cent of the value of the Pharmaceutical Trade Baltics cash generating unit, 73.4 (49.3) per cent of the value of the Swedish retail cash generating unit and 57.6 (50.9) per cent of the value of the Swedish wholesale cash gen-erating unit.
The discount rate used in the calculation is based on the Group’s weighted average cost of capital, taking into account the industry and country specific risks in each of the Group’s operating segment. The most important component in defining the discount rate is the long-term risk-free interest rate in the operating country. The risk-free interest rate of the Pharmaceutical Trade Baltic cash generating unit is 1.6 (1.6) per cent. The risk-free interest rate of the Swedish cash generating units is 1.8 (1.7) per cent. When defining the dis-count rates, Oriola-KD has acquired the necessary information from external information source.
Goodwill is allocated to Oriola-KD’s cash generating units as follows:
EUR million 2015 2014Pharmaceutical Trade Baltics 0.2 0.2
Swedish retail 230.3 225.3
Swedish wholesale 26.0 25.4
Carrying amount 256.5 250.9
2015Post-tax
discount rate %Pre-tax discount
rate %Operating
profit % 1)Terminal growth
%2) Net Sales growth 3)
Pharmaceutical Trade Baltics 7.3 9.1 3.6 2.0 3.0
Swedish retail 7.5 9.6 6.1 2.0 2.3
Swedish wholesale 7.5 9.6 1.6 2.0 3.4
2014Pharmaceutical Trade Baltics 7.3 9.0 3.6 1.0 4.2
Swedish retail 7.8 9.5 6.2 0.5 2.3
Swedish wholesale 7.8 9.5 1.6 0.5 4.2
1) Operating profit percentage is the average operating profit percentage over a five-year the period.2) From the beginning of year 2021.3) CAGR over a five-year period.
Projection parameters applied

32
Year 2015Notes to the Consolidated Financial Statements
During the second quarter of 2014 the Group determined the recov-erable amount of the Russian pharmaceutical wholesale business based on a revised business plan prepared by the new business area operational management, according to which the growth in future net sales and profitability were expected to be below those of the earlier plans. Based on the determination the carrying value of the tested assets exceeded their recoverable amount and as a result a EUR 70.2 million goodwill impairment charge was recognised. Af-ter the impairment, no goodwill was allocated to the the Russian wholesale business. On 8 December 2014, Oriola-KD entered into an agreement to sell its Russian businesses to the Russian pharmacy chain CJSC Apteki 36.6, upon which the Group classified the Russian businesses in accordance with IFRS 5 as a discontinued operation. The impairment charge is reported withing discontinued opera-tions in the Consolidated Statement of Comprehensive Income, see Note 4.
2015Discount rate change
%
Operating profit percentage chan-
ge %Terminal growth
change %Net Sales growth
change %Pharmaceutical Trade Baltics5) 17.1 -2.6 - -14.6
Swedish retail 2.0 -2.8 -8.7 -13.3
Swedish wholesale5) 28.5 -1.4 - -114.7
2014Pharmaceutical Trade Baltics5) 14.8 -2.2 - -9.0
Swedish retail 3.6 -2.4 -20.3 -7.2
Swedish wholesale5) - -2.3 - -46.5
4) A greater change in one of the main parameters would result in a partial impairment of goodwill, providing other key assumptions remain unchanged.5) Goodwill allocated to the Swedish wholesale cash generating unit is not sensitive to changes in the terminal growth percentage in 2015 and 2014 since the discounted cash flows from the period 2015–2020 clearly exceed the value of tested assets. Pharmaceutical Trade Baltics is not
sensitive to changes in the terminal growth percentage in 2015 or 2014 since the discounted cash flows from the period 2015–2020 clearly exceed the value of tested assets.
Change in projection parameters that causes the fair value equal to book value4)
14. Post-employment and other long term benefitsOriola-KD has defined benefit pension plans in Finland and Sweden. The Baltic Group’s subsidiaries do not have defined benefit pension plans.
In Finland, statutory pension security under the Employees’ Pen-sions Act (TyEL) is arranged through the Oriola Pension Fund for the Group’s employees, with some of the office employees enjoying a supplementary defined benefit plan. The TyEL pension plans at the Oriola Pension Fund comprise both defined benefit plans and de-fined contribution plans. The TyEL-related national disability pension obligation is recognized on the basis of the employment.
Oriola-KD has delegated the performance and position of the Finn-ish statutory pension insurance in Oriola Pension Fund to Ilmarinen Mutual Pension Insurance Company and supplementary pensions management and insurance portfolio of OP Life Assurance 31. De-cember 2015.
Oriola-KD has noted, in 2017, entering into force of the pension reform. The impact of the reform has not been included in the pen-sion calculations in 2015.
In Sweden, some of the office employees are covered by the defined benefit plan ITP 2 and others by the defined contribution plan ITP 1. The employees have a defined contribution plan accord-ing to local legislation. In ITP 2, the company can recognize the old age pension liabilities in its statement of financial position (balance sheet) or, alternatively, pay the pension expenses to the pension insurance company Alecta according to the pension plan. Oriola AB has recognized its ITP 2 old age pension liabilities in full in its statement of financial position. Oriola AB’s old age pension benefits other than ITP 2 are insured with Alecta. All of Kronans Droghandel Apotek AB’s pension benefits are defined contribution and are in-sured with Alecta.
The Group also operates a long-service benefit scheme. The long-service benefit scheme is presented as Other non-current liabilities in the statement of financial position and note 21.

33
Year 2015 Year 2015Notes to the Consolidated Financial Statements
Net defined benefit liability in the statement of financial position is defined as follows: EUR million 2015 2014Present value of funded obligations 11.8 79.3
Fair value of plan assets -2.3 -64.5
Deficit/surplus 9.6 14.9
Net liability(+) / assets (-) in the statement of financial position 9.6 14.9
Change in defined benefit obligation and plan assets
EUR millionPresent value of fun-
ded obligation Fair value of plan assets Total1 Jan 2014 61.0 -62.8 -1.8Current service cost 1.1 0.0 1.1Interest cost or income 2.4 -2.5 -0.1
64.5 -65.3 -0.8Remeasurements
Actuarial gains (-) and losses (+) arising from changes in financial assumptions 16.3 0.0 16.3Experience profits (-) or losses (+) 1.0 -0.8 0.2
81.7 -66.1 15.7
Differences in foreign exchange rates -0.4 0.0 -0.4Contributions
Employers 0.0 0.9 0.9Plan participants 0.0 -1.0 -1.0
Expenses arising from the plans
Benefits paid -2.0 1.8 -0.231 Dec 2014 79.3 -64.5 14.9Current service cost 2.1 -0.2 1.9Interest cost or income 2.0 -1.6 0.4Gains/losses on curtailement and settlements -63.5 63.2 -0.3
19.9 -3.1 16.8Remeasurements
Changes in demographical assumptions 1.7 0.0 1.7
Actuarial gains (-) and losses (+) arising from chan-ges in financial assumptions -9.2 0.0 -9.2Experience profits (-) or losses (+) 1.7 0.3 1.9
14.1 -2.8 11.2Differences in foreign exchange rates -0.2 0.0 -0.2Contributions
Employers 0.0 -1.5 -1.5Plan participants 0.0 0.0 0.0
Expenses arising from the plans
Benefits paid -2.0 2.0 0.031 Dec 2015 11.8 -2.3 9.6

34
Year 2015Notes to the Consolidated Financial Statements
Classification of fair valuesof assets in Finland
2015 2014
Listed securities
Unlisted securities
Listed securities
Unlisted securities
EUR million EUR million Percentage EUR million EUR million PercentageEquity instruments
Oriola-KD’s shares - - - 3.2 - 4.9
Other shares, developed markets - - - 19.6 1.4 31.6
Other shares, emerging markets - - - 2.2 - 3.3
Debt instruments
Governments and other general government actors - - - 5.8 - 8.7
Corporates, high credit rating (IG) - - - 13.7 - 20.5
Corporates, low credit rating (HY) - - - 15.7 - 23.5
Cash and money market investments - - - 5.0 - 7.5
Other assets1) - 2.3 100.0 - - -
Total - 2.3 100.0 65.2 1.4 100.01) Other assets are the responsibility of the insurance company and a part of the insurance company’s investment assets. The distribution in categories is
not possible to provide.
Significant actuarial assumptions 31 Dec: 2015 2014Discount rate (%) 2.5-2.6 2.5-2.6
Salary increases (%) 2.0-2.2 1.0-2.0
Mortality assumptions are made on the basis of actuarial guidelines and they are founded on statistics published in each region and on experience.

35
Year 2015 Year 2015Notes to the Consolidated Financial Statements
Effect on defined benefit pension obligation
Assumption
Change in assumption
as percen-tage point
Effect of change in assumption %
Decrease in discount rate -0.5 increase by 11.5
Increase in discount rate +0.5 reduce by 10.0
Increase in salaries +0.5 increase by 5.9
Increase in benefits +0.5 increase by 11.3
The table presents a sensitivity analysis for the most significant ac-tuarial assumptions, showing the effect of any change in actuarial assumptions on the defined benefit pension obligation.
The effects of the above sensitivity analysis have been calculated so that when the effect of the change in the assumption is calcu-lated all other assumptions are expected to remain unchanged. This is unlikely to happen and in some assumptions changes may corre-late with each other. The sensitivity of the defined benefit obligation has been calculated using the same method as in the calculation of the pension obligation to be entered in the statement of financial position (the current value of the defined benefit obligation at the end of the reporting period using the projected unit credit method).
The most significant risks arising from defined benefit pension plans:
Life expectancyMost of the plan obligations are connected with generating life-long benefits for employees and for this reason a higher life expec-tancy will mean more obligations under the plan.
Employer contributions to post-employment benefit plans are expected to be EUR 0.1 million during the 2016 financial year.
The weighted average duration of the defined benefit obligation is 20.8 years.
15. Deferred tax assets and liabilitiesDeferred tax is calculated on temporary differences between car-rying amount and taxable value. A tax receivable is calculated on adopted taxable losses of the Group companies only to the extent that they can be utilised in the future. The largest temporary differ-ences are caused by the depreciation of property, plant and equip-ment, the defined pension benefit plans and by unused losses in taxation. The deferred taxes are booked only to the extent they most probably can be utilised in the future. The deferred taxes are cal-culated using the official tax rates valid on the balance sheet date.
The Group has a deferred tax assets EUR 2.1 (1.4) million related to tax losses. The group has recognised deferred tax assets relating to all confirmed tax losses. The tax losses expires in ten years.
Sensitivity of the defined benefit obligation to changes in the most significant assumptions:

36
Year 2015Notes to the Consolidated Financial Statements
EUR million 2015
1 Jan
Items booked in income statement
Items booked in other com-
prehensive income Disposals
Translation differences 31 Dec
Deferred tax assetsConfirmed tax losses 1.4 0.7 - - - 2.1
Inventories 0.1 0.0 - - 0.1 0.2
Pension liabilities 1.2 0.0 -1.1 - - 0.1
Acquisitions 0.3 0.4 - - 0.2 0.8
Employee benefits 0.1 - - - - 0.1
Cash flow hedges 0.0 - 0.0 - - 0.0
Other 0.2 0.1 - - 0.1 0.4
Deferred tax assets total 3.3 1.2 -1.2 - 0.3 3.7
Deferred tax liabilities
Depreciation difference and other untaxed reserves 6.0 0.9 - - -0.1 6.8
Pension assets 0.0 - 0.0 - - 0.0
Acquisitions 9.8 - - - -0.2 9.6
Other -0.1 0.8 0.0 - -0.2 0.5
Deferred tax liabilities total 15.8 1.7 0.0 - -0.5 16.9
Offset against deferred tax assets 1) -1.1 - - - - -1.1
Net deferred tax liabilities 14.7 1.7 0.0 -0.5 15.8
2014Deferred tax assetsConfirmed tax losses 6.0 1.4 - -6.0 - 1.4
Inventories 0.2 -0.1 - - 0.0 0.2
Pension liabilities 1.8 -0.2 -0.3 - -0.1 1.2
Acquisitions 0.3 - - - 0.0 0.3
Divestment of business - -5.0 - 5.0 - -
Employee benefits 0.0 0.0 - - - 0.1
Cash flow hedges 0.0 - - - - 0.0
Other 0.0 0.2 - - - 0.2
Deferred tax assets total 8.3 -3.6 -0.3 -1.0 -0.1 3.3
Deferred tax liabilities
Depreciation difference and other untaxed reserves2) 3) 5.1 0.1 1.4 - -0.5 6.0
Pension assets 1.9 -0.0 -1.9 - - 0.0
Acquisitions3) 10.8 -0.4 - - -0.6 9.8
Other 0.0 0.0 -0.1 - - -0.1
Deferred tax liabilities total 17.7 -0.3 -0.6 - -1.0 15.8
Offset against deferred tax assets 1) - - -1.1 - - -1.1
Net deferred tax liabilities 17.7 -0.3 -1.7 - -1.0 14.7
1) Deferred tax assets and liabilities are offset when there is a legally enforceable right to offset current tax assets against current tax liabilities and when the deferred income taxes relate to the same fiscal authority.
2) The statement of financial position has been restated due to an error relating to prior periods. The restatement increased the deferred tax liabilities with EUR 2.1 million and decreased equity by the corresponding amount.
3) Tax bases have been reclassified from Depreciation difference and other untaxed reserves to Acquisitions to better reflect the origin of the deferred tax liability.

37
Year 2015 Year 2015Notes to the Consolidated Financial Statements
17. Trade and other receivables
2015 2014EUR million Book value Book valueTrade receivables 194.0 178.4
Prepaid expenses and accrued income 13.9 9.8
Derivatives measured at fair value through profit and loss 0.1 1.4
VAT receivables 9.0 9.7
Rental prepayments and guarantees 3.3 3.5
Prepaid expenses 6.6 2.4
Other receivables 0.6 1.7
Total 227.5 206.8
Material items included in prepaid expenses and accrued incomeEUR million 2015 2014Income tax receivable 3.3 2.1
Compensations not received 0.2 0.2
Accrued interest income - 0.0
Other receivables 10.4 7.5
Total 13.9 9.8
Allowance for impairment of trade receivablesEUR million 2015 2014Balance 1 Jan 0.1 6.3Additions 0.1 0.3
Disposed subsidiaries - -6.3
Deductions -0.1 -0.2
Balance 31 Dec 0.1 0.1
Aging and impairment of trade receivables at the closing date
2015 2015 2014 2014EUR million Gross Impairment Gross ImpairmentNot past due 185.7 - 170.7 -
Past due 1 - 30 days 8.1 - 7.3 -
Past due 31 - 180 days 0.2 - 0.4 -
Past due more than 180 days 0.1 -0.1 0.1 -0.1
Total 194.1 -0.1 178.6 -0.1
16. Inventories
EUR million 2015 2014Raw materials and consumables 0.0 0.0
Work in progress 0.3 0.4
Finished goods 200.7 184.5
Total 201.1 185.0
During the financial year 2015–2014 no material inventory write-offs were recognised.
Book value of trade and other receivables corresponds to the maxi-mum amount of credit risk relating to them at the balance sheet date. Credit risk management is described in more details in the note 24 Financial risk management.
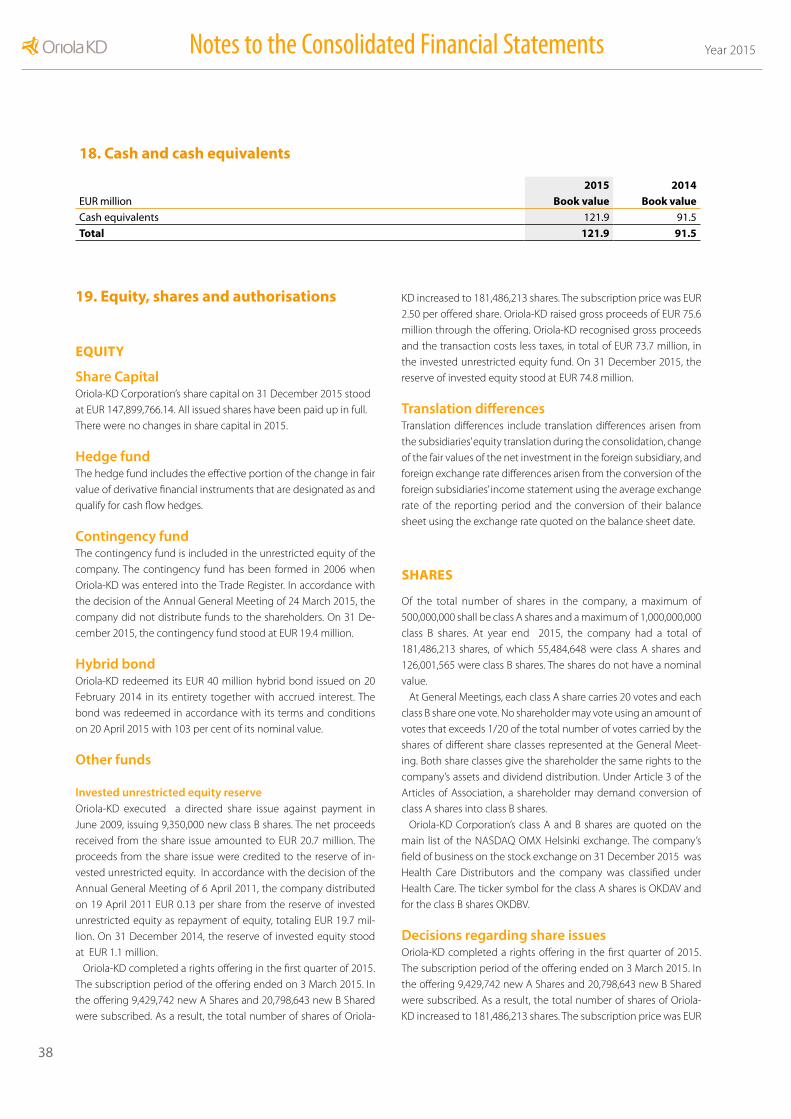
38
Year 2015Notes to the Consolidated Financial Statements
18. Cash and cash equivalents
2015 2014EUR million Book value Book valueCash equivalents 121.9 91.5
Total 121.9 91.5
19. Equity, shares and authorisations
EQUITY Share Capital Oriola-KD Corporation’s share capital on 31 December 2015 stood at EUR 147,899,766.14. All issued shares have been paid up in full. There were no changes in share capital in 2015.
Hedge fundThe hedge fund includes the effective portion of the change in fair value of derivative financial instruments that are designated as and qualify for cash flow hedges.
Contingency fundThe contingency fund is included in the unrestricted equity of the company. The contingency fund has been formed in 2006 when Oriola-KD was entered into the Trade Register. In accordance with the decision of the Annual General Meeting of 24 March 2015, the company did not distribute funds to the shareholders. On 31 De-cember 2015, the contingency fund stood at EUR 19.4 million.
Hybrid bondOriola-KD redeemed its EUR 40 million hybrid bond issued on 20 February 2014 in its entirety together with accrued interest. The bond was redeemed in accordance with its terms and conditions on 20 April 2015 with 103 per cent of its nominal value.
Other funds
Invested unrestricted equity reserveOriola-KD executed a directed share issue against payment in June 2009, issuing 9,350,000 new class B shares. The net proceeds received from the share issue amounted to EUR 20.7 million. The proceeds from the share issue were credited to the reserve of in-vested unrestricted equity. In accordance with the decision of the Annual General Meeting of 6 April 2011, the company distributed on 19 April 2011 EUR 0.13 per share from the reserve of invested unrestricted equity as repayment of equity, totaling EUR 19.7 mil-lion. On 31 December 2014, the reserve of invested equity stood at EUR 1.1 million.
Oriola-KD completed a rights offering in the first quarter of 2015. The subscription period of the offering ended on 3 March 2015. In the offering 9,429,742 new A Shares and 20,798,643 new B Shared were subscribed. As a result, the total number of shares of Oriola-
KD increased to 181,486,213 shares. The subscription price was EUR 2.50 per offered share. Oriola-KD raised gross proceeds of EUR 75.6 million through the offering. Oriola-KD recognised gross proceeds and the transaction costs less taxes, in total of EUR 73.7 million, in the invested unrestricted equity fund. On 31 December 2015, the reserve of invested equity stood at EUR 74.8 million.
Translation differencesTranslation differences include translation differences arisen from the subsidiaries’ equity translation during the consolidation, change of the fair values of the net investment in the foreign subsidiary, and foreign exchange rate differences arisen from the conversion of the foreign subsidiaries’ income statement using the average exchange rate of the reporting period and the conversion of their balance sheet using the exchange rate quoted on the balance sheet date.
SHARES
Of the total number of shares in the company, a maximum of 500,000,000 shall be class A shares and a maximum of 1,000,000,000 class B shares. At year end 2015, the company had a total of 181,486,213 shares, of which 55,484,648 were class A shares and 126,001,565 were class B shares. The shares do not have a nominal value.
At General Meetings, each class A share carries 20 votes and each class B share one vote. No shareholder may vote using an amount of votes that exceeds 1/20 of the total number of votes carried by the shares of different share classes represented at the General Meet-ing. Both share classes give the shareholder the same rights to the company’s assets and dividend distribution. Under Article 3 of the Articles of Association, a shareholder may demand conversion of class A shares into class B shares.
Oriola-KD Corporation’s class A and B shares are quoted on the main list of the NASDAQ OMX Helsinki exchange. The company’s field of business on the stock exchange on 31 December 2015 was Health Care Distributors and the company was classified under Health Care. The ticker symbol for the class A shares is OKDAV and for the class B shares OKDBV.
Decisions regarding share issues Oriola-KD completed a rights offering in the first quarter of 2015. The subscription period of the offering ended on 3 March 2015. In the offering 9,429,742 new A Shares and 20,798,643 new B Shared were subscribed. As a result, the total number of shares of Oriola-KD increased to 181,486,213 shares. The subscription price was EUR

39
Year 2015 Year 2015Notes to the Consolidated Financial Statements
2.50 per offered share. Oriola-KD raised gross proceeds of EUR 75.6 million through the offering.
Treasury sharesThe company holds 124,024 of the company’s class B shares, repre-senting approximately 0.07 per cent of the total number of company shares and approximately 0.01 per cent of the total number of votes.
Share trading and pricesIn 2015 the traded volume of Oriola-KD Corporation shares, exclud-ing treasury shares, corresponded to 21.9 per cent of the total num-ber of shares. The traded volume of class A shares amounted to 5.5 per cent of the average stock, and that of class B shares, excluding treasury shares, to 29.3 per cent of the average stock.
The average share price of Oriola-KD Corporation’s class A shares was EUR 4.01 and of its class B shares EUR 4.06. The market value of all Oriola-KD Corporation shares at 31 December 2015 was EUR 779.6 million, of which the market value of class A shares was EUR 235.3 million and of class B shares EUR 544.3 million.
ShareholdersOn 31 December 2015, Oriola-KD Corporation had a total of 28,935 registered shareholders. There were 28,311,696 nominee-registered shares on 31 December 2015, corresponding to 15.6 per cent of all shares and 6.1 per cent of all votes.
Share conversionsUnder Article 3 of the Articles of Association, a shareholder may demand conversion of class A shares into class B shares. During the period 1 January – 31 December 2015, 1,093,804 (-) class A shares were converted into class B shares.
Management shareholdingsOn 31 December 2015, the members of the company’s Board of Di-rectors and the President and CEO, the deputy to the President and CEO and the companies controlled by them had a total of 633,157 shares, corresponding to 0.35 per cent of the total number of shares in the company and 0.05 per cent of the votes.
Dividend policy and distribution proposalThe Board of Directors of Oriola-KD Corporation has on 24 Novem-ber 2010 confirmed the dividend policy of the Oriola-KD Group. Oriola-KD will seek to pay out annually as dividends approximately 50 per cent of earnings per share. The Company’s strategy and finan-cial position shall be taken into consideration when determining the annual dividend payout ratio.
The Board proposes to the Annual General Meeting that a divi-dend of EUR 0.13 (-) per share is paid for 2015.
AuthorisationThe Annual General Meeting (AGM), held on 30 March 2015, author-ised the Board of Directors to decide on a share issue against pay-ment in one or more issues. The authorisation comprises the right
to issue new shares or assign treasury shares held by the company. The authorisation covers a maximum of 5,650,000 Class A shares and 12,500,000 Class B shares and includes the right to derogate from the shareholders’ pre-emptive subscription right. Pursuant to the au-thorisation, shares held by the company as treasury shares may also be sold through trading on a regulated market organised by NAS-DAQ OMX Helsinki Ltd. The authorisation is in effect for a period of eighteen months from the decision of the Annual General Meeting.
The AGM authorised the Board of Directors to decide on a share issue against payment in one or more issues. The authorisation com-prises the right to issue new class B shares or assign class B treasury shares held by the company. The authorisation covers a combined maximum of 18,000,000 class B shares of the company and includes the right to derogate from the shareholders’ pre-emptive subscrip-tion right. Pursuant to the authorisation, class B shares held by the Company as treasury shares may also be sold on regulated market organised by NASDAQ OMX Helsinki Ltd. The authorisation is in ef-fect for a period of eighteen months from the decision of the Annual General Meeting.
The authorisation revokes all previous share issue authorisations given to the Board of Directors apart from the authorisation given to the Board of Directors by the Annual General Meeting held on 20 March 2013, pursuant to which the Board of Directors may decide upon directed share issues against or without a payment concern-ing no more than 1,715,000 class B shares in order to execute the share-based incentive plan for the Oriola-KD Group’s executives and the share savings plan for the Oriola-KD Group’s key personnel.
The AGM also authorised the Board of Directors to decide on re-purchasing of the company’s own class B shares. The authorisation entitles the Board of Directors to decide on the repurchase of no more than 18,000,000 of the company’s own class B shares in a pro-portion other than in which shares are owned by the shareholders. The authorisation to repurchase own shares is in force for a period of not more than eighteen months from the decision of the An-nual General Meeting. Shares may be repurchased to develop the company’s capital structure, to execute corporate transactions or other business arrangements, to finance investments, to be used as a part of the company’s incentive schemes or to be otherwise relinquished, held by the company or cancelled.
Other authorisationsThe company’s Board of Directors holds no other authorisations concerning share issues, share options or other special rights.
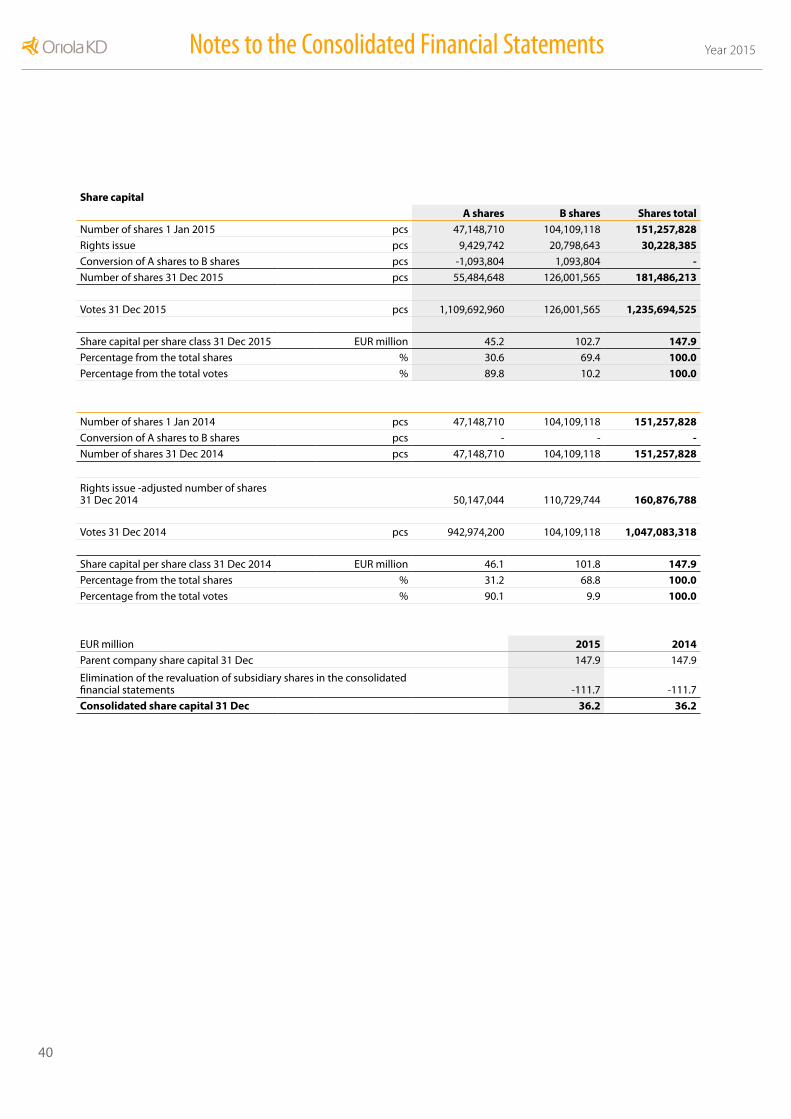
40
Year 2015Notes to the Consolidated Financial Statements
Share capitalA shares B shares Shares total
Number of shares 1 Jan 2015 pcs 47,148,710 104,109,118 151,257,828Rights issue pcs 9,429,742 20,798,643 30,228,385Conversion of A shares to B shares pcs -1,093,804 1,093,804 -Number of shares 31 Dec 2015 pcs 55,484,648 126,001,565 181,486,213
Votes 31 Dec 2015 pcs 1,109,692,960 126,001,565 1,235,694,525
Share capital per share class 31 Dec 2015 EUR million 45.2 102.7 147.9Percentage from the total shares % 30.6 69.4 100.0Percentage from the total votes % 89.8 10.2 100.0
Number of shares 1 Jan 2014 pcs 47,148,710 104,109,118 151,257,828Conversion of A shares to B shares pcs - - -Number of shares 31 Dec 2014 pcs 47,148,710 104,109,118 151,257,828
Rights issue -adjusted number of shares 31 Dec 2014 50,147,044 110,729,744 160,876,788
Votes 31 Dec 2014 pcs 942,974,200 104,109,118 1,047,083,318
Share capital per share class 31 Dec 2014 EUR million 46.1 101.8 147.9Percentage from the total shares % 31.2 68.8 100.0Percentage from the total votes % 90.1 9.9 100.0
EUR million 2015 2014Parent company share capital 31 Dec 147.9 147.9
Elimination of the revaluation of subsidiary shares in the consolidated financial statements -111.7 -111.7
Consolidated share capital 31 Dec 36.2 36.2

41
Year 2015 Year 2015Notes to the Consolidated Financial Statements
20. Borrowings
2015 2014EUR million Book value Book valueNon-currentLoans from financial institutions 65.3 80.9
Finance lease liabilities 1.6 2.8
Contingent consideration 1) - 14.7
Total 66.9 98.5
CurrentLoans from financial institutions 10.9 21.3
Issued commercial papers 13.0 51.8
Advances received 23.9 20.6
Finance lease liabilities 1.6 1.7
Contingent consideration 1) 12.4 -
Total 61.7 95.41) Contingent consideration is in fair value, additional information in note 27.
Maturity of non-current interest-bearing liabilitiesEUR million 2015 20141-5 years 66.9 98.5
More than five years - -
Total 66.9 98.5
Interest-bearing liabilities by currency
EUR million 2015 2014EUR 37.1 92.8
SEK 91.5 101.1
Total 128.6 193.9
Maturity of finance lease liabilitiesEUR million 2015 2014Within one year 1.7 1,8
Within 1-5 years 1.6 3.0
Unearned financial expense -0.1 -0.3
Total 3.2 4.5
Present value of minimum lease paymentsEUR million 2015 2014Within one year 1.6 1.7
Within 1-5 years 1.6 2.8
Total 3.2 4.5

42
Year 2015Notes to the Consolidated Financial Statements
22. Trade payables and other current liabilities
2015 2014EUR million Book value Book valueTrade payables 547.7 494.3
Accrued liabilities and deferred income 39.3 32.3
Derivatives at fair value through profit and loss 1.3 0.3
Other current liabilities 7.5 9.1
Total 595.9 536.0
Material items included in accrued liabilities and deferred incomeEUR million 2015 2014Accrued wages, salaries and social security payments 19.0 19.0
Income tax liability 11.7 5.6
Other accrued liabilities and deferred income 8.7 7.6
Total 39.3 32.3
23. Provisions
EUR million Restructuring provision Other provisions TotalProvisions 1 Jan 2014 3.0 - 3.0Increase - 0.4 0.4Decrease -2.8 - -2.8Provisions 31 Dec 2014 0.2 0.4 0.6Increase - - -Decrease -0.2 -0.4 -0.6Provisions 31 Dec 2015 - - -
24. Financial risk management
The financial risks relating to the business operations of the Oriola-KD are managed in accordance with the treasury policy approved by the Board of Directors. Oriola-KD’s centralized Group Treasury is responsible for implementing, monitoring and reporting of the treasury policy
Oriola-KD’s Group Treasury’s main objectives are to maintain solid long-term financial position and secure daily liquidity of the Group and to efficiently manage currency and interest rate risks.
The objective of financial risk management is to hedge against unfavorable changes in the finanacial markets and to minimise the impact of foreign exchange, interest rate, refinancing and liquidity risks on the Group’s cash reserves, profits and shareholders’ equity. Approved hedging instruments are set in the treasury policy.
Currency riskThe most important country-specific operating currencies for Orio-la-KD are the euro (EUR) and the Swedish krona (SEK). A substantial proportion of procurements and sales are conducted in the op-erating currencies of the subsidiaries, which considerably reduces the operating currency risk. In accordance with its treasury policy, Oriola-KD’s internal loans and deposits are denominated in the local currency of each subsidiary.
Transaction riskTransaction risks arise from commercial and finance-related transac-tions and payments made by the business units, which are denomi-nated in a currency other than the unit’s operating currency. Due to
21. Other non-current liabilities
2015 2014EUR million Book value Book valueDerivatives designated as hedges 1.6 1.7
Other non-current liabilities1) 0.5 0.5
Total 2.1 2.21) Other non-current liabilities consist of long-service benefit liability.

43
Year 2015 Year 2015Notes to the Consolidated Financial Statements
the nature of business operations, Oriola-KD’s transaction risks are minor. In accordance with its treasury policy, Oriola-KD’s internal loans and deposits are denominated in the local currency of each subsidiary, mainly in Swedish krona. In addition Oriola-KD Corpora-tion had a EUR 76,2 (-) million Swedish krona denominated external loan on the balance sheet date. In accordance of the treasury policy, transaction risk arising from balance sheet items recognized in the income statement is aimed to be fully hedged with derivatives. On the balance sheet date Swedish krona denominated transaction position was EUR 4.8 (3.5) million.
Translation riskOriola-KD’s most significant translation risk concerns items in Swed-ish krona. Translation risks arise from capital investments and good-will in foreign subsidiaries. On the balance sheet date Oriola-KD had not hedged the equity-related translation risks. On the balance sheet date Swedish krona denominated translation risk position was EUR 231.9 (158.0) million.
Currency risk sensitivity analysisEffect of a 10 per cent weakening/strengthening of Swedish krona would effect Oriola-KD’s earnings after taxes EUR -/+0.4 (-/+0.3) mil-lion and in Group equity EUR -/+21.1 (-/+14.4) million.
Liquidity riskThe objective of liquidity risk management is to maintain adequate liquid assets and revolving credit facilities so that Oriola-KD is able to meet all of its financial obligations. The Group’s liquidity man-agement is based on 12-month cash flow forecasts and four-week rolling cash flow forecasts drawn up on a weekly basis. Oriola-KD has diversified its refinancing risk among a number of different counter-parties and various financing sources.
Oriola-KD’s liquidity position is secured with a EUR 100.0 (100.0) million committed credit facility that expires on 2018 and with short-term uncommitted credit account limits of EUR 35.4 (55.6) million. Facilities were unused on the balance sheet date. In addition Oriola-KD has an EUR 200.0 (200.0) million uncommitted commercial paper programme of which EUR 13.0 (51.8) million had been issued on the balance sheet date. Oriola-KD’s cash and cash equivalents totalled EUR 121.9 (91.5) million at the end of December 2015.
Oriola-KD’s net working capital was EUR -152.6 (-130.9) million on the balance sheet date. Oriola-KD’s net working capital was negative on the balance sheet date owing to the terms of payment defined in principal and customer agreements and to the non-recourse factoring programs used in the retail and wholesale businesses in Sweden. The Group’s principal and customer agreements are based on established, long-term agreements, and no significant changes are anticipated in them during 2016.
Oriola-KD has open-ended frame agreements in Sweden that allows the company to sell trade receivables relating to Swedish retail and wholesale businesses to the financial institutions on non-recourse basis. Sales of non-recourse trade receivables totalled EUR 114.6 (100.1) million on the balance sheet date. No significant changes are anticipated in the scope of the programmes in 2016.
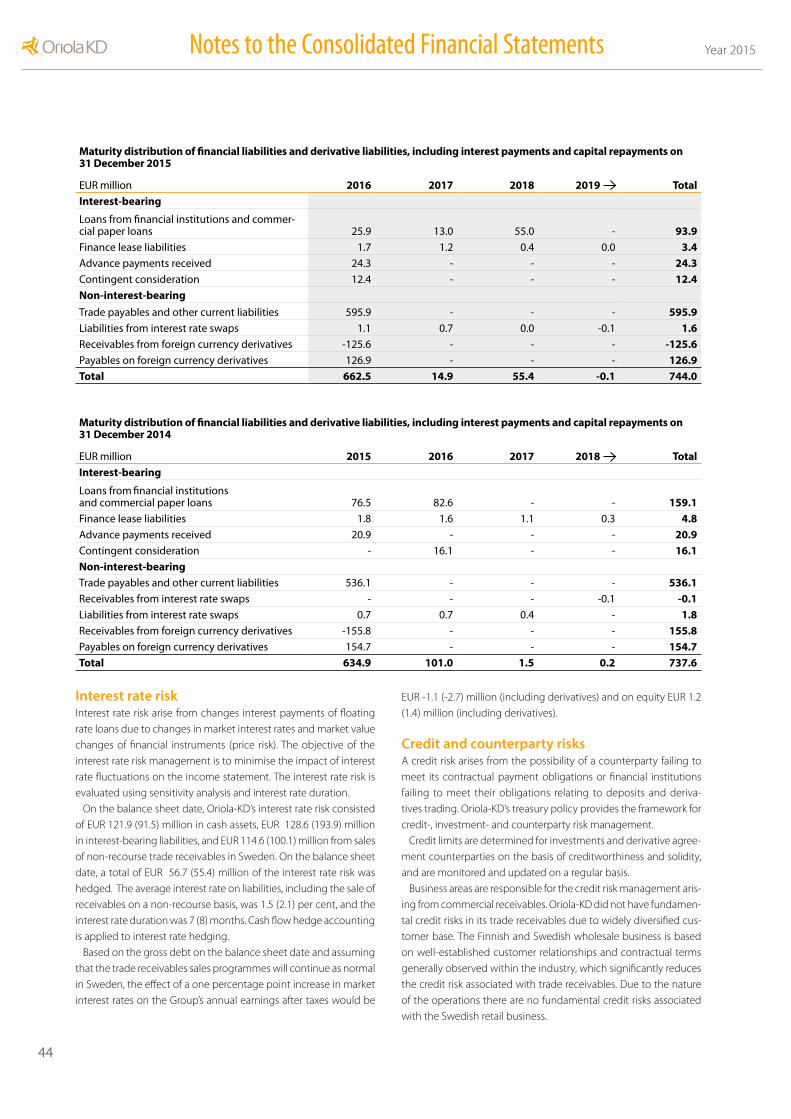
44
Year 2015Notes to the Consolidated Financial Statements
Interest rate riskInterest rate risk arise from changes interest payments of floating rate loans due to changes in market interest rates and market value changes of financial instruments (price risk). The objective of the interest rate risk management is to minimise the impact of interest rate fluctuations on the income statement. The interest rate risk is evaluated using sensitivity analysis and interest rate duration.
On the balance sheet date, Oriola-KD’s interest rate risk consisted of EUR 121.9 (91.5) million in cash assets, EUR 128.6 (193.9) million in interest-bearing liabilities, and EUR 114.6 (100.1) million from sales of non-recourse trade receivables in Sweden. On the balance sheet date, a total of EUR 56.7 (55.4) million of the interest rate risk was hedged. The average interest rate on liabilities, including the sale of receivables on a non-recourse basis, was 1.5 (2.1) per cent, and the interest rate duration was 7 (8) months. Cash flow hedge accounting is applied to interest rate hedging.
Based on the gross debt on the balance sheet date and assuming that the trade receivables sales programmes will continue as normal in Sweden, the effect of a one percentage point increase in market interest rates on the Group’s annual earnings after taxes would be
EUR -1.1 (-2.7) million (including derivatives) and on equity EUR 1.2 (1.4) million (including derivatives).
Credit and counterparty risksA credit risk arises from the possibility of a counterparty failing to meet its contractual payment obligations or financial institutions failing to meet their obligations relating to deposits and deriva-tives trading. Oriola-KD’s treasury policy provides the framework for credit-, investment- and counterparty risk management.
Credit limits are determined for investments and derivative agree-ment counterparties on the basis of creditworthiness and solidity, and are monitored and updated on a regular basis.
Business areas are responsible for the credit risk management aris-ing from commercial receivables. Oriola-KD did not have fundamen-tal credit risks in its trade receivables due to widely diversified cus-tomer base. The Finnish and Swedish wholesale business is based on well-established customer relationships and contractual terms generally observed within the industry, which significantly reduces the credit risk associated with trade receivables. Due to the nature of the operations there are no fundamental credit risks associated with the Swedish retail business.
Maturity distribution of financial liabilities and derivative liabilities, including interest payments and capital repayments on 31 December 2015
EUR million 2016 2017 2018 2019 TotalInterest-bearing
Loans from financial institutions and commer-cial paper loans 25.9 13.0 55.0 - 93.9Finance lease liabilities 1.7 1.2 0.4 0.0 3.4Advance payments received 24.3 - - - 24.3Contingent consideration 12.4 - - - 12.4Non-interest-bearing Trade payables and other current liabilities 595.9 - - - 595.9Liabilities from interest rate swaps 1.1 0.7 0.0 -0.1 1.6Receivables from foreign currency derivatives -125.6 - - - -125.6Payables on foreign currency derivatives 126.9 - - - 126.9Total 662.5 14.9 55.4 -0.1 744.0
Maturity distribution of financial liabilities and derivative liabilities, including interest payments and capital repayments on 31 December 2014
EUR million 2015 2016 2017 2018 TotalInterest-bearing
Loans from financial institutions and commercial paper loans 76.5 82.6 - - 159.1Finance lease liabilities 1.8 1.6 1.1 0.3 4.8Advance payments received 20.9 - - - 20.9Contingent consideration - 16.1 - - 16.1Non-interest-bearing Trade payables and other current liabilities 536.1 - - - 536.1Receivables from interest rate swaps - - - -0.1 -0.1Liabilities from interest rate swaps 0.7 0.7 0.4 - 1.8Receivables from foreign currency derivatives -155.8 - - - 155.8Payables on foreign currency derivatives 154.7 - - - 154.7Total 634.9 101.0 1.5 0.2 737.6
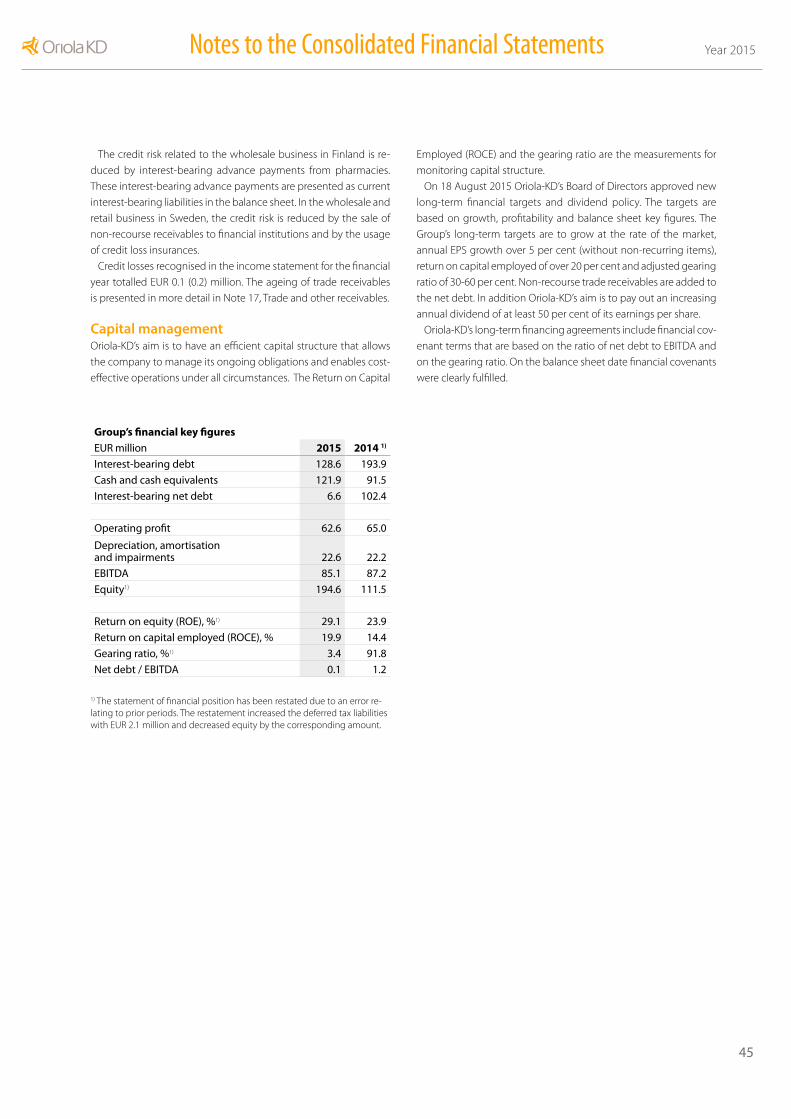
45
Year 2015 Year 2015Notes to the Consolidated Financial Statements
The credit risk related to the wholesale business in Finland is re-duced by interest-bearing advance payments from pharmacies. These interest-bearing advance payments are presented as current interest-bearing liabilities in the balance sheet. In the wholesale and retail business in Sweden, the credit risk is reduced by the sale of non-recourse receivables to financial institutions and by the usage of credit loss insurances.
Credit losses recognised in the income statement for the financial year totalled EUR 0.1 (0.2) million. The ageing of trade receivables is presented in more detail in Note 17, Trade and other receivables.
Capital managementOriola-KD’s aim is to have an efficient capital structure that allows the company to manage its ongoing obligations and enables cost-effective operations under all circumstances. The Return on Capital
Employed (ROCE) and the gearing ratio are the measurements for monitoring capital structure.
On 18 August 2015 Oriola-KD’s Board of Directors approved new long-term financial targets and dividend policy. The targets are based on growth, profitability and balance sheet key figures. The Group’s long-term targets are to grow at the rate of the market, annual EPS growth over 5 per cent (without non-recurring items), return on capital employed of over 20 per cent and adjusted gearing ratio of 30-60 per cent. Non-recourse trade receivables are added to the net debt. In addition Oriola-KD’s aim is to pay out an increasing annual dividend of at least 50 per cent of its earnings per share.
Oriola-KD’s long-term financing agreements include financial cov-enant terms that are based on the ratio of net debt to EBITDA and on the gearing ratio. On the balance sheet date financial covenants were clearly fulfilled.
Group’s financial key figuresEUR million 2015 2014 1)
Interest-bearing debt 128.6 193.9
Cash and cash equivalents 121.9 91.5
Interest-bearing net debt 6.6 102.4
Operating profit 62.6 65.0
Depreciation, amortisation and impairments 22.6 22.2
EBITDA 85.1 87.2
Equity1) 194.6 111.5
Return on equity (ROE), %1) 29.1 23.9
Return on capital employed (ROCE), % 19.9 14.4
Gearing ratio, %1) 3.4 91.8
Net debt / EBITDA 0.1 1.2
1) The statement of financial position has been restated due to an error re-lating to prior periods. The restatement increased the deferred tax liabilities with EUR 2.1 million and decreased equity by the corresponding amount.

46
Year 2015Notes to the Consolidated Financial Statements
26. Derivatives
EUR million Positive fair value
Negative fair value
Nominal value2015
Derivatives recognised as cash flow hedgesInterest rate swaps - 1.6 56.6
Derivatives measured at fair value through profit and lossForeign currency forward and swap contracts - 1.2 126.9
2014Derivatives recognised as cash flow hedgesInterest rate swaps - 1.7 55.4
Derivatives measured at fair value through profit and lossForeign currency forward and swap contracts 1.0 - 154.7
25. Commitments and contingencies
EUR million 2015 2014Commitments for own liabilitiesGuarantees on behalf of own companies 8.5 8.1
Guarantees on behalf of other companies 2.0 22.0
Mortgages on company assets 2.3 2.2
Other guarantees and liabilities 1.0 1.1
Accumulated interest on hybrid bond - 2.4
Total 13.7 35.8
Leasing commitments 0.7 0.8
Derivatives that are open on the balance sheet date fall due in next twelve months period except interest rate swaps recognised as cash flow hedges.
Interest rate risk relating to cash flow from Oriola AB’s selling of trade receivables has been hedged with interest rate swaps. The fair value of interest rate derivatives is defined by cash flows due to contracts. These interest rate swaps are wholly designated as cash flow hedges and their changes in fair value related to the effective portion of the hedge are recognised in other comprehensive in-come and the potential ineffective part is recognised in the income statement.
The fair value of foreign currency forward and swap contracts and interest rate swaps fall due in next twelve months is quoted based on market value on the balance sheet date. The Group had no open foreign currency forward or swap contracts used as cash flow hedges at the end of 2015.
Fair values of the derivatives have been booked to balance sheet in gross amount as the derivatives contracts are related to credit events and can not be netted in financial statements. The Group has not given nor received collateral to/from derivatives counterparties.
Oriola-KD has derivative positions with several banks and relat-ed transactions are effected under master derivative agreements. Master derivative agreements allow to settle on a net basis all out-standing items within the scope of the agreement for example in the event of bankruptcy. On the balance sheet date, the remaining counterparty risk after net settlement, as allowed in master deriva-tive agreements, was EUR 0.1 (1.2) for Oriola-KD and EUR 2.9 (1.9) million for the counterparties.
The nominal amount of foreign currency derivatives is the euro equivalent of the contracts´currency denominated amount on the balance sheet date.
Guarantees on behalf of other companies include parent company guarantees given to third parties on behalf of sold Russian entities commercial agreements and rent contracts. In accordance of frame-work agreement the buyer undertakes to compensate Oriola-KD for any claim against the guarantees. In addition the buyers bank has given Oriola-KD in aggregate EUR 4.1 million counter guarantee mainly subject to parent company guarantees of the commercial agreements. Guarantees on behalf of other companies will expire in 2016.
The most significant guarantees are bank guarantees against trade payables in wholesale company in Sweden. In addition, Oriola-KD Corporation has granted parent company guarantees of EUR 2.8 (4.7) million against subsidiaries’ trade payables.

47
Year 2015 Year 2015Notes to the Consolidated Financial Statements
27. Book values and fair values of financial assets and financial liabilities
Note2015 2015 2014 2014
EUR million Fair value Book value Fair value Book valueFinancial assets recognised at fair value through profit and lossDerivatives measured at fair value through profit and loss 17 0.1 0.1 1.4 1.4
Loans and other receivablesCash equivalents 18 121.9 121.9 91.5 91.5
Trade receivables and other receivables 17 227.4 227.4 205.4 205.4
Financial assets total 349.4 349.4 298.3 298.3
Derivatives designated as hedges 21 1.6 1.6 1.7 1.7
Other non-current liabilities 21 0.5 0.5 0.5 0.5
Financial liabilities recognised at fair value through profit and loss Derivatives measured at fair value through profit and loss 22 1.3 1.3 0.3 0.3
Contingent consideration 20 12.4 12.4 14.7 14.7
Financial liabilities measured at amortised costNon-current interest-bearing liabilities 20 66.9 66.9 83.8 83.8
Current interest-bearing liabilities 20 49.3 49.3 95.4 95.4
Trade payables and other current liabilities 22 594.9 594.9 536.1 536.1
Financial liabilities total 726.5 726.5 732.5 732.5
Reconciliation of financial liabilities recognised at fair value through profit and loss according to the level 3EUR million 2015 2014Book value 1 Jan 14.7 14.6Bookings to financial expenses 0.9 1.0
Change in fair value recognised in other operating income -3.4 -Translation differences 0.2 -0.9
Book value 31 Dec 12.4 14.7
Fair value hierarchyEUR million
2015 Level 1 Level 2 Level 3 TotalAssetsDerivatives measured at fair value through profit and loss - 0.1 - 0.1LiabilitiesDerivatives designated as hedges - 1.6 - 1.6Derivatives measured at fair value through profit and loss - 1.3 1.3Non-current interest bearing liability - 76.4 - 76.4Contingent consideration - - 12.4 12.4
2014AssetsDerivatives measured at fair value through profit and loss - 1.4 - 1.4LiabilitiesDerivatives designated as hedges - 1.7 - 1.7Derivatives measured at fair value through profit and loss - 0.3 - 0.3Non-current interest bearing liability - 82.9 - 82.9Contingent consideration - - 14.7 14.7
Level 1: Quoted prices (unadjusted) in active markets for identical assets or liabilities.Level 2: Inputs other than quoted prices included within level 1 that are observable for the asset or liability. either directly (i.e. as prices) or indirectly (i.e. derived from prices).Level 3: Inputs for the asset or liability that are not based on observable market data (i.e. unobservable inputs).
Financial liabilities recognised at fair value through profit and loss (level 3) include estimated discounted fair value of a contingent consideration related to the Medstop acquisition. Payment of the contingent consideration will be based on 2015 EBITDA of Oriola-KD’s combined Swedish retail businesses and will be paid in first quarter of 2016. The fair value of the contingent consideration has been calculated using discounted cash flow method. The discount rate used in the valuation is determined using the weighted average cost of capital of the Group.
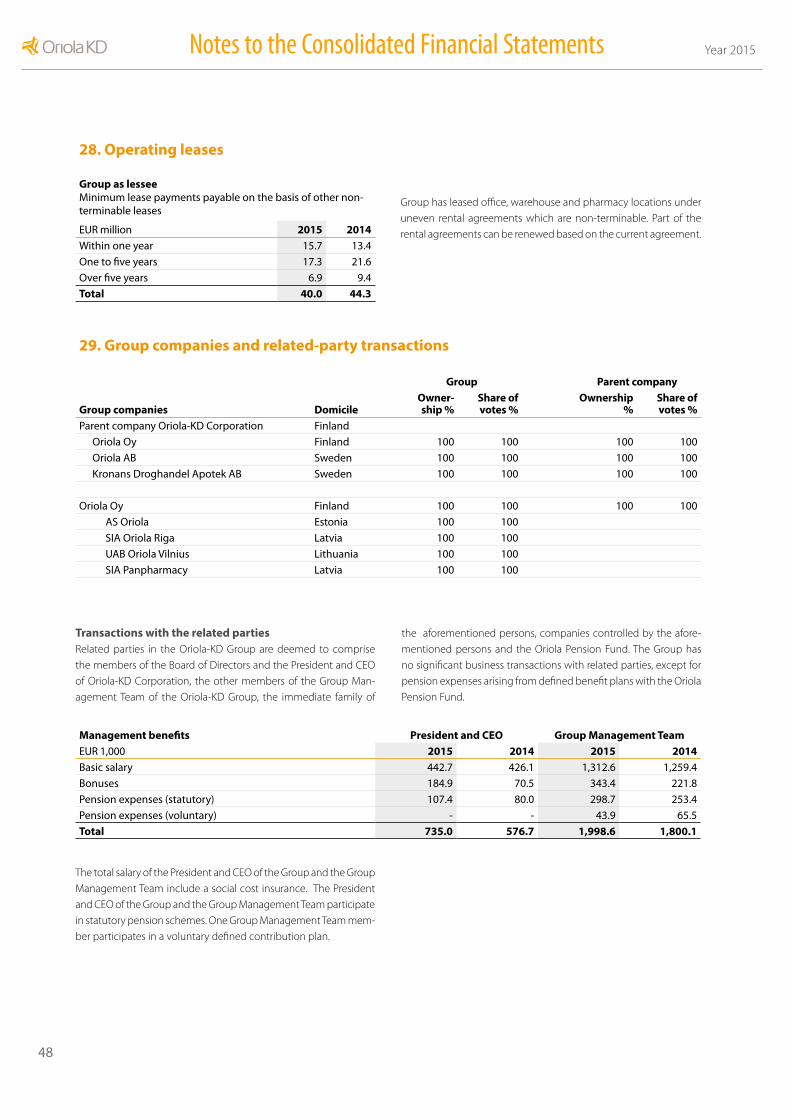
48
Year 2015Notes to the Consolidated Financial Statements
29. Group companies and related-party transactions
Group Parent company
Group companies DomicileOwner-ship %
Share of votes %
Ownership %
Share of votes %
Parent company Oriola-KD Corporation Finland
Oriola Oy Finland 100 100 100 100
Oriola AB Sweden 100 100 100 100
Kronans Droghandel Apotek AB Sweden 100 100 100 100
Oriola Oy Finland 100 100 100 100
AS Oriola Estonia 100 100
SIA Oriola Riga Latvia 100 100
UAB Oriola Vilnius Lithuania 100 100
SIA Panpharmacy Latvia 100 100
Transactions with the related partiesRelated parties in the Oriola-KD Group are deemed to comprise the members of the Board of Directors and the President and CEO of Oriola-KD Corporation, the other members of the Group Man-agement Team of the Oriola-KD Group, the immediate family of
the aforementioned persons, companies controlled by the afore-mentioned persons and the Oriola Pension Fund. The Group has no significant business transactions with related parties, except for pension expenses arising from defined benefit plans with the Oriola Pension Fund.
28. Operating leases
Group as lesseeMinimum lease payments payable on the basis of other non-terminable leases
EUR million 2015 2014Within one year 15.7 13.4
One to five years 17.3 21.6
Over five years 6.9 9.4
Total 40.0 44.3
Group has leased office, warehouse and pharmacy locations under uneven rental agreements which are non-terminable. Part of the rental agreements can be renewed based on the current agreement.
Management benefits President and CEO Group Management TeamEUR 1,000 2015 2014 2015 2014Basic salary 442.7 426.1 1,312.6 1,259.4
Bonuses 184.9 70.5 343.4 221.8
Pension expenses (statutory) 107.4 80.0 298.7 253.4
Pension expenses (voluntary) - - 43.9 65.5
Total 735.0 576.7 1,998.6 1,800.1
The total salary of the President and CEO of the Group and the Group Management Team include a social cost insurance. The President and CEO of the Group and the Group Management Team participate in statutory pension schemes. One Group Management Team mem-ber participates in a voluntary defined contribution plan.

49
Year 2015 Year 2015Notes to the Consolidated Financial Statements
Key personnel incentive plan 2010–2012On 10 February 2010, Oriola-KD’s Board of Directors decided on a share based incentive scheme for the Group’s approximately 40 key personnel for the years 2010–2012. The scheme had three earn-ing periods, which were calendar years 2010, 2011 and 2012. The company’s Board of Directors decided on the earning criteria for the earning period and the targets to be set for these at the start of each earning period. The payment under the scheme for the earning period 2012 was be based on achievement of Oriola-KD Group’s business specific strategic targets.
The reward from the earning period 2012 was paid in 2013 partly in Company’s class B-shares and partly in cash. The proportion paid as cash covered the taxes and tax-like charges associated with the reward. No reward was paid if a key person’s employment or ser-vice with a Group company ended before the reward payment. The shares could not be transferred during a restriction period, which ended two years from the end of the restriction period. The restric-tion period for earning period 2012 ended 31 December 2014. The President and CEO of the Company and the members of the Group Management Team must hold 50 per cent of the shares received on the basis of the plan as long as his/her employment or service with a Group company continues. In total 277,257 company’s class B shares were granted under the scheme.
The expenses recognised for Key personnel incentive plan 2010-2012 were EUR - (0.2) million in 2015.
Further details the shareholdings of the members of the Board of Directors and the management are outlined within the section on shares and shareholders.
Executives incentive plan 2013–2015On 19 December 2012, Oriola-KD’s Board of Directors approved a share-based incentive plan for the Group executives. The target group of the new Plan during the performance periods 2015 and 2014 consists of approximately ten executives, of which six partici-pants are named. The Plan includes three performance periods, cal-endar years 2013, 2014 and 2015. The company’s Board of Directors decides on the earning criteria for the earning period and the targets to be set for these at the start of each earning period. The potential reward from the plan for the performance period 2015 is based on Oriola-KD Group’s Earnings per Share (EPS) and for 2014 based on Oriola-KD Group’s Earnings per Share (EPS) and Return on Capital Employed (ROCE), per cent. The rewards to be paid on the basis of the performance period 2015 correspond to the value of an approxi-mate maximum total of 625,500 Company’s class B shares (including also the proportion to be paid in cash). The potential reward will be paid partly in Company’s class B shares and partly in cash in 2018. The cash proportion is intended to cover taxes and tax-related costs arising from the reward to the executives. No reward will mainly be paid if an executive’s employment or service in a Group company ends before the reward payment. There was no payment based on the performance period 2014 since the performance criteria for the Plan was not met.
If the executives’ total earnings are more than their total salary of the calendar year preceding the reward payment multiplied by 3.5, the reward to be paid on the basis of the performance period will be reduced for such exceeding part. Total earnings mean total salary together with annual bonus and long-term incentive plan, and total salary means fixed base salary together with fringe benefits.
Expenses recognised for the incentive plan were EUR 0.2 (-) mil-lion in 2015.
Of the Board of Directors’ annual fee, 60 per cent is paid in cash and 40 per cent in the Company’s class B shares. For the apportionment paid in shares, an expense of EUR 0,1 (-) million was recognised in 2015.
Salaries and benefits of the members of the Board of Directors1,000 EUR 2015 2014Anssi Vanjoki, chairman 1) 59.9 -
Jukka Alho, vice chairman 2) 41.3 64.0
Harry Brade 4) 2.8 35.0
Eva Nilsson Bågenholm 1) 30.2 -
Per Båtelson 30.3 29.8
Anja Korhonen 3) 43.7 39.1
Kuisma Niemelä 3) 33.8 30.2
Matti Rihko 3) 31.8 37.1
Staffan Simberg 1) 32.2 -
Outi Raitasuo, vice chairman 5) - 1.6
Karsten Slotte 5) - 1.2
Mika Vidgrén 5) - 1.2
Total 305.9 239.11) from March 30th, 20152) chairman until March 30th, 20153) from March 24th, 20144) until March 30th, 20155) until March 24th, 2014
50
Year 2015Notes to the Consolidated Financial Statements
Executives incentive plan 2016 - 2018On 2 December 2015 the Board of Directors of Oriola-KD Corpora-tion resolved to establish a new share-based incentive plan directed to the Group key personnel. Approximately 20 key persons, includ-ing the members of the Group Management Team, participate in the plan. The plan includes three performance periods, calendar years 2016, 2017 and 2018, and three vesting periods, calendar years 2017, 2018 and 2019, respectively. The Board of Directors of the Company will resolve on the plan’s performance criteria and on the required performance level for each criterion at the beginning of a perfor-mance period. The potential reward of from the performance period 2016 is based on the Group’s Earnings per Share (EPS). The rewards to be paid on the basis of the performance period 2016 correspond to the value of an approximate maximum total of 800,000 Company’s class B shares (including also the proportion to be paid in cash). The potential reward will be paid partly in Company’s class B shares and partly in cash in 2018. The cash proportion is intended to cover taxes and tax-related costs arising from the reward to a key person.
The prerequisite for participation in the plan and for receipt of reward on the basis of the Plan is that a key person has enrolled in the OKShares and makes the monthly saving from his or her fixed gross monthly salary, in accordance with the Rules of the OKShares in force. The aim is also to harmonize the Company’s incentive plans into a One-Platform Plan where the Company’s Key Personnel Share Savings Plan (the OKShares) and Long-Term Incentive Plan are com-bined.
The member of the Group Management Team must hold 50 per cent of the net shares given on the basis of the entire Plan, until his or her shareholding in the Company in total equals the value of his or her gross annual salary. Such number of shares must be held as long as the key person holds a position as a Group Management Team member.
No expenses were recognised for the plan in 2015.
Share savings plans On 28 May 2013 the Board of Directors of Oriola-KD Corporation decided to launch a key personnel share savings plan. A total of 34 key employees participated in the plan during a savings period 1 October 2013 – 30 September 2014. A total of 39 key employees participated in the plan during a savings period 1 October 2014 – 30 September 2015 that was approved 27 August 2014. For both sav-ings plans the maximum and minimum monthly savings amounted to 10 and 2 per cent, respectively, of each participant’s fixed gross monthly salary.
On 18 June 2015 the Board of Directors of Oriola-KD Corporation decided to launch a new savings period 2015-2016. This savings period began on 1 October 2015 and will end on 31 December 2016. The maximum monthly saving is 8.3 percent and the minimum is 2 percent of each participant’s fixed monthly gross salary. A total of about 50 key employees participate in the plan.
The accumulated savings will be used for purchasing Oriola-KD’s class B shares for the participants at market prices. In return, each participant will receive two free class B matching shares for every three acquired savings shares. Matching shares will be delivered to a participant if the participant holds the acquired shares from the
savings period until the end of the designated holding period and the employment has not terminated by the last day of the holding period. Matching shares will be paid partly in Oriola-KD’s class B shares and partly in cash. The cash proportion is intended for cover-ing taxes and tax-related payments arising.
During 2015, in total 24,314 company’s class B shares were granted under the savings period 2013–2014. The savings of plan 2014–2015 correspond to approximately 48,600 savings shares and 32,400 matching shares estimated at the share price level of the year end.
The expenses recognised for the Share savings plans were EUR 0.2 (0.1) million in 2015.
Oriola-KD Corporation has an agreement with a third-party service provider concerning administration of the executives incentive plan and for the share savings plan. At the end of the reporting period, the amount of treasury shares held by the third-party service pro-vider was 27,202 (42,930).
30. Events after the balance sheet dateThe Nomination Committee of Oriola-KD has presented to the Board of Directors its recommendation on the proposal to the 2016 An-nual General Meeting concerning the composition of the Board of Directors as follows:
• The number of members of the Board of Directors would be eight• The present members of the Board of Directors Anja Korho-
nen, Kuisma Niemelä, Eva Nilsson Bågenholm, Staffan Simberg, Matti Rihko and Anssi Vanjoki would be re-elected
• Mariette Kristenson and Lena Ridström would be elected new members of the Board of Directors
• Anssi Vanjoki would be re-elected as Chairman of the Board of Directors

Year 2015
51
Year 2015Key Financial Figures
Key Financial Figures
Consolidated statement of comprehensi-ve income 2015 2014 4) 2013 2012 1) 2011 1)
Net sales EUR million 1,626.3 1,612.3 1,619.7 1,521.8 1,456.7
International operations EUR million 1,240.6 1,224.0 1,236.8 1,099.3 1,077.2
% of net sales % 76.3 75.9 76.4 72.2 73.9
Operating profit EUR million 62.6 65.0 29.3 28.1 25.8
% of net sales % 3.8 4.0 1.8 1.8 1.8
Financial income and expenses EUR million -6.5 -7.8 -8.4 -1.0 -4.1
% of net sales % -0.4 -0.5 -0.5 -0.1 -0.3
Profit before taxes EUR million 56.1 57.1 20.9 27.1 21.7
% of net sales % 3.4 3.5 1.3 1.8 1.5
Profit for the period EUR million 44.5 46.5 17.1 22.3 17.1
% of net sales % 2.7 2.9 1.1 1.5 1.2
Consolidated balance sheet 2015 2014 4) 2013 2012 1) 2011 1)
Non-current assets EUR million 396.4 390.8 561.8 423.1 405.4
Current assets EUR million 550.5 483.2 938.3 893.1 863.4
Equity of the parent company sharehol-ders5) EUR million 194.6 111.5 278.1 310.5 294.5
Liabilities5) EUR million 752.3 762.5 1,222.0 1,005.6 974.3
Interest-bearing liabilities EUR million 128.6 193.9 318.8 94.8 173.0
Non-interest-bearing liabilities5) EUR million 623.7 568.6 903.2 910.9 801.0
Total assets EUR million 946.9 874.0 1,500.1 1,316.2 1,273.3
Key figures 2015 2014 4) 2013 2012 1) 2011 1)
Equity ratio5) % 21.1 13.1 19.2 24.5 24.1
Equity per share5) EUR 1.07 0.69 1.84 2.05 1.95
Return on capital employed (ROCE) 2) % 19.9 14.4 4.2 5.9 -4.0
Return on equity 2)5) % 29.1 23.9 2.0 5.4 -7.5
Net interest-bearing debt EUR million 6.6 102.4 181.5 6.7 19.2
Gearing5) % 3.4 91.8 65.3 2.1 6.5
Net interest-bearing debt / EBITDA from continuing operations ratio 0.1 1.2 3.7 0.2 0.5
Earnings per share from continuing opera-tions4) EUR 0.25 0.28 0.11 0.15 0.11
Earnings per share incl. discontinued opera-tions4) EUR 0.25 -1.33 0.04 0.11 -0.16
Average number of shares 3)4) pcs 177,501,818 160,741,152 151,157,494 151,247,748 151,161,006
Average number of personnel from contin-uing operations pers 2,327 2,377 2,156 1,784 1,819
Gross capital expenditure incl. disconti-nued operations EUR million 20.4 34.0 193.7 22.6 28.8
1) The comparative figures are adjusted retroactively according to the revised standard IAS 19R.2) The comparative figures 2013 - 2011 includes discontinued operations.3) Company-owned treasury shares are not included.4) Average number of shares have been adjusted for right issue 2014.5) The statement of financial position has been restated due to an error relating to prior periods. The restatement increased the deferred tax liabilities with
EUR 2.1 million and decreased equity by the corresponding amount.

52
Year 2015Share-Related Key Figures
Share-Related Key Figures
2015 2014 3) 2013 2012 1) 2011 1)
Earnings per share EUR 0.25 -1.33 0.04 0.11 -0.16
Earnings per share, continuing operations EUR 0.25 0.28 0.11 0.15 0.11
Equity per share EUR 1.07 0.69 1.84 2.05 1.95
Total dividends EUR million 23.6 2) - - 7.6 7.6
Dividend per share EUR 0.13 2) - - 0.05 0.05
Payout ratio % 51.7 - 2) - - 44.0 -
Dividend yield A % 3.06 2) - - 2.2 2.7
Dividend yield B % 3.01 2) - - 2.2 2.9
Repayment of equity EUR - 2) - - 0.04 0.03
P/E ratio A 16.90 11.76 23.64 15.37 16.75
P/E ratio B 17.22 11.80 23.18 15.09 15.24
Share price on 31 Dec A EUR 4.24 3.26 2.60 2.27 1.89
Share price on 31 Dec B EUR 4.32 3.27 2.55 2.23 1.72
Average share price A EUR 4.01 2.37 2.40 2.04 2.76
Average share price B EUR 4.06 2.34 2.38 1.95 2.51
Lowest share price A EUR 2.93 1.89 2.24 1.77 1.70
Lowest share price B EUR 2.84 1.98 2.18 1.70 1.57
Highest share price A EUR 4.52 3.31 2.69 2.44 3.83
Highest share price B EUR 4.60 3.30 2.73 2.25 3.74
Market capitalisation EUR million 779.6 524.4 388.1 339.2 268.7
Trading volume
A shares pcs 3,045,353 7,868,093 3,215,623 5,674,171 2,890,117
% of average number of A shares % 5.5 15.7 6.8 12.0 6.1
B shares pcs 35,816,293 41,162,592 28,601,043 29,496,044 71,804,571
% of average number of B shares % 29.3 37.2 27.5 28.4 69.0
% of average number of all shares % 21.9 30.5 21.1 23.3 49.4
Number of shares 31 Dec A pcs 55,484,648 50,147,044 47,148,710 47,148,710 47,148,710
B pcs 126,001,565 110,729,744 104,109,118 104,109,118 104,109,118
Total Number of shares 31 Dec pcs 181,486,213 160,876,788 151,257,828 151,257,828 151,257,828
Total number of A shares, annual average pcs 55,204,784 50,147,044 47,148,710 47,148,710 47,161,339
Total number of B shares, annual average pcs 122,441,865 110,729,744 104,109,118 104,109,118 104,096,489
Total number of shares, annual average pcs 177,646,649 160,876,788 151,257,828 151,257,828 151,257,828
Total number of shares 31 Dec pcs 181,486,213 160,876,788 151,257,828 151,257,828 151,257,828
1) The comparative figures are adjusted retroactively according to the revised standard IAS 19R. 2) Proposal by the Board of Directors. 3) Calculated based on the rights issue -adjusted number of shares. The right issue factor was 1.06359 Calculations of Key Figures are given on the page 53.

53
Year 2015Calculation of Key Ratios Year 2015
Calculation of Key Ratios
Equity ratio, %=Equity total x 100Total assets – Advances received
Return on capital employed (ROCE), % =EBIT from continuing operations
x 100Total assets – Non-interest-bearing liabilities (average between the beginning and the end of the year)
Return on equity (ROE), % =
x 100Profit for the period from continuing operations Equity total (average between the beginning and the end of the year)
Gearing, % =Interest-bearing liabilities – cash and cash equivalents x 100Equity total
Net interest-bearing debt/EBITDA=Interest-bearing liabilities – cash and cash equivalents Operating profit/loss from continuing operations before depreciation, amortization and impairment loss
Earnings per share (EPS), EUR =Profit attributable to shareholders of the parent company – unpaid interest on hybrid bond Average number of shares during the period 1)
Equity per share, EUR =Equity attributable to shareholders of the parent companyNumber of shares at the end of the period 1)
Dividend per share, EUR =Dividends paid for the financial period Number of shares at the end of the period 1)
Payout ratio, % =
x 100Dividend per shareEarnings per share
Effective dividend yield, % =
x 100Dividend per share Closing price on the last trading day of the financial period
Price/Earnings ratio (P/E) =Closing price on the last trading day of the financial periodEarnings per share
Average price of share, EUR =Trading volume, EUR Average number of shares traded during the financial period
Market capitalisation, EUR =Number of shares at the end of the financial period x Closing price on the last trading day of the financial period1) Average number of shares has been adjusted for right issue

54
Year 2015Parent Company Income Statements (FAS)
Parent Company Income Statements (FAS)
EUR 1,000 Note 2015 2014Other operating income 1 3,568.2 3,531.8
Personnel expenses 2 -5,040.3 -4,044.1
Depreciations 3 -216.8 -172.9
Other operating expenses 4 -5,281.9 -7,865.6
Operating profit/loss -6,970.9 -8,550.8Financial income and expenses 5 2 514.7 34,657.5
Profit before extraordinary items -4,456.2 26,106.6Extraordinary items 6 45,168.8 -
Profit before appropriations and taxes 40,712.6 26,106.6Appropriations 7 -76.9 -32.4
Income taxes 8 -437.0 542.7
Net profit for the period 40,198.7 26,616.9

55
Year 2015 Year 2015Parent Company Balance Sheet (FAS)
Parent Company Balance Sheet (FAS)
1,000 EUR Note 31 Dec 2015 31 Dec 2014ASSETS
Non-current assetsIntangible assets 9
Intangible rights 2,568.8 117.5
Other capitalised long-term expenditure 439.2 478.6
Intangible assets total 3,008.0 596.1
Tangible assets 10
Land and water areas 149.2 149.2
Machinery and equipment 415.8 209.5
Other tangible assets 7.5 7.5
Tangible assets total 572.4 366.1
Investments 11
Shares in Group companies 609,598.8 156,807.0
Receivables from Group companies 150,241.7 440,376.8
Other shares and receivables - 10.0
Investments total 759,840.5 597,193.8
Non-current assets total 763,421.0 598,156.0
Current assetsReceivables
Long-term
Deferred tax assets 2,196.1 542.7
Short-term
Receivables from Group companies 12 23,773.8 1,763.8
Other receivables 398.5 494.8
Accrued receivables 12 480.9 2,028.1
Receivables total 26,849.3 4,829.3
Cash and cash equivalents 118,036.0 84,482.1
Current assets total 144,885.3 89,311.4
Assets total 908,306.3 687,467.4

56
Year 2015Parent Company Balance Sheet (FAS)
EQUITY AND LIABILITIES Note 31 Dec 2015 31 Dec 2014
Equity 13
Share capital 147,899.8 147,899.8
Other funds 19,418.7 19,418.7
Invested unrestricted equity reserve 76,957.5 1,386.6
Retained earnings 232,272.0 205,768.6
Profit for the financial year 40,198.7 26,616.9
Equity total 516,746.8 401,090.6
Appropriations 14 109.3 32.4
Provisions 15 - 412.1
Liabilities 16
Long-term
Borrowings 65,291.9 20,000.0
Other long-term liabilities - 40,000.0
Liabilities to other Group companies 82,244.7 -
Accrued liabilities 1,594.5 1,719.1
Long-term liabilities total 149,131.1 61,719.1
Short-term
Received prepayments - 500.0
Trade payables 1,141.4 384.7
Liabilities to other Group companies 201,914.9 167,079.3
Other liabilities 36,480.6 52,121.9
Accrued liabilities 2,782.3 4,127.4
Short-term liabilities total 242,319.1 224,213.4
Liabilities total 391,450.2 285,932.4
Equity and liabilities total 908,306.3 687,467.4

57
Year 2015 Year 2015Parent Company Cash Flow Statement (FAS)
Parent Company Cash Flow Statement (FAS)
EUR 1,000 2015 2014
Cash flow from operating activitiesOperating profit/loss -6,970.9 -8,550.8
Adjustments
Depreciations according to plan 216.8 172.9
Unrealised exchange rate profit/loss -3,972.9 5,510.7
Other non-cash items 88.9 -
Other adjustments 1,843.6 -
-8,794.4 -2,867.3
Change in working capital 1)
Change in current receivables -11,630.2 1,147.5
Change in non-interest-bearing current liabilities -107.5 4,015.5
-11,737.7 5,163.0
Interest paid and other financial expenses -3,507.4 -10,531.4
Dividends received - 10,000.0
Interest received and other financial income2) 4,931.9 13,110.1
Income taxes paid -10.2 -12.3
Net cash flow from operating activities -19,117.9 14,862.1
Cash flow from investing activities
Investments in property, plant and equipment and intan-gible assets -2,258.8 -530.4
Proceeds from (-) /repayment of long-term receivables net (+) 12,804.2 -40,018.6
Dividends received 32,762.9 -
Net cash flow from investing activities 43,308.2 -40,549.1
Cash flow from financing activitiesProceeds from issuance of share capital 75,571.0 -
Expenses from issuance of share capital -1,843.6 -
Purchase of own shares -113.4 -72.6
Proceeds from (+)/Repayment (-) of long-term borrowings -40,000.0 40,000.0
Proceeds from (+)/Repayment (-) of short-term borrowings -24,250.3 -41,338.8
Net cash flow from financing activities 9,363.2 -1,411.4
Net change in cash and cash equivalents 33,553.9 -27,098.4
Cash and cash equivalents at the beginning of the period 84,482.1 111,580.5
Net change in cash and cash equivalents 33,553.9 -27,098.4
Cash and cash equivalents at the end of the period3) 118,036.0 84,482.1
1) The changes in liabilities and receivables between domestic group companies are included in the gross change in working capital. 2) Interest paid by the group companies are included in the net cash flow from operating activities. 3) Cash and cash equivalents include cash, deposits and money market investments.

58
Year 2015Notes to the Parent Company Financial Statements (FAS)
Notes to the Parent Company Financial Statements (FAS)
Oriola-KD Corporation is the parent company of Oriola-KD Group and is domiciled in Espoo.
Oriola-KD Corporation provides administrative services to the group companies. These administrative services are centralized to the parent company.
Copies of the consolidated financial statements of the Oriola-KD Group are available from the head office of Oriola-KD Corporation, Orionintie 5, FI-02200 Espoo, Finland.
Accounting principles for the financial statementsThe Oriola-KD Corporation´s financial statements are prepared in euros and according to Generally Accepted Accounting Principles in Finland (Finnish GAAP) and according to corporate legislation. The financial statements are presented in thousand euros.
Intangible and tangible assetsIntangible and tangible assets are measured at their historical cost, less depreciation according to plan. Planned depreciation is record-ed on a straight-line basis over the useful life of an asset. The periods for planned depreciation are as follows:• Intangible rights and other long-term expenditure 5 years• Machinery and equipment 5-10 years
The carrying value of land and water areas as well as the carrying value of other tangible assets are based on historical costs. No write-downs have been done on land and water areas or on other tangible assets.
A one-time impairment will be recorded in the parent company’s non-current assets when the expected profitability of the subsidiar-ies is significantly lowered.
Items in foreign currenciesMonetary receivables and liabilities in foreign currencies have been measured using the exchange rates quoted by European Central Bank on the balance sheet date. The translation gains and losses are recognised in the income statement. Exchange rate gains and losses related to loans and receivables in foreign currencies are booked as financial income and expenses.
Pension liabilitiesThe Statutory pension coverage of Oriola-KD Corporation is provid-ed by Ilmarinen Mutual Pension Insurance Company. Supplementa-ry pension coverage is provided by OP Life Assurance Company Ltd.
Income taxesThe income taxes include taxes based on the Oriola-KD Corpora-tion’s taxable profit.
1. Other operating income
EUR 1,000 2015 2014Rental income 22.7 22.3
Other service charges 3,538.5 3,343.9
Other operating income 6.9 165.6
Total 3,568.2 3,531.8
2. Personnel
EUR 1,000 2015 2014Cost of personnel
Salaries and bonuses 4,084.9 3,365.4
Pension costs 799.1 513.6
Other personnel expenses 156.4 165.1
Total 5,040.3 4,044.1
Voluntary personnel expenses are included in other operating costs.
Average number of personnel 38 40
Salaries and bonuses to the ManagementPresident and CEO and Members of Board of Directors 933.5 761.1
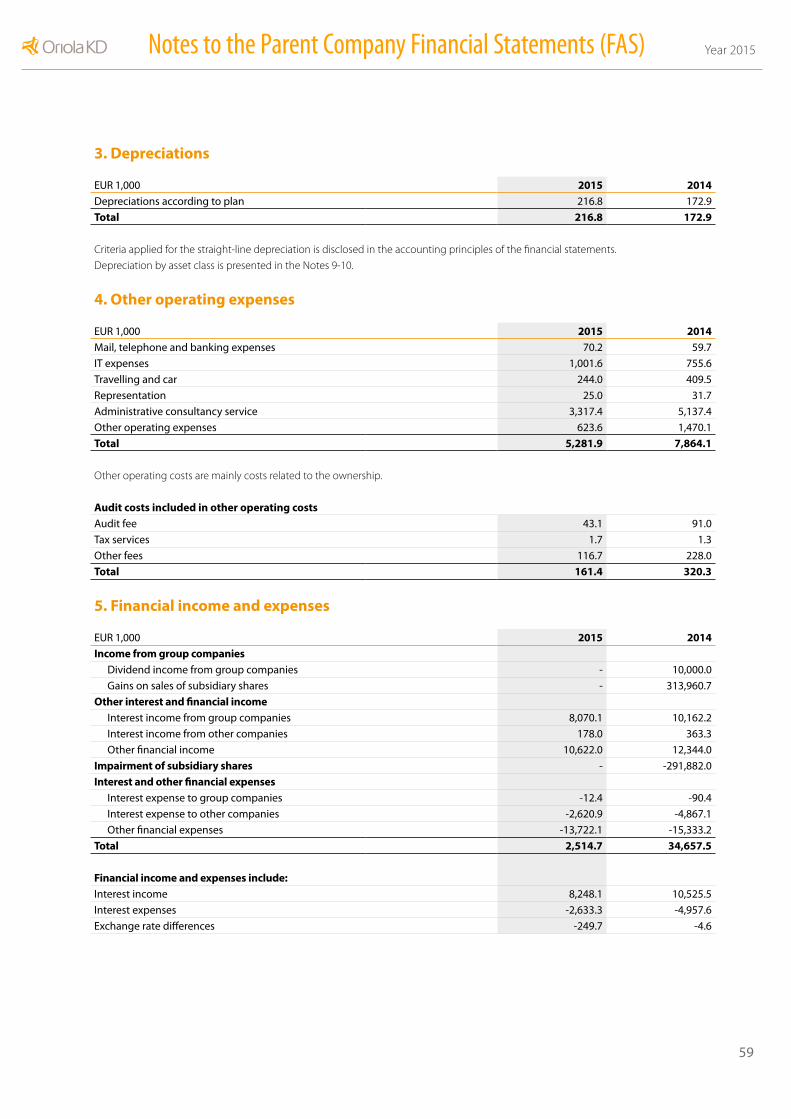
59
Year 2015 Year 2015Notes to the Parent Company Financial Statements (FAS)
3. Depreciations
EUR 1,000 2015 2014Depreciations according to plan 216.8 172.9
Total 216.8 172.9
Criteria applied for the straight-line depreciation is disclosed in the accounting principles of the financial statements.
Depreciation by asset class is presented in the Notes 9-10.
4. Other operating expenses
EUR 1,000 2015 2014Mail, telephone and banking expenses 70.2 59.7
IT expenses 1,001.6 755.6
Travelling and car 244.0 409.5
Representation 25.0 31.7
Administrative consultancy service 3,317.4 5,137.4
Other operating expenses 623.6 1,470.1
Total 5,281.9 7,864.1
Other operating costs are mainly costs related to the ownership.
Audit costs included in other operating costsAudit fee 43.1 91.0
Tax services 1.7 1.3
Other fees 116.7 228.0
Total 161.4 320.3
5. Financial income and expenses
EUR 1,000 2015 2014Income from group companies
Dividend income from group companies - 10,000.0
Gains on sales of subsidiary shares - 313,960.7
Other interest and financial incomeInterest income from group companies 8,070.1 10,162.2
Interest income from other companies 178.0 363.3
Other financial income 10,622.0 12,344.0
Impairment of subsidiary shares - -291,882.0
Interest and other financial expensesInterest expense to group companies -12.4 -90.4
Interest expense to other companies -2,620.9 -4,867.1
Other financial expenses -13,722.1 -15,333.2
Total 2,514.7 34,657.5
Financial income and expenses include:Interest income 8,248.1 10,525.5
Interest expenses -2,633.3 -4,957.6
Exchange rate differences -249.7 -4.6
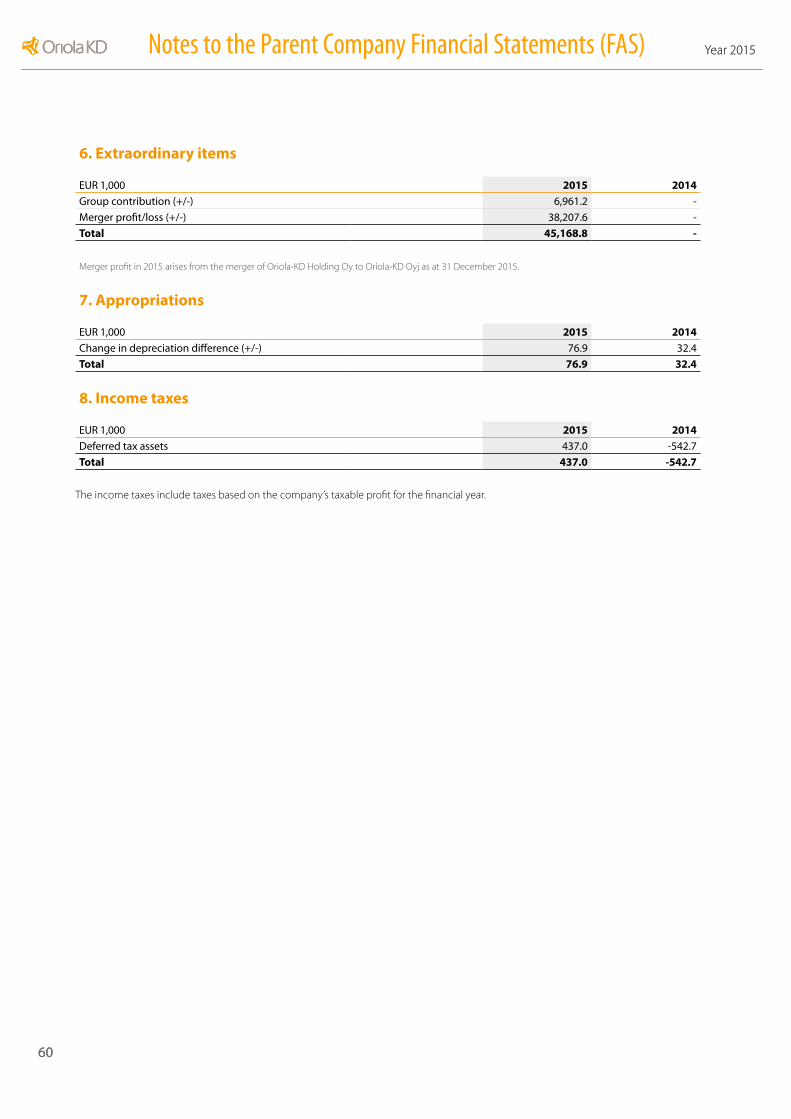
60
Year 2015Notes to the Parent Company Financial Statements (FAS)
60
Year 2015
6. Extraordinary items
EUR 1,000 2015 2014Group contribution (+/-) 6,961.2 -
Merger profit/loss (+/-) 38,207.6 -
Total 45,168.8 -
Merger profit in 2015 arises from the merger of Oriola-KD Holding Oy to Oriola-KD Oyj as at 31 December 2015.
7. Appropriations
EUR 1,000 2015 2014Change in depreciation difference (+/-) 76.9 32.4
Total 76.9 32.4
8. Income taxes
EUR 1,000 2015 2014Deferred tax assets 437.0 -542.7
Total 437.0 -542.7
The income taxes include taxes based on the company’s taxable profit for the financial year.
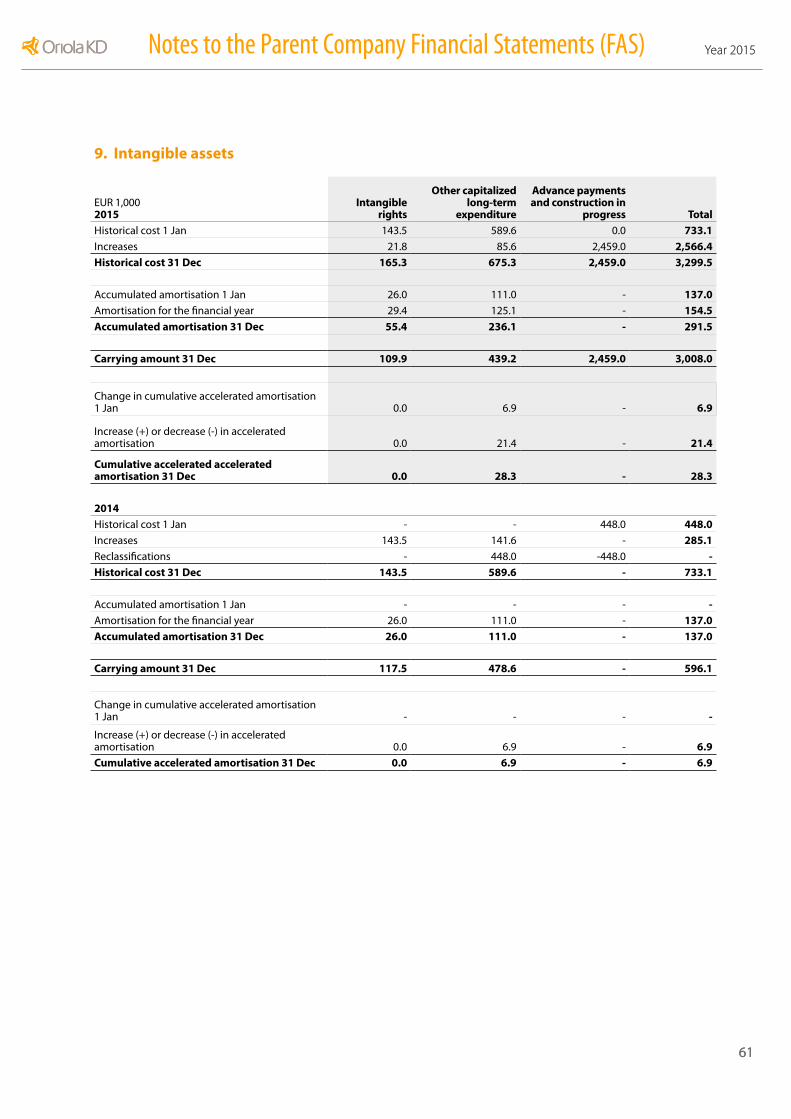
61
Year 2015 Year 2015Notes to the Parent Company Financial Statements (FAS)
61
Year 2015 Year 2015
9. Intangible assets
EUR 1,0002015
Intangible rights
Other capitalized long-term
expenditure
Advance payments and construction in
progress TotalHistorical cost 1 Jan 143.5 589.6 0.0 733.1Increases 21.8 85.6 2,459.0 2,566.4Historical cost 31 Dec 165.3 675.3 2,459.0 3,299.5
Accumulated amortisation 1 Jan 26.0 111.0 - 137.0Amortisation for the financial year 29.4 125.1 - 154.5Accumulated amortisation 31 Dec 55.4 236.1 - 291.5
Carrying amount 31 Dec 109.9 439.2 2,459.0 3,008.0
Change in cumulative accelerated amortisation 1 Jan 0.0 6.9 - 6.9
Increase (+) or decrease (-) in accelerated amortisation 0.0 21.4 - 21.4
Cumulative accelerated accelerated amortisation 31 Dec 0.0 28.3 - 28.3
2014Historical cost 1 Jan - - 448.0 448.0Increases 143.5 141.6 - 285.1Reclassifications - 448.0 -448.0 -Historical cost 31 Dec 143.5 589.6 - 733.1
Accumulated amortisation 1 Jan - - - -Amortisation for the financial year 26.0 111.0 - 137.0Accumulated amortisation 31 Dec 26.0 111.0 - 137.0
Carrying amount 31 Dec 117.5 478.6 - 596.1
Change in cumulative accelerated amortisation 1 Jan - - - -
Increase (+) or decrease (-) in accelerated amortisation 0.0 6.9 - 6.9Cumulative accelerated amortisation 31 Dec 0.0 6.9 - 6.9

62
Year 2015Notes to the Parent Company Financial Statements (FAS)
10. Tangible assets
EUR 1,0002015
Land and water areas
Machinery and equipment
Other tangible assets Total
Historical cost 1 Jan 149.2 245.3 7.5 402.0Increases - 351.3 - 351.3Decreases - -118.6 - -118.6Historical cost 31 Dec 149.2 478.0 7.5 634.7
Accumulated depreciation 1 Jan - 35.9 - 35.9
Changes in cumulative depreciation due to sales - -35.9 - -35.9
Depreciation for the financial year - 62.4 - 62.4
Accumulated depreciation 31 Dec - 62.3 - 62.3
Carrying amount 31 Dec 149.2 415.8 7.5 572.4
Change in cumulative accelerated depreciation 1 Jan - 25.5 - 25.5Increase (+) or decrease (-) in accelerated depre-ciation - 55.5 - 55.5
Cumulative accelerateddepreciation 31 Dec - 80.9 - 80.9
2014Historical cost 1 Jan 149.2 - 7.5 156.7Increases - 245.3 - 245.3Historical cost 31 Dec 149.2 245.3 7.5 402.0
Accumulated depreciation 1 Jan - - - -Depreciation for the financial year - 35.9 - 35.9Accumulated depreciation 31 Dec - 35.9 - 35.9
Carrying amount 31 Dec 149.2 209.5 7.5 366.1
Change in cumulative accelerated depreciation 1 Jan - - - -Increase (+) or decrease (-) in accelerated depreciation - 25.5 - 25.5
Cumulative accelerateddepreciation 31 Dec - 25.5 - 25.5

63
Year 2015 Year 2015Notes to the Parent Company Financial Statements (FAS)
11. Investments
EUR 1,0002015
Shares in group companies
Receivable from group companies
Other shares and receivables Total
Historical cost 1 Jan 448,689.0 440,376.8 10.0 889,075.8Increases 824,164.3 82,051.3 - 906,215.6Decreases -663,254.5 -372,186.3 -10.0 -1,035,450.7Historical cost 31 Dec 609,598.8 150,241.8 - 759,840.6
Accumulated depreciation 1 Jan -291,882.0 - - -291,882.0Reversed write-downs due to mergers 291,882.0 - - 291,882.0Accumulated depreciation 31 Dec - - - -
Carrying amount 31 Dec 609,598.8 150,241.7 - 759,840.5
2014Historical cost 1 Jan 314,335.0 226,262.1 10.0 540,607.1Increases 195,104.5 483,358.4 - 678,462.9Decreases -60,750.6 -269,243.6 - -329,994.2Historical cost 31 Dec 448,688.9 440,376.8 10.0 889,075.8
Accumulated depreciation 1 Jan - - - -Write-downs for the financial year -291,882.0 - - -291,882.0Accumulated depreciation 31 Dec -291,882.0 - - -291,882.0
Carrying amount 31 Dec 156,807.0 440,376.8 10.0 597,193.8
12. Receivables
EUR 1,000 2015 2014Receivables from group companiesShort-term receivables
Trade receivables 636.2 1,505.7
Other receivables 16,173.4 246.0
Accrued income and prepaid expenses 6,964.2 12.1
Total 23,773.8 1,763.8
Accrued receivablesArrangement fees relating to loans 234.0 462.9
Exchange rate profit on hedges 36.5 1,361.1
Compensations not received 8.4 9.9
Other accrued receivables 201.9 194.1
Total 480.9 2,028.1

64
Year 2015Notes to the Parent Company Financial Statements (FAS)
15. Provisions
EUR 1,000 2015 2014Other provisions - 412.1
Total - 412.1
Other provisions consist of commitments related to trade payables of disposed Russian businesses.
13. Equity
EUR 1,000 2015 2014Share capital 1 Jan 147,899.8 147,899.8
Share capital 31 Dec 147,899.8 147,899.8
Contingency fund 1 Jan 19,418.7 19,418.7
Contingency fund 31 Dec 19,418.7 19,418.7
Invested unrestricted equity reserve 1 Jan 1,386.6 1,386.6
Issue of shares 75,571.0 -
Invested unrestricted equity reserve 31 Dec 76,957.5 1,386.6
Profit/loss from previous years 1 Jan 232,385.5 205,841.2
Share-based compensation -156.2 -9.6
Purchase of own shares 1) -113.4 -72.6
Proceeds from sale of own shares 156.2 9.6
Profit/loss from previous years 31 Dec 232,272.0 205,768.6
Net profit for the period 40,198.7 26,616.9
Total 516,746.8 401,090.6
1) Shares purchased for the share based incentive program.
Split of shares 31 Dec 2015 number of shares EUR millionSerie A shares (20 votes/share) 55,484,648 45.2
Serie B shares (1 vote/share) 126,001,565 102.7
Total 181,486,213 147.9
Split of shares 31 Dec 2014 number of shares EUR millionSerie A shares (20 votes/share) 47,148,710 46.1
Serie B shares (1 vote/share) 104,109,118 101.8
Total 151,257,828 147.9
14. Appropriations
EUR 1,000 2015 2014Cumulative accelerated depreciation 109.3 32.4
Total 109.3 32.4

65
Year 2015 Year 2015Notes to the Parent Company Financial Statements (FAS)
16. Liabilities
EUR 1,000 2015 2014Long-term liabilitiesLiabilities to Group companies
Long-term liabilities to Group companies 82,244.7 -
Other long-term liabilitiesLoans from financial institutions 65,291.9 20,000.0
Other long-term liabilities - 40,000.0
Accrued liabilities 1,594.5 1,719.1
Long-term liabilities total 149,131.1 61,719.1
Short-term liabilitiesLiabilities to Group companies
Received prepayments 8.7 -
Trade payables 237.9 5.2
Interest-bearing liabilities 201,666.8 167,074.1
Accrued liabilities 1.5 -
Other short-term liabilitiesReceived prepayments - 500.0
Trade payables 1,141.4 384.7
Other non-interest-bearing liabilities 245.3 299.0
Interest-bearing liabilities 36,235.2 51,822.9
Accrued liabilities 2,782.3 4,127.4
Short-term liabilities total 242,319.1 224,213.3
Liabilities total 391,450.2 285,932.4
Material items included in accrued liabilitiesLong-term accrued liabilities
Change of fair value for interest rate swap 1,594.5 1,719.1
Short-term accrued liabilities
Items related to personnel 841.4 851.6
Derivatives measured at fair value 1,319.2 253.3
Interest 471.0 2,554.3
Other accrued liabilities 150.6 468.2
Total 4,376.7 5,846.5
Short-term liabilities includeLiabilities to group companies 201,914.9 167,079.3
Non-interest-bearing liabilities to other companies 4,169.0 5,311.1
Interest-bearing liabilities to other companies 36,235.2 51,822.9
Total 242,319.1 224,213.4
17. Commitments
EUR 1,000 2015 2014Commitments for own liabilitiesGuarantees on behalf of own companies 8,481.8 92,089.9
Guarantees on behalf of other companies 1,958.5 22,004.0
Total 10,440.4 114,093.9
18. Ownership in other companiesThe Parent company’s ownership in other companies is presented in Note 29. Group companies and related-party transactions, in the Notes to the Consolidated Financial Statements.
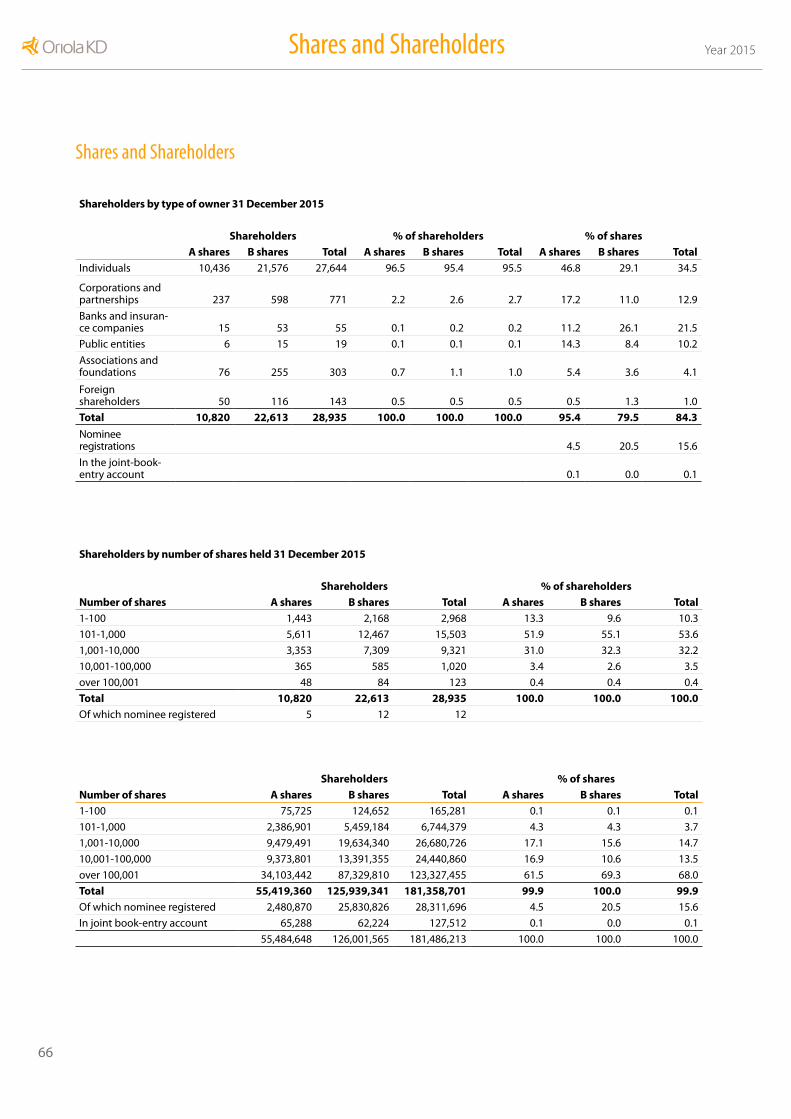
66
Year 2015Shares and Shareholders
Shares and Shareholders
Shareholders by number of shares held 31 December 2015
Shareholders % of shareholdersNumber of shares A shares B shares Total A shares B shares Total1-100 1,443 2,168 2,968 13.3 9.6 10.3
101-1,000 5,611 12,467 15,503 51.9 55.1 53.6
1,001-10,000 3,353 7,309 9,321 31.0 32.3 32.2
10,001-100,000 365 585 1,020 3.4 2.6 3.5
over 100,001 48 84 123 0.4 0.4 0.4
Total 10,820 22,613 28,935 100.0 100.0 100.0Of which nominee registered 5 12 12
Shareholders % of sharesNumber of shares A shares B shares Total A shares B shares Total1-100 75,725 124,652 165,281 0.1 0.1 0.1
101-1,000 2,386,901 5,459,184 6,744,379 4.3 4.3 3.7
1,001-10,000 9,479,491 19,634,340 26,680,726 17.1 15.6 14.7
10,001-100,000 9,373,801 13,391,355 24,440,860 16.9 10.6 13.5
over 100,001 34,103,442 87,329,810 123,327,455 61.5 69.3 68.0
Total 55,419,360 125,939,341 181,358,701 99.9 100.0 99.9Of which nominee registered 2,480,870 25,830,826 28,311,696 4.5 20.5 15.6
In joint book-entry account 65,288 62,224 127,512 0.1 0.0 0.1
55,484,648 126,001,565 181,486,213 100.0 100.0 100.0
Shareholders by type of owner 31 December 2015
Shareholders % of shareholders % of sharesA shares B shares Total A shares B shares Total A shares B shares Total
Individuals 10,436 21,576 27,644 96.5 95.4 95.5 46.8 29.1 34.5
Corporations and partnerships 237 598 771 2.2 2.6 2.7 17.2 11.0 12.9
Banks and insuran-ce companies 15 53 55 0.1 0.2 0.2 11.2 26.1 21.5
Public entities 6 15 19 0.1 0.1 0.1 14.3 8.4 10.2
Associations and foundations 76 255 303 0.7 1.1 1.0 5.4 3.6 4.1
Foreign shareholders 50 116 143 0.5 0.5 0.5 0.5 1.3 1.0
Total 10,820 22,613 28,935 100.0 100.0 100.0 95.4 79.5 84.3Nominee registrations 4.5 20.5 15.6
In the joint-book-entry account 0.1 0.0 0.1

67
Year 2015 Year 2015Shares and Shareholders
Major shareholders 31 December 2015
By number of shares held A shares B shares Total shares% of total
shares Votes% of total
votesBy number
of votes1. Mariatorp Oy 4,500,000 9,600,000 14,100,000 7.77 99,600,000 8.06 1.
2. Wipunen Varainhallinta Oy 2,550,000 6,250,000 8,800,000 4.85 57,250,000 4.63 4.
3. Ilmarinen Mutual Pension Insurance Company 3,606,414 3,995,536 7,601,950 4.19 76,123,816 6.16 3.
4. Varma Mutual Pension Insurance Company 4,320,600 3,273,000 7,593,600 4.18 89,685,000 7.26 2.
5. Mandatum Life Insurance Company Limited 960,000 3,600,000 4,560,000 2.51 22,800,000 1.85 9.
6. Fondita Nordic Micro Cap Placeringsfond 0 3,400,000 3,400,000 1.87 3,400,000 0.28
7. Mutual Insurance Company Pension-Fennia 310,484 2,467,969 2,778,453 1.53 8,677,649 0.70 13.
8. Medical Investment Trust Oy 1,560,000 510,540 2,070,540 1.14 31,710,540 2.57 7.
9. The Land and Water Techno-logy Foundation 2,041,832 0 2,041,832 1.13 40,836,640 3.30 5.
10. The Social Insurance Institution 0 1,991,481 1,991,481 1.10 1,991,481 0.16
11. Tukinvest Oy 1,983,526 0 1,983,526 1.09 39,670,520 3.21 6.
12. Ylppö Jukka 1,496,562 286,992 1,783,554 0.98 30,218,232 2.45 8.
13. Aktia Capital Fund 0 1,747,772 1,747,772 0.96 1,747,772 0.1414. Nordea Fennia Fund 0 1,492,550 1,492,550 0.82 1,492,550 0.1215. Kaleva Mutual Pension
Insurance Company 277,942 1,200,000 1,477,942 0.81 6,758,840 0.55 15.
16. Evli Finnish Small Cap Fund 0 1,475,868 1,475,868 0.81 1,475,868 0.1217. The State Pension Fund 0 1,060,000 1,060,000 0.58 1,060,000 0.0918. Nordea Pro Finland Fund 0 1,050,000 1,050,000 0.58 1,050,000 0.0819. The Finnish Cultural
Foundation 388,821 600,000 988,821 0.54 8,376,420 0.68 14.
20. Alfred Berg Finland 0 968,642 968,642 0.53 968,642 0.08Total 23,996,181 44,970,350 68,966,531 38.00 524,893,970 42.48Nominee registered 2,480,870 25,830,826 28,311,696 15.60 75,448,226 6.11Other 29,007,597 55,200,389 84,207,986 46.40 635,352,329 51.42All shareholders total 55 ,484,648 126,001,565 181,486,213 100.0 1,235,694,525 100.00

68
Year 2015
Proposal for Profit Distribution, Signatures for the Board of Director’s Report and the Financial Statements and Auditor’s Note
Proposal for profit distributionThe parent company’s distributable assets on balance sheet as of 31 December, 2015 is EUR 368,847,032.43 from which profit for the period is EUR 40,198,726.22. The Board of Directors proposes to the Annual General Meeting that the distributable funds will be used as follows:
a dividend of EUR 0.13 per share will be distributed on 181,362,189 shares EUR 23,577,084.57
will be retained in equity EUR 345,269,947.86
EUR 368,847,032.43
There have not been any material changes in the financial position of the company after the end of financial year.
Signatures for the financial statements and Board of Directors’ report
Espoo 4 February 2016
Anssi Vanjoki Chairman
Jukka AlhoVice Chairman
Eva Nilsson Bågenholm Per Båtelson
Anja Korhonen Kuisma Niemelä
Matti Rihko Staffan Simberg
Eero Hautaniemi President and CEO
Auditor’s Note The auditor’s report has been issued today.
Espoo 15 February 2016
PricewaterhouseCoopers Oy Authorised Public Accountants
Ylva ErikssonAuthorised Public Accountant

69
Year 2015 Year 2015Auditor’s Report
Auditor’s Report (Translation from the Finnish Original)
To the Annual General Meeting of Oriola-KD OyjWe have audited the accounting records, the financial statements, the report of the Board of Directors and the administration of Oriola-KD Oyj for the year ended 31 December, 2015. The financial state-ments comprise the consolidated statement of financial position, statement of comprehensive income, statement of changes in eq-uity and statement of cash flows, and notes to the consolidated financial statements, as well as the parent company’s balance sheet, income statement, cash flow statement and notes to the financial statements.
Responsibility of the Board of Directors and the Managing DirectorThe Board of Directors and the Managing Director are responsible for the preparation of consolidated financial statements that give a true and fair view in accordance with International Financial Re-porting Standards (IFRS) as adopted by the EU, as well as for the preparation of financial statements and the report of the Board of Directors that give a true and fair view in accordance with the laws and regulations governing the preparation of the financial state-ments and the report of the Board of Directors in Finland. The Board of Directors is responsible for the appropriate arrangement of the control of the company’s accounts and finances, and the Manag-ing Director shall see to it that the accounts of the company are in compliance with the law and that its financial affairs have been arranged in a reliable manner.
Auditor’s ResponsibilityOur responsibility is to express an opinion on the financial state-ments, on the consolidated financial statements and on the report of the Board of Directors based on our audit. The Auditing Act re-quires that we comply with the requirements of professional ethics. We conducted our audit in accordance with good auditing practice in Finland. Good auditing practice requires that we plan and perform the audit to obtain reasonable assurance about whether the finan-cial statements and the report of the Board of Directors are free from material misstatement, and whether the members of the Board of Directors of the parent company or the Managing Director are guilty of an act or negligence which may result in liability in damages towards the company or whether they have violated the Limited Liability Companies Act or the articles of association of the company.
An audit involves performing procedures to obtain audit evidence about the amounts and disclosures in the financial statements and the report of the Board of Directors. The procedures selected de-pend on the auditor’s judgment, including the assessment of the risks of material misstatement, whether due to fraud or error. In mak-ing those risk assessments, the auditor considers internal control rel-evant to the entity’s preparation of financial statements and report of the Board of Directors that give a true and fair view in order to de-sign audit procedures that are appropriate in the circumstances, but not for the purpose of expressing an opinion on the effectiveness
of the company’s internal control. An audit also includes evaluating the appropriateness of accounting policies used and the reasona-bleness of accounting estimates made by management, as well as evaluating the overall presentation of the financial statements and the report of the Board of Directors.
We believe that the audit evidence we have obtained is sufficient and appropriate to provide a basis for our audit opinion.
Opinion on the Consolidated Financial StatementsIn our opinion, the consolidated financial statements give a true and fair view of the financial position, financial performance, and cash flows of the group in accordance with International Financial Reporting Standards (IFRS) as adopted by the EU.
Opinion on the Company’s Financial Statements and the Report of the Board of Directors In our opinion, the financial statements and the report of the Board of Directors give a true and fair view of both the consolidated and the parent company’s financial performance and financial position in accordance with the laws and regulations governing the prepara-tion of the financial statements and the report of the Board of Direc-tors in Finland. The information in the report of the Board of Directors is consistent with the information in the financial statements.
Helsinki 15 February 2016
PricewaterhouseCoopers Oy Authorised Public Accountants
Ylva ErikssonAuthorised Public Accountant
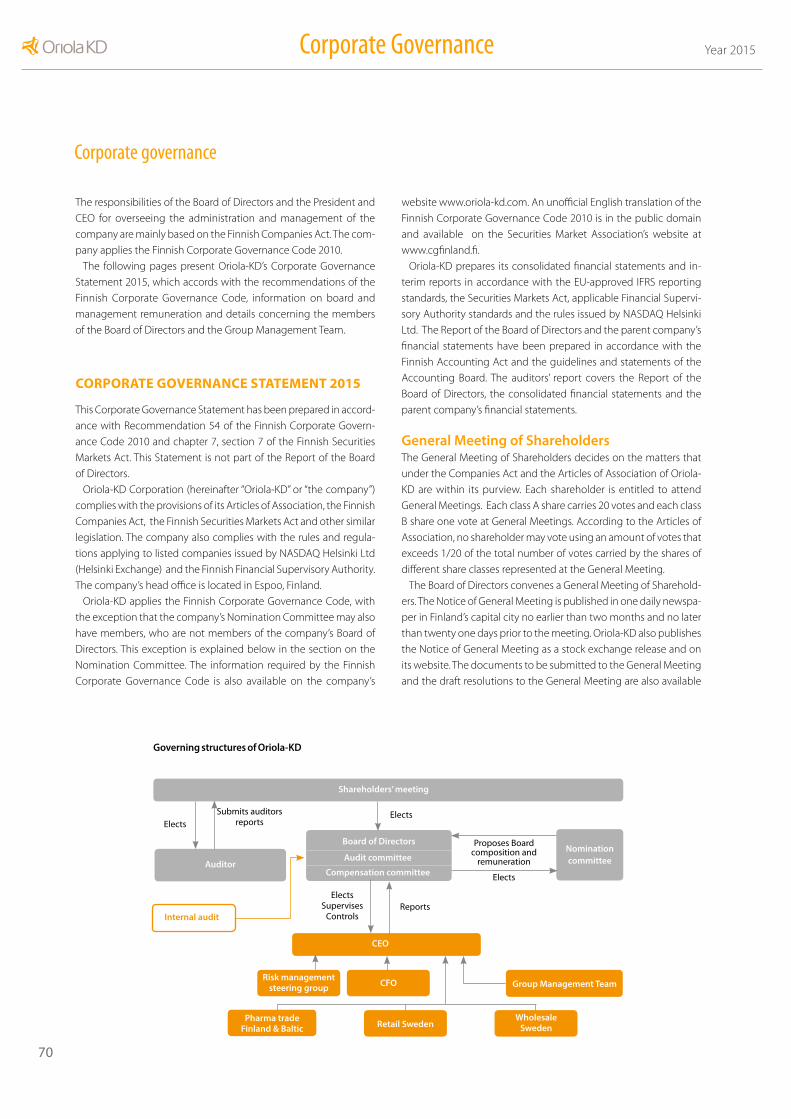
70
Year 2015Corporate Governance
Corporate governance
The responsibilities of the Board of Directors and the President and CEO for overseeing the administration and management of the company are mainly based on the Finnish Companies Act. The com-pany applies the Finnish Corporate Governance Code 2010.
The following pages present Oriola-KD’s Corporate Governance Statement 2015, which accords with the recommendations of the Finnish Corporate Governance Code, information on board and management remuneration and details concerning the members of the Board of Directors and the Group Management Team.
CORPORATE GOVERNANCE STATEMENT 2015
This Corporate Governance Statement has been prepared in accord-ance with Recommendation 54 of the Finnish Corporate Govern-ance Code 2010 and chapter 7, section 7 of the Finnish Securities Markets Act. This Statement is not part of the Report of the Board of Directors.
Oriola-KD Corporation (hereinafter “Oriola-KD” or “the company”) complies with the provisions of its Articles of Association, the Finnish Companies Act, the Finnish Securities Markets Act and other similar legislation. The company also complies with the rules and regula-tions applying to listed companies issued by NASDAQ Helsinki Ltd (Helsinki Exchange) and the Finnish Financial Supervisory Authority. The company’s head office is located in Espoo, Finland.
Oriola-KD applies the Finnish Corporate Governance Code, with the exception that the company’s Nomination Committee may also have members, who are not members of the company’s Board of Directors. This exception is explained below in the section on the Nomination Committee. The information required by the Finnish Corporate Governance Code is also available on the company’s
website www.oriola-kd.com. An unofficial English translation of the Finnish Corporate Governance Code 2010 is in the public domain and available on the Securities Market Association’s website at www.cgfinland.fi.
Oriola-KD prepares its consolidated financial statements and in-terim reports in accordance with the EU-approved IFRS reporting standards, the Securities Markets Act, applicable Financial Supervi-sory Authority standards and the rules issued by NASDAQ Helsinki Ltd. The Report of the Board of Directors and the parent company’s financial statements have been prepared in accordance with the Finnish Accounting Act and the guidelines and statements of the Accounting Board. The auditors’ report covers the Report of the Board of Directors, the consolidated financial statements and the parent company’s financial statements.
General Meeting of ShareholdersThe General Meeting of Shareholders decides on the matters that under the Companies Act and the Articles of Association of Oriola-KD are within its purview. Each shareholder is entitled to attend General Meetings. Each class A share carries 20 votes and each class B share one vote at General Meetings. According to the Articles of Association, no shareholder may vote using an amount of votes that exceeds 1/20 of the total number of votes carried by the shares of different share classes represented at the General Meeting.
The Board of Directors convenes a General Meeting of Sharehold-ers. The Notice of General Meeting is published in one daily newspa-per in Finland’s capital city no earlier than two months and no later than twenty one days prior to the meeting. Oriola-KD also publishes the Notice of General Meeting as a stock exchange release and on its website. The documents to be submitted to the General Meeting and the draft resolutions to the General Meeting are also available
Governing structures of Oriola-KD
Shareholders’ meeting
CEO
Auditor
Board of Directors
Audit committee
Compensation committee
Nomination committee
Group Management TeamRisk management
steering group
ElectsElects
Elects
ReportsElects
Supervises Controls
Submits auditors reports
Proposes Board composition and
remuneration
Retail SwedenWholesale
Sweden
CFO
Pharma trade Finland & Baltic
Internal audit

71
Year 2015 Year 2015Corporate Governance
on the company’s website. The Notice of the General Meeting con-tains the proposed agenda for the meeting.
A shareholder has the right to have matters that under the Com-panies Act falls within the competence of the General Meeting dealt with by the General Meeting, if the shareholder so demands in writ-ing to the Board of Directors well in advance of the meeting so that the matter can be included in the Notice of General Meeting. The demand shall be considered to have arrived in time, when the Board of Directors has been informed about the demand at the latest four weeks in advance of the publication of the Notice of the General Meeting.
The Chairman of the Board of Directors, a sufficient number of members of the Board of Directors and its committees, the President and CEO, and the auditor attend the General Meeting. A person pro-posed for the first time as member of the Board of Directors shall be present at the General Meeting that decides on his or her election unless there are well-founded reasons for absence.
General Meeting of ShareholdersThe shareholders shall based on law and the Articles of Association exercise their power of decision at the General Meeting. The Annual General Meeting is held by the end of May each year. The duties of the Annual General Meeting include:• adoption of the financial statements• use of the profit shown on the balance sheet• election of the members of the Board of Directors and the deci-
sion on their fees• discharging from liability for the members of the Board of Direc-
tors and the President and CEO• election of the auditor and the decision on compensation• proposals made by the Board of Directors and shareholders to
the Annual General Meeting (e.g. amendments to the Articles of Association, repurchase of the company’s own shares, share issue, giving special authorizations).
Annual General Meeting 2015 The Annual General Meeting of Oriola-KD Corporation, held on 30 March 2014, adopted the financial statements and discharged the members of the Board of Directors and the President and CEO from liability for the financial year ending 31 December 2014. According to the decision of the Annual General Meeting, no dividend was paid on the basis of the balance sheet adopted for the financial year ending 31 December 2014.
The Annual General Meeting authorised the Board to decide on a share issue against payment in one or more issues, including the right to issue new shares or to assign shares held by the company. The authorisation covers a combined maximum of 5,650,000 class A shares and 12,500,000 class B shares of the company and includes the right to derogate from the shareholders’ pre-emptive subscription right. The authorisation is in force for 18 months following the decision of the Annual General Meeting.
The Board was also authorised to decide on a share issue against payment of class B shares to the company on one or more issues in-cluding the right to issue new class B shares or assign class B treasury shares held by the company. The authorisation covers a combined maximum of 18,000,000 class B shares of the company including the right to derogate from the shareholders’ pre-emptive subscription right. The authorisation is in force for a maximum of 18 months fol-lowing the decision of the Annual General Meeting.
The Annual General Meeting authorised the Board to decide on repurchasing up to 18,000,000 of the company’s own class B shares. Shares may be repurchased also in a proportion other than in which shares are owned by the shareholders. The authorisation is in force for a maximum of 18 months following the decision of the Annual General Meeting.
All decisions of the Annual General Meeting 2015 are available on the company’s website at www.oriola-kd.com.
Board of DirectorsThe Board of Directors is responsible for the administration of the company and the appropriate organisation of its operations.
The Board of Directors is responsible for managing and supervising the company’s operations in accordance with the law, governmen-tal regulations and the Articles of Association. The Board also ensures that good corporate governance is complied with throughout the Oriola-KD Group.
The members of the Board of Directors are elected by the General Meeting of Shareholders. The Board of Directors uses the highest decision making power in the Oriola-KD Group between the General Meetings of Shareholders. Pursuant to the Articles of Association, the Board of Directors consists of no fewer than five and no more than eight members. The term of the members of the Board of Directors expires at the end of the next Annual General Meeting following their election. Persons aged 67 and above may not be elected to the Board of Directors. The Chairman of the Board of Directors is elected by the General Meeting of Shareholders. The Vice Chairman of the Board is elected by the Board of Directors from among its members.
The Nomination Committee’s recommendation to the Board for the Board’s proposal on the composition and remuneration of the Board is given in the Notice of the Annual General Meeting. The biographical details of the proposed Board members are presented on the company’s website.
The Board of Directors convenes in accordance with a timetable agreed in advance and also convenes as required. In addition to making decisions, the Board of Directors also receives during its meetings current information about the operations, finances and risks of the Group. Board meetings are also attended by the Presi-dent and CEO, the CFO and the General Counsel (who acts as secre-tary to the Board). Members of the Group Management Team attend Board meetings at the invitation of the Board. Minutes are kept of all meetings.

72
Year 2015Corporate Governance
Board of Directors 2015-2016The Annual General Meeting of Oriola-KD held on 30 March 2015 confirmed that the Board of Directors of Oriola-KD shall have eight members and elected the following persons as chairman and mem-bers of the Board of Directors:
NameYear of birth Education and independence
Attendanceat BoardMeetings
Attendance at Committee Meetings
Anssi Vanjoki(Chairman)
1956 M.Sc. (Economics), independent member of the Board 11/11
Jukka Alho(Vice Chairman)
1952 M.Sc. (Eng.), independent member of the Board 16/16 Compensation Committee 2/2
Per Båtelson 1950 M.Sc. (Physics), independent member of the Board 13/16 Compensation Committee 2/2
Anja Korhonen 1953 M.Sc. (Economics), independent member of the Board 16/16 Audit Committee 7/7
Kuisma Niemelä 1958 M.Sc. independent member of the Board 16/16 Audit Committee 6/6
Eva Nilsson Bågenholm
1960 Physician, independent member of the Board 11/11 Compensation Committee 2/2
Matti Rihko 1962 M.Sc. (Economics), M.Sc. (Psychology), independent member of the Board
15/16 Compensation Committee 2/2 Audit Committee 1/1
Staffan Simberg 1949 MBA, independent member of the Board 11/11 Audit Committee 6/6
In its constitutive meeting held later the same day, the Board of Directors elected Jukka Alho as its Vice Chairman.
Members of Oriola-KD’s Board of Directors 1 January - 30 March 2015:
Harry Brade 1969 M.Sc. (Eng.), MBA, CEFA, independent member of the Board 5/5 Audit Committee 1/1
Main tasks of the Board of DirectorsThe main tasks to be dealt with by the Board of Directors are listed in the Board’s rules of procedure. Accordingly, these are among others:• approving the company’s strategy• approving financial targets, budgets, major investments and risk
management principles• appointment and dismissal of the company’s President and CEO• consideration and decision of all significant matters concerning
the operations of the Group and the business segments• approving the charters of the Audit Committee, the Compensa-
tion Committee and the Nomination Committee.
The Board of Directors has evaluated the independence of its mem-bers and determined that all members are independent of the com-pany and its major shareholders. The Board has also conducted an assesment of its activities and working practises.
In 2015, the Board of Directors of Oriola-KD convened 16 times, two of which were conference call meetings and two per capsulam meetings.
Board CommitteesThe Board of Directors has an Audit Committee and a Compensation Committee. In addition, the company has a Nomination Committee. The Committees’ charters are confirmed by the Board. The Commit-tees are preparatory bodies that submit proposals to the Board on matters within their purview. Minutes are kept of the Committees’ meetings. The Committees report to the Board at regular intervals. The Committees do not have independent decision-making pow-
ers. Their task is to submit recommendations to the Board on matters under consideration.
In its constitutive meeting, held after the Annual General Meet-ing, the Board of Directors appoints, from among its members, the members and chairman of the Audit Committee and the Compen-sation Committee. The process of appointing the members of the Nomination Committee is presented below in the section on the Nomination Committee.
In addition to the Audit, Compensation and Nomination Com-mittees, the Board of Directors may appoint ad hoc committees for preparing specific matters. Such committees do not have Board-approved charters and the Board does not release information on their term, composition, the number of meetings or the members’ attendance rates.
73
Year 2015 Year 2015Corporate Governance
Audit CommitteeThe task of the Audit Committee is to enhance the control of the company’s operations and financial reporting. According to the charter, the following in particular shall be addressed and prepared by the Audit Committee:
• reviewing the consolidated financial statements and interim re-ports, together with the auditor
• reviewing together with the auditor any deficiencies in the su-pervision systems observed in control inspections and any other deficiencies reported by auditors
• reviewing any deficiencies in the control system observed in in-ternal audit and other observations and recommendations made
• reviewing the plans of action for the control inspection and in-ternal audit and giving recommendations to company manage-ment on focus areas for internal audits
• evaluating the appropriateness of the supervision of company administration and risk management, and reviewing changes in the principles of company accounting and external reporting prior to their introduction.
In addition, the Audit Committee’s duties include preparatory work on the decision on electing the auditor, evaluation of the independ-ence of the auditor, taking into account particularly the effect of the provision of related services on the independence, and carrying out any other tasks assigned to it by the Board. The Audit Committee has at least three members.
As of 30 March 2015, the Chairman of the Audit Committee is Anja Korhonen and the other members are Kuisma Niemelä and Staffan Simberg. The members of the Audit Committee are independent of the company and its major shareholders.
Compensation CommitteeAccording to the charter, the Compensation Committee reviews management and personnel remuneration policies and issues re-lated to management appointments, and makes proposals on such matters to the Board of Directors. The Committee’s responsibilities include:• reviewing, evaluating and making proposals on the remuneration
structure and incentive schemes of management and the person-nel of the Oriola-KD Group
• monitoring the effectiveness of these systems to ensure that in-centive schemes of the management promote achievement of the company’s short term and long term goals
• reviewing and preparing other matters relating to the remune-ration of management and personnel, and submitting proposals on these to the Board
• considering and preparing appointments of top management to be decided by the Board.
The Compensation Committee has four members. As of 30 March 2015, the Chairman of the Committee is Jukka Alho and the other
members are Per Båtelson, Eva Nilsson Bågenholm and Matti Rihko. The members of the Compensation Committee are independent of the company and its major shareholders.
Nomination CommitteeThe Nomination Committee of Oriola-KD is a body established by the Board of Directors for the purpose of preparing and presenting to the Board a recommendation for the proposal to be put by the Board to the Annual General Meeting concerning the composition and remuneration of the Board. The Board has approved the charter of the Nomination Committee.
The Committee members are appointed by the Board of Directors, which also appoints one of the members as Chairman. The term of office for the Committee members’ expire the year following the appointment upon the appointment of the Committee members pursuant to the charter. Members of the Committee need not be members of the Board of Directors. The purpose of this deviation from the Corporate Governance Code is to allow the appointment of major shareholders of the company to the Nomination Commit-tee and thus to ensure that their opinions are heard well before the Annual General Meeting.
Prior to appointing the Committee members, the Chairman of the Board arranges a meeting to which the Chairman invites the com-pany’s twenty largest shareholders, by votes, registered by the 31st of August preceding the Annual General Meetings as shareholders in the company’s shareholders register maintained by Euroclear Fin-land Ltd. The purpose of the meeting is to hear the major sharehold-ers on their views as to the composition of the Committee.
Not later than on the 1st of February preceding the Annual General Meeting, the Committee presents to the Board its recommendation on the proposal to be put before the Annual General Meeting con-cerning the composition and remuneration of the Board. The Nomi-nation Committee evaluates the independence of the proposed Board members it has recommended. The Committee’s recommen-dation does not affect the Board’s independent decision-making authority or its right to put proposals before the General Meeting.
The Nomination Committee appointed for the term of office end-ing at the appointment of the new Committee members’ appoint-ment on 25 September 2015, convened 5 times and the attendance rate of the Committee’s members was 96.7per cent.
On 25 September 2015, the Board of Directors elected the follow-ing persons to the Nomination Committee: Peter Immonen, Timo Leino, Mikko Mursula, Pekka Pajamo and Into Ylppö. Pekka Pajamo was elected as Chairman of the Committee. The members of the Committee are independent of the company.
President and CEO and deputy to CEOThe Board of Directors appoints the President and CEO of Oriola-KD and decides on the terms of his/her employment. The current President and CEO of the company is Eero Hautaniemi, M.Sc. (Econ.), born in 1965. In accordance with the Companies Act, the President and CEO is responsible for the day to day executive management of

74
Year 2015Corporate Governance
the company in accordance with the instructions and orders given by the Board of Directors. In addition, the President and CEO also ensures that accounts of the company complies with Finnish law and that its financial affairs have been arranged in a reliable manner. The terms and conditions of the President and CEO’s employment are specified in a written service contract approved by the Board.
The Board of Directors also appoints, as necessary, a deputy to CEO. The company’s deputy to CEO is Kimmo Virtanen, Executive Vice President, Pharmaceutical Wholesale Finland, Sweden and the Bal-tics and Managing Director of Oriola Oy, M.Sc. (Econ.), born in 1968.
Group Management TeamThe Group Management Team consists of the President and CEO of Oriola-KD as Chairman and persons appointed by the Board. At the end of year 2015, the Group Management Team consisted of seven members, including the President and CEO, to whom the other Group Management Team members report.
The Group Management Team meets regularly to address mat-ters concerning the entire Group. The Group Management Team is not a decision-making body. It assists the President and CEO in the implementation of Group strategy and in operational management, and facilitates the Group-wide distribution of information concern-ing the entire Group.
The following persons were members of Oriola KD’s Group Man-agement Team in 2015:• Eero Hautaniemi, President and CEO• Sari Aitokallio, CFO (as of 9 April 2015)• Lars Birkeland, Vice President, Pharmaceutical Retail, Sweden• Thomas Gawell, Vice President, Pharmaceutical Wholesale, Swe-
den (as of 6 February 2015)• Jukka Mäkelä, Vice President, Development • Teija Silver, Vice President, Human Resources• Kimmo Virtanen, Executive Vice President, Pharmaceutical Who-
lesale, Finland, Sweden and Baltics• Tuomas Itkonen, CFO (until 1 April 2015)
Risk management and internal supervision systems connected with financial reportingThe internal control and risk management systems related to Oriola-KD’s financial reporting aim to ensure a reasonable certainty of the reliability of the company’s financial statements and financial report-ing, as well as the company’s compliance to legislation and generally approved accounting principles.
Financial reportingThe Board of Directors and the President and CEO have the overall responsibility for organising the internal control and risk manage-ment systems pertaining to financial reporting. The President and CEO, the members of the Group Management Team and the heads of the business units are responsible for the accounting and admin-istration of the areas within their spheres of responsibility complying
with legislation, the Group’s operating principles, and the guidelines and instructions issued by Oriola-KD Corporation’s Board of Direc-tors. The organising and leading of the financial reporting in the Group has been centralized under the subordination of the CFO.
Oriola-KD Group follows the International Financial Reporting Standards (IFRS) approved for application within the European Union. Instructions and accountancy principles for financial reporting are collected in an accounting manual that is updated as soon as stand-ards change, as well as in the financial department’s instructions that are followed in all Group companies. Group Accounting is respon-sible for following and keeping up to date with financial statement standards, upholding the principles concerning financial reporting and distributing information about these to the business units.
Measurement and follow-upThe performance of the Group is monitored in the Group Manage-ment Team with monthly reports as well as in the monthly opera-tional reviews of the business segments. The financial situation of the Group is also monitored in the meetings of the Board of Direc-tors. The Audit Committee and the Board of Directors examine the interim reports and financial statements before their publication. Monitoring of the monthly reports also ensures the effectiveness of the internal supervision. Each business segment must ensure effective supervision of its own operations as part of Group-level internal supervision. The business segments and the Group Finance organisation are responsible for the evaluation of the processes cov-ering financial reporting. The evaluations must contain balances and analyses, which are compared with budgets, assessments and vari-ous economic indicators.
Internal controlInternal control forms an essential part of the company’s govern-ance and management systems. It covers all of the Group’s functions and organisational levels. The purpose of internal control is to ensure a sufficient certainty that the company will be able to carry out its strategy. Internal control is not a separate process but a procedural measure covering all Group-wide operating principles, guidelines and systems.
The purpose of Oriola-KD’s internal supervision system is to sup-port the implementation of the Group strategy and to ensure that rules and regulations are observed. The company’s internal supervi-sion is based on a Group structure, in which the Group’s operations are organised into business segments and Group functions. Group functions issue Group-level guidelines laying down the operational framework and the persons responsible for the process. The guide-lines cover such areas as accounting, reporting, financing, invest-ments and business principles.
The guidelines aim to ensure that all risks connected to the achievement of the company’s objectives can be identified and pre-vented. The control measures cover all Group levels and functions. All new instructions and guidelines are published on the company’s internal website and staff members can provide feedback to the

75
Year 2015 Year 2015Corporate Governance
management and anonymously report any questionable activities through the company intranet.
Risk management The purpose of risk management is to help the Group to achieve its objectives. The risks threatening the achievement of the objectives can only be managed if they are identified and assessed.
The Board of Directors of Oriola-KD Corporation approves the company’s risk management policy in which the risk management operating model, principles, responsibilities and reporting are speci-fied. The Board guides and supervises the planning and implemen-tation of the risk management. The Board-appointed Audit Commit-tee supervises risk management in the Group.
The President and CEO of Oriola-KD and the Group Management Team have the operative responsibility for risk management. Risk management and the principles governing risk management and their development, coordination and monitoring are the responsi-bility of the Risk Management Steering Group, which is chaired by the Group’s CFO.
Oriola-KD’s risk management policies are part of the Group’s man-agement and reporting process and its different components. The purpose of the policies is to ensure that risks that may threaten Oriola-KD’s operations and the achievement of goals set can be comprehensively identified, assessed, managed and monitored throughout the Group. Risk management is an integral part of Ori-ola-KD’s strategic process, governance and management system, decision-making, daily management, monitoring and reporting. Risk management is also a part of Oriola-KD’s internal control system.
In its risk management system Oriola-KD classifies risks affecting its business to four different categories: strategic risks, operational risks, financial risks as well as health, safety and environmental (HSE) risks. The most significant strategic and operational risks recognised by the company have been described in the Report of the Board of Directors.The financial risks are described in Note no 24 to the Consolidated Financial Statements.
Internal auditOriola-KD uses an outsourced internal audit function for the purpose of fulfilling its internal audit requirements. The outsourced internal audit function is an independent and objective assurance activity re-porting directly to the Audit Committee of the Board of Directors. The internal audit assignments are carried out on the basis of an Internal Audit Charter approved by the Board of Directors as well as an Internal Audit Plan annually reviewed and approved by the Audit Committee.
External auditThe company has one auditor, which must be a firm of authorised public accountants. The auditor is elected annually by the Annual General Meeting for a term that expires at the end of the next An-nual General Meeting following the election. The task of the auditor is to audit the consolidated financial statements, the financial state-ments of the parent company, the accounting of the Group and the
parent company and the administration of the parent company. The company’s auditor submits the auditors’ report to the shareholders in connection with the annual financial statements, as required by law, and submits regular reports on its observations to the Board’s Audit Committee.
The Annual General Meeting of Oriola-KD Corporation held on 30 March 2015 re-elected PricewaterhouseCoopers Oy, a firm of authorised public accountants, as the company’s auditor, with Kaj Wasenius, APA, as the principal auditor. The auditor of Oriola-KD Corporation as elected by the Annual General Meeting, Pricewa-terhouseCoopers Oy, designated Ylva Eriksson, APA, as the principal auditor as of July 16, 2015. The fees for the audit proper paid to the auditing firm PricewaterhouseCoopers Oy in 2015 totalled EUR 204,450. In addition, EUR 126,871 was paid for other consultation provided to Group companies.
Insider managementOriola-KD complies with the insider holding guidelines issued by NASDAQ Helsinki Ltd.The public insiders of Oriola-KD comprise the members of the company’s Board, its auditor, President and CEO and other members of the management team and the secretary to the Board. Persons in the employment of the company who have regular access to insider information by virtue of their position or du-ties make up the company’s company-specific insiders. The public and company-specific registers of insiders are kept in the Euroclear Finland SIRE system.
In addition, the company maintains a project-specific register of insiders. Persons privy to insider information concerning a specific project are entered in this register.
REMUNERATION STATEMENT
This Remuneration Statement is published in accordance with Rec-ommendation 47 of the Corporate Governance Code 2010.
Remuneration and other benefits of the members of the Board of DirectorsThe Annual General Meeting decides annually on the remuneration payable to members of the Board of Directors for their term of office.
On 30 March 2015, the Annual General Meeting decided that the Chairman of the Board will receive EUR 48,400 in remuneration for his term of office, the Vice Chairman of the Board and the Chairman of the Board’s Audit Committee EUR 30,250 and the other mem-bers of the Board EUR 24,200 each. The Chairman of the Board will receive an attendance fee of EUR 1000 per meeting, and the other Board members EUR 500 per meeting. Attendance fees will also be paid correspondingly to the chairmen and members of Board and company committees. Travel expenses will be paid in accord-ance with the travel policy of the company. In accordance with the decision of the Annual General Meeting, 60 per cent of the annual remuneration was paid in cash and 40 per cent in class B shares.
76
Year 2015Corporate Governance
Oriola-KD Corporation class B shares were acquired on the market for the Board members as follows: Anssi Vanjoki 4,756 shares, Jukka Alho 2,973 shares, Anja Korhonen 2,973 shares, Per Båtelson 2,378 shares, Kuisma Niemelä 2,378 shares, Eva Nilsson Bågenholm 2,378 shares, Matti Rihko 2,378 shares and Staffan Simberg 2,378 shares.
Restriction periods are not included in the remuneration paid in Oriola-KD Corporation class B shares. The members of the Board of Directors have not received any share-based rights as remuneration. They are not included in the company’s share incentive scheme. The company has not granted any loans to Board members nor given guarantees on their behalf.
The total fees and other benefits of the Board members for 2015 and shareholdings in the company 31 December 2015 are available on page 78.
Main principles and decision-making process on the remuneration of the President and CEO and other executivesThe salary of the President and CEO and other members of the Group Management Team consists of a fixed base salary, fringe benefits, a short term performance bonus and a long term share incentive plan. The remuneration commits management to develop the company and its financial success in the long term. The development stage and strategy of the company are considered when determining the principles for remuneration.
In accordance with its charter approved by the Board of Direc-tors, the Compensation Committee monitors the effectiveness of the incentive schemes to ensure that the schemes promote the achievement of the company’s short term and long term goals.
The Board of Directors reviews and decides annually on the remu-neration and benefits of the President and CEO and other members of the Group Management Team, and the underlying criteria thereof.
The Board of Directors decides annually on the earnings criteria and the determination of the performance bonuses based on the proposal of the Compensation Committee.
The company has not granted any loans to the President and CEO or to the members of the Group Management team, nor given guar-antees on their behalf. The company has no share option scheme in place. The President and CEO and the members of the Group Man-agement Team have no supplementary pension scheme, except the Vice President Pharmaceutical Wholesale Sweden and Vice President Pharmaceutical Retail Sweden, who have a defined contribution pension benefit typically applied in the Swedish market.
Short term performance bonus The performance bonus is based on the achievement of the com-pany’s financial targets and personal targets. The maximum per-formance bonus in 2015 for the President and CEO is 58.3 per cent of the annual salary and for the other Group Management Team members 33.3 per cent of the annual salary. The Board of Directors decides annually on the earnings criteria and the determination of
the performance bonuses based on the proposal of the Compensa-tion Committee.
Long term share based incentive scheme The members of Oriola-KD’s Group Management Team are in the company’s long term share incentive scheme. The scheme unites the objectives of shareholders and key personnel to increase the value of the company, commits the key personnel to the company, and offers key personnel a competitive remuneration system based on ownership of shares in the company.
The Board of Directors of Oriola-KD approved on 19 December 2012 a new share-based incentive plan for the Group executives for the years 2013-2015. The share-based incentive plan includes three performance periods which are calendar years 2013, 2014 and 2015. The Board of Directors of the company will decide on the per-formance criteria and on targets to be established for them at the beginning of each performance period. The potential reward from the plan for the performance period 2015 will be based on Oriola-KD Group’s Earnings per Share (EPS).
The potential reward from the performance period 2015 will be paid partly in the company’s series B shares and partly in cash in 2018. The company will cover taxes and tax-related costs arising from the reward to the executives with the proportion to be paid in cash. No reward will mainly be paid if an executive’s employment or service in a Group company ends before the reward payment.
If an executive’s total earnings are more than his or her total salary of the calendar year preceding the reward payment multiplied by 3.5, the reward to be paid on the basis of the performance period will be reduced for such exceeding part. Total earnings mean total salary together with annual bonus and long-term incentive plan, and total salary means fixed base salary together with fringe benefits.
The target group of the share-based incentive plan consists of six executives during the performance period 2015. The rewards to be paid on the basis of the performance period 2015 will correspond to the value of a maximum total of 625,483 Oriola-KD Corporation series B shares (including also the proportion to be paid in cash).
The Board of Directors of Oriola-KD approved the terms and con-ditions of the key employees’ share savings plan on 28 May 2013. On 27 August 2014 the Board of Directors decided to continue the Share Savings Plan with a new Savings Period 2014-2015. A total of about 40 key employees were participating in the plan. The Savings Period started on 1 October 2014 and ended on 30 September 2015.The holding period will end on the publication date of the Oriola-KD Q3/2016 interim report.
On 15 June 2015 the Board of Directors decided to launch a new Savings Period 2015-2016 in which approximately 50 group key em-ployees have enrolled. This Savings Period will last for 15 months, and it will begin on 1 October 2015 and end on 31 December 2016. The maximum monthly saving is 8.3 percent and the minimum is 2 percent of each participant’s fixed monthly gross salary. The ac-cumulated savings are used for purchasing Oriola-KD class B shares for the participants at the market price quarterly.

77
Year 2015 Year 2015Corporate Governance
In return, each participant will receive two free class B matching shares for every three acquired savings shares. Matching shares will be delivered to a participant if the participant holds the acquired shares from the Savings Period until the end of the designated holding period and if his or her employment with a company has not been terminated on the last day of the holding period on bad leaver terms. The holding period will end on the publication date of the Oriola-KD Q4/2017 interim report. Matching shares will be paid partly in the Company’s class B shares and partly in cash. The cash proportion is intended for covering taxes and tax-related payments arising from the reward to a key person.
The Board of Directors resolved to establish a new share-based incentive plan directed to the Group key personnel (the Plan) on 4 December 2015. The aim of the Plan is to combine the objectives of the shareholders and the key personnel in order to increase the value of the Company in the long-term, to retain the key personnel in the Company, and to offer them a competitive reward plan based on performance and accumulation of share ownership in the Com-pany. The aim is also to harmonize the Company’s incentive plans into a One-Platform Plan where the Company’s Key Personnel Share Savings Plan and Long-Term Incentive Plan are combined.
The Plan includes three performance periods, calendar years 2016, 2017 and 2018, and three vesting periods, calendar years 2017, 2018 and 2019, respectively. The Board of Directors of the Company will resolve on the Plan’s performance criteria and on the required per-formance level for each criterion at the beginning of a performance period. Approximately 20 key persons, including the members of the Group Management Team, belong to the target group of the Plan.
The prerequisite for participation in the Plan and for receipt of reward on the basis of the Plan is that a key person has enrolled in the Share Savings Plan and makes the monthly saving from his or her fixed gross monthly salary, in accordance with the Rules of the Share Savings Plan in force.
The potential reward of from the performance period 2016 will be based on the Group’s Earnings per Share (EPS). The rewards to be paid on the basis of the performance period 2016 correspond to the value of an approximate maximum total of 800,000 Oriola-KD Corporation Class B shares (including also the proportion to be paid in cash). The potential reward will be paid partly in Oriola-KD Corporation Class B shares and partly in cash in 2018. The cash pro-portion is intended to cover taxes and tax-related costs arising from the reward to a key person.
Financial benefits of the President and CEO in 2015The salary and other remuneration, including fringe benefits, paid in 2015 to the President and CEO Eero Hautaniemi, amounted to a total of EUR 627,591as follows:• fixed base salary of EUR 417,886;• fringe benefits of EUR 24,850;• performance bonus of EUR 147,479; and• share-based payments of EUR 37,377.
The President and CEO has a six-month period of notice and is enti-tled to severance pay equal to 12 months’ salary. The retirement age of the President and CEO is 63 years and his pension is in accordance with the Employees’ Pensions Act. The President and CEO is included in the company’s share based incentive scheme. Shareholdings of the President and CEO in the company are available on page 78.
Financial benefits of other executives 2015 The salaries and other remuneration, including fringe benefits, paid in 2015 to the members of the Group Management team totalled EUR 1,656,049 as follows:• fixed base salaries totalling EUR 1,258,855;• fringe benefits totalling EUR 53,755;• performance bonuses totalling EUR 297,998; and• share-based payments totalling EUR 45,441.
The members of the Group Management Team are included in the company’s share based incentive scheme. Shareholdings of the members of the Group Management Team in the company are available on page 78.

78
Year 2015Corporate Governance
Salaries and benefits of the Members of the Board of Directors, CEO and Members of the Group Management Team 2015 and their shareholdings (including controlled entities) 31.12.2015
Salaries and benefits 2015 Salaries and benefits 2014 Shareholdings 31.12.2015EUR 1,000 EUR 1,000 A shares B shares Total
Board of DirectorsVanjoki Anssi, chairman 59.9 - - 4,756 4,756Alho Jukka (vice chairman) 41.3 64.0 - 32,996 32,996Brade Harry 2.8 35.0 - - -Nilsson Bågenholm Eva 30.2 - - 2,378 2,378Båtelson Per 30.3 29.8 - 6,691 6,691Korhonen Anja 43.7 39.1 - 9,002 9,002Niemelä Kuisma 33.8 30.2 - 7,289 7,289Rihko Matti 31.8 37.1 - 8,768 8,768Staffan Simberg 32.2 - - - -(Nez-Invest Ab) - 152,378 152,378
Raitasuo Outi 1.6 1.6Vidgren Mika 1.2 1.2Slotte Karsten 1.2 1.2
President and CEOHautaniemi Eero Fixed basic salary 417.9 426.1 - 235,975 235,975
Fringe benefits 24.9 20.5Performance bonus 147.5 70.5
Share-based payments 37.4 -Total 627.6 496.6
Group Management teamSari Aitokallio - - -Lars Birkeland - - -Jukka Mäkelä - 8,144 8,144Teija Silver - 30,988 30,988Kimmo Virtanen 1,757 114,863 116,620Thomas Gawell - 17,172 17,172
Tuomas Itkonen (until1.4.2015) - - -
Salaries and benefits of the Group management 1,656.0 1,481.2

79
Year 2015Year 2015 Members of the Board of Directors 2015–2016
Members of the Board of Directors 2015–2016
Mr. Anssi Vanjoki, Chairman, b. 1956KM.Sc. (Economics)Shares in Oriola-KD Corporation 31 Dec 2015: 0 class A shares; 4.756 class B sharesPRIMARY CAREER-03/2011, Nokia Corporation, Executive Vice President & General Manager 1998-2011, Nokia Group, Executive board memberKEY POSITIONS OF TRUSTMember of the Board of Basware Corporation, Atacama Labs Oy and Sonova Holding AG Chairman of the Board of Amer Sports Corporation, KoruLab Oy, Omegawave Oy, Aqsens Oy and Sstatzz Oy
Mr. Jukka Alho, , b. 1952M.Sc. (Eng.) Vice ChairmanChairman of the Remuneration CommitteeIndependent member of the Board since 2011Shares in Oriola-KD Corporation 31 Dec 2015: 0 class A shares; 32.996 class B sharesPRIMARY CAREER2000-2012 Itella Corporation, CEO1981-2000 Elisa Corporation, Executive Vice President 1997-2000KEY POSITIONS OF TRUSTChairman of the Board of the Church Resource Agency and the Foundation for the Church Training College
Mr. Per Båtelson, b. 1950M.Sc. (Physics)Independent member since 2010Shares in Oriola-KD Corporation 31 Dec 2015: 0 class A shares; 6.691 class B sharesPRIMARY CAREER2006-2012 Global Health Partner Plc, Managing Director1994-2006 Capio AB, Managing DirectorKEY POSITIONS OF TRUSTChairman of the Board of Karolinska University HospitalMember of the Board of Humana AB, Unilabs AB and IVBAR - The Institute for Value Based Reimbursement AB
Ms. Anja Korhonen, b. 1953M.Sc. (Economics)Chairman of the Audit CommitteeShares in Oriola-KD Corporation 31 Dec 2015: 0 class A shares; 9.002 class B sharesPRIMARY CAREER1996-2011 Nokia Corporation, Senior Vice President, Corporate Con-troller; Vice President, Business Controller, Mobile Phones; Senior Vice President, Business Controller Nokia Mobile Phones. 1983-1996 Hewlett-Packard, Nordic Controller and Finance & Admin Manager/Finland; European Planning and Reporting Manager; Vari-ous other manager positions within finance and accounting as well as developments programs.KEY POSITIONS OF TRUSTMember of the Board of Outotec Oyj

Members of the Board of Directors 2015–2016
80
Year 2015
Mr. Kuisma Niemelä, b. 1958 M.Sc. Shares in Oriola-KD Corporation 31 Dec 2015: 0 class A shares; 7.289 class B sharesPRIMARY CAREER2010-2013 SOK (Suomen Osuuskauppojen keskuskunta), CEO and Chairman of the Board;Different leadership positions within the SOK-group during 30 years.KEY POSITIONS OF TRUST Member of the Board of Joutsen Finland Oy, Fresto Group Oy and Alko OyChairman of the Board of Puls Nutrition Oy
Ms. Eva Nilsson Bågenholm, b. 1960 PhysicianShares in Oriola-KD Corporation 31 Dec 2015: 0 class A shares; 2,378 class B sharesPRIMARY CAREER2015- Humana AB, Quality Director2011-2014 Swedish Ministry of Health and Social Affairs, National Coordinator for Elderly Care 2002-2011 Sahlgrenska University Hospital, Specialist physician in Internal medicine
Mr. Matti Rihko, b. 1962M.Sc. (Economics), M.Sc. (Psychology)Shares in Oriola-KD Corporation 31 Dec 2015: 0 class A shares; 8.768 class B sharesPRIMARY CAREER2006- Raisio plc, CEO2004-2006 Altadis SA, Vice Precident, Ingredients Division1999-2004 Altadis Finland Oy, General ManagerKEY POSITIONS OF TRUSTMember of the Board of Suomen Terveystalo Oy, Turku Science Park Oy and Turku Chamber of Commerce Chairman of the Board of Turku UniversityMember of the Supervisory Board of the Finnish Medical Foundation
Mr. Staffan Simberg, b. 1949MBAShares in Oriola-KD Corporation 31 Dec 2015: 0 class A shares; 0 class B sharesPRIMARY CAREER2011 Metso Group, Industrial Advisor2009, 2012 Cargotec Oyj, Industrial Advisor2008–2009 Metso Panelboard, Chairman2007–2013Landis & Gyr AG, Member of the Advisory Board2005-2007 Enermet Group, Managing Director 1992-1994 Siar-Bossard, Associated Partner 1978-1991 Leading positions at Nokia KEY POSITIONS OF TRUSTMember of the Board of Bittium Corporation, Bittium Technologies LtdChairman of the Board of Endomines AB (Publ)

81
Year 2015Year 2015 Group Management Team 2015
Group Management Team 2015
Mr. Eero Hautaniemi, b. 1965M. Sc. (Econ.), President and CEO Mr. Hautaniemi has been President and CEO of Oriola-KD Corpo-ration since the establishment in 2006. Mr Hautaniemi served as President of GE Healthcare Finland Oy during 2004–2005, and as General Manager and Vice President of Oximetry, Supplies and Ac-cessories business area of GE Healthcare IT in 2003–2004. Before this Mr. Hautaniemi held different positions in financial and business management in Instrumentarium Corporation in Finland and in the United States.Mr. Hautaniemi is a member of the Board of Directors of Lassila & Tikanoja Corporation. He is also a member of the Board of Finnish Commerce, a member of the GIRP Management Board and GIRP Treasurer (GIRP= The European Association of Pharmaceutical Full-line Wholesalers).
Ms. Sari Aitokallio, b. 1960Master of Laws, CFOSari Aitokallio was appointed Chief Financial Officer (CFO) of Oriola-KD Corporation on 16 July 2015.Sari Aitokallio was appointed as interim CFO of Oriola-KD Corpora-tion and member of Oriola-KD Group’s Management Team as of 9 April 2015. Ms. Aitokallio holds strong experience from financial management positions in Finnish listed companies. Previously Ms. Aitokallio has worked for Metso Automation as division SVP Finance and administration since 2007. Earlier experience includes several positions in Valmet and Metso Groups, both in Finland and abroad. Furthermore Ms. Aitokallio worked for Sponda Group in 2002-2006 as CFO.
Mr. Lars Birkeland, b. 1964M.Sc. (Econ.)Vice President, Consumer BusinessManaging Director of Kronans ApotekMr. Lars Birkeland was appointed Vice President of Oriola-KD’s Con-sumer Business as of 1January, 2016. Mr. Birkeland served as Vice President of Oriola-KD’s Pharmaceutical Retail business in Sweden and Managing Director of Kronans Apotek in 2012-2015. Previously Mr. Birkeland held the position of Managing Director of the Nor-wegian Apotek 1 pharmacy chain. Mr. Birkeland has 11 years’ ex-perience from the pharmaceutical retail and wholesale businesses within Tamro Group and he also brings with him over 10 years of retail experience from the USA within the fields of finance and busi-ness management.
Mr. Thomas Gawell, b. 1963Thomas Gawell, b. 1963M.Sc. (Econ.)Vice President, Healthcare BusinessManaging Director of Oriola ABMr. Thomas Gawell was appointed Vice President of Oriola-KD’s Healthcare Business as of 1 January, 2016. Mr. Gawell served as Vice President of Oriola-KD’s Pharmaceutical Wholesale business in Swe-den and Managing Director of Oriola AB in 2009-2015. Before that, Gawell held the position of Financial Manager of Oriola AB since 2001, and before joining Oriola AB Gawell held several Financial Management positions for over 10 years.

82
Year 2015Year 2015Group Management Team 2015
Mr. Jukka Mäkelä, b. 1963M. Sc.Vice President, Development and Information ManagementMr. Mäkelä was appointed Vice President, Development of Oriola-KD Corporation in April 2013.Before joining Oriola-KD, Mr. Mäkelä worked for Aedi Oy as partner and CEO. Before that Mr. Mäkelä worked for Accenture during 1990-2011 as a consultant and Business Unit Executive Director (partner) responsible for Retail & Wholesale and Manufacturing Industries.
Ms. Teija Silver, b. 1964M.Sc. (Econ)Vice President, Human Resources Ms. Teija Silver was appointed Vice President, Human Resources of Oriola-KD Corporation in October 2006. She joined Oriola-KD from GE Healthcare Finland where she held the position of Director, Hu-man Resources. Before that she served in Nokia Networks as Director and Manager, Human Resources.
Mr. Kimmo Virtanen, b. 1968M. Sc. (Econ.)Executive Vice President, Services BusinessManaging Director of Oriola OyDeputy to CEO of Oriola-KD CorporationMr. Virtanen was appointed Executive Vice President of Oriola-KD’s Services Business as of January 1, 2016. Mr. Virtanen served as Execu-tive Vice President of Oriola-KD’s Pharmaceutical Wholesale busi-nesses in Finland, Sweden and the Baltic Countries in 2012-2015 and as CFO of Oriola-KD Corporation in 2006-2012. Previously Mr. Vir-tanen served as CFO of Componenta Corporation in 2003-2006, CFO of Danisco Sweeteners in the UK and Finland in 1999-2003 and held several management positions of Cultor Corporation in 1995-1999.
Changes in the Group Management Team in 2015
Mr. Tuomas Itkonen was CFO until 1 April 2015.
Ms. Sari Aitokallio was appointed as interim CFO on 9 April 2015 and as CFO on 16 July 2015.
83
Year 2015 Year 2015Stock Exchange Releases 2015Year 2015
Stock Exchange Releases 2015
20 January 2015 Oriola-KD to begin co-operation negotiations in Finland to improve operating efficiency
20 January 2015 Oriola-KD renews centralized sourcing service agreement for pharmacy chains in Swedena
27 January 2015 Oriola-KD Corporation will publish its financial statements release 1 January-31 December 2014 on Friday, 6 February 2015 at 8.30 a.m.
28 January 2015 Recommendation by the Nomination Committee of Oriola-KD Corporation concerning the Board of Directors to be elected by the 2015 Annual General Meeting
2 February 2015 Oriola-KD Corporation revises recognised loss from the sale of Russian businesses
6 February 2015 Oriola-KD Corporation’s Financial Statements Release 2014
6 February 2015 Oriola-KD Corporation has today published its Annual Review and Corporate Governance Statement for 2014
9 February 2015 Changes in Oriola-KD’s Group Management Team
10 February 2015 Oriola-KD Corporation Board of Directors has decided on a eur 75.6 million rights offering
12 February 2015 Oriola-KD Corporation’s Financial Statements 2014 and the Report of the Board of Directors is published
12 February 2015 Oriola-KD Corporation publishes the Finnish language prospectus regarding the Rights Offering
4 March 2015 The preliminary results of Oriola-KD’s rights offering the offering has been concluded successfully
6 March 2015 Final results of Oriola-KD’s rights offering the offering was oversubscribed
6 March 2015 Notice to Oriola-KD Corporation’s Annual General Meeting 2015
16 March 2015 Oriola-KD’s co-operation negotiations in Finland completed
18 March 2015 Oriola-KD redeems the EUR 40 million hybrid bond
30 March 2015 Resolutions of the Annual General Meeting of Oriola-KD Corporation and the decisions of the constitutive meeting of the Board of Directors
1 April 2015 Oriola-KD Corporation’s CFO Tuomas Itkonen leaves the company
7 April 2015 Sari Aitokallio appointed interim CFO of Oriola-KD Corporation
13 April 2015 Oriola-KD Corporation will publish the interim report 1 January - 31 March 2015 on Thursday, 23 April 2015 at 8.30 a.m.
23 April 2015 Oriola-KD Corporation’s Interim Report for 1 January-31 March 2015
5 May 2015 Notification on a change in ownership according to chapter 9, section 5 of the Securities Market act
1 June 2015 Oriola-KD and Orion renew their cooperation agreement in Finland
11 June 2015 Oriola-KD Corporation has rearranged its long-term revolving credit facility and term loan agreement
18 June 2015 The Board of Directors of Oriola-KD Corporation Decided to Continue the Key Personnel Share Savings Plan
2 July 2015 Oriola-KD Corporation will publish the interim report 1 January - 30 June 2015 on Friday, 17 July 2015 at 8.30 a.m
17 July 2015 Oriola-KD Corporation’s Interim Report for 1 January - 30 June 2015
17 July 2015 Sari Aitokallio appointed CFO of Oriola-KD Corporation
18 August 2015 Oriola-KD’s updated strategy, new operating model and long-term financial targets
18 August 2015 Invitation to Oriola-KD Corporation’s Capital Markets Day, 9 September 2015
31 August 2015 Notification on change in ownership according to Chapter 9, Section 5 of the Securities Market Act
17 September 2015 Oriola-KD Corporation’s 120,000 A-shares converted into B-shares
17 September 2015 Oriola-KD and MSD renew their long-term cooperation agreement in Finland
25 September 2015 Oriola-KD to transfer its statutory occupational pensions to Ilmarinen and supplementary pension benefits to OP Life Assurance
25 September 2015 The Composition of Oriola-KD’s Nomination Committee
7 October 2015 Nasdaq Helsinki Disciplinary Committee imposed a warning and a fine on Oriola-KD Corporation for Breaching the Rules of the Exchange
9 October 2015 Oriola-KD Corporation will publish the interim report 1 January - 30 September 2015 on Thursday, 22 October 2015 at 8.30 a.m.
22 October 2015 Oriola-KD Corporation’s Interim Report for 1 January - 30 September 2015
5 November 2015 Oriola-KD Corporation’s 863,804 A-shares converted into B-shares
2 December 2015 Publication schedule for Oriola-KD Corporation’s financial reporting in 2016
3 December 2015 Oriola-KD Corporation’s 110,000 A-shares converted into B-shares
4 December 2015 The Board of Directors of Oriola-KD Corporation Resolved on Key Personnel Long-Term Incentive Plan
Kronans ApotekLindhagensgatan 120, 7 floor, S-104 25 Stockholm, SwedenP.O.Box 30094Tel.+ 46 10 240 60 [email protected] information of the Kronans Apotek pharmacies in www.kdapotek.se
Oriola Oy, EspooOrionintie 5, FI-02200 Espoo, FinlandP.O.Box 8, FI-02101 Espoo, FinlandTel. +358 10 429 99Fax +358 10 429 [email protected] Oriola Oy, OuluIskontie 3, FI-90570 Oulu, FinlandP.O.Box 51, FI-90101 Oulu, FinlandTel. +358 10 42 999Fax +358 10 429 [email protected]
AS Oriola, EstoniaTammsaare tee 47, EST-11316 Tallinn, Estonia Kungla 2, EST-76505 Saue, Harjumaa, Estonia (warehouse)Tel. +372 6 515 100Fax +372 6 515 [email protected]
SIA Oriola Riga, LatviaDzelzavas iela 120 M, LV-1021 Riga, LatviaTel. +371 67 802 450Fax + 371 67 802 [email protected] UAB Oriola Vilnius, LithuaniaLaisves pr. 75, LT-06144 Vilnius, LithuaniaTel. +370 5 2688 401Fax +370 5 2688 [email protected] Oriola AB, MölnlyckeFibervägen SolstenP.O.Box 252, S-43525, Mölnlycke, SwedenTel. +46 31 887 000Fax +46 31 338 [email protected]
Oriola-KD CorporationOrionintie 5, FI-02200 Espoo, FinlandP.O.Box 8, FI-02101 Espoo, FinlandTel. +358 10 429 99Fax +358 10 429 [email protected]
Oriola AB, EnköpingKvartsgatan 7 P.O.Box 900, S-74525 Enköping, SwedenTel. +46 171 41 49 00Fax +46 171 41 49 [email protected] Oriola AB, StockholmSlöjdgatan 9P.O.Box 7532, S-10393 Stockholm, SwedenTel. +46 8 402 38 [email protected]
Contact informationInformation for Shareholders
Analysts following Oriola-KD
The banks and investment service companies listed below have published investment reports on the Oriola-KD Corporation. The analysts’ contact details are listed on the Oriola-Kd website.
Carnegie Investment BankDanske MarketsEnskilda Equity ResearchEvli Pankki PlcInderes LtdHandelsbanken Capital MarketsNordea MarketsPohjola Bank Plc
Annual General Meeting 2016
The 2016 Annual General Meeting of shareholders of Oriola-KD Corporation will be held on Monday, 14 March 2016 at 2 pm at the Helsinki Exhibition and Convention Centre, address Helsinki Exhibition and Convention Centre, Conference Wing, Rautatieläisenkatu 3, 00520 Helsinki, Finland. The notice to convene is available on the company’s web site at www.oriola-kd.com and it will be published in Helsingin sanomat on 19 February 2016.
Shareholders register and insider register
The company’s shareholder register as well as the insider re-gister are available at Euroclear Finland Ltd at the following address:
Euroclear Finland LtdUrho Kekkosen katu 5 C00100 Helsinki, Finland
The shareholders are requested to make their change of address to the Account Operator who attends to the shareholder’s book-entry account.

ORIO ORPORATIONOrionintie 5, P.O Box 8
FI-02101 Espoowww.oriola-kd.com
12
REPORT OF BOARD OF DIRECTORS AND
FINANCIAL STATEMENTS
2015