REPORT OF PRICEWATERHOUSECOOPERS LLP, INDEPENDENT …
53
- APP.-B-1 - THE PROGRESSIVE CORPORATION AND SUBSIDIARIES REPORT OF PRICEWATERHOUSECOOPERS LLP, INDEPENDENT AUDITORS In our opinion, the accompanying consolidated balance sheets and the related consolidated statements of income, changes in shareholders’ equity and cash flows present fairly, in all material respects, the financial position of The Progressive Corporation and its subsidiaries at December 31, 2003 and 2002, and the results of their operations and their cash flows for each of the three years in the period ended December 31, 2003, in conformity with accounting principles generally accepted in the United States of America.These financial statements are the responsibility of the Company’s management; our responsibility is to express an opinion on these financial statements based on our audits.We conducted our audits of these statements in accordance with auditing standards generally accepted in the United States of America, which require that we plan and perform the audits to obtain reasonable assurance about whether the financial statements are free of material misstatement.An audit includes examining, on a test basis, evidence supporting the amounts and disclosures in the financial statements, assessing the accounting principles used and significant estimates made by management, and evaluating the overall financial statement presentation.We believe that our audits provide a reasonable basis for our opinion. To the Board of Directors and Shareholders, The Progressive Corporation: Cleveland, Ohio January 21, 2004
Transcript of REPORT OF PRICEWATERHOUSECOOPERS LLP, INDEPENDENT …

- APP.-B-1 -
THE PROGRESSIVE CORPORATION AND SUBSIDIARIES
REPORT OF PRICEWATERHOUSECOOPERS LLP, INDEPENDENT AUDITORS
In our opinion, the accompanying consolidated balance sheets and the related consolidated statements of income, changesin shareholders’ equity and cash flows present fairly, in all material respects, the financial position of The ProgressiveCorporation and its subsidiaries at December 31, 2003 and 2002, and the results of their operations and their cash flows foreach of the three years in the period ended December 31,2003, in conformity with accounting principles generally acceptedin the United States of America. These financial statements are the responsibility of the Company’s management; ourresponsibility is to express an opinion on these financial statements based on our audits.We conducted our audits of thesestatements in accordance with auditing standards generally accepted in the United States of America,which require that weplan and perform the audits to obtain reasonable assurance about whether the financial statements are free of materialmisstatement.An audit includes examining,on a test basis, evidence supporting the amounts and disclosures in the financialstatements, assessing the accounting principles used and significant estimates made by management, and evaluating theoverall financial statement presentation.We believe that our audits provide a reasonable basis for our opinion.
To the Board of Directors and Shareholders, The Progressive Corporation:
Cleveland, OhioJanuary 21, 2004

- APP.-B-2 -
THE PROGRESSIVE CORPORATION AND SUBSIDIARIES
CONSOLIDATED STATEMENTS OF INCOME
(millions – except per share amounts)
For the years ended December 31, 2003 2002 2001
REVENUES
Net premiums earned $ 11,341.0 $ 8,883.5 $ 7,161.8Investment income 465.3 455.2 413.6Net realized gains (losses) on securities 12.7 (78.6) (111.9)Service revenues 41.8 34.3 24.7Other income1 31.2 — —
Total revenues 11,892.0 9,294.4 7,488.2
EXPENSES
Losses and loss adjustment expenses 7,640.4 6,299.1 5,264.1Policy acquisition costs 1,249.1 1,031.6 864.9Other underwriting expenses 1,010.1 874.2 686.9Investment expenses 11.5 11.5 12.7Service expenses 25.7 22.0 19.8Interest expense 95.5 74.6 52.2
Total expenses 10,032.3 8,313.0 6,900.6
NET INCOME
Income before income taxes 1,859.7 981.4 587.6Provision for income taxes 604.3 314.1 176.2Net income $ 1,255.4 $ 667.3 $ 411.4
COMPUTATION OF EARNINGS PER SHARE
Basic:Average shares outstanding 216.8 219.0 221.0
Per share $ 5.79 $ 3.05 $ 1.86Diluted:Average shares outstanding 216.8 219.0 221.0Net effect of dilutive stock-based compensation 3.7 4.2 4.2
Total equivalent shares 220.5 223.2 225.2Per share $ 5.69 $ 2.99 $ 1.83
1See Note 3 – Income Taxes for discussion.
All share and per share amounts were adjusted for the April 22, 2002, 3-for-1stock split.
See notes to consolidated financial statements.

- APP.-B-3 -
December 31, 2003 2002
ASSETS
Investments:Available-for-sale:
Fixed maturities, at market (amortized cost: $8,899.0 and $7,409.4) $ 9,133.4 $ 7,712.5Equity securities, at market:
Preferred stocks (cost: $751.3 and $631.9) 778.8 656.7Common equities (cost: $1,590.6 and $1,425.3) 1,972.1 1,347.3
Short-term investments, at amortized cost (market: $648.0 and $567.8) 648.0 567.8Total investments 12,532.3 10,284.3
Cash 12.1 16.9Accrued investment income 97.4 77.9Premiums receivable, net of allowance for doubtful accounts of $66.8 and $54.6 2,079.6 1,742.8Reinsurance recoverables, including $41.4 and $34.8 on paid losses 271.3 215.7Prepaid reinsurance premiums 114.7 96.7Deferred acquisition costs 412.3 363.5Income taxes 81.6 219.2Property and equipment, net of accumulated depreciation of $476.4 and $392.4 584.7 503.1Other assets 95.5 44.3
Total assets $ 16,281.5 $ 13,564.4
LIABILITIES AND SHAREHOLDERS’ EQUITY
Unearned premiums $ 3,894.7 $ 3,304.3Loss and loss adjustment expense reserves 4,576.3 3,813.0Accounts payable, accrued expenses and other liabilities 1,290.1 1,190.1Debt 1,489.8 1,489.0
Total liabilities 11,250.9 9,796.4Shareholders’ equity:
Common Shares, $1.00 par value (authorized 600.0 and 300.0; issued 230.1, including treasury shares of 13.7 and 12.1) 216.4 218.0
Paid-in capital 688.3 584.7Unamortized restricted stock (28.9) —Accumulated other comprehensive income (loss):
Net unrealized appreciation on investment securities 418.2 162.4Net unrealized gains on forecasted transactions 10.7 11.7Foreign currency translation adjustment (3.9) (4.8)
Retained earnings 3,729.8 2,796.0Total shareholders’ equity 5,030.6 3,768.0
Total liabilities and shareholders’ equity $ 16,281.5 $ 13,564.4
(millions)
See notes to consolidated financial statements.
THE PROGRESSIVE CORPORATION AND SUBSIDIARIES
CONSOLIDATED BALANCE SHEETS

- APP.-B-4 -
For the years ended December 31, 2003 2002 2001
RETAINED EARNINGS
Balance, Beginning of year $ 2,796.0 $ 2,497.4 $ 2,220.4Net income 1,255.4 $1,255.4 667.3 $ 667.3 411.4 $ 411.4Cash dividends on Common Shares ($.100, $.096
and $.093 per share, split effected) (21.7) (21.1) (20.6)Treasury shares purchased (297.5) (200.7) (112.5)Capitalization of stock split — (147.0) —Other, net (2.4) .1 (1.3)
Balance, End of year $ 3,729.8 $ 2,796.0 $ 2,497.4
ACCUMULATED OTHER COMPREHENSIVEINCOME (LOSS), NET OF TAX
Balance, Beginning of year $ 169.3 $ 125.9 $ 64.7Changes in:
Unrealized appreciation 255.8 40.9 52.0Net unrealized gains on forecasted transactions (1.0) 2.5 9.2Foreign currency translation adjustment .9 — —
Other comprehensive income 255.7 255.7 43.4 43.4 61.2 61.2Balance, End of year $ 425.0 $ 169.3 $ 125.9Comprehensive Income $ 1,511.1 $ 710.7 $ 472.6
COMMON SHARES, $1.00 PAR VALUE
Balance, Beginning of year $ 218.0 $ 73.4 $ 73.5Stock options exercised 2.8 1.2 .8Treasury shares purchased1 (5.0) (3.6) (.9)Restricted stock issued, net of forfeitures .6 — —Capitalization of stock split — 147.0 —
Balance, End of year $ 216.4 $ 218.0 $ 73.4
PAID-IN CAPITAL
Balance, Beginning of year $ 584.7 $ 554.0 $ 511.2Stock options exercised 47.2 21.4 25.2Tax benefits on stock options exercised 44.0 19.3 24.4Treasury shares purchased (14.3) (10.0) (6.8)Restricted stock issued, net of forfeitures 26.7 — —
Balance, End of year $ 688.3 $ 584.7 $ 554.0
UNAMORTIZED RESTRICTED STOCK
Balance, Beginning of year $ — $ — $ —Restricted stock issued, net of forfeitures (37.3) — —Restricted stock market value adjustment (2.6) — —Amortization of restricted stock 11.0 — —
Balance, End of year $ (28.9) $ — $ —
Total Shareholders’ Equity $ 5,030.6 $ 3,768.0 $ 3,250.7
1The Company did not split treasury shares. In 2002, the Company repurchased 136,182 Common Shares prior to the stocksplit and 3,471,916 Common Shares subsequent to the stock split.
There are 20.0 million Serial Preferred Shares authorized; no such shares are issued or outstanding.
There are 5.0 million Voting Preference Shares authorized; no such shares have been issued.
See notes to consolidated financial statements.
(millions – except per share amounts)
THE PROGRESSIVE CORPORATION AND SUBSIDIARIES
CONSOLIDATED STATEMENTS OF CHANGES IN SHAREHOLDERS’ EQUITY
- APP.-B-5 -
(millions)
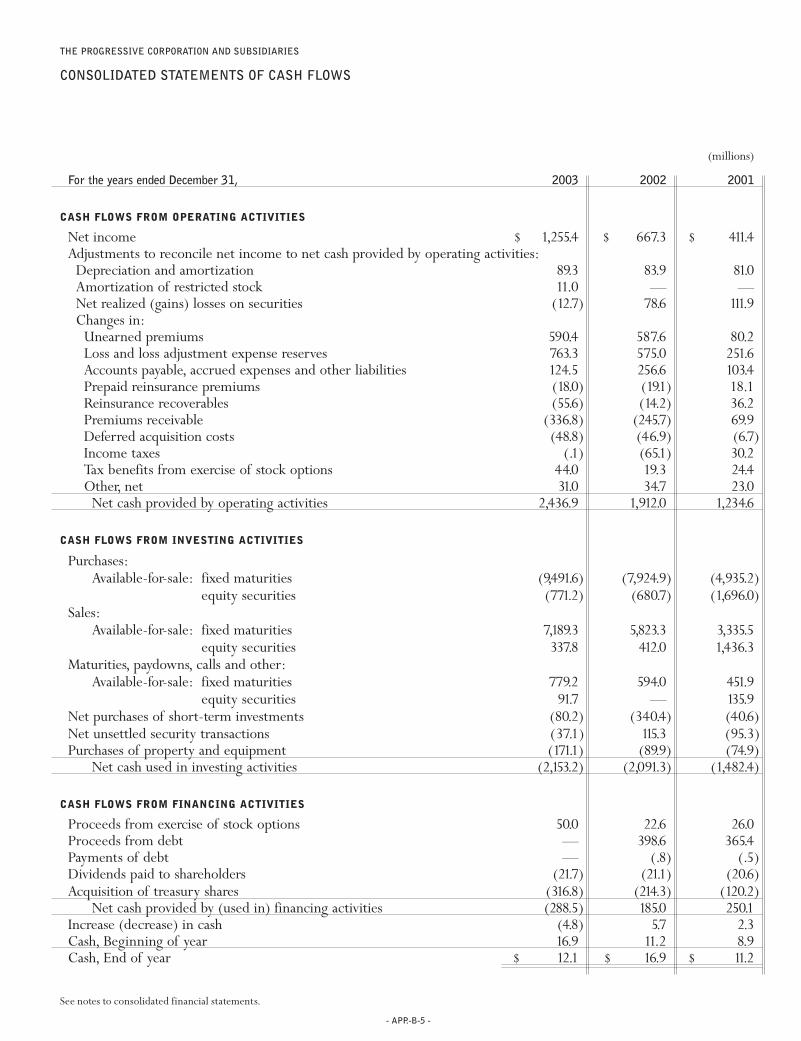
For the years ended December 31, 2003 2002 2001
CASH FLOWS FROM OPERATING ACTIVITIES
Net income $ 1,255.4 $ 667.3 $ 411.4Adjustments to reconcile net income to net cash provided by operating activities:
Depreciation and amortization 89.3 83.9 81.0Amortization of restricted stock 11.0 — —Net realized (gains) losses on securities (12.7) 78.6 111.9Changes in:
Unearned premiums 590.4 587.6 80.2Loss and loss adjustment expense reserves 763.3 575.0 251.6Accounts payable, accrued expenses and other liabilities 124.5 256.6 103.4Prepaid reinsurance premiums (18.0) (19.1) 18.1Reinsurance recoverables (55.6) (14.2) 36.2Premiums receivable (336.8) (245.7) 69.9Deferred acquisition costs (48.8) (46.9) (6.7)Income taxes (.1) (65.1) 30.2Tax benefits from exercise of stock options 44.0 19.3 24.4Other, net 31.0 34.7 23.0
Net cash provided by operating activities 2,436.9 1,912.0 1,234.6
CASH FLOWS FROM INVESTING ACTIVITIES
Purchases:Available-for-sale: fixed maturities (9,491.6) (7,924.9) (4,935.2)
equity securities (771.2) (680.7) (1,696.0)Sales:
Available-for-sale: fixed maturities 7,189.3 5,823.3 3,335.5equity securities 337.8 412.0 1,436.3
Maturities, paydowns, calls and other:Available-for-sale: fixed maturities 779.2 594.0 451.9
equity securities 91.7 — 135.9Net purchases of short-term investments (80.2) (340.4) (40.6)Net unsettled security transactions (37.1) 115.3 (95.3)Purchases of property and equipment (171.1) (89.9) (74.9)
Net cash used in investing activities (2,153.2) (2,091.3) (1,482.4)
CASH FLOWS FROM FINANCING ACTIVITIES
Proceeds from exercise of stock options 50.0 22.6 26.0Proceeds from debt — 398.6 365.4Payments of debt — (.8) (.5)Dividends paid to shareholders (21.7) (21.1) (20.6)Acquisition of treasury shares (316.8) (214.3) (120.2)
Net cash provided by (used in) financing activities (288.5) 185.0 250.1Increase (decrease) in cash (4.8) 5.7 2.3Cash, Beginning of year 16.9 11.2 8.9Cash, End of year $ 12.1 $ 16.9 $ 11.2
See notes to consolidated financial statements.
THE PROGRESSIVE CORPORATION AND SUBSIDIARIES
CONSOLIDATED STATEMENTS OF CASH FLOWS

- APP.-B-6 -
- 1 - REPORTING AND ACCOUNTING POLICIES
NATURE OF OPERATIONS The Progressive Corporation, an insurance holding company formed in 1965,owns 68 subsidiariesand has 1mutual insurance company affiliate and 1reciprocal insurance company affiliate (the Company) as of December 31,2003.The insurance subsidiaries and affiliates provide personal automobile insurance and other specialty property-casualtyinsurance and related services throughout the United States.The Company’s Personal Lines segment writes insurance forprivate passenger automobiles and recreation vehicles through both an independent agency channel and a direct channel.The Company’s Commercial Auto segment writes insurance for automobiles and trucks owned by small businesses primarilythrough the independent agency channel.
BASIS OF CONSOLIDATION AND REPORTING The accompanying consolidated financial statements include the accounts ofThe Progressive Corporation, its subsidiaries and affiliates. All of the subsidiaries and the affiliates are wholly owned orcontrolled.All intercompany accounts and transactions are eliminated in consolidation.
ESTIMATES The Company is required to make estimates and assumptions when preparing its financial statements andaccompanying notes in conformity with accounting principles generally accepted in the United States of America (GAAP).Actual results could differ from those estimates.
INVESTMENTS Available-for-sale: fixed maturity securities are debt securities, which may have fixed or variable principalpayment schedules, may be held for indefinite periods of time, and may be used as a part of the Company’s asset/liabilitystrategy or sold in response to changes in interest rates, anticipated prepayments, risk/reward characteristics, liquidity needsor similar economic factors.These securities are carried at market value with the corresponding unrealized appreciation ordepreciation,net of deferred income taxes,reported in accumulated other comprehensive income.Market values are obtainedfrom a recognized pricing service or other quoted sources.The asset-backed portfolio is accounted for under the retrospectivemethod; prepayment assumptions are based on market expectations.For interest only and non-investment-grade asset-backedsecurities, the prospective method is used in accordance with the guidance prescribed by Emerging Issues Task Force Issue(EITF) 99-20,“Recognition of Interest Income and Impairment on Purchased and Retained Beneficial Interest in SecuritizedFinancial Assets.”
Available-for-sale: equity securities include common equities and nonredeemable preferred stocks and are reported atquoted market values.Changes in the market values of these securities,net of deferred income taxes,are reflected as unrealizedappreciation or depreciation in accumulated other comprehensive income.Changes in value of foreign equities due to foreigncurrency exchange rates are limited by foreign currency hedges; unhedged amounts are not material and changes in valueare recognized in income in the current period.The Company held no foreign equities or foreign currency hedges during2003 or 2002.
Trading securities are securities bought principally for the purpose of sale in the near term and, when not material to theCompany’s financial position, cash flows or results of operations, are reported at market value within the available-for-saleportfolio.The Company had no trading securities at December 31, 2003; derivatives used for trading are discussed below. Inprior years, the net activity in trading securities was not material to the Company’s financial position or cash flows; the effecton results of operations is separately disclosed in Note 2 - Investments.To the extent the Company has trading securities,changesin market value would be recognized in income in the current period.
Derivative instruments may include futures, options, forward positions, foreign currency forwards and interest rate swapagreements and may be used in the portfolio for risk management or trading purposes or to hedge the exposure to: changesin fair value of an asset or liability (fair value hedge); foreign currency of an investment in a foreign operation (foreign currencyhedge); or variable cash flows of a forecasted transaction (cash flow hedge).These derivative instruments would be recognized
THE PROGRESSIVE CORPORATION AND SUBSIDIARIES
NOTES TO CONSOLIDATED FINANCIAL STATEMENTS
December 31, 2003, 2002 and 2001

- APP.-B-7 -
as either assets or liabilities and measured at fair value with changes in fair value recognized in income in the period of change.Changes in the fair value of the hedged items would be recognized in income while the hedge was in effect.
At December 31, 2003, the Company held two derivatives classified as trading securities. The Company sold defaultprotection related to two issuers, using credit default swaps and matched the notional value of these positions with Treasurynotes with an equivalent principal value and maturity to replicate a cash bond position.Changes in the fair value of the creditdefault swaps and the Treasury notes are recognized in income in the current period.
During 2003, the Company held no derivatives classified as cash flow hedges. Changes in fair value of these hedges arereported as a component of accumulated other comprehensive income and subsequently amortized into earnings over thelife of the hedged transaction.Gains and losses on hedges on forecasted transactions are amortized over the life of the hedgeditem (see Note 4 – Debt).Hedges on forecasted transactions that no longer qualify for hedge accounting due to lack of correlationare considered derivatives used for risk management purposes.
During 2003, the Company had no fair value or foreign currency hedges or derivative instruments held or issued for riskmanagement purposes.To the extent the Company held fair value hedges,changes in the hedge,along with the hedged itemswould be recognized in income in the period of change while the hedge was in effect. Gains and losses on foreign currencyhedges would offset the foreign exchange gains and losses on the foreign investments. Derivatives held or issued for riskmanagement purposes would be recognized in income during the period of change.
Derivatives designated as hedges would also be evaluated on established criteria to determine the effectiveness of theircorrelation to, and ability to reduce risk of, specific securities or transactions; effectiveness would be reassessed regularly. Ifthe effectiveness of a fair value hedge becomes non-compliant, the adjustment in the change in value of the hedged itemwould no longer be recognized in income during the current period.
For all derivative positions, net cash requirements are limited to changes in market values, which may vary based uponchanges in interest rates, currency exchange rates and other factors. Exposure to credit risk is limited to the carrying value;collateral may be required to limit credit risk.
Short-term investments include Eurodollar deposits, commercial paper and other securities maturing within one yearand are reported at amortized cost, which approximates market.
Investment securities are exposed to various risks such as interest rate, market and credit risk. Market values of securitiesfluctuate based on the magnitude of changing market conditions; significant changes in market conditions could materiallyaffect portfolio value in the near term.The Company continually monitors its portfolio for pricing changes, which mightindicate potential impairments and performs detailed reviews of securities with unrealized losses based on predeterminedcriteria. In such cases, changes in market value are evaluated to determine the extent to which such changes are attributableto (i) fundamental factors specific to the issuer, such as financial conditions,business prospects or other factors or (ii) market-related factors, such as interest rates or equity market declines.When a security in the Company’s investment portfolio hasan unrealized loss in market value that is deemed to be other than temporary, the Company reduces the book value of suchsecurity to its current market value, recognizing the decline as a realized loss in the income statement.Any future increasesin the market value of securities written down are reflected as changes in unrealized gains as part of accumulated othercomprehensive income within shareholders’ equity.
Realized gains and losses on securities are computed based on the first-in first-out method and include write-downs onavailable-for-sale securities considered to have other than temporary declines in market value.
PROPERTY AND EQUIPMENT Property and equipment are recorded at cost.Depreciation is provided over the estimated usefullives of the assets using accelerated methods for computers and the straight-line method for all other fixed assets.The usefullives range from 3 to 4 years for computers,10 to 40 years for buildings and improvements, and 5 to 6 years for all otherproperty and equipment. Property and equipment includes software capitalized for internal use.At December 31, 2003 and2002, land and buildings comprised 75% and 73%, respectively, of total property and equipment.
Total interest capitalized was $1.5 million,$.5 million and $1.2 million in 2003,2002 and 2001,respectively, relating to boththe Company's construction projects and capitalized computer software costs.
INSURANCE PREMIUMS AND RECEIVABLES Insurance premiums written are earned on a pro rata basis over the period ofrisk,using a mid-month convention. Insurance premiums written in 2004 and forward will be earned based on a daily earnings

- APP.-B-8 -
convention.The Company provides insurance and related services to individuals and small commercial accounts throughoutthe United States, and offers a variety of payment plans. Generally, premiums are collected prior to providing risk coverage,minimizing the Company’s exposure to credit risk.The Company performs a policy level evaluation to determine the extentthe premiums receivable balance exceeds its unearned premiums balance.The Company then ages this exposure to establishan allowance for doubtful accounts based on prior experience.
INCOME TAXES The income tax provision is calculated under the balance sheet approach in accordance with Statement ofFinancial Accounting Standards (SFAS) 109 “Accounting for Income Taxes.” Deferred tax assets and liabilities are recordedbased on the difference between the financial statement and tax bases of assets and liabilities at the enacted tax rates.Theprincipal assets and liabilities giving rise to such differences are net unrealized gains/losses on securities, loss reserves,unearnedpremiums reserves, deferred acquisition costs and non-deductible accruals.The Company reviews its deferred tax assets forrecoverability.At December 31, 2003, the Company is able to demonstrate that the benefit of its deferred tax assets is fullyrealizable and, therefore, no valuation allowance is recorded.
LOSS AND LOSS ADJUSTMENT EXPENSE RESERVES Loss reserves represent the estimated liability on claims reported to theCompany, plus reserves for losses incurred but not yet reported (IBNR). These estimates are reported net of amountsrecoverable from salvage and subrogation. Loss adjustment expense reserves represent the estimated expenses required tosettle these claims and losses.The methods of making estimates and establishing these reserves are reviewed regularly, andresulting adjustments are reflected in income currently. Such loss and loss adjustment expense reserves could be susceptibleto significant change in the near term.
REINSURANCE The Company’s reinsurance transactions include premiums written under state-mandated involuntary plansfor commercial vehicles (Commercial Auto Insurance Procedures–CAIP), for which the Company retains no loss indemnityrisk (see Note 6 – Reinsurance for further discussion). In addition, the Company cedes auto premiums to state-providedreinsurance facilities and premiums in its non-auto programs to limit its exposure in those particular markets. Prepaidreinsurance premiums were recognized on a pro rata basis over the period of risk, primarily using a mid-month conventionand consistent with premiums written. Beginning in 2004, prepaid reinsurance premiums will be earned based on a dailyearnings convention. Because the Company’s primary line of business, auto insurance, is written at relatively low limits ofliability, the Company does not believe that it needs to mitigate its risk through voluntary reinsurance.
EARNINGS PER SHARE Basic earnings per share are computed using the weighted average number of Common Sharesoutstanding. Diluted earnings per share include common stock equivalents assumed outstanding during the period.TheCompany’s common stock equivalents include stock options and qualified restricted stock awards.
DEFERRED ACQUISITION COSTS Deferred acquisition costs include commissions, premium taxes and other variableunderwriting and direct sales costs incurred in connection with writing business.These costs are deferred and amortizedover the policy period in which the related premiums are earned.The Company considers anticipated investment income indetermining the recoverability of these costs.Management believes that these costs will be fully recoverable in the near term.The Company does not defer advertising costs.
GUARANTY FUND ASSESSMENTS The Company is subject to state guaranty fund assessments which provide for the paymentof covered claims or other insurance obligations of insurance companies deemed insolvent.These assessments are accruedafter a formal determination of insolvency has occurred and the Company has written the premiums on which the assessmentswill be based.
SERVICE REVENUES AND EXPENSES Service revenues consist primarily of fees generated from processing business forinvoluntary plans and are earned on a pro rata basis over the term of the related policies.Acquisition expenses are deferredand amortized over the period in which the related revenues are earned.
- APP.-B-9 -
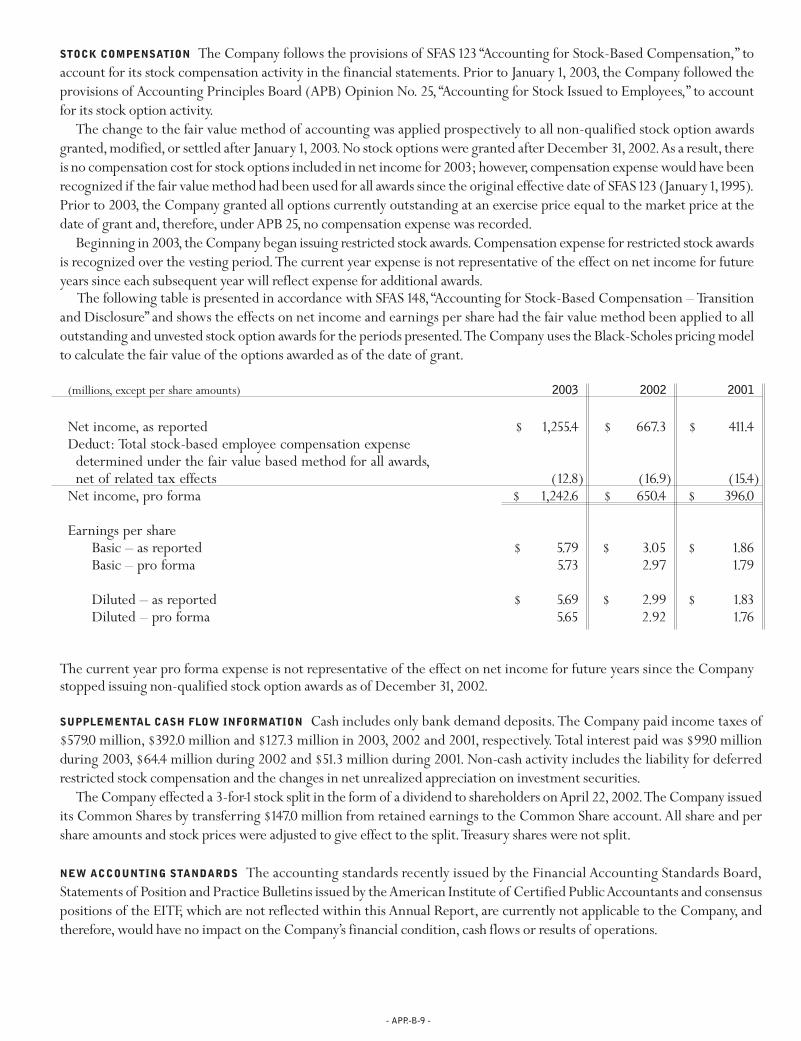
The following table is presented in accordance with SFAS 148, “Accounting for Stock-Based Compensation – Transitionand Disclosure” and shows the effects on net income and earnings per share had the fair value method been applied to alloutstanding and unvested stock option awards for the periods presented.The Company uses the Black-Scholes pricing modelto calculate the fair value of the options awarded as of the date of grant.
(millions, except per share amounts) 2003 2002 2001
Net income, as reported $ 1,255.4 $ 667.3 $ 411.4Deduct: Total stock-based employee compensation expense
determined under the fair value based method for all awards,net of related tax effects (12.8) (16.9) (15.4)
Net income, pro forma $ 1,242.6 $ 650.4 $ 396.0
Earnings per shareBasic – as reported $ 5.79 $ 3.05 $ 1.86Basic – pro forma 5.73 2.97 1.79
Diluted – as reported $ 5.69 $ 2.99 $ 1.83Diluted – pro forma 5.65 2.92 1.76
The current year pro forma expense is not representative of the effect on net income for future years since the Companystopped issuing non-qualified stock option awards as of December 31, 2002.
STOCK COMPENSATION The Company follows the provisions of SFAS 123 “Accounting for Stock-Based Compensation,” toaccount for its stock compensation activity in the financial statements. Prior to January 1, 2003, the Company followed theprovisions of Accounting Principles Board (APB) Opinion No. 25, “Accounting for Stock Issued to Employees,” to accountfor its stock option activity.
The change to the fair value method of accounting was applied prospectively to all non-qualified stock option awardsgranted,modified,or settled after January 1,2003.No stock options were granted after December 31,2002.As a result, thereis no compensation cost for stock options included in net income for 2003; however,compensation expense would have beenrecognized if the fair value method had been used for all awards since the original effective date of SFAS 123 (January 1,1995).Prior to 2003, the Company granted all options currently outstanding at an exercise price equal to the market price at thedate of grant and, therefore, under APB 25, no compensation expense was recorded.
Beginning in 2003, the Company began issuing restricted stock awards.Compensation expense for restricted stock awardsis recognized over the vesting period.The current year expense is not representative of the effect on net income for futureyears since each subsequent year will reflect expense for additional awards.
SUPPLEMENTAL CASH FLOW INFORMATION Cash includes only bank demand deposits.The Company paid income taxes of$579.0 million, $392.0 million and $127.3 million in 2003, 2002 and 2001, respectively.Total interest paid was $99.0 millionduring 2003, $64.4 million during 2002 and $51.3 million during 2001. Non-cash activity includes the liability for deferredrestricted stock compensation and the changes in net unrealized appreciation on investment securities.
The Company effected a 3-for-1stock split in the form of a dividend to shareholders on April 22,2002.The Company issuedits Common Shares by transferring $147.0 million from retained earnings to the Common Share account. All share and pershare amounts and stock prices were adjusted to give effect to the split.Treasury shares were not split.
NEW ACCOUNTING STANDARDS The accounting standards recently issued by the Financial Accounting Standards Board,Statements of Position and Practice Bulletins issued by the American Institute of Certified Public Accountants and consensuspositions of the EITF, which are not reflected within this Annual Report, are currently not applicable to the Company, andtherefore, would have no impact on the Company’s financial condition, cash flows or results of operations.

- APP.-B-10 -
The components of net investment income for the years ended December 31were:
(millions) 2003 2002 2001
Available-for-sale: fixed maturities $ 369.5 $ 379.4 $ 335.0preferred stocks 53.0 45.1 53.8common equities 31.1 22.8 14.2
Short-term investments 11.7 7.9 10.6Investment income 465.3 455.2 413.6Investment expenses 11.5 11.5 12.7
Net investment income $ 453.8 $ 443.7 $ 400.9
See Note 10 – Other Comprehensive Income for changes in the net unrealized gains (losses) during the period.
At December 31, 2003, bonds in the principal amount of $79.6 million were on deposit with various regulatory agencies tomeet statutory requirements.The Company did not have any securities of one issuer with an aggregate cost or market valueexceeding ten percent of total shareholders’ equity at December 31, 2003 or 2002.
- 2 - INVESTMENTS
The composition of the investment portfolio at December 31was:
Gross Gross % ofUnrealized Unrealized Market Total
(millions) Cost Gains Losses Value Portfolio
2003
Available-for-sale:U.S. government obligations $ 1,307.9 $ 7.3 $ (3.0) $ 1,312.2 10.5%State and local government obligations 2,841.7 94.6 (6.1) 2,930.2 23.4Foreign government obligations 13.9 .7 — 14.6 .1Corporate and U.S. agency debt securities 1,763.1 73.9 (3.2) 1,833.8 14.6Asset-backed securities 2,972.4 83.4 (13.2) 3,042.6 24.3
8,899.0 259.9 (25.5) 9,133.4 72.9Preferred stocks 751.3 34.9 (7.4) 778.8 6.2Common equities 1,590.6 390.3 (8.8) 1,972.1 15.7
Short-term investments 648.0 — — 648.0 5.2$ 11,888.9 $ 685.1 $ (41.7) $ 12,532.3 100.0%
2002
Available-for-sale:U.S. government obligations $ 1,619.6 $ 27.3 $ — $ 1,646.9 16.0%State and local government obligations 1,900.3 76.2 (.5) 1,976.0 19.2Foreign government obligations 25.6 .8 — 26.4 .3Corporate and U.S. agency debt securities 1,443.1 75.6 (5.9) 1,512.8 14.7Asset-backed securities 2,420.8 140.1 (10.5) 2,550.4 24.8
7,409.4 320.0 (16.9) 7,712.5 75.0Preferred stocks 631.9 35.1 (10.3) 656.7 6.4Common equities 1,425.3 55.3 (133.3) 1,347.3 13.1
Short-term investments 567.8 — — 567.8 5.5$ 10,034.4 $ 410.4 $ (160.5) $ 10,284.3 100.0%

- APP.-B-11 -
The components of net realized gains (losses) for the years ended December 31were:
(millions) 2003 2002 2001
Gross realized gains:Available-for-sale: fixed maturities $ 108.4 $ 159.4 $ 63.0
preferred stocks 7.4 12.0 4.2common equities 19.0 35.3 119.7
Short-term investments .1 — .1134.9 206.7 187.0
Gross realized losses:Available-for-sale: fixed maturities (40.5) (85.6) (51.9)
preferred stocks (4.1) (.1) (31.0)common equities (77.6) (199.6) (216.0)
(122.2) (285.3) (298.9)Net realized gains (losses) on securities:
Available-for-sale: fixed maturities 67.9 73.8 11.1preferred stocks 3.3 11.9 (26.8)common equities (58.6) (164.3) (96.3)
Short-term investments .1 — .1$ 12.7 $ (78.6) $ (111.9)
Per share $ .04 $ (.23) $ (.32)
For 2003, 2002 and 2001, net realized gains (losses) on securities include $50.3 million, $136.5 million and $36.0 million, re-spectively, of write downs in securities determined to have an other than temporary decline in market value for securitiesheld at December 31.
None of these securities was deemed to have any fundamental issues that would lead the Company to believe that they wereother than temporarily impaired.The Company has the intent and ability to hold the fixed-maturity securities and preferredstocks to maturity/redemption,and will do so,as long as their relative value is greater than comparable investment opportunitieswith similar investment risk characteristics.The Company will retain the common stocks to maintain correlation to the Russell1000 index as long as the portfolio and index correlation remain similar. If the Company’s strategy were to change and thesesecurities were impaired, the Company would recognize a write down in accordance with its stated policy.
The components of gross unrealized losses at December 31,2003, in accordance with EITF Issue 03-1,“The Meaning of Other-Than-Temporary Impairments,” were:
Unrealized LossesTotal
Market Less than 12 months(millions) Value Total 12 Months or greater
Available-for-sale: fixed maturities $ 2,004.9 $ (25.5) $ (22.9) $ (2.6)preferred stocks 132.3 (7.4) (2.2) (5.2)common equities 179.2 (8.8) (2.2) (6.6)
$ 2,316.4 $ (41.7) $ (27.3) $ (14.4)
The market value for securities in an unrealized loss position for 12 months or greater was $165.1million.

- 3 - INCOME TAXES
The components of the Company’s income tax provision (benefit) were as follows:
(millions) 2003 2002 2001
Current tax provision $ 543.6 $ 404.9 $ 176.6Deferred tax (benefit) expense 60.7 (90.8) (.4)
Total income tax provision $ 604.3 $ 314.1 $ 176.2
- APP.-B-12 -
Asset-backed securities are reported based upon their projected cash flows.All other securities which do not have a singlematurity date are reported at average maturity.Actual maturities may differ from expected maturities because the issuers ofthe securities may have the right to call or prepay obligations.
The Company records derivative instruments at fair value on the balance sheet,with changes in value reflected in incomeduring the current period.This accounting treatment did not change when SFAS 133,“Accounting for Derivative Instrumentsand Hedging Activities,” became effective January 1, 2001; therefore, no transition adjustment was required.
Derivative instruments are generally used to manage the Company's risks and enhance the yields of the available-for-saleportfolio.This is accomplished by modifying the basis,duration, interest rate or foreign currency characteristics of the portfolio,hedged securities or hedged cash flows.During 2003 and 2002,the Company did not hold any open risk management derivativepositions; during 2001, the Company recognized net losses of $2.7 million.
During 2002, the Company entered into a cash flow hedge in anticipation of its $400 million debt issuance,of which $150million was originally expected to be a 10-year issuance and $250 million a 30-year issuance.The decision to issue all 30-yeardebt made the 10-year hedge a discontinued hedge and the loss recognized on closing the hedge of $1.5 million was realizedin income in accordance with SFAS 133.The debt issuance hedges are described further in Note 4 – Debt.
Derivative instruments may also be used for trading purposes.At December 31, 2003, the Company held two derivativeinstruments used for trading purposes,with a net market value of $5.7 million.During 2003, the Company sold credit defaultprotection related to two issuers, using credit default swaps.The Company matched the notional value of the positions withTreasury notes with an equivalent principal value and maturity to replicate a cash bond position.The net market value of thederivatives and the Treasury notes was $103.2 million as of December 31, 2003. Net gains (losses) on the position were $4.9million in 2003, including $(.8) million on the Treasury notes. Net gains (losses) on positions were $(.1) million in 2002 and$1.9 million in 2001and are included in the available-for-sale portfolio.
Trading securities are accounted for separately in accordance with SFAS 115,“Accounting for Certain Investments in Debt andEquity Securities.”At December 31, 2003 and 2002, the Company did not hold any trading securities. Derivatives used fortrading purposes are discussed below.Net realized gains (losses) on trading securities for the years ended December 31,2003,2002 and 2001were $.1 million, $0 and $(6.5) million, respectively.Trading securities are not material to the Company’s financial condition, cash flows or results of operations and are reported within the available-for-sale portfolio, rather thanseparately disclosed.
The composition of fixed maturities by maturity at December 31, 2003 was:
Market(millions) Cost Value
Less than one year $ 629.3 $ 643.5One to five years 4,540.8 4,645.4Five to ten years 3,661.2 3,774.2Ten years or greater 67.7 70.3
$ 8,899.0 $ 9,133.4

In July 2003, the Company received notice from the Internal Revenue Service that the Joint Committee of Taxation of Con-gress had completed its review of a Federal income tax settlement agreed to by the Internal Revenue Service, primarily at-tributable to the amount of loss reserves deductible for tax purposes.As a result, the Company will receive an income taxrefund of approximately $58 million,which is reflected as a tax recoverable as a component of the Company’s “Income Taxes”item on the balance sheet. In addition, as of December 31, 2003, the Company estimated that it will receive $31.2 million, or$.09 per share, of interest; interest will continue to accrue thereafter until payment is received.
Deferred income taxes reflect the effect for financial statement reporting purposes of temporary differences between the fi-nancial statement carrying amounts and the tax bases of assets and liabilities.At December 31, 2003 and 2002, the compo-nents of the net deferred tax assets were as follows:
(millions) 2003 2002
Deferred tax assets:Unearned premium reserve $ 268.4 $ 230.7Non-deductible accruals 84.5 79.2Loss reserves 113.1 149.6Write-downs on securities 34.7 50.7Other — 5.6
Deferred tax liabilities:Deferred acquisition costs (144.3) (127.2)Unrealized gains (225.2) (87.5)Hedges on forecasted transactions (5.8) (6.3)Other (28.5) —
Net deferred tax assets $ 96.9 $ 294.8
- APP.-B-13 -
The provision for income taxes in the accompanying consolidated statements of income differed from the statutory rate as follows:
(millions) 2003 2002 2001
Income before income taxes $ 1,859.7 $ 981.4 $ 587.6Tax at statutory rate $ 650.9 35% $ 343.5 35% $ 205.7 35%Tax effect of:
Exempt interest income (26.9) (1) (15.6) (2) (14.7) (3)Dividends received deduction (16.6) (1) (12.9) (1) (12.6) (2)Other items, net (3.1) — (.9) — (2.2) —
$ 604.3 33% $ 314.1 32% $ 176.2 30%
At December 31, 2003 and 2002, net income taxes payable were $15.3 million and $75.6 million, respectively.

Debt includes amounts the Company has borrowed and contributed to the capital of its insurance subsidiaries or borrowedfor other long-term purposes. Market values are obtained from publicly quoted sources. Interest on all debt is payablesemiannually and all principal is due at maturity.There are no restrictive financial covenants.
The 6.25% Senior Notes, the 6.375% Senior Notes and the 6 5⁄8% Senior Notes (collectively,“Senior Notes”) may be redeemedin whole or in part at any time,at the option of the Company, subject to a “make whole”provision.All other debt is noncallable.
Prior to issuance of the Senior Notes, the Company entered into forecasted debt issuance hedges against possible rises ininterest rates. Upon issuance of the applicable debt securities, the hedges were closed. Pursuant to SFAS 133, the Companyrecognized, as part of accumulated other comprehensive income, a $5.1 million unrealized gain associated with the 6.25%Senior Notes and an $18.4 million unrealized gain associated with the 6.375% Senior Notes. In addition, in 2001, the Companyreclassified the remaining $4.2 million unrealized loss associated with the 6 5⁄8% Senior Notes from a deferred asset account,in accordance with SFAS 80,“Accounting for Futures Contracts,” to accumulated other comprehensive income.The gain (loss)on these hedges is recognized as an adjustment to interest expense over the life of the related debt issuances.
In May 1990, the Company entered into a revolving credit arrangement with National City Bank, which is reviewed by thebank annually. Under this agreement, the Company has the right to borrow up to $10.0 million. By selecting from availablecredit options, the Company may elect to pay interest at rates related to the London interbank offered rate, the bank’s base rateor at a money market rate.A commitment fee is payable on any unused portion of the committed amount at the rate of .125%per annum.The Company had no borrowings under this arrangement at December 31, 2003 or 2002.
Aggregate principal payments on debt outstanding at December 31, 2003, are $206.0 million for 2004, $0 for 2005, $100.0million for 2006, $0 for 2007, $0 for 2008 and $1.2 billion thereafter.
- APP.-B-14 -
- 4 - DEBT
Debt at December 31consisted of:2003 2002
Market Market(millions) Cost Value Cost Value
6.60% Notes due 2004 (issued: $200.0, January 1994) $ 200.0 $ 200.3 $ 199.8 $ 208.17.30% Notes due 2006 (issued: $100.0, May 1996) 99.9 110.8 99.8 110.96.375% Senior Notes due 2012 (issued: $350.0, December 2001) 347.5 382.6 347.2 370.47% Notes due 2013 (issued: $150.0, October 1993) 148.8 171.0 148.7 165.565⁄8% Senior Notes due 2029 (issued: $300.0, March 1999) 294.0 312.5 294.0 295.86.25% Senior Notes due 2032 (issued: $400.0, November 2002) 393.6 408.8 393.5 432.2Other debt 6.0 6.0 6.0 6.0
$1,489.8 $1,592.0 $1,489.0 $1,588.9

- APP.-B-15 -
The Company’s objective is to establish case and IBNR reserves that are adequate to cover all loss costs, while sustainingminimal variation from the date that the reserves are initially established until losses are fully developed.The Company’sreserves developed favorably in 2003 and 2001. In addition to favorable claims settlement during 2003, the Company benefitedfrom a change in its estimate of the Company’s future operating losses due to business assigned from the New York AutomobileInsurance Plan.
Because the Company is primarily an insurer of motor vehicles, it has limited exposure to environmental, asbestos andgeneral liability claims.The Company has established reserves for these exposures, in amounts which it believes to be adequatebased on information currently known.The Company does not believe that these claims will have a material effect on theCompany’s liquidity, financial condition, cash flows or results of operations.
The Company writes personal and commercial auto insurance in the coastal states, which could be exposed to naturalcatastrophes.Although the occurrence of a major catastrophe could have a significant affect on the Company’s monthly orquarterly results, the Company believes such an event would not be so material as to disrupt the overall normal operations ofthe Company.The Company is unable to predict if any such events will occur in the near term.
- 6 - REINSURANCE
Reinsurance contracts do not relieve the Company from its obligations to policyholders. Failure of reinsurers to honor theirobligations could result in losses to the Company.The Company evaluates the financial condition of its reinsurers and monitorsconcentrations of credit risk to minimize its exposure to significant losses from reinsurer insolvencies.
As of December 31, 2003, almost 60% of the “prepaid reinsurance premiums” and approximately 55% of the “reinsurancerecoverables” are comprised of CAIP, compared to approximately 55% for both items in 2002, for which the Company retainsno loss indemnity risk.
- 5 - LOSS AND LOSS ADJUSTMENT EXPENSE RESERVES
Activity in the loss and loss adjustment expense reserves, prepared in accordance with GAAP, is summarized as follows:
(millions) 2003 2002 2001
Balance at January 1 $ 3,813.0 $ 3,238.0 $ 2,986.4Less reinsurance recoverables on unpaid losses 180.9 168.3 201.1
Net balance at January 1 3,632.1 3,069.7 2,785.3Incurred related to:
Current year 7,696.5 6,295.6 5,363.1Prior years (56.1) 3.5 (99.0)
Total incurred 7,640.4 6,299.1 5,264.1Paid related to:
Current year 5,065.4 4,135.0 3,570.4Prior years 1,860.7 1,601.7 1,409.3
Total paid 6,926.1 5,736.7 4,979.7Net balance at December 31 4,346.4 3,632.1 3,069.7
Plus reinsurance recoverables on unpaid losses 229.9 180.9 168.3Balance at December 31 $ 4,576.3 $ 3,813.0 $ 3,238.0

- APP.-B-16 -
- 7 - STATUTORY FINANCIAL INFORMATION
At December 31, 2003, $492.7 million of consolidated statutory policyholders’ surplus represents net admitted assets of theCompany’s insurance subsidiaries and affiliates that are required to meet minimum statutory surplus requirements in suchentities’ states of domicile.The companies may be licensed in states other than their states of domicile, which may have higherminimum statutory surplus requirements. Generally, the net admitted assets of insurance companies that, subject to otherapplicable insurance laws and regulations,are available for transfer to the parent company cannot include the net admitted assetsrequired to meet the minimum statutory surplus requirements of the states where the companies are licensed.
During 2003, the insurance subsidiaries paid aggregate cash dividends of $516.2 million to the parent company.Based on thedividend laws currently in effect, the insurance subsidiaries may pay aggregate dividends of $967.2 million in 2004 withoutprior approval from regulatory authorities.
Statutory policyholders’ surplus was $4,538.3 million and $3,370.2 million at December 31, 2003 and 2002, respectively.Statutory net income was $1,260.5 million,$557.4 million and $469.5 million for the years ended December 31,2003,2002 and2001, respectively.
- 8 - EMPLOYEE BENEFIT PLANS
RETIREMENT PLANS The Company has a two-tiered Retirement Security Program.The first tier is a defined contributionpension plan covering all employees who meet requirements as to age and length of service. Contributions vary from 1% to5% of annual eligible compensation up to the Social Security wage base, based on years of eligible service. Companycontributions were $15.4 million in 2003, $13.0 million in 2002 and $10.7 million in 2001.
The second tier is a long-term savings plan under which the Company matches,up to a maximum of 3% of the employee’seligible compensation, amounts contributed to the plan by an employee. Effective April 1, 2002, Company matchingcontributions may be invested by a participant in any of the investment funds available under the plan. Previously, suchmatching contributions were required to be invested in the Company stock fund until fully vested. Company matchingcontributions were $19.9 million in 2003, $16.9 million in 2002 and $14.4 million in 2001.
POSTEMPLOYMENT BENEFITS The Company provides various postemployment benefits to former or inactive employees whomeet eligibility requirements, their beneficiaries and covered dependents.Postemployment benefits include salary continuationand disability-related benefits, including workers’ compensation, and, if elected, continuation of health-care benefits.TheCompany’s liability was $12.3 million at December 31, 2003, compared to $10.0 million in 2002.
The effect of reinsurance on premiums written and earned for the years ended December 31was as follows:
2003 2002 2001(millions) Written Earned Written Earned Written Earned
Direct premiums $12,187.9 $11,597.5 $ 9,665.7 $ 9,078.1 $7,379.2 $ 7,299.0Ceded (274.5) (256.5) (213.8) (194.7) (119.2) (137.3)Assumed — — .1 .1 .1 .1
Net premiums $11,913.4 $11,341.0 $ 9,452.0 $8,883.5 $7,260.1 $ 7,161.8
Losses and loss adjustment expenses are net of reinsurance ceded of $185.8 million in 2003,$131.8 million in 2002 and $102.4million in 2001.

A summary of all employee restricted stock activity during the year ended December 31, 2003, follows:
2003WeightedAverage
Number of GrantRestricted Shares Shares Price
Beginning of year — —Add (deduct):
Granted 553,290 $ 65.81Vested (655) 65.55Cancelled (2,987) 65.55
End of year 549,648 $ 65.81
POSTRETIREMENT BENEFITS The Company provides postretirement health and life insurance benefits to all employees whomet requirements as to age and length of service at December 31,1988.This group of employees represents less than one-halfof one percent of the Company’s current workforce.The Company’s funding policy is to contribute annually the maximumamount that can be deducted for Federal income tax purposes. Contributions are intended to provide not only for benefitsattributed to services to date, but also for those expected to be earned in the future.
DEFERRED COMPENSATION The Company maintains The Progressive Corporation Executive Deferred Compensation Plan(Deferral Plan), which permits eligible executives to defer receipt of some or all of their annual bonuses or restricted stockawards.These deferred amounts are deemed invested in one or more investment funds, including Common Shares of theCompany, offered under the Deferral Plan. All distributions from the Deferral Plan will be made in cash. Prior to January2004,distributions representing amounts deemed invested in Common Shares were made in Common Shares.The Companyreserved 900,000 Common Shares for issuance under the Deferral Plan. Included in the Company’s balance sheets is anirrevocable grantor trust established to provide a source of funds to assist the Company in meeting its liabilities under theDeferral Plan.At December 31,2003 and 2002, the trust held assets of $41.3 million and $23.6 million, respectively,of which$7.1million and $5.2 million were held in Common Shares, to cover its liabilities.
INCENTIVE COMPENSATION PLANS The Company’s incentive compensation plans include executive cash bonus programsfor key members of management, a cash gainsharing program for all other employees and other stock-based compensationplans for key members of management and the non-employee directors.The amounts charged to income for cash incentivecompensation plans were $233.5 million in 2003, $169.4 million in 2002 and $128.3 million in 2001.The amount charged toincome for time-based and performance-based restricted stock awards was $11.0 million in 2003.
The Company’s 2003 Incentive Plan and the Company’s 1995 Incentive Plan,which provide for the granting of stock-basedawards, including stock options and restricted stock awards, to key employees of the Company, has 5 million and 15 millionshares authorized,respectively.The 1989 Incentive Plan has expired; however,awards made under the plan prior to expirationare still in effect.
Beginning in 2003, the Company began issuing restricted stock awards in lieu of stock options.The restricted stock awardswere issued as either time-based or performance-based awards.The time-based awards vest in equal installments upon thelapse of a period of time, typically over 3,4 and 5 year periods.The restriction period must be a minimum of six months andone day.The performance-based awards vest upon the achievement of predetermined performance criteria.The restrictedstock awards are expensed pro rata over the vesting period based on the market value of the non-deferred awards at the timeof grant, while the deferred awards are based on the current market value at the end of the reporting period.
Prior to 2003, the Company issued nonqualified stock options, which were granted for periods up to ten years, becomeexercisable at various dates not earlier than six months after the date of grant, and remain exercisable for specified periodsthereafter.All options granted had an exercise price equal to the market value of the Common Shares on the date of grant.All option exercises are settled in Common Shares.
- APP.-B-17 -

- APP.-B-18 -
The following employee stock options were outstanding or exercisable as of December 31, 2003:
Options Outstanding Options ExercisableWeighted Average Weighted Weighted
Range of Number of Remaining Average Number of AverageExercise Prices Shares Contractual Life Exercise Price Shares Exercise Price
$ 10 < 15 298,700 1.00 years $ 12.74 298,700 $ 12.7415 < 20 2,899,812 4.82 years 18.20 1,415,373 17.1320 < 30 1,004,239 3.43 years 23.12 880,246 22.8630 < 40 1,811,047 6.92 years 30.81 268,595 31.1340 < 50 1,574,415 4.64 years 44.83 696,285 41.8150 < 60 1,136,824 7.98 years 52.21 190,254 52.11
$ 10 < 60 8,725,037 3,749,453
In addition to the employee incentive plans disclosed above, the Company registered 350,000 Common Shares for the 2003Directors Equity Incentive Plan,which provides for the granting of equity-based incentive awards to non-employee directorsof the Company, and 600,000 Common Shares under the 1998 Directors’ Stock Option Plan. During 2003, the Companygranted 16,102 time-based restricted stock awards,which vest within one year from the date of grant.During 2002 and 2001,the Company granted options for 23,571shares and 38,853 shares, respectively, to the non-employee directors.These awardshave the same vesting, exercise and contract terms as the employee stock option awards.As of December 31, 2003, 2002 and2001,the directors stock options outstanding and exercisable were 311,061shares,343,044 shares and 385,473 shares,respectively.
A summary of all employee stock option activity during the years ended December 31follows:
2003 2002 2001
Weighted Weighted WeightedNumber of Average Number of Average Number of Average
Options Outstanding Shares Exercise Price Shares Exercise Price Shares Exercise Price
Beginning of year 11,947,271 $ 27.44 12,682,380 $ 23.81 13,576,176 $ 20.53Add (deduct):
Granted — — 1,194,192 52.17 2,012,082 30.89Exercised (2,826,420) 17.47 (1,464,862) 15.11 (2,437,755) 10.47Cancelled (395,814) 32.66 (464,439) 30.81 (468,123) 28.58
End of year 8,725,037 $ 30.43 11,947,271 $ 27.44 12,682,380 $ 23.81Exercisable, end of year 3,749,453 $ 25.49 4,542,722 $ 17.19 4,206,609 $ 13.19Available, end of year1 11,825,903 6,988,479 7,739,682
1Represents total shares available under both the 1995 and 2003 Incentive Plans, after the granting of stock options and re-stricted stock awards.
- APP.-B-19 -
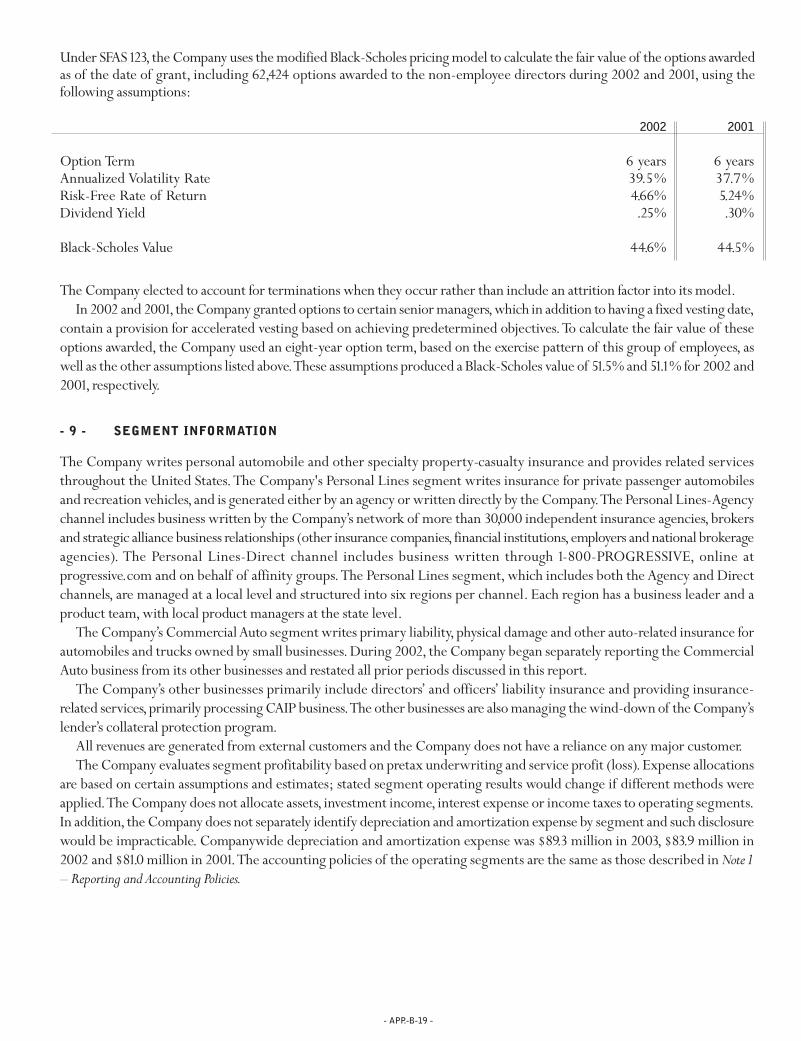
The Company elected to account for terminations when they occur rather than include an attrition factor into its model.In 2002 and 2001,the Company granted options to certain senior managers,which in addition to having a fixed vesting date,
contain a provision for accelerated vesting based on achieving predetermined objectives.To calculate the fair value of theseoptions awarded, the Company used an eight-year option term, based on the exercise pattern of this group of employees, aswell as the other assumptions listed above.These assumptions produced a Black-Scholes value of 51.5% and 51.1% for 2002 and2001, respectively.
- 9 - SEGMENT INFORMATION
The Company writes personal automobile and other specialty property-casualty insurance and provides related servicesthroughout the United States.The Company's Personal Lines segment writes insurance for private passenger automobilesand recreation vehicles, and is generated either by an agency or written directly by the Company.The Personal Lines-Agencychannel includes business written by the Company’s network of more than 30,000 independent insurance agencies, brokersand strategic alliance business relationships (other insurance companies, financial institutions,employers and national brokerageagencies). The Personal Lines-Direct channel includes business written through 1-800-PROGRESSIVE, online atprogressive.com and on behalf of affinity groups.The Personal Lines segment, which includes both the Agency and Directchannels, are managed at a local level and structured into six regions per channel. Each region has a business leader and aproduct team, with local product managers at the state level.
The Company’s Commercial Auto segment writes primary liability,physical damage and other auto-related insurance forautomobiles and trucks owned by small businesses. During 2002, the Company began separately reporting the CommercialAuto business from its other businesses and restated all prior periods discussed in this report.
The Company’s other businesses primarily include directors’ and officers’ liability insurance and providing insurance-related services,primarily processing CAIP business.The other businesses are also managing the wind-down of the Company’slender’s collateral protection program.
All revenues are generated from external customers and the Company does not have a reliance on any major customer.The Company evaluates segment profitability based on pretax underwriting and service profit (loss).Expense allocations
are based on certain assumptions and estimates; stated segment operating results would change if different methods wereapplied.The Company does not allocate assets, investment income, interest expense or income taxes to operating segments.In addition, the Company does not separately identify depreciation and amortization expense by segment and such disclosurewould be impracticable. Companywide depreciation and amortization expense was $89.3 million in 2003, $83.9 million in2002 and $81.0 million in 2001.The accounting policies of the operating segments are the same as those described in Note 1– Reporting and Accounting Policies.
Under SFAS 123,the Company uses the modified Black-Scholes pricing model to calculate the fair value of the options awardedas of the date of grant, including 62,424 options awarded to the non-employee directors during 2002 and 2001, using the following assumptions:
2002 2001
Option Term 6 years 6 yearsAnnualized Volatility Rate 39.5% 37.7%Risk-Free Rate of Return 4.66% 5.24%Dividend Yield .25% .30%
Black-Scholes Value 44.6% 44.5%

The components of other comprehensive income for the years ended December 31were as follows:
2003 2002 2001Tax Tax Tax
(Provision) After (Provision) After (Provision) After(millions) Pretax Benefit Tax Pretax Benefit Tax Pretax Benefit TaxUnrealized gains (losses)
arising during period:Available-for-sale:
fixed maturities $ 2.8 $ (.9) $ 1.9 $ 240.9 $ (84.3) $ 156.6 $ 17.0 $ (5.9) $ 11.1equity securities 431.6 (151.1) 280.5 (137.8) 48.2 (89.6) 40.9 (14.3) 26.6
Reclassification adjustment:1
Available-for-sale:fixed maturities (71.5) 25.0 (46.5) (13.8) 4.7 (9.1) 16.7 (5.8) 10.9equity securities 30.6 (10.7) 19.9 (26.2) 9.2 (17.0) 5.2 (1.8) 3.4
Net unrealized gains (losses) 393.5 (137.7) 255.8 63.1 (22.2) 40.9 79.8 (27.8) 52.0Net unrealized gains
on forecasted transactions2 (1.5) .5 (1.0) 3.8 (1.3) 2.5 14.2 (5.0) 9.2Foreign currency
translation adjustment3 .9 — .9 — — — — — —Other comprehensive
income $ 392.9 $ (137.2) $ 255.7 $ 66.9 $ (23.5) $ 43.4 $ 94.0 $ (32.8) $ 61.2
1Represents adjustments for gains (losses) realized in net income for securities held in the portfolio at December 31of the preceding year.
2Entered into for the purpose of managing interest rate risk associated with debt issuances. See Note 4 – Debt.The Company expects to reclassify $1.6 million into incomewithin the next 12 months.
3Foreign currency translation adjustments have no tax effect.
- 10 - OTHER COMPREHENSIVE INCOME
- APP.-B-20 -
Following are the operating results for the years ended December 31:
2003 2002 2001Pretax Pretax Pretax
(millions) Revenues Profit (Loss) Revenues Profit (Loss) Revenues Profit (Loss)
Personal Lines – Agency $6,948.0 $ 836.0 $5,542.7 $ 388.0 $4,706.8 $ 251.2Personal Lines – Direct 3,103.0 383.0 2,365.1 203.8 1,787.0 40.9
Total Personal Lines1 10,051.0 1,219.0 7,907.8 591.8 6,493.8 292.1Commercial Auto Business 1,226.7 214.2 880.0 80.0 552.3 45.7Other businesses2 136.3 55.5 130.0 19.1 140.4 13.0Investments3 478.0 466.5 376.6 365.1 301.7 289.0Interest expense — (95.5) — (74.6) — (52.2)
$11,892.0 $ 1,859.7 $ 9,294.4 $ 981.4 $7,488.2 $ 587.6
1Personal automobile insurance accounted for 93% of the total Personal Lines segment net premiums written in 2003, 2002 and 2001.
2For 2003, both revenues and pretax profit include $31.2 million of estimated interest income related to an income tax refund the Company will receive. See Note 3 –
Income Taxes for further discussion.
3Revenues represent recurring investment income and net realized gains (losses) on securities; pretax profit is net of investment expenses.

- APP.-B-21 -
-11 - LITIGATION
The Company is named as defendant in various lawsuits arising out of its insurance operations.All legal actions relating toclaims made under insurance policies are considered by the Company in establishing its loss and loss adjustment expensereserves.
In addition, the Company is named as defendant in a number of class action or individual lawsuits. Other insurancecompanies face many of these same issues.The lawsuits discussed below are in various stages of development.The Companyplans to contest these suits vigorously, but may pursue settlement negotiations in appropriate cases.The outcomes of thesecases are uncertain at this time. In accordance with GAAP,the Company is only permitted to establish loss reserves for lawsuitswhen it is probable that a loss has been incurred and the Company can reasonably estimate its potential exposure (referredto as a loss that is both “probable and estimable” in the discussion below).As to lawsuits that do not satisfy both parts of thisGAAP standard, the Company has not established reserves at this time. However, in the event that any one or more of thesecases results in a judgment against or settlement by the Company, the resulting liability could have a material impact on theCompany’s financial condition, cash flows and results of operations.
As required by the GAAP standard, the Company has established loss reserves for lawsuits as to which the Company hasdetermined that a loss is both probable and estimable. Certain of these cases are mentioned in the discussion below. Basedon currently available information, the Company believes that its reserves for these lawsuits are reasonable and that theamounts reserved did not have a material impact on the Company’s financial condition or results of operations. However, ifany one or more of these cases results in a judgment against or settlement by the Company for an amount that is significantlygreater than the amount so reserved, the resulting liability could have a material impact on the Company’s financial condition,cash flows and results of operations.
There are currently three putative class action lawsuits challenging the Company’s use of certain automated databasevendors to assist in the adjustment of bodily injury claims.Plaintiffs allege that these databases systematically undervalue theclaims.The Company does not consider a loss from these cases to be probable and estimable,and is unable to estimate a rangeof loss, if any, at this time.
There are currently five putative class action lawsuits challenging the Company’s installment fee programs.The Companyhas successfully defended similar cases in the past and does not consider a loss to be probable and estimable, and is unable toestimate a range of loss, if any, at this time.
There are currently four putative class action lawsuits challenging the Company’s practice of specifying aftermarket (non-original equipment manufacturer) replacement parts in the repair of insured or claimant vehicles. Plaintiffs in these casesgenerally allege that aftermarket parts are inferior to replacement parts manufactured by the vehicle’s original manufacturerand that the use of such parts fails to restore the damaged vehicle to its “pre-loss” condition, as required by their insurancepolicies.The Company does not consider a loss from these cases to be probable and estimable, and is unable to estimate arange of loss, if any, at this time.
There are currently four putative class action lawsuits, and one individual bad faith case, pending against the Company inFlorida, challenging the legality of the Company’s payment of preferred provider rates on personal injury protection (PIP)claims.The primary issue is whether the Company violated Florida law by paying PIP medical expense claims at preferredprovider rates.The Company does not consider a loss to be probable and estimable, and is unable to estimate a range of loss,if any, at this time.
There are currently three putative class action lawsuits challenging the Company’s use of certain automated databasevendors to assist in the evaluation of total loss claims.Plaintiffs allege that these databases systematically undervalue total lossclaims to the detriment of insureds.The Company has been engaged in extensive settlement negotiations concerning thesecases over a prolonged period of time and has established a loss reserve for these cases.
There are currently six class action lawsuits challenging certain aspects of the Company’s use of credit information andnotice requirements under the federal Fair Credit Reporting Act. One of these cases is a state-specific class action that wascertified in December 2002.A loss reserve has been established for that case.The Company does not consider a loss from theother five cases to be probable and estimable, and is unable to estimate a range of loss, if any, at this time.
The Company is defending four putative class action lawsuits, in various Texas state courts, alleging that the Company isobligated to reimburse insureds for the inherent diminished value of their vehicles under their auto policies.Plaintiffs define

- APP.-B-22 -
- 12 - COMMITMENTS AND CONTINGENCIES
The Company has operating lease commitments and service agreements with terms greater than one year, some with op-tions to renew at the end of the contract periods.
The minimum commitments under noncancelable agreements at December 31, 2003, are as follows:
(millions)Operating Service
Year Leases Contracts Total2004 $ 77.4 $ 76.6 $ 154.02005 57.0 41.4 98.42006 42.3 1.4 43.72007 31.9 1.4 33.32008 19.7 1.4 21.1Thereafter 43.3 2.2 45.5
inherent diminished value as the difference between the market value of the insured automobile before an accident and themarket value after proper repair.The Supreme Court of Texas has recently ruled that diminished value recovery is not availableunder the Texas automobile policy.The Company believes that the ruling should result in the termination of the four pendingTexas cases,mentioned above. In February 2002, the Company reached an agreement to settle its Georgia diminution of valuecase for $19.8 million, plus administrative costs.The claims process was completed in early 2003.The Company believes thatGeorgia law on diminution of value is an anomaly and has successfully defended several of these cases in other jurisdictions.
The Company is currently defending one federal collective action lawsuit and five state class action lawsuits involvingworker classification issues.These lawsuits challenge the Company’s exempt employee classification under the federal FairLabor Standards Act and/or various state laws. In November 2002, the Company reached an agreement to settle its lawsuitrelating to the classification of the Company’s California claims employees as exempt workers for purposes of state wage andhour laws for $10 million.The claims process for the California case was completed in early 2003.That class action lawsuitwas based on California-specific law.The Company continues to believe that its classification of claim representatives asexempt workers is appropriate under federal and state laws. Accordingly, the Company does not consider a loss from theremaining cases to be probable and estimable, and is unable to estimate a range of loss, if any, at this time.
In July 2002, the Company settled a nationwide class action lawsuit challenging one of the Company’s claim adjustmentpractices,known as the charging of "betterment." Specifically, it was alleged that the Company made improper adjustmentsfor depreciation and physical condition in the adjustment of first party physical damage claims.This settlement has receivedtrial court approval and the claims process was completed in early 2003.
The Company is currently defending two groups of individual cases, one in Alabama and one in Mississippi, challengingthe subsidiaries’ alternative commissions programs. Under these programs, the Company’s independent insurance agentswere able to offer its insurance products at different commission levels. In July 2002, the Company reached a nationwidesettlement of a class action lawsuit challenging the alternative commission programs.The settlement resulted in the paymentof approximately $60 million, including the costs of settlement and attorneys’ fees.The claims process for that settlementwas completed in early 2003.The two groups of cases mentioned above are comprised of individuals that opted out of thenational class action settlement.The Company has established a loss reserve for these cases.
The Company is defending one putative class action lawsuit alleging that the Company’s rating practices at renewal areimproper.The Company does not consider a loss from this case to be probable and estimable,and is unable to establish a rangeof loss, if any, at this time.
There is currently one national putative class action lawsuit brought on behalf of medical providers disputing the legalityof the Company’s practice of paying first party medical benefits pursuant to a preferred provider agreement.The Companydoes not consider a loss to be probable and estimatable, and is unable to estimate a range of loss, if any, at this time.

- APP.-B-23 -
- 13 - FAIR VALUE OF FINANCIAL INSTRUMENTS
- 14 - RELATED PARTY TRANSACTIONS
The following table summarizes the Company’s repurchase of its Common Shares, $1.00 par value, from Peter B. Lewis, theCompany’s Chairman of the Board,or through an entity owned and controlled,directly or indirectly,by Mr.Lewis.The pricesper share equaled the then current market price of the Company’s stock as quoted on the New York Stock Exchange.Thesetransactions are part of the Company’s ongoing repurchase program to eliminate the effect of dilution created by equitycompensation awards.
Information about specific valuation techniques and related fair value detail is provided in Note 1 – Reporting and Accounting Policies, Note 2 – Investments and Note 4 – Debt.The cost and market value of the financial instruments as of Decem-ber 31are summarized as follows:
2003 2002Market Market
(millions) Cost Value Cost ValueInvestments:
Available-for-sale: fixed maturities $ 8,899.0 $9,133.4 $ 7,409.4 $7,712.5preferred stocks 751.3 778.8 631.9 656.7common equities 1,590.6 1,972.1 1,425.3 1,347.3
Short-term investments 648.0 648.0 567.8 567.8Debt (1,489.8) (1,592.0) (1,489.0) (1,588.9)
Total expense incurred by the Company was:
(millions)Operating Service
Year Leases Contracts Total2003 $ 101.6 $ 80.1 $ 181.72002 71.0 77.5 148.52001 69.9 49.9 119.8
During 2003, the Company incurred $12.2 million of guaranty fund assessments,compared to $21.2 million in 2002 and $14.6million in 2001.At December 31, 2003 and 2002, the Company had $10.1million and $17.9 million, respectively, reserved forfuture assessments on current insolvencies.The Company believes that any assessment in excess of its current reserves willnot materially affect the Company’s financial condition, cash flows or results of operations.
As of December 31, 2003, the Company had open investment funding commitments of $28.4 million.The Company hadno uncollateralized lines or letters of credit as of December 31, 2003 or 2002.
Number of Price perDate of Purchase Shares Share1
September 2003 200,000 $ 71.00January 2003 400,000 52.23March 2002 6,182 53.92October 2001 30,866 47.82
1Per share amounts were adjusted for the April 22, 2002, 3-for-1stock split.

- APP.-B-24 -
The consolidated financial statements and the related notes, together with the supplemental information, should be read inconjunction with the following discussion of the consolidated financial condition and results of operations.
OVERVIEW The Progressive Corporation is a holding company and does not have any revenue producing operations of itsown. Its insurance subsidiaries and affiliates (together with The Progressive Corporation, the “Company”) provide personalautomobile insurance and other specialty property-casualty insurance and related services throughout the United States.TheCompany’s Personal Lines segment writes insurance for private passenger automobiles and recreation vehicles through boththe independent agency channel and the direct channel.The Company ranks third in the U.S.private passenger auto insurancemarket, based on net premiums written, with an estimated 7% market share. Although there are over 300 insurancecompanies/groups with annual premiums greater than $5 million competing in this $150 billion market, the top 10 insurancegroups account for approximately 60% of the premiums written.The Company expects that the market will continue toconsolidate with the top 15 or 20 companies growing at the expense of the smaller ones, which may not have sufficientresources to invest in the technologies and systems necessary to remain cost competitive.The Company is the number onewriter of private passenger auto insurance through independent agencies and the number three writer in the direct channel,based on net premiums written in the United States.The Company also competes in the U. S. commercial auto insurancemarket where it is the third largest carrier with about 5% market share.The Company’s Commercial Auto segment writesinsurance for automobiles and trucks owned by small businesses primarily through the independent agency channel.
The holding company receives cash through borrowings, equity sales, subsidiary dividends and other transactions, andmay use the proceeds to contribute to the capital of its insurance subsidiaries in order to support premium growth, torepurchase its Common Shares, to pay interest on or to retire its outstanding indebtedness, to pay dividends and for otherbusiness purposes. In addition, the Company has $1.4 billion of readily marketable securities in a non-insurance subsidiarythat can be used to satisfy the holding company’s obligations.The Company did not issue any debt or equity securities during2003, but repaid $200 million of notes in January 2004. On a consolidated basis, the Company generated positive cash flowsof $2.4 billion in 2003, portions of which were used during the year to repurchase 5.0 million Common Shares (average costof $64.00 per share) and to construct two call centers and an office building, as well as lease additional space to support ourgrowing operations.The Company leased 12 additional Claims Service Center sites during the year.These sites, which aredesigned to provide end-to-end resolution for auto physical damage losses, are expected to improve efficiency, increaseaccuracy,reduce rework, improve repair cycle time and provide greater brand distinction.The Company continues to evaluatethe operating performance and cost parameters of these sites to validate their effectiveness.
The Company’s goal is to grow as fast as possible, constrained only by its objective to produce an aggregate calendar year4% underwriting profit and its ability to provide high quality customer service.The Company had a successful 2003 with a26% increase in net premiums written, an underwriting profit of 12.7% and net income of $1.26 billion. The Companycontinued to reap the benefits of the profitable growth phase of this insurance cycle and further benefited from the lowestlevel of automobile accident frequency experienced by the industry in recent history. Rate adequacy, improved customerretention and new business growth contributed to 2003’s growth.Policies in force grew 19%.The Company performed over200 rate and program revisions, which were designed to maintain rate adequacy and reflect the most accurate estimate ofprospective loss costs based on available information.The Company’s commitment to constrain growth if it is unable tomaintain service quality was demonstrated during 2003,when the Company imposed constraints on growth in Texas.Duringthe constraint period, the Company increased the number of employees in the Texas claims organization by approximately16%,relocated claims managers to Texas, reduced turnover and responded to a sizeable weather-related catastrophe,allowingthe Company to relax the constraints by mid-year.Although the Company expects the year-over-year percentage growth todecline in 2004, it believes it is still in a position to grow at a rate which is well in excess of the industry growth rate. Futuregrowth will be constrained by the Company’s most current assessment of claims handling quality.The Company does not
THE PROGRESSIVE CORPORATION AND SUBSIDIARIES
MANAGEMENT’S DISCUSSION AND ANALYSIS OF FINANCIAL CONDITION AND RESULTS OF OPERATIONS

- APP.-B-25 -
expect claims to hinder growth in 2004 since the Company is comfortable with its claims handling quality, as indicated bythe Company’s internal audit of claims files, and increased staff during 2003 to enhance capacity.
In 2003, the Company achieved underwriting profitability in all of the Personal Lines markets where it writes business,with only five states not meeting or exceeding its 4% underwriting profit objective (these states represented 8% of thePersonal Lines premiums written). In Commercial Auto, five states,out of the 42 markets in which we conduct business,wereunprofitable (these states represented less than 6% of the Commercial Auto premiums written).The Company will remainfocused on maintaining rate stability and allow anticipated increases in trend to bring the Company’s underwriting marginscloser to its 4% underwriting profit objective over time.
The Company realized a modest increase in customer retention year-over-year. The Company continues to focus onretention, but expects external factors, such as the softening of the market, to play a role. Given its strong underwritingmargins, the Company is in a position to focus on retaining customers and to introduce new product improvements faster.
Loss reserves developed favorably during 2003, with 1.5% favorable prior period development.This level of reservingaccuracy allows the Company to have solid pricing data, which helps ensure rate adequacy.The majority of the favorablereserve runoff was driven by the assigned risk development (discussed further in the “Loss and Loss Adjustment ExpenseReserves” subsection).The Company’s loss ratio also benefited from continued favorable accident frequency.Frequency rateshave declined over the past four quarters for all coverages,compared to the same quarter of the prior year,with the exceptionof personal injury protection, although the magnitude and sequential direction have varied by coverage.These trends aresimilar to industry trends.The Company cannot predict if these recent trends will continue and, therefore,will consider pasttrend in its rate evaluation to ensure rates remain adequate.
The investment environment in 2003 was more favorable than in 2002.The economy improved, resulting in strongervaluations for stocks, modestly higher U.S.Treasury yields and generally lower risk premiums for non-U.S.Treasury bonds.The Company maintained its asset allocation discipline of investing approximately 15% of the total portfolio in commonequities and 85% in fixed-income securities.Both asset classes produced positive total returns,with stocks rebounding sharply.In the fixed-income portfolio, the Company kept its exposure to interest rate risk low and credit quality high. During theyear, the fixed-income portfolio duration ranged from just under 3 years to 3.3 years at the end of 2003, and the weightedaverage credit rating ranged from AA to AA+. Substantial cash flows from operations and positive investment returnscontributed to strong portfolio growth.With the interest rates low in all fixed-income sectors, the Company plans to maintainits strategy to hold short-duration,high-quality securities.The Company continues to believe that the underwriting businessremains the most attractive place to invest its capital.
FINANCIAL CONDITION HOLDING COMPANY During 2003, the Company repurchased 4,950,362 of its Common Shares.Thetotal cost to repurchase these shares was $316.8 million,with an average cost of $64.00 per share.During the three-year periodended December 31,2003, the Company repurchased 9,490,694 of its Common Shares at a total cost of $651.4 million (averagecost of $56.02, on a split-adjusted basis).The Company did not split its treasury shares when it effected a 3-for-1stock split inApril 2002.See the Incentive Compensation Plans,a supplemental disclosure provided in this Annual Report, for further discussionon the Company’s policy regarding share repurchases.
During the three-year period ended December 31,2003,The Progressive Corporation received $596.4 million of dividendsfrom its subsidiaries,net of cash capital contributions made to subsidiaries.The regulatory restrictions on subsidiary dividendsare described in Note 7 – Statutory Information, to the financial statements.
CAPITAL RESOURCES AND LIQUIDITY The Company has substantial capital resources and is unaware of any trends, events orcircumstances not disclosed herein that are reasonably likely to affect its capital resources in a material way.The Companyhas the ability to issue $250 million of additional debt securities under a shelf registration statement filed with the Securitiesand Exchange Commission (SEC) in October 2002 (see discussion below). In addition, the Company is seeking to arrangean emergency liquidity facility by securing an uncommitted line of credit through one or more banks in the amount ofapproximately $100 million.This credit line is part of a contingency plan to help the Company maintain liquidity in the unlikelyevent that it will experience simultaneous situations that would affect the Company’s ability to transfer or receive funds.
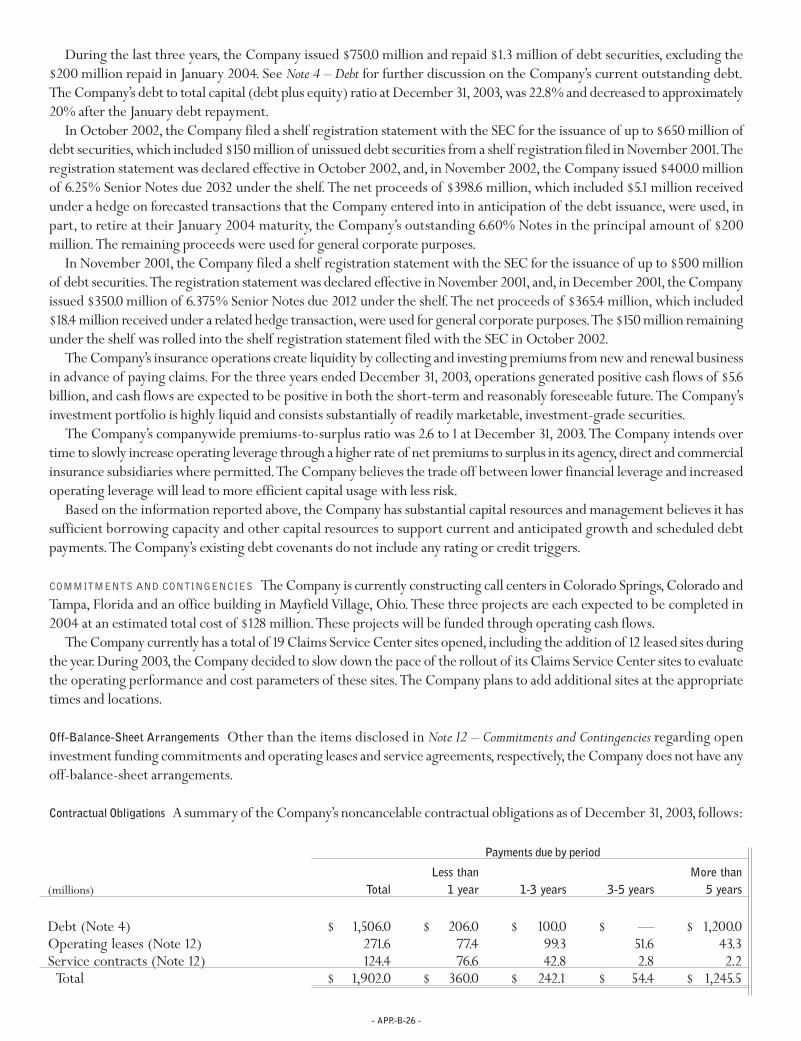
- APP.-B-26 -
During the last three years, the Company issued $750.0 million and repaid $1.3 million of debt securities, excluding the$200 million repaid in January 2004. See Note 4 – Debt for further discussion on the Company’s current outstanding debt.The Company’s debt to total capital (debt plus equity) ratio at December 31,2003,was 22.8% and decreased to approximately20% after the January debt repayment.
In October 2002, the Company filed a shelf registration statement with the SEC for the issuance of up to $650 million ofdebt securities,which included $150 million of unissued debt securities from a shelf registration filed in November 2001.Theregistration statement was declared effective in October 2002, and, in November 2002, the Company issued $400.0 millionof 6.25% Senior Notes due 2032 under the shelf.The net proceeds of $398.6 million, which included $5.1 million receivedunder a hedge on forecasted transactions that the Company entered into in anticipation of the debt issuance, were used, inpart, to retire at their January 2004 maturity, the Company’s outstanding 6.60% Notes in the principal amount of $200million.The remaining proceeds were used for general corporate purposes.
In November 2001, the Company filed a shelf registration statement with the SEC for the issuance of up to $500 millionof debt securities.The registration statement was declared effective in November 2001,and, in December 2001, the Companyissued $350.0 million of 6.375% Senior Notes due 2012 under the shelf.The net proceeds of $365.4 million, which included$18.4 million received under a related hedge transaction,were used for general corporate purposes.The $150 million remainingunder the shelf was rolled into the shelf registration statement filed with the SEC in October 2002.
The Company’s insurance operations create liquidity by collecting and investing premiums from new and renewal businessin advance of paying claims. For the three years ended December 31, 2003, operations generated positive cash flows of $5.6billion, and cash flows are expected to be positive in both the short-term and reasonably foreseeable future.The Company’sinvestment portfolio is highly liquid and consists substantially of readily marketable, investment-grade securities.
The Company’s companywide premiums-to-surplus ratio was 2.6 to 1 at December 31, 2003.The Company intends overtime to slowly increase operating leverage through a higher rate of net premiums to surplus in its agency,direct and commercialinsurance subsidiaries where permitted.The Company believes the trade off between lower financial leverage and increasedoperating leverage will lead to more efficient capital usage with less risk.
Based on the information reported above, the Company has substantial capital resources and management believes it hassufficient borrowing capacity and other capital resources to support current and anticipated growth and scheduled debtpayments.The Company’s existing debt covenants do not include any rating or credit triggers.
COMMITMENTS AND CONTINGENCIES The Company is currently constructing call centers in Colorado Springs,Colorado andTampa, Florida and an office building in Mayfield Village, Ohio.These three projects are each expected to be completed in2004 at an estimated total cost of $128 million.These projects will be funded through operating cash flows.
The Company currently has a total of 19 Claims Service Center sites opened, including the addition of 12 leased sites duringthe year.During 2003,the Company decided to slow down the pace of the rollout of its Claims Service Center sites to evaluatethe operating performance and cost parameters of these sites.The Company plans to add additional sites at the appropriatetimes and locations.
Off-Balance-Sheet Arrangements Other than the items disclosed in Note 12 – Commitments and Contingencies regarding openinvestment funding commitments and operating leases and service agreements, respectively, the Company does not have anyoff-balance-sheet arrangements.
Contractual Obligations A summary of the Company’s noncancelable contractual obligations as of December 31,2003, follows:
Payments due by period
Less than More than(millions) Total 1 year 1-3 years 3-5 years 5 years
Debt (Note 4) $ 1,506.0 $ 206.0 $ 100.0 $ — $ 1,200.0Operating leases (Note 12) 271.6 77.4 99.3 51.6 43.3Service contracts (Note 12) 124.4 76.6 42.8 2.8 2.2
Total $ 1,902.0 $ 360.0 $ 242.1 $ 54.4 $ 1,245.5

- APP.-B-27 -
RESULTS OF OPERATIONS UNDERWRITING OPERATIONS Growth The Company’s premiums written,on both a direct and netbasis, increased 26% in 2003,as compared to last year.Direct premiums written were $12.2 billion in 2003,$9.7 billion in 2002and $7.4 billion in 2001. For 2003, 2002 and 2001, net premiums written were $11.9 billion, $9.5 billion and $7.3 billion,respectively.The primary difference between direct and net premiums written is attributable to premiums written understate-mandated involuntary Commercial Auto Insurance Procedures (CAIP), for which the Company retains no loss indemnityrisk, and premiums ceded to state-provided reinsurance facilities.
Net premiums earned, which are a function of the premiums written in the current and prior periods, were recognizedinto income over the policy term using a mid-month convention. Insurance premiums written in 2004 and forward are beingearned using a daily earnings convention.This change to a daily earnings method will improve the precision of the Company’spremium recognition on a monthly basis. For 2003, 2002 and 2001, premiums earned increased 28%, 24% and 13%,respectively.
Rate adequacy, improved customer retention and new business growth drove the increase in premium growth. On acompanywide basis, policies in force increased 19% during 2003 and 16% compounded annually over the three-year periodended December 31, 2003. During 2003, the Company implemented 87 auto rate revisions in various states, with aggregatefiled rate changes of approximately a 4% net increase.Despite the strong underwriting margins the Company earned in 2003(discussed below), the Company does not plan to reduce rates as a primary strategy in 2004,although selective rate reductionsmay occur in some markets.
Another important element affecting growth is customer retention.One measure of improvement in customer retentionis policy life expectancy,which is an estimate of the average length of time that a policy will remain in force before cancellationor non-renewal.The Company experienced a modest increase in retention in its Personal Lines segment, in both the Agencychannel and the Direct channel, during the first half of 2003. During the second half of the year, retention declined slightly,leaving retentions levels at year end slightly below those of the prior year.Beginning late in 2003 and into 2004, the Companyis seeing retention flattening.Multiple factors affect retention, such as market conditions,competitors achieving rate adequacyand the Company’s mix of business, as well as improvements in processes and customer service.The Company’s primaryapproach to increasing retention is to drive down the cost of auto insurance to consumers and to improve consumers’experience with the Company.
Profitability For the years ended December 31, 2003, 2002 and 2001, the Company generated net income of $1,255.4 million($5.69 per share), $667.3 million ($2.99 per share) and $411.4 million ($1.83 per share), respectively. The 88% increase in netincome for 2003 was generated by several factors. During 2003, the Company’s underwriting margin improved 5.1points to12.7%, compared to 7.6% in 2002 and 4.8% in 2001. For 2003, 2002 and 2001, investment income, on a pretax basis net ofinvestment and interest expenses, was $358.3 million, $369.1 million and $348.7 million, respectively, excluding net realizedgains (losses) on securities of $12.7 million, $(78.6) million and $(111.9) million. In addition, during 2003, the Companyrecognized $31.2 million of interest income earned on an expected tax refund of approximately $58 million. This incometax refund reflects the fact that the Joint Committee of Taxation of Congress had completed its review of a Federal incometax settlement agreed to by the Internal Revenue Service (IRS) and the Company, primarily attributable to the amount ofloss reserves deductible for tax purposes. In February 2004, the Company received $88.5 million, representing the refundand interest from the IRS.

- APP.-B-28 -
Underwriting results for the Company’s Personal Lines business, including its channel components, the Commercial AutoBusiness and other businesses were as follows (detailed discussions below):
(millions) 2003 2002 2001
NET PREMIUMS WRITTEN
Personal Lines–Agency $ 7,239.6 $ 5,832.7 $ 4,614.7Personal Lines–Direct 3,263.2 2,529.8 1,861.7
Total Personal Lines 10,502.8 8,362.5 6,476.4Commercial Auto Business 1,357.7 1,002.9 665.7Other businesses 52.9 86.6 118.0
Companywide $ 11,913.4 $ 9,452.0 $ 7,260.1
NET PREMIUMS EARNED
Personal Lines–Agency $ 6,948.0 $ 5,542.7 $ 4,706.8Personal Lines–Direct 3,103.0 2,365.1 1,787.0
Total Personal Lines 10,051.0 7,907.8 6,493.8Commercial Auto Business 1,226.7 880.0 552.3Other businesses 63.3 95.7 115.7
Companywide $ 11,341.0 $ 8,883.5 $ 7,161.8
PERSONAL LINES–AGENCY CR
Loss & loss adjustment expense ratio 68.4 72.0 74.8Underwriting expense ratio 19.6 21.0 19.9
88.0 93.0 94.7
PERSONAL LINES–DIRECT CR
Loss & loss adjustment expense ratio 67.4 69.1 71.8Underwriting expense ratio 20.3 22.3 25.9
87.7 91.4 97.7
PERSONAL LINES–TOTAL CR
Loss & loss adjustment expense ratio 68.1 71.1 74.0Underwriting expense ratio 19.8 21.4 21.5
87.9 92.5 95.5
COMMERCIAL AUTO BUSINESS –CR
Loss & loss adjustment expense ratio 62.7 70.7 70.6Underwriting expense ratio 19.8 20.2 21.1
82.5 90.9 91.7
OTHER BUSINESSES–CR
Loss & loss adjustment expense ratio 48.2 56.7 60.6Underwriting expense ratio 38.8 36.1 32.4
87.0 92.8 93.0
COMPANYWIDE GAAP CR
Loss & loss adjustment expense ratio 67.4 70.9 73.5Underwriting expense ratio 19.9 21.5 21.7
87.3 92.4 95.2
COMPANYWIDE ACCIDENT YEAR
Loss & loss adjustment expense ratio 67.9 70.9 74.9
POLICIES IN FORCE (AT DECEMBER 31)
(thousands)
Agency – Auto 3,966 3,386 2,779Direct – Auto 1,852 1,541 1,209Other Personal Lines1 1,990 1,642 1,383
Total Personal Lines 7,808 6,569 5,371Commercial Auto Business 365 289 209
1Includes insurance for motorcycles, recreation vehicles, mobile homes, watercraft, snowmobiles, homeowners and similar items.
CR = Combined Ratio

- APP.-B-29 -
Loss and Loss Adjustment Expense Reserves Claims costs, the Company’s most significant expense, represent payments madeand estimated future payments to be made to or on behalf of its policyholders for incurred losses, including adjusting expensesneeded to settle claims.These costs include a loss estimate for future involuntary market assignments, based on currentbusiness,under state-mandated automobile insurance programs.Claims costs are defined by loss severity and frequency,andinfluenced by the rate of inflation.Anticipated changes in these factors are taken into account when the Company establishespremium rates and loss reserves.
The Company has seen a decline in frequency rates throughout 2003, similar to what has been experienced by the rest ofthe industry.The Company’s experience may differ from that of the industry due to changes in its mix of business.For example,during 2003, the Company had a shift in the policies in force in its Direct business from nonstandard auto and mid-marketto standard and preferred. As a result, the Company analyzes trends to distinguish changes in its experience from externalfactors versus shifts in the mix of its business.
The Company’s pure premium (i.e. frequency times severity) trend was notably lower than the industry’s, driven by theCompany’s paid severity. Bodily injury severity is highly variable, but changes in severity over the last several quarters werebetter than the Company had expected.The Company continues to monitor physical damage trend in evaluating its claimshandling performance and capacity. The Company is comfortable with its claims handling quality, as indicated by theCompany’s internal audit of claims files, and has increased its claims staff to enhance capacity.During the year, the Companyhired and trained 3,300 new claims resolution representatives.The Company plans to be diligent in its efforts to recognizechanges in trend and costs when setting rates and establishing loss reserves.
During 2003, the Company experienced $56.1million of favorable loss reserve development, compared to $3.5 million ofunfavorable development in 2002 and $99.0 million of favorable development in 2001.The favorable prior year developmentrecognized in 2003 was primarily attributable to the Company’s assigned risk reserves.The favorable assigned risk developmentreflects a change in the Company’s estimate of its future operating losses due to business assigned from the New YorkAutomobile Insurance Plan for 2003. Starting in the second half of 2002, the Company began participating in the expandedtake-out program as designed by the governing committee of the plan and has managed its writings to maximize the assignedrisk credits.The realization of these changes, combined with a lower than expected overall plan size, has resulted in a muchlower than expected number of future assignments to the Company from the plan.The Company will continue to study theenvironment in New York.
The remaining development for 2003,along with 2002 and 2001,was primarily attributable to the settlement of claims atamounts that differed from the established reserves.The Company continues to increase the analysis intensity of its lossreserves to improve accuracy and further enhance the Company’s understanding of its loss costs.The Company conductsextensive reviews on a monthly basis on portions of its business to help ensure that the Company is meeting its objective ofalways having reserves that are adequate, with minimal variation. Results would differ if different assumptions were made.See the Critical Accounting Policies section of Management’s Discussion and Analysis for a discussion of the effect of changing estimates.A detailed discussion of the Company’s loss reserving practices can be found in its Report on Loss Reserving Practices, which wasreleased via Form 8-K in June 2003.
Because the Company is primarily an insurer of motor vehicles, it has limited exposure as an insurer of environmental,asbestos and general liability claims.The Company has established reserves for these exposures in amounts that it believes tobe adequate based on information currently known. These exposures are not expected to have a material effect on theCompany’s liquidity, financial condition, cash flows or results of operations.
Underwriting Expenses Policy acquisition costs and other underwriting expenses as a percentage of premiums earned were19.9% in 2003, 21.5% in 2002 and 21.7% in 2001. Policy acquisition costs are amortized over the policy period in which therelated premiums are earned (see Note 1– Reporting and Accounting Policies).The increase in “other underwriting expenses,” asshown in the 2003 income statement, primarily reflects increases in salaries and other infrastructure costs driven by thegrowth in the business; 2002 results also included the cost of settling certain class action lawsuits (see Note 11– Litigation).
During 2003, the Company incurred $12.2 million of guaranty fund assessments,compared to $21.2 million in 2002 and $14.6million in 2001.The 2003 expense was spread across numerous states and was not attributable to any one particular insolvency,while the 2002 expense was primarily related to the Reliance Insurance Company and Aries Insurance Company insolvencies,and the 2001expense primarily related to Reliance.The Company believes that any assessment for known insolvencies in excessof its current reserves will not materially affect the Company’s financial condition, cash flows or results of operations.
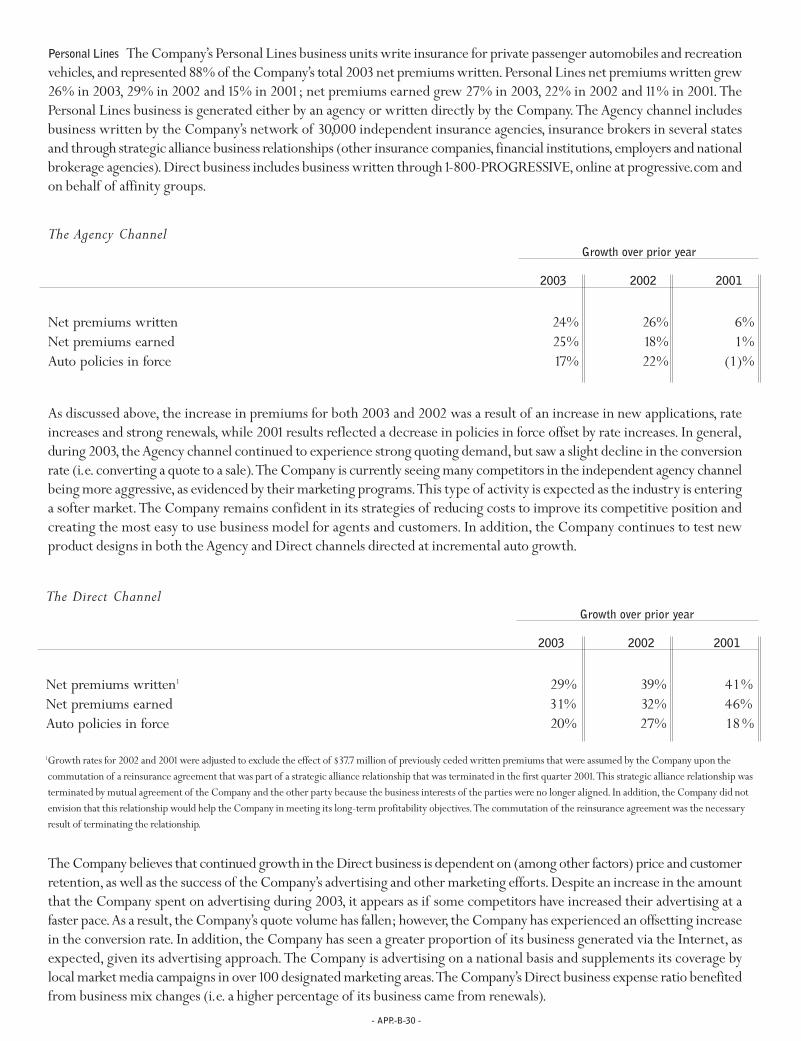
- APP.-B-30 -
Personal Lines The Company’s Personal Lines business units write insurance for private passenger automobiles and recreationvehicles, and represented 88% of the Company’s total 2003 net premiums written.Personal Lines net premiums written grew26% in 2003, 29% in 2002 and 15% in 2001; net premiums earned grew 27% in 2003, 22% in 2002 and 11% in 2001.ThePersonal Lines business is generated either by an agency or written directly by the Company.The Agency channel includesbusiness written by the Company’s network of 30,000 independent insurance agencies, insurance brokers in several statesand through strategic alliance business relationships (other insurance companies, financial institutions,employers and nationalbrokerage agencies).Direct business includes business written through 1-800-PROGRESSIVE,online at progressive.com andon behalf of affinity groups.
As discussed above, the increase in premiums for both 2003 and 2002 was a result of an increase in new applications, rateincreases and strong renewals, while 2001 results reflected a decrease in policies in force offset by rate increases. In general,during 2003, the Agency channel continued to experience strong quoting demand,but saw a slight decline in the conversionrate (i.e.converting a quote to a sale).The Company is currently seeing many competitors in the independent agency channelbeing more aggressive, as evidenced by their marketing programs.This type of activity is expected as the industry is enteringa softer market.The Company remains confident in its strategies of reducing costs to improve its competitive position andcreating the most easy to use business model for agents and customers. In addition, the Company continues to test newproduct designs in both the Agency and Direct channels directed at incremental auto growth.
The Company believes that continued growth in the Direct business is dependent on (among other factors) price and customerretention,as well as the success of the Company’s advertising and other marketing efforts.Despite an increase in the amountthat the Company spent on advertising during 2003, it appears as if some competitors have increased their advertising at afaster pace.As a result, the Company’s quote volume has fallen; however, the Company has experienced an offsetting increasein the conversion rate. In addition, the Company has seen a greater proportion of its business generated via the Internet, asexpected, given its advertising approach.The Company is advertising on a national basis and supplements its coverage bylocal market media campaigns in over 100 designated marketing areas.The Company’s Direct business expense ratio benefitedfrom business mix changes (i.e. a higher percentage of its business came from renewals).
The Agency ChannelGrowth over prior year
2003 2002 2001
Net premiums written 24% 26% 6%Net premiums earned 25% 18% 1%Auto policies in force 17% 22% (1)%
The Direct ChannelGrowth over prior year
2003 2002 2001
Net premiums written1 29% 39% 41%Net premiums earned 31% 32% 46%Auto policies in force 20% 27% 18%
1Growth rates for 2002 and 2001were adjusted to exclude the effect of $37.7 million of previously ceded written premiums that were assumed by the Company upon thecommutation of a reinsurance agreement that was part of a strategic alliance relationship that was terminated in the first quarter 2001.This strategic alliance relationship wasterminated by mutual agreement of the Company and the other party because the business interests of the parties were no longer aligned. In addition, the Company did notenvision that this relationship would help the Company in meeting its long-term profitability objectives.The commutation of the reinsurance agreement was the necessaryresult of terminating the relationship.

- APP.-B-31 -
The Company’s Commercial Auto Business unit writes primary liability, physical damage and other auto-related insurancefor automobiles and trucks owned by small businesses. In 2003, the Commercial Auto Business represented 11% of theCompany’s total net premiums written. Although the Commercial Auto Business differs from Personal Lines auto, bothbusinesses require the same fundamental skills, including disciplined underwriting and pricing, as well as excellent claimsservice.The Company’s Commercial Auto Business is primarily distributed through the independent agency channel.TheCompany’s Commercial Auto Business ranked fourth in market share on a national basis based on data reported by A.M.BestCompany Inc. in 2002 and estimates that it moved into the third position for 2003.
The Company is still benefiting from actions taken in 2002,when competitors raised rates and restricted the business theywrote. Commercial Auto also benefited from favorable loss frequency trends during 2003.The Company continues to focuson writing insurance for small business autos and trucks,with the majority of its customers insuring three or fewer vehicles.Approximately 52% of the Company’s 2003 Commercial Auto net premiums written were generated in the light and localcommercial auto markets, which includes autos, vans and pick-up trucks used by contractors, such as artisans, landscapers,plumbers,etc., and a variety of other small businesses.The remainder of the business was written in the specialty commercialauto market,which includes dump trucks, logging trucks and other short-haul commercial vehicles.There are many similaritiesbetween the Company’s commercial and personal auto business; however, since the commercial auto policies have higherlimits (up to $1million) than personal auto, the Company monitors this segment closely.
Other Businesses The Company’s other businesses,which represented less than 1% of the 2003 net premiums written,principallyinclude writing directors' and officers' liability insurance and providing insurance-related services,primarily processing CAIPbusiness.The other businesses are also managing the wind-down of the Company’s lender’s collateral protection program,which the Company decided to cease writing as of September 30, 2003. During 2002, the Company lost some key accountsfor the lender’s collateral protection products and determined that this business was unable to meet its profitability target.Management believes that exiting this line of business will not materially affect the Company’s financial condition, results ofoperations or cash flows.The remaining ongoing indemnity products in the Company’s other businesses are continuing togrow profitably.
The Company processes business for the CAIP plans, which are state-supervised plans serving the involuntary market, in25 states.The Company processes over 49% of the premiums in the CAIP market and competes with two other providersnationwide.As a service provider, the Company collects fee revenue that is earned on a pro rata basis over the term of therelated policies.The Company cedes 100% of the losses to the CAIP plan. To the extent the Company fails to comply withcontractual service standards, the Company would be restricted from ceding business to the CAIP plan.The Company hasmaintained,and plans to continue to maintain,compliance with these standards.Any changes in the Company’s participationas a CAIP service provider would not materially affect the Company’s financial condition, results of operations or cash flows.
Litigation The Company is named as a defendant in a number of putative class action lawsuits, such as those alleging damagesas a result of the Company’s use of after-market parts, total loss evaluation methodology, use of credit in underwriting,installment fee programs, using preferred provider rates for payment of personal injury protection claims or for paying firstparty medical benefits,worker classification issues,use of third-party vendors to analyze the propriety of payment of medicalbills,offering alternative commission programs,rating practices at renewal or the alleged diminution of value to vehicles whichare involved in accidents, and cases challenging other aspects of the Company’s claims and marketing practices and businessoperations.Other insurance companies face many of these same issues.During 2002,the Company settled several long-standingclass action lawsuits relating to diminution of value, handling of betterment in claim settlements, use of alternative agentcommissions programs and a California-specific labor classification claim.See Note 11– Litigation for a more detailed discussion.
Commercial AutoGrowth over prior year
2003 2002 2001
Net premiums written 35% 51% 51%Net premiums earned 39% 59% 44%Auto policies in force 26% 38% 23%

- APP.-B-32 -
INVESTMENTS Portfolio Allocation The Company manages its portfolio to an 85% fixed income and 15% common equitytarget allocation.The Company’s investment strategy recognizes its need to maintain capital adequate to support its insuranceoperations.The Company evaluates the risk/reward tradeoffs of investment opportunities,measuring their effects on stability,diversity,overall quality and liquidity of the investment portfolio. Investments in the Company’s portfolio have varying degreesof risk.The composition of the investment portfolio at year-end was:
Fixed-Income Securities The fixed-maturity and short-term securities, as reported on the balance sheets, were comprisedof the following:
(millions) December 31, 2003 December 31, 2002
Investment-Grade Fixed Maturities:Short/Intermediate Term $ 9,446.0 96.6% $ 7,932.0 95.8%Long Term1 70.3 .7 168.3 2.0Non-Investment-Grade2 265.1 2.7 180.0 2.2
Total $ 9,781.4 100.0% $ 8,280.3 100.0%
1Includes securities with maturities of 10 years or greater.Asset-backed securities are reported at their weighted average maturity based upon their projected cash flows.Allother securities that do not have a single maturity date are reported at average maturity. See Note 2 – Investments.
2Non-investment-grade fixed-maturity securities offer the Company higher returns and added diversification but may involve greater risks, often related tocreditworthiness, solvency and relative liquidity of the secondary trading market.
As of December 31, 2003, the Company’s portfolio had $643.4 million in net unrealized gains, compared to $249.9 million atyear-end 2002.The increase was the result of significant equity market returns during 2003.
Gross Gross % ofUnrealized Unrealized Market Total Duration
(millions) Cost Gains Losses Value Portfolio (years) Rating1
2003
Fixed maturities $ 8,899.0 $ 259.9 $ (25.5) $ 9,133.4 72.9% 3.5 AAPreferred stocks 751.3 34.9 (7.4) 778.8 6.2 2.8 A-Short-term investments2 648.0 — — 648.0 5.2 <1 AA+
Total fixed income 10,298.3 294.8 (32.9) 10,560.2 84.3 3.3 AACommon equities 1,590.6 390.3 (8.8) 1,972.1 15.7 NM NM
Total portfolio3 $ 11,888.9 $ 685.1 $ (41.7) $ 12,532.3 100.0% 3.3 AA
2002
Fixed maturities $ 7,409.4 $ 320.0 $ (16.9) $ 7,712.5 75.0% 3.4 AA+Preferred stocks 631.9 35.1 (10.3) 656.7 6.4 2.8 A-Short-term investments2 567.8 — — 567.8 5.5 <1 AAA-
Total fixed income 8,609.1 355.1 (27.2) 8,937.0 86.9 3.2 AACommon equities 1,425.3 55.3 (133.3) 1,347.3 13.1 NM NM
Total portfolio3 $ 10,034.4 $ 410.4 $ (160.5) $ 10,284.3 100.0% 3.2 AA
NM = not meaningful
1Weighted average quality ratings as assigned by nationally recognized securities rating organizations.
2Short-term investments include Eurodollar deposits, commercial paper and other securities maturing within one year.
3The Company had net unsettled security acquisitions of $75.1million and $112.2 million at December 31, 2003 and 2002, respectively. December 31, 2003 and 2002 totalsinclude $1.4 billion and $1.3 billion, respectively, of securities in the portfolio of a consolidated, non-insurance subsidiary of the holding company; composition is similarto the consolidated portfolio.

- APP.-B-33 -
The fixed-income portfolio includes fixed-maturity securities, preferred stocks, and short-term investments.A primaryexposure of the fixed-income portfolio is interest rate risk,which is managed by restricting the portfolio’s duration to between1.8 to 5 years.The distribution of maturities and convexity (i.e. a measure of the change in duration due to the change ininterest rates) are monitored on a regular basis. Interest rate risk includes the change in value resulting from movements inthe underlying market rates of debt securities held.The fixed-income portfolio had a duration of 3.3 years at December 31,2003, compared to 3.2 years at December 31, 2002. Excluding the unsettled securities transactions, the allocation to fixed-income securities at December 31, 2003, was 84.2% of the portfolio, within the Company’s normal range of variation; atDecember 31, 2002, the allocation was 86.8%.
Also included in fixed-income securities are $3,042.6 million of asset-backed securities.These asset-backed securities arecomprised of residential mortgage-backed ($775.7 million),commercial mortgage-backed ($1,175.2 million) and other asset-backed ($1,091.7 million) securities,with a total duration of 2.6 years and a weighted average credit quality of AA+.The largestcomponents of the other asset-backed securities are automobile receivable loans ($488.0 million) and home equity loans($364.4 million).Substantially all of the asset-backed securities are liquid with available market quotes and contain no residualinterest.
Another exposure related to the fixed-income portfolio is credit risk,which is managed by maintaining a minimum averageportfolio credit quality rating of A+,as defined by nationally recognized rating agencies, and limiting non-investment-gradesecurities to a maximum of 5% of the fixed-income portfolio. Concentration in a single issuer’s bonds and preferred stocksis limited to no more than 6% of the Company’s shareholders’ equity, except for U.S.Treasury and agency bonds; any state’sgeneral obligation bonds cannot exceed 12% of shareholders’ equity.
The quality distribution of the fixed-income portfolio was as follows:
Rating December 31, 2003 December 31, 2002
AAA 63.9% 65.7%AA 10.7 8.2A 13.1 12.6BBB 9.5 11.3Non Rated/Other 2.8 2.2
100.0% 100.0%
Common Equities Common equities, as reported in the balance sheets, were comprised of the following:
(millions) December 31, 2003 December 31, 2002
Common Stocks $ 1,929.7 97.9% $ 1,275.0 94.6%Other Risk Investments 42.4 2.1 72.3 5.4
Total Common Equities $ 1,972.1 100.0% $ 1,347.3 100.0%

- APP.-B-34 -
Market Value at Market Value at TotalDecember 31, 2003 December 31, 2002 Return1
Common Stocks2 $ 1,929.7*million $ 1,275.0*million 28.6%Russell 1000 Index3 $ 594.56 $ 466.18 29.9%
1Includes gross dividends reinvested and price appreciation/depreciation.
2The market value at December 31, 2003, includes appreciation/depreciation in the value of the underlying securities as well as dividend income received and net cashinfusions/withdrawals made during the year needed to maintain the Company’s 85%/15% fixed income to equity allocation.
3This broad-based index, which is used for comparative benchmarking, incepted December 31,1986, with a base valuation of $130. Market values exclude dividendsreinvested.
The Company’s common equity allocation is intended to enhance the return of and provide diversification for the totalportfolio.To maintain high correlation with the Russell 1000, the Company holds approximately 700 of the common stockscomprising the index. Individual holdings are measured based on their contribution to the correlation with the index. For2003, the equity-indexed portfolio returns were outside the anticipated annual tracking error.The variance was partially dueto rebalancing the portfolio in response to tax initiated strategies during the year.
Other risk investments include private equity investments and limited partnership interests in private equity and mezzanineinvestment funds which have no off-balance-sheet exposure or contingent obligations, except for the $28.4 million openfunding commitments discussed in Note 12 – Commitments and Contingencies.The Company is no longer initiating investmentsin these types of securities and expects to continue reducing its current holdings over time.
The Company monitors the value at risk of the fixed-income and equity portfolios, as well as the total portfolio, to evaluatethe potential maximum expected loss. For further information, see the Quantitative Market Risk Disclosures, a supplementalschedule provided in this Annual Report.
Trading Securities Trading securities are entered into for the purpose of near-term profit generation.At December 31,2003and 2002, the Company did not hold any trading securities. Net realized gains on trading securities for the year endedDecember 31,2003 was $.1million,compared to $0 in 2002 and net realized losses of $6.5 million in 2001.Trading securitiesare not material to the Company’s financial condition,cash flows or results of operations and are reported within the available-for-sale portfolio rather than separately disclosed.
Common equities, which generally have greater risk and volatility of market value than fixed-maturity securities, have atarget allocation of 15% and may range from 0 to 25% of the investment portfolio.At December 31,2003 and 2002,excludingthe net unsettled security transactions, these securities comprised 15.8% and 13.2%,respectively,of the total portfolio.Commonstocks are managed externally to the Russell 1000 index with an anticipated annual tracking error of +/- 50 basis points.The results of the common stock portfolio relative to the benchmark index are noted in the table below:

- APP.-B-35 -
Derivative Instruments From time to time, the Company invests in derivative instruments, which are primarily used to manage the risks and enhance the returns of the available-for-sale portfolio.This is accomplished by modifying the basis,duration, interest rate, credit or foreign currency characteristics of the portfolio, hedged securities or hedged cash flows.The Company had no risk management derivatives in 2003 and 2002, and recognized net losses of $2.7 million in 2001.During 2002 and 2001, the Company entered into hedges on forecasted transactions in anticipation of its debt issuances.See Note 2 – Investments and Note 4 – Debt for further discussion of these hedges. The Company had no open positions atDecember 31, 2003.
Derivative instruments may also be used for trading purposes or classified as trading derivatives due to the characteristicsof the transaction.At December 31, 2003, the Company had two derivatives classified as trading, which are not included inthe trading securities discussed above.The Company sold default protection on two credit issuers using credit default swapsand matched the notional value of these positions with Treasury securities with an equivalent principal value and maturityto replicate a cash bond position.These derivatives generated net realized gains of $4.9 million in 2003.See Note 2 – Investmentsfor further discussion.
The Company had no derivatives at December 31, 2002 and one credit default protection instrument used for tradingpurposes at December 31, 2001.These derivatives used for trading purposes generated net realized gains (losses) of $(.1)million in 2002 and $1.9 million in 2001,and were included in the available-for-sale portfolio.For all derivative positions,netcash requirements are limited to changes in market values that may vary based upon changes in interest rates and other factors.Exposure to credit risk is limited to the carrying value; collateral may be required to limit credit risk.
Investment Income Recurring investment income (interest and dividends) increased 2% in 2003,10% in 2002 and 7% in 2001.The Company is reporting total returns to reflect more accurately the management philosophy of the portfolio and evaluationof the investment results.The fully taxable equivalent (FTE) total return includes recurring investment income, net realizedgains (losses) on securities and changes in unrealized appreciation/depreciation on investment securities.The Companyreported the following investment results:
Realized Gains/Losses Gross realized gains of $134.9 million and $206.7 million in 2003 and 2002,respectively,were primarilythe result of the Company’s sales of fixed-maturity securities with favorable yield, sector or interest rate movements.The gross realized losses of $122.2 million and $285.3 million during 2003 and 2002, respectively, were primarily the resultof write-downs in securities determined to have an other-than-temporary decline in market value and rebalancing of thecommon stock portfolio to the Russell 1000 index during the year.During 2001,both the gross realized gains of $187.0 millionand the gross realized losses of $298.9 million, primarily related to the Company’s sales of common stocks, reflectingmanagement’s decision to index the entire equity portfolio to the Russell 1000 rather than the Russell 3000 index.
2003 2002 2001
Pretax recurring investment book yield 4.2% 5.1% 5.6%Weighted average FTE book yield 4.9% 5.6% 6.2%FTE total return:
Fixed-income securities 5.5% 10.1% 8.8%Common stocks 28.6% (21.5)% (9.2)%Total portfolio 8.7% 5.5% 5.9%

- APP.-B-36 -
Write-downs Write-downs
Total On Securities On Securities
(millions) Write-downs Subsequently Sold Held at Period End
2003
Fixed income $ 17.5 $ 2.3 $ 15.2Common equities 47.7 12.6 35.1
Total portfolio1 $ 65.2 $ 14.9 $ 50.3
2002
Fixed income $ 45.6 $ 19.7 $ 25.9Common equities 156.5 45.9 110.6
Total portfolio $ 202.1 $ 65.6 $ 136.5
2001
Fixed income $ 17.1 $ 4.2 $ 12.9Common equities 42.9 19.8 23.1
Total portfolio $ 60.0 $ 24.0 $ 36.0
1At December 31, 2003, the Company did not have any impairment on securities with similar market-related declines that have been in a loss position for only twoconsecutive quarters.
Other-than-Temporary Impairment Included in the net realized gains (losses) on securities for the years ended 2003, 2002and 2001,are write-downs on securities determined to have an other-than-temporary decline in market value.The Companycontinually monitors its portfolio for pricing changes which might indicate potential impairments and, on a quarterly basis,performs a detailed review of securities with unrealized losses based on predetermined criteria. In such cases, changes inmarket value are evaluated to determine the extent to which such changes are attributable to (i) fundamental factors specificto the issuer, such as financial conditions, business prospects or other factors or (ii) market-related factors, such as interestrate increases or equity market declines.
Fixed-income and equity securities with declines attributable to issuer-specific fundamentals are reviewed to identify allavailable evidence, circumstances and influences to estimate the potential for and timing of recovery of the investment’simpairment.An other-than-temporary impairment loss is deemed to have occurred when the potential for, and timing of,recovery does not satisfy the conditions set forth in the current accounting guidance (see Critical Accounting Policies,Other-than-Temporary Impairment for further discussion).
For fixed-income investments with unrealized losses due to market or industry-related declines where the Company hasthe intent and ability to hold the investment for the period of time necessary to recover a significant portion of the investment’soriginal principal and interest obligation,declines are not deemed to qualify as other than temporary.The Company's policyfor equity securities with market-related declines is to recognize impairment losses on individual securities with losses thatare not reasonably expected to be recovered under historical market conditions when the security has been in such lossposition for three consecutive quarters.
When a security in the Company’s investment portfolio has an unrealized loss in market value that is deemed to be otherthan temporary, the Company reduces the book value of such security to its current market value, recognizing the declineas a realized loss in the income statement.All other unrealized gains or losses are reflected in shareholders' equity.The write-down activity for the years ended December 31was as follows:
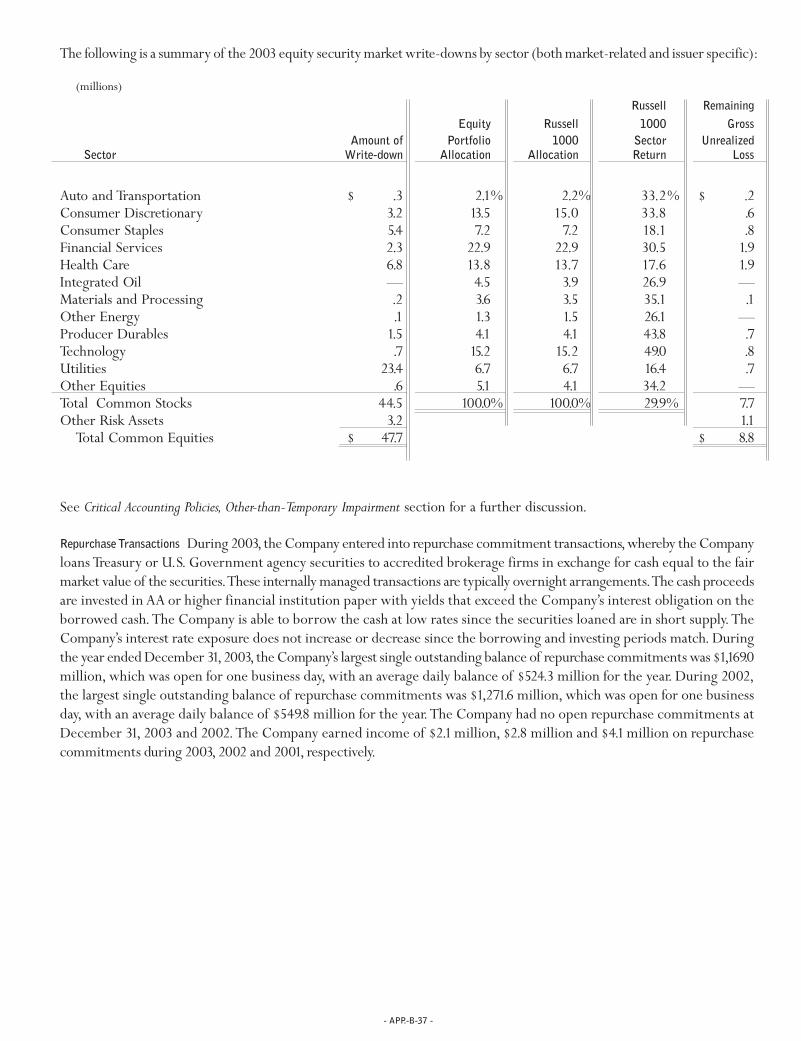
- APP.-B-37 -
The following is a summary of the 2003 equity security market write-downs by sector (both market-related and issuer specific):
(millions)
Russell RemainingEquity Russell 1000 Gross
Amount of Portfolio 1000 Sector UnrealizedSector Write-down Allocation Allocation Return Loss
Auto and Transportation $ .3 2.1% 2.2% 33.2% $ .2Consumer Discretionary 3.2 13.5 15.0 33.8 .6Consumer Staples 5.4 7.2 7.2 18.1 .8Financial Services 2.3 22.9 22.9 30.5 1.9Health Care 6.8 13.8 13.7 17.6 1.9Integrated Oil — 4.5 3.9 26.9 —Materials and Processing .2 3.6 3.5 35.1 .1Other Energy .1 1.3 1.5 26.1 —Producer Durables 1.5 4.1 4.1 43.8 .7Technology .7 15.2 15.2 49.0 .8Utilities 23.4 6.7 6.7 16.4 .7Other Equities .6 5.1 4.1 34.2 —Total Common Stocks 44.5 100.0% 100.0% 29.9% 7.7Other Risk Assets 3.2 1.1
Total Common Equities $ 47.7 $ 8.8
See Critical Accounting Policies, Other-than-Temporary Impairment section for a further discussion.
Repurchase Transactions During 2003, the Company entered into repurchase commitment transactions,whereby the Companyloans Treasury or U.S. Government agency securities to accredited brokerage firms in exchange for cash equal to the fairmarket value of the securities.These internally managed transactions are typically overnight arrangements.The cash proceedsare invested in AA or higher financial institution paper with yields that exceed the Company’s interest obligation on theborrowed cash.The Company is able to borrow the cash at low rates since the securities loaned are in short supply.TheCompany’s interest rate exposure does not increase or decrease since the borrowing and investing periods match. Duringthe year ended December 31,2003, the Company’s largest single outstanding balance of repurchase commitments was $1,169.0million, which was open for one business day, with an average daily balance of $524.3 million for the year. During 2002,the largest single outstanding balance of repurchase commitments was $1,271.6 million, which was open for one business day, with an average daily balance of $549.8 million for the year.The Company had no open repurchase commitments atDecember 31, 2003 and 2002.The Company earned income of $2.1 million, $2.8 million and $4.1 million on repurchasecommitments during 2003, 2002 and 2001, respectively.

- APP.-B-38 -
CRITICAL ACCOUNTING POLICIES The Company is required to make certain estimates and assumptions when preparing itsfinancial statements and accompanying notes in conformity with GAAP.Actual results could differ from those estimates ina variety of areas.The two areas that the Company views as most critical with respect to the application of estimates andassumptions are the establishment of its loss reserves and its method of determining impairments in its investment portfolio.
LOSS AND LAE RESERVES Loss and loss adjustment expense (LAE) reserves represent the Company’s best estimate of itsultimate liability for losses and LAE that occurred prior to the end of any given accounting period but have not yet been paid.At December 31, 2003, the Company had $4.6 billion of gross loss and LAE reserves, which represents management’s bestestimate of ultimate loss.As a result of the detailed product review processes the Company performs (discussed below), theCompany does not develop aggregate countrywide ranges for its loss reserves.The Company’s carried reserve balance assumesan increase in the loss and LAE severity for both personal auto liability and commercial auto liability, which represent over97% of the Company’s total reserves.These estimates are influenced by many variables that are difficult to quantify, such asmedical costs, jury awards, etc., which will influence the final amount of the claim settlement.That, coupled with changesto internal claims practices,changes in the legal environment and state regulatory requirements, requires significant judgmentin the reserve setting process.
The Company reviews its reserves at a combined state, product and line coverage level (the “products”) on an annual,semiannual or quarterly time frame,depending on size of the products or emerging issues relating to the products.By reviewingthe reserves at such a detailed level, the Company has the ability to identify and measure variances in trend by state, productand line coverage that would not otherwise be seen on a consolidated basis.The Company’s actuarial department completessix different estimates of needed reserves, three based on paid data and three based on incurred data, to determine if a reservechange is required. In the event of a wide variation between results generated by the different projections, the actuarial groupwill further analyze the data using additional techniques.
In analyzing the ultimate accident year loss experience, the Company’s actuarial staff reviews in detail the frequency(number of losses per earned car year), severity (dollars of loss per each claim),and the average premium (dollars of premiumper earned car year).The loss ratio, a primary measure of loss experience, is equal to the product of frequency times severitydivided by the average premium.The average premium for personal and commercial auto businesses are known and thereforeare not estimated.The projection of frequency for these lines of business is generally very stable because injured partiesgenerally report their claims within a reasonably short time period after the accident.The actual frequency experienced willvary depending on the change in mix by class of drivers written by the Company, but the accuracy of the projected level isgenerally reliable.The severity experienced by the Company,which is much more difficult to estimate, is affected by changesin underlying costs, such as medical costs, jury verdicts, etc. In addition, severity will change relative to the change in theCompany’s mix of business by limit.
During 2003, the Company experienced exceptional growth, which creates additional uncertainty in estimating theultimate loss costs. Contributing to this uncertainty are changes in the Company’s limit mix and mix of business by state orjurisdiction. To address this risk of uncertainty, the Company’s actuarial staff expanded their scope of reserve reviewssignificantly in 2002 and by approximately another 10% in 2003 to accommodate reviews for high and low policy limitswithin the reserving product level.Although this increased focus on needed reserves by policy limit was already part of theprocess for the personal auto business, even more attention is now given to studies regarding losses by policy limit for thecommercial auto business, as the average limit of this business is much higher than personal auto.
The Company’s goal is to ensure that total reserves are adequate to cover all loss costs while sustaining minimal variationfrom the time reserves are initially established until losses are fully developed.During 2003, the Company made no significantchange to the estimate of loss reserves recorded in prior years.The following table shows how the Company has performedagainst this goal over the last ten years.
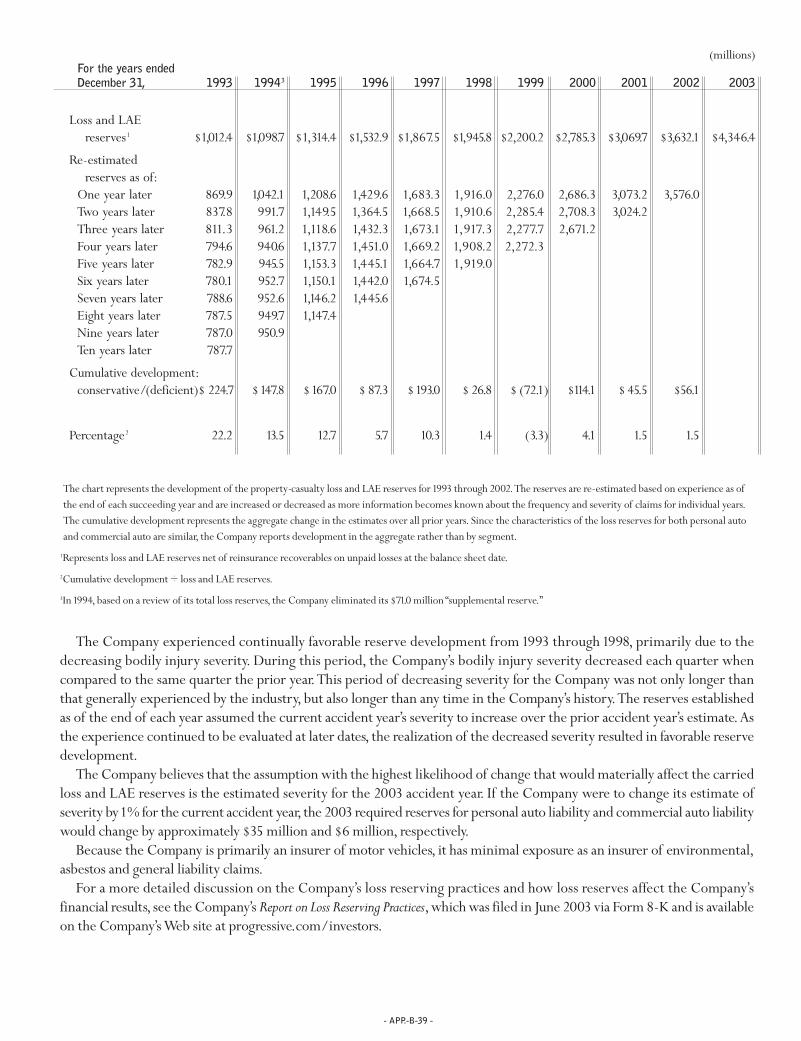
- APP.-B-39 -
For the years endedDecember 31, 1993 19943 1995 1996 1997 1998 1999 2000 2001 2002 2003
Loss and LAE reserves1 $1,012.4 $1,098.7 $1,314.4 $1,532.9 $1,867.5 $1,945.8 $2,200.2 $2,785.3 $3,069.7 $3,632.1 $4,346.4
Re-estimatedreserves as of:
One year later 869.9 1,042.1 1,208.6 1,429.6 1,683.3 1,916.0 2,276.0 2,686.3 3,073.2 3,576.0Two years later 837.8 991.7 1,149.5 1,364.5 1,668.5 1,910.6 2,285.4 2,708.3 3,024.2Three years later 811.3 961.2 1,118.6 1,432.3 1,673.1 1,917.3 2,277.7 2,671.2Four years later 794.6 940.6 1,137.7 1,451.0 1,669.2 1,908.2 2,272.3Five years later 782.9 945.5 1,153.3 1,445.1 1,664.7 1,919.0Six years later 780.1 952.7 1,150.1 1,442.0 1,674.5Seven years later 788.6 952.6 1,146.2 1,445.6Eight years later 787.5 949.7 1,147.4Nine years later 787.0 950.9Ten years later 787.7
Cumulative development:conservative/(deficient)$ 224.7 $147.8 $167.0 $ 87.3 $193.0 $ 26.8 $ (72.1) $114.1 $ 45.5 $56.1
Percentage2 22.2 13.5 12.7 5.7 10.3 1.4 (3.3) 4.1 1.5 1.5
The chart represents the development of the property-casualty loss and LAE reserves for 1993 through 2002.The reserves are re-estimated based on experience as ofthe end of each succeeding year and are increased or decreased as more information becomes known about the frequency and severity of claims for individual years.The cumulative development represents the aggregate change in the estimates over all prior years. Since the characteristics of the loss reserves for both personal autoand commercial auto are similar, the Company reports development in the aggregate rather than by segment.
1Represents loss and LAE reserves net of reinsurance recoverables on unpaid losses at the balance sheet date.
2Cumulative development ÷ loss and LAE reserves.
3In 1994, based on a review of its total loss reserves, the Company eliminated its $71.0 million “supplemental reserve.”
(millions)
The Company experienced continually favorable reserve development from 1993 through 1998, primarily due to thedecreasing bodily injury severity. During this period, the Company’s bodily injury severity decreased each quarter whencompared to the same quarter the prior year.This period of decreasing severity for the Company was not only longer thanthat generally experienced by the industry, but also longer than any time in the Company’s history.The reserves establishedas of the end of each year assumed the current accident year’s severity to increase over the prior accident year’s estimate.Asthe experience continued to be evaluated at later dates, the realization of the decreased severity resulted in favorable reservedevelopment.
The Company believes that the assumption with the highest likelihood of change that would materially affect the carriedloss and LAE reserves is the estimated severity for the 2003 accident year. If the Company were to change its estimate ofseverity by 1% for the current accident year, the 2003 required reserves for personal auto liability and commercial auto liabilitywould change by approximately $35 million and $6 million, respectively.
Because the Company is primarily an insurer of motor vehicles, it has minimal exposure as an insurer of environmental,asbestos and general liability claims.
For a more detailed discussion on the Company’s loss reserving practices and how loss reserves affect the Company’sfinancial results, see the Company’s Report on Loss Reserving Practices,which was filed in June 2003 via Form 8-K and is availableon the Company’s Web site at progressive.com/investors.
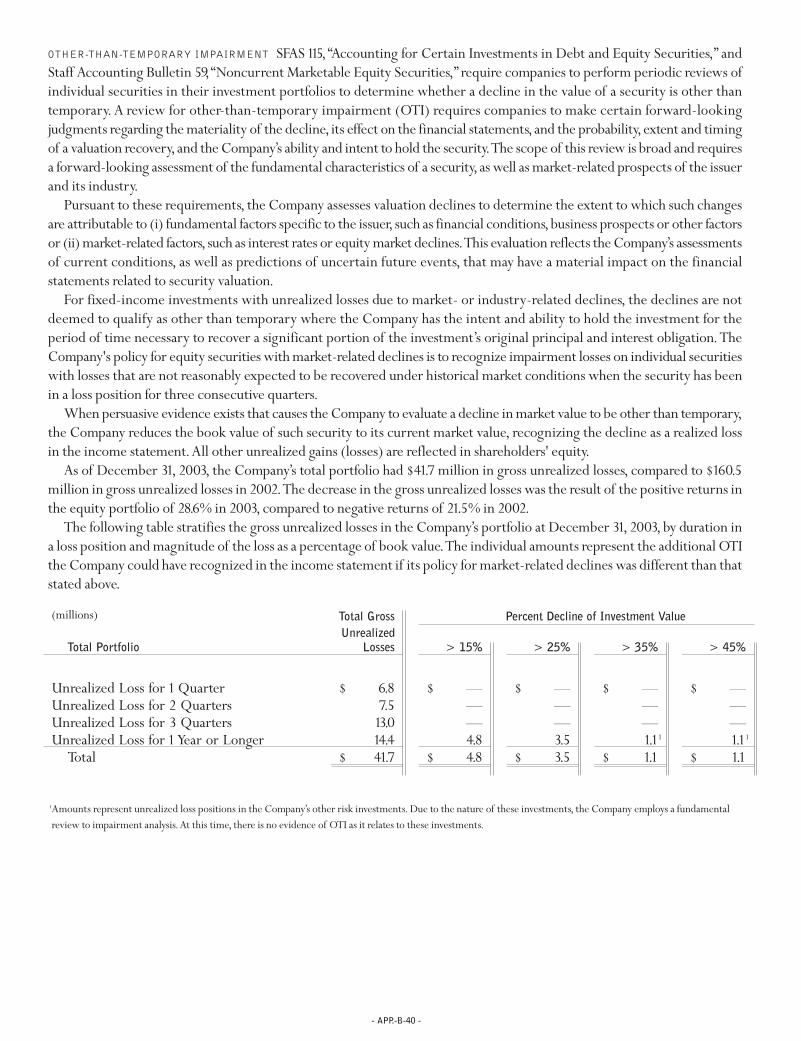
- APP.-B-40 -
Total Gross Percent Decline of Investment ValueUnrealized
Total Portfolio Losses > 15% > 25% > 35% > 45%
Unrealized Loss for 1 Quarter $ 6.8 $ — $ — $ — $ —Unrealized Loss for 2 Quarters 7.5 — — — —Unrealized Loss for 3 Quarters 13.0 — — — —Unrealized Loss for 1 Year or Longer 14.4 4.8 3.5 1.11 1.11
Total $ 41.7 $ 4.8 $ 3.5 $ 1.1 $ 1.1
1Amounts represent unrealized loss positions in the Company’s other risk investments. Due to the nature of these investments, the Company employs a fundamentalreview to impairment analysis.At this time, there is no evidence of OTI as it relates to these investments.
(millions)
OTHER-THAN-TEMPORARY IMPAIRMENT SFAS 115, “Accounting for Certain Investments in Debt and Equity Securities,” andStaff Accounting Bulletin 59,“Noncurrent Marketable Equity Securities,” require companies to perform periodic reviews ofindividual securities in their investment portfolios to determine whether a decline in the value of a security is other thantemporary. A review for other-than-temporary impairment (OTI) requires companies to make certain forward-lookingjudgments regarding the materiality of the decline, its effect on the financial statements,and the probability,extent and timingof a valuation recovery,and the Company’s ability and intent to hold the security.The scope of this review is broad and requiresa forward-looking assessment of the fundamental characteristics of a security,as well as market-related prospects of the issuerand its industry.
Pursuant to these requirements, the Company assesses valuation declines to determine the extent to which such changesare attributable to (i) fundamental factors specific to the issuer, such as financial conditions,business prospects or other factorsor (ii) market-related factors, such as interest rates or equity market declines.This evaluation reflects the Company’s assessmentsof current conditions, as well as predictions of uncertain future events, that may have a material impact on the financialstatements related to security valuation.
For fixed-income investments with unrealized losses due to market- or industry-related declines, the declines are notdeemed to qualify as other than temporary where the Company has the intent and ability to hold the investment for theperiod of time necessary to recover a significant portion of the investment’s original principal and interest obligation.TheCompany's policy for equity securities with market-related declines is to recognize impairment losses on individual securitieswith losses that are not reasonably expected to be recovered under historical market conditions when the security has beenin a loss position for three consecutive quarters.
When persuasive evidence exists that causes the Company to evaluate a decline in market value to be other than temporary,the Company reduces the book value of such security to its current market value, recognizing the decline as a realized lossin the income statement.All other unrealized gains (losses) are reflected in shareholders' equity.
As of December 31, 2003, the Company’s total portfolio had $41.7 million in gross unrealized losses, compared to $160.5million in gross unrealized losses in 2002.The decrease in the gross unrealized losses was the result of the positive returns inthe equity portfolio of 28.6% in 2003, compared to negative returns of 21.5% in 2002.
The following table stratifies the gross unrealized losses in the Company’s portfolio at December 31, 2003, by duration ina loss position and magnitude of the loss as a percentage of book value.The individual amounts represent the additional OTIthe Company could have recognized in the income statement if its policy for market-related declines was different than thatstated above.

- APP.-B-41 -
For example, if the Company decided to write down all securities in an unrealized loss position for one year or longerwhere the securities decline in value exceeded 15%, the Company would recognize an additional $4.8 million of OTI lossesin the income statement.These OTI losses would be $3.5 million if the threshold for market decline was greater than 25%.
The $14.4 million of gross unrealized losses that have been impaired for one year or longer are split almost evenly betweenthe fixed-income and common equity portfolios. None of these securities are deemed to have any fundamental issues thatwould lead the Company to believe that they were other-than-temporarily impaired.The Company has the intent and abilityto hold the fixed-income securities to maturity, and will do so, as long as their relative value is greater than comparableinvestment opportunities with similar investment risk characteristics.The Company will retain the common stocks to maintaincorrelation to the Russell 1000 index as long as the portfolio and index correlation remain similar. If the Company’s strategywere to change and these securities were impaired, the Company would recognize a write down in accordance with its statedpolicy.
Since total unrealized losses are already a component of the Company’s shareholders’equity, any recognition of additionalOTI losses would have no effect on the Company’s comprehensive income or book value.
Safe Harbor Statement Under the Private Securities Litigation Reform Act of 1995: Statements in this Annual Report that are not historical fact are forward-looking
statements that are subject to certain risks and uncertainties that could cause actual events and results to differ materially from those discussed herein.These risks and
uncertainties include,without limitation,uncertainties related to estimates, assumptions and projections generally; inflation and changes in economic conditions (including
changes in interest rates and financial markets); the accuracy and adequacy of the Company’s pricing and loss reserving methodologies; pricing competition and other
initiatives by competitors; the Company’s ability to obtain regulatory approval for requested rate changes and the timing thereof; the effectiveness of the Company’s advertising
campaigns; legislative and regulatory developments; the outcome of litigation pending or that may be filed against the Company; weather conditions (including the severity
and frequency of storms, hurricanes, snowfalls, hail and winter conditions); changes in driving patterns and loss trends; acts of war and terrorist activities; court decisions
and trends in litigation and health care and auto repair costs; and other matters described from time to time by the Company in releases and publications, and in periodic
reports and other documents filed with the United States Securities and Exchange Commission. In addition, investors should be aware that generally accepted accounting
principles prescribe when a company may reserve for particular risks, including litigation exposures. Accordingly, results for a given reporting period could be significantly
affected if and when a reserve is established for a major contingency. Reported results may therefore appear to be volatile in certain accounting periods.

- APP.-B-42 -
(millions–except ratios, per share amounts and number of people employed) 2003 2002 2001 2000 1999
INSURANCE COMPANIES SELECTED FINANCIAL
INFORMATION AND OPERATING STATISTICS
— STATUTORY BASIS
Policyholders’ surplus $ 4,538.3 $ 3,370.2 $ 2,647.7 $ 2,177.0 $ 2,258.9Net premiums written to
policyholders’ surplus ratio 2.6 2.8 2.7 2.8 2.7
Loss and loss adjustment expense 67.4 70.9 73.6 83.2 75.0Underwriting expense 18.8 20.4 21.1 21.0 22.1Statutory combined ratio 86.2 91.3 94.7 104.2 97.1
SELECTED CONSOLIDATED FINANCIAL INFORMATION
— GAAP BASIS
Total revenues $ 11,892.0 $ 9,294.4 $ 7,488.2 $ 6,771.0 $ 6,124.2Total assets 16,281.5 13,564.4 11,122.4 10,051.6 9,704.7Total shareholders’ equity1 5,030.6 3,768.0 3,250.7 2,869.8 2,752.8Common Shares outstanding 216.4 218.0 220.3 220.6 219.3Common Share price:
High $ 84.68 $ 60.49 $ 50.60 $ 37.00 $ 58.08Low 46.25 44.75 27.38 15.00 22.83Close2 83.59 49.63 49.77 34.54 24.38
Market capitalization $ 18,088.9 $ 10,819.3 $ 10,958.6 $ 7,616.8 $ 5,345.4Book value per Common Share1 $ 23.25 $ 17.28 $ 14.76 $ 13.01 $ 12.55Return on average common
shareholders’ equity3 29.1% 19.3% 13.5% 1.7% 10.9%Debt outstanding $ 1,489.8 $ 1,489.0 $ 1,095.7 $ 748.8 $ 1,048.6Ratios:
Debt to total capital 23% 28% 25% 21% 28%Earnings to fixed charges4 18.8x 13.2x 10.7x 1.3x 5.7xPrice to earnings5 15 17 27 164 18Price to book 3.6 2.9 3.4 2.7 1.9
Net premiums written growth 26% 30% 17% 1% 16%GAAP underwriting margin1 12.7% 7.6% 4.8% (4.4)% 1.7%Number of people employed 25,834 22,974 20,442 19,490 18,753
All share and per share amounts were adjusted for the April 22, 2002, 3-for-1stock split.
1In 1994, the $71.0 million “supplemental reserve” was eliminated, increasing book value per share $.21,underwriting profit margin 3.2% and shareholders’ equity $46.1million.
2Represents the closing price at December 31.
THE PROGRESSIVE CORPORATION AND SUBSIDIARIES
TEN YEAR SUMMARY — FINANCIAL HIGHLIGHTS
(unaudited — not covered by report of independent auditors)

- APP.-B-43 -
3Net income minus preferred share dividends ÷ average common shareholders’ equity.
41995 and 1994 represents the ratio of earnings to combined fixed charges and preferred share dividends.
5Represents the closing stock price ÷ earnings per share.
(millions–except ratios, per share amounts and number of people employed) 1998 1997 1996 1995 1994
INSURANCE COMPANIES SELECTED FINANCIAL
INFORMATION AND OPERATING STATISTICS
— STATUTORY BASIS
Policyholders’ surplus $ 2,029.9 $ 1,722.9 $ 1,292.4 $ 1,055.1 $ 945.1Net premiums written to
policyholders’ surplus ratio 2.6 2.7 2.7 2.8 2.6
Loss and loss adjustment expense 68.5 71.1 70.2 71.6 64.2Underwriting expense 22.4 20.7 19.8 21.4 22.4Statutory combined ratio 90.9 91.8 90.0 93.0 86.6
SELECTED CONSOLIDATED FINANCIAL INFORMATION
— GAAP BASIS
Total revenues $ 5,292.4 $ 4,608.2 $ 3,478.4 $ 3,011.9 $ 2,415.3Total assets 8,463.1 7,559.6 6,183.9 5,352.5 4,675.1Total shareholders’ equity1 2,557.1 2,135.9 1,676.9 1,475.8 1,151.9Common Shares outstanding 217.6 216.9 214.5 216.3 213.6Common Share price:
High $ 57.33 $ 40.29 $ 24.08 $ 16.50 $ 13.50Low 31.33 20.50 13.46 11.58 9.25Close2 56.46 39.96 22.46 16.29 11.67
Market capitalization $ 12,279.7 $ 8,667.0 $ 4,817.3 $ 3,523.9 $ 2,492.0Book value per Common Share1 $ 11.75 $ 9.85 $ 7.82 $ 6.44 $ 4.99Return on average common
shareholders’ equity3 19.3% 20.9% 20.5% 19.6% 27.4%Debt outstanding $ 776.6 $ 775.9 $ 775.7 $ 675.9 $ 675.6Ratios:
Debt to total capital 23% 27% 32% 31% 37%Earnings to fixed charges4 10.2x 9.2x 7.7x 5.6x 6.1xPrice to earnings5 28 23 16 15 10Price to book 4.8 4.1 2.9 2.5 2.3
Net premiums written growth 14% 36% 18% 19% 35%GAAP underwriting margin1 8.4% 6.6% 8.5% 5.7% 11.5%Number of people employed 15,735 14,126 9,557 8,025 7,544

- APP.-B-44 -
(millions – except per share amounts) 2003 2002 2001 2000 1999
Direct premiums written:Personal Lines $ 10,594.4 $ 8,431.1 $ 6,485.1 $ 5,773.2 $ 5,799.4Commercial Auto Business 1,359.2 1,004.3 665.7 442.2 321.4Other businesses 234.3 230.3 228.4 186.7 184.5
Total direct premiums written 12,187.9 9,665.7 7,379.2 6,402.1 6,305.3Reinsurance assumed — .1 .1 — —Reinsurance ceded (274.5) (213.8) (119.2) (206.0) (180.6)
Net premiums written 11,913.4 9,452.0 7,260.1 6,196.1 6,124.7Net change in unearned premiums reserve1 (572.4) (568.5) (98.3) 152.3 (441.1)
Net premiums earned 11,341.0 8,883.5 7,161.8 6,348.4 5,683.6Expenses:
Losses and loss adjustment expenses2 7,640.4 6,299.1 5,264.1 5,279.4 4,256.4Policy acquisition costs 1,249.1 1,031.6 864.9 788.0 745.0Other underwriting expenses 1,010.1 874.2 686.9 559.3 583.8
Total underwriting expenses 9,899.6 8,204.9 6,815.9 6,626.7 5,585.2Underwriting profit (loss) before taxes 1,441.4 678.6 345.9 (278.3) 98.4Provision (benefit) for income taxes 504.5 237.5 121.1 (97.4) 34.4Underwriting profit (loss) after taxes 936.9 441.1 224.8 (180.9) 64.0Service operations profit (loss) after taxes 10.5 8.0 3.2 (.6) 4.3
947.4 449.1 228.0 (181.5) 68.3Investment income after taxes 345.9 324.4 296.1 278.3 249.6Net realized gains (losses) on securities
after taxes 8.3 (51.1) (72.7) 11.0 30.7Interest expense after taxes (62.1) (48.5) (33.9) (50.6) (49.7)Nonrecurring items after taxes3 — — — (4.2) —Other income after taxes4 20.3 — — — 3.4Net expenses after taxes5 (4.4) (6.6) (6.1) (6.9) (7.1)Net income $ 1,255.4 $ 667.3 $ 411.4 $ 46.1 $ 295.2Per share6
Net income $ 5.69 $ 2.99 $ 1.83 $ .21 $ 1.32Dividends .100 .096 .093 .090 .087
Average equivalent sharesBasic 216.8 219.0 221.0 219.6 218.7Diluted 220.5 223.2 225.2 223.0 223.9
All share and per share amounts were adjusted for the April 22, 2002, 3-for-1stock split.
1Amount represents change in unearned premiums reserve less change in prepaid reinsurance premiums.
2In 1994, the “supplemental reserve” was eliminated, resulting in a one-time decrease to losses and loss adjustment expenses of $71.0 million, or $.21per share.
32000 reflects a foreign currency translation loss.
42003 reflects interest income related to an income tax refund; 1999 reflects a gain on the sale of the corporate aircraft.
5Reflects investment expenses after taxes and other tax adjustments.
6Presented on a diluted basis. In 1997, the Company adopted SFAS 128,“Earnings Per Share,” and, as a result, restated prior periods per share amounts, if applicable.
THE PROGRESSIVE CORPORATION AND SUBSIDIARIES
TEN YEAR SUMMARY—GAAP CONSOLIDATED OPERATING RESULTS
(unaudited — not covered by report of independent auditors)

- APP.-B-45 -
(millions–except per share amounts) 1998 1997 1996 1995 1994
Direct premiums written:Personal Lines $ 4,987.1 $ 4,355.9 $ 3,165.4 $ 2,644.6 $ 2,181.7Commercial Auto Business 265.2 253.5 229.9 210.5 183.7Other businesses 199.0 215.8 243.1 213.8 279.7
Total direct premiums written 5,451.3 4,825.2 3,638.4 3,068.9 2,645.1Reinsurance assumed — — 3.8 .1 2.9Reinsurance ceded (151.6) (160.1) (200.5) (156.2) (190.8)
Net premiums written 5,299.7 4,665.1 3,441.7 2,912.8 2,457.2Net change in unearned premiums reserve1 (351.7) (475.6) (242.4) (185.6) (266.1)
Net premiums earned 4,948.0 4,189.5 3,199.3 2,727.2 2,191.1Expenses:
Losses and loss adjustment expenses2 3,376.3 2,967.5 2,236.1 1,943.8 1,397.3Policy acquisition costs 659.9 607.8 482.6 459.6 391.5Other underwriting expenses 495.8 336.0 208.5 167.2 150.8
Total underwriting expenses 4,532.0 3,911.3 2,927.2 2,570.6 1,939.6Underwriting profit (loss) before taxes 416.0 278.2 272.1 156.6 251.5Provision (benefit) for income taxes 145.6 97.4 95.2 54.8 88.0Underwriting profit (loss) after taxes 270.4 180.8 176.9 101.8 163.5Service operations profit (loss) after taxes 4.8 .9 2.8 5.6 6.5
275.2 181.7 179.7 107.4 170.0Investment income after taxes 221.3 205.3 175.6 156.2 131.2Net realized gains (losses) on securities
after taxes 7.4 64.0 4.6 30.4 15.5Interest expense after taxes (39.7) (42.0) (40.0) (37.1) (35.9)Nonrecurring items after taxes3 — — — — —Other income after taxes4 — — — — —Net expenses after taxes5 (7.5) (9.0) (6.2) (6.4) (6.5)Net income $ 456.7 $ 400.0 $ 313.7 $ 250.5 $ 274.3Per share6
Net income $ 2.04 $ 1.77 $ 1.38 $ 1.09 $ 1.20Dividends .083 .080 .077 .073 .070
Average equivalent sharesBasic 217.4 216.0 214.8 215.4 214.8Diluted 224.1 225.9 222.6 222.6 222.0

- APP.-B-46 -
Quantitative market risk disclosures are only presented for market risk categories when risk is considered material. Mate-riality is determined based on the fair value of the financial instruments at December 31, 2003, and the potential for near-term losses from reasonably possible near-term changes in market rates or prices.
OTHER THAN TRADING FINANCIAL INSTRUMENTS
Financial instruments subject to interest rate risk were:
Market Value-200 bps -100 bps +100 bps +200 bps
(millions) Change Change Actual Change Change
U.S. government obligations $ 1,383.4 $ 1,348.5 $ 1,312.2 $ 1,277.2 $ 1,243.6State and local government obligations 3,220.7 3,071.1 2,930.2 2,798.6 2,675.7Asset-backed securities 3,191.7 3,119.1 3,042.6 2,965.1 2,885.9Corporate and other debt securities 2,003.9 1,925.1 1,848.4 1,776.4 1,708.5Preferred stocks 822.3 800.9 778.8 757.9 738.2Short-term investments 648.0 648.0 648.0 648.0 648.0Balance as of December 31, 2003 $ 11,270.0 $10,912.7 $ 10,560.2 $ 10,223.2 $ 9,899.9Balance as of December 31, 2002 $ 9,500.3 $ 9,223.0 $ 8,937.0 $ 8,659.7 $ 8,382.5
Exposure to risk is represented in terms of changes in fair value due to selected hypothetical movements in market rates.Bondsand preferred stocks are individually priced to yield to the worst case scenario.State and local government obligations, includinglease deals and super sinkers, are assumed to hold their prepayment patterns.Asset-backed securities are priced assuming dealspecific prepayment scenarios, considering the deal structure, prepayment penalties, yield maintenance agreements and theunderlying collateral.Over 95% of the preferred stocks have mechanisms that are expected to provide an opportunity to liquidateat par.
Financial instruments subject to equity market risk were:
Hypothetical Market ChangesMarket
(millions) Value +10% -10%
Common equities as of December 31, 2003 $ 1,972.1 $ 2,169.3 $ 1,774.9Common equities as of December 31, 2002 $ 1,347.3 $ 1,482.0 $ 1,212.6
THE PROGRESSIVE CORPORATION AND SUBSIDIARIES
QUANTITATIVE MARKET RISK DISCLOSURES
(unaudited — not covered by report of independent auditors)

- APP.-B-47 -
The model represents the estimated value of the Company’s common equity portfolio given a +/- 10% change in the market,based on the common stock portfolio’s weighted average beta of .95.The beta is derived from recent historical experience,using the S&P 500 as the market surrogate.The historical relationship of the common stock portfolio’s beta to the S&P 500is not necessarily indicative of future correlation,as individual company or industry factors may affect price movement.Betasare not available for all securities. In such cases, the change in market value reflects a direct +/- 10% change; the number ofsecurities without betas is less than 3%, and the remaining 97% of the equity portfolio is indexed to the Russell 1000.
As an additional supplement to the sensitivity analysis, the Company presents summarized estimates of the Value-at-Risk(VaR) of the fixed-income and equity portfolios for the following quarterly periods:
December 31, September 30, June 30, March 31, December 31,(millions) 2003 2003 2003 2003 2002
Fixed-income portfolio $ (147.5) $ (192.9) $ (162.5) $ (148.2) $ (130.9)% of portfolio (1.4)% (1.9)% (1.6)% (1.6)% (1.5)%
Equity portfolio $ (102.0) $ (123.0) $ (133.9) $ (166.6) $ (146.9)% of portfolio (5.2)% (6.7)% (7.8)% (11.1)% (10.9)%
Total portfolio $ (158.5) $ (209.0) $ (183.0) $ (109.0) $ (99.8)% of portfolio (1.3)% (1.7)% (1.6)% (1.0)% (1.0)%
The model results represent the maximum expected loss in a one month period at a 95% confidence level.The results arebased on 10,000 paths generated using Monte Carlo methodology. Fixed-income securities are priced off simulated termstructures,capturing the path-dependency of instruments with embedded options.Equities are priced off a 10 factor model;risk factors include both macroeconomics and industry segment exposures.The variance/covariance matrix is estimatedusing the last two years (rolling) of market data and is exponentially-weighted,making the model especially sensitive to recentvolatility.The VaR of the total investment portfolio is less than the sum of the two components (fixed income and equity)due to the benefit of diversification.
The VaR exposure of the total investment portfolio increased 30 basis points from December 31, 2002 to December 31,2003, primarily reflecting a higher correlation among the securities, thereby reducing the diversification benefit.
TRADING FINANCIAL INSTRUMENTS
At December 31,2003 and December 31,2002, the Company did not have any trading securities.During 2003 and 2002,netactivity of trading securities was not material to the Company’s financial position, cash flows or results of operations. For2003, the Company realized $.1million of net gains on trading securities, compared to $0 in 2002.

- APP.-B-48 -
The Company believes that equity compensation awards align management interests with those of shareholders. In 1989, theCompany began awarding non-qualified stock options (NQSO) annually to key employees and to directors of the Companyas the equity component of total compensation. In 2003,the Company discontinued NQSO awards in favor of annual restrictedstock (RS) grants.The Company believes that restricted stock,which provides voting rights,dividend payments, an indefinitelife and unleveraged returns, represents a superior tool in aligning interests.
The Company recognizes investor concerns about the dilutive effects of equity-based compensation. Beginning January 1,2001, the Company initiated a policy of share repurchases to neutralize the effect of dilution. Management’s goal is to keepthe outstanding share count relatively stable.
The following table shows the Common Share activity since this policy was established (all amounts are presented on apost-split basis):
CommonBeginning RS NQSOs Shares Ending
Year Balance Granted Exercised Repurchased Balance
2001 220.6 — 2.5 (2.8) 220.32002 220.3 — 1.3 (3.6) 218.02003 218.0 .6 2.8 (5.0) 216.4
Cumulative activity 220.6 .6 6.6 (11.4) 216.4
THE PROGRESSIVE CORPORATION AND SUBSIDIARIES
INCENTIVE COMPENSATION PLANS
(unaudited — not covered by report of independent auditors)
As of January 1, 2004, there were 9.0 million options outstanding with 6.3 million options currently eligible for exercise,including .3 million options for directors. On January 1, 2004, 2.2 million options became exercisable.The final expirationdate for these outstanding options is December 31,2011,with the exception of the directors’options,which expire April 2012.
The Company anticipates that approximately 8.6 million of the currently outstanding options will have been exercised bythe expiration date.The difference between options currently outstanding and total projected exercises represents an estimateof the Company’s historical experience of option cancellations.Actual exercises can and will vary based on a number of factors,including variation in the market price of Progressive stock. Forecasted exercises are based on management assumptionsderived from historical experience.

- APP.-B-49 -
Following is the Company’s anticipated rate of option exercises over the remaining life of the option plan.
Forecasted Average Projected Year of Exercise Exercises Strike Price
2004 1.8 $ 24.372005 1.8 27.472006 1.4 32.522007 1.2 36.142008 1.0 35.212009 .8 32.562010 .4 45.302011 .2 61.81
Remaining obligation 8.6 $ 31.68
The Company expects to repurchase shares to offset its remaining obligation during the expected future life of the optionsoutstanding.
During the year, the Company granted the following restricted stock awards, including 16,102 awards granted to directors:WeightedAverage
Shares Grant Value
Employees:1
Time-based 452,730 $ 65.86Performance-based 100,560 65.55
Directors time-based 16,102 65.55Total granted 569,392 65.80
Cancelled (2,987) 65.55Vested (655) 65.55
Net unvested awards 565,750 $ 65.80
1Includes 152,593 shares deferred pursuant to The Progressive Corporation Executive Deferred Compensation Plan.
(millions, except prices)
The employee time-based awards typically vest in equal installments over three, four and five year periods.The performance-based awards vest upon the attainment of preestablished profitability and growth objectives.The directors’awards vest withina one-year period.As of December 31, 2003, the remaining weighted average vesting period for our total unvested awards is2.49 years.
The Company recognizes compensation expense on a pro rata basis over the vesting period for all non-deferred awardsbased on the market value at the date of grant.The compensation expense on the deferred awards is based on the currentmarket value at the end of each period. During 2003, the Company recognized $11.0 million of compensation expenseassociated with restricted stock awards.

- APP.-B-50 -
Net Income Stock Price1
Operating Per Rate of DividendsQuarter Revenues2 Share3 Total High Low Close Return4 Per Share
20031 $ 2,607.1 $ 1.32 $ 291.5 $ 60.41 $ 46.25 $ 59.31 $ .0252 2,785.4 1.29 286.3 76.38 59.66 73.10 .0253 2,938.6 1.45 319.8 75.81 64.25 69.11 .0254 3,051.7 1.63 357.8 84.68 69.11 83.59 .025
$ 11,382.8 $ 5.69 $1,255.4 $ 84.68 $ 46.25 $ 83.59 68.7% $ .100
20021 $ 1,975.3 $ .78 $ 176.2 $ 55.80 $ 46.75 $ 55.54 $ .0232 2,144.8 .71 160.4 60.49 54.64 57.85 .0233 2,325.7 .80 178.5 57.77 44.75 50.63 .0254 2,472.0 .69 152.2 58.30 48.79 49.63 .025
$ 8,917.8 $ 2.99 $667.3 $ 60.49 $ 44.75 $ 49.63 (.1)% $ .096
20011 $ 1,678.8 $ .39 $ 86.6 $ 34.49 $ 27.38 $ 32.35 $ .0232 1,761.7 .46 103.7 45.59 31.20 45.06 .0233 1,839.7 .43 96.4 45.32 38.20 44.63 .0234 1,906.3 .56 124.7 50.60 43.62 49.77 .023
$ 7,186.5 $ 1.83 $ 411.4 $ 50.60 $ 27.38 $ 49.77 44.1% $ .093
All per share amounts and stock prices were adjusted for the April 22, 2002, 3-for-1stock split.
1Prices as reported on the consolidated transaction reporting system.The Company’s Common Shares are listed on the New York Stock Exchange.
2Represents premiums earned plus service revenues.
3Presented on a diluted basis.The sum may not equal the total because the average equivalent shares differ in the periods.
4Represents annual rate of return, including quarterly dividend reinvestment.
(millions — except per share amounts)
THE PROGRESSIVE CORPORATION AND SUBSIDIARIES
QUARTERLY FINANCIAL AND COMMON SHARE DATA
(unaudited — not covered by report of independent auditors)
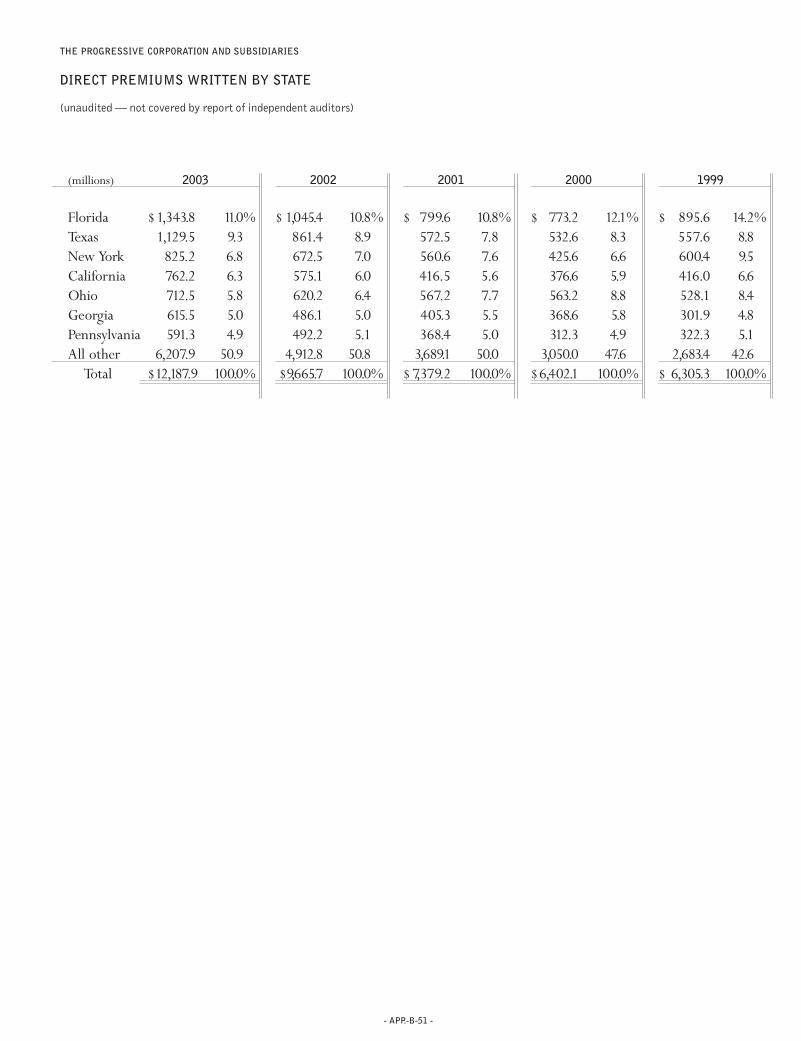
- APP.-B-51 -
THE PROGRESSIVE CORPORATION AND SUBSIDIARIES
DIRECT PREMIUMS WRITTEN BY STATE
(unaudited — not covered by report of independent auditors)
(millions) 2003 2002 2001 2000 1999
Florida $1,343.8 11.0% $ 1,045.4 10.8% $ 799.6 10.8% $ 773.2 12.1% $ 895.6 14.2%Texas 1,129.5 9.3 861.4 8.9 572.5 7.8 532.6 8.3 557.6 8.8New York 825.2 6.8 672.5 7.0 560.6 7.6 425.6 6.6 600.4 9.5California 762.2 6.3 575.1 6.0 416.5 5.6 376.6 5.9 416.0 6.6Ohio 712.5 5.8 620.2 6.4 567.2 7.7 563.2 8.8 528.1 8.4Georgia 615.5 5.0 486.1 5.0 405.3 5.5 368.6 5.8 301.9 4.8Pennsylvania 591.3 4.9 492.2 5.1 368.4 5.0 312.3 4.9 322.3 5.1All other 6,207.9 50.9 4,912.8 50.8 3,689.1 50.0 3,050.0 47.6 2,683.4 42.6
Total $12,187.9 100.0% $9,665.7 100.0% $7,379.2 100.0% $6,402.1 100.0% $ 6,305.3 100.0%

- APP.-B-52 -
DIRECTORS
Milton N.Allen1, 2, 6
Consultant, Director, and Trustee,Profit and Not-for-profitOrganizations
B. Charles Ames1, 6
Partner,Clayton, Dubilier & Rice, Inc.(investment banking)
Charles A. Davis3, 5, 6
Chairman and Chief Executive Officer,MMC Capital, Inc.(private equity investing)
Stephen R. Hardis2, 4, 5, 6
Chairman of the Board,Axcelis Technologies, Inc.(manufacturing)
Bernadine P. Healy, M.D.3, 6
Medical & Science Columnist, U.S.News & World Report,(publishing)formerly President and ChiefExecutive Officer,American Red Cross(emergency services)
Jeffrey D. Kelly4, 6
Executive Vice President and ChiefFinancial Officer,National City Corporation(commercial banking)
Philip A. Laskawy1, 6
formerly Chairman and ChiefExecutive Officer,Ernst & Young LLP(professional services)
Peter B. Lewis2
Chairman of the Board
Norman S. Matthews3, 5, 6
Consultant,formerly President,Federated Department Stores, Inc.(retailing)
Glenn M. Renwick2
President and ChiefExecutive Officer
Donald B. Shackelford4, 6
Chairman,Fifth Third Bank, Central Ohio(commercial banking)
Bradley T. Sheares, Ph.D.6
President,U.S. Human Health Division ofMerck & Co., Inc.(health care)
1Audit Committee member2Executive Committee member3Compensation Committee member4Investment and Capital Committee member5Nominating and Governance Committee member6Independent director
CORPORATE OFFICERS
Peter B. LewisChairman
Glenn M. RenwickPresident and ChiefExecutive Officer
W.Thomas ForresterVice President and Chief Financial Officer
Charles E. JarrettVice President, Secretary and Chief Legal Officer
Thomas A. KingVice President and Treasurer
Jeffrey W. BaschVice President and Chief Accounting Officer
CONTACT NON-MANAGEMENT DIRECTORS Interested partieshave the ability to contact non-management directors as agroup by sending a written communication clearly addressedto the non-management directors or any one of the following:
Peter B. Lewis, Chairman of the Board, The ProgressiveCorporation,6300 Wilson Mills Road,Mayfield Village,Ohio44143 or e-mail: [email protected].
Philip A. Laskawy, Chairman of the Audit Committee,The Progressive Corporation, c/o Ernst & Young,
5 Times Square, New York, New York 10036 or e-mail:[email protected].
Charles E. Jarrett, Corporate Secretary, The ProgressiveCorporation,6300 Wilson Mills Road,Mayfield Village,Ohio44143 or e-mail: chuck_jarrett @progressive.com.
The recipient will forward communications so received tothe non-management directors.

- APP.-B-53 -
ANNUAL MEETING The Annual Meeting of Shareholders willbe held at the offices of The Progressive Corporation, 6671Beta Drive, Mayfield Village, Ohio 44143 on April 16, 2004,at 10 a.m. eastern time. There were 4,103 shareholders ofrecord on December 31, 2003.
PRINCIPAL OFFICE The principal office of The ProgressiveCorporation is at 6300 Wilson Mills Road, Mayfield Village,Ohio 44143.
PHONE: 440-461-5000
WEB SITE: progressive.com
TOLL-FREE TELEPHONE NUMBER For assistance after anaccident or to report a claim, 24 hours a day, 7 days a week,call: 1-800-PROGRESSIVE (1-800-776-4737).
To check rates available to you from Progressive and otherleading auto insurance companies,call: 1-800-PROGRESSIVE(1-800-776-4737) or visit: progressive.com.
For 24 Hour Customer Service, call: 1-800-PROGRESSIVE (1-800-776-4737)
COUNSEL Baker & Hostetler LLP, Cleveland, Ohio
TRANSFER AGENT AND REGISTRAR If you have questionsabout a specific stock ownership account, write orcall: National City Bank,Corporate Trust Operations,Dept.5352,4100 W.150th St.,Cleveland,Ohio 44135.Phone: 1-800-622-6757.
CHARITABLE CONTRIBUTIONS Progressive supports qualifiednot-for-profit organizations working to reduce the humantrauma and economic cost of auto accidents. In addition,TheProgressive Insurance Foundation,established in December2001, will contribute to qualified tax-exempt organizationsthat are financially supported by Progressive employees.
COMMON SHARES The Progressive Corporation’s CommonShares (symbol PGR) are traded on the New York StockExchange. Dividends are customarily paid on the last day ofeach quarter. The 2004 quarterly dividend record dates,subject to Board approval, are as follows: March 12, June 11,September 10 and December 10.
CORPORATE GOVERNANCE The Company’s CorporateGovernance guidelines and Board committee charters areavailable at: progressive.com/governance, or may berequested in print by writing to: The ProgressiveCorporation, Investor Relations, 6300 Wilson Mills Road,Box W33, Mayfield Village, Ohio 44143.
ACCOUNTING COMPLAINT PROCEDURE Any employee orother interested party with a complaint or concern regardingaccounting, internal accounting controls or auditing mattersrelating to the Company may report such complaint orconcern directly to the Chairman of the Audit Committee,as follows:
Philip A.Laskawy,Audit Committee Chairman,c/o Ernst& Young,5 Times Square,New York,New York 10036,Phone:212-773-1300, e-mail: [email protected].
Any such complaint or concern also may be reportedanonymously over the following toll-free Alert Line: 1-800-683-3604. The Company will not retaliate against anyindividual by reason of his or her having made such a complaint or reported such a concern in good faith.Viewthe complete procedures at progressive.com/governance.
WHISTLEBLOWER PROTECTIONS The Company will notretaliate against any officer or employee of the Companybecause of any lawful act done by the employee to provideinformation or otherwise assist in investigations regardingconduct that the employee reasonably believes to be aviolation of Federal Securities Laws or of any rule orregulation of the Securities and Exchange Commission orFederal Securities Laws relating to fraud against shareholders.View the complete Whistleblower Protections atprogressive.com/governance.
SHAREHOLDER/INVESTOR RELATIONS The ProgressiveCorporation does not maintain a mailing list for distributionof shareholders’ reports.To view Progressive’s publicly fileddocuments, shareholders can access the Company’s Web site:progressive.com/sec.To view its earnings and other releases,access progressive.com/investors.
To request copies of public financial information on theCompany, write to: The Progressive Corporation, InvestorRelations,6300 Wilson Mills Road,Box W33,Mayfield Village,Ohio 44143, e-mail: [email protected] orcall: 1-440-395-2258.
For financial-related information, call: 1-440-395-2222 or e-mail: [email protected].
For stock ownership account information,call: National CityBank at 1-800-622-6757.
For all other Company information,call: 1-440-461-5000 ore-mail: [email protected].
INTERACTIVE ANNUAL REPORT The Progressive Corpor-ation’s 2003 Annual Report, in an interactive format, can befound at: progressive.com/annualreport.
©2004 The Progressive Corporation