Report of C S /U A L C of P - UNICEF
52
Report of Coverage Survey in Slums/Underserved Areas of 10 Largest Cities of Pakistan Punjab (Lahore, Rawalpindi, Multan, Gujranwala, Faisalabad), Sindh (Karachi & Hyderabad), Khyber Pakhtunkhwa (Peshawar), Balochistan (Quetta), Federal Capital (Islamabad) July 2020
Transcript of Report of C S /U A L C of P - UNICEF

Report of Coverage Survey in Slums/Underserved Areas of 10 Largest Cities of Pakistan
Punjab (Lahore, Rawalpindi, Multan, Gujranwala, Faisalabad),
Sindh (Karachi & Hyderabad), Khyber Pakhtunkhwa (Peshawar),
Balochistan (Quetta), Federal Capital (Islamabad)
July 2020

Acknowledgements
This study was conducted with the technical support and oversight from UNICEF Immunization team Pakistan, with financial support of Gavi- the vaccine alliance and executed by Civil Society Human and Institutional Development Programme (CHIP) under the leadership of Provincial and Federal EPI programs. The report in hand presents the results of ‘Childhood Immunization Coverage Survey’ held in slums/underserved areas of 10 largest cities of Pakistan. Our sincere thanks to UNICEF for their technical support throughout the process to achieve the planned results. Our sincere thanks to UNICEF and WHO provincial and Country office colleagues, CSO and expanded partners for their technical support and facilitation to complete this assignment. Special acknowledgement is extended to Federal and Provincial EPI Programs, Directorate of Health Islamabad and District Department of Health in 10 largest cities of Pakistan who extended their leadership and fullest cooperation for the successful execution of the survey. Specific acknowledgement is also extended to all the respondents for participating in this study and adding their valuable input to this discourse. It would not have been possible to present such in-depth, relevant and reliable information without their cooperation.

Table of Contents
Acknowledgements .............................................................................................................................. ii
Executive Summary .............................................................................................................................. 1
Chapter 1: Introduction ................................................................................................................... 3
1.1 Global Context .............................................................................................................................. 3 1.2 National Context ........................................................................................................................... 4 1.3 Punjab ........................................................................................................................................... 5 1.4 Sindh ............................................................................................................................................. 5 1.5 Balochistan ................................................................................................................................... 6 1.6 Khyber Pakhtunkhwa .................................................................................................................... 8 1.7 Islamabad ..................................................................................................................................... 9
Chapter 2: Methodology ................................................................................................................ 12
2.1 Study Design ............................................................................................................................... 12 2.2 Study Sites .................................................................................................................................. 12 2.3 Study Duration ............................................................................................................................ 12 2.4 Study Respondents ..................................................................................................................... 12 2.5 Sampling Procedures & Sample Size ......................................................................................... 13 2.6 Key Variables .............................................................................................................................. 15 2.7 Data Collection Instruments ........................................................................................................ 16 2.8 Operational Definitions................................................................................................................ 16 2.9 Data Analysis Techniques .......................................................................................................... 17 2.10 Monitoring Mechanism ................................................................................................................ 17 2.11 Study Team and Training ........................................................................................................... 18 2.12 Objectives and Rationale of the Coverage Survey ..................................................................... 18 2.13 Study Limitations ......................................................................................................................... 18
Chapter 3: Childhood Vaccinations ............................................................................................. 20
3.1 Vaccination Coverage ................................................................................................................. 20 3.2 Background Characteristics of Mothers ...................................................................................... 26 3.3 Background Characteristics of Households ................................................................................ 26 3.4 Background Characteristics of Fully Immunized Vs. Zero Dose ................................................ 28
Chapter 4: Conclusion and Recommendation ............................................................................ 31
4.1 Conclusion .................................................................................................................................. 31 4.2 Recommendations ...................................................................................................................... 31
Annex 1: Questionnaire for Household Coverage Survey ...................................................... 34
Annex 2: Analysis of Household Coverage Survey ................................................................. 38

Abbreviation
AIDS Acquired Immune Deficiency Syndrome
BCG Bacille Calmette Guerin
CHIP Civil Society Human and Institutional Development Programme
CI Confidence Interval
cMYP Country Multiyear Plan
CNIC Computerized National Identity Card
DEF Design Effect Factor
DPT Diphtheria, Pertussis and Tetanus
EOC Emergency Operation Center
EPI Expanded Programme on Immunization
ESS Effective Sample Size
FSD Faisalabad
GJR Gujranwala
Hep B Hepatit is B
Hib Haemophilus Influenza type b
HYD Hyderabad
IBD Islamabad
ILR Ice-Lined Refrigerator
IMR Infant Mortality Rate
KCH Karachi
LEAD Leadership for Environment and Development
LHR Lahore
LHW Lady Health Worker
MDGs Millennium Development Goals
MICS Multiple Indicators Cluster Survey
MMR Maternal Mortality Rate
MTN Multan
NDC National Disaster Consortium
OPV Oral Polio Vaccine
PCV Pneumococcal Conjugate Vaccine
PDHS Pakistan Demographic Housing Survey
PKR Pakistani Rupee
PSLM Pakistan Social Living Measurement Survey
PWR Peshawar
QTA Quetta
RWP Rawalpindi
SATA Statistics and Data (Statistical Software Package)
SDG Sustainable Development Goals
SPSS Statistical Package for Social Sciences
TB Tuberculosis
TT Tetanus Toxoid
UC Union Council
UN United Nations
UN-HABITAT United Nations Human Settlements Programme
UNHCR United Nations High Commissioner for Refugees
UNICEF United Nations Children Fund
WASH Water, Sanitation and Hygiene
WB World Bank
WHO World Health Organization

1
Executive Summary An in-depth study to determine the childhood vaccination coverage rates of children aged 12-23 months was undertaken in slums/underserved areas of 10 largest cities of Pakistan i.e. Faisalabad, Gujranwala, Lahore, Multan, Rawalpindi (Punjab), Quetta (Balochistan), Peshawar, Karachi and Hyderabad. The coverage survey was conducted with 14,531 children of 14,491 Mothers living in 14,467 households. Overall only 44% children have vaccination cards. Lower percentage card retention (46%) of vaccination card is found in girls compared to boys (54%). Highest percentage of card retention is found in two cities namely Gujranwala (65%) and Multan (65%) and lowest card retention is found in two cities Hyderabad (26%) and Islamabad (31%). Overall 53% children are fully immunized (records+recall) while the percentage drops to only 30% when checked against records. Lesser percentage (46%) of girls are fully immunized compared to boys (54%). Highest percentage of fully immunized children are found in Multan (76%) and lowest percentage of fully immunized children are found in Quetta (27%). Antigen wise coverage based on records+recall reflect that overall 85% children have received Bacille Calmette Guerin (BCG) + Oral Polio Vaccine (OPV0) with highest percentage in Karachi (93%) and Multan (92%) and lowest percentage in Quetta (71%). The coverage rates for Penta 1 are 78% with highest percentage in Multan (91%) and Faisalabad (88%) and lowest percentage in Quetta (63%). The coverage rates for Penta 3 are 65% with highest percentage in Multan (84%) and lowest in Quetta (42%). The coverage rates for Measles 1 are 58% with highest percentage in two cities Multan (79%) and Rawalpindi (71%) and lowest percentage in Quetta (38%). Overall 33% children are partially vaccinated with highest percentage in Quetta (46%) lowest percentage in Gujranwala (11%). Gender wise analysis reflects higher percentage of partially vaccinated boys (52%). Overall defaulter rate from BCG to Penta 3 is 24% with highest in Quetta (41%) and lowest in Rawalpindi (5%). Overall defaulter rate from BCG to Measles 1 is 32% with highest in Quetta (46%) and lowest in Rawalpindi (14%). Overall 14% children have not received any antigen hence are zero dose. Higher percentage (54%) of boys are zero dose when compared with girls (46%). Highest percentage of zero dose are found in Quetta (27%) and Gujranwala (24%) and lowest percentage of zero dose are found in Karachi (5%). Overall 56% mothers of 14,531 children are illiterate with highest percentage of illiterate mothers in Quetta (83%), Peshawar (74%) and Hyderabad (72%) and lowest percentage of illiterate mothers in Gujranwala (17%) and Faisalabad (31%). Only 6% mothers are engaged in livelihood activities with highest percentage of working mothers in Islamabad (9%) and Karachi (8%). 33% mothers do not know that vaccination protect their children from diseases. 44% mothers are unaware of services of Lady Health Workers in their respective areas. Overall 56% of 14,467 families live in either Kacha or Kacha Pacca housing structures. Housing structures of 35% families is comprised of one room only. 5% housing structures are without electricity connections and without toilets. 4% families practice open defecation due to unavailability of toilets. Average users per toilet are highest in Quetta (10) and Peshawar (9). More than half (54%) of the caregivers work as daily wage workers for earning their living. Comparison of background characteristics between zero dose and fully immunized reflects weaker family situation of zero dose compared to fully immunized children. 43% zero dose children live in Kacha housing structures and 17% of them are found without toilets hence practice open defecation. In contrast only 15% fully immunized children live in Kacha housing structures and only 2% of them are without toilets. Similarly, 64% caregivers of zero dose children work as daily wage labour and 63% report debt burden on them. In contrast only 50% caregivers of fully immunized children work as daily wage labour and 53% report debt burden on them. Comparison of mothers’ education reflect similar results as 76% mothers of zero dose are illiterate compared to 47% mothers of fully immunized children.
Box 1: Major Inequities
Childhood Immunization 47% children are either zero dose or drop out 53% are fully immunized
Retention of Vaccination Card 44% children have vaccination cards.
Education Levels of Mothers 70% mothers are either illiterate or educated
between 1-5 grades.
Housing Structures 56% or more residents of slums live in vulnerable
housing structures i.e. Kacha or Kacha/Pacca structures.
Livelihood 54% families rely on daily wage labor for livelihood.
2
Chapter 1 Introduction
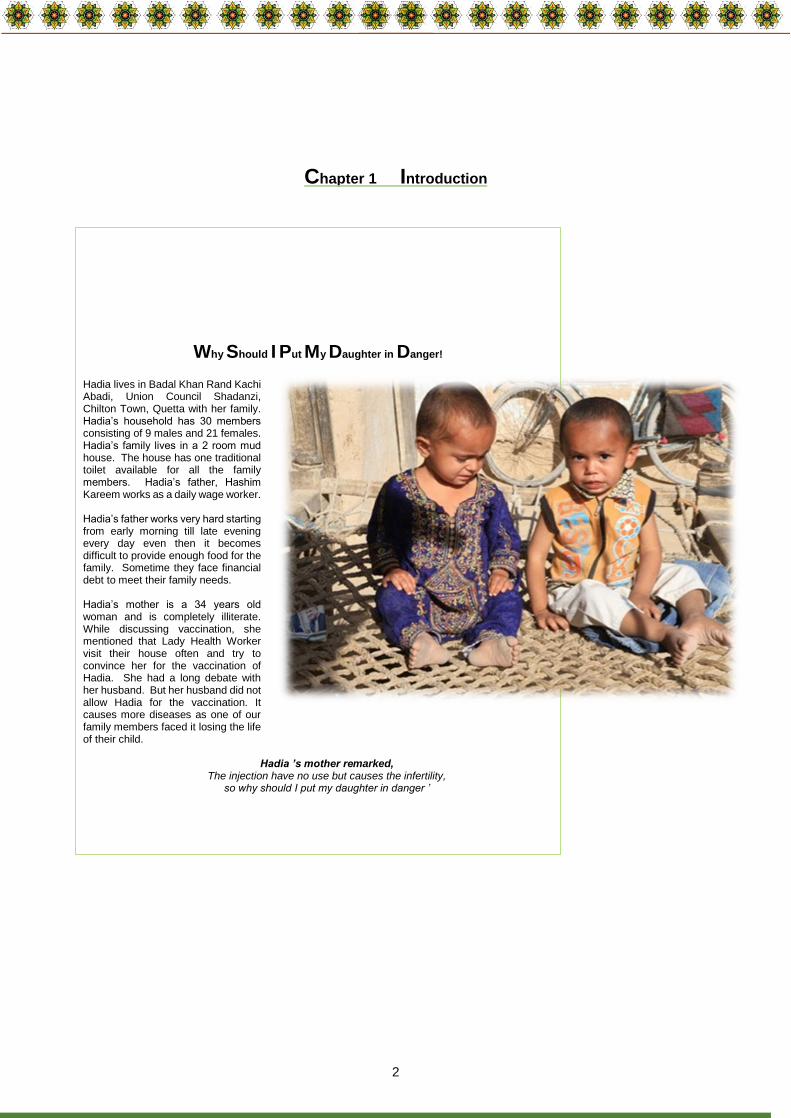
Why Should I Put My Daughter in Danger!
Hadia lives in Badal Khan Rand Kachi Abadi, Union Council Shadanzi, Chilton Town, Quetta with her family. Hadia’s household has 30 members consisting of 9 males and 21 females. Hadia’s family lives in a 2 room mud house. The house has one traditional toilet available for all the family members. Hadia’s father, Hashim Kareem works as a daily wage worker. Hadia’s father works very hard starting from early morning till late evening every day even then it becomes difficult to provide enough food for the family. Sometime they face financial debt to meet their family needs. Hadia’s mother is a 34 years old woman and is completely illiterate. While discussing vaccination, she mentioned that Lady Health Worker visit their house often and try to convince her for the vaccination of Hadia. She had a long debate with her husband. But her husband did not allow Hadia for the vaccination. It causes more diseases as one of our family members faced it losing the life of their child.
Hadia ’s mother remarked, The injection have no use but causes the infertility,
so why should I put my daughter in danger ’
3
Chapter 1: Introduction
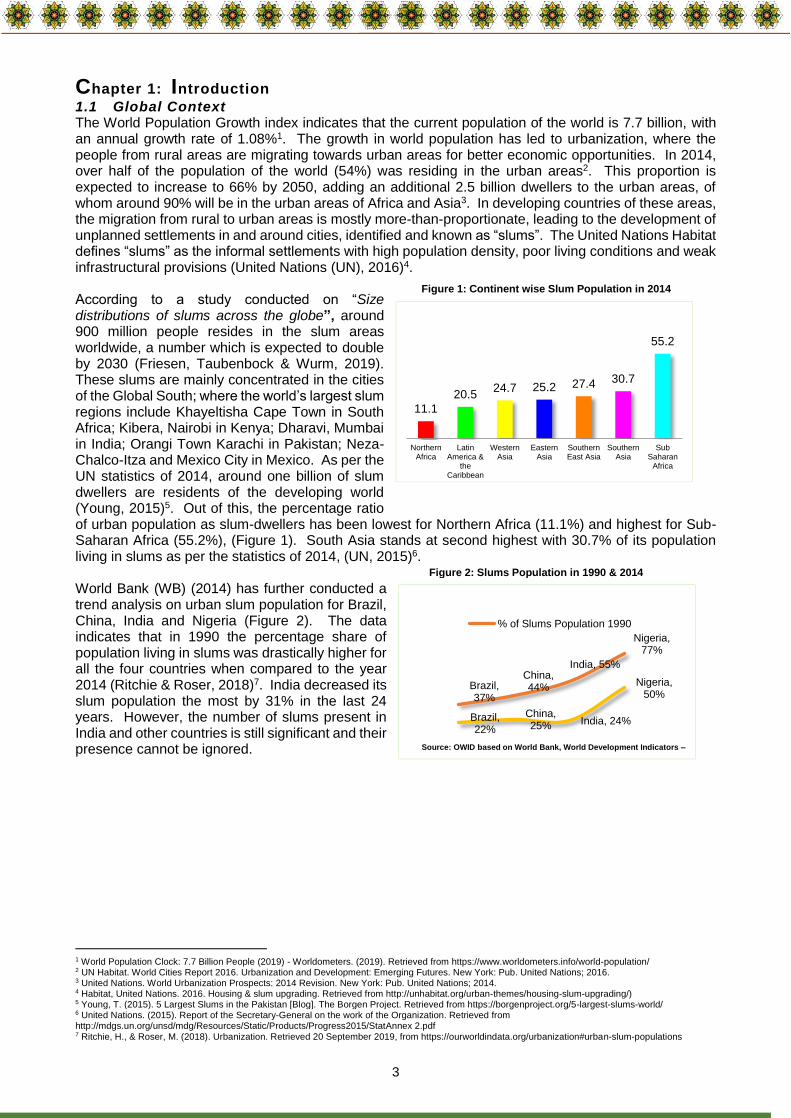
1.1 Global Context The World Population Growth index indicates that the current population of the world is 7.7 billion, with an annual growth rate of 1.08%1. The growth in world population has led to urbanization, where the people from rural areas are migrating towards urban areas for better economic opportunities. In 2014, over half of the population of the world (54%) was residing in the urban areas2. This proportion is expected to increase to 66% by 2050, adding an additional 2.5 billion dwellers to the urban areas, of whom around 90% will be in the urban areas of Africa and Asia3. In developing countries of these areas, the migration from rural to urban areas is mostly more-than-proportionate, leading to the development of unplanned settlements in and around cities, identified and known as “slums”. The United Nations Habitat defines “slums” as the informal settlements with high population density, poor living conditions and weak infrastructural provisions (United Nations (UN), 2016)4. According to a study conducted on “Size distributions of slums across the globe”, around 900 million people resides in the slum areas worldwide, a number which is expected to double by 2030 (Friesen, Taubenbock & Wurm, 2019). These slums are mainly concentrated in the cities of the Global South; where the world’s largest slum regions include Khayeltisha Cape Town in South Africa; Kibera, Nairobi in Kenya; Dharavi, Mumbai in India; Orangi Town Karachi in Pakistan; Neza-Chalco-Itza and Mexico City in Mexico. As per the UN statistics of 2014, around one billion of slum dwellers are residents of the developing world (Young, 2015)5. Out of this, the percentage ratio of urban population as slum-dwellers has been lowest for Northern Africa (11.1%) and highest for Sub-Saharan Africa (55.2%), (Figure 1). South Asia stands at second highest with 30.7% of its population living in slums as per the statistics of 2014, (UN, 2015)6. World Bank (WB) (2014) has further conducted a trend analysis on urban slum population for Brazil, China, India and Nigeria (Figure 2). The data indicates that in 1990 the percentage share of population living in slums was drastically higher for all the four countries when compared to the year 2014 (Ritchie & Roser, 2018)7. India decreased its slum population the most by 31% in the last 24 years. However, the number of slums present in India and other countries is still significant and their presence cannot be ignored.
1 World Population Clock: 7.7 Billion People (2019) - Worldometers. (2019). Retrieved from https://www.worldometers.info/world-population/ 2 UN Habitat. World Cities Report 2016. Urbanization and Development: Emerging Futures. New York: Pub. United Nations; 2016. 3 United Nations. World Urbanization Prospects: 2014 Revision. New York: Pub. United Nations; 2014. 4 Habitat, United Nations. 2016. Housing & slum upgrading. Retrieved from http://unhabitat.org/urban-themes/housing-slum-upgrading/) 5 Young, T. (2015). 5 Largest Slums in the Pakistan [Blog]. The Borgen Project. Retrieved from https://borgenproject.org/5-largest-slums-world/ 6 United Nations. (2015). Report of the Secretary-General on the work of the Organization. Retrieved from http://mdgs.un.org/unsd/mdg/Resources/Static/Products/Progress2015/StatAnnex 2.pdf 7 Ritchie, H., & Roser, M. (2018). Urbanization. Retrieved 20 September 2019, from https://ourworldindata.org/urbanization#urban-slum-populations
11.1
20.524.7 25.2 27.4 30.7
55.2
NorthernAfrica
LatinAmerica &
theCaribbean
WesternAsia
EasternAsia
SouthernEast Asia
SouthernAsia
SubSaharan
Africa
Brazil, 37%
China, 44%
India, 55%
Nigeria, 77%
Brazil, 22%
China, 25% India, 24%
Nigeria, 50%
% of Slums Population 1990
Source: OWID based on World Bank, World Development Indicators –
Figure 1: Continent wise Slum Population in 2014
Figure 2: Slums Population in 1990 & 2014

4
The comparison of these countries with Pakistan reveals that, Pakistan lists much lower in the number of urban slum settlements (Table ). However, when compared on the parameter of population growth between 1990 and 2014, it has been discovered that Pakistan has shown an increase in population growth for slums from nearly 16.79 million in 1990 to around 32.34 million in 2014 (Our World in Data, 2014). The conditions of slums in Pakistan in terms of population growth, health and immunization and social problems have been further investigated from the secondary data sources hereafter.
1.2 National Context 1.2.1 Population Growth The current estimated population of Pakistan is 212 Million8, making it the 5th most populous country of the world. According to the UN Population estimations, the population of Pakistan will reach to 242 Million by 20259. According to the estimation of UN for 2014, the slum population was 32 Million in urban areas of Pakistan10. Currently, 36.9% of the total population of Pakistan makes up urban population, which is expected to increase to 50.2% by 205011. The urban population is growing at the rate of 3% annually (Shaikh & Nabi, 2017). It is expected that the cities of Pakistan will accommodate 250 million people by the year 203012. The rapid urbanization can be seen in the increase on population of 8 largest cities of Pakistan in which 12.9 Million population (census 1998) has increased to 24.3 Million (census 2017). Highest population increase is noticed in Lahore where population increased from 5 Million to 11 Million. Smallest cities like Quetta and Islamabad also shows double population growth. Considering the growth rate of urban population of present day, the slum population is likely to increase even further by 2030 in absence of proper urban planning1314. To improve the living conditions of these settlements and to meet the Sustainable Development Goals, an improvement in the health and socioeconomic conditions of the slum-dwellers is required. However, a better understanding of the individual slum environment and the factors contributing to poor health conditions is essential to be taken into account to maintain a balance between the demand and supply of health services for the slum-dwellers. The social inequities are also to be evaluated to target the areas of improvement for slum-dwellers.
1.2.2 Status of Health
Studies on the levels of immunization coverage in Pakistan reveals that the coverage has remained lower15 for urban poor, including slum residents, when compared to rural poor16. Although the Pakistan Demographic and Health Survey (PDHS) for 2018 indicates that the 66% of children age 12-23 months have received all basic vaccinations. The coverage data is bifurcated by urban and rural areas, province-wise but it does not specifically highlight the disparities of the slum areas in these provinces. However, marginalization, both ethnic and economic, low awareness level including carelessness of caregivers and inaccessibility to the healthcare centers have been identified as the major reasons for low immunization coverage in the slums17. Some of the interventions like awareness programmes, community engagements, vaccination campaigns and medicine coupon incentives have yielded results in Pakistan to overcome health related issues of slums, (Crocker-Buque, Mindra, Duncan & Mounier-Jack, 2017).
8 World Bank. (2019). Population Total. Retrieved from https://data.worldbank.org/indicator/SP.POP.TOTL?locations=PK 9 United Nations, Department of Economic and Social Affairs, Population Division (2019). World Population Prospects 2019, custom data acquired via website. 10 UNMDGs. (2019). Retrieved from mdgs.un.org 11 United Nations, Department of Economic and Social Affairs, Population Division (2018). World Urbanization Prospects: The 2018 Revision. 12 Shaikh, H., & Nabi, I. (2017). The six biggest challenges facing Pakistan’s urban future. Pakistan’s Growth Story. Retrieved from https://pakistangrowthstory.org/2017/01/10/6-challenges-facing-pakistans-urban-future/ 13 Ibid. 14 Buque, Mindra & Duncan, T. (2016). Immunization, urbanization and slums: A review of evidence. UNICEF. 15 Ibid 16 Gotlife.gavi.org 17 Aleemi, A. R., Khaliqui, H., & Faisal, A. (2018). Challenges and patterns of seeking primary health care in slums of Karachi: a disaster lurking in urban
shadows. Asia Pacific Journal of Public Health, 30(5), 479-490.
Table 1: Slum Population in 1990 & 2014
Countries Slum Population in Millions in 1990
Slum Population in Millions in 2014
China 130.87 187.06
India 122.04 100.50
Nigeria 21.86 41.58
Brazil 40.52 38.91
Pakistan 16.79 32.34

5
1.3 Punjab 1.3.1 Population Growth According to Pakistan Economic Survey (2018-19), Punjab is the most populous province of Pakistan and accounts for 110 Million of population for the year 201718. The second largest city of Pakistan, and the capital of Punjab Lahore, has roughly 30% of the settlements as slums (Abubakar, 2016)19. The slums of Lahore are home to an estimated population of 1.7 million people (National Report of Pakistan for Habitat III, 2015). The proportion of urban slum population in Lahore has reached the upper limit threshold of the city’s total population. It has a population density of 400 persons/km (National Report of Pakistan for Habitat III, 2015). In case of the slums of Faisalabad, the number of slum-dwelling units ranges from 42 to 2,851 (Ahmed, Mustafa & Khan, 2015)20. Lahore has approximately 308 informal settlements or slums (National Report of Pakistan for Habitat III, 2015)21. Faisalabad ranks as the third most populous city of Pakistan and it is a home to 104 slums (Ahmed, Mustafa & Khan, 2015)22. 1.3.2 Status of Health A study conducted on 104 slums of Faisalabad indicates that 84% of the children are vaccinated and have received any dose of vaccine; whereas, 3.3% of the children are not vaccinated. On the other hand, 12% of the respondents are without any knowledge of vaccination22. Another study is conducted on the slums of Bahawalpur where out of the 306 children surveyed, only 26% have the vaccination cards. The highest coverage is for BCG vaccine. First dose against measles is received by as many as 84% of the children; whereas, second dose is received by only 42% of the children. 59% mothers of the children who have completed their vaccination schedule are educated over intermediate level23.
1.4 Sindh
1.4.1 Population Growth Sindh is situated in the southeast of the country and is one of the four provinces of Pakistan. By area, it is the third largest province of the country and is second largest in terms of population. Sindh is the most urbanized province of Pakistan with around 52% population residing in the urban areas (Noh, 2018)24. According to 2017 Census of Pakistan, the population of the Sindh province is 47.89 million; whereas Karachi has a population of 14.9 million, which is projected to increase to 18.7 million by 2025 (Pakistan Bureau of Statistics, 2017)25. The population density for the city of Karachi is approximately 6,000 people per square kilometer. In the year 2016, UN ranked Karachi as the 12th top megacity by size in the world, the number which is expected to rise to 7th by 2030 (Sparkman, 2018)26. Hyderabad, on the other hand is the fourth-largest city in Pakistan with the population of 1.73 million. Hyderabad is the second most urbanized city of Sindh with around 80% of the people living in the cities27. Karachi and Hyderabad are key focus areas when it comes to unplanned urbanization and are the home to around 1,300 slums. About 70% of these slums are situated in 18 towns of Karachi, whereas, the remaining 25-30% slums are located in four towns of Hyderabad28. According to a detailed study conducted on “Challenges and patterns of seeking primary healthcare in slums of Karachi: A disaster lurking in urban shadows” it has been highlighted that there are more than 600 slums in Karachi. Karachi is also a home to the largest slum in Asia i.e. Orangi Town with the estimated population of 2.4 Million29.
18 Pakistan Economic Survey 2018-19, Ministry of Finance, Government of Pakistan. Retrieved from: http://finance.gov.pk/survey/chapters_19/Economic_Survey_2018_19.pdf 19 Abubakar, M. (2016). Women and slums. Retrieved 21 September 2019, from http://www.lead.org.pk/lead/postDetail.aspx?postid=326 20 Ibid. 21 National Report of Pakistan for HABITAT III. (2015). Islamabad. 22 Ahmed, R., Mustafa, U., & Khan, A. (2015). Socio-economic Status of Transferred and Non-transferred Urban Slums: A Case Study from Faisalabad. The Pakistan Development Review, 54(4I-II), 947-962. doi: 10.30541/v54i4i-iipp.947-962 23 Badar, S., Qadri, S., (2016). Childhood Immunization in Slums of Bahawalpur City. Journal of University Medical and Dental College. 7 (2). 35-40. 24 Noh, J. (2018). Factors affecting complete and timely childhood immunization coverage in Sindh, Pakistan; A secondary analysis of cross-sectional survey data. PLOS. 25 Sparkman, G. (2018). Challenges of slum life in Orangi Town, Karachi, Pakistan. Sparkman Center for Global Health. 26 Sparkman, G. (2018). Challenges of slum life in Orangi Town, Karachi, Pakistan. Sparkman Center for Global Health. 27 Sparkman, G. (2018). Challenges of slum life in Orangi Town, Karachi, Pakistan. Sparkman Center for Global Health. 28 Khawar, H. (2019). A virulent strain. [online] DAWN.COM. Available at: https://www.dawn.com/news/1514595 [Accessed 15 Nov. 2019]. 29 Aleemi, A. and Khaliqui, H. (2019). Challenges and Patterns of Seeking Primary Health Care in Slums of Karachi: A Disaster Lurking in Urban Shadows. Asia Pacific Journal of Public Health, pp.1-12.

6
1.4.2 Status of Health The Multiple Indicator Cluster Survey (MICS) survey of 2014 for the Sindh province reveals that the vaccination coverage for Measles 1 in Karachi was 65.3%; whereas, it was 62.9% for Hyderabad. According to the study of Aleemi and Khalique (2018), the coverage rates are even lower for urban slums30. The study formulates that in the sample population of 400 people from 8 slums of Karachi, only 11.7% of the respondents reported the visits by Lady Health Workers (LHWs). The regular visits of LHWs in the slum communities is important because these health workers educate and promote healthy behavior and provide basic curative healthcare services. In the slum areas, where the level of education and awareness is already low, the absence of LHWs is an alarming sign, which demands immediate attention. The study further formulates that 75% of the sample population is not vaccinated for hepatitis and tetanus against 23% of the population which has received vaccination31. The reasons for no vaccination are reported to be inaccessibility, unawareness, cost and family belief system. The slums are prone to communicable diseases due to unhygienic living conditions and poor waste disposal system and therefore attention needs to be paid to improving coverage rates for routine immunization. According to the recent findings of Emergency Operation Centre (EOC) for Polio in Sindh, the vaccination coverage demands special attention in the province since 6 new cases of polio are reported in the province, out of which 3 have occurred in Karachi, whereas, two were present in Hyderabad32. Systematic approach to healthcare and vaccination coverage is required to solve the healthcare related problems of the province. 1.5 Balochistan 1.5.1 Population Growth Quetta is the largest City and the Provincial Capital of Balochistan, Pakistan. The city shars its boundaries with Pishin district in the north, Ziarat in the East, Mastung in the South and Afghanistan in the West. The city is located near the Bolan Pass, which is among one of the major gateways from Central Asia to South Asia. The City is known as the “Fruit Garden of Pakistan” due to various fruit orchids in and around the city. As per the National Census of 2017, the population of Quetta City is One Million and the population of Quetta District is Two Million. Quetta is the most urbanized city of Balochistan and hosts 29% of all urban population of the province33. Though Balochistan is the largest province by area, the population of the province is the lowest at 7.7 million and is thinly dispersed around the province. The Quetta city accommodates multiple ethnic groups including Pashtuns, Baloch, Brahvi, Hazara and Punjabi and is enriched with cultural and language diversity. The multi-dimensional poverty at headcount for Quetta stands at 46% and the Average Intensity of Deprivation is 46%, thus making poverty rate in Quetta the highest among all provincial capitals of Pakistan34. Furthermore, about 17% of the population is living below poverty line in this city35. The literacy rate stands at 66% in Quetta city, however, there is a noticeable difference between literacy rates, and female literacy stands at 83%36. Major challenges of Quetta city are exponential growth-rate, lack of resources and city planning for managing a large influx of economic migrants and those affected by natural disasters or conflict. Poor access to health and Expanded Programme on Immunization (EPI) services, safe water and almost non-existent drainage system also pose serious health risks as cited by different researchers.
30 MICS, S. (2014). MICS Survey. [online] Mics-surveys-prod.s3.amazonaws.com. Available at: https://mics-surveys-prod.s3.amazonaws.com/MICS5/South%20Asia/Pakistan%20%28Sindh%29/2014/Final/Pakistan%20%28Sindh%29%202014%20MICS_English.pdf [Accessed 15 Nov. 2019]. 31 Aleemi, A. and Khaliqui, H. (2019). Challenges and Patterns of Seeking Primary Health Care in Slums of Karachi: A Disaster Lurking in Urban Shadows. Asia Pacific Journal of Public Health, pp.1-12. 32 Khuhro, N. (2019). Over 120,000 children in Sindh left unvaccinated per campaign: report - Daily Times. [online] Daily Times. Available at: https://dailytimes.com.pk/472464/over-120000-children-in-sindh-left-unvaccinated-per-campaign-report/ [Accessed 15 Nov. 2019]. 33 State of Pakistani Cities, 208 34 http://www.pk.undp.org/content/dam/pakistan/docs/MPI/MPI%204pager.pdf 35 Geography of Poverty and Public Service Delivery in Pakistan. Research Brief April 2017, Pakistan Poverty Alleviation Fund 36 http://emis.gob.pk/Uploads/QUETTA%20DISTRICT%20EDUCATION%20PLAN%20FOR%202016-2017%20TO%202020-2021.pdf

7
The housing structures accommodating over 800,000 residents of Quetta lack the facilities and infrastructure for adequate drainage and sanitation37. While the situation of disposal and drainage of wastewater in the city remains poor, drainage system in the slums is almost non-existent 38. The provision of safe water is available to only 39% of the households39. Water is found to be scarce due to which a majority of residents end up paying private vendors for their water-supply40. To assess the quality of consumable water, a study was conducted in 16 different locations of Quetta, which revealed high contamination in tap water owed to the seepage and leakage of the water supply and sewer lines41. Furthermore, fecal contamination of drinking water is known to cause 30% of all diseases42. There are 47 identified slum areas as per the records of the Katchi Abadi Directorate43, although the actual numbers are higher than this. These slums are mostly accompanied by temporary houses (mud houses) with substandard basic and health facilities44. The slum areas are highly populated with poor or no infrastructure45. The slum dwellers of Quetta lack accessibility to basic resources and are living far beyond the standards laid down by the Sustainable Development Goals (SDGs). 1.5.2 Status of Health Comprehensive Multi Year Plan (cMYP) Balochistan 2014-2018 depicts acute shortage of health personnel in Quetta46. To address the health needs, there are 07 health programmes that are running in Quetta city, namely TB (Tuberculosis) Control Programme, Malaria Control Programme, Hepatitis Prevention Control Programme, AIDS (Acquired Immune Deficiency) Control Programme, National Programme on Family Planning and Primary Healthcare and National, Maternal, Newborn & Child Healthcare Programme47. Among the most common diseases reported by the health facilities are Respiratory Tract Infections, Gastrointestinal, Urinary Tract Infection and Diarrhea/ Dysentery, whereas other communicable diseases include Malaria, Meningitis, Fever and Scabies48. In terms of immunization, the Pakistan Social Living Measurement Survey (PSLM) for the year 2014-2015 reveals 65% of children aged 12-23 months in Quetta (recorded both by record ad recall) have received all basic vaccination, with the low coverage rates of 52% in rural areas and comparatively high rates of 71% in urban areas. Although 94% of the children in Quetta have received at least one vaccination, there are marked differences in the immunization status of first and third doses of Diphtheria Pertussis & Tetanus (DPT), Polio and Hepatitis B. About 28.5% children of age 12-23 months have received their first dose of BCG, while 54.2% and 13% have received doses of Polio and Hepatitis B vaccines respectively and 18% have received vaccination for measles. Balochistan Comprehensive Development Strategy (2013-2020) reveals that the health sector of the province has extremely underperformed in the last decade. The poor performance has been attributed to financial deficit of the province. The detailed evaluation of the health sector of the province indicates that the biggest challenge faced by the province is related to primary and preventive healthcare specifically in the context of mother and childcare. The study indicates that only 26% of the deliveries of the mothers in the province take place at designated health facilities, a figure 10% lower than the rest of the provinces. In the rural areas of Balochistan, over 80% deliveries by mothers take place at home and by untrained attendants increasing the risk of mother and child mortality. The sparsely populated and sparsely developed province contributes to the problems of access to health facilities.
37 Urbanization Challenges in Balochistan, 2015. Pakistan Urban Forum, The Urban Unit 38 http://www.balochistan.gov.pk/index.php?option=com_content&view=article&id=839&Itemid=1087 39 Pakistan Economist 40 State of Pakistani Cities, 2018 41 Khattak M I. (2011). Study of Common Inorganic Anions in Water Samples of Quetta City By Technique Of Ion Chromatography. Sci.Int. (Lahore).23(2):135–141. 42 Aziz J A. (2005). Management of source and drinking-water quality in Pakistan. Eastern Mediterranean Health Journal. 11(5-6):1087–98 43 Qutub, S.A.; Salam, N.; Shah, K. and Anjum D. (2008). Community-based sanitation for urban poor: the case of Quetta, Pakistan 44 Growth of slum areas on rise in Baochistan. Pakistan Economist, Sep 11, 2017. 45 Huma Batool.; Mega cities And Climate Change Sustainable Cities in a Changing World. LEAD Pakistan. 46 Comprehensive multi-year plan 2014-2018. Islamabad, Expanded Programme on Immunization, Balochistan 47 http://www.ndma.gov.pk/Publications/Development%20Profile%20District%20Quetta.pdf 48 http://www.ndma.gov.pk/Publications/Development%20Profile%20District%20Quetta.pdf

8
The conditions of prenatal and postnatal care delivery is also quite dismal for the province of Balochistan. Urban areas of Balochistan reveal only 55% cases of prenatal consultation, whereas, these figures drop further in the urban slums and for rural areas. The postnatal care reception is also poor for the province and only 31% of pregnant women in the province receive Tetanus Toxoid (TT) injections. Pertaining to these alarming statistics, the PDHS 2006-2007 reveals that the Mother Mortality Rate (MMR) was highest for Balochistan among four provinces at 785 maternal deaths per 100,000 births. According to the MICS report of 2010, the Infant Mortality Rate (IMR) of Balochistan is also the highest among all the other provinces of the country. IMR is reported to be 89 per 1000 live births against the Millennium Development Goals (MDGs) targets of 52 per 1000 births. As per the PSLM results of 2010-2011 the overall immunization coverage rate for Balochistan is only 45% for the children under 5 years of age when compared to Punjab (86%), Khyber Pakhtunkhwa (77%) and Sindh (67%). When checked for BCG coverage of the province, the results reveal that the coverage for 12-23 months of children is only 35%, Polio 1 has been administered to 61% of the children, a figure that dipped to 46% for Polio 3 (MICS, 2010). Decently polio epidemic has reemerged in Pakistan. As per the report by Independent Monitoring Board of the Global Polio Eradication Initiative, for Balochistan, the majority of the cases for Balochistan occur in three major areas: Pishin, Killa Abdullah and Quetta. As for the status on child health, it is reported that for every 1,000 live births, 59 babies do not survive up to their first birthday and another 12 die before reaching the age of 5 years49. The prevalence of water-borne disease indicates 44% of the households are affected by Diarrhea, 25% by Gastrointestinal, 21% by Cholera, 5% by Typhoid and 3% by other common diseases50. 1.6 Khyber Pakhtunkhwa 1.6.1 Population Growth According to the 2017 Census of Pakistan, the population of Peshawar is 1.97 million distributed into four towns, which are further distributed into 79 Union Councils (UCs). With the highest annual growth rate of 4% in the province, the city has seen a rapid increase in population, with huge influx of Afghan refugees. According to estimates out of 80% of the afghan refugees living in Khyber-Pakhtunkhwa, 60% resides in Peshawar valley (United Nations High Commissioner for Refugees (UNHCR), 2012). Displaced populations having low financial resources tend to settle in and around the city in squatter settlements (Katchi Abadis). Besides Afghan refugees being the main reason of slum formation in Peshawar, the floods of 2005 made 3.5 million homeless, causing destruction of more than 600,152 houses (United Nations Human Settlement Programme (UN-Habitat)-III, 2015)51. A study of UN-Habitat52, identified 18 informal settlements in Peshawar city. It constitutes about 15% of the total population of Peshawar with the estimated population of 250,00053, although the actual number of people living in slums are higher than this54. As some of the studies report that slums and squatter settlements almost constitute 50-60% of the city.55
1.6.2 Status of Health Unhygienic living condition, open defecation and lack of access to clean drinking water are a root cause of diarrheal diseases and together contribute to about 1.5 billion deaths of children below 5 years of age (UN 2007). Slums are considered to be the incubator and transmitter of infectious diseases. Tuberculosis is also reportedly prevalent in congested and densely populated slums, malaria diarrhea and respiratory infections are common among slum dwellers and children are more exposed to these diseases (Fernando 2010).
49 http://www.ndma.gov.pk/Publications/Development%20Profile%20District%20Quetta.pdf 50 Butt, M., & Khair, S. M. (2016). Cost of illness of water-borne diseases: a case study of Quetta. Journal of applied and emerging sciences, 5(2), pp133-143 51 National Report of Pakistan for HABITAT III. (2015). Islamabad 52 District Disaster Management Plan Peshawar. (2017). Retrieved 25 September 2019, from http://kp.gov.pk/uploads/2018/08/DDM_Plan.pdf UNHCR (2012) KP and FATA IDP Statistics (As of 01 Dec 2012). 54 DDM Plan peshawar - Khyber Pakhtunkhwa. Accessed From: http://kp.gov.pk/uploads/2018/08/DDM_Plan.pdf 55 The walled slums : Through the looking glass into Peshawar’s belly, Accessed From: https://tribune.com.pk/story/704975/the-walled-slums-through-the-looking-glass-into-peshawars-belly/

9
With the residents living in extremely poor living conditions, the incidents of disease remain high in Peshawar. A study conducted by Urban Unit Khyber Pakhtunkhwa in the selected slums of Peshawar revealed 74% of the frequently occurring diseases are linked to unhygienic living conditions. It was also revealed that 72% of these diseases were found in children. For health services, 74% of the residents use public health facilities while 30% seek services from private health care units. A study on measles vaccination reported immunization coverage of 58% in children of age 1-2 years in Peshawar with no major gender disparity56. For better understanding of the reasons for its low prevalence, this study also revealed mother’s education as a strong factor affecting the vaccination coverage, which was found to be low for children with illiterate mothers (36%) and considerably higher (83%) for children having literate mothers. Despite all the factors, levels of immunization in slums of Pakistan have remained low57. The main cause of low levels of immunization is lack of awareness and proper policies. Lack of mother’s education regarding child’s health and diseases like measles, polio, TB, typhoid, lead to high child mortality rates58. Hence maternal knowledge is equally important in preventing children from diseases (National Disaster Consortium (NDC), 2019)59. Interventions like awareness programs, community engagements, and vaccination campaigns, medicine coupon incentives are some of the initiatives taken by Government of Pakistan to overcome health issues of slums (Crocker-Buque, Mindra, Duncan & Mounier-Jack, 2017). 1.7 Islamabad Islamabad is the Federal capital of Pakistan and is located within the Federal Islamabad Capital Territory. According to World Population Review, the population of Islamabad is 1,095,06460. The trend analysis for population growth for the city reveals that by 2020, the city population will be almost 1.7 million and it is expected to exceed 2.2 million by the year 2030 (Review, 2019).
1.7.1 Population Growth Islamabad has also seen a proliferation in its slum development in the last two decades. About 20 years ago, there were only 12 slums in and around the city; whereas, the number is now at more than 4261. The areas in and around Sihala, Tarnol, Rawal Dam, Bani Gala, Barakahu and Golra have seen an evident surge in the population and the number of slums62. Analysis of the rapid urban development in Islamabad further reveals that the expansion of new slums, along with the old ones are appearing in the sectors like I-12 and I-14, which will further stress the already dwindling natural resources of the city. It has been estimated that more than 0.1 million people reside in more than two dozen slums situated around sectors G-7, H-9, F-6, F-7, I-11 and I-1263. Additionally, a study by Leadership for Environment and Development (LEAD) refers to the three slums of Islamabad named, Chora Stop Slum, Akram Gill Colony, and Mera Jaffar Slum64 with the approximate population as 5,000, 2,000 and 1,000 respectively. It is significant to note that a dozen of these slums are legally occupied by their inhabitants and are given ‘ownership’ rights by the courts65. However, everyday amenities, including clean water and sanitation, gas and electricity are unavailable to many of them. Absence of basic facilities has led to poor health conditions, social and economic disparities in these slums.
56 Rehman, H., Mahesar, A. L., Khalid, S. N., & Ishaq, M. (2014). Assessment of Measles Immunization in Children 1-2 Year Age in District Peshawar, Khyber Pakhtunkhwa Pakistan. In Medical Forum (Vol. 25, No. 10, pp. 50-51). 57 Haider, S. (2017). Growth of Slum Areas on the rise in Baluchistan. Pakistan Economist. 58Crocker-Buque, T., Mindra, G., Duncan, R., & Mounier-Jack, S. (2017). Immunization, urbanization and slums – a systematic review of factors and interventions. BMC Public Health, 17(1). doi: 10.1186/s12889-017-4473-7 59 Natural Disasters Consortium (NDC)., 2019. Balochistan Drought Needs Assessment 60 Review, W. (2019). World Population Review. [online] Worldpopulationreview.com. Available at: http://worldpopulationreview.com/world-cities/islamabad-population/ [Accessed 17 Oct. 2019]. 61 Qureshi, Z. (2018). Concern over proliferation of slums in Islamabad. Gulf News Asia. 62 Butt, T. (2017). Islamabad — a city with maximum slums. [online] Thenews.com.pk. Available at: https://www.thenews.com.pk/print/227624-Islamabad-a-city-with-maximum-slums [Accessed 17 Oct. 2019]. 63 Mohal, S. (2018). Slums continue to mushroom across Islamabad. [online] Pakistantoday.com.pk. Available at: https://www.pakistantoday.com.pk/2018/05/28/slums-continue-to-mushroom-across-islamabad/ [Accessed 17 Oct. 2019]. 64 Quadri, F., Nasrin, D., Khan, A., Bokhari, T., Tikmani, S., & Nisar, M. et al. (2013). Health Care Use Patterns for Diarrhea in Children in Low-Income Periurban Communities of Karachi, Pakistan. The American Journal of Tropical Medicine and Hygiene, 89(1_Suppl), 49-55. doi: 10.4269/ajtmh.12-0757 65 65 Mohal, S. (2018). Slums continue to mushroom across Islamabad. [online] Pakistantoday.com.pk. Available at: https://www.pakistantoday.com.pk/2018/05/28/slums-continue-to-mushroom-across-islamabad/ [Accessed 17 Oct. 2019].

10
1.7.2 Status of Health According to PDHS (2017-18), all basic vaccinations are provided to 67.8% residents of Islamabad66. A study on the reasons of incomplete vaccination in children of Islamabad, sampled 803 children, of which 70.6% were completely vaccinated, 4.1% had ongoing status on vaccination, another 4.4% were partially vaccinated; whereas, 20.7% had never been vaccinated67 (zero dose). Most of the zero-dose children had uneducated parents, or those who had received education up-to primary level only. 15.4% of the parents were unaware about the need for vaccination or about the existing EPI. 84.3% of the parents were not acquainted about the existence of vaccinators in their area. 64.7% of the parents of zero-dose children report long waiting hours, ranging between 04-05 hours, as the major reason for not vaccinating their children. 55.3% of the parents were apprehensive of the long distance to the health facility68. Around 40% of the parents of zero-dose children had trust issues when it comes to vaccination or vaccinator; whereas 38% reported the regular absence of vaccinator from their health facility69. The findings of the study indicate that an improvement is needed in the provision of vaccination facilities so that they are more accessible to the underprivileged residents of slums. Moreover, awareness about the need for vaccination in the prevailing unhygienic living conditions of slums are essential for the urban poor.
66 All basic vaccination includes; BCG, three doses of DPT-HepB-Hib (pentavalent), three doses of oral polio vaccine (excluding polio vaccine given at birth), and one dose of measles. 67 Shah, H. and Pervaiz, S. (2016). Reasons for Incomplete Vaccination in Children of Rawalpindi and Islamabad. 68 68 Shah, H. and Pervaiz, S. (2016). Reasons for Incomplete Vaccination in Children of Rawalpindi and Islamabad. 69 69 Shah, H. and Pervaiz, S. (2016). Reasons for Incomplete Vaccination in Children of Rawalpindi and Islamabad.

11
Chapter 2: Methodology
There Is No Use To Put Our Children At Risk!
Rehan, the youngest of all is one year old and have only been given the BCG. Rehan lives with his parents and three siblings in Faqeerabad Kachi Abbadi located in Union council Kot Habib ullah, Nadirpur Town of district Gujranwala. Rehan lives in a small Kacha Pacca house of two rooms. Rehan’s father (Sakhawat) works as a daily wage worker and earn a small amount for living. Rehan’s family manage their daily life needs with great difficulty due to limited income. Rehan’s mother is 27 years old and have never been to school. Her four children are in between the ages of 1 year to 8 years that keeps her very busy for whole day.
According to Rehan’s mother! ‘These vaccination do not have any benefit but rather have negative agenda to harm health of
small children. All my children are very healthy without
vaccination and there is no use to put my children at risk’

12
Chapter 2: Methodology
This part describes the detailed methodology adopted for the coverage survey. This methodology was designed in close consultation with the UNICEF Pakistan Country Office, UNICEF Pakistan Field Office and Provincial Expanded Programme on Immunization (EPI) Cell. The process was made participatory and engaging for having community driven perspectives. The methodology was finalized according to the security situation and local context. 2.1 Study Design The following four key activities were conducted for the purpose of this study (Figure 1). 2.2 Study Sites The study was conducted in the slums / underserved areas located in 1070 largest cities of Pakistan. The administrative structure of Pakistan distributes the country into four provinces and Islamabad, Azad Kashmir and Gilgit Baltistan as federally administered areas. The provinces are further distributed into districts. Each district is distributed into multiple towns (tehsils), which are further distributed into union councils. Each union council has 5 to 15 villages/areas depending on the context and rural/urban settings in each province. Previously, the performance of the country against health indicators used to be assessed either at the provincial level and or at the district level. Gradually it has been realized that the performance needs to be monitored at the administrative unit level, which is union council. 2.3 Study Duration This study was conducted between 2018 and 2019 with different intervals. Overall it took about 12 months period to complete the survey. 2.4 Study Respondents Mothers of children aged 12-23 months old were study respondents. Questionnaire comprised of closed ended and open ended questions was utilised for holding individual interviews of mothers.
2.4.1 Inclusion Criteria
Mothers of living children aged 12-23 months and residents of slums/underserved areas.
2.4.2 Exclusion Criteria
Mothers of living children aged less than 12 months or more than 23 months and residents or non-residents of slums/underserved areas.
70 Karachi, Hyderabad, Quetta, Peshawar, Islamabad, Lahore, Faisalabad, Multan, Rawalpindi and Gujranwala
1. Sampling
4. Data entry, analysis and
Reporting
2. Mapping of buildings and
children aged 12-23 months
3. House-to-House
Interviews of Mothers
Figure 1: Key Activities in the Study

13
2.5 Sampling Procedures & Sample Size The coverage survey was conducted to determine the childhood immunization rates by the study team. This background information about the households and respondents were also collected (Figure 2). The correlations of the following three broader categories:
i. Vaccination coverage in children ii. Characteristics of the mothers and households iii. Vaccination coverage in children aged 12-23 months old
were undertaken to comprehend the real reasons of high / low or no coverage rates in the slums / underserved areas. 2.5.1 Sampling Methodology This was conducted according to the methodology of World Health Organization (WHO). The following six points were utilized in calculating the sample size for this coverage survey. 1. Penta 3 coverage rates from 3rd party sources 2. Effective Sample Size (ESS) 3. Design Effect Factor (DEFF) 4. Estimation of number of children aged between 12 and 23 months 5. Calculation of inflation or no response 6. Steps for determining sample size and cluster 2.5.1a. Penta 3 Coverage Rates The city was taken as an independent stratum and Pakistan Demographic and Housing Survey 2017-18 was used for using Penta 3 coverage rates. The following coverage rates for Penta 3 were utilised for calculating the sample size.
Table 2: Penta 3 Coverage Rates for Each City
Cities Penta 3 Coverage Rates Sources for the Coverage Rates
Rawalpindi 80% PHS II
Multan 90% PHS II
Gujranwala 75% PHS II
Lahore 80% PHS II
Faisalabad 75% PHS II
Islamabad 90% PDHS 2017-18
Peshawar 80% Khyber Pakhtunkhwa Health Survey 2017
Quetta 50% MICS 2010
Karachi 69% Admin source for the period Jan-June 2019
Hyderabad 54% MICS 2014
2.5.1b. Calculation of Effective Sample Size ESS was determined through expected coverage and desired precision level was set at 95 percent Confidence Interval (CI) as per Table B - 1, Page 118, WHO reference manual.
A. Vaccination Coverage in Children
A1. Vaccination Cards
A2. Fully Immunized
A3. Antigen wise Coverage
A4. Zero Dose
A5. Reasons of Zero Dose
A6. Prefered Channels of Communication
B. Characteristics of Mothers
B1. Age
B2. Educational Levels
B3. Employment
C. Characteristics of Households
C1. Language
C2. Housing Structures
C3. Access to Water
C4. Access to Toilets
C5. Primary Occupations
Figure 2: Key Elements for Background Information of Respondents
households

14
2.5.1c. Design Effect Factor Post measles campaign design effect factor calculated for the 3rd party survey 2018 was utilized as a basis for calculating the sample size. The following table presents the design effect utilised for calculating sample size for each city:
Table 3: Post Measles Survey Design Effect
Cities Design Effect
Rawalpindi 2.7
Multan 2.7
Gujranwala 2.7
Lahore 2.7
Faisalabad 2.7
Islamabad 2.1
Peshawar 4
Quetta 6.4
Karachi 2.1
Hyderabad 3.4
2.5.1d. Estimation of Number of Children Aged between 12 and 23 Months The number of children aged between 12 and 23 months were determined by using the 3.5 percent of the total population are children between 0 and 1 year and 3.5 percent are between 1 and 2 years. The estimation of the number of 12-23 months old children was calculated as follows:
= Percentage of 12 – 23 months children in 100 household = 100 / 3 / 6.5 = 5 = This means that from every 5th to 6th house one child will be available = If the required # of children were not available in a cluster, new clusters were included and existing cluster was stopped.
2.5.1e. Calculation of Inflation or No Response Inflation or No Response factor from households was calculated by using the following formula mentioned in WHO manual. This factor is usually intended to include additional houses in case a child is not available at a set interval or has refused to participate. In order to overcome this, additional houses were also listed and profiled. The inflation or no-response factor was calculated as follows: No Response = 100 / 100 – P (Household Did not Respond)
= 100 / 100-5 = 1.05
2.5.1f. Calculation of Sample Size and Clusters Calculation of sample size was done once the DEFF and ESS, including No Response Inflation factor were all set. The following steps were undertaken to ascertain the sample-size: Total Completed Interviews = # of strata X ESS target from table B of WHO guidelines X DEFF71 Total Households to be visited to get the Target # of Households to be interviewed = ESS X DEFF X household to find a child X no response inflation factor Number of Households to Visit per Strata = ESS X DEFF X household to find a child X no response inflation factor Number of Clusters = ESS X DEFF / Household to be interviewed per cluster Total Households to Visit per Cluster = Household to find a child X no response inflation factor X household to be interviewed per cluster.
71 Taken from Post Measles Campaign Analysis by WHO

15
2.5.2 Sampling Procedure: The slum was taken as a cluster. The following steps were undertaken during survey taking: a. City-wise lists of slums located in all urban towns were organized in an ascending order on the basis
of population; b. The random number for selecting slum was calculated by dividing the total slums by total clusters; c. After knowing the random number e.g. 2 or 3 or 4 or 5, every 2-5th slum of each town was picked up
for mapping and listing; d. Maps were prepared for each selected slum (cluster). The buildings including government schools
were numbered and marked. Maps of the areas/clusters/slums were prepared, and residential buildings were marked for the listing of the households;
e. Then by throwing the pencil on the map, the residential block was selected randomly; f. The selected block was listed, and number of children were also listed; g. List of minimum 80 to 150 houses were prepared; h. The total listed households were divided by 15 to calculate the random number for selecting a
household for checking availability of children; i. Listed households with the final random number were picked up for interview; and j. In case of unavailability of 15 children in the cluster, additional clusters were added. 2.6 Key Variables The key variables are grouped into four broader categories.
Table 4: Key Variables in the Study A. Vaccination Coverage
Sample Size
Retention of Vaccination Cards
Fully Immunized Coverage
Antigen wise Coverage
Partially Vaccinated
Zero Dose
Reasons of Zero Dose
Information about Working of LHWs
Preferred Channels of Communication B. Characteristics of Mothers
Age
Educational Levels
Engagement in Livelihood C. Characteristics of Households
Commonly Spoken Language
Housing Structures
Access to Water
Household Toilet
Major Professions
D. Background Characteristics of Fully Immunized Vs. Zero-Dose
Illiteracy in Mothers
Kacha Housing Structures
Household Toilets
Daily Wage Workers
Debt Burden
16
2.7 Data Collection Instruments The data collection instrument was designed by the senior investigators and finalized in consultation with the UNICEF Pakistan officials. The instruments was pre-tested in order to ensure the consistency, appropriateness of language and sequencing of the questions. Based on the feedback from the pre-testing, the instruments was modified and rephrased, where necessary. These data collection instrument was not only translated into local languages but also culturally adopted, where necessary. The study instrument is attached in Annex 2ure. 2.8 Operational Definitions The operational definitions were defined based on the desk reviews as well as discussions with the health authorities. 2.8.1 Slums The definition of slums was reviewed from UN Habitat, Kachi Abadi Cell, Town Municipal Offices and Offices of Development Authority. Slums are a contiguous settlement where the inhabitants are characterized as having inadequate housing and basic services. A slum is often not recognized and addressed by the public authorities as an integral or equal part of the city. According to UN Habitat, the generic definition of a slum suggests that it is: ...a contiguous settlement where the inhabitants are characterized as having inadequate housing and basic services. A slum is often not recognized and addressed by the public authorities as an integral or equal part of the city (UN Habitat, 2010, p. 1372). Similarly, a slum household is defined as a group of individuals who live under the same roof that lacks one or more73 of the following conditions:
Limited access to improved water and sanitation
Weak housing structures
Insufficient living area
Uncertain about legal ownership of the residential area 2.8.2 Peri-Urban Slums Slums located at the periphery of urban areas that join the borders of cities and rural areas. 2.8.3 Underserved Areas Underserved Areas includes both planned residential areas with majority of the plastered housing structures. Underserved areas have one or more of the following conditions:
Low immunisation coverage or
High number of refusal 2.8.4 Expanded Programme on Immunization Expanded Programme on Immunization of the government of Pakistan for children and women of child-bearing age. 2.8.5 Kacha Housing Structure All walls and ceilings are made of mud, straws, bamboos or material other than cement, concrete and iron and are vulnerable to damage due to excessive rains, floods or earthquake etc. 2.8.6 Pacca Housing Structure All walls and ceilings are made of cement, concrete and iron. 2.8.7 Kacha-Pacca Housing Structure Walls are made of concrete and iron while ceiling is made of mud, straw or bamboo or vice versa. 2.8.8 Antigen A liquid medicine, which develops immunity in the body of an individual.
72 UN Habitat (2010), The Challenge of Slums: Global Report on Human Settlements 2003 73 This definition may be locally adapted for where some factors may be similar between the slums and majority of the society (UN Habitat).

17
2.8.9 Fully Immunized Children aged between 12 and 23 months who have completed vaccination of all doses starting from BCG-OPV0, Penta 1, Penta 2, Penta 3, and Measles-1. 2.8.10 Partially Vaccinated Children aged between 12 and 23 months who have received some doses of vaccination but could not complete it according to age wise requirements. 2.8.11 Defaulter Any child aged between 12 and 23 months who has received BCG+OPV0 and Penta 1 and Penta 2 but did not receive Penta 3 or Measles-1. 2.8.12 Zero Dose Children aged between 12 and 23 months who have not received any doses of vaccines including polio, which may protect children from vaccine preventable diseases. 2.8.13 Records Under two years of children whose vaccination cards containing record of their age wise doses administered are available in readable condition for any confirmation. 2.8.14 Recall Under two years of children whose record of vaccination is not presented on any paper or card at the time of the survey and mother shares the vaccination status based on her memory or recall. 2.8.15 Vaccine Preventable Diseases The vaccine preventable diseases for children aged between 0 and 23 months are prevented through offering basic vaccination. The names of these diseases are Childhood Tuberculosis, Poliomyelitis, Rotavirus Diarrhea, Pneumonia, Diphtheria, Pertussis (Whooping Cough), Tetanus, Hepatitis B (Hep B), Haemophilus Influenza type b (Hib) and Measles. 2.8.16 Antigens as part of Basic Vaccine
The following antigens are administered to children aged between 0 and 15 months old with different age intervals:
Table 5: Vaccination Schedule
1st Dose 2nd Dose 3rd Dose 4th Dose 5th Dose 6th Dose
Immediately After Birth
6 Weeks 10 Weeks 14 Weeks 9 Months 15 Months
BCG+OPV0 OPV 1, Rota 1, Pneumococcal Conjugate Vaccine (PCV) 1, Penta 1
OPV 2, Rota 2, PCV 2, Penta 2
OPV 3, Rota 3, PCV 3, Penta 3
Measles-1 Measles-2
2.9 Data Analysis Techniques Systematic approach was adopted for cleaning, and verification and further entering of data in excel sheets as per the variables defined for this study. The data was analyzed by the Data Manager in Statistical Package for Social Sciences (SPSS) and Statistics and Data (STATA). The processed data is interpreted through tabular and graphical presentation required for quantitative analysis. 2.10 Monitoring Mechanism For the purpose of this study, timely review and rigorous monitoring system was put in place to ensure there were no detractions. This included engagement of a full-time team dedicated to holding survey, timely submission of data, physical verification and further cleaning process of the data, and assignment for each team member. The monitoring ensured the following:
Verification of data either through telephonic correspondence or physical on-field visits Supportive supervision and daily review of field performance Trouble shooting in case of problems Review of survey forms to ensure that no information was missed or fake or contradictory

18
2.11 Study Team and Training A three-tiered team was engaged in childhood vaccination coverage in slums / underserved areas. The first tier of team comprised of a
team leader, survey supervisors and data collectors. The team leader provided overall guidelines and end-to-end management of the process, the supervisors extended supportive supervision and monitoring of the data collection and ensured quality standards while surveyors collected the data from the field through physical visits, group discussions and individual interviews.
The 2nd tier of the team consisted of data validation, cleaning, entry and analysis. The 3rd tier of the team comprised report writers responsible for undertaking desk
researches and interpreting the results in an effective manner. The training of study teams was conducted by the professionals prior to commencing data collection activities that includes study objectives, basic concepts on healthcare and immunization services, data collection, ethical considerations as well as confidentiality. In addition, they were trained on data entry processes (i.e. validation and cleaning before their final consolidation). 2.12 Objectives and Rationale of the Coverage Survey Line lisitng and profiling of slums was done in 2017 with the aim to support process for increasing coverage in slums. Soon after the profiling of slums, it was realized that statistics about current status of immunization in the slums and underserved areas would be even more helpful to reach zero dose, defaulter and under vaccinated children. Thus, in order to create a baseline on status of immunization, background charateristics of mothers and household, it was felt important to undertake a dedicated coverage assessment exercise in slums of ten cities including Faisalabad, Gujranwala, Lahore, Multan, Rawalpindi, Islamabad, Quetta, Peshawar, Karachi and Hyderabad. 2.13 Study Limitations Although the survey was conducted with a highly reliable team to know the status of immunization in children aged 12-23 months old and the methodology was designed according to the latest sample calculation and procedures, but the results may have some limitation explained below: 2.13.1 The status of vacicnation was not tirangualted with the data available in fixed EPI facilties hence
the survey records for recall basis may have some variations; 2.13.2 The coverage survey was conducted only with mother living in slums and underserved areas.
Majority of the mothers were either illiterate or have very low levels of education. The responses may have some understanding gaps;
2.13.3 Since the majority of the respondents of coverage survey were illiterate mothers therefore status of vacicnation on recall basis have limited relaibaility;
2.13.4 Since majority of the mothers of zero dose children were illiterate therefore reasons of zero dose may have missed some more aspects.
1. Team Leader Supervisors
Data Collectors
Data Entry Operators
2. Data Validation Team
Data Assistant
3. Report Writer Data Analyst
Graphic Designer
Figure 3: Study Team Composition

19
Chapter 3: Status of Childhood Vaccination
Dreams Never Come True!
Chamanabad is a registered slum, which was legalized in the year 2000 and has around 3000 residents. Despite the legalization of the slum, the residents are deprived of the basic necessities of life; including sanitation system and government supply of water.
“Chamanabad has been my home since the last 10 years and I know this place a little too well. Ask me about the ‘humans of Chamanabad’, the history of this place, our famous Chai wala (tea-stall holder) and ‘Mai Naseema of big Jhuggi (a slum dwelling);
I will know it all” said Sallu, a 34 years old resident of Chamanabad, Union Council Chak Jalal Din, City Rawalpindi. Sallu is a daily wage construction worker in the nearby locality. Since Sallu is the only breadwinner for the family and his daily wage is very low; his household usually operates in financial debt.
“My wife talks about dreams! We both had them as individuals and now we have them as a couple. We want our children to be educated so that they can be empowered and can have a better life than ours. Alas! Our poverty does not allow this as of yet”- Sallu explained further.
“He talks about education; we do not even have a proper system of healthcare in this area. You have asked me about Lady Health Workers, I do not know who they are and I do not really have any information about them.”- Clarifies Naheeda. Sallu’s wife Naheeda is a 30 years old illiterate woman; who, unlike her husband, is a fan of few words; “We have dreams, big dreams but we know that their translation into reality is not possible in this life time”- She shared in pure agony.

20
Chapter 3: Childhood Vaccinations This chapter presents the analysis of vaccination coverage rates of children aged 12-23 months. The coverage rates are correlated with the background characteristics of mothers and their households. This chapter comprehensively covers the following variables:
3.1 Vaccination Coverage 3.1.1 Sample Size 3.1.2 Retention of Vaccination Cards 3.1.3 Fully Immunized Coverage 3.1.4 Antigen wise Coverage 3.1.5 Partially Vaccinated 3.1.6 Zero Dose 3.1.7 Reasons of Zero Dose 3.1.8 Information about Working of LHWs 3.1.9 Preferred Channels of Communication 3.2 Characteristics of Mothers 3.2.1 Age 3.2.2 Educational Levels 3.2.3 Engagement in Livelihood 3.3 Characteristics of Households 3.3.1 Commonly spoken language 3.3.2 Housing Structures 3.3.3 Access to Water 3.3.4 Household toilet 3.3.5 Major professions 3.4 Background Characteristics of Fully Immunized Vs. Zero-Dose 3.4.1 Illiteracy in Mothers 3.4.2 Living in Kacha Housing Structures 3.4.3 Availability of Household Toilets 3.4.4 Caregivers working as Daily Wage Workers 3.4.5 Debt Burden 3.1 Vaccination Coverage This section presents the sample size, retention of vaccination card and childhood immunization coverage rates. The status of vaccination is checked for both records and recall basis. The coverage rates are higher on recall basis compared to records basis. Since 56% mothers are illiterate and 14% are educated between grades 1-5 therefore reliability of recall is limited. 3.1.1 Sample Size 14,467 houses were included in the sample. Sample size of each city was calculated according to its coverage rates explained in chapter 2. The largest sample size was for Karachi (4,597) as it includes all districts of Karachi (East, West, Korangi, Malir and Central) and smallest sample size was for Multan (582). From the total sampled mothers, 44 mothers have two
children. The counting of family members at the time
of the survey reflects 113,319 family members with
49% males and 51% females. The average family size is 8 members per household. 99.7% mothers have
one child aged 12-23 months while only 0.3% mothers have two children aged 12-23 months at the time of
the survey
.
Table 6: Units of Analysis in the Survey
City Households Mothers Children
Faisalabad 708 712 716
Gujranwala 918 918 918
Lahore 820 820 820
Multan 582 582 583
Rawalpindi 824 824 826
Islamabad 1072 1072 1072
Quetta 1782 1786 1792
Peshawar 1799 1807 1814
Karachi 4597 4605 4625
Hyderabad 1365 1365 1365
Total 14467 14491 14531

21
3.1.2 Retention of Vaccination Cards Overall 44% children have vaccination cards. The percentage of card retention varies across cities and goes as high as 65% in Gujranwala and Multan and as low as 26% in Hyderabad followed by Islamabad (31%). The card retention in four cities’ (Hyderabad, Islamabad, Peshawar and Quetta) is below 35% while it is over 60% in only three cities’ (Gujranwala, Multan Rawalpindi). The gender lens on the card retention confirms that the retention of card is high for boys (54%) and low for girls (46%). The pattern is almost same across all cities, where highest difference is observed in Multan with 60% boys having vaccination card in comparison to only 40% girls. The unavailability of card is highly linked to the lack of awareness regarding the importance of vaccination cards. (Table 6 Annex 2)
3.1.3 Fully Immunized Children74 3.1.3a Records+ Recall Basis 53% children are fully immunized with higher percentage of fully immunized boys (54%). The highest percentage of fully immunized children is in Multan (76%) while the lowest percentage is in Quetta (27%) followed by Islamabad (51%). 59% children in Hyderabad and 54% in Karachi are fully immunized. The gender lens indicates that greater percentage of boys are fully immunized except for Quetta (51%) and Faisalabad (57%) where greater number of girls are found to be fully immunized. The gender variation is highest in Islamabad (66%) and Multan (60%) where a greater percentage of fully immunized boys are found.
3.1.3b Records Basis The fully immunized coverage rates reduce drastically when checked against records. Highest reduction of coverage rates based on the records is found in Hyderabad where coverage rate drops from 59% to 18%, Islamabad where coverage rates drop from 51% 14% and Quetta where coverage rates drop from 27% to 11%. The lowest drop of coverage rate is found in Lahore where coverage rates drop from 53% to 47% only. On the basis of record, Gujranwala has the highest share of fully immunized children (57%), while the lowest share of fully immunized children on record basis is in Quetta (11%). The gender lens on fully immunized children found greater percentage of fully immunized boys (54%) compared to fully immunized girls (46%). This pattern is more prominent in Islamabad and Multan where 66% and 60% boys are fully immunized as compared to lower percentage of fully immunized girls.
74 Only those children are included who have received all antigens up-to Measles 1.
Figure 4: Retention of Vaccination Card
Figure 5: Fully Immunized Children (records+recall)
Figure 6: Fully Immunized (Records)
26%
31% 32%35%
46%
52%
59%62%
65% 65%
44%
HYD IBD PWR QTA KCH FSD LHR RWP GJR MTN Total
27%
51%53% 53% 54%
57%59%
65%69%
76%
53%
QTA IBD LHR PWR KCH FSD HYD GJR RWP MTN Total
11%14%
18%
27%29%
36%
47%51%
55%57%
30%
QTA IBD HYD PWR KHI FSD LHR RWP MTN GUJ Total
22
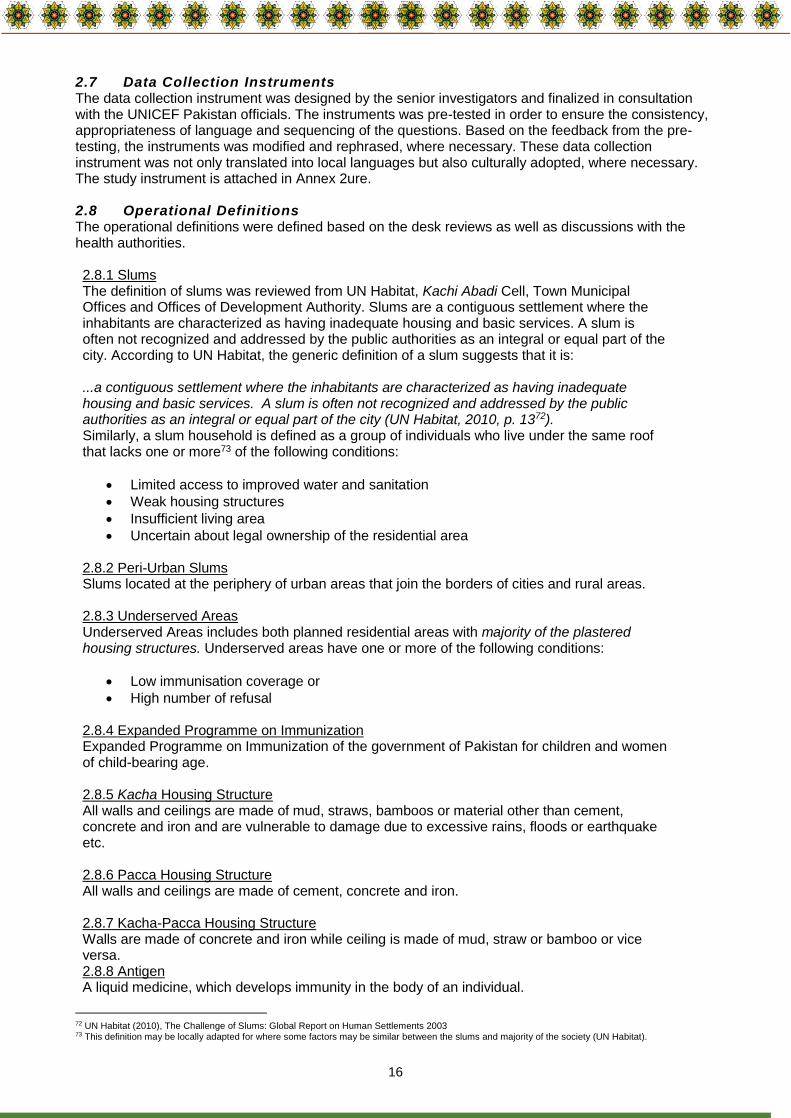
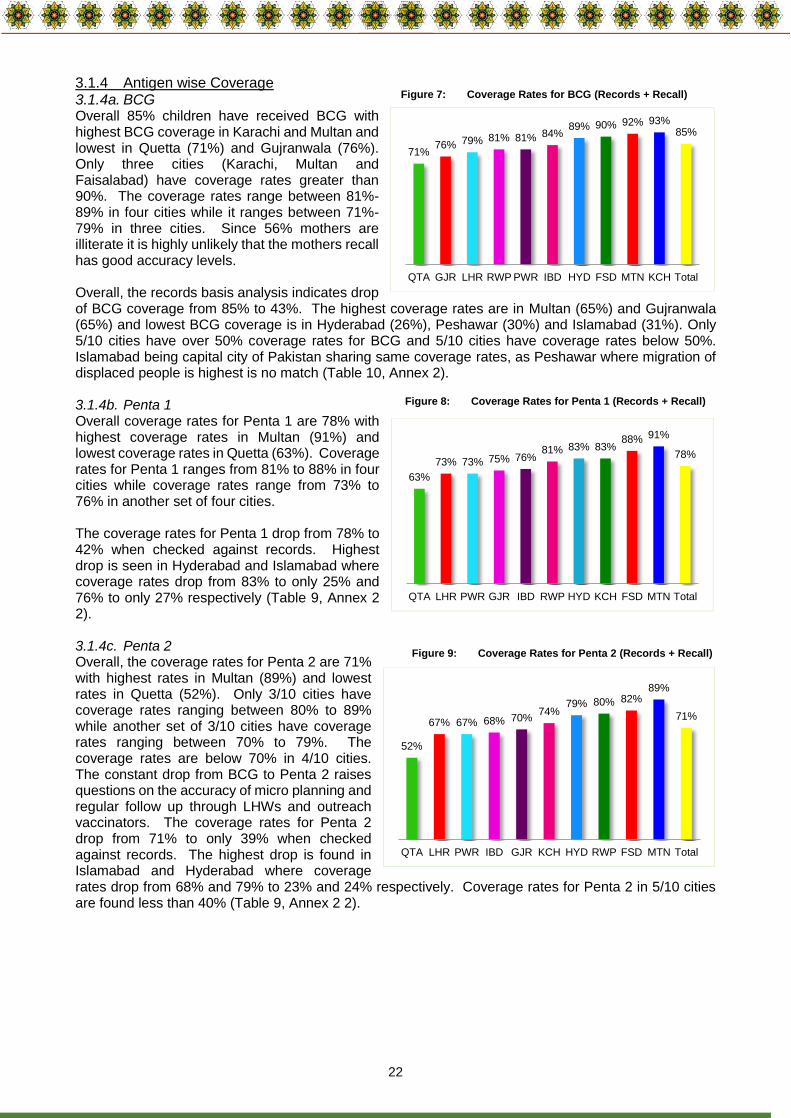
3.1.4 Antigen wise Coverage 3.1.4a. BCG Overall 85% children have received BCG with highest BCG coverage in Karachi and Multan and lowest in Quetta (71%) and Gujranwala (76%). Only three cities (Karachi, Multan and Faisalabad) have coverage rates greater than 90%. The coverage rates range between 81%-89% in four cities while it ranges between 71%-79% in three cities. Since 56% mothers are illiterate it is highly unlikely that the mothers recall has good accuracy levels. Overall, the records basis analysis indicates drop of BCG coverage from 85% to 43%. The highest coverage rates are in Multan (65%) and Gujranwala (65%) and lowest BCG coverage is in Hyderabad (26%), Peshawar (30%) and Islamabad (31%). Only 5/10 cities have over 50% coverage rates for BCG and 5/10 cities have coverage rates below 50%. Islamabad being capital city of Pakistan sharing same coverage rates, as Peshawar where migration of displaced people is highest is no match (Table 10, Annex 2). 3.1.4b. Penta 1 Overall coverage rates for Penta 1 are 78% with highest coverage rates in Multan (91%) and lowest coverage rates in Quetta (63%). Coverage rates for Penta 1 ranges from 81% to 88% in four cities while coverage rates range from 73% to 76% in another set of four cities. The coverage rates for Penta 1 drop from 78% to 42% when checked against records. Highest drop is seen in Hyderabad and Islamabad where coverage rates drop from 83% to only 25% and 76% to only 27% respectively (Table 9, Annex 2 2). 3.1.4c. Penta 2 Overall, the coverage rates for Penta 2 are 71% with highest rates in Multan (89%) and lowest rates in Quetta (52%). Only 3/10 cities have coverage rates ranging between 80% to 89% while another set of 3/10 cities have coverage rates ranging between 70% to 79%. The coverage rates are below 70% in 4/10 cities. The constant drop from BCG to Penta 2 raises questions on the accuracy of micro planning and regular follow up through LHWs and outreach vaccinators. The coverage rates for Penta 2 drop from 71% to only 39% when checked against records. The highest drop is found in Islamabad and Hyderabad where coverage rates drop from 68% and 79% to 23% and 24% respectively. Coverage rates for Penta 2 in 5/10 cities are found less than 40% (Table 9, Annex 2 2).
Figure 7: Coverage Rates for BCG (Records + Recall)
71%76% 79% 81% 81% 84%
89% 90% 92% 93%85%
QTA GJR LHR RWP PWR IBD HYD FSD MTN KCH Total
63%
73% 73% 75% 76%81% 83% 83%
88% 91%
78%
QTA LHR PWR GJR IBD RWP HYD KCH FSD MTN Total
52%
67% 67% 68% 70%74%
79% 80% 82%89%
71%
QTA LHR PWR IBD GJR KCH HYD RWP FSD MTN Total
Figure 8: Coverage Rates for Penta 1 (Records + Recall)
Figure 9: Coverage Rates for Penta 2 (Records + Recall)
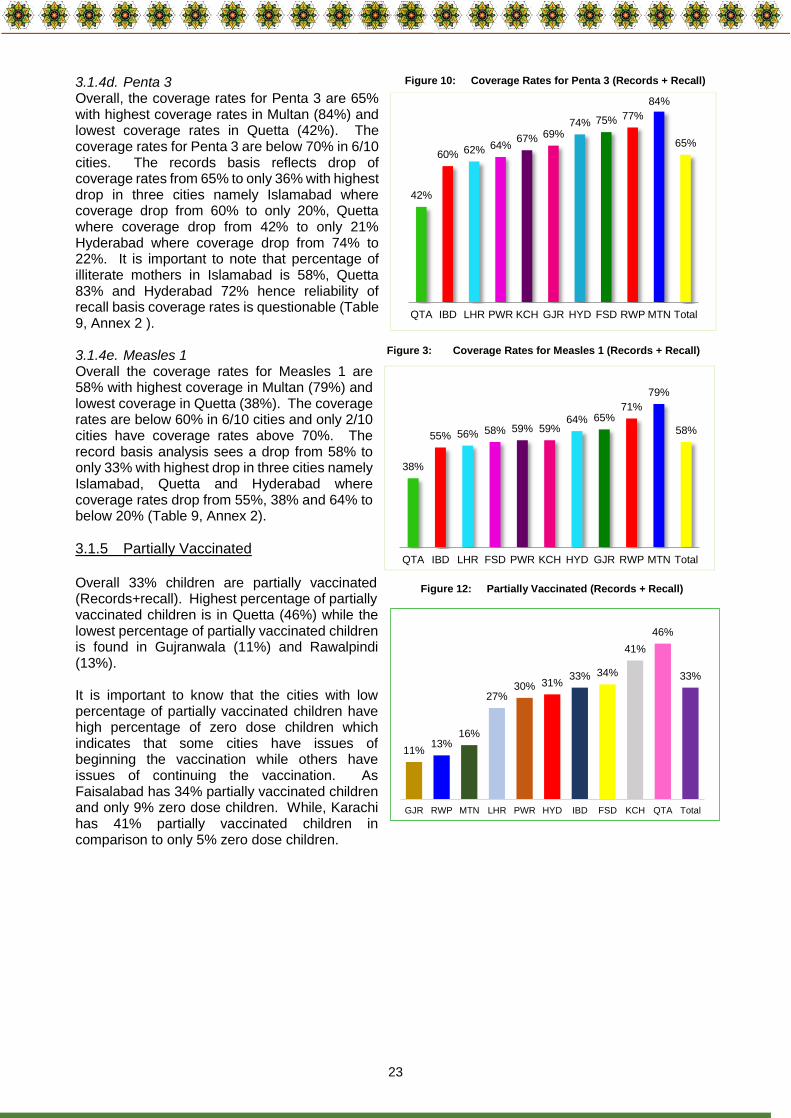
23
3.1.4d. Penta 3 Overall, the coverage rates for Penta 3 are 65% with highest coverage rates in Multan (84%) and lowest coverage rates in Quetta (42%). The coverage rates for Penta 3 are below 70% in 6/10 cities. The records basis reflects drop of coverage rates from 65% to only 36% with highest drop in three cities namely Islamabad where coverage drop from 60% to only 20%, Quetta where coverage drop from 42% to only 21% Hyderabad where coverage drop from 74% to 22%. It is important to note that percentage of illiterate mothers in Islamabad is 58%, Quetta 83% and Hyderabad 72% hence reliability of recall basis coverage rates is questionable (Table 9, Annex 2 ). 3.1.4e. Measles 1 Overall the coverage rates for Measles 1 are 58% with highest coverage in Multan (79%) and lowest coverage in Quetta (38%). The coverage rates are below 60% in 6/10 cities and only 2/10 cities have coverage rates above 70%. The record basis analysis sees a drop from 58% to only 33% with highest drop in three cities namely Islamabad, Quetta and Hyderabad where coverage rates drop from 55%, 38% and 64% to below 20% (Table 9, Annex 2).
3.1.5 Partially Vaccinated Overall 33% children are partially vaccinated (Records+recall). Highest percentage of partially vaccinated children is in Quetta (46%) while the lowest percentage of partially vaccinated children is found in Gujranwala (11%) and Rawalpindi (13%). It is important to know that the cities with low percentage of partially vaccinated children have high percentage of zero dose children which indicates that some cities have issues of beginning the vaccination while others have issues of continuing the vaccination. As Faisalabad has 34% partially vaccinated children and only 9% zero dose children. While, Karachi has 41% partially vaccinated children in comparison to only 5% zero dose children.
Figure 12: Partially Vaccinated (Records + Recall)
42%
60% 62% 64%67% 69%
74% 75% 77%
84%
65%
QTA IBD LHR PWR KCH GJR HYD FSD RWP MTN Total
38%
55% 56% 58% 59% 59%64% 65%
71%
79%
58%
QTA IBD LHR FSD PWR KCH HYD GJR RWP MTN Total
Figure 10: Coverage Rates for Penta 3 (Records + Recall)
Figure 3: Coverage Rates for Measles 1 (Records + Recall)
11%13%
16%
27%30% 31%
33% 34%
41%
46%
33%
GJR RWP MTN LHR PWR HYD IBD FSD KCH QTA Total

24
3.1.6 Zero Dose Overall 14% children have not received any antigen and hence are zero dose. The city wise variations indicate that highest percentage zero dose children are in Quetta (27%) and Gujranwala (24%); whereas the lowest percentage of zero dose are in three cities namely Karachi (5%), Multan (8%) and Faisalabad (9%). The gender lens on zero dose children reflects that 54% of the zero dose children are boys and 46% are girls. The pattern is same across all cities, but the variation is more noticeable in Faisalabad where 63% zero dose children are boys compared to 37% zero dose girls. However, in contrast Islamabad has the higher percentage of zero dose girls (51%) than zero dose boys (49%).
3.1.7 Reasons of Zero Dose Majority of the reasons stated by 70% mothers are linked with the unawareness of mothers regarding childhood vaccination and its importance. For example, vaccination causes more diseases, no time for vaccination; fear of injections reflects the low level of awareness amongst mothers. Besides that, 30% of zero dose children are deprived of vaccination because of non- permission of their family members, which shows that along with mothers’ other family members also do not understand the importance of vaccination. The following four reasons emerge as major contributors to zero dose children
a. Non permission for vaccination b. Vaccination causes more diseases c. No time for vaccination d. Fear of injection.
3.1.7a. Non-Permission for Vaccination Intensity of these reasons varies for each city. For example, overall 30% mothers report non-permission as one of the major reasons for not getting their children vaccinated. Three cities namely Peshawar (54%), Karachi (48%) and Quetta (43%) report very high percentages for non-permission. Non-permission for vaccination appears very low in 5/10 cities where percentage of mothers stating non-permission as a reason is below 15%.
Figure 13: Zero Dose Children
1%
1%
3%
4%
4%
7%
16%
19%
23%
30%
Environment in EPI facility is…
Child Was Sick
Unaware of Vaccination Point
Unaware of Vaccination…
Transport cost to EPI facility…
Unaware of Vaccination
Fear of Injection
No Time for Vaccination
Vaccination Causes More…
No Family Permission
Figure 14: Reasons of Zero Dose
Figure 15: Non-Permission for Vaccination
5%
9%
11%
13%
15%
16%
17%
43%
48%
54%
30%
GJR
MTN
IBD
LHR
FSD
HYD
RWP
QTA
KCH
PWR
Total
5%
8%9%
10%
16% 16%18%
20%
24%
27%
14%
KCH MTN FSD HYD IBD PWR RWP LHR GJR QTA Total

25
3.1.7b. Vaccination Causes More Diseases Overall 23% mothers report that vaccination causes more diseases as one of the major reasons of not getting their children immunized. Myths against vaccination that it causes more diseases are reported by majority of the mothers in Lahore (58%), Hyderabad (53%) and Karachi (35%). Less than 15% mothers in namely Multan, Islamabad, Faisalabad, Quetta and Gujranwala report that vaccination causes more diseases (Table 15, Annex 2). 3.1.7c. No Time for Vaccination Overall 19% mothers report ‘no time for vaccination’ as one of the major reasons for not vaccinating their children for any antigen. This issue is found very intense in Gujranwala where 44% mothers report ‘no time for vaccination’ as a major excuse. Mothers in Hyderabad (29) and Islamabad (28%) also report ‘no time for vaccination’ as one of the major excuses, (Table 15, Annex 2). 3.1.7d. Fear of Injection Overall 16% mothers report fear of injection as one of the major reasons of not vaccinating their children for any antigen. Mothers in Multan (66%) and Faisalabad (42%) report fear of injection as one of the major reasons of not vaccinating their children for any antigen. Peshawar (4%), Quetta (8%) and Hyderabad (14%) where percentages of zero dose are very high do not report fear of injection as a major reason for not vaccinating their children (Table 15, Annex 2).
3.1.8 Information about Working of LHWs Overall 44% mothers are unaware of working of LHWs in their respective areas. Highest percentage of unaware mothers is found in Gujranwala (89%) and Karachi (75%). Lowest percentage of unaware mothers is found in 6/10 cities where less than 30% mothers were found unaware of working of LHWs. Interestingly 99% mothers in Hyderabad and 95% mothers in Multan are aware of working of LHWs. Of those mothers who are aware of working of LHWs, believe that they provide general health education to women (44%). Only 5% mothers reported that LHWs are engaged in supporting vaccinators and 1% reported that LHWs provide information about vaccination. Since LHWs come from the similar background and have their own children as well therefore the working of LHWs in close coordination with vaccinators may help in removing the myths and biases of mothers towards childhood (Table 18, Annex 2).
3.1.9 Preferred Communication Channels Mother’s opinion regarding their preferred channels of communications for receiving information on childhood vaccination is explored. Highest percentage of mothers prefers television and lowest percentage of mothers prefer leaflet. The reason for low preference for leaflet could be linked with the illiteracy of mothers. The intensity of preference varies for different cities. The analysis of the two most preferred channels is as follow:
a. Television b. Health Workers
Overall 64% mothers prefer television as a channel of communication with highest percentage of mothers in Islamabad (99%) and Faisalabad (94%). Lowest percentage of mothers in Peshawar (39%) and Karachi (44%) prefers television as their preferred channel for communication. Majority of the mothers ranging from 82%-99% in 5/10 cities prefer television as a preferred channel of communication (Table 19, Annex 2).
1%
5%
8%
17%
25%
28%
39%
52%
75%
89%
44%
HYD
MTN
IBD
PWR
RWP
LHR
FSD
QTA
KCH
GJR
Total
Figure 16: Information about Working of LHWs
Figure 17: Preferred Channels of Communication
64%
46%
39%
24%
18%
12%
T.V
Health Worker
Others
Poster/Billboard
Radio
Leaflet

26
Overall 46% mothers prefer health workers as a preferred channel of communication with highest percentage of mothers in Peshawar (87%) and Hyderabad (84%) and lowest percentage of mothers in Gujranwala (13%) and Karachi (19%). Majority of the mothers ranging from 53% to 87% in 5/10 cities namely Rawalpindi (53%), Faisalabad (55%), Multan (65%), Hyderabad (84%) and Peshawar (87%), prefer health workers as a channel of communication for childhood vaccination (Table 19, Annex 2 2).
3.2 Background Characteristics of Mothers In order to comprehend the real reasons of low or no coverage, it important to know the background characteristics of mothers, three major variables i.e. mother’s age, education levels and engagement in livelihood activities are compared and analyzed.
3.2.1 Age 55% mothers are 20-29 years of age while 40% are of 30-39 years. While only 2% mothers each are under 18 years and over 40 years of age. The ratio of this pattern is similar across all cities. The highest number of mothers in Lahore (66%) is of age 20-29 years. There is no major inconsistency in age of mothers across cities (Table 20, Annex 2).
3.2.2 Educational Level 56% mothers are illiterate and 14% are educated between 1-5 grades, while 21% are educated between grades 6 to 10. Only 8% mothers have education between 11 grades and above (Table 21, Annex 2) Highest percentage of illiterate mothers is in Quetta (83%) followed by Peshawar (74%) and Hyderabad (72%). Whereas lowest percentage of illiterate mothers is in Gujranwala (17%). Majority 25% mothers in Multan are educated between 1-5 grades, while 43% mothers of Gujranwala have education between 6-10 grades (Table 21, Annex 2).
3.2.3 Engagement in Livelihood 6% mothers are engaged in livelihood activities while 94% mothers are serving as home makers. 9% mothers in Islamabad and Multan are engaged in livelihood activities, which make up the highest share of working mothers followed by Karachi (8%). The lowest percentage of working mothers is in Faisalabad (2%) and Rawalpindi (3%) (Table 222, Annex 2).
3.3 Background Characteristics of Households The background characteristics of households were checked to know the living conditions and economic pressures. Five major variables were analyzed i.e. language spoken to know the ethnic background, housing structures, access to water and toilets, major professions and financial debts.
3.3.1 Commonly Spoken Language Punjabi (27%) and Pashto (26%) are the most commonly spoken languages while Urdu is spoken in 16% and Sindhi in 10% houses. A combination including Balochi, Potohari/Hindko and Siraiki is spoken languages of 13% houses (Table 233, Annex 2). Punjabi is the most commonly spoken language in Faisalabad (97%), whereas, Siraiki is the commonly spoken language in Multan (48%). In Peshawar, Pashto is spoken in majority 87% houses, while in Hyderabad; Sindhi is the most commonly spoken language of 44% houses (Table 23, Annex 2).

27
3.3.2 Housing Structures 56% children live in Kacha/Tented or Kacha/Pacca combination houses. The maximum number of Kacha/Tented houses is in Quetta (56%). Whereas lowest number is in Hyderabad (9%) and Faisalabad (10%). In Multan majority (74%) houses of children are Pacca followed by Gujranwala (66%). 35% houses have only 1 room, while 52% houses have 2-3 rooms. The highest number of houses in Karachi (55%) and Hyderabad (48%) has only 1 room. While 71% and 69% houses in Multan and Gujranwala have 2-3 rooms respectively. 5% houses are without operational electricity connections. Islamabad (12%) and Lahore (10%) has the highest number of houses without electricity connections.
3.3.3 Sources of Domestic Water 56% houses do not have access to Government water supply, however the houses where supply is available, majority of the houses (54%) have water available for only 1-5 hours. Gujranwala (2%) and Faisalabad (15%) have the lowest number of houses with government supplied water. While in Quetta, 63% houses acquire water for domestic use from other sources. 42% houses also use ground water for their domestic use (Table 27, Annex 2 2).
3.3.4 Household Toilets 5% of the houses lack toilet facilities and are either using Neighbor’s/Public toilets or practicing open defecation. 16% houses in Islamabad and 10% in Lahore are devoid of toilet facilities. While in Karachi 3% houses are without toilets (Table 29, Annex 2 2). For houses where toilets are available 36% have traditional/open pit type toilets. The highest number of houses in Faisalabad (70%) and Peshawar (69%) have traditional/open pit types toilet, whereas it is lowest in Karachi (5%), where 92% houses have toilets connected to street drains (Table 29, Annex 2). On average 7 members use single toilet facility per house. The average toilet users are highest in Quetta and Peshawar, where 10 and 9 members uses single toilet facility on daily basis respectively (Table 30, Annex 2).
3.3.5 Major Professions 54% families rely on daily wage labor for income while 29% families are job holders and 17% run small business to earn income. Islamabad (73%) and Hyderabad (63%) has the maximum number of households where daily wage labor is the main source of income, whereas it is lowest in Multan (41%) (Table 32, Annex 2). 56% families of children are under constant debt. Quetta (72%) and Karachi (63%) has the highest number of houses with constant state of debt. Whereas lowest number of families under debt is observed in Peshawar (36%) (Table 333, Annex 2).
Figure 4: Housing Structures
9% 10% 12% 15% 16% 21% 22%28%
40%
56%49%
37%22% 11%
22% 16%
30%
37%24%
40%43%54%
66%74%
62% 62%48%
35% 36%
4%
HYD FSD GJR MTN RWP LHR KCH PWR IBD QTA
Kacha Kacha-pacca Pacca
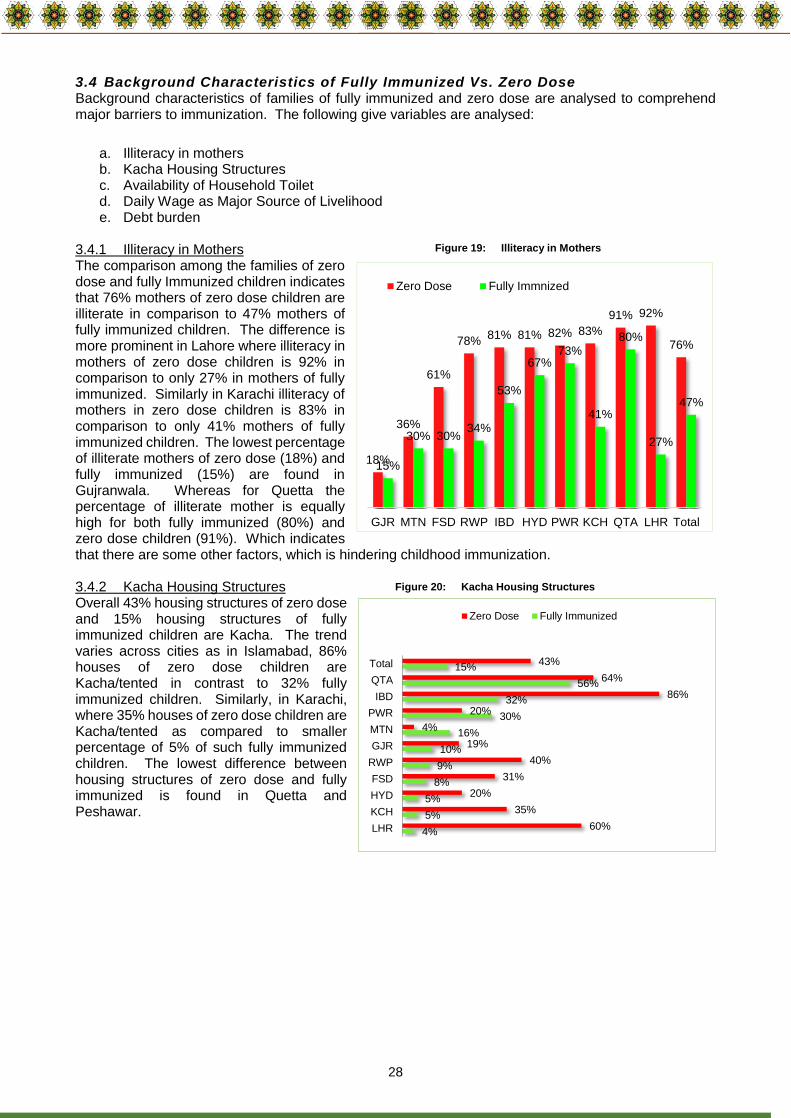
28
3.4 Background Characteristics of Fully Immunized Vs. Zero Dose Background characteristics of families of fully immunized and zero dose are analysed to comprehend major barriers to immunization. The following give variables are analysed:
a. Illiteracy in mothers b. Kacha Housing Structures c. Availability of Household Toilet d. Daily Wage as Major Source of Livelihood e. Debt burden
3.4.1 Illiteracy in Mothers The comparison among the families of zero dose and fully Immunized children indicates that 76% mothers of zero dose children are illiterate in comparison to 47% mothers of fully immunized children. The difference is more prominent in Lahore where illiteracy in mothers of zero dose children is 92% in comparison to only 27% in mothers of fully immunized. Similarly in Karachi illiteracy of mothers in zero dose children is 83% in comparison to only 41% mothers of fully immunized children. The lowest percentage of illiterate mothers of zero dose (18%) and fully immunized (15%) are found in Gujranwala. Whereas for Quetta the percentage of illiterate mother is equally high for both fully immunized (80%) and zero dose children (91%). Which indicates that there are some other factors, which is hindering childhood immunization. 3.4.2 Kacha Housing Structures Overall 43% housing structures of zero dose and 15% housing structures of fully immunized children are Kacha. The trend varies across cities as in Islamabad, 86% houses of zero dose children are Kacha/tented in contrast to 32% fully immunized children. Similarly, in Karachi, where 35% houses of zero dose children are Kacha/tented as compared to smaller percentage of 5% of such fully immunized children. The lowest difference between housing structures of zero dose and fully immunized is found in Quetta and Peshawar.
Figure 19: Illiteracy in Mothers
Figure 20: Kacha Housing Structures
18%
36%
61%
78%81% 81% 82% 83%
91% 92%
76%
15%
30% 30%34%
53%
67%73%
41%
80%
27%
47%
GJR MTN FSD RWP IBD HYD PWR KCH QTA LHR Total
Zero Dose Fully Immnized
4%
5%
5%
8%
9%
10%
16%
30%
32%
56%
15%
60%
35%
20%
31%
40%
19%
4%
20%
86%
64%
43%
LHR
KCH
HYD
FSD
RWP
GJR
MTN
PWR
IBD
QTA
Total
Zero Dose Fully Immunized

29
3.4.3 Household Toilets
17% houses of zero dose children are devoid of toilets; whereas in contrast only 2% houses of fully immunized children do not have toilet facilities. The trend is more prominent in Islamabad where 67% houses of zero dose children are without toilets while in contrast only 2% houses of fully immunized children lack toilet facility. 36% houses of zero dose children in Lahore and 34% houses in Rawalpindi do not have toilet facilities 3.4.4 Daily Wage Workers
Although daily wage work is the major source of earning of majority of the caregivers living in slums/underserved areas but its percentage for caregivers are higher for zero dose children compared to fully immunize. Overall 64% caregivers of zero dose children are working as daily wageworkers while only 50% of families of fully immunized children are working as daily wage workers. Majority 88% families belonging to zero dose children in Islamabad and 85% in Faisalabad rely on daily wage labor as a source of income, in contrast to lesser share of 68% and 63% respectively families of fully immunized children. The trend is similar across all cities
3.4.5 Debt Burden
The economic situation of families of fully immunized children is comparatively better than families belonging to zero dose. Overall 63% families of zero dose children face debt conditions whereas this share is 53% in the case of fully immunized. Variations are more noticeable in Quetta where 80% families of zero dose face debt in contrast to only 67% families belonging to fully immunized children. Similarly, in Faisalabad, 78% families of zero dose face constant debt burden in contrast to 55% families of fully immunized children
Figure 21: Household Toilets
Figure 22: Caregivers Working as Daily Wage Workers
Figure 23: Debt Burden on Caregivers
37%
42%
43%
49%
53%
53%
54%
55%
60%
67%
53%
46%
57%
47%
48%
46%
71%
53%
78%
76%
80%
63%
PWR
RWP
MTN
HYD
GJR
IB
LHR
FSD
KCH
QTA
Total
Zero Dose Fully Immunized
2% 3% 3% 4% 11%
17%
27%
34% 36%
67%
17%
1% 1% 0%2% 1%
5% 5%2%
0%2% 2%
MTN GJR PWR QTA KCH HYD FSD RWP LHR IBD Total
Zero Dose Fully Immnized
52% 53% 54%60% 61% 63%
68%
77%
85% 88%
64%
41%36%
54%
47%
59%
51%
41%37%
63%68%
50%
GJR MTN PWR KCH HYD QTA RWP LHR FSD IBD Total
Zero Dose Fully Immnized

30
Chapter 4: Conclusion and Recommendations
Few Injections are Enough!
Gul lives in the slum of Ibrahim Khel, with her family. The slum is located in the UC Deh Bahador Kally, Town 3, Peshawar. Gul’s household has 8 members consisting for 4 males and 4 females. Gul’s family has been living in this slum since the last 3 years in a 2 roomed mud house. The household uses 1 traditional toilet available for all the family members. The most commonly spoken language of their household is Pashto. Gul’s father, Mishal Khan drives a Taxi on regular basis. It is through 16 hours of work every day that he is able to provide for his family. Though the family of Gul does not face financial debt, they are also not able to save for unforeseen circumstances. Gul’s mother is a 26 years old woman who is illiterate. While discussing vaccination, she mentioned that Lady Health Workers visit her house. Though Gul is 22 months old now, she has only received vaccination for BCG and Measles.
Gul’s mother remarked, ‘Few injections are enough for the
protection of children’!
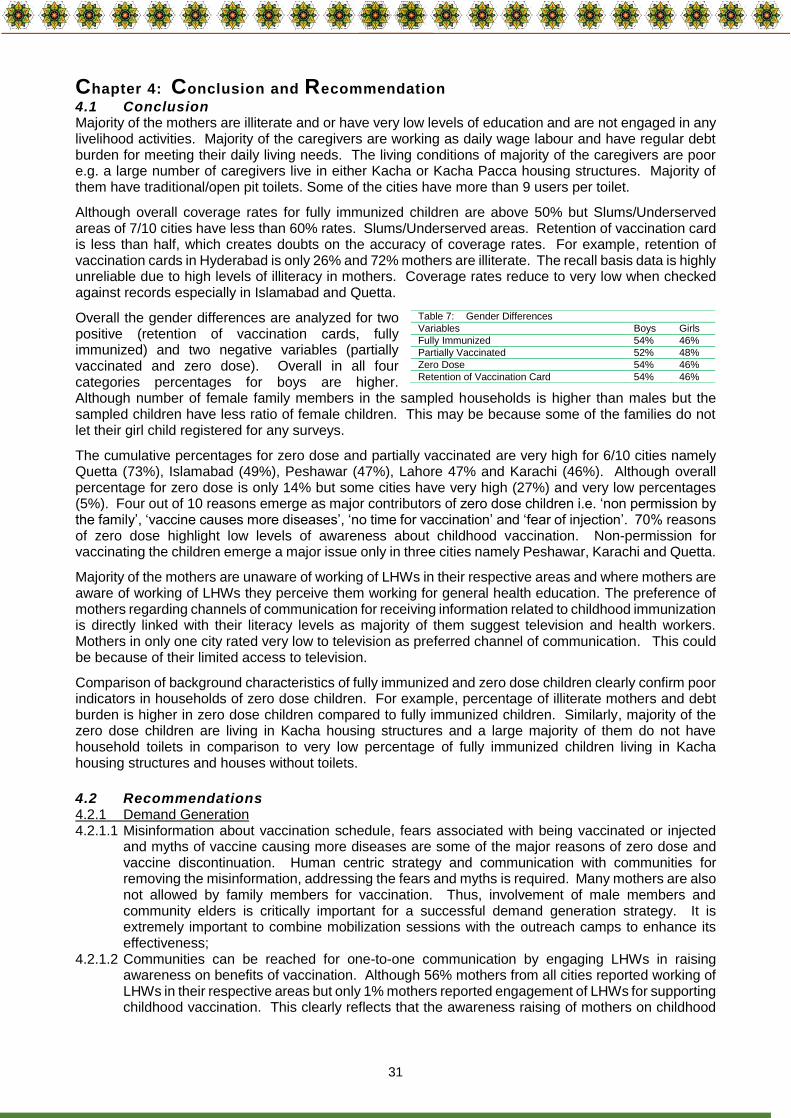
31
Chapter 4: Conclusion and Recommendation
4.1 Conclusion Majority of the mothers are illiterate and or have very low levels of education and are not engaged in any livelihood activities. Majority of the caregivers are working as daily wage labour and have regular debt burden for meeting their daily living needs. The living conditions of majority of the caregivers are poor e.g. a large number of caregivers live in either Kacha or Kacha Pacca housing structures. Majority of them have traditional/open pit toilets. Some of the cities have more than 9 users per toilet.
Although overall coverage rates for fully immunized children are above 50% but Slums/Underserved areas of 7/10 cities have less than 60% rates. Slums/Underserved areas. Retention of vaccination card is less than half, which creates doubts on the accuracy of coverage rates. For example, retention of vaccination cards in Hyderabad is only 26% and 72% mothers are illiterate. The recall basis data is highly unreliable due to high levels of illiteracy in mothers. Coverage rates reduce to very low when checked against records especially in Islamabad and Quetta.
Overall the gender differences are analyzed for two positive (retention of vaccination cards, fully immunized) and two negative variables (partially vaccinated and zero dose). Overall in all four categories percentages for boys are higher. Although number of female family members in the sampled households is higher than males but the sampled children have less ratio of female children. This may be because some of the families do not let their girl child registered for any surveys.
The cumulative percentages for zero dose and partially vaccinated are very high for 6/10 cities namely Quetta (73%), Islamabad (49%), Peshawar (47%), Lahore 47% and Karachi (46%). Although overall percentage for zero dose is only 14% but some cities have very high (27%) and very low percentages (5%). Four out of 10 reasons emerge as major contributors of zero dose children i.e. ‘non permission by the family’, ‘vaccine causes more diseases’, ‘no time for vaccination’ and ‘fear of injection’. 70% reasons of zero dose highlight low levels of awareness about childhood vaccination. Non-permission for vaccinating the children emerge a major issue only in three cities namely Peshawar, Karachi and Quetta.
Majority of the mothers are unaware of working of LHWs in their respective areas and where mothers are aware of working of LHWs they perceive them working for general health education. The preference of mothers regarding channels of communication for receiving information related to childhood immunization is directly linked with their literacy levels as majority of them suggest television and health workers. Mothers in only one city rated very low to television as preferred channel of communication. This could be because of their limited access to television.
Comparison of background characteristics of fully immunized and zero dose children clearly confirm poor indicators in households of zero dose children. For example, percentage of illiterate mothers and debt burden is higher in zero dose children compared to fully immunized children. Similarly, majority of the zero dose children are living in Kacha housing structures and a large majority of them do not have household toilets in comparison to very low percentage of fully immunized children living in Kacha housing structures and houses without toilets.
4.2 Recommendations 4.2.1 Demand Generation 4.2.1.1 Misinformation about vaccination schedule, fears associated with being vaccinated or injected
and myths of vaccine causing more diseases are some of the major reasons of zero dose and vaccine discontinuation. Human centric strategy and communication with communities for removing the misinformation, addressing the fears and myths is required. Many mothers are also not allowed by family members for vaccination. Thus, involvement of male members and community elders is critically important for a successful demand generation strategy. It is extremely important to combine mobilization sessions with the outreach camps to enhance its effectiveness;
4.2.1.2 Communities can be reached for one-to-one communication by engaging LHWs in raising awareness on benefits of vaccination. Although 56% mothers from all cities reported working of LHWs in their respective areas but only 1% mothers reported engagement of LHWs for supporting childhood vaccination. This clearly reflects that the awareness raising of mothers on childhood
Table 7: Gender Differences
Variables Boys Girls
Fully Immunized 54% 46%
Partially Vaccinated 52% 48%
Zero Dose 54% 46%
Retention of Vaccination Card 54% 46%

32
immunization is an ignored topic and requires immediate actions. It is extremely important to priorities list of topics for awareness raising for LHWs on a monthly basis; and
4.2.1.3 Since myths and misbeliefs of mothers regarding side effects of vaccination constitutes major share of 64%. This requires large scale awareness and sensitization of the locals. This can be done by training and engaging local females and community volunteers in the campaigns and community awareness raising session. The inclusion of local girls/females in awareness raising would have greater impact in removing misconceptions and mobilizing people for childhood vaccination.
4.2.2 Channels of Communication 4.2.2.1 Majority of the mothers (63%) prefers to receive information either through television or health
worker (45%). This could be because of the low literacy levels in mothers as 56% mothers are illiterate. It is extremely important to use channels of communication preferred by mothers and other community members so that importance of childhood immunization could be understood, and practices can be changed. Also, while designing any campaign or communication strategy this must be considered that major chunk of mothers is illiterate so the material should be the one which such mothers can easily understand and relate to; and
4.2.2.2 Television and radio programs on importance of vaccination can be design in local languages to increase the understanding and knowledge of community at a larger scale involving male members and community elders;
4.2.3 Targeted Aareness Raising Sessions 4.2.3.1 33% mothers indicated non-permission as reason for no vaccination of the child (zero dose). It
is extremely important to enhance the horizon of awareness raising on importance of childhood immunization beyond mothers. Targeted awareness raising campaign for family decision makers can be designed and launched for changing the mind set of family decision makers;
4.2.3.2 Engaging informal groups to build connection between community and health workers can be a better approach to target the male decision makers of the family to increase the acceptance of vaccination especially in Quetta and Peshawar where non-permission from family is one of the major reasons of zero dose; and
4.2.3.3 08% mothers indicated unawareness about the vaccination schedule and outreach camps timings as major reasons of discontinuing vaccination. It is extremely important to make announcements about the schedule and place for outreach camps.
4.2.4 Co-ordination of LHWs & Vaccinators 5.4.1 It is important to facilitate LHWs and vaccinators to prepare combined micro plans and its field
implementation. Performance indicators and monthly accountability measures may help in improving the coverage rates in slums;
5.4.2 High performing LHWs and vaccinators may be rewarded non-financial incentives such as certificates, training opportunities, shield of honor, etc. This would improve the coordination and teamwork between LHWs and vaccinators and will boost their morale;
5.4.3 Inclusion of female vaccinators in outreach camps and EPI facility center can also be a better strategy to facilitate mothers facing family restrictions.
4.2.5 Retention of Vaccination Card 4.2.5.1 Since vaccination card retention in slums is very challenging due to multiple reasons such as
poor housing, vulnerability to natural disasters, negligence and illiteracy, it is extremely important to design alternate mediums for punching the child vaccination there and then for caregivers as well as at the vaccinator’s levels. This would help in enhancing the reliability of recall-based coverage (child registry and SMS reminders); and
4.2.5.2 Since majority of the population in slums is mobile, multiple strategies could be introduced for highlighting the importance of safe keeping of vaccination card such as using CBVs and LHWs for undertaking in person communication sessions and offering incentives to mothers such as certificate for the most responsible mother, etc.
4.2.6 Service Delivery 4.2.6.1 54% of the total population is working as daily wage labor to earn livelihood and finds it really
challenging to take time out for the vaccination of their children. As 20% mothers indicated unavailability of time and transport cost as some of the major obstacles in vaccinating their children. Flexible vaccination timings of EPI center can be helpful to facilitate children of daily

33
wage workers. This can be done by introducing evening working hours of EPI facility center per week. There could also be liaison with private service providers where EPI services can be based for additional hours; and
4.2.6.2 Constant struggle for raising livelihoods and paying financial debts is what keeps the families driving all the time. If EPI programme cannot improve their livelihoods, outreach camps can be intensified to facilitate caregivers to cut down the additional expenses on the transportation for taking the child to the EPI center.
4.2.7 WASH Programss 4.2.7.1 The sanitary practices of caregivers reflect that on an average 07 members are using a single
toilet and is even higher in Quetta and Peshawar. Majority of the children also practice open defection in the streets. It is important to introduce measures for preventing diarrhea and unhygienic environment by the construction of public toilets or introduction of community sanitation programme or any WASH intervention through Civil Society Organisations with support from development partners.
4.2.8 Accountability 4.2.8.1 Design performance-based outreach camps and ensures accountability measures for
compensating vaccinators according to the number of children vaccinated per camp.

34
Annex 1: Questionnaire for Household Coverage Survey
Questionnaire for Household Coverage Survey
Name of Enumerator
Date of interview
Select your province by typing the number from below, e.g., 2 for KP: 1. Punjab 2. KP 3. Balochistan 4. Sindh 5. Islamabad
Enter district name
Enter Union Council name
Enter the name of location
HHM1 Is this location a slum or underserved 1. Slum 2. Underserved
Enter name of household head
Enter household number. Please insert household numbers as 1, 2 , 3 etc. as you begin filling questionnaires from different households
Enter Converted ID number (CID) Marziya: Please move this to the end of the survey and ensure this appears on the dash board so that supervisors can insert converted ID number Instructions for Supervisors: The logic of having Converted ID number (CID) is to ensure a unique ID for each HOUSEHOLD. The household number cannot be unique as different enumerators will collect data from different households on the same time and will enter household number of their own such as 1, 2, 3 etc. Once data collection by all enumerators is completed for the day, the supervisor or Team Leader) enter CID for each of the completed interviews on the MS EXCEL sheet. The supervisor should know the last CID entered. This will be continued in the following day. The supervisor will enter CIDs considering the last CID entered in the previous day.
If you have accidentally chosen the wrong answer in any of the questions in this section, please press "G" to go back to it and correct it. If you would like to proceed to the next section, press "P"
HHMa Thanks! You will now be asked few questions on household socio economic information. How many members are currently living in your household?
HHMb How many of them are males? Please write your answer in numbers e.g. 2, 3, 4
HHMc How many females are in the household? Please write your answer in numbers e.g. 2, 3, 4
SE01 Since how long you (and your family members) are living here in this house/slum? Enter the duration in number of years and months, e.g, 2 years and 3 months
SE02
If you have migrated from another place in the last 2 years, can you please pick a reason from the list below for coming/migrating to this slum? years If you have been here for more than 2 years, please type 6 1. To find a job/better life 2. Came from conflict affected area 3. We are displaced temporarily 4. We are nomads 5. Any other reason 6. Living here since for more than two
In case of nomads please specify the reason for moving and write this correct spellings and complete meaningful sentence
SE03
Which language is primarily used in your house with family members? Type the correct number from below: If they choose 8: Please write which language is primarily spoken at home and not stated in the above mentioned list of languages 1. Urdu 2. Punjabi 3. Potohari 4. Balochi 5. Pashto 6. Sindhi 7. Siraiki 8. Other
SE04
What is type of infrastructure of main living room/bedroom of the house? If they choose 5: Please specify what is the other type of infrastructure of the main room of the house in correct spellings and complete meaningful sentence 1. Kacha 2. Pakka 3. Mixed 4. Tented 5. Other type of infrastructure
SE05 How many (living rooms and bedrooms) are in the house? (Do not include kitchen, toilet, cattle-shed etc). Please write your answer in number only e.g. 1 or 2 or 3
SE06 How many members were in the house yesterday including any guests? Please write your answer in number only e.g. 1 or 2 or 3
SE07
Is electricity available/installed in your house? Please write your answer either in 1 or 2 or yes or no 1. Yes 2. No
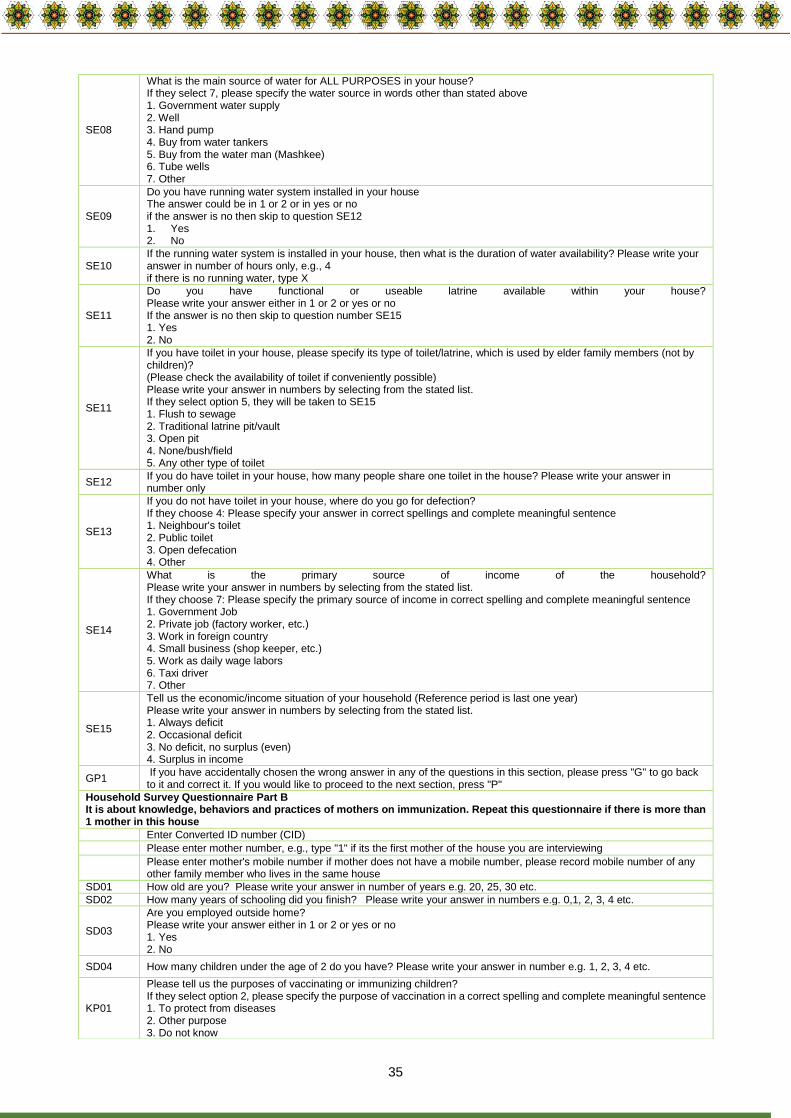
35
SE08
What is the main source of water for ALL PURPOSES in your house? If they select 7, please specify the water source in words other than stated above 1. Government water supply 2. Well 3. Hand pump 4. Buy from water tankers 5. Buy from the water man (Mashkee) 6. Tube wells 7. Other
SE09
Do you have running water system installed in your house The answer could be in 1 or 2 or in yes or no if the answer is no then skip to question SE12 1. Yes 2. No
SE10 If the running water system is installed in your house, then what is the duration of water availability? Please write your answer in number of hours only, e.g., 4 if there is no running water, type X
SE11
Do you have functional or useable latrine available within your house? Please write your answer either in 1 or 2 or yes or no If the answer is no then skip to question number SE15 1. Yes 2. No
SE11
If you have toilet in your house, please specify its type of toilet/latrine, which is used by elder family members (not by children)? (Please check the availability of toilet if conveniently possible) Please write your answer in numbers by selecting from the stated list. If they select option 5, they will be taken to SE15 1. Flush to sewage 2. Traditional latrine pit/vault 3. Open pit 4. None/bush/field 5. Any other type of toilet
SE12 If you do have toilet in your house, how many people share one toilet in the house? Please write your answer in number only
SE13
If you do not have toilet in your house, where do you go for defection? If they choose 4: Please specify your answer in correct spellings and complete meaningful sentence 1. Neighbour's toilet 2. Public toilet 3. Open defecation 4. Other
SE14
What is the primary source of income of the household? Please write your answer in numbers by selecting from the stated list. If they choose 7: Please specify the primary source of income in correct spelling and complete meaningful sentence 1. Government Job 2. Private job (factory worker, etc.) 3. Work in foreign country 4. Small business (shop keeper, etc.) 5. Work as daily wage labors 6. Taxi driver 7. Other
SE15
Tell us the economic/income situation of your household (Reference period is last one year) Please write your answer in numbers by selecting from the stated list. 1. Always deficit 2. Occasional deficit 3. No deficit, no surplus (even) 4. Surplus in income
GP1 If you have accidentally chosen the wrong answer in any of the questions in this section, please press "G" to go back to it and correct it. If you would like to proceed to the next section, press "P"
Household Survey Questionnaire Part B It is about knowledge, behaviors and practices of mothers on immunization. Repeat this questionnaire if there is more than 1 mother in this house
Enter Converted ID number (CID)
Please enter mother number, e.g., type "1" if its the first mother of the house you are interviewing
Please enter mother's mobile number if mother does not have a mobile number, please record mobile number of any other family member who lives in the same house
SD01 How old are you? Please write your answer in number of years e.g. 20, 25, 30 etc.
SD02 How many years of schooling did you finish? Please write your answer in numbers e.g. 0,1, 2, 3, 4 etc.
SD03
Are you employed outside home? Please write your answer either in 1 or 2 or yes or no 1. Yes 2. No
SD04 How many children under the age of 2 do you have? Please write your answer in number e.g. 1, 2, 3, 4 etc.
KP01
Please tell us the purposes of vaccinating or immunizing children? If they select option 2, please specify the purpose of vaccination in a correct spelling and complete meaningful sentence 1. To protect from diseases 2. Other purpose 3. Do not know
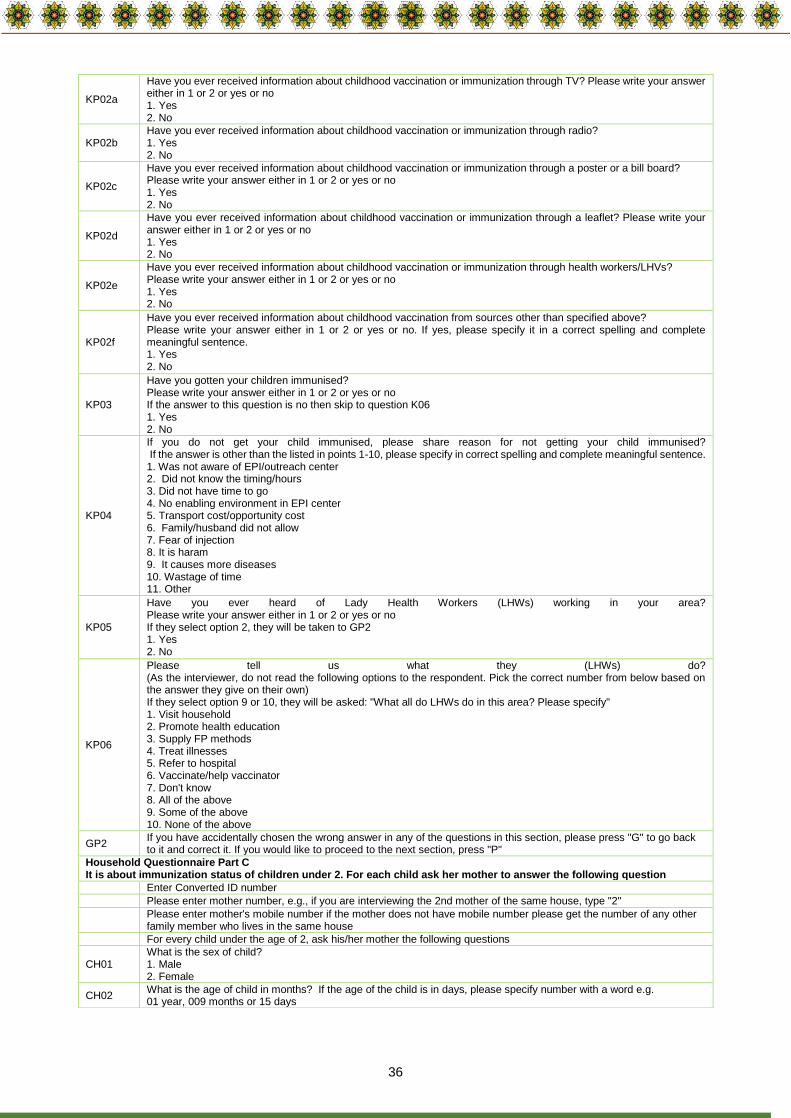
36
KP02a
Have you ever received information about childhood vaccination or immunization through TV? Please write your answer either in 1 or 2 or yes or no 1. Yes 2. No
KP02b Have you ever received information about childhood vaccination or immunization through radio? 1. Yes 2. No
KP02c
Have you ever received information about childhood vaccination or immunization through a poster or a bill board? Please write your answer either in 1 or 2 or yes or no 1. Yes 2. No
KP02d
Have you ever received information about childhood vaccination or immunization through a leaflet? Please write your answer either in 1 or 2 or yes or no 1. Yes 2. No
KP02e
Have you ever received information about childhood vaccination or immunization through health workers/LHVs? Please write your answer either in 1 or 2 or yes or no 1. Yes 2. No
KP02f
Have you ever received information about childhood vaccination from sources other than specified above? Please write your answer either in 1 or 2 or yes or no. If yes, please specify it in a correct spelling and complete meaningful sentence. 1. Yes 2. No
KP03
Have you gotten your children immunised? Please write your answer either in 1 or 2 or yes or no If the answer to this question is no then skip to question K06 1. Yes 2. No
KP04
If you do not get your child immunised, please share reason for not getting your child immunised? If the answer is other than the listed in points 1-10, please specify in correct spelling and complete meaningful sentence. 1. Was not aware of EPI/outreach center 2. Did not know the timing/hours 3. Did not have time to go 4. No enabling environment in EPI center 5. Transport cost/opportunity cost 6. Family/husband did not allow 7. Fear of injection 8. It is haram 9. It causes more diseases 10. Wastage of time 11. Other
KP05
Have you ever heard of Lady Health Workers (LHWs) working in your area? Please write your answer either in 1 or 2 or yes or no If they select option 2, they will be taken to GP2 1. Yes 2. No
KP06
Please tell us what they (LHWs) do? (As the interviewer, do not read the following options to the respondent. Pick the correct number from below based on the answer they give on their own) If they select option 9 or 10, they will be asked: "What all do LHWs do in this area? Please specify" 1. Visit household 2. Promote health education 3. Supply FP methods 4. Treat illnesses 5. Refer to hospital 6. Vaccinate/help vaccinator 7. Don't know 8. All of the above 9. Some of the above 10. None of the above
GP2 If you have accidentally chosen the wrong answer in any of the questions in this section, please press "G" to go back to it and correct it. If you would like to proceed to the next section, press "P"
Household Questionnaire Part C It is about immunization status of children under 2. For each child ask her mother to answer the following question
Enter Converted ID number
Please enter mother number, e.g., if you are interviewing the 2nd mother of the same house, type "2"
Please enter mother's mobile number if the mother does not have mobile number please get the number of any other family member who lives in the same house
For every child under the age of 2, ask his/her mother the following questions
CH01 What is the sex of child? 1. Male 2. Female
CH02 What is the age of child in months? If the age of the child is in days, please specify number with a word e.g. 01 year, 009 months or 15 days
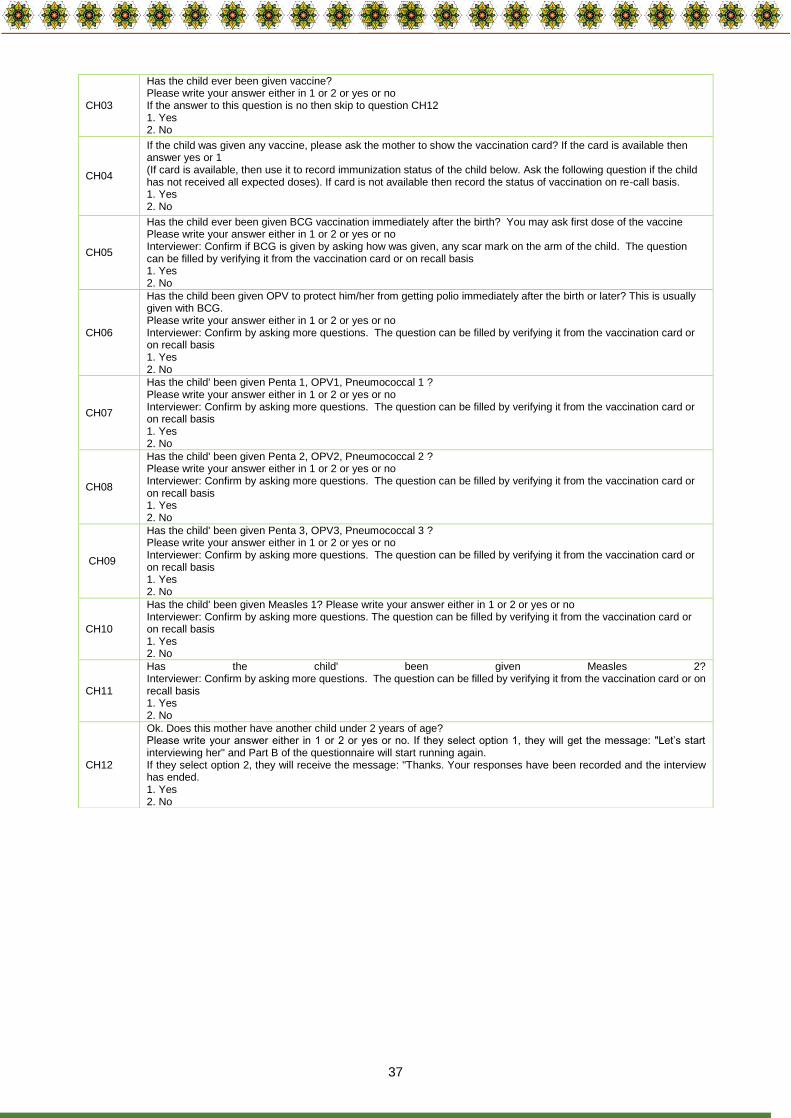
37
CH03
Has the child ever been given vaccine? Please write your answer either in 1 or 2 or yes or no If the answer to this question is no then skip to question CH12 1. Yes 2. No
CH04
If the child was given any vaccine, please ask the mother to show the vaccination card? If the card is available then answer yes or 1 (If card is available, then use it to record immunization status of the child below. Ask the following question if the child has not received all expected doses). If card is not available then record the status of vaccination on re-call basis. 1. Yes 2. No
CH05
Has the child ever been given BCG vaccination immediately after the birth? You may ask first dose of the vaccine Please write your answer either in 1 or 2 or yes or no Interviewer: Confirm if BCG is given by asking how was given, any scar mark on the arm of the child. The question can be filled by verifying it from the vaccination card or on recall basis 1. Yes 2. No
CH06
Has the child been given OPV to protect him/her from getting polio immediately after the birth or later? This is usually given with BCG. Please write your answer either in 1 or 2 or yes or no Interviewer: Confirm by asking more questions. The question can be filled by verifying it from the vaccination card or on recall basis 1. Yes 2. No
CH07
Has the child' been given Penta 1, OPV1, Pneumococcal 1 ? Please write your answer either in 1 or 2 or yes or no Interviewer: Confirm by asking more questions. The question can be filled by verifying it from the vaccination card or on recall basis 1. Yes 2. No
CH08
Has the child' been given Penta 2, OPV2, Pneumococcal 2 ? Please write your answer either in 1 or 2 or yes or no Interviewer: Confirm by asking more questions. The question can be filled by verifying it from the vaccination card or on recall basis 1. Yes 2. No
CH09
Has the child' been given Penta 3, OPV3, Pneumococcal 3 ? Please write your answer either in 1 or 2 or yes or no Interviewer: Confirm by asking more questions. The question can be filled by verifying it from the vaccination card or on recall basis 1. Yes 2. No
CH10
Has the child' been given Measles 1? Please write your answer either in 1 or 2 or yes or no Interviewer: Confirm by asking more questions. The question can be filled by verifying it from the vaccination card or on recall basis 1. Yes 2. No
CH11
Has the child' been given Measles 2? Interviewer: Confirm by asking more questions. The question can be filled by verifying it from the vaccination card or on recall basis 1. Yes 2. No
CH12
Ok. Does this mother have another child under 2 years of age? Please write your answer either in 1 or 2 or yes or no. If they select option 1, they will get the message: "Let’s start interviewing her" and Part B of the questionnaire will start running again. If they select option 2, they will receive the message: "Thanks. Your responses have been recorded and the interview has ended. 1. Yes 2. No

38
Annex 2: Analysis of Household Coverage Survey
Table 1: Sample Size
Cities Households Mothers Children
Faisalabad 708 712 716
Gujranwala 918 918 918
Lahore 820 820 820
Multan 582 582 583
Rawalpindi 824 824 826
Islamabad 1072 1072 1072
Quetta 1782 1786 1792
Peshawar 1799 1807 1814
Karachi 4597 4605 4625
Hyderabad 1365 1365 1365
Total 14467 14491 14531
Table 2: Gender Wise Total Children
Cities Boys Girls Total
Faisalabad 404 312 716
Gujranwala 487 431 918
Lahore 449 371 820
Multan 336 247 583
Rawalpindi 441 385 826
Islamabad 586 486 1072
Quetta 929 863 1792
Peshawar 981 833 1814
Karachi 2409 2216 4625
Hyderabad 732 633 1365
Total 7754 6777 14531
Table 3: Number of Children of Each Mother of Less Than 2 Year of Age
Cities 1 2 3 Total
# # # #
Faisalabad 708 4 0 712
Gujranwala 918 0 0 918
Lahore 820 0 0 820
Multan 581 1 0 582
Rawalpindi 822 2 0 824
Islamabad 1072 0 0 1072
Quetta 1780 6 0 1786
Peshawar 1796 11 0 1807
Karachi 4585 20 0 4605
Hyderabad 1365 0 0 1365
Total 14447 44 0 14491
Table 4: Total Family Members with Gender Segregation
Cities Total Household members Male Female
Faisalabad 6192 3097 3095
Gujranwala 5888 2882 3006
Lahore 5298 2740 2558
Multan 3625 1808 1817
Rawalpindi 5883 2838 3045
Islamabad 8452 4111 4341
Quetta 18946 9133 9813
Peshawar 18592 8839 9753
Karachi 29772 15063 14709
Hyderabad 10641 5306 5335
Total 113289 55817 57472
Table 5: Average Family Size
Cities Average Family Size Average Male Members Average Female Members
Faisalabad 9 5 4
Gujranwala 6 3 3
Lahore 6 3 3
Multan 6 3 3
Rawalpindi 7 3 4
Islamabad 8 4 4
Quetta 11 5 6
Peshawar 10 5 5
Karachi 7 4 3
Hyderabad 8 4 4
Total 8 4 4
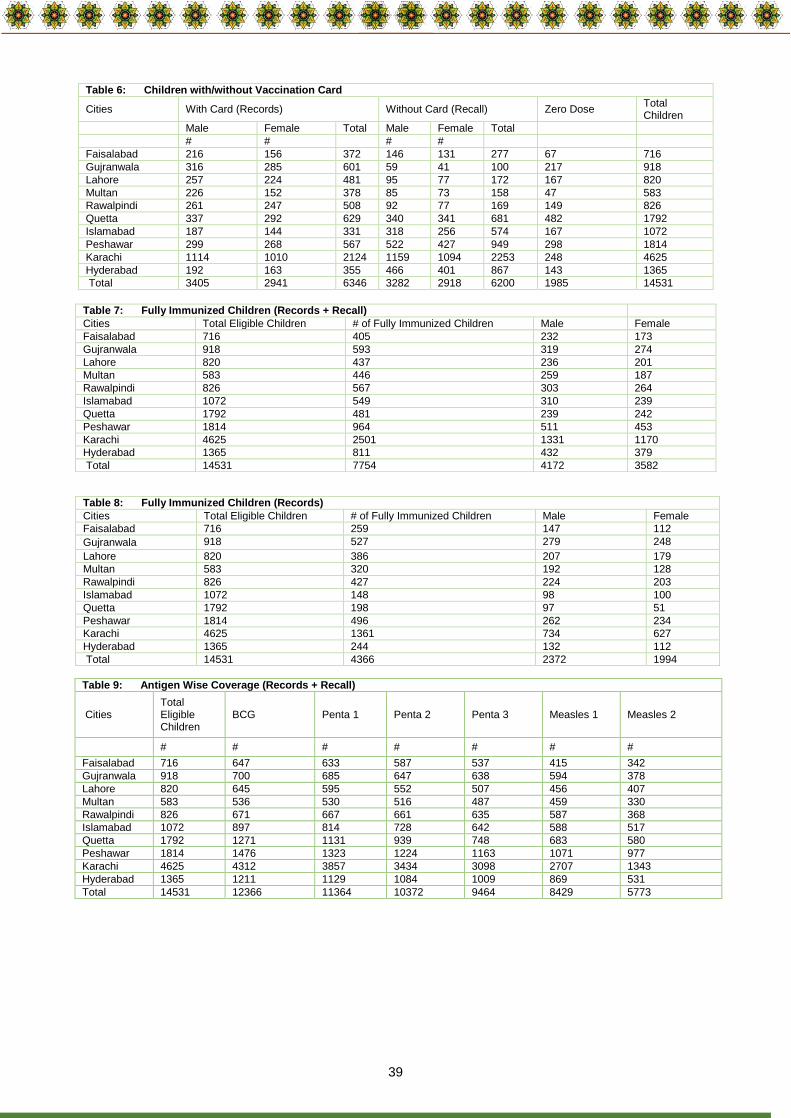
39
Table 6: Children with/without Vaccination Card
Cities With Card (Records) Without Card (Recall) Zero Dose Total Children
Male Female Total Male Female Total
# # # #
Faisalabad 216 156 372 146 131 277 67 716
Gujranwala 316 285 601 59 41 100 217 918
Lahore 257 224 481 95 77 172 167 820
Multan 226 152 378 85 73 158 47 583
Rawalpindi 261 247 508 92 77 169 149 826
Quetta 337 292 629 340 341 681 482 1792
Islamabad 187 144 331 318 256 574 167 1072
Peshawar 299 268 567 522 427 949 298 1814
Karachi 1114 1010 2124 1159 1094 2253 248 4625
Hyderabad 192 163 355 466 401 867 143 1365
Total 3405 2941 6346 3282 2918 6200 1985 14531
Table 9: Antigen Wise Coverage (Records + Recall)
Cities Total Eligible Children
BCG Penta 1 Penta 2 Penta 3 Measles 1 Measles 2
# # # # # # #
Faisalabad 716 647 633 587 537 415 342
Gujranwala 918 700 685 647 638 594 378
Lahore 820 645 595 552 507 456 407
Multan 583 536 530 516 487 459 330
Rawalpindi 826 671 667 661 635 587 368
Islamabad 1072 897 814 728 642 588 517
Quetta 1792 1271 1131 939 748 683 580
Peshawar 1814 1476 1323 1224 1163 1071 977
Karachi 4625 4312 3857 3434 3098 2707 1343
Hyderabad 1365 1211 1129 1084 1009 869 531
Total 14531 12366 11364 10372 9464 8429 5773
Table 7: Fully Immunized Children (Records + Recall)
Cities Total Eligible Children # of Fully Immunized Children Male Female
Faisalabad 716 405 232 173
Gujranwala 918 593 319 274
Lahore 820 437 236 201
Multan 583 446 259 187
Rawalpindi 826 567 303 264
Islamabad 1072 549 310 239
Quetta 1792 481 239 242
Peshawar 1814 964 511 453
Karachi 4625 2501 1331 1170
Hyderabad 1365 811 432 379
Total 14531 7754 4172 3582
Table 8: Fully Immunized Children (Records)
Cities Total Eligible Children # of Fully Immunized Children Male Female
Faisalabad 716 259 147 112
Gujranwala 918 527 279 248
Lahore 820 386 207 179
Multan 583 320 192 128
Rawalpindi 826 427 224 203
Islamabad 1072 148 98 100
Quetta 1792 198 97 51
Peshawar 1814 496 262 234
Karachi 4625 1361 734 627
Hyderabad 1365 244 132 112
Total 14531 4366 2372 1994

40
Table 10: Antigen Wise Coverage (Records)
Cities Total Eligible Children
BCG Penta 1 Penta 2 Penta 3 Measles 1 Measles 2
# # # # # # #
Faisalabad 716 370 368 363 358 261 197
Gujranwala 918 601 597 577 568 528 312
Lahore 820 473 468 454 431 401 357
Multan 583 378 376 369 340 327 249
Rawalpindi 826 503 500 494 479 438 284
Islamabad 1072 327 289 246 214 192 153
Quetta 1792 624 574 486 377 343 313
Peshawar 1814 542 551 539 538 520 453
Karachi 4625 2089 1984 1840 1656 1504 687
Hyderabad 1365 354 337 326 305 260 150
Total 14531 6261 6044 5694 5266 4774 3155
Table 11: Partially Vaccinated Children (Records+ Recall)
Cities FI (Records +Recall) ZD Partially Vaccinated
Faisalabad 405 67 244
Gujranwala 593 217 108
Lahore 437 167 216
Multan 446 47 90
Rawalpindi 567 149 110
Islamabad 549 167 356
Quetta 481 482 829
Peshawar 964 298 552
Karachi 2501 248 1876
Hyderabad 811 143 411
Total 7754 1985 4792
Table 12: Gender of Partially vaccinated Children on Record and Recall Basis
Cities Male Female Total
Faisalabad 130 114 244
Gujranwala 56 52 108
Lahore 116 100 216
Multan 52 38 90
Rawalpindi 50 60 110
Quetta 438 391 829
Islamabad 195 161 356
Peshawar 310 242 552
Karachi 942 934 1876
Hyderabad 226 185 411
Grand Total 2515 2277 4792
Table 14: Status of Zero Dose Children
Cities Zero Dose
Male Female Total
Faisalabad 42 25 67
Gujranwala 112 105 217
Lahore 97 70 167
Multan 25 22 47
Rawalpindi 88 61 149
Quetta 252 230 482
Islamabad 81 86 167
Peshawar 160 138 298
Karachi 136 112 248
Hyderabad 74 69 143
Total 1067 918 1985
Table 13: Partially Vaccinated Children (Records)
Cities FI (Records) With Card Partially Vaccinated
Faisalabad 259 372 113 16%
Gujranwala 527 601 74 8%
Lahore 386 481 95 12%
Multan 320 378 58 10%
Rawalpindi 427 508 81 10%
Islamabad 148 331 183 17%
Quetta 198 629 431 24%
Peshawar 496 567 71 4%
Karachi 1361 2124 763 16%
Hyderabad 244 355 111 8%
Total 4366 6346 1980 14%
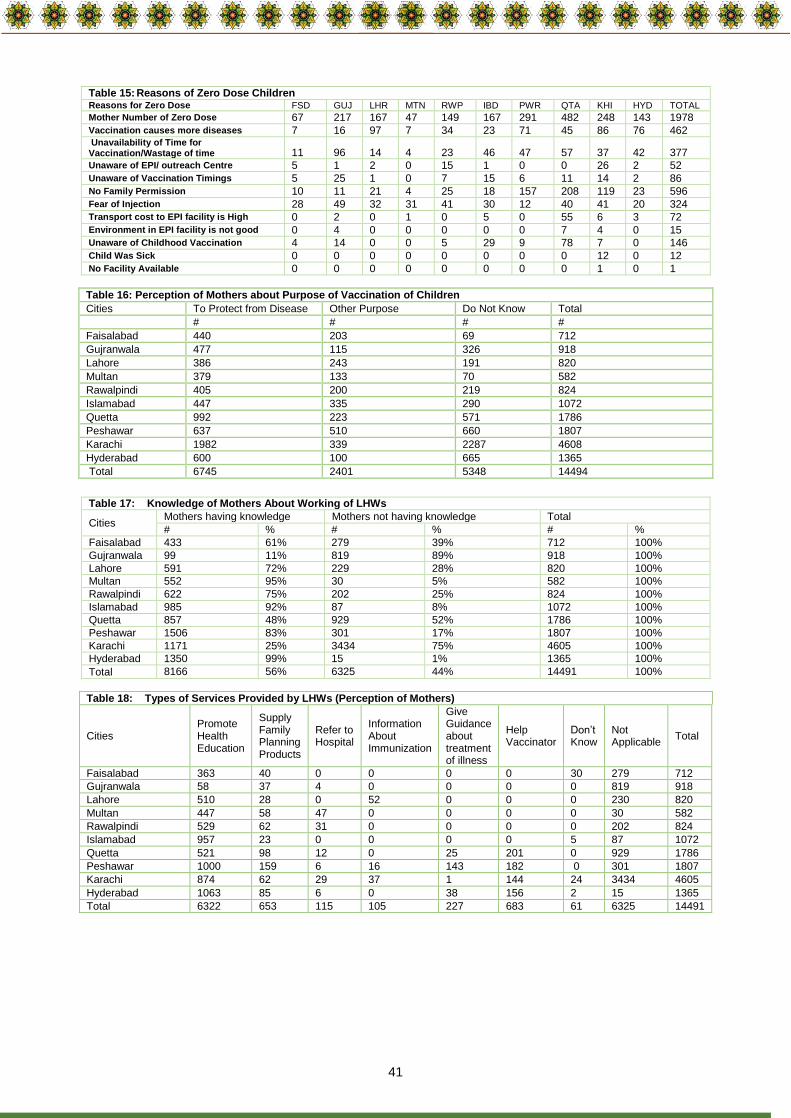
41
Table 15: Reasons of Zero Dose Children Reasons for Zero Dose FSD GUJ LHR MTN RWP IBD PWR QTA KHI HYD TOTAL
Mother Number of Zero Dose 67 217 167 47 149 167 291 482 248 143 1978 Vaccination causes more diseases 7 16 97 7 34 23 71 45 86 76 462 Unavailability of Time for Vaccination/Wastage of time 11 96 14 4 23 46 47 57 37 42 377 Unaware of EPI/ outreach Centre 5 1 2 0 15 1 0 0 26 2 52 Unaware of Vaccination Timings 5 25 1 0 7 15 6 11 14 2 86 No Family Permission 10 11 21 4 25 18 157 208 119 23 596 Fear of Injection 28 49 32 31 41 30 12 40 41 20 324 Transport cost to EPI facility is High 0 2 0 1 0 5 0 55 6 3 72 Environment in EPI facility is not good 0 4 0 0 0 0 0 7 4 0 15 Unaware of Childhood Vaccination 4 14 0 0 5 29 9 78 7 0 146 Child Was Sick 0 0 0 0 0 0 0 0 12 0 12 No Facility Available 0 0 0 0 0 0 0 0 1 0 1
Table 16: Perception of Mothers about Purpose of Vaccination of Children
Cities To Protect from Disease Other Purpose Do Not Know Total
# # # #
Faisalabad 440 203 69 712
Gujranwala 477 115 326 918
Lahore 386 243 191 820
Multan 379 133 70 582
Rawalpindi 405 200 219 824
Islamabad 447 335 290 1072
Quetta 992 223 571 1786
Peshawar 637 510 660 1807
Karachi 1982 339 2287 4608
Hyderabad 600 100 665 1365
Total 6745 2401 5348 14494
Table 17: Knowledge of Mothers About Working of LHWs
Cities Mothers having knowledge Mothers not having knowledge Total
# % # % # %
Faisalabad 433 61% 279 39% 712 100%
Gujranwala 99 11% 819 89% 918 100%
Lahore 591 72% 229 28% 820 100%
Multan 552 95% 30 5% 582 100%
Rawalpindi 622 75% 202 25% 824 100%
Islamabad 985 92% 87 8% 1072 100%
Quetta 857 48% 929 52% 1786 100%
Peshawar 1506 83% 301 17% 1807 100%
Karachi 1171 25% 3434 75% 4605 100%
Hyderabad 1350 99% 15 1% 1365 100%
Total 8166 56% 6325 44% 14491 100%
Table 18: Types of Services Provided by LHWs (Perception of Mothers)
Cities Promote Health Education
Supply Family Planning Products
Refer to Hospital
Information About Immunization
Give Guidance about treatment of illness
Help Vaccinator
Don’t Know
Not Applicable
Total
Faisalabad 363 40 0 0 0 0 30 279 712
Gujranwala 58 37 4 0 0 0 0 819 918
Lahore 510 28 0 52 0 0 0 230 820
Multan 447 58 47 0 0 0 0 30 582
Rawalpindi 529 62 31 0 0 0 0 202 824
Islamabad 957 23 0 0 0 0 5 87 1072
Quetta 521 98 12 0 25 201 0 929 1786
Peshawar 1000 159 6 16 143 182 0 301 1807
Karachi 874 62 29 37 1 144 24 3434 4605
Hyderabad 1063 85 6 0 38 156 2 15 1365
Total 6322 653 115 105 227 683 61 6325 14491

42
Table 19: Preferred Channels of Communication for Mothers
Cities T.V Radio Poster/Billboard Leaflet Health Worker Others
# # # # # #
Faisalabad 605 117 184 51 356 49
Gujranwala 339 35 50 11 93 378
Lahore 653 153 302 115 245 135
Multan 480 298 377 211 377 143
Rawalpindi 648 313 267 221 404 152
Islamabad 899 316 364 188 432 100
Quetta 604 363 303 215 561 488
Peshawar 662 313 266 172 1328 385
Karachi 1929 219 672 193 845 2763
Hyderabad 1155 168 154 104 1132 209
Total 7974 2295 2939 1481 5773 4802
Table 20: Age Range of Mothers Surveyed
Cities 14-19 20-24 25-29 30-34 35-39 40+ Total
# # # # # # #
Faisalabad 9 119 237 257 83 7 712
Gujranwala 11 175 354 261 107 10 918
Lahore 15 146 393 206 49 11 820
Multan 12 109 234 164 53 10 582
Rawalpindi 20 128 334 227 100 15 824
Islamabad 12 134 472 327 111 16 1072
Quetta 53 278 518 558 282 97 1786
Peshawar 63 318 575 455 319 77 1807
Karachi 132 949 1762 1224 461 77 4605
Hyderabad 20 320 459 395 141 30 1365
Total 284 2676 5338 4074 1706 350 14491
Table 21: Years of Schooling Completed by Mothers
Cities 0 1-5 6-10 11-15 15+ Total
# # # # # #
Faisalabad 224 155 254 65 14 712
Gujranwala 160 211 395 131 21 918
Lahore 419 90 235 68 8 820
Multan 184 148 187 63 0 582
Rawalpindi 367 119 202 109 27 824
Islamabad 617 160 241 49 5 1072
Quetta 1486 131 106 62 1 1786
Peshawar 1335 151 221 89 11 1807
Karachi 2347 700 1199 336 23 4605
Hyderabad 976 227 65 94 3 1365
Total 8115 2092 3105 1066 113 14491
Table 22: Engagement of Mothers in Livelihood Activities
Cities Yes No Total
# # #
Faisalabad 13 699 712
Gujranwala 38 880 918
Lahore 35 785 820
Multan 52 530 582
Rawalpindi 26 798 824
Islamabad 99 973 1072
Quetta 76 1710 1786
Peshawar 79 1728 1807
Karachi 354 4251 4605
Hyderabad 61 1304 1365
Total 833 13658 14491
Table 23: Commonly Spoken Languages
Cities Urdu Punjabi Potohari Balochi Pashto Sindhi Siraiki Others Total
# # # # # # # # #
Faisalabad 5 685 0 0 3 0 15 0 708
Gujranwala 302 604 1 1 10 0 0 0 918
Lahore 142 587 0 1 51 1 8 30 820
Multan 93 205 0 0 6 0 277 1 582
Rawalpindi 149 475 11 4 129 3 41 12 824
Islamabad 98 622 96 0 226 1 7 22 1072
Quetta 18 34 9 313 971 71 34 332 1782
Peshawar 150 7 4 1 1567 0 0 70 1799
Karachi 1017 618 18 555 784 825 333 447 4597
Hyderabad 287 52 2 54 38 606 135 191 1365
Total 2261 3889 141 929 3785 1507 850 1105 14467

43
Table 24: Housing Structures
Cities Kacha Kacha-Pacca Pacca Total
# # # #
Faisalabad 70 259 379 708
Gujranwala 113 203 602 918
Lahore 175 135 510 820
Multan 90 63 429 582
Rawalpindi 135 177 512 824
Islamabad 432 256 384 1072
Quetta 1006 700 76 1782
Peshawar 513 662 624 1799
Karachi 997 1388 2212 4597
Hyderabad 117 664 584 1365
Total 3648 4507 6312 14467
Table 25: Number of Rooms per House
Cities 1 Room 2-3 Rooms 4-6 Rooms 7-10 Rooms 10+ Rooms Total
# # # # # #
Faisalabad 175 455 73 5 0 708
Gujranwala 95 633 183 7 0 918
Lahore 365 400 51 4 0 820
Multan 114 413 55 0 0 582
Rawalpindi 158 539 116 10 1 824
Islamabad 422 632 16 2 0 1072
Quetta 277 994 446 59 6 1782
Peshawar 222 1021 477 79 0 1799
Karachi 2539 1838 204 15 1 4597
Hyderabad 648 632 82 3 0 1365
Total 5015 7557 1703 184 8 14467
Table 26: Availability of Electricity
Cities Houses With Electricity Houses Without Electricity Total
# # #
Faisalabad 688 20 708
Gujranwala 896 22 918
Lahore 740 80 820
Multan 565 17 582
Rawalpindi 781 43 824
Islamabad 938 134 1072
Quetta 1615 167 1782
Peshawar 1774 25 1799
Karachi 4436 161 4597
Hyderabad 1321 44 1365
Total 13754 713 14467
Table 28: Duration of Water Availability in Case of Government Water Supply
Cities Less than 1 hour
1-5 hours 6-10 hours 11-15 hours
16-20 hours 20+ Hours
Total
# # # # # # #
Faisalabad 0 88 18 0 0 1 107
Gujranwala 0 9 6 0 0 0 15
Lahore 0 219 207 54 16 2 498
Multan 0 139 78 0 0 0 217
Rawalpindi 0 317 5 0 0 0 322
Islamabad 0 221 57 0 0 0 278
Quetta 0 485 0 0 0 1 486
Peshawar 0 306 117 1 3 3 430
Karachi 1205 1083 227 110 33 312 2970
Hyderabad 2 569 192 91 151 0 1005
Total 1207 3436 907 256 203 319 6328
Table 27: Sources of Water
Cities Government Water Supply Ground Water Acquire Water Total
# # # #
Faisalabad 107 513 88 708
Gujranwala 15 712 191 918
Lahore 498 299 23 820
Multan 217 361 4 582
Rawalpindi 322 389 113 824
Islamabad 278 778 16 1072
Quetta 486 182 1114 1782
Peshawar 430 1356 13 1799
Karachi 2970 1075 552 4597
Hyderabad 1005 354 6 1365
Total 6328 6019 2120 14467

44
Table 29: Household Toilets
Cities Connected with Street Drains Traditional Latrine/ Open Pit Houses Without Toilets Total
# # # #
Faisalabad 166 495 47 708
Gujranwala 560 340 18 918
Lahore 393 343 84 820
Multan 425 151 6 582
Rawalpindi 465 287 72 824
Islamabad 430 468 174 1072
Quetta 704 1039 39 1782
Peshawar 555 1236 8 1799
Karachi 4232 214 151 4597
Hyderabad 668 583 114 1365
Total 8598 5156 713 14467
Table 30: Average Users of One Toilet
Cities Average Toilets Users
Faisalabad 8
Gujranwala 5
Lahore 5
Multan 6
Rawalpindi 6
Islamabad 7
Quetta 10
Peshawar 9
Karachi 6
Hyderabad 7
Total 7
Table 31: Modes of Defecation in the Case of Unavailability of Household Toilet
Cities Neighbor’s Toilet Public Toilet Open Defecation Houses with Toilets Total
# # # # #
Faisalabad 3 0 44 661 708
Gujranwala 0 1 17 900 918
Lahore 0 1 83 736 820
Multan 0 1 5 576 582
Rawalpindi 1 8 63 752 824
Islamabad 0 0 174 898 1072
Quetta 1 0 38 1743 1782
Peshawar 2 0 6 1791 1799
Karachi 19 52 82 4444 4597
Hyderabad 17 10 87 1251 1365
Total 41 73 599 13754 14467
Table 32: Major Professions
Cities Job (Government Job, Private Job, Work in Foreign Country)
Small Business Daily Wage Labor Total
# # # #
Faisalabad 98 172 438 708
Gujranwala 322 174 422 918
Lahore 226 197 397 820
Multan 170 177 235 582
Rawalpindi 283 153 388 824
Islamabad 126 164 782 1072
Quetta 384 434 964 1782
Peshawar 378 445 976 1799
Karachi 1788 426 2383 4597
Hyderabad 321 183 861 1365
Total 4096 2525 7846 14467
Table 33: Status of Financial Debt/Savings
Cities Debt (Always / Occasional) No Debt, No Savings Savings Total
# # # #
Faisalabad 399 293 16 708
Gujranwala 460 235 223 918
Lahore 453 277 90 820
Multan 254 234 94 582
Rawalpindi 383 392 49 824
Islamabad 608 462 2 1072
Quetta 1288 394 100 1782
Peshawar 651 1085 63 1799
Karachi 2882 1536 179 4597
Hyderabad 682 611 72 1365
Total 8060 5519 888 14467

45
Background Characteristics of Zero Dose Children
Table 35: Major Professions of Caregivers of Zero Dose Children
Cities Job Holders Small Business Daily wage Labor Other Total
# # # # #
Faisalabad 4 6 57 0 67
Gujranwala 69 35 113 0 217
Lahore 20 18 128 1 167
Multan 7 15 25 0 47
Rawalpindi 27 21 101 0 149
Islamabad 2 6 147 12 167
Quetta 61 116 294 7 478
Peshawar 42 87 154 0 283
Karachi 65 33 150 0 248
Hyderabad 21 22 87 13 143
Total 318 359 1256 33 1966
Table 36: Status of Financial Debt/Savings in Households of Zero Dose Children
Cities Debt (Always / Occasional) No Debt, No Savings Savings Total
# # # #
Faisalabad 52 15 0 67
Gujranwala 99 67 51 217
Lahore 88 62 17 167
Multan 22 23 2 47
Rawalpindi 85 62 2 149
Islamabad 119 48 0 167
Quetta 383 75 20 478
Peshawar 130 146 7 283
Karachi 189 55 4 248
Hyderabad 68 70 5 143
Total 1235 623 108 1966
s
Table 37: Family Sizes of Zero Dose
Cities Average Family Size Male Members Female Members Total Members
# # #
Faisalabad 7 226 266 492
Gujranwala 6 649 708 1357
Lahore 7 557 560 1117
Multan 6 154 160 314
Rawalpindi 8 566 634 1200
Islamabad 7 593 645 1238
Quetta 11 2556 2655 5211
Peshawar 11 1632 1807 3439
Karachi 7 875 858 1733
Hyderabad 7 529 511 1040
Total 7 8337 8804 17141
Table 38: Housing Structures of Zero Dose Children
Cities Kacha Kacha-Pacca Pacca Total
# # # #
Faisalabad 21 23 23 67
Gujranwala 42 30 145 217
Lahore 100 26 41 167
Multan 2 3 42 47
Rawalpindi 59 34 56 149
Islamabad 143 14 10 167
Quetta 306 157 15 478
Peshawar 56 131 96 283
Karachi 86 89 73 248
Hyderabad 29 70 44 143
Total 844 577 545 1966
Table 34: Education Level of Mothers of Zero Dose Children
Cities 0 (Illiterate) 01—05 06—10 11—15 Total
# # # # #
Faisalabad 41 16 5 5 67
Gujranwala 40 55 107 15 217
Lahore 153 6 7 1 167
Multan 17 16 13 1 47
Rawalpindi 117 16 16 0 149
Islamabad 136 22 9 0 167
Quetta 439 28 11 4 482
Peshawar 240 17 30 4 291
Karachi 206 25 14 3 248
Hyderabad 116 18 5 4 143
Total 1505 219 217 37 1978
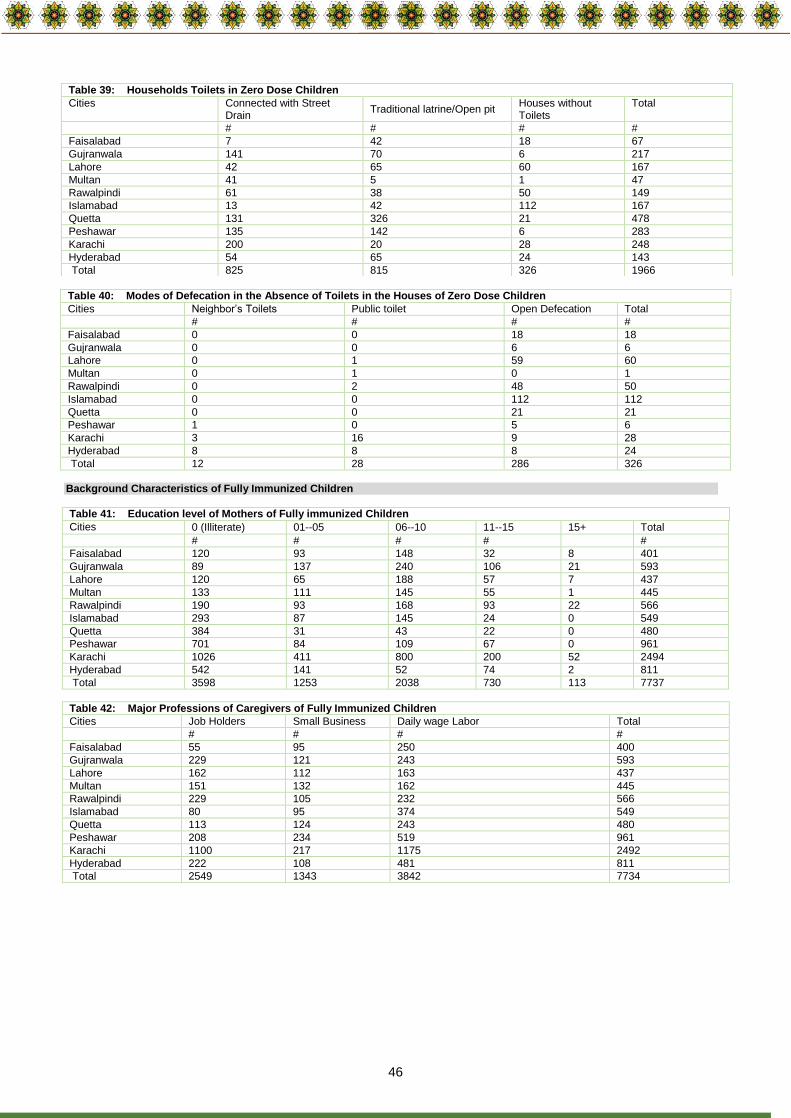
46
Table 40: Modes of Defecation in the Absence of Toilets in the Houses of Zero Dose Children
Cities Neighbor’s Toilets Public toilet Open Defecation Total
# # # #
Faisalabad 0 0 18 18
Gujranwala 0 0 6 6
Lahore 0 1 59 60
Multan 0 1 0 1
Rawalpindi 0 2 48 50
Islamabad 0 0 112 112
Quetta 0 0 21 21
Peshawar 1 0 5 6
Karachi 3 16 9 28
Hyderabad 8 8 8 24
Total 12 28 286 326
Background Characteristics of Fully Immunized Children
Table 41: Education level of Mothers of Fully immunized Children
Cities 0 (Illiterate) 01--05 06--10 11--15 15+ Total
# # # # #
Faisalabad 120 93 148 32 8 401
Gujranwala 89 137 240 106 21 593
Lahore 120 65 188 57 7 437
Multan 133 111 145 55 1 445
Rawalpindi 190 93 168 93 22 566
Islamabad 293 87 145 24 0 549
Quetta 384 31 43 22 0 480
Peshawar 701 84 109 67 0 961
Karachi 1026 411 800 200 52 2494
Hyderabad 542 141 52 74 2 811
Total 3598 1253 2038 730 113 7737
Table 42: Major Professions of Caregivers of Fully Immunized Children
Cities Job Holders Small Business Daily wage Labor Total
# # # #
Faisalabad 55 95 250 400
Gujranwala 229 121 243 593
Lahore 162 112 163 437
Multan 151 132 162 445
Rawalpindi 229 105 232 566
Islamabad 80 95 374 549
Quetta 113 124 243 480
Peshawar 208 234 519 961
Karachi 1100 217 1175 2492
Hyderabad 222 108 481 811
Total 2549 1343 3842 7734
Table 39: Households Toilets in Zero Dose Children
Cities Connected with Street Drain
Traditional latrine/Open pit Houses without Toilets
Total
# # # #
Faisalabad 7 42 18 67
Gujranwala 141 70 6 217
Lahore 42 65 60 167
Multan 41 5 1 47
Rawalpindi 61 38 50 149
Islamabad 13 42 112 167
Quetta 131 326 21 478
Peshawar 135 142 6 283
Karachi 200 20 28 248
Hyderabad 54 65 24 143
Total 825 815 326 1966
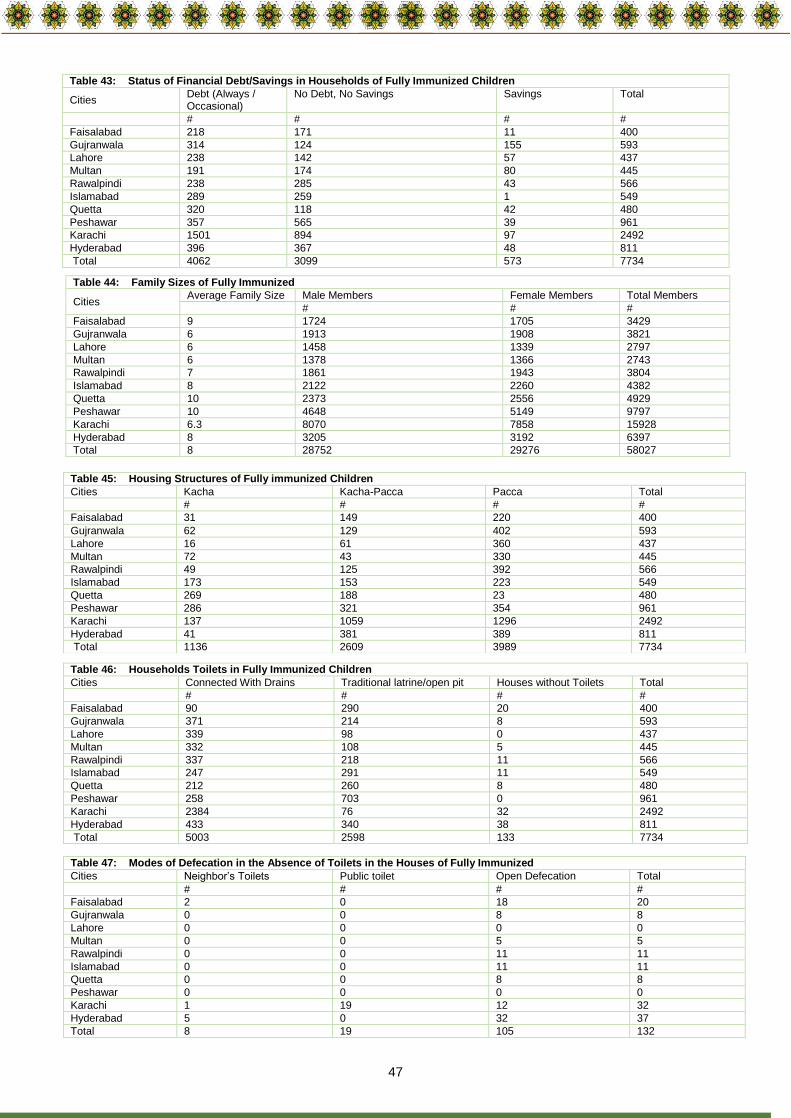
47
Table 43: Status of Financial Debt/Savings in Households of Fully Immunized Children
Cities Debt (Always / Occasional)
No Debt, No Savings Savings Total
# # # #
Faisalabad 218 171 11 400
Gujranwala 314 124 155 593
Lahore 238 142 57 437
Multan 191 174 80 445
Rawalpindi 238 285 43 566
Islamabad 289 259 1 549
Quetta 320 118 42 480
Peshawar 357 565 39 961
Karachi 1501 894 97 2492
Hyderabad 396 367 48 811
Total 4062 3099 573 7734
Table 46: Households Toilets in Fully Immunized Children
Cities Connected With Drains Traditional latrine/open pit Houses without Toilets Total
# # # #
Faisalabad 90 290 20 400
Gujranwala 371 214 8 593
Lahore 339 98 0 437
Multan 332 108 5 445
Rawalpindi 337 218 11 566
Islamabad 247 291 11 549
Quetta 212 260 8 480
Peshawar 258 703 0 961
Karachi 2384 76 32 2492
Hyderabad 433 340 38 811
Total 5003 2598 133 7734
Table 47: Modes of Defecation in the Absence of Toilets in the Houses of Fully Immunized
Cities Neighbor’s Toilets Public toilet Open Defecation Total
# # # #
Faisalabad 2 0 18 20
Gujranwala 0 0 8 8
Lahore 0 0 0 0
Multan 0 0 5 5
Rawalpindi 0 0 11 11
Islamabad 0 0 11 11
Quetta 0 0 8 8
Peshawar 0 0 0 0
Karachi 1 19 12 32
Hyderabad 5 0 32 37
Total 8 19 105 132
Table 44: Family Sizes of Fully Immunized
Cities Average Family Size Male Members Female Members Total Members
# # #
Faisalabad 9 1724 1705 3429
Gujranwala 6 1913 1908 3821
Lahore 6 1458 1339 2797
Multan 6 1378 1366 2743
Rawalpindi 7 1861 1943 3804
Islamabad 8 2122 2260 4382
Quetta 10 2373 2556 4929
Peshawar 10 4648 5149 9797
Karachi 6.3 8070 7858 15928
Hyderabad 8 3205 3192 6397
Total 8 28752 29276 58027
Table 45: Housing Structures of Fully immunized Children
Cities Kacha Kacha-Pacca Pacca Total
# # # #
Faisalabad 31 149 220 400
Gujranwala 62 129 402 593
Lahore 16 61 360 437
Multan 72 43 330 445
Rawalpindi 49 125 392 566
Islamabad 173 153 223 549
Quetta 269 188 23 480
Peshawar 286 321 354 961
Karachi 137 1059 1296 2492
Hyderabad 41 381 389 811
Total 1136 2609 3989 7734

48