LB!@= (8 #8 29 IA &F - 4 : GH < - K ; GH < -D GH LB ......qW*vg)+ x 4-

November 28, 2007
Document of the World Bank
Report No. 40934-GH
GhanaMeeting the Challenge of Accelerated and Shared Growth
(In Three Volumes) Volume I: Synthesis
PREM 4Africa Region
Report N
o. 40934-GH
Ghana
Meeting the C
hallenge of Accelerated and Shared G
rowth
Volume I
Country Economic Memorandum
40934 v1P
ublic
Dis
clos
ure
Aut
horiz
edP
ublic
Dis
clos
ure
Aut
horiz
edP
ublic
Dis
clos
ure
Aut
horiz
edP
ublic
Dis
clos
ure
Aut
horiz
ed

iii
FAO Food and Agriculture Organization of the United Nations FASDEP Food and Agriculture Sector Development Policy FBO Farmer-Based Organizations FDI Foreign Direct Investment FEER Fundamental Equilibrium Exchange Rate GASCO Ghana Association of Stevedoring Companies GCC Ghana Co-operatives Council GCNet Customs and Trade facilitation e-government application GDP Gross Domestic Product GHA Ghana Highway Authority GIPC Ghana Investment Promotion Centre GIS Geographic Information System G-JAS Ghana - Joint Assistance Strategy GLSS Ghana Living Standars Survey GMES Ghana Manufacturing Enterprise Survey GMM Generalized Method of Moments GNI Gross National Income GoG Government of Ghana GPHA Ghana Port Harbour Authority GPRS Ghana Poverty Reduction Strategy GSP Generalized System of Preferences GSS Ghana Statistical Service GT Ghana Telecom GWCL Ghana Water Company Ltd GWEP Guinea Worm Eradication Program HD Human Development HHI Herfindahl-Hirschman Index HIPC Heavily Indebted Poor Countries HP Hodrick-Prescott ICA Investment Climate Assessment ICOR Incremental Capital Output Ratio ICT Information and Communication Technology IFC International Finance Corporation IFPRI Internal Food Policy Research Institute IITA International Institute of Tropical Agriculture IMF International Monetary Fund IOCT Incremental Output-Capital Ratio IPP Independent Power Producer ISP Internet Service Provider ISSER Institute of Statistical, Social and Economic Research (University of Ghana) IT Information Technology ITES IT Enabled Services ITU International Telecommunications Union JTC-IWRM Joint Ghana-Burkina Technical Committee on Integrated Water Resources
Management KWh Kilowatt/hour LBC Licenced Buying Company LCU Local Currency Unit LDB World Bank’s Live Data Base M or m Million M2 Ratio of Money to quasy-money

iv
MAMS A CGE model for MDG Simulations MBB Marginal Budgeting for Bottlenecks MCA Millenium Challenge Account MDBS/PRSC Poverty Reduction Support Credit MDG Millenium Development Goal MDRI Multilateral Debt Relief Initiative MENA Middle East and North Africa MG Mean Group MIC Middle-Income Countries MMYE Ministry of Manpower, Youth and Employment MoE Ministry of Energy MP Members of Parliament MPS Meridian Port Services MRPH Ministry of Railways, Ports and Harbours MRT Ministry of Roads and Transport MTC Ministry of Transport and Communication MW Mega Watt MWH Ministry of Works and Housing MWRWH Ministry of Water Resources, Works and Housing NCA National Communications Authority NDPC National Development Planning Commission NEAP National Environmental Action Plan NED Northern Electricity Department NEF National Electrification Funds NEP National Electrification Project NEPAD New Partnership for Africa’s Development NGOs Non Governmental Organization NITA National Information Technology Agency NTP National Communications Authority O&M Operation and Maintenance ODAs Official Development Assistance PMG Pooled Mean Group model PPP Public Private Partnership PPRC Producer Price Review Committee PRSC Poverty Reduction Support Credit PSI Presidential Special Initiative PURC Public Utilities Regulatory Commission RCA Revealed Comparative Advantage RDSP Road Sector Development Program RPED Regional Program for Enterprise Development REA Rural Electrification Agency REER Real Effective Exchange Rate RELC Research/ Extension Liaison Committees REF Rural Electrification Fund RER Real Exchange Rate RPED Regional Program on Enterprise Development RSDP Road Sector Development Program SAM Social Accounting Matrix SAT Submarine Fiber-optic Cable SBI Sustainable Budget Index (Botswana) SHEP Self-Help Electricity Program

v
SIP Strategy Investment Plan SMLE Small, Medium and Large Enterprise SMS Short Message Service SNO Second National Operator SOEs State-owned Enterprises SPS Stringent Sanitary and Phyto-sanitary SSA Sub-Saharan Africa SWAp Sector-Wide Approach TFP Total Factor Productivity TMP Telenor Management Partner TMS Tropical Manioc Selection TOT Terms of Trade TUC Trades Union Congress UEMOA Union économique et monétaire ouest africaine (West African Economic and
Monetary Union) UK United Kingdom UN United Nations UNDP United Nations Development Programme US United States USAID United States Agency for International Development UW Upper West region VALCO Volta Aluminum Company VBTC Volta Basin Technical Committee VoIP Voice over Internet Protocol VRA Volta River Authority WAGP West African Gas Pipeline WAPGOco West African Gas Pipeline Company WAPP West African Power Pool WATTFP West Africa Transport and Transit Facilitation Project WB World Bank WBES World Business Environment Survey WDI World Development Indicators WDR World Development Report WESTEL Western Telesystems WIAD Women in Agricultural Development WRC Water Resources Commission
Vice President: Country Director:
Sector Director: Sector Manager:
Task Team Leader:
Obiageli K. Ezekwesili (AFRVP) Mats Karlsson (AFCF1) Sudhir Shetty (AFTPM) Antonella Bassani (AFTP4) Zeljko Bogetic (AFTP4)

vi
TABLE OF CONTENTS
FOREWORD ............................................................................................................................................. ix
PREFACE...................................................................................................................................................xi
ACKNOWLEDGEMENTS .....................................................................................................................xii
EXECUTIVE SUMMARY ...................................................................................................................... xv
1. GHANA’S GROWTH STORY: LOOKING BACK......................................................................... 1
BACKGROUND AND GHANA’S CURRENT GROWTH CONTEXT ........................................................... 1 Brief, longer-term perspective on Ghana’s growth.......................................................................... 1 Ghana’s current policy and growth context ..................................................................................... 5 Ghana’s growth, poverty, and inequality ....................................................................................... 10 Ghana’s growth aspirations and challenges ................................................................................... 14
GROWTH ANALYTICS: ANALYZING DIMENSIONS OF GHANA’S GROWTH...................................... 17 Aggregate growth accounting: Factor accumulation vs. productivity growth ............................... 18 Factor reallocations and technology changes in Ghana’s growth.................................................. 21 Agricultural growth........................................................................................................................ 23 Closer look at agricultural productivity during 2001–05............................................................... 25 Aggregate capital and labor productivity and investments ............................................................ 27 Supply (sectoral) structure of Ghana’s growth .............................................................................. 31 Demand structure of Ghana’s growth ............................................................................................ 36 Trends in employment and earnings .............................................................................................. 42 Ghana’s growth from a household perspective.............................................................................. 46 Constraints to Ghana’s accelerated growth.................................................................................... 48
2. LOOKING FORWARD: ACHIEVING ACCELERATED AND SHARED GROWTH............ 52
Ghana’s baseline growth scenario ................................................................................................. 56 Ghana’s accelerated growth scenario and removal of infrastructure gaps..................................... 60 Absorption capacity ....................................................................................................................... 62 Ghana’s MDG achievement scenario ............................................................................................ 63 Labor market effects and trade-offs in the world of accelerated growth ....................................... 66 Summing up: Ghana’s growth story looking forward ................................................................... 69
REFERENCES ....................................................................................................................................... 73
ANNEXES:
Annex 1: Managing Oil Revenues: Ghana’s Future Challenge and Lessons of Experience .................... 77 Annex 2: Forging a Mutually Beneficial Economic Relationship with China ......................................... 80

vii
TABLES:
Table 1.1: Ghana’s quality of economic policies (2005 CPIA index) within Sub-Saharan Africa, on a scale of 1 (lowest) to 6 (highest) ........................................................................................ 5 Table 1.2: Ghana - Poverty headcount and inequality, by locality and urban/rural, 1991-2006 .............. 12 Table 1.3: Decomposition of change in poverty headcount - Total, urban, and rural areas (%) .............. 13 Table 1.4: Ghana - Growth rates and sources of growth from a Solow-Denison Model (%) ................... 21 Table 1.5: Ghana - Employment share by sector and the most recent changes (%) ................................. 21 Table 1.6: Ghana - Contribution of intersector labor reallocation to Solow residual (%) ........................ 22 Table 1.7: Sensitivity analysis - Growth contribution through increasing return to scale ........................ 23 Table 1.8: Ghana agricultural sector - Growth rates and sources of growth from a Solow-Denison Model (%) ...................................................................................................... 24 Table 1.9: Agricultural crop and livestock production, 1995–2004 (%) .................................................. 25 Table 1.10: Growth, investment and productivity, average 2001-05 (%)................................................... 29 Table 1.11: Ghana - Sectoral sources of economic growth, 1980–2006 (%).............................................. 32 Table 1.12: Ghana’s agriculture sector - Growth, output shares, and growth contributions, 1980–2006... 33 Table 1.13: Ghana’s industry - Growth, output shares and contributions to growth, 1980–2006 (%) ....... 35 Table 1.14: Ghana’s service sector - Growth, output shares, and contributions to growth, 1980-2006 ..... 36 Table 1.15: GDP growth and decomposition of the demand-side contributions, 1970-2004 (%) .............. 38 Table 1.16: Ghana - Co-movement between GDP growth and changes in external prices, 1985-2005..... 39 Table 1.17: Employment, unemployment, and underemployment rates (%), 1991 to 2006....................... 43 Table 1.18: Shares of employment by type of employment and geographic location (%), 1991 to 2006 ..44 Table 1.19: Average Annual Earnings (in ‘000’ cedis, Accra January 2006 prices) and Weekly Hours Worked, 1991/2006................................................................................... 46 Table 1.20: Contributions of key factors to growth in household consumption, 1991-2006 (%)............... 47 Table 1.21: Ghana - Annual infrastructure funding gap (US$m) ................................................................ 50 Table 2.1: MDG progress in Ghana, 1990–2004 ...................................................................................... 52 Table 2.2: Ghana - Public spending on infrastructure and human development, 2004 ............................ 55 Table 2.3: Ghana - Projected macro variables in the baseline scenario.................................................... 56 Table 2.4: Ghana - Projected MDG achievements in the baseline scenario ............................................. 59 Table 2.5: Ghana - Projected macro variables in the accelerated growth scenario................................... 61 Table 2.6: Ghana - Projected MDG achievements in the accelerated growth scenario ............................ 62 Table 2.7: Ghana - Structure of public finance ......................................................................................... 64 Table 2.8: Ghana - Projected macro variables in the foreign grant MDG scenario .................................. 66 Table 2.9: Ghana - Factor market performance ........................................................................................ 67
viii
FIGURES:
Figure 1.1: Sub-Saharan Africa: Average annual GDP per capita growth and ratio of per capita incomes, 1960–2004 ............................................................................................ 2 Figure 1.2: Growth experiences of African countries, 2000–05................................................................. 3 Figure 1.3: Contributions of factors influencing growth ............................................................................ 4 Figure 1.4: Potential GDP per capita, and real GDP and GNI per capita, 1970–2004 ............................... 4 Figure 1.5: Ghana - Stabilization with accelerating growth, 2000-05 ........................................................ 6 Figure 1.6: Doing business indicators 2005-06 .......................................................................................... 7 Figure 1.7: Managers’ responses on biggest investment climate constraints, MLEs and microenterprises ...................................................................................................... 8 Figure 1.8: Ghana's long-term trend and short-term growth per capita (%) ............................................... 9 Figure 1.9: Predictability of Aid - Some Country Examples .................................................................... 10 Figure 1.10: Ghana's poverty reduction vs. Africa, 1991–2002 to 2005–06 (poverty %) .......................... 11 Figure 1.11: Ghana’s growth incidence curve, 1998–99 to 2005–06 ......................................................... 14 Figure 1.12: Ghana’s growth incidence curve, 1991–92 to 2005–06 ......................................................... 14 Figure 1.13: Average annual growth of yield per ha, 2001–05 .................................................................. 26 Figure 1.14: Average annual growth of cultivated area, 2001–05.............................................................. 26 Figure 1.15: Capital per worker and labor productivity.............................................................................. 27 Figure 1.16: Ghana - Fixed capital formation by public and private sectors and foreign direct investment................................................................................................. 28 Figure 1.17: Ghana - Growth and investment efficiency, 1969–2005........................................................ 29 Figure 1.18: Ghana - Iso-growth curves, annual averages, 2001-05 (%).................................................... 30 Figure 1.19: Ghana and Mauritius - Contribution to GDP growth by aggregated expenditure category ... 37 Figure 1.20: Ghana - GDP growth and annual % change of export price (1 year lag), 1985-2005............ 39 Figure 1.21: Ghana’s terms of trade and current account balance .............................................................. 40 Figure 1.22: Ghana - Income effect of TOT and GDP growth per diem, 1981–2006 ................................ 41 Figure 2.1: Ghana - Sources of growth in the 3 MAMS scenarios ........................................................... 58 Figure 2.2: Ghana - Growth incidence curve for the baseline and MDG scenarios ................................. 59 Figure 2.3: Resource requirements for the achievement of MDGs of alternative growth paths............... 64 Figure 2.4: Infrastructure-human development trade-off.......................................................................... 68 BOXES Box 1.1: Ghana - Main Findings of the Previous CEM (2004) ................................................................ 15 Box 1.2: Growth analytics - Eclectic Approach to Analyzing Growth in this CEM ................................ 18 Box 1.3: Variable Definitions and Data Sources in Growth Accounting ................................................. 20 Box 1.4: Factors Explaining the Doubling of Cocoa Production, 2002–04.............................................. 34 Box 1.5: Africa’s Success Stories - Mauritius and Botswana................................................................... 41 Box 1.6: Ghana’s Urbanization, Youth, Education, and Poverty Reduction ............................................ 48 Box 1.7: Ghana’s Twin Infrastructure Crises: Energy, and Water and Sanitation ................................... 49 Box 2.1: Maquette for MDG Simulations (MAMS) - Technical Details.................................................. 54


ix
FOREWORD
By
Honorable Dr. A. Akoto Osei
Minister of State
In the Ministry of Finance and Economic Planning
1. Ghana has done increasingly well in recent years. Our country’s economic growth--central to the poverty reduction and our middle-income status aspirations--has been strong. For without strong, robust and sustained growth over the long term, there cannot be sustained and deep reduction in poverty. In the past few years, Ghana’s growth has averaged 6 percent. Ghana has also managed to reduce the share of the population living in poverty significantly, from about 52% in 1991/2 to 28.5% in 2005/6. And we are well ahead of schedule to achieve the poverty millennium development goal of halving poverty, one of the few African countries to do so. We are noted as one of the top economic reformers among African countries in the latest World Bank’s Doing Business report and foreign investors have taken note of Ghana’s improved policy environment and economic performance.
2. The lynchpin of these achievements has been prudent macroeconomic policy—monetary-exchange and fiscal management--which helped lower inflation while avoiding exchange rate overvaluation. But we also made major strides in a number of areas, improving roads and primary education for example, and we are constantly striving to improve governance, public financial management and our institutions using best practice examples of other countries (e.g., value-for-money, which we are initiating in public sector activities). At the same time, there are indications that important sectors of our rural economy are also performing much better than in the past (cocoa, horticulture).
3. Yet our development agenda is huge and there are spatial inequities that require attention, so there is no room for complacency. Not only must we preserve these hard won gains, but we must do even better in the future. Indeed, Ghana can and must achieve even higher, accelerated growth of 7-8 percent, which would help truly transform our society and put it firmly on a path towards the middle income status. No doubt this will be challenging. And no doubt there are significant constraints---infrastructure gaps, agricultural productivity, and some elements of the investment climate. But it can be done. Many answers on how this might be accomplished are already available at the technical level. There are also challenges to improve regional equity and social inclusion to ensure that all benefit as much as possible from Ghana’s ongoing economic expansion. The policy challenge is to implement this remaining growth and wealth creation agenda with even greater vigor and urgency.
4. This report has analyzed these issues in considerable depth, making it a prime reference on Ghana’s growth and poverty experience and current policy challenges. The Ghana CEM report presented in these three volumes brings together detailed, relevant analyses of Ghana’s growth and MDGs, poverty reduction, infrastructure, agriculture, investment climate, export competitiveness, social inclusion and political economy. The analysis is comprehensive, of high quality, up-to-date, and timely. It offers tangible answers to some nagging questions that are on

x
the minds of many of us in and around the government: How does Ghana’s growth and poverty reduction performance compare with other countries? What are the sources of Ghana’s growth and how sustainable it is? Is there an evidence of a Dutch disease, a phenomenon of appreciating real exchange rate in response to a sizeable inflow of capital? And, perhaps most important for the current policy context, what are the key constraints to further, accelerated growth in Ghana, and how they can be overcome? What is the scope for scaling up for accelerated and shared growth and further progress on MDGs?
5. The reader will find that the report has strong focus on the Ghanaian context, with concrete, analytically sound and detailed answers to these and many other questions of importance for economic policy. The report brings new data, new analysis/knowledge, and new tools to bear on key development issues facing Ghana today. It is my hope, therefore, that it will be read widely not only among policymakers and development partners and specialized audiences but also among parliamentarians and other development stakeholders.
6. Finally, I wish to note the breadth and the quality of the process in preparing this report, which I believe could become a model for similar, multi-sector analytical exercises by the Bank and other development partners. The report—the Ghana CEM—was prepared by a team led by the World Bank, in close collaboration with a number of Ghanaian experts, institutions (e.g., Ministry of Finance and Economic Planning, Bank of Ghana, NDPC, GSS and think tanks, civil society) and other development partners. Intensive and productive collaboration with key stakeholders during the preparation of the report--from the concept stage, through various consultative workshops, to dissemination–makes the report highly relevant and timely for Ghana. The report’s intensive, four-day dissemination in Accra during September 2007, ensured that the main messages were carried to key development stakeholders in a highly participatory discussion. In this context, I also note the strong collaboration between the Ghana Statistical Service (GSS) and the World Bank. The Ghana MAMS model for policy analysis, developed under the Ghana CEM, and in close collaboration with the Ministry of Finance and Economic Planning, also allowed for useful policy simulations that informed the government’s thinking about policy choices and trade offs in its quest to solidify and accelerate economic growth and wealth creation.

xi
PREFACE
By
Mats Karlsson
World Bank Country Director for Ghana
1. In February 2006, the President of Ghana, John Agyekum Kufuor, invited the World Bank, led by the then Vice President for the Africa Region, Gobind Nankani, to a two-day session with the full Cabinet to discuss public policy choices to accelerate economic growth. An outcome was an invitation to the World Bank to provide comprehensive analytical work. While the World Bank has always provided critical analysis, a comprehensive engagement of this scale had not taken place for many years. In September 2006, the work on a Country Economic Memorandum (CEM) was launched. The objective was to analyze in depth constraints to Ghana’s economic growth and poverty reduction, to highlight critical policy options, and to inform public choice, as the country moves to operationalize its strategy to achieve accelerated and shared growth. Ghana and the Bank partnered particularly in growth and poverty analysis and in the specific sectors of energy, transport, agriculture, natural resource management, information technology, and the business environment.
2. This analysis has been taking place with strong support and participation by the Ministry of Finance and Economic Planning, sector ministries, Bank of Ghana, Ghana Statistical Service, the National Development Planning Commission (NDPC), and, importantly, a number of research institutions, and also other development partners. Five major consultations were held in Ghana. Preliminary research results were presented and reviewed at a technical workshop in Accra May 2–3, 2007, and subsequently revised and updated with the most recent data.
3. Importantly, the CEM was presented and broadly endorsed at the June 18–19, 2007, Consultative Group meeting. At this meeting, Government and its partners agreed on a Partnership Strategy, based on a modern joint results framework and resource overview. The CEM is thus helping to inform both Government strategy and the future of overall development assistance. The Ghana CEM team presented the revised, synthetic findings on growth and poverty and made a case for scaling up of aid to Ghana to close the infrastructure financing gaps and get Ghana on a faster trajectory toward the achievement of the key Millennium Development Goals. Further, in September 2007, a four-day, intensive presentation of the report’s main messages and discussions with stakeholders were held in Accra, validating the CEM key findings.
4. It is my belief that the genesis and process of preparing this report is as important as its content. It is my hope that the substance of the report in this way may inform the Ghanaian public, stakeholders and decision-makers alike. Informed public dialogue will allow for better public policy choice to be made. These choices will only be made in Ghana. If in this way, this analytical work can contribute to accelerate Ghana’s path to middle-income status, with greater prosperity and equity, it will have served its purpose.


xii
ACKNOWLEDGEMENTS
The Ghana Country Economic Memorandum (CEM) was prepared to provide analytical contributions and assist the Government of Ghana to operationalize its accelerated and shared growth agenda. Earlier versions of the CEM background papers were discussed at the Ghana CEM technical review workshop in Accra on May 2–3, 2007. The revised papers on growth and MDG (present Volume 1) and poverty (in volume 3) as well as papers on infrastructure and agriculture (Volume 2) were discussed at the high-level Ghana CEM Growth and Poverty Reduction Workshop in Accra, June 18, 2007 as part of the Results and Resources (R & R) Consultative Group (CG) Meeting held during June 18–19, 2007 in Accra. In part, the purpose of the CEM was to provide analytically based answers to a number of questions regarding the scope for scaling up of aid to Ghana as one of Africa’s high-performing low-income countries.
The authors are grateful to the authorities of Ghana for the extensive data and discussions on the dimensions of Ghana’s growth and poverty reduction, without which this study would not have been possible. We are particularly grateful, without attribution, to Dr. Akoto Osei, Minister of State in the Ministry of Finance and Economic Planning, Prof. George Gyan-Baffour, Deputy Minister of Finance and Economic Planning, Alan Kyerematen, the Minister of Trade, Industries, Private Sector and Special Presidential Initiatives, J.H. Mensah, Chairman of the National Development Planning Commission, Dr. Mahamudu Bawmia, Deputy Governor of the Bank of Ghana, Dr. Ernest Addison, Director of Research, Bank of Ghana, and Regina Adutwum, Director-General of the NDPC; and their staffs; and all government ministries and agencies involved. Special thanks go to the Ghana Statistical Service (GSS) for the partnership and collaboration with the Bank in the completion and analysis of the GLSS-5 survey. We also thank participants of the May 2-3 Ghana CEM technical review workshop in Accra as well as the participants of the CG meeting in June 2007 in Accra. We particularly wish to acknowledge the valuable discussions and insights received from numerous Ghanaian experts and colleagues: Ernest Aryeetey (ISSER), Joseph Abbey (CEPA), Kwame Pianim, Gobind Nankani, K.Y. Amoako, Isaac Sam, Cletus Dordonou, Emmanuel Akpa, Vikram Nehru, Benno Ndulu, Bob Blake, Alan Gelb, Marcelo Andrade, Carlos Cavalcanti, and all the members of the Ghana CEM team and the Bank’s Ghana country team.
Cooperation with Ghana’s development partners, think tanks, private sector and the civic society is gratefully acknowledged.
This CEM was prepared during the period September 2006-August 2007 under the general direction of Mats Karlsson, Country Director for Ghana, as well as continuous guidance and support of Sudhir Shetty (AFPREM Sector Director), Bob Blake (former AFTP4 Sector Manager) and Antonella Bassani (AFTP4, Sector Manager).
The CEM was produced by the team led by Zeljko Bogetic (TTL, Lead Economist, AFTP4 and the lead author of Volume 1) with main responsibility for the report and final editing of all the papers in the report. The volume 1 consists of two chapters. The first is an analysis of Ghana’s past growth and constraints to growth, authored by Zeljko Bogetic (Lead Economist, AFTP4), Xiao Ye (Senior Economist, AFRVP), Quentin Wodon (Lead Poverty Specialist, AFPREM), and Daniel Boakye (Economist, AFTP4). Silvana Tordo (COCPO) contributed Annex 1 on the management of oil revenues. Chapter 2 on Ghana’s future medium-term growth and MDGs was authored by Zeljko Bogetic (Lead Economist, AFTP4), Maurizio Bussolo

xiii
(Senior Economist, DECPRG) and Denis Medvedev (Consultant, DECPRG). Volume 1 also draws synthetically on the findings of the 9 additional background papers in volumes 2 and 3.
Volume 2 comprises five chapters authored by the following team members: Antonio Estache (Senior Advisor, PREMVP) and Maria Vagliasindi (Senior Economist, PREMVP) are the lead authors of the infrastructure chapter with contributions and support of Paivi Koljonen (Lead Energy Specialist, AFTEG), Fanny Kathinka Missfeldt-Ringius (Energy Economist, AFTEG), Ajay Kumar (AFRTR), Mavis Ampah (Senior ICT Policy Specialist, CITPO), Charles Boakye (Senior Municipal Engineer, AFTU2), and Christopher Juan Costain (Lead Financial Sector Specialist, AFTPS). Christopher Jackson (Economist, AFTS4) and Gayatri Acharya (Sr. Economist, AFTS4) are the authors of the agriculture chapter. George Clarke is the author of the investment climate chapter. Ibrahim Elbadawi (Lead Economist, DEC) and Linda Kaltani (Consultant, DECRG) wrote the chapter on real exchange rate and scaling up of aid. Vandana Chandra (Senior Economist, PREMED) is the main author of the chapter on export diversification.
Volume 3 comprises four chapters. The first chapter on poverty was written by Harolde Coulombe (Consultant) and Quentin Wodon (Lead Poverty Specialist, AFPREM). The second chapter on labor and skills was authored by Setareh Razmara (Lead Social Protection Specialist), Arvil Adams (Consultant), Moukim Temourov (Human Development Economist, AFTH2), Pieter Serneels (Consultant, PRMPR), Harold Coulombe (Consultant, AFPREM), and Quentin Wodon (Lead Poverty Specialist, AFPREM). Next, the chapter on shared growth with focus on northern Ghana and gender was prepared by Ghana’s Institute of Social, Statistical and Economic Research (ISSER). The last chapter on political economy was authored by Philip E. Keefer (Lead Economist, DECRG).
The estimates of poverty presented in this study are based on joint work with the Ghana Statistical Service. In particular, Grace Bediako, the Government Statistician, and Nicholas Nsowah-Nuamah, the Deputy Government Statistician, have been very generous in providing their support, as have many staff of GSS, especially Isaac Osei-Akoto, Isaac Mensa-Bonsu, Kofi Agyeman-Duah, Opoku Manu Asare, Henry Nii Odai, Abena Osei Akoto, Jacqueline Anum and Samilia Mintah. The authors of the poverty chapter would also like to acknowledge partial support from the Belgian Poverty Reduction Partnership and the Norwegian Trust Fund for Private Sector and Infrastructure.
The following country team members also provided advice and support to the TTL or authors of chapters: Christine Kimes (Sr. Operations Officer, AFTRL), Pilar Maisterra (Country Program Coordinator, AFCGH), Cathy Bain (Senior Country Officer, AFCW1), Smile Kwawukume (Public Sector Specialist, AFTPR), Laura Rose (Sr. Health Economist, AFTH2), Evelyn Awittor (Health Specialist, AFTH2), Eunice Dapaah (Education Specialist, AFTH2), Kofi Boateng Agyen (Sr. Operations Officer (AFTPS), Beatrix Allah-Mensah (Social Development Specialist, AFTS4), and Philip Jaspersen (Monitoring Specialist, AFCW1).
Kafu Kofi Tsikata and Kennedy Fosu (Senior Communications Specialists, AFCW1) provided valuable external relations, media and communications support.
Alicia Hetzner (Senior Editor) proofed and assisted the TTL in editing the report.
Team assistance and logistical support was provided by Emmabel Hammond, Jemima Harlley, Rita Akweley Lartey, Ayishetu Terewina (all in AFCW1), Pierre Lenaud (AFTP4).

xiv
Judite Fernandes (team assistant, AFTP4) was responsible for formatting and putting together the final version of the CEM report (Volumes 1, 2, and 3).
Peer reviewers for the decision meeting of this report were Delfin Go (Lead Economist, AFRVP), KY Amoako (Chairman, Center for Economic Transformation, Accra) and Benno Ndulu (Advisor, AFRPG). Peer reviewers at the concept stage were Vikram Nehru (PREM Director), and Benno Ndulu (Advisor, AFRPG).
Valuable advice, comments and support to the TTL in various stages of the preparation of the CEM was also provided by Zia Qureshi (Sr. Adviser, DECVP) who participated in the CG meeting presentation of the CEM in June 2007, as well as Aart Kraay (Lead Economist, DECRG), Quentin Wodon (Lead Poverty Specialist, AFTPM), Carlos Cavalcanti (Lead Economist, AFTP4), Daniel Boakye (Economist, AFTP4), Piroska Nagy (IMF Mission Chief), Catherine Pattillo (IMF’s Senior desk economist for Ghana) and Elena Loukoianova (IMF’s desk economist for Ghana, IMF), Peter Darvas (Sr. Education Economist and Sector Coordinator), Louise Fox (Lead Economist, AFPREM), and Pierella Paci (Lead Economist, PRMPR).


xv
EXECUTIVE SUMMARY
1. Ghana has recently achieved impressive gains in growth performance and poverty reduction. Improving the policy environment was a major contributor to this success although a benign external environment in terms of agricultural export prices has helped. Economic growth has averaged over 5 percent since 2001 and reached 6 percent in 2005–06. This strong growth nearly halved the poverty rate in Ghana––the proportion of the population below the country’s poverty line––from approximately 52 percent at the beginning of the 1990s to 28.6 percent in 2005–06. As a result, Ghana is well ahead of schedule in achieving the key poverty Millennium Development Goal (MDG). In the low-income African context, this achievement is remarkable. Significantly, it is built on the foundation of the improved economic policy environment––based on sound fiscal management––and investment climate, rising private investments, and aid. Alongside Tanzania and Uganda, Ghana is one of the three strongest economic policy performers among low-income African countries.
2. All sectors of Ghana’s economy––especially rural areas––participated in growth. This shared growth was key to the rapid pace of poverty reduction. Rural incomes rose because of greater use of land as well as some productivity gains and higher agricultural export commodity prices. Private, small-holder cocoa farmers were a major beneficiary of rising rural incomes. There are additional reasons for guarded optimism about Ghana’s agriculture, as evidenced by the recent success of the horticulture sector (for example, pineapple). Agriculture has the potential to further grow, but it must be supported by improved policies, institutions, and investments. Ghana’s large services sector has also grown on the heels of a better climate for private business and investments and rising incomes. The small industrial sector also has shown dynamism, albeit from a low base. Finally, responding to the more favorable economic climate, Ghana’s exports have grown, including nontraditional exports.
3. Some human development indicators improved, and aggregate employment increased mostly through the informal sector, but also with some gains in the private formal sector. However, while Ghana did well in primary education in terms of enrollment, ensuring that children stay in school and make progress has been a challenge. Secondary and university education has not always provided the skills needed by the growing economy. And rural-urban migrations continue unabated, putting pressure on the already high urban unemployment and urban public services.
4. Despite these gains, income inequality across regions and between men and women remains high and has increased during this period of accelerated growth. These inequities remain potent sources of political and social tensions. While all main income groups––from the poorest to the richest––have benefited from the economic expansion since the beginning of the 1990s, the gains by the poorest were much smaller than those of the rest of society. Despite their major role benefiting the society, women continue to earn much less then men, and poor women are the most economically vulnerable. While all regions saw gains in incomes and a reduction in poverty, these gains and poverty reduction were much less pronounced in the North of Ghana.
5. Ghana’s good overall performance has attracted rising amounts of better-managed aid. Ghana now receives annually approximately US$1 billion in various forms of aid, and aid is now more effective than in the past. A lot of aid went into some key sectors such as roads and as

xvi
a result, the quality of roads in Ghana now is much better. Also, donors are now “harmonizing” aid among themselves and are closely aligning it to Ghana’s social and economic priorities. Annual external reviews of Ghana’s public financial management note continuous improvements. This good management is one reason that the large volume of aid in Ghana has not resulted in significant downside effects, such as overwhelming the local institutional capacity and reducing competitiveness of Ghanaian products. Aid could be even more effective in the future if it were more predictable and better geared toward identified growth constraints.
6. So what are Ghana’s main constraints now to even more rapid growth and poverty reduction? This report identifies three major constraints that, if eliminated, would help Ghana sustain and accelerate growth and poverty reduction in the future. These constraints are:
7. Infrastructure gaps are severe, especially in energy and water and sanitation. In electricity, the power crisis with long cuts and large losses is a stark reminder of the gap between supply and demand that threatens the viability of many businesses, especially in manufacturing and services. In water and sanitation, supply is inadequate and quality often poor. In Information Communication Technology (ICT), interconnectivity remains a problem and the sector is yet to deliver on its promise. Even in roads, the best performing infrastructure sector, there are gaps in rural areas and in connectivity with poor regions. Simply put, Ghana spends approximately 3–4 percent of GDP per year less than is necessary to address the most critical infrastructure gaps in electricity, water and sanitation and, to a lesser extent, in ICT and rural roads. The medium-term shortfall in infrastructure financing is higher––approximately 5-6 percent of GDP. The power crisis is already costing the country at least 1.5 percentage points of GDP per year, and the “silent crisis” in water and sanitation threatens not only economic activity but also public health. Moreover, there are important policy and institutional weaknesses in the key infrastructure sectors; without eliminating them, additional financing alone will not likely be effective.
8. Productivity remains low, especially in agriculture. Ghana’s aggregate productivity is improving, but the level remains below the most productive African economies––such as Mauritius and Botswana––and way behind the rapidly growing Asian countries. With irrigation almost nonexistent, Ghana’s agriculture still depends largely on weather. Recently, productivity has begun to increase but the use of modern agricultural techniques remains limited. The success stories in Ghana’s agriculture, such as cocoa and horticulture (pineapple), may provide lessons on how to strengthen the rest of agriculture.
9. While improving, several aspects of the business and investment climate remain weak. These constraints hold back Ghanaian firms from investing, expanding output, and hiring more workers as well as becoming more productive. The most important constraints relate to electricity and access to finance, especially for small and medium-size enterprises.
10. How can these constraints be overcome, and what can public policy contribute? To begin with, it is necessary to continue what Ghana has been doing well, to improve the overall policy environment in at least three areas: macroeconomic policy, especially fiscal and monetary management; efficiency; and sector policies. A broader policy agenda going forward for accelerated and shared growth is likely to revolve around three pillars: sustaining the fundamentals, especially macroeconomic stability; value-for-money and enhancing efficiency across public sector activities; and targeting specific growth bottlenecks.
11. First—the fundamentals. Increasingly, the cornerstone of Ghana’s recent macro stability has been prudent fiscal and monetary-exchange rate policies. This stability must
xvii
continue if Ghana is to further reduce interest rates, increase private investments, and continue to attract favorable investment ratings and donor support. This means sustaining a prudent fiscal stance and borrowing levels consistent with debt sustainability. In this context, it is important for Ghana to maintain fiscal prudence over the political cycle and resist pressure on the budget to pay for inefficient tariff policies and energy companies’ operations. Equally important, Ghana had successfully avoided an overvaluation of the currency in the past; going forward, this challenge becomes even more important as the country accesses external resources from both private and aid channels, and also from future oil revenues. Key to Ghana’s future success here will be a prudent, flexible exchange rate policy and productive use and management of additional capital inflows. Moreover, there may be a case for a modest undervaluation as a way of promoting more rapid export orientation and diversification.
12. Second—value-for-money and strengthening public sector efficiency. Going forward, Ghana’s public sector could significantly improve its efficiency by adopting a strong value-for-money mindset and systematic approach in planning, execution and evaluation of public programs. As a country that aspires to middle-income status, Ghana will increasingly need to focus on this part of its longer term reform agenda. Despite solid gains in certain areas (e.g., roads) and an overall good governance record in the context of low-income African countries, Ghana’s key public utilities remain largely inefficient public enterprises in need of significant improvements to ensure efficient and effective delivery of basic services. Improving delivery of basic services will also be important for broader social reasons of getting closer to some of the key Millennium Development Goals (MDGs) on which Ghana remains behind—especially health and water and sanitation. In some state-owned enterprises, introduction and enforcement of performance contracts, for example, may help, while in others (e.g., telecom sector), greater competition and ownership and management reform will be even more important to generate efficiency gains and stimulate technological modernization. Within the government budget operations, there are also pressures to raise the already large government wage bill beyond the levels justified by fiscal affordability and productivity. Increasing the productivity of public sector personnel and using resources more efficiently will be important, hence, the emphasis should be to improve efficiency and value-for-money at all levels of public sector activities.
13. Third—targeted interventions to address identified growth bottlenecks. While maintaining macro stability and competitive currency and value-for-money is very important, Ghana also faces several specific growth bottlenecks requiring urgent and focused interventions in order to achieve accelerated and more broadly shared growth.
(i) Closing the infrastructure gap. This will require urgent efforts by policymakers and implementing agencies on the financing, policy, regulatory and institutional fronts. Specifically, short-term efforts over the next 12 months should focus on:
o Eliminating the short-term annual funding shortfall estimated at US$350-430 million (3-4 percent of GDP); and targeting the main bottlenecks in electricity, water and sanitation, ICT, and some rural roads. Funding for this scaling-up in infrastructure could come from a combination of greater use of private-public partnerships in infrastructure and domestic and external resources, preferably on concessional terms.
o To ensure broader sharing of benefits of infrastructure scale up, greater emphasis should be placed on rural roads and connectivity of the poorest regions with the mainstream centers of economic activity within the country as well as accelerating
xviii
and strengthening regional infrastructure integration (West Africa Power Pool, and West Africa Gas Pipeline, and connectivity with northern neighbors).
o Accelerating tariff reform toward average cost recovery while safeguarding the poor’s affordability with a suitable design of “lifeline” tariffs or alternative ways of striking a balance between revenue and social concerns in tariff policy will be important.
o Strengthening regulation and depoliticizing sector management.
o Aggressively seeking opportunities for greater private participation in infrastructure, especially in energy and ICT.
(ii) Raising productivity, especially in agriculture. Productivity is fundamental to long-term growth. Addressing infrastructure bottlenecks will help raise productivity in the economy. Without water supply and electricity, there is no refrigeration; and without refrigeration, there is no vibrant commercial fishing industry and associated food chains. Some new technologies, such as cellular/IT, offer opportunities to “leapfrog” into higher and more productive, new economic sectors that offer promise of new jobs, investments and growth. Additional opportunities beyond infrastructure must be sought to sustainably enhance productivity in sectors important to the wellbeing of Ghanaians––especially in agriculture, on which most poor depend for their livelihoods. Since the remaining poverty is even more concentrated in the rural areas, raising agricultural productivity will be key to further poverty reduction and greater sharing of the benefits of growth. The most important sources of Ghana’s future productivity improvements are likely to be achieved through the competitive entry of new and more productive enterprises, as well as the growth of existing firms, and through increasing the available skilled labor. To these ends, policy efforts should focus on:
o Eliminating infrastructure bottlenecks and widening the use of technology and ICT. As noted above, introducing in the public sector a new value-for-money and productivity-enhancing mindset will also lead to better use of resources and wider space for private sector innovation in the new technology-intensive sectors that offer opportunities for leapfrogging.
o Transferring to other agriculture sectors the lessons of recent productivity gains in the cocoa sector as a result of better and wider use of disease control, fertilizers, and better product varieties and contemporary agronomic techniques. The last shows that aggressive productivity-enhancing measures on privately owned farms can have major impacts on productivity and output.
(iii) Strengthening the investment climate in the areas of greatest concern. Recent surveys including the World Bank’s Doing Business (2007) and Association of Ghana Industries (AGI) surveys as well as the most recent World Bank Investment Climate Survey reported in this Ghana CEM indicate that the investment climate is improving and there is investor optimism. However, these are happening from a low base, and there remain serious concerns in at least two notable areas: electricity and access to finance by small and medium-size enterprises. Thus, the improvements in investment climate must be extended and sustained over the long term, especially in these areas. This underscores the importance of focusing infrastructure efforts on quickly resolving the electricity crisis and continuing the efforts of the Government and the Bank of Ghana to extend micro-finance and financial

xix
services more widely across the country. While other areas of the investment climate are much less of a problem, certain business regulations could be improved. For example, procedures for formal business start-ups are still too cumbersome and push firms to informality.
14. Exports will need to play an increasing role as an engine of growth and export diversification will need to be promoted. It is no accident that all successful stories of development are linked with rapid and sustained export growth, including in Africa (Mauritius, Botswana). As a small open economy, Ghana, therefore, must grow not only using its small domestic market but tapping the potential of unlimited global markets. While Ghana has begun to develop non-traditional exports, much more needs to be done. The report details opportunities to expand existing and develop new exports up the value chain but also based on existing natural resources. There are no easy answers here, but one thing is certain: Ghana must avoid the overvaluation of its currency that would hurt export and growth prospects. This is perhaps a central lesson that must be heeded for there is no example of rapidly growing economies with overvalued currency. So far, Ghana has managed this challenge well and it must continue to do so in the future.
15. To ensure that this policy agenda results in wider sharing of the benefits of growth in the future, Ghana could well consider more active regional infrastructure policy and greater attention to skills and regional and gender disparities. Effective regional infrastructure policy will require identifying, professionally appraising and implementing regional projects that connect poor regions with centers of the mainstream economy as well as with neighboring countries in the North. With more detailed geographical poverty and infrastructure data now available, greater precision is possible in identifying geographic pockets of poverty that could be targeted by policy aimed at linking those isolated areas with basic services and centers of economic activity. Promoting employment and gender equality in economic opportunities and education must be high on the policy agenda. Also, new growth will increasingly demand more skilled workers and building skills of new generations will be an important element of a strategy for shared growth. The analysis of the political economy in this report also suggests that reforms will work better and will be accepted more widely within society if citizens are more informed about basic policies, key economic and social data, and policy choices.
16. Against this background, Ghana will continue to face––and will need to manage––important risks, so there is no room for complacency. The main short term risk is the energy crisis that must be resolved urgently. But there are also macroeconomic, environmental, and external risks to rapid growth in Ghana. As noted, sustaining macroeconomic stability and enhancing public sector capacity and efficiency is a constant must. Environmental degradation also must be dealt with, as well documented elsewhere (Natural Resource Study). Finally, as a small open economy, Ghana remains vulnerable to external shocks over which it has little control: commodity prices, climatic conditions, regional tensions, and fluctuations in global, international trade and investment flows. The future oil revenues also bring with them the risk of the “Dutch disease” and poor management of public resources. The best way for Ghana to manage these risks is to build resilience by strengthening its own policies, institutions, and capacity.
17. Looking into the future, if the above growth constraints are eliminated and policies and institutions strengthened, Ghana faces strong medium-term prospects––but they

xx
should not be taken for granted. The report analyzes the medium-term prospects in detail and spells out three possible medium-term scenarios. It should be noted that none of these fairly positive scenarios would materialize if economic policy fails: this Ghana cannot afford.
i. Under the baseline medium-term scenario with current policies and short-term restoration of the energy balance––which is a must if Ghana is to continue to grow rapidly––but no major additional infrastructure investments, Ghana’s real GDP growth could improve to approximately 7 percent. As noted above, sustaining macroeconomic stability and further enhancing public sector efficiency will be required. This results in the key poverty MDG being achieved well ahead of schedule, possibly by 2008–09. However, the achievement of the other MDGs would be mixed and reaching MDGs on health and water and sanitation will continue to be elusive. The biggest short-term risk to this scenario is the ongoing energy crisis and all policy efforts should focus on this priority.
ii. In the accelerated growth scenario, if Ghana manages to close major infrastructure gaps––as advocated by this report––through a combination of additional improvements in policies, and associated efficiency gains (e.g., lower interest rates and higher private investments and productivity) and more resources, even more rapid growth and poverty reduction are possible. Additional resources of approximately US$350-430 million per year above the Ghana Poverty Reduction Strategy (GPRS II) spending path would be required to close the infrastructure gaps. This scenario envisions increased economic growth (averaging 7.5 percent per annum), somewhat faster poverty reduction, and better MDG performance compared with the baseline. However, some MDGs (especially health and water and sanitation) remain elusive. The analysis shows that the economy can absorb this moderate scaling-up of resources without negative consequences on competitiveness or strain on institutional capacity. Finally, if Ghana manages to improve its policies and capacity even further and mobilizes substantial additional resources particularly directed towards water and sanitation and health, it could be possible to achieve all four key MDGs––poverty, education, water and sanitation, and health; such scaling up would require considerable additional resources that could come from a combination of domestic and external sources.
18. In conclusion, Ghana has done well in recent years and the challenge is to sustain this strong growth and poverty reduction performance over the long term. To this end, Ghana faces favorable prospects but only if it continues and strengthens the current course, by sustaining the policy fundamentals, instituting value-for-money across the public sector, and targeting specific, identified growth bottlenecks. In that scenario, Ghana also appears to be a prime candidate for scaling up donor financial support to accelerate growth and the achievement of the MDGs. Ghana’s policies have been good and its institutional capacity continues to improve. However, there are clear bottlenecks in the provision of public goods, such as infrastructure that threaten the ongoing economic expansion. Additional donor resources and private investments combined with better policies and capacity could mitigate these problems and accelerate the achievement of the MDGs. Ghana has demonstrated its ability to absorb substantial amounts of aid relatively effectively. In addition, public resource management has been improving. This trend suggests that the absorptive capacity of the economy is not likely to constrain greater and productive use of additional resources in the future, including in the form

xxi
of aid. The CEM analysis, therefore, indicates that some further scaling-up of aid to Ghana is both desirable and possible, with no adverse effects on competitiveness and no strain on its absorptive capacity. From the Ghanaian side, such scaling-up of resources must be matched by continued improvements in policies and a value-for-money approach to public sector activities.
19. The Ghana CEM report is structured in three volumes. The first, synthetic volume consists of two papers. The first provides a retrospective and a broad diagnostic of Ghana’s recent experience with growth and poverty reduction and it integrates many of the findings of the entire report: key constraints and main policy challenges. The second paper in this volume provides a forward-looking analysis of medium-term growth prospects and resource and policy requirements of accelerated growth and the achievement of MDGs. Volume 2 focuses mainly on the identified constraints to growth and the associated issues. It contains five papers focusing on infrastructure, agriculture, investment climate, scaling up aid and the real exchange rate, and export diversification. By contrast, Volume 3 consists of 4 papers that focus on social and distributional and political issues. They analyze poverty and the livelihoods of Ghana’s poor, labor and skills, regional and gender inequities, and political economy issues.
20. The table below summarizes some of the key elements of the policy agenda for accelerated and shared growth. They are deliberately selective, focusing on key items. Complete analysis and details and justification of specific policy recommendations are provided in the following chapters of the Ghana CEM report.
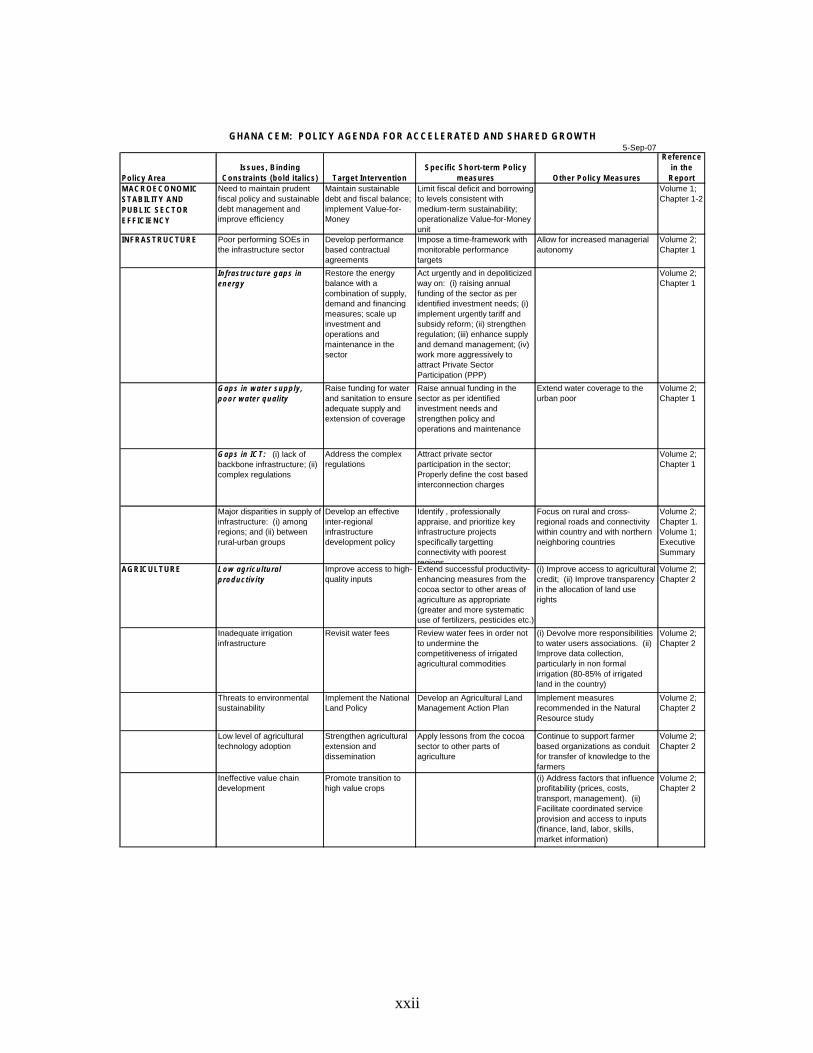
xxii
5-Sep-07
Policy AreaIssues, Binding
Constraints (bold italics) Target InterventionSpecific Short-term Policy
measures Other Policy Measures
Reference in the Report
MACROECONOMIC STABILITY AND PUBLIC SECTOR EFFICIENCY
Need to maintain prudent fiscal policy and sustainable debt management and improve efficiency
Maintain sustainable debt and fiscal balance; implement Value-for-Money
Limit fiscal deficit and borrowing to levels consistent with medium-term sustainability; operationalize Value-for-Money unit
Volume 1; Chapter 1-2
INFRASTRUCTURE Poor performing SOEs in the infrastructure sector
Develop performance based contractual agreements
Impose a time-framework with monitorable performance targets
Allow for increased managerial autonomy
Volume 2; Chapter 1
Infrastructure gaps in energy
Restore the energy balance with a combination of supply, demand and financing measures; scale up investment and operations and maintenance in the sector
Act urgently and in depoliticized way on: (i) raising annual funding of the sector as per identified investment needs; (i) implement urgently tariff and subsidy reform; (ii) strengthen regulation; (iii) enhance supply and demand management; (iv) work more aggressively to attract Private Sector Participation (PPP)
Volume 2; Chapter 1
Gaps in water supply, poor water quality
Raise funding for water and sanitation to ensure adequate supply and extension of coverage
Raise annual funding in the sector as per identified investment needs and strengthen policy and operations and maintenance
Extend water coverage to the urban poor
Volume 2; Chapter 1
Gaps in ICT: (i) lack of backbone infrastructure; (ii) complex regulations
Address the complex regulations
Attract private sector participation in the sector; Properly define the cost based interconnection charges
Volume 2; Chapter 1
Major disparities in supply of infrastructure: (i) among regions; and (ii) between rural-urban groups
Develop an effective inter-regional infrastructure development policy
Identify , professionally appraise, and prioritize key infrastructure projects specifically targetting connectivity with poorest regions
Focus on rural and cross-regional roads and connectivity within country and with northern neighboring countries
Volume 2; Chapter 1. Volume 1; Executive Summary
AGRICULTURE Low agricultural productivity
Improve access to high-quality inputs
Extend successful productivity-enhancing measures from the cocoa sector to other areas of agriculture as appropriate (greater and more systematic use of fertilizers, pesticides etc.)
(i) Improve access to agricultural credit; (ii) Improve transparency in the allocation of land use rights
Volume 2; Chapter 2
Inadequate irrigation infrastructure
Revisit water fees Review water fees in order not to undermine the competitiveness of irrigated agricultural commodities
(i) Devolve more responsibilities to water users associations. (ii) Improve data collection, particularly in non formal irrigation (80-85% of irrigated land in the country)
Volume 2; Chapter 2
Threats to environmental sustainability
Implement the National Land Policy
Develop an Agricultural Land Management Action Plan
Implement measures recommended in the Natural Resource study
Volume 2; Chapter 2
Low level of agricultural technology adoption
Strengthen agricultural extension and dissemination
Apply lessons from the cocoa sector to other parts of agriculture
Continue to support farmer based organizations as conduit for transfer of knowledge to the farmers
Volume 2; Chapter 2
Ineffective value chain development
Promote transition to high value crops
(i) Address factors that influence profitability (prices, costs, transport, management). (ii) Facilitate coordinated service provision and access to inputs (finance, land, labor, skills, market information)
Volume 2; Chapter 2
GHANA CEM: POLICY AGENDA FOR ACCELERATED AND SHARED GROWTH

xxiii
Policy Area Issues, Binding
Constraints (bold italics) Target InterventionSpecific Short-term Policy
measures Other Policy Measures Reference
in the Report
INVESTMENT CLIMATE Unreliable electricity supply
Improve regularity in electricity supply
(i) ensure adequate, priority annual funding; (ii) reform tariff and revenue collections; (iii) improve operation and maintenance.
Volume 2, Chapter 3
Inadequate access to finance
Facilitate SME access tofinance
Promote microfinance, especially in secondary cities and rural areas
Promote policies to reduce interest rates (lower inflation, reduced government financing needs, lower bank overheads)
Volume 2, Chapter 3
INVESTMENT CLIMATE (Continued)
Low worker productivity Improve skills and technology. Promotegreater capital intensitywhere economically justified
Identify measures to improve labor skills and promote more capital intensive investments
Volume 2, Chapter 3
EXPORT DIVERSIFICATION AND FASTER EXPORT GROWTH
Over the past 25 years, Ghana has exported broadly the same products and has not become richer
(i) Promote export diversification. (ii) Reward or scale up known and winning sectors, rather than pick unknown winners
(i) Consider additional field work to test the feasibility of tentatively identified export diversification opportunities. (ii) Consider scaling up fresh and processed fishery and horticultural products
(i) In the medium term: promote more complex processed products (salt and starch) and palm and vegetable oil. (ii) In the longer term: develop wood and metals manufactures
Volume 2, Chapter 5
POVERTY, INEQUALITY Wide spatial inequities; remaining poverty especially in Northern Ghana; inequal status of women
Regional infrastructure policy targeting connectivity of poorestareas with mainstream economy
(i) Eliminating identified growth bottlenecks to raise incomes and further reduce poverty; (ii) Extending further basic services to the poor (e.g., accelerating rural electrification, access to water etc.); Identifying regional projects to overcome spatial isolation; promote women's greater equality in economic opportunities and education.
Develop full infrastructure and poverty mapping at lowest geographic level and use it to targets geographic pockets of worst poverty by providing priority basic services.
Volume 3, Chapter 1; Chapter 3
LABOR AND SKILLS Most of the jobs generatedin the last 15 years have low earnings and low productivity
Generate more jobs with higher earnings and productivity
Identify jobs where productivity and earnings can be improved relatively easily
Promote the creation of export oriented private firms, in industry and services
Volume 3, Chapter 2
(i) Many youths in Ghana are not enrolled in secondary education. (ii)Technical and vocational Education.
(i) Lower the walls that separate education and training: open pathways horizontally and vertically to accommodate differentlearning needs. (ii)Strengthen the capacityof the private sector to provide training, especially for the traditional sector
Modify the Education Strategic Plan (ESP) to define steps to open pathways between general and vocational education.
(i) Blend curricula of academic and vocational training. (ii) Implement the open pathways policy for general education and training. (iii) Improve performance of public and private training institutions by strengthening employers' engagement. (iv) Involve employers in setting standards. (v) Link funding of the training system to outcomes and performance. (vi) Encourage private financing of vocational training
Volume 3, Chapter 2
POLITICAL ECONOMY Lack of fully credible policy promises by political competitors
Improve education, including on fundamentals of public policy
Foster education (including on public policy) to enhance the electoral accountability of politicians for their performance on broad policy issues
Volume 3, Chapter 4
POLITICAL ECONOMY (Continued)
Lack of voter information Increase transparency in government provided information and data
Make easily available information on public expenditure and financial management using variety of media
Volume 3, Chapter 4
Social, particularly ethnic,polarization
Ensure that costs andbenefits of policy fall equally across ethnic groups
Put greater emphasis on regional connectivity (within country and with neighboring countries) of isolated northern areas, to diffuse regional political tensions
Ensure public policy making is as transparent as possible and free of biases that exacerbate social cleavages
Volume 3, Chapter 4


1. GHANA’S GROWTH STORY: LOOKING BACK
BACKGROUND AND GHANA’S CURRENT GROWTH CONTEXT
1.1 On March 6, 2007, Ghana celebrated the fiftieth anniversary of its independence with strong growth, continued poverty reduction, and renewed optimism about its future. The country’s present determination to reach middle-income status is reminiscent of the optimism and self-confidence that characterized the mood of its original independence celebrations in 1957. However, Ghana’s economic performance in the early decades of post-independence was disappointing. At the time of their independence, Malaysia, Mauritius, Singapore, and South Korea were broadly on a par with Ghana in per capita income terms. These other countries have long since reached––and some have surpassed––middle-income status. For example, with a 2005 Gross National Income (GNI) per capita of US$15,840, South Korea is a high-income country, and with US$5,250 GNI per capita, Mauritius is upper-middle income. In contrast, despite all of its natural and human resources and favorable coastal position, Ghana lags behind with a 2005 per capita GNI of US$450.
Brief, longer-term perspective on Ghana’s growth
1.2 A longer-term perspective raises inevitable questions. What went wrong in the early decades? More importantly, what is the basis for today’s renewed optimism? Focusing on the most recent growth, what are the sources of its acceleration and poverty reduction, and how sustainable is the growth momentum? What holds Ghana back from reaching even higher, better, and faster on the road to middle-income status? What kind of strategy and policy should Ghana and its partners pursue to achieve key development objectives? Finally, where is Ghana expected to be in 2015 in terms of income, poverty reduction, and the main Millennium Development Goals? These are the questions, in one form or another, on the minds of many Ghanaians and the development community at large. We take a fresh look and suggest answers to contribute to Ghana’s growth story and to the national government’s thinking about how to operationalize the country’s current accelerated and shared growth agenda.
1.3 The first half of Ghana’s 50 years of independence could be characterized by political instability, mixed development paradigms, and policy reversals. Ghana’s long-term economic performance in the early independence years was closely associated with cycles of political instability and shifts in policy regimes, including changes in strategies between state-led and market-led development. The impact of dirigiste state-led policies in the First Republic (1957–66) compounded by the fall in the price of cocoa resulted in significant deterioration in internal and external balances and in the overall economic situation.
1.4 The following years (1966–72) were characterized by political turmoil and short-lived reforms followed by a period of economic chaos until the early 1980s. Overall, during its first quarter-century of independence, the political and economic policy environment of Ghana was not conducive to dynamic private sector investments, entrepreneurship, and growth (Tsikata 2001). However, since 1983, Ghana has entered a period of relative political stability and gradually improving policy and growth performance. With improved policies, the country

2
also began to receive increasing amounts of financial aid. More recently, since 2000, Ghana has significantly improved its macroeconomic management and economic performance.
1.5 Its slow start after independence set Ghana back in its race with many other Sub-Saharan African and low-income countries toward long-term growth. Its real per capita annual income growth average over those 50 years has been well below 1 percent (Figure 1.1). In contrast, during the same period, with its aggressive export-oriented strategy, Mauritius has sustained average annual per capita growth of above 3 percent, and its income level has almost quadrupled (Figure 1.1).
1.6 In a welcome development, since the 1990s, Ghana’s economy has begun to advance. Ghana has sustained real GDP growth of above 4 percent and per capita growth of approximately 2 percent. These figures have elevated Ghana toward the medium growth performance among African countries over this period (Figure 1.2). The Government of Ghana (GoG) now explicitly aims to achieve middle income status by 2015, with an annual GDP growth of 6 percent to 8 percent. This goal means that Ghana must accelerate its current growth, already its best since 1960.
Figure 1.1: Sub-Saharan Africa: Average annual GDP per capita growth and ratio of per capita incomes, 1960–2004
AGO
BDIBEN
BFA
BWA
CAF
CIVCMR
COG
COM
CPV
ETH
GAB
GHAGIN
GMB
GNB
KEN
LSO
MDG
MLIMOZ
MRT
MUS
MWINAM
NER
NGARWA
SDN
SEN
SLE
SYC
TCDTGO
TZA
UGA
ZAF
ZAR
ZMB
-2.0
00
.00
2.0
04
.00
6.0
0A
vera
ge g
row
th r
ate
, 19
60-2
004
0.00 2.00 4.00 6.00 8.00 10.00Ratio of per capita income in 2004 to per capita income in 1960
Source: Ndulu and others 2006.
3
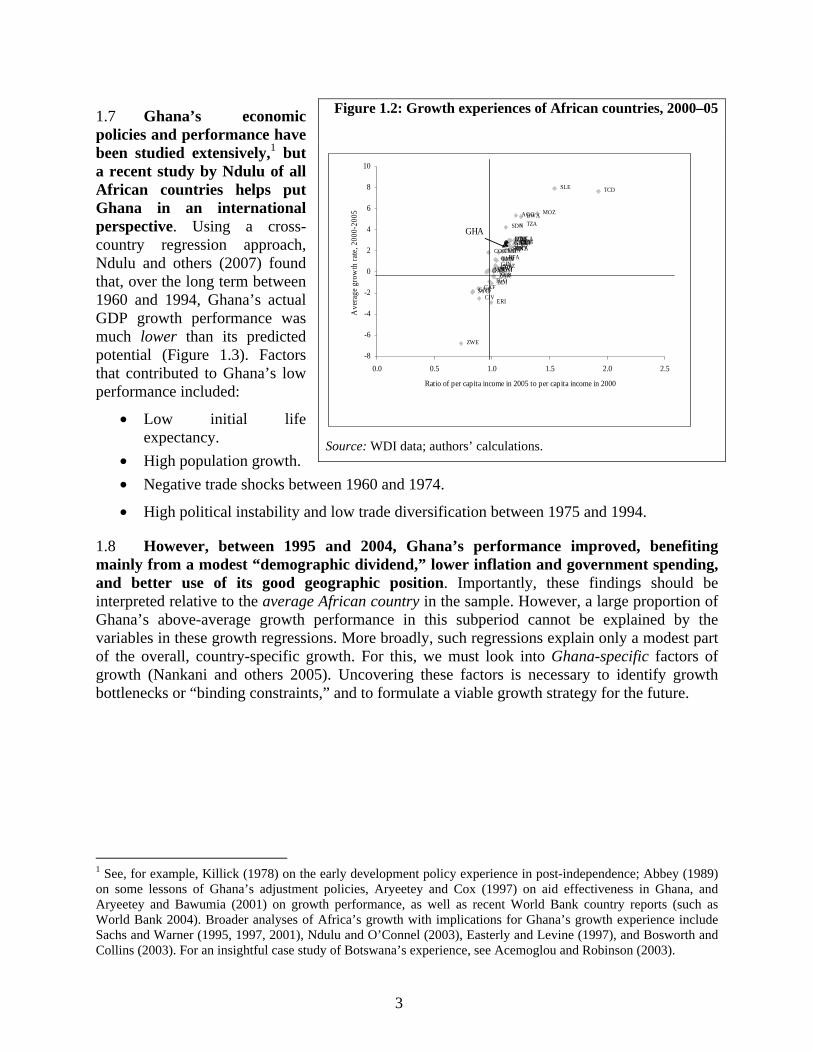
1.7 Ghana’s economic policies and performance have been studied extensively,1 but a recent study by Ndulu of all African countries helps put Ghana in an international perspective. Using a cross-country regression approach, Ndulu and others (2007) found that, over the long term between 1960 and 1994, Ghana’s actual GDP growth performance was much lower than its predicted potential (Figure 1.3). Factors that contributed to Ghana’s low performance included:
• Low initial life expectancy.
• High population growth.
• Negative trade shocks between 1960 and 1974.
• High political instability and low trade diversification between 1975 and 1994.
1.8 However, between 1995 and 2004, Ghana’s performance improved, benefiting mainly from a modest “demographic dividend,” lower inflation and government spending, and better use of its good geographic position. Importantly, these findings should be interpreted relative to the average African country in the sample. However, a large proportion of Ghana’s above-average growth performance in this subperiod cannot be explained by the variables in these growth regressions. More broadly, such regressions explain only a modest part of the overall, country-specific growth. For this, we must look into Ghana-specific factors of growth (Nankani and others 2005). Uncovering these factors is necessary to identify growth bottlenecks or “binding constraints,” and to formulate a viable growth strategy for the future.
1 See, for example, Killick (1978) on the early development policy experience in post-independence; Abbey (1989) on some lessons of Ghana’s adjustment policies, Aryeetey and Cox (1997) on aid effectiveness in Ghana, and Aryeetey and Bawumia (2001) on growth performance, as well as recent World Bank country reports (such as World Bank 2004). Broader analyses of Africa’s growth with implications for Ghana’s growth experience include Sachs and Warner (1995, 1997, 2001), Ndulu and O’Connel (2003), Easterly and Levine (1997), and Bosworth and Collins (2003). For an insightful case study of Botswana’s experience, see Acemoglou and Robinson (2003).
Figure 1.2: Growth experiences of African countries, 2000–05
ZWE
ZMBUGA
TGO
TZA
SWZ
SDN
ZAF
SLE
SYC
SENRWA
NGA
NER
NAM
MOZ
MUS
MRTMLI
MWIMDG
LSO
KEN
GNB
GIN
GHA
GMB
GAB
ETH
ERICIV
COG
ZARCOM
TCD
CAF
CPV
CMR
BDI
BFA
BWA
BEN
AGO
-8
-6
-4
-2
0
2
4
6
8
10
0.0 0.5 1.0 1.5 2.0 2.5
Ratio of per capita income in 2005 to per capita income in 2000
Ave
rage
gro
wth
rat
e, 2
000-
2005
GHA
Source: WDI data; authors’ calculations.

4
Figure 1.3: Contributions of factors influencing growth
Source: Ndulu and others 2007.
1.9 Interestingly, had Ghana achieved its growth potential (based on the factors identified in cross-country regressions), it could have raised its per capita GDP 70 percent higher than the current level (Figure 1.4). For example, the fact that the bars at the far right-hand side of Figure 1.3 (“Initial income”) are far higher than the bars at the far left (“Growth”) tells us that Ghana exploited only a fraction of the catch-up opportunities available to low-income countries. After volatile years in the 1970s and early 1980s, economic performance began to improve progressively, until it gathered full steam in the first years of the twenty-first century. However, despite full economic recovery and accelerated growth since 2001, Ghana’s GDP per capita has remained comparatively low. Arguably, had more specific country constraints been relaxed––in addition to those found in cross-country regressions––with its strong initial conditions, Ghana could have been a candidate for exceptional growth performance similar to that of Mauritius and Botswana (Box 1.5).
Figure 1.4: Potential GDP per capita, and real GDP and GNI per capita, 1970–2004 (constant 2000 US$)
Source: World Bank WDI database.
$289$284
$492
0
50
100
150
200
250
300
350
400
450
500
1970
1972
1974
1976
1978
1980
1982
1984
1986
1988
1990
1992
1994
1996
1998
2000
2002
2004
Con
stan
t 200
0 $U
S
GDP per capita (constant 2000 US$)
GNI per capita, Atlas method (constant US$)
Potential GDP Per Capita
-3.5-3.0-2.5-2.0-1.5-1.0-0.50.00.51.01.52.0
Gro
wth
Res
idua
l
Initi
al li
feex
pect
ancy
Age
Dep
ende
ncy
Bla
ckM
arke
t
Pot
entia
lL
abor
for
ce
Ter
ms
ofT
rade
Sho
ck
Infl
atio
n
Pol
itica
lin
stab
ility
Gov
t.C
ons.
/GD
P
Lan
d L
ocke
d
Tra
ding
part
ner
Tim
e ef
fect
s
Initi
alin
com
e
Dev
iatio
n fr
om s
ampl
e m
ean 1960-1974 1975-1994 1995-2004

5
Ghana’s current policy and growth context
1.10 In recent years, Ghana has shown good policy and growth performance, but its resource-based economy remains vulnerable to external shocks. The World Bank CPIA index measures the quality of overall economic policies on 16 dimensions of performance. Ghana rose from 3.5 (medium performer) in 1998 to 3.9 (strong performer) in 2005, making it 1 of the top 3 policy performers among low-income Sub-Saharan African countries (Table 1.1). Significant fiscal consolidation enabled major reduction of inflation (Figure 1.5), increasingly creating a favorable overall macroeconomic environment. The good policy environment and political stability also have helped improve Ghana’s growth performance and business environment (Figure 1.6) and attracted some trade/transport business from neighboring Côte d’Ivoire (for example, cocoa exports).
Table 1.1: Ghana’s quality of economic policies (2005 CPIA index) within Sub-Saharan Africa, on a scale of 1 (lowest) to 6 (highest)
Country CPIA Index
Ghana 3.9 Tanzania 3.9 Uganda 3.9 Sub-Saharan Africa average 3.2
Source: The World Bank.
Note: The World Bank’s index of the quality of economic policies is calculated as a composite, comprehensive, indicator-based evaluation of member country policies. Policies are measured along 16 dimensions of performance. The lowest value of 1 reflects the worst and 6 the best possible performance on a 6-point scale.
1.11 However, in contrast to landlocked African countries that face daunting geographical constraints (Collier 2006), Ghana also has been blessed with abundant coastal and natural resources. As a result, Ghana’s economy continues to depend heavily on its natural resources. Timber, cocoa, minerals, and fish still represent 48 percent of GDP, 90 percent of foreign export earnings, and 70 percent of total employment. Consequently, the country’s economic base remains narrow and vulnerable to the vagaries of commodity prices, agricultural supply shocks, and the changing climate. Most of the population––especially the poor––rely on natural resources for their livelihoods (World Bank/DFID/ISSER 2005).
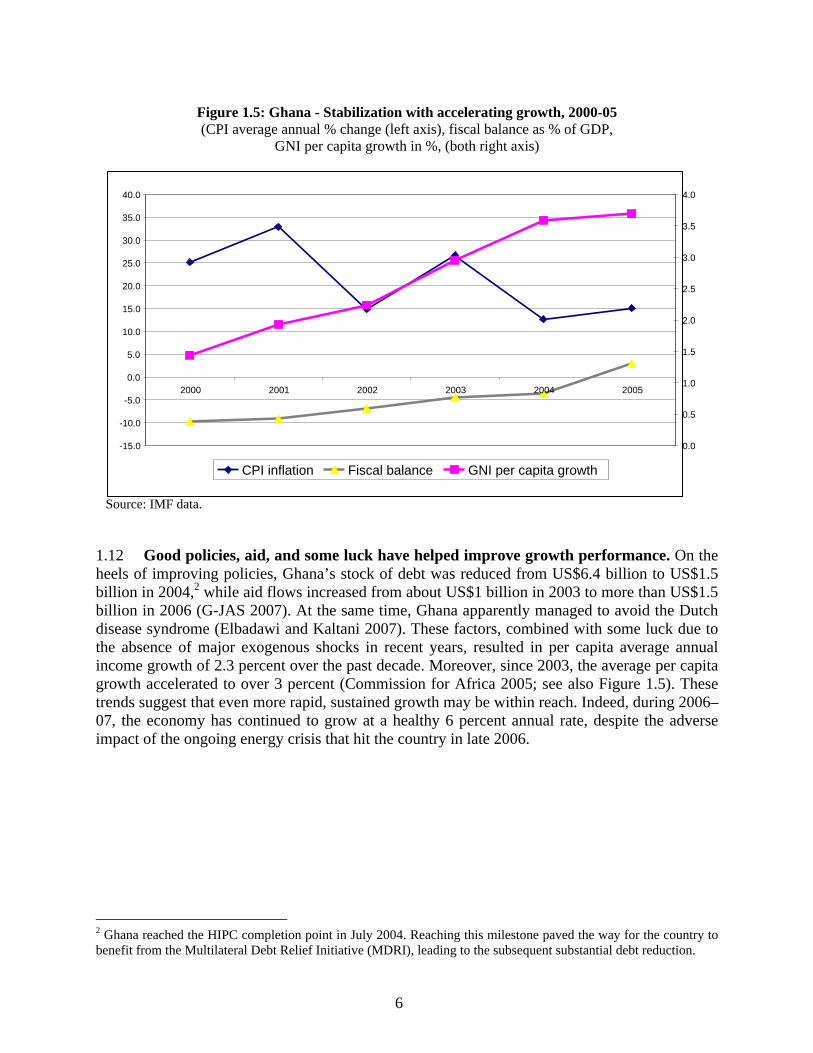
6
Figure 1.5: Ghana - Stabilization with accelerating growth, 2000-05 (CPI average annual % change (left axis), fiscal balance as % of GDP,
GNI per capita growth in %, (both right axis)
Source: IMF data.
1.12 Good policies, aid, and some luck have helped improve growth performance. On the heels of improving policies, Ghana’s stock of debt was reduced from US$6.4 billion to US$1.5 billion in 2004,2 while aid flows increased from about US$1 billion in 2003 to more than US$1.5 billion in 2006 (G-JAS 2007). At the same time, Ghana apparently managed to avoid the Dutch disease syndrome (Elbadawi and Kaltani 2007). These factors, combined with some luck due to the absence of major exogenous shocks in recent years, resulted in per capita average annual income growth of 2.3 percent over the past decade. Moreover, since 2003, the average per capita growth accelerated to over 3 percent (Commission for Africa 2005; see also Figure 1.5). These trends suggest that even more rapid, sustained growth may be within reach. Indeed, during 2006–07, the economy has continued to grow at a healthy 6 percent annual rate, despite the adverse impact of the ongoing energy crisis that hit the country in late 2006.
2 Ghana reached the HIPC completion point in July 2004. Reaching this milestone paved the way for the country to benefit from the Multilateral Debt Relief Initiative (MDRI), leading to the subsequent substantial debt reduction.
-15.0
-10.0
-5.0
0.0
5.0
10.0
15.0
20.0
25.0
30.0
35.0
40.0
2000 2001 2002 2003 2004 2005
0.0
0.5
1.0
1.5
2.0
2.5
3.0
3.5
4.0
CPI inflation Fiscal balance GNI per capita growth

7
Figure 1.6: Doing business indicators 2005-06 (Left axis = Ghana's ranking among 186 countries; lower rank number represents better performance)
Source: World Bank, Doing Business, 2007.
1.13 Overall, the regulatory environment and the investment climate have improved although there are important areas of remaining concern. On the regulatory front, as measured by the Doing Business Indicators (2007), Ghana scores relatively well on the basic indicators such as law and order, taxes, trading across border, and enforcement of contracts, but less well on issues affecting starting a business, getting a license and hiring workers. (Figure 1.6). The most recent Doing Business Indicators (2008 edition) review identifies Ghana as one of the top reformers. At the same time, the overall investment climate in Ghana, as measured by the World Bank’s just completed enterprise investment climate survey, is relatively good. The two main areas of investment climate that deserve particular attention, as measured on both subjective and objective indicators, are power and access to finance, especially for small and medium size firms (Figure 1.7).
0
20
40
60
80
100
120
140
160
Starting business Registering property
Employingworkers
Closing business Dealing withlicences
Paying Taxes Trading across borders
Enforcingcontracts
2005 2006

8
Figure 1.7: Managers’ responses on biggest investment climate constraints, MLEs and microenterprises
Source: World Bank Enterprise Surveys.
1.14 With growth momentum and good policy fundamentals, it is now clear that Ghana is in the middle of a major acceleration in economic growth (Figure 1.8). A Hodrick-Prescott (HP) smoothing filter of per capita growth for Ghana for 1984–2005 indicates that longer term growth is on the accelerated trend and that short-term growth, from 2002 on significantly exceeds the long-term upward trend. Most recent data indicate that this favorable trend continued in 2006–07. This accelerated growth is a result not only of high commodity prices but also of an improving economic policy environment and investment climate, rising amounts of investments, and increasingly harmonized aid. Furthermore, as discussed below, while past growth was driven mainly by factor accumulation, most recently, there is an indication of gradual productivity increases, albeit from a low base. Given this strong but recent performance and its proven ability to reduce poverty, a key long-term issue is how to sustain Ghana’s high growth in the next decade.
0%
20%
40%
60%
80%
100%
Electric
ity
Acces
s to
finan
ce
Acces
s to
land
Tax ra
tes
Trans
porta
tion
Mac
roec
onom
ic In
stabil
ity
Tax a
dmini
strat
ion
Compe
tition
from
info
rmal
firms
Crime
Corru
ption
Trade
and
custo
ms reg
ulatio
n
Inad
equa
tely e
duca
ted w
orke
rs
Busine
ss lic
ensin
g
Teleco
mm
unica
tions
Labo
r reg
ulatio
n
Courts
Politic
al ins
tabil
ity
% o
f firm
s sa
ying
issu
e is
ser
ious
pro
blem

9
Figure 1.8: Ghana's long-term trend and short-term growth per capita (%)
Source: Authors’ calculations using WDI data.
1.15 The good growth and policy performance has also attracted rising amounts of aid. Ghana is now one of the larger recipients of aid and donor coordination and harmonization has been improving. There is a joint assistance strategy in place (G-JAS) that aligns donor programs with government’s strategic objectives and harmonizes aid across donors and sectors. Yet the volume of aid and coordination and harmonization, as important as they are, are not the only dimensions of aid effectiveness that are important to recipient countries. Another of increasing importance for aid effectiveness and of interest to countries is aid predictability.
1.16 Since 2003, Ghana has also experienced improvements in aid predictability, but the average level of predictability still could be improved. Predictability, especially over the medium term, is important for policy planning and implementation of PRSs and programs for achievement of MDGs, yet this medium term predictability could still be improved in Ghana and many other countries. Predictability is especially important for budget support, yet this component of aid is typically vulnerable to greater fluctuation. Recent Bank analysis indicates that low-income countries in Sub-Saharan Africa experience the highest level of unpredictability. Predictability is improving in the better-performing countries, but the pattern is uneven. In a sample of thirteen countries with relatively large aid inflows, the mean absolute deviation in budget aid receipts from expected levels declined between 1993-99 and 2000-05, but was still almost one-third of the expected levels in the latter period (Figure 1.9). Within the sample, among the better-performing countries, the predictability of budget aid improved for some (e.g., Burkina Faso, Madagascar, and Ghana since 2003), stagnated for others (e.g., Tanzania), and even regressed for some (e.g., Uganda).
0.00
0.50
1.00
1.50
2.00
2.50
3.00
3.50
4.00
1990 1991 1992 1993 1994 1995 1996 1997 1998 1999 2000 2001 2002 2003 2004 2005
Real Per Capita Growth Trend Growth

10
Figure 1.9: Predictability of Aid - Some Country Examples
0
1
2
3
4
5
6
7
8
WholeSample
Madagascar BurkinaFaso
Ghana Tanzania Uganda Rwanda
Per
cent
of G
DP
1993-99
2000-05
Average Budget Aid
Mean Absolute Deviation
Note: Deviation is measured as the absolute difference between the budget aid projected in the government’s program with the IMF and actual disbursement. The periods compared are 1993-99 and 2000-05; however, for Ghana, Madagascar, and Rwanda, the calculations for the first period cover only a subset of that period for lack of data. Source: Celasun, Oya and Jan Walliser, 2007. Predictability and Procyclicality of Aid: Do Fickle Donors Undermine Economic Development. Paper presented at the 46th Panel Meeting of Economic Policy in Lisbon, June 1.
1.17 More tangible improvements in predictability will require greater transparency in aid allocations, longer-time horizons for aid commitments aligned as much as possible with the recipient’s medium- to long-term development strategy, and clearer and simpler rules for disbursements linked to performance. In this regard, some recent initiatives show promise. The European Commission has launched a proposal for six-year aid contracts with the African, Caribbean, and Pacific (ACP) countries. Called the MDG Contract, the arrangement aims to make EC’s budget support longer-term and more predictable to countries with a strong performance track record and a multiyear monitoring framework.3 The U.S.’s Millennium Challenge Account already employs 4-5 year aid contracts with pre-agreed disbursement schedules.4 Several European bilateral donors are adopting multiyear planning frameworks for aid budgets. The recent DAC initiative to ask donors to provide medium-term projections on aid at the country level is also a useful step.5 Donors are increasingly providing medium-term aid projections at aid coordination meetings, though the practice is uneven and the coverage of projections in most cases is partial.
Ghana’s growth, poverty, and inequality
1.18 The most remarkable aspect of Ghana’s growth experience from 1991 to 2005–06 is how effectively it reduced poverty. Growth was very good to Ghana’s poor in that Ghana’s poverty reduction experience, in the aggregate, is perhaps among the most successful in the
3 European Commission. 2007. Technical Discussion Paper on a “MDG Contract” – A Proposal for Longer-Term and More Predictable General Budget Support, June 19, 2007. 4 http://www.mcc.gov/programs/compacts.php 5 OECD-DAC, 2007. Methodology for the DAC 2007, Survey of Aid allocation Policies and Indicative Spending Plans (DCD/RD (2007)5/RDI, June 11, 2007).

11
Africa Region. The country’s overall poverty declined significantly––from 51.7 percent in the early 1990s to 39.5 percent in the early 2000s and then to only 28.5 percent in 2005–06 (GLSS5). This drop is a major achievement by international standards. It implies an average annual poverty reduction of approximately 1.5 percentage points, meaning that growth was very poverty reducing in the aggregate. As shown in the analysis below, the reason that Ghana’s growth was so poverty reducing was that its benefits were fairly broadly shared: growth raised agricultural incomes as well as employment and earnings across the spectrum of economic activities.
1.19 An estimated 5 million people were lifted out of poverty in just 15 years, and the middle class gained significantly. Said differently, if there had been no reduction in poverty over the last 15 years, the number of poor would be 5 million persons higher than it is today. Not only was the poverty rate almost halved but also the absolute number of the poor fell from 7.9 million in 1991–92 to 7.2 million in 1998–99, then to 6.2 million in 2005–06. Furthermore, this reduction was achieved despite a major increase in population. In addition, the poor, in the aggregate, were not the only beneficiaries of Ghana's growth. An emerging middle class (2nd-4th income/expenditure quintiles) registered large gains. The richest quintile became even richer, marking the period by an increase in inequality as well. Therefore, without a doubt, Ghana’s experience with growth and poverty reduction over the past 15 years represents an important success story in Africa (Figure 1.10).
Figure 1.10: Ghana's poverty reduction vs. Africa, 1991–2002 to 2005–06 (poverty %)
Sources: World Bank 2007 using WDI data; Coulombe and Wodon 2007 for Ghana.
20
25
30
35
40
45
50
55
1991/2 1998/9 2005–06
Ghana Sub-Saharan Africa
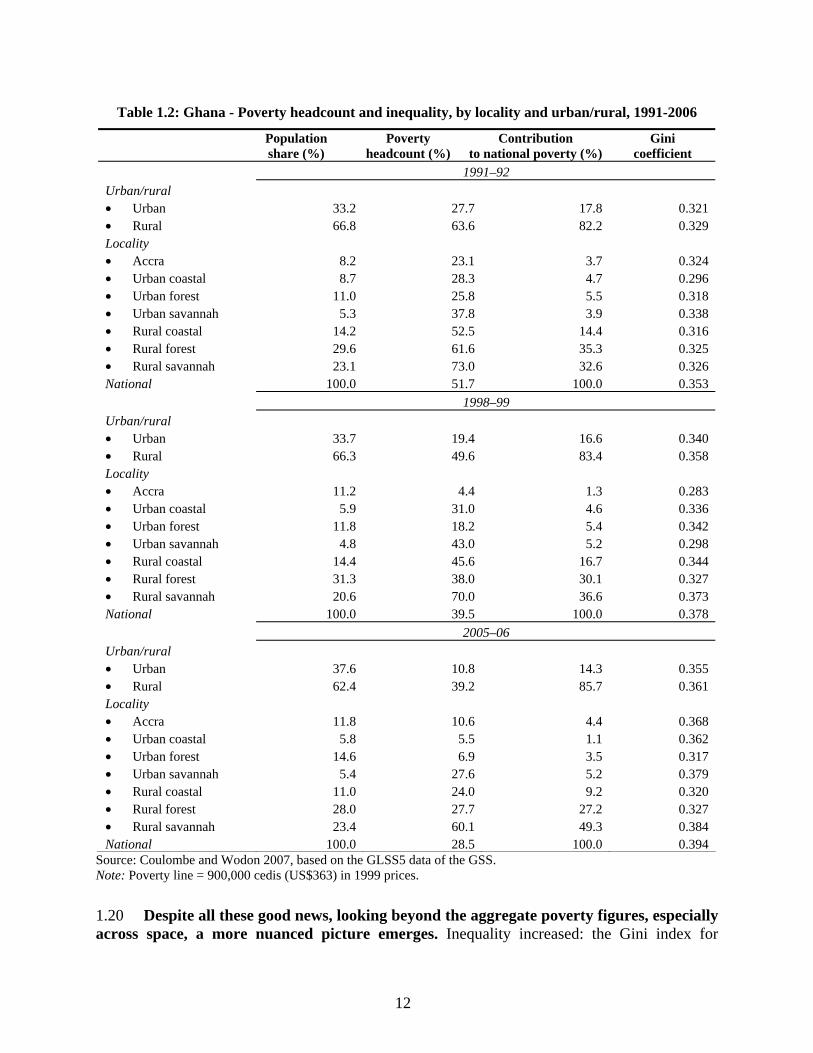
12
Table 1.2: Ghana - Poverty headcount and inequality, by locality and urban/rural, 1991-2006
Population share (%)
Poverty headcount (%)
Contribution to national poverty (%)
Gini coefficient
1991–92 Urban/rural • Urban 33.2 27.7 17.8 0.321 • Rural 66.8 63.6 82.2 0.329 Locality • Accra 8.2 23.1 3.7 0.324 • Urban coastal 8.7 28.3 4.7 0.296 • Urban forest 11.0 25.8 5.5 0.318 • Urban savannah 5.3 37.8 3.9 0.338 • Rural coastal 14.2 52.5 14.4 0.316 • Rural forest 29.6 61.6 35.3 0.325 • Rural savannah 23.1 73.0 32.6 0.326 National 100.0 51.7 100.0 0.353 1998–99 Urban/rural • Urban 33.7 19.4 16.6 0.340 • Rural 66.3 49.6 83.4 0.358 Locality • Accra 11.2 4.4 1.3 0.283 • Urban coastal 5.9 31.0 4.6 0.336 • Urban forest 11.8 18.2 5.4 0.342 • Urban savannah 4.8 43.0 5.2 0.298 • Rural coastal 14.4 45.6 16.7 0.344 • Rural forest 31.3 38.0 30.1 0.327 • Rural savannah 20.6 70.0 36.6 0.373 National 100.0 39.5 100.0 0.378 2005–06 Urban/rural • Urban 37.6 10.8 14.3 0.355 • Rural 62.4 39.2 85.7 0.361 Locality • Accra 11.8 10.6 4.4 0.368 • Urban coastal 5.8 5.5 1.1 0.362 • Urban forest 14.6 6.9 3.5 0.317 • Urban savannah 5.4 27.6 5.2 0.379 • Rural coastal 11.0 24.0 9.2 0.320 • Rural forest 28.0 27.7 27.2 0.327 • Rural savannah 23.4 60.1 49.3 0.384 National 100.0 28.5 100.0 0.394
Source: Coulombe and Wodon 2007, based on the GLSS5 data of the GSS. Note: Poverty line = 900,000 cedis (US$363) in 1999 prices.
1.20 Despite all these good news, looking beyond the aggregate poverty figures, especially across space, a more nuanced picture emerges. Inequality increased: the Gini index for

13
consumption rose from 0.353 to 0.394, and the increase in income inequality was even more pronounced. Despite major gains, significant rural poverty remains. Poverty fell by approximately 17 points in urban areas, and, remarkably, by 24 points in rural areas. However, the reduction in poverty was lower in the poorer areas of the country, such as the rural savannah areas. At the same time, the gaps between the various regions of the country have widened, as contribution of Rural Savannah to national poverty increased. (Table 1.2). As Coulombe and Wodon (2007) speculate, future gains in poverty reduction could be more difficult to achieve without even more rapid growth. The reason is that these gains would have to take place in more remote areas that also are less well endowed with physical and human capital as well as agricultural potential. However, one also could argue that as the proportion of the poor in poor areas becomes higher, reaching a large number of the poor through well-targeted policies and programs becomes easier.
1.21 Overall, the increase in inequality was relatively minor compared to the reduction in poverty due to growth. The Gini index for consumption per equivalent adult increased from 0.353 in 1991–92 to 0.378 in 1998–99, and finally to 0.394 in 2005–06. Coulombe and Wodon (2007) provide a simple decomposition of growth contribution to poverty reduction (in consumption per equivalent adult) and changes in inequality (Datt and Ravallion 1992) (Table 1.3). Over the full period under review, from 1991 to 2006, the headcount index of poverty was reduced by 23.2 percentage points. Had there been no change in inequality, the reduction in poverty would have reached 27.5 points, so that Ghana would have achieved the MDG target of reducing poverty by half vis-a-vis its 1990 level. From this perspective, therefore, this target has not yet been achieved because the increase in inequality led to a poverty rate in 2005–06 that was 4.3 points higher than it would have been with fully equitable growth.
Table 1.3: Decomposition of change in poverty headcount - Total, urban, and rural areas (%)
Share of change due to: Total change Growth Redistribution
1991–92 to 1998–99 National -12.3 -13.1 0.9Urban -8.3 -10.7 2.4Rural -14.0 -14.4 0.31998–99 to 2005–06 National -10.9 -13.5 2.6Urban -8.6 -8.6 0.0Rural -10.4 -13.8 3.41991–92 to 2005–06 National -23.2 -27.5 4.3Urban -16.9 -20.0 3.1Rural -24.4 -28.7 4.3
Sources: Coulombe and Wodon 2007; Ghana Statistical Services 2007. 1.22 Another way to look at the relationship between growth and inequality is to rely on growth incidence curves, which show how much various income groups benefited from economic growth (Ravallion and Chen 2003). Remarkably, for Ghana, these curves show that all income groups benefited from growth. Although gains varied across individual income groups, the middle class (second through fourth quintiles) registered large and fairly uniform

14
gains. These curves show growth rates in consumption at various points of the distribution, starting from the poorest groups on the left of the horizontal axis to the richest on the right. Clearly, as shown in Figure 1.11 (for the most recent period 1998–99 to 2005–06) and Figure 1.12 (for the whole period 1991–92 to 2005–06), all of the growth rates are positive and substantial, but they are significantly higher in the upper consumption/income groups.
Figure 1.11: Ghana’s growth incidence curve, 1998–99 to 2005–06
Source: Coulombe and Wodon 2007.
Figure 1.12: Ghana’s growth incidence curve, 1991–92 to 2005–06
Source: Coulombe and Wodon 2007. Ghana’s growth aspirations and challenges
1.23 Ghana now faces an opportunity to fulfill its Ghana Poverty Reduction Strategy II (GPRS II) aspirations to accelerate growth and double its per capita income in the next decade. Aggregate growth in 2003–05 averaged a healthy 5.6 percent. During 2006-07, it is
020
4060
Med
ian sp
line
0 20 40 60 80 100Percentiles
020
4060
80
Med
ian sp
line
0 20 40 60 80 100Percentiles

15
likely to average close to 6 percent. Policy performance is strong; and good progress was made on recommendations of the previous CEM (Box 1.1). The terms-of-trade outlook is favorable. Debt relief, including the Multilateral Debt Relief Initiative (MDRI) debt relief, has helped create fiscal space for investments in better infrastructure, education and health, and governance. International commercial banks have taken note of Ghana’s relatively low external debt-to-GDP ratio (now 43 percent of GDP) and manageable debt service (approximately 4 percent of GDP), and seem ready to offer additional, nonconcessional financing for the government’s investment plans. A recent, joint World Bank–IMF debt sustainability exercise has tentatively concluded that Ghana’s baseline growth prospects are quite strong and risks of new debt distress in the foreseeable future limited, subject to prudent levels of future borrowing (IMF 2007).
1.24 The authorities’ Growth and Poverty Reduction Strategy (GPRS II) for 2006-09 reaffirms the key growth objective: the need to accelerate growth to achieve middle-income status by 2015. This objective will be pursued via policies clustered around three main pillars:
• Improving private sector competitiveness. • Strengthening human resource development. • Further improving governance and accountability.
Box 1.1: Ghana - Main Findings of the Previous CEM (2004)
The previous Ghana CEM focused on the period from the late 1990s to 2002–03. It identified three main groups of constraints to Ghana’s growth: the large size of the public sector, inadequate and inefficient investments, and low agricultural productivity. The large size of the public sector was related to the high wage bill and the fiscal deficit. An exchange rate appreciation in the 1990s has been associated with poor macroeconomic management. Public sector institutional structure involved significant overlaps of responsibilities and weak coordination. Inadequate investments and the high cost of doing business resulted in low productivity and impeded competitiveness in nonfarming activities.
Regarding short-, medium-, and long-term measures and policies, the CEM recommended removing these constraints to accelerate economic growth. In the short run, the report recommended consolidating Ghana’s fiscal position, streamlining government structure, and strengthening public-private sector partnerships. This last would improve an environment conducive to private sector investment in infrastructure such as water, power, transportation, and telecommunication. It also recommended strengthening the fight against corruption. In the medium term, the report urged the government to improve public sector efficiency by downsizing the sector. This effort should be accompanied by measures to eliminate subsidies to public enterprises; improve the management of public finance, particularly public expenditures; and allocate resources in line with strategic priorities, such as small-scale irrigation, agricultural research, feeder roads, ports, and airports. Business environment, cluster development (agroprocessing and manufacturing), financial sector, and nontraditional export growth also should be encouraged. For the long run, the CEM emphasized the need to encourage policy that maximizes the demographic dividend through investment in education and health.
All told, Ghana has successfully implemented the short-run recommendations, resulting in strengthened economic performance. Yet, important elements of the medium-term agenda remain unfinished. Ghana also has since reduced inflation and improved the overall policy environment. However, greater attention to public-private partnerships and improvements in infrastructure service delivery and value-for-money is needed. The GPRS II provides a clear vision for growth and broad axes of action for 2006–09. The current Ghana CEM aims to help operationalize the strategy and provides fresh advice with specific policies and measures to consolidate gains and improve longer-term growth prospects.

16
1.25 Explicitly, these goals and policy pillars are predicated on the debt relief and scaling up concessional assistance (including under the Millennium Challenge Account, or MCA), and, potentially, on accessing international capital markets. Equally important, they depend on further strengthening macroeconomic and structural policies and more efficient use of resources for higher growth. In addition, Ghana is in the middle of preparing the next National Development Plan, which will chart a vision of the country’s growth and development in the next decade.
1.26 Despite legitimate aspirations, Ghana faces daunting development and policy challenges. These challenges and their scale, cost, and policy implications are analyzed in depth in the remaining papers of Ghana CEM, volumes 1-3. These challenges are selectively summarized below:
• While, according to the Ministry of Energy, access to electricity has improved in recent years,6 the country now faces an energy crisis.7 More broadly, infrastructure gaps in other sectors such as water, roads, and sanitation are massive. Cumulative needs in the 4 major infrastructure sectors were recently estimated at US$3.4 billion for 2004–08, representing annual outlays of approximately 8 percent of GDP. This rate is approximately three times more than in previous years (Briceno-Garmendia 2004; Tsibouris and others 2004). Ensuring the required financing is likely to require significant private sector participation. Newly revised estimates based on the recent data and developed under the current 2007 Ghana CEM paper on infrastructure indicate that these needs may be even higher in the medium term (Estache, Vagliasindi, and others 2007, Chapter 1 in Volume 2 of this CEM), especially in water and sanitation. This sector is engulfed in a “silent crisis” that has received little attention compared with the ongoing energy crisis.
• Despite strong growth, the resource and export base of the economy remains narrow and the economy highly vulnerable to external shocks. Agricultural productivity is low. Moreover, there is evidence of unsustainable natural resource use and environmental degradation that may have already cost Ghana 1 percentage point in aggregate economic growth over the past decade (World Bank/DFID/ISSER 2005). Ghana did experience export diversification. However, it has not yet gone far enough, and exports are yet to act as a major engine of economic growth (Chandra 2007). Future oil revenues will need to be prudently managed (see Annex 1). Also, the rising trade and investment relations with China offer important opportunities (see Annex 2).
• Although the business environment and investment climate improved, it is still lacking in some areas of private sector development, such as starting a business, getting a license, registering property, and accessing credit (Doing Business 2007; Figure 1.6; Clarke 2007). Keefer (2007) reports that business start-up costs in Ghana are, as a fraction of per capita income, 17 percent higher than the average of all other countries. These costs are 46 percent higher than the average of countries that, as does Ghana, hold
6 According to the Ministry of Energy, access to electricity increased to 54% in 2005 from 44% 5 years earlier. 7 The combined impact of the crisis and lower water levels on mining and manufacturing likely reduced real GDP growth in 2006 by 0.7%–0.9%. However, this decrease was offset by the bumper crop of cocoa of approximately 770,000 metric tons, compared with 586,000 in 2005. Nevertheless, the adverse impact of the energy crisis is likely to be felt during most of 2007 (Cavalcanti and others 2006; energy sector notes; ongoing work on joint IMF-Bank Debt Sustainability Assessments, DSAs).

17
competitive elections. Private investment is highly sensitive to governance indicators: corruption, bureaucratic quality, and the rule of law. Concerning these, Clarke (2007) presents evidence that Ghana compares favorably with many low-income Sub-Saharan countries. Keefer (2007) presents more evidence suggesting that, when compared with a broader universe of developing countries, Ghana’s performance is at best average, and in several cases significantly worse than average. In addition, preliminary Investment Climate Assessment (ICA) survey results (Clarke 2007, Volume 2, Chapter 3, of this CEM) indicate that poor electricity supply and access to finance––especially for small firms––are aspects of the investment climate that need considerable improvement. Compared with earlier surveys, these findings suggest that in important dimensions such as macroeconomic stability and taxes, for example, investment climate seems to have improved in Ghana. Meanwhile, access to finance remains an issue, and electricity problems have become a serious issue recently.
• Progress in public sector reform has been made but slowly. Further progress is needed on public expenditure/financial management, transparency, and internal audits. Controlling the public sector wage bill remains a challenge. Implementing value-for-money in all public sector activities would help (joint IDA-IMF Advisory Note of the Poverty Reduction Strategy (PRS) and 2004 Progress Report, April 21, 2006).
• The policy focus on growth is also vital to meet social objectives and the MDGs. However, it must not detract from the remaining sectoral social agenda to help improve key MDG health and education outcomes in a country with a per capita income of only US$450 (see chapter 2 of this Volume 1 regarding simulating the achievement of MDGs).
1.27 Moreover, these same outcomes also impact economic activity and growth. Firm surveys reveal that the issue of skills and difficulties of attracting skilled workers may be important, especially for larger and knowledge oriented firms. However, the most recent Investment Climate survey indicates that these issues are less of a concern for small firms, which usually rely on basic skills. With respect to skills, compared with neighboring countries, Ghana is a good performer, overall, but the quality remains an issue. Also, using a variety of comparator groups, Keefer (2007) shows that, controlling for demographic and other factors, gross secondary school enrollment in Ghana is 20 percent less than the average in countries that hold competitive elections. The government is addressing the lack of skilled workers with a set of reforms. However, the extent to which these reforms address quality issues, and are backed by adequate funding, remains unclear.
1.28 These challenges mean that Ghana must continue to strengthen its overall policies and build resilience and capacity for accelerated growth, while confronting the constraints to these goals.
GROWTH ANALYTICS: ANALYZING DIMENSIONS OF GHANA’S GROWTH
1.29 Given this broad background, a deeper analysis of Ghana’s growth story requires a multi-dimensional, eclectic approach that could be termed “growth analytics.” This approach starts from the uncontroversial premise that there is no single, all-encompassing theory of economic growth nor a single best method for analyzing past economic growth (Johnson, Ostry, and Subramaniam 2007). A second premise is that growth is more than just a number.

18
Rather, it resembles development itself. Similar to poverty, growth is a multidimensional phenomenon that has its own supply, demand, exogenous, policy, institutional, and aid dimensions. At its base, it has firms and households and, most importantly, people, whose welfare is directly affected by the economy’s growth prospects. To analyze such broadly defined economic growth, no single methodology can provide all the answers. An eclectic approach is required (Box 1.2).
Aggregate growth accounting: Factor accumulation vs. productivity growth
1.30 Long-term growth is a product of both factor accumulation (physical and human) and increased productivity. Gains in productivity reflecting more efficient use of inputs long have been recognized as an important source of improvements in income and welfare. Therefore, a standard growth accounting model (based on Solow 1957) can be used to unbundle growth into factor accumulation and productivity gains. We are interested in this disaggregation, partly to help identify where to assign priorities for possible policy reforms. For example, the finding that factor accumulation is high but productivity gains are low suggests emphasizing improvements in closing the infrastructure gaps, improving human capital, and removing obstacles to competition. Remaining barriers to competition suggest the need for greater emphasis on governance difficulties that reduce returns to capital and labor.
Box 1.2: Growth analytics - Eclectic Approach to Analyzing Growth in this CEM
The “growth analytics” approach aims to piece together a broader, multidimensional picture of Ghana’s growth. We first seek to analyze the various dimensions of Ghana’s growth experience. This approach combines analytical tools to help uncover important elements of Ghana’s growth experience: (1) growth accounting; (2) analysis of sectoral structure of growth and structural transformation of the economy; (3) demand analysis; (4) analysis of relevant exogenous shocks; (5) policy analysis; and (6) other approaches such as microeconomic analysis at the firm and household levels, aid analysis, and elements of growth diagnostics. This approach combines macro, sectoral, and micro approaches to analyze the totality of Ghana’s growth experience (Bourguignon 2006). The “growth analytics” approach is distinct from, and encompasses (as special cases), single-tool approaches such as growth accounting or growth diagnostics8. It is close to Nankani and others’ (2005) approach, which emphasizes country specificity in understanding a country’s growth experience.
1.31 From the aggregate macroeconomic viewpoint, an increase in productivity can be measured by gains in total factor productivity (TFP). In this setting, TFP represents any change in real output that cannot be explained by the physical or human capital accumulation. To measure TFP, a production function must be assumed for an economy that estimates how inputs
8 A “growth diagnostics” exercise for Ghana (Lumbila 2007) pointed to similar constraints identified using other approaches in this CEM (i.e., infrastructure), corroborating findings from other methods and sectoral analysis presented in Volume 2 of this CEM. But even this recently popular approach (Hausmann, Rodrik and Velasco, 2004) cannot be assured to provide unambiguous answers and in many cases requires additional analyses. One fundamental problem with growth diagnostics is that its assessment relies on clear and complete evaluation of relative prices and marginal contributions of various constraints to growth. While theoretically appealing, in heavily supply constrained economies such as those found among low-income countries, such an approach may be difficult to implement due to missing or even misleading data, making judgments about which constraints are most “binding” very difficult. Hence using several approaches might be more productive to avoid the misleading conclusions based on a single approach.

19
are combined to produce outputs. In measuring Ghana’s TFP, we assume a standard Cobb-Douglas production function:
,])*([ )1(1.0 γαα −= SeLKAY (1) in which A is TFP, K is physical capital, L is labor, S is average number school years per labor unit, γ measures the returns to scale, α measures the elasticity of output (Y ) to physical capital, and (1-α) measures the elasticity of output to labor and education inputs. If γ =1 (γ>1) (γ<1) there are constant (increasing) (decreasing) returns to scale.9
1.32 Following standard practice in growth accounting, we generated a capital stock series based on assumptions about the initial stock level and depreciation rates. The capital stock can be estimated by multiplying the GDP of the initial year by the country’s incremental capital output ratio. For Ghana, we used the 3-year average (1969, 1970, and 1971) capital/output ratio of 1.8, which is within the reasonable range of 1 to 2. The physical capital depreciation rate is fixed at 4 percent per year, and return to education at 10 percent per year (Box 1.3). In addition, based on the growth accounting experience in other developing countries, we assumed α=0.4.10
1.33 Nevertheless, interpreting the estimates of TFP using this approach can be difficult. The reason is that, at the aggregate level, productivity gains can be explained by both exogenous or endogenous factors. They include favorable weather conditions and commodity prices, resource shifts from less productive to more productive sectors (perhaps as a result of economic reform), more productive sectors attracting new investments, technology advances, or even human capital or physical capital accumulations that are not captured in the data. As a result, the TFP analysis can shed limited light on the sources of growth between factor accumulation and productivity generally.11 Nevertheless, it is a first useful step in a more in-depth analysis of Ghana’s growth story.
9 Ghosh and Kraay 2000. 10 Bosworth and Collins carried out a growth accounting exercise for all countries with available data for 1960–2000, and updated it for 1960–2003. They used the Cobb-Douglas production function with α=0.35, depreciation rate of 6%, and return to education of 7%. In a study using a panel of African countries, Berthélemy and Soderling (2000) found 0.45 as the elasticity of output to capital. In an econometric study of developing countries, Nehru and Dhareshwar (1994) found 0.52 as the elasticity of output to capital. 11 However, data on the investment and labor force at the subsector level are sparse. Therefore, it is difficult to analyze subsector TFP. In this CEM, whenever possible, we support the aggregated TFP analysis with subsector information.

20
Box 1.3: Variable Definitions and Data Sources in Growth Accounting
All growth rates were calculated using the simple Least-Squares method on data series: Y = Gross domestic products. They are based on constant Ghana cedis. (World Bank WDI database).
K = Fixed capital accumulation. Total capital stock is calculated based on an estimate of the initial capital stock by multiplying the initial year GDP by the three-year average incremental capital output ratio. The capital stock of subsequent years is obtained by adding the gross fixed capital formation to the last year’s capital stock with 4 percent depreciation. (World Bank WDI database).
S = School years of the labor force. The average school years for the labor force in 1970 were obtained from the Barro-Lee (2000) database. For subsequent years, we first used 2003 CWIQ to calculate the average school years per labor unit, which was 5.7 years. The average school years of the labor force then was extrapolated between the initial year and 2003, and further extended to 2005 at 5.9 years.
L = Labor force. Active labor force. Estimated by multiplying the total population by percent of 15–64 year-old population and by labor participation rate. (World Bank WDI database and ILO database for labor participation).
1.34 Based on Ghana’s phases of political and economic development and to capture both long-term trends and developments within shorter periods, we carried out growth accounting exercise for four main periods. First, we looked at the sources of growth for the entire period between 1970 and 2005. We then focused on the 5-year intervals between 1991 and 2005, the latest economic recovery period, which is of particular interest in this CEM. The first decade of these 15 years was characterized by a stable but relatively moderate growth path at an annual rate of 4 percent. However, during 2001–05, the economy clearly experienced an accelerated growth above 5 percent. While we are interested in the long-term performance, our main focus is on the most recent acceleration in growth. We use the historical growth experience between 1970 and 2005 as background and a benchmark.
1.35 Looking at the entire period of analysis, 1970–2005, the overall annual growth in Ghana averaged 2.7 percent, but due to the high rate of population growth, the per capita growth was well below 1 percent. This growth performance is consistent with the growth accounting analysis for this entire period, suggesting that Ghana’s growth has been driven mainly by increased labor force and, to a lesser extent, by capital accumulation. Indeed, the main engine of economic growth was factor accumulation––especially labor––rather than productivity gains (Table 1.4).
1.36 However, during 1991–2005––aggregate growth began to accelerate. In the most recent 5-year subperiod, 2001–05, it increasingly was driven by TFP and capital. In particular, in that subperiod, the estimates indicate strong growth in total factor productivity (TFP), which contributed 30 percent of the total growth. This pattern is especially strong in the agricultural sector, as discussed below.

21
Table 1.4: Ghana - Growth rates and sources of growth from a Solow-Denison Model (%)
1970–2005 1991–1995 1996–2000 2001–2005
Growth accounting for the whole economy, 1970–2005 Average annual growth, depreciation = 0.04
Real GDPa 2.7 4.0 4.2 5.2 Fixed capital accumulation 2.1 4.3 5.9 3.9 Labor force 2.7 2.8 2.3 2.5 School years of the labor force 0.8 0.8 0.9 1.0 Total factor productivity -0.26 0.05 -0.07 1.6
Contribution to growth, α = 0.4, depreciation = 0.04b Fixed capital accumulation 31.6 43.7 56.2 29.8 Labor force 61.3 42.6 32.8 28.5 School years of the labor force 16.9 12.4 12.7 11.1 Total factor productivity -9.9 1.3 -1.6 30.6 Total 100 100 100 100
Source: WDI, Ghana Live Data Base (LDB), authors’ calculation. Notes: a We did a sensitivity analysis based on various scenarios, including the initial capital output ratio at 1.3, estimated using the perpetual inventory method as in Nehru and Dhareshwar (1993), depreciation rate at 0.06, and α at 0.35 and 0.45. The results are basically the same: the factor accumulation accounted for most of the growth over the 15 years while TFP contribution to growth was more pronounced in the last 5 years. b α is the parameter that measures the importance of physical capital in Cobb-Douglas production function.
Factor reallocations and technology changes in Ghana’s growth
1.37 To what extent has the observed TFP growth been due to factor reallocations? Experience in developing countries has demonstrated that more efficient reallocation of factors across sectors may be an important source of growth, TFP growth in particular (Kraay 1996). Table 1.5 on intersector labor reallocation in Ghana between 1991 and 2005 shows that, indeed, labor increasingly has shifted from the agricultural sector toward financial services, transport and communication, and construction sectors.
Table 1.5: Ghana - Employment share by sector and the most recent changes (%)
1991–95 1996-2000 2001–05 Change between 1996 and 2005
Agriculture 46.6 45.5 43.5 -5 Mining/Quarrying 0.7 0.8 0.9 9 Manufacturing 12.0 13.9 14.0 1 Utilities 0.2 0.3 0.3 3 Construction 1.7 1.7 2.1 21 Transport/communication 2.7 2.8 3.5 24 Trading 22.5 22.2 22.9 3 Financial services 0.8 1.0 1.4 39 Community and other services 12.6 11.8 11.4 3 Total economy 100 100 100
Source: Coulombe and Wodon 2007. The labor shares from Ghana Living Standard Surveys are available for 1991, 1997, and 2005. All shares in other years were extrapolated between the two data points.

22
1.38 The contribution of intersector reallocation of labor force to TFP can be quantified using the expression:
ij ijijiji gyTFP εω += ∑
Where ωij is the output elasticity of labor in sector j at period i; yij is the average share of value added in that sector for the period i; gij is the growth rate of the share of labor in sector j over the
period i; and iε is the remaining TFPi that can not be accounted for by the intersector resource reallocation (Kraay 1996). Based on our production function, we first assumed that labor elasticity was 0.6 for all sectors. However, since some technology improvements have taken place in agriculture, we performed a sensitivity analysis by assuming that the agricultural sector has a higher elasticity of 0.7, while maintaining the overall output elasticity of labor at 0.6. Table 1.6 presents the results, indicating that intersector labor movement contributed approximately 20 percent to total TFP growth. Sectors that benefited most from this reallocation effect include construction, transport, and nontrading services (especially financial). This still leaves a large, autonomous increase in TFP (80 percent) that could be thought of as “pure” productivity effect within the measured, overall increase in TFP.
Table 1.6: Ghana - Contribution of intersector labor reallocation to Solow residual (%)
Elasticity of agricultural sector = 0.6
Elasticity of agricultural sector = 0.7
TFP growth 1.6 1.6 Agriculture -0.2 -0.3 Mining and quarrying 0.1 0.1 Manufacturing 0.0 0.0 Electricity 0.0 0.0 Construction 0.2 0.2 Transport storage and communication 0.2 0.1 Wholesale and retail trade, restaurants, and hotels 0.0 0.0 Finance, insurance, real estate, and business services 0.2 0.2 Community and other services 0.0 0.0 Total intersector labor reallocation effect 0.4 0.3 As % of Solow residual (TFP) 23.7 16.7
Source: IMF Country Sheet, GLSS data and authors’ calculation.
1.39 In addition to intersector labor reallocation, there is also the intrasector reallocation. It is possible that, for example, within the agricultural sector, labor is reallocated from less productive to more productive subsectors, say, from cereal crop to cocoa production. However, due to the lack of robust data on labor use in various agricultural activities, it would be difficult to quantify this intrasector resource reallocation effect for Ghana. International studies might provide some indication of a possible average magnitude of the growth contribution due to such reallocation. For example, a case study demonstrated that the intrasector reallocation contributed to approximately 15 percent of the TFP growth in China (Kraay 1996). This figure could serve as an upper bond for Ghana since China has gone through more extensive inter- and intrasectoral changes than Ghana in the course of its transition from planned to a market

23
economy. Therefore, even if we take as such contribution half of that found in China, the total contribution of inter- and intrasectoral labor reallocation in Ghana to the overall TFP growth would not exceed 27 percent, leaving 73 percent driven by “autonomous” TFP growth.
1.40 Finally, changes in technology can also contribute to growth. Recent technological changes have been documented in Ghana, especially in the agricultural and ICT sectors. In agriculture, such changes include the adoption of high-yield crop varieties and changes in ant-pesticide and spraying technologies. What this means is that instead of constant return to scale, Ghana’s production function may display increasing return to scale. Although this effect is difficult to quantify, sensitivity analysis for the return to scale parameter γ could provide some indication. In a study of a set of 9 Asian and G5 economies, Kim and Lau (1994) found evidence of increasing returns in Asian economies was on the order of 1.3. Using 1.3 as an upper bond and assuming different increasing returns to scale parameters, Table 1.7 presents the contribution of change in technology to growth for 2001–05. Given the overall level of technology absorption and related productivity gains in Ghana, the country’s increasing return to scale parameter γ is likely to be considerably lower than in high performing Asian countries. The first two columns of Table 1.7 are likely to capture the realm of a possible impact of increasing returns to scale, if any.
Table 1.7: Sensitivity analysis - Growth contribution through increasing return to scale
γ =1 γ =1.1 γ =1.2 γ =1.3
Growth due to increasing return to scale (%age point) 0 0.36 0.73 1.09 Total factor productivity growth as % of GDP growth 30.6 23.6 16.7 9.8
1.41 In sum, the above analysis of the sources of the most recent TFP growth suggests that 27 percent–30 percent came from inter- and intrasector labor reallocation. Technology advances may have contributed less than 10 percent of total growth. Therefore, overall, these three factors––intra- and intersector reallocation and technology advances––appear to have accounted for between one-third and one-half of the total TFP gains between 2001 and 2005.
Agricultural growth
1.42 Agriculture is a pillar of Ghana’s economy. Agriculture accounts for approximately 40 percent of GDP and employs 55 percent of the labor force. This sector thus deserves a special look by the growth analysis. Interestingly, despite difficult years, over the past 25 years, agriculture largely kept pace with the rest of the economy. Between 1979 and 2005, the agricultural sector grew at roughly the same speed as the rest of economy, except between 1991 and 1996.12
1.43 Even so, over the long haul, agricultural growth arose from factor expansion, not productivity growth (Diao 2005). The latter remains low as in many low-income African countries. However, the most recent subperiod after 2001 evidences gradual productivity gains,
12 For the agricultural sector, we have adequate data going back only to 1979.

24
although from very low levels. These recent gains can be traced to specific, productivity-enhancing measures and results in the cocoa sector.
1.44 Since 2001, the agricultural sector has been growing at an average annual rate of 5.7 percent––that is, faster than the overall GDP growth of 5.2 percent. Using FAO data on agricultural investment and labor force participation, we estimate a growth accounting model for the agricultural sector (Table 1.8). The model shows that total factor productivity accounts for 60 percent of agricultural sector growth between 2001 and 2005. This model also suggests that a large proportion of the overall TFP growth between 2001 and 2005 resulted from agricultural TFP growth.
1.45 However, the short period over which this estimate is constructed makes it sensitive to initial (2001) estimates of land and capital in agriculture. In addition, this is not to say that all is well with Ghana’s agriculture nor that productivity increases are particularly impressive. As mentioned above, productivity gains in the Ghanaian economy, including in agriculture, are quite recent and begin from a very low base. While they provide some ground for optimism, the gains are more an indication of the potential going forward than a sign of a particularly productive economy at this stage. Moreover, other researchers using different data, methods, and a somewhat earlier time period looked at land productivity and concluded that most agricultural growth in Ghana can be explained as the result of bringing new land under cultivation, not by higher yields (Diao 2005). Clearly, more research would provide more definitive answers to the questions of the factors behind the dynamism in Ghana’s agriculture. We take one more step toward this end by a closer inspection of agricultural growth performance in the most recent period, 2001–05.
Table 1.8: Ghana agricultural sector - Growth rates and sources of growth from a Solow-Denison Model (%)
Growth accounting for the agricultural sector, 1979–2005** Average annual growth percent, depreciation = 0.04
1979–2005 1991–1995 1996–2000 2001–2005 Real agricultural growth 2.6 1.7 3.9 5.7 Fixed capital accumulation 2.3 3.0 2.8 0.5 Labor participation 2.6 2.6 2.4 2.1 Education level 0.8 0.8 0.9 1.0 Total factor productivity -0.66 -1.7 0.9 3.4
Contribution to growth , α* = 0.4, depreciation = 0.04 Fixed capital accumulation 36.7 69.4 28.5 3.5 Labor participation 61.3 90.4 37.3 21.8 Education level 27.8 35.3 11.4 15.3 Total factor productivity -25.9 -95.2 22.8 59.4 Total 100.0 100.0 100.0 100.0
Source: WDI, and Ghana LDB for growth, FAO database for Agricultural Sector, authors’ calculation. Notes: *α = the parameter measures the importance of physical capital in Cobb-Douglas production function. ** = the agricultural TFP is not strictly comparable with the overall TFP changes, because data sources for agricultural sector growth accounting are different from those used for the total TFP calculation.

25
Closer look at agricultural productivity during 2001–05
1.46 As mentioned above, the agricultural sector appears to be an important sector driving the recent aggregate TFP growth in the 2001–05 subperiod. An important question is whether this recent TFP growth in the agricultural sector is based on (1) factors endogenous to the growth process, signifying that this high growth can be accelerated and sustained; or (2) exogenous factors, such as favorable commodity prices and/or weather conditions.
1.47 Ghanaian agricultural production is dominated by cereal and starchy roots (maize, rice, yams, cassavas, and others). These crops account for about 50 percent of Ghana’s total crop and livestock production values. However, Ghana’s cereal-cropping systems are characterized by low productivity. While output of these crops has increased in quantity, total production values have increased little due to significant price declines (Table 1.9). A consequence has been that, faced with declining prices and incomes, to maintain a labor productivity that could sustain a minimum livelihood, labor had to move out of this sector. A 2007 study on youth and urbanization (Boakye) found that these developments are related, corroborating the evidence on labor reallocation discussed above. The study found that labor (especially youth) increasingly is moving out of agriculture to participate in industrial, manufacturing, services, and construction employment. Notably, an increasingly larger part of this employment has been taking place in the informal sector.
Table 1.9: Agricultural crop and livestock production, 1995–2004 (%)
Production values, m$ Total output, '000 tones Area harvested, '000 ha
Production values, $m
% change
Share of total production
values
Total output,
tones%
change
Share of total
outputTotal area harvested
% change
Share of total area harvested
Average Price
change, %
Cereals and pulses 409 -0.4% 14% 1,935 5.6% 17.4% 1,513 1.4% 30% -6.5%Of which maize 147 -3.7% 36% 782 2.1% 40% 727 2.2% 48% 0.1%
Starchy roots 995 0.9% 35% 7,668 2.0% 68.8% 1,168 5.0% 23% -4.6%Of which yams 450 1.8% 45% 2,112 3.9% 28% 248 7.6% 21% -1.2%
Cocoa beans 294 11.2% 10% 400 8.5% 3.6% 1,333 5.7% 26% 3.5%Nuts/oil seeds 161 3.2% 6% 986 1.2% 8.8% 546 6.6% 11% -5.0%Meat 165 9.0% 6% 163 2.1% 1.5% na na na 0.2%Others 850 4.9% 30% na na na 567 3.5% 11.1% naTotal 2,872 3.6% 100% 11,152 3.7% 100% 5,127 4.2% 100% na Source: FAO Agricultural database, authors’ calculations.
21. Agricultural growth is usually driven by an expansion of land, increasing yields, or a combination of the two factors. During 2001–05, extensive agricultural growth remained important. The strong agricultural growth in this short period benefited from a productivity increase in the important traded sector of agriculture––cocoa––but also in a few primary grains, primary fiber crops, and cereals (Figure 1.13). Cultivated land has been growing most rapidly for oil crops, which may explain their yield reduction possibly due to young palm oil trees not having reached their maturity in production (Figure 1.14). Land for cocoa trees has expanded at an annual 5 percent growth rate while maintaining an impressive yield growth of 17 percent. Noteworthy also is fiber crops’ decline in acreage while maintaining an annual growth in yield of more than 6 percent.

26
Figure 1.13: Average annual growth of yield per ha, 2001–05
Source: FAO Agricultural database; authors’ calculations.
Figure 1.14: Average annual growth of cultivated area, 2001–05
Source: FAO agricultural database; authors’ calculations.
1.48 In a nutshell, Ghana’s most recent accelerated aggregate growth is beginning to be more balanced than in the past, benefiting partly from very recent productivity gains in the agricultural and nonagricultural sectors. As such, its broad-based nature coupled with recent productivity gains suggests that aggregate growth acceleration does not appear to be a fluke or a result of temporary factors. In fact, the analysis below shows that it is quite broad-based in other dimensions of growth performance. Although accounting for only 10 percent of the total crop, cocoa production value and livestock production values contributed to approximately 30 percent of the agricultural growth. Cocoa beans, nuts/oil seeds, and meat have benefited from increased commodity prices, while cereals and starchy roots have experienced price declines. Agricultural
17.4
8.0 7.2 6.5
2.00.6 0.1 0.0
-5.4-10
-5
0
5
10
15
20
Cocoa
beans
Coarse g
rain prim
ary
Fibre c
rops prim
ary
Cerea
ls
Fruit e
xcl m
elons
Roots
and tube
rs
Veg
etab
les+
melon
s
Citrus fr
uit
Oil crop
s prim
ary
Ann
ual p
erce
nt cha
nge
10.1
5.4
2.1 1.70.2 0.0
-1.5 -1.7
-10.1
-15
-10
-5
0
5
10
15
Oil crop
s prim
ary
Cocoa
beans
Roots
and tube
rs
Fruit e
xcl m
elons
Veg
etab
les+
melon
s
Citrus fr
uit
Coarse g
rain prim
ary
Cerea
ls
Fibre c
rops prim
ary
Ann
ual p
erce
nt cha
nge
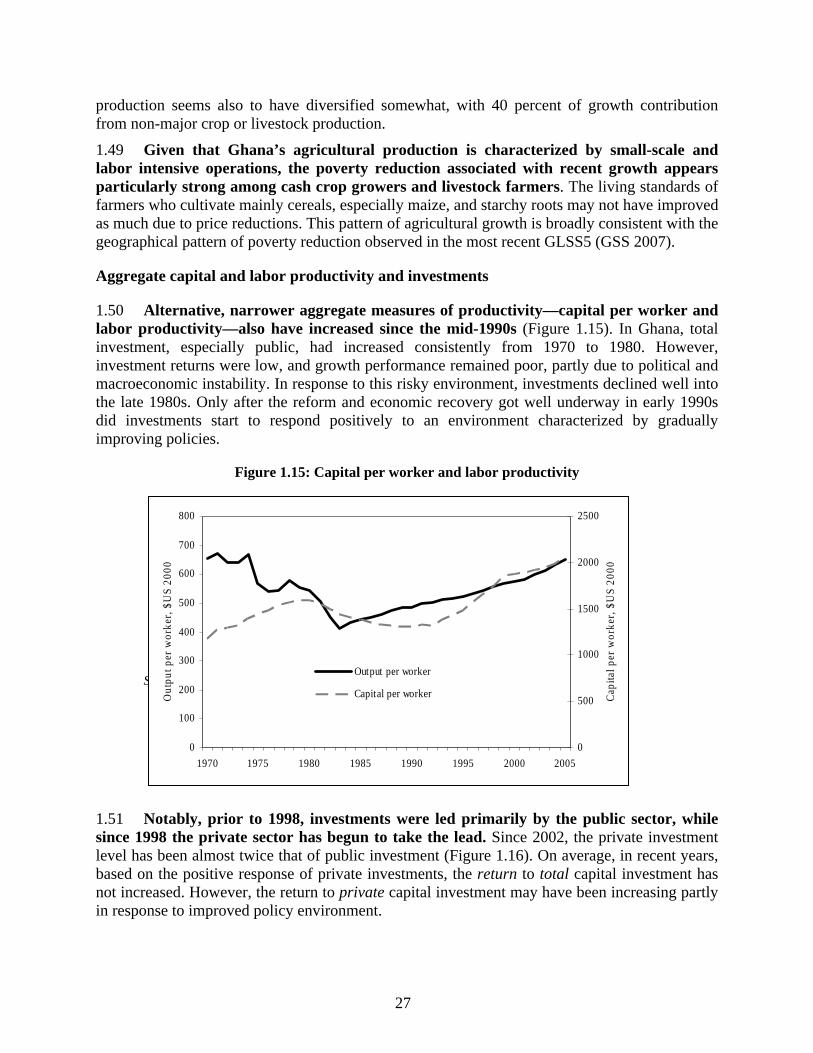
27
production seems also to have diversified somewhat, with 40 percent of growth contribution from non-major crop or livestock production.
1.49 Given that Ghana’s agricultural production is characterized by small-scale and labor intensive operations, the poverty reduction associated with recent growth appears particularly strong among cash crop growers and livestock farmers. The living standards of farmers who cultivate mainly cereals, especially maize, and starchy roots may not have improved as much due to price reductions. This pattern of agricultural growth is broadly consistent with the geographical pattern of poverty reduction observed in the most recent GLSS5 (GSS 2007).
Aggregate capital and labor productivity and investments
1.50 Alternative, narrower aggregate measures of productivity––capital per worker and labor productivity––also have increased since the mid-1990s (Figure 1.15). In Ghana, total investment, especially public, had increased consistently from 1970 to 1980. However, investment returns were low, and growth performance remained poor, partly due to political and macroeconomic instability. In response to this risky environment, investments declined well into the late 1980s. Only after the reform and economic recovery got well underway in early 1990s did investments start to respond positively to an environment characterized by gradually improving policies.
Figure 1.15: Capital per worker and labor productivity
Source: World Bank WDI and authors’ calculations.
1.51 Notably, prior to 1998, investments were led primarily by the public sector, while since 1998 the private sector has begun to take the lead. Since 2002, the private investment level has been almost twice that of public investment (Figure 1.16). On average, in recent years, based on the positive response of private investments, the return to total capital investment has not increased. However, the return to private capital investment may have been increasing partly in response to improved policy environment.
0
100
200
300
400
500
600
700
800
1970 1975 1980 1985 1990 1995 2000 2005
Out
put p
er w
orke
r, $
US
2000
0
500
1000
1500
2000
2500
Cap
ital p
er w
orke
r, $
US
2000
Output per worker
Capital per worker

28
1.52 Ghana’s growth path discussed so far is also broadly consistent with evidence from other developing countries, often showing a changing composition of growth over long hauls, with a heavy reliance on capital and labor in the early stages of development (Fedderke 2005). After reaching a certain level of factor accumulation, an accelerated growth must be sustained on productivity increase stimulated by factors endogenous to development, such as technology advances and an increased proportion of higher-value-added outputs. The preliminary results above indicate that Ghana is not yet in this transformation stage in earnest, although the early years of this millennium suggest that it may be beginning.
Figure 1.16: Ghana - Fixed capital formation by public and private sectors and foreign direct investment
Sources: World Bank WDI; authors’ calculations.
Efficiency of fixed capital accumulation
1.53 A look at the efficiency of fixed capital investments reveals that recent high GDP growth performance is not yet clearly associated with higher marginal returns.13 This is both bad and good news. It is bad news because efficiency of investment is a desirable element to underpin long-term growth. The good part is that it has considerable upside potential. One way to look at the marginal return to fixed capital investment is to estimate the incremental output-capital ratio (IOCR). IOCR is commonly calculated as the ratio of growth rate over investment as a percent of GDP. Thus, IOCR is an inverse of the conventional measure of the incremental capital output ratio (ICOR). The higher IOCR figure suggests greater efficiency of investments or return, translating into higher economic growth. Figure 1.17 shows the historical trend of Ghana’s IOCR, illustrating that the efficiency of the country’s investment can stand considerable improvement.
13 Incremental output-capital ratio (IOCR) represents return to fixed capital investment, while TFP is the portion of GDP growth that cannot be explained by investment and human capital accumulation alone so is associated with technical progress. Although both IOCR and TFP measure productivity, they measure returns to different factors.
0.0
2.0
4.0
6.0
8.0
10.0
12.0
14.0
16.0
18.0
20.0
1985 1990 1995 2000 2005
Percen
t of GDP
Gross fixed capital formation, private
Gross fixed capital formation, public
Foreign direct investment, net inflows

29
Figure 1.17: Ghana - Growth and investment efficiency, 1969–2005
Source: WDI; authors’ calculations.
1.54 How does Ghana’s economic growth and marginal return to fixed capital investment, calculated as IOCR, compare to other relevant comparator countries? A comparison with several well-performing African and Asian countries suggests that Ghana’s growth only now is gradually becoming comparable to some good performers, such as Malaysia, Thailand, and Uganda (Table 1.10). Nonetheless, Ghana’s growth falls far short of the growth achievements of the so-called Asian Tigers when their incomes were closer to Ghana’s. The country’s growth performance in recent years has been even higher than that of Botswana and Mauritius, although over the very long haul, these countries have far outpaced Ghana’s growth. As noted by Ndulu (2007), when it comes to growth, tortoise beats the hare. However, while the overall comparative growth picture for Ghana now looks bright, the return to fixed capital investment (IOCR) is among the lowest when compared with these countries. By the international standard of high-performing Asian and African countries, Ghana’s IOCR is among the lowest.
Table 1.10: Growth, investment and productivity, average 2001-05 (%)
Country name Annual GDP
growth Investment as %
of GDP Productivity
(IOCR) China 9.2 35.5 0.26 Mozambique 8.9 24.9 0.36 Vietnam 7.2 30.9 0.23 Uganda 5.4 20.3 0.27 Malaysia 5.2 23.2 0.23 Ghana 5.2 25.3 0.20 Botswana 5.1 24.6 0.21 Thailand 5.0 24.9 0.20 Mauritius 4.1 22.3 0.18
Sources: WDI; authors’ calculations.
1.55 Noteworthy also is that Ghana’s 2005 growth rate of 5.8 percent is based on its very high investment-to-GDP ratio of approximately 30 percent. Therefore, Ghana has scope to improve its efficiency of investments toward the levels already achieved by, for example, Botswana, Uganda, and Vietnam. To illustrate, if Ghana’s efficiency of investments measured by
-2.50
-2.00
-1.50
-1.00
-0.50
0.00
0.50
1.00
1.50
2.00
1969 1972 1975 1978 1981 1984 1987 1990 1993 1996 1999 2002 2005
IOCR
-15
-10
-5
0
5
10
15
GDP gr
owth
Ghana IOCR
Ghana growth

30
IOCR during 2001–05 had been comparable to Uganda’s, the former already would have averaged 6.8 percent annual growth (rather than 5.2 percent) with the same level of investments. Given the large perceived infrastructure gap in Ghana, the real potential for a sustained high growth performance in the future––comparable to that of Mozambique and Vietnam––must rely on both sustained levels of fixed capital investments and increased returns to these investments.
1.56 Ghana’s trade-off between investment-led growth and efficiency-led growth can be conceptualized using a simple framework that highlights dismal but inevitable choices among different growth strategies. Figure 1.18 plots 4 different iso-growth curves (curves along which growth is kept constant in the investment and IOCR space) for relevant comparators, including Ghana. It shows Mauritius’ growth at 4.1 percent (the lowest), Ghana’s at 5.2 percent, Vietnam at 7.2 percent, and China’s at 9.2 percent (the highest), respectively.
Figure 1.18: Ghana - Iso-growth curves, annual averages, 2001-05 (%)
Source: World Bank WDI database; staff calculations.
1.57 How can Ghana move to a higher growth path? It could attain a higher iso-growth curve. Theoretically, it could pursue either a purely investment-led, or a purely-efficiency, led growth strategy. For example, without efficiency gains, to achieve a 7 percent of GDP growth, Ghana would need to increase investment to 40 percent of GDP. Given domestic and foreign saving levels, this level of investment clearly is unrealistic. Nevertheless, the scenario establishes one boundary for more realistic growth strategy scenarios. On the other extreme, given the current investment level, Ghana could seek to achieve a 7 percent growth by increasing efficiency. In this case, Ghana would need to increase productivity by 25 percent. This is, in fact, achievable although not very common. A few developing countries have accomplished similar efficiency gains over the past 15 years, including Tanzania (29 percent), Comoros, Ethiopia, and Trinidad and Tobago (25 percent).
1.58 The most realistic growth path for Ghana appears to be a mixed investment-cum-efficiency growth strategy. There is nothing particularly unique about such growth paths. They
5
15
25
35
45
55
18%
20%
22%
24%
26%
28%
30%
32%
34%
36%
38%
40%
Incremental Output Capital Ratio (IOCR)
Inve
stm
ent a
s %
of
GD
P
9.2%
7.2%
5.2%
Ghana
BotswanaMauritius
Mozambique
Pure efficiency
led gain
Pure investment
led gain
China
Vietnam
4.1%
Malaysia Uganda

31
also have been traveled by other good performers, with Vietnam on the 7.2 percent growth curve and Mozambique and China on the 9.2 percent curve. A combination of increased return to fixed capital investment (IOCR) and TFP will ensure a sustained growth in the medium- and long-run for Ghana. Moreover, Ghana exhibits room for improvement in areas of policy reform ranging from business environment to skills and education whose lack are impeding investment and/or efficiency-driven growth. We turn next to another dimension of Ghana’s growth––the sectoral supply side––to ascertain which sectors of the economy have contributed most to the past growth performance.
Supply (sectoral) structure of Ghana’s growth
1.59 A first observation on the sectoral structure of Ghana’s growth is that the broad structure of the economy has remained fairly stable over the entire period of 1980–2005.14 The degree of “structural transformation” among the large sectors of the economy has been limited. Ghana has not yet entered the period of rapid structural transformation that characterized some of the most dynamic economies of South and East Asia. However, given this broad general statement, each sector has exhibited a different growth pattern and made a different contribution to GDP.
1.60 Looking at the sectoral pattern of aggregate growth over the long-term period of 1980–2005, services and industry were the most dynamic while agriculture grew less rapidly (Table 1.11). Since 1980, the service sector has maintained an average 6 percent annual growth while the whole economy has grown at only 4.2 percent. However, Ghana’s most recent economic growth has benefited from the agricultural sector, which in the most recent years accelerated its growth rate from 3.9 percent to 5.5 percent.15
1.61 Services contributed the most to growth, accounting for almost 40 percent of GDP growth in 1980–2005; industry and the agricultural sector contributed equally to the remainder. Noteworthy was the most recent episode of growth during 2001–05 when agriculture overtook the service sector, becoming Ghana’s most important growth-contributing sector.
14 Detailed, consistent sectoral data that we had available go back only to 1980. 15 The agricultural sector growth here is slightly different from that in Table 1.5, which presented the results of the agricultural sector growth accounting. The reason is that the data in these two tables are from different data sources. To maintain the internal data consistency within particular series, we did not try to reconcile the minor differences.

32
Table 1.11: Ghana - Sectoral sources of economic growth, 1980–2006 (%)
1980–2005 1991–95 1996–2000 2001–05 2006
Real growth, annual % GDP growth 4.2 4.4 4.2 5.2 6.1 Agriculture 2.7 2.0 3.9 5.5 5.6 Industry 4.6 4.2 4.3 5.3 7.0 Services 6.0 6.8 5.5 5.1 6.3 Indirect tax 3.0 2.4 1.3 4.3 4.4 Real share as % of GDP Agriculture 39 37 36 36 36 Industry 25 25 25 25 25 Services 27 27 29 30 30 Indirect tax 10 11 9 9 9 Contribution to total GDP growth Agriculture 25 17 34 38 33 Industry 27 24 26 25 29 Services 39 42 38 29 31 Indirect tax 7 6 3 8 6 Discrepancy 1 11* 0 0 0
Sources: IMF country data; authors’ calculations. Note: The discrepancy between 1991 and 1995 is due to the change of base price to 1993 prices..
(1) Agriculture
1.62 Further analysis shows that over the long term, within the agricultural sector, it is the large crop and livestock subsectors that have contributed most to the overall sector growth (Table 1.12). This subsector is the backbone of the agricultural sector. The former accounts for close to 70 percent of total agricultural GDP and contributes to approximately 60 percent of its total growth.
1.63 Since the 1970s, significant research efforts have been made to address the low productivity of cereal production in Ghana but with limited success. Some improvements have been made in the varieties of maize, rice, and sorghum, Nonetheless, the physical environment; farmers’ socioeconomic conditions; and the generally poor rural infrastructure, especially poor irrigation infrastructure, have limited the adoption and performance of improved varieties.16 FAO production data show a moderate yield growth for cereal at an average annual increase of 1.75 percent and for starchy roots at 0.75 percent. However, these moderate increases in yields have been overwhelmed by declining prices and, therefore, declining production. Policies must address yields, diversification, and price issues simultaneously to improve the overall productivity of this agricultural subsector.
1.64 Cocoa production/marketing clearly is an emerging sector (Box 1.4). It accounts for approximately 10 percent of agricultural GDP, but contributed close to 30 percent of its growth during the most recent period, 2001–05. This high figure partly reflects the increase in the quantity and quality of cocoa production and higher prices as well as the most recent productivity gains by this key cash export crop.
1.65 Forests/logging is also very important, growing at an average 4 percent, but it had much higher growth rates between 1996 and 2005. It should be noted that the value of export 16 Al-Hassan and Jatoe 2002.

33
crops, including cocoa and forestry, are subject to large growth fluctuations due to international market price shocks. In contrast, crops and livestock maintain a stable growth rate and support the livelihoods of a large part of the rural population.
Table 1.12: Ghana’s agriculture sector - Growth, output shares, and growth contributions, 1980–2006
1980–2005 1991–95 1996–2000 2001–05 2006
Real growth, annual %, agriculture 2.7 2.0 3.9 5.5 5.6 Cultivations other than cocoa and livestock:
2.6 1.5 3.4 4.5 5.8
Production and marketing 4.0 7.0 6.0 14.8 8.3
Forestry and logging 4.3 1.9 10.8 5.1 2.5
Fishing 1.8 1.8 0.6 3.0 3.6
Real share: As % of agricultural GDP Cultivations other than cocoa and livestock:
69 69 68 68 66
Cocoa production and marketing
9 8 9 10 13
Forestry and logging 8 7 9 10 10
Fishing 14 15 14 12 11
Contribution to agricultural GDP growth Cultivations other than cocoa and livestock: 65 51 60 55 69
Cocoa production and marketing 13 28 14 28 19 Forestry and logging 13 7 24 9 4 Fishing 10 14 2 7 7
Sources: Ghana Statistical Service data; authors’ calculations.
1.66 Micro-evidence from GLSS5 corroborates the above aggregate and sectoral analysis. It indicates that poverty has decreased substantially among cocoa producers but that these producers remain vulnerable to changes in world cocoa prices. Given the increase in cocoa prices, yields, and production, we would expect poverty among cocoa farmers to have been reduced substantially over time, indeed, faster than for other population groups. In 1991–92 cocoa producers were poorer than the population as a whole. Wodon and others (2007) find that in 2005–06 only 23.9 percent of cocoa producers were poor, a lower rate than for the population as a whole. Nevertheless, they still remain vulnerable. A decrease of 100 cedis in the producer price of cocoa per kilo could increase poverty among producers by approximately 15 points, which is very large. Thus, while cocoa producers are less poor on average today than the population as a whole, and certainly less poor than the typical rural household, they remain vulnerable to external price shocks.

34
Box 1.4: Factors Explaining the Doubling of Cocoa Production, 2002–04
At least 4 key factors are at the source of the doubling of cocoa production between 2002 and 2004: an increase in the labor supply of producers, government assistance to the sector through a variety of policies and productivity-enhancing measures, increased competition among licensed buying companies (LBCs) in a context of gradual liberalization that started in the mid-1980s, and cross-border movements of Cote d’Ivoire’s exports since the beginning of its civil war. We turn to each of the four explanations below: 1. The increase in labor supply appears clearly in data from the Centre for the Study of African Economies analyzed by Zeitlin (2005). Evidence comes from two surveys in 2002 and 2004, each of approximately 450 cocoa farmers. The survey data suggest an output increase of 34 percent, which is lower than the doubling of production. The total number of working days spent by households on cocoa-related activities per year doubled from 328 to 640. This expansion of labor came from extra time devoted to cocoa rather than from an increase in the number of persons working on the crop. In fact, household size among producers decreased over the same period. 2. Productivity-enhancing measures played an important role. The use of fertilizers increased dramatically, from 0.5 kg to 5.1 kg per household in the data gathered by Zeitlin (2005). Brooks and others (2007) suggest that free mass spraying of insecticides on cocoa crops reduced the incidence of pests and diseases. The planting of new tree varieties, especially in the context of old-farm rehabilitation also boosted output. Efforts put on transportation infrastructure in cocoa-growing areas reduced shipping costs (USDA 2005, ISSER 2005). Information campaigns on higher-productivity and faster-maturing tree varieties also accounted for some gains (Edwin and Masters 2005). 3. Competition among LBCs is considered another key determinant of the gains in production. Established in 1947, the Cocoa Marketing Board (CMB) monopolized the internal and external marketing of the cocoa production. In 1979, the CMB was renamed the “Ghana Cocoa Board” or Cocobod, and the government extended its control over the purchase of inputs, internal prices, quality standards, and exports. With the gradual liberalization of the sector since the mid-1980s, LBCs have been allowed to purchase domestically and export directly, buying and selling at prices fixed by the Ghana Cocoa Board. Zeitlin (2005) argues that “in spite of the fixed purchasing price, competition for producers’ output by LBCs remains an important institutional feature–– indeed, a driver of growth in the cocoa sector.” Varangis and Schreiber (2001) highlight the stimulating effect of competition on producers’ efficiency as well as the positive impact it induces on profits. Likewise, Tiffin and others (2004) tell the success story of the Kuapa Kokoo Ltd. (“Good Cocoa Farmers” in Twi, the local language). The company involves more than 2,000 farmers from 22 villages in volunteering and organizing the seasonal delivery of 100 tons of cocoa beans per village. 4. Cocoa smuggled from Côte d’Ivoire due to the civil war there also increased production and exports. Brooks and others (2007) estimate this inflow at 120,000–150,000 tons in 2004, which is indeed very high. This tonnage represented half of Ghana’s increase in production during that period. To explain the low levels of output prior to cocoa production’s doubling, Bulir (2002) raised the question of whether prices gave incentives to smugglers. Source: Wodon and others 2007.
(2) Industry
1.67 Within industry, for the entire period 1980–2005, the main sources of dynamism were energy and construction. These were fueled in part by rising incomes, remittances, and the emerging mortgage lending by the financial sector (Table 1.13). Between 1980 and 1995,

35
there was a rapid expansion of gas, electricity, and water output as part of the extension of basic utility services from the very low base of 35 years ago. This expansion slowed significantly after 1995, with the exception of 2006.
1.68 Manufacturing largely kept pace with the overall industrial growth, although the former had a significant setback between 1991 and 1995. During the entire 15-year period, manufacturing and construction contributed close to 70 percent of industry sector growth. Mining and quarrying contributed on average approximately one-fourth of growth. Noteworthy is that growth in the mining and quarrying sector fluctuated significantly from 4 percent to 9 percent. This sector made significant contributions only during 1991–95 and in 2006.
1.69 However, microeconomic evidence suggests that Ghanaian firms lag behind the most productive African firms, indicating scope for improvements. Teal and others (2006) used microeconomic, firm-level data to compare manufacturing firm performance in Ghana with that in other countries in which the Regional Program for Enterprise Development (RPED) and other similar surveys were carried out in the mid-late 1990s. Based on this calculation, rough values for value-added per worker in these countries can be calculated. Productivity for the median manufacturing firm in Ghana was approximately one-tenth of the productivity for the median firm in South Africa. Firms in Ghana compared more favorably with productivity in the other countries. In particular, the median Ghanaian firm was slightly more productive than the median Tanzanian firm, approximately half as productive as the median Kenyan firm, and approximately one-third as productive as the median Nigerian firm (see also Clarke 2007).
Table 1.13: Ghana’s industry - Growth, output shares and contributions to growth, 1980–2006 (%)
1980–2005 1991–1995 1996–2000 2001–2005 2006
Real Growth, annual %, Industry 4.6 4.2 4.3 5.3 7.0
Mining and quarrying 5.2 6.9 4.0 4.4 3.0
Manufacturing 3.9 2.0 4.7 4.6 4.1
Electricity and Water 7.0 7.4 1.9 5.5 20.7
Construction 5.2 6.0 4.9 6.6 7.9
Real share: As % of Industrial GDP
Mining and quarrying 21 22 22 21 20
Manufacturing 38 38 36 36 35
Electricity and Water 9 10 10 10 12
Construction 30 30 31 33 34
Contribution to Industrial GDP Growth Mining and quarrying 24 36 21 17 8
Manufacturing 32 18 40 32 20
Electricity and Water 14 18 5 11 36
Construction 34 42 35 40 38 Source: Ghana Statistic Service data and authors’ calculations. Note: * = The discrepancy during 1991 and 1995 is due to the change of base price to 1993 prices.
(3) Services
1.70 In the service sector, the most dynamic sectors in the whole period 1980-2005 are “Wholesale, retail trade, restaurants and hotels” and “Transport, storage and
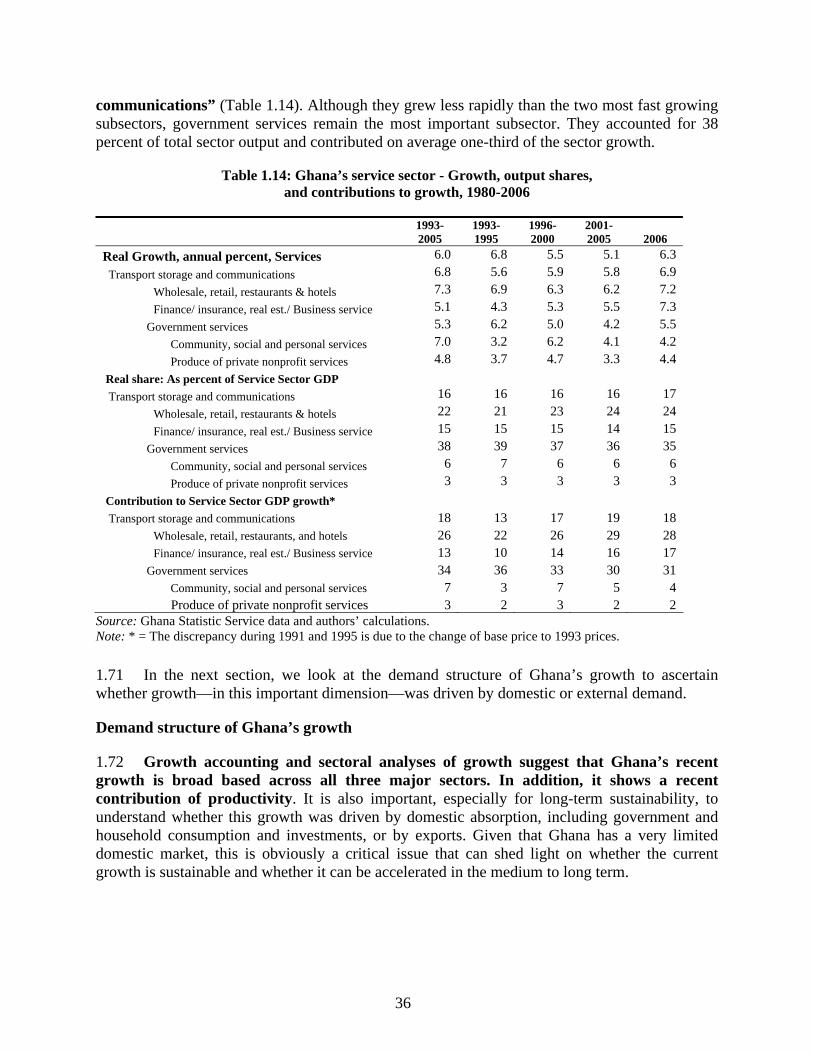
36
communications” (Table 1.14). Although they grew less rapidly than the two most fast growing subsectors, government services remain the most important subsector. They accounted for 38 percent of total sector output and contributed on average one-third of the sector growth.
Table 1.14: Ghana’s service sector - Growth, output shares, and contributions to growth, 1980-2006
1993-2005
1993-1995
1996-2000
2001-2005 2006
Real Growth, annual percent, Services 6.0 6.8 5.5 5.1 6.3
Transport storage and communications 6.8 5.6 5.9 5.8 6.9
Wholesale, retail, restaurants & hotels 7.3 6.9 6.3 6.2 7.2
Finance/ insurance, real est./ Business service 5.1 4.3 5.3 5.5 7.3
Government services 5.3 6.2 5.0 4.2 5.5
Community, social and personal services 7.0 3.2 6.2 4.1 4.2
Produce of private nonprofit services 4.8 3.7 4.7 3.3 4.4
Real share: As percent of Service Sector GDP Transport storage and communications 16 16 16 16 17
Wholesale, retail, restaurants & hotels 22 21 23 24 24
Finance/ insurance, real est./ Business service 15 15 15 14 15
Government services 38 39 37 36 35
Community, social and personal services 6 7 6 6 6
Produce of private nonprofit services 3 3 3 3 3
Contribution to Service Sector GDP growth* Transport storage and communications 18 13 17 19 18
Wholesale, retail, restaurants, and hotels 26 22 26 29 28 Finance/ insurance, real est./ Business service 13 10 14 16 17
Government services 34 36 33 30 31 Community, social and personal services 7 3 7 5 4 Produce of private nonprofit services 3 2 3 2 2
Source: Ghana Statistic Service data and authors’ calculations. Note: * = The discrepancy during 1991 and 1995 is due to the change of base price to 1993 prices.
1.71 In the next section, we look at the demand structure of Ghana’s growth to ascertain whether growth––in this important dimension––was driven by domestic or external demand.
Demand structure of Ghana’s growth
1.72 Growth accounting and sectoral analyses of growth suggest that Ghana’s recent growth is broad based across all three major sectors. In addition, it shows a recent contribution of productivity. It is also important, especially for long-term sustainability, to understand whether this growth was driven by domestic absorption, including government and household consumption and investments, or by exports. Given that Ghana has a very limited domestic market, this is obviously a critical issue that can shed light on whether the current growth is sustainable and whether it can be accelerated in the medium to long term.

37
Ghana
4.0%4.2%
5.2%
2.7%
-40%
-20%
0%
20%
40%
60%
80%
100%
120%
140%
1970-2005
1991-1995
1996-2000
2001-2005
0.0%
1.0%
2.0%
3.0%
4.0%
5.0%
6.0%
Exports
Gross investment
Governmentexpenditure
Householdconsumption
Imports
GDP growth - Raxis
Mauritius
5.3%
4.9%
5.4%
3.6%
-100%
-50%
0%
50%
100%
150%
200%
1970-2005
1991-1995
1996-2000
2001-2005
0.0%
1.0%
2.0%
3.0%
4.0%
5.0%
6.0%
1.73 On the demand side, Ghana’s growth in the entire 1970–2005 period17 was dominated by domestic absorption (consumption and investment). However, exports began to play an important role in the 1990s. Between 1991 and 1996, Ghana was able to take advantage of favorable terms of trade (TOT), and exports contributed close to 30 percent of GDP growth, the highest contribution since 1970 (Figure 1.19). However, in the most recent years, the exceptional growth performance was dominated by government consumption and investments.
1.74 In comparison, Mauritius’ long-term growth has been driven primarily by exports. They accounted for nearly 80 percent of GDP growth between 1975 and 2005. Mauritius and Ghana had very similar aggregate growth experiences at above 5 percent in the 1990s and 2000s, respectively. However, while exports contributed to almost 50 percent of Mauritius’ 5 percent growth, they contributed to only 6 percent of Ghana’s 5 percent GDP growth. This stark difference also reflects the different growth strategies pursued by the two countries.
Figure 1.19: Ghana and Mauritius - Contribution to GDP growth by aggregated expenditure category18
Sources: World Bank WDI and authors’ calculations.
1.75 What is remarkable about Ghana’s demand side of growth during 1970–2005 is that, compared with other rapidly growing economies, Ghana’s export contribution to total GDP growth has been the lowest (Table 1.15). Specifically, Ghana’s export contribution to overall growth is only 12 percent. In contrast, rapidly growing comparator countries all have recorded export contributions of approximately 40 percent (Botswana, Mozambique) or much
17 The period of demand-side analysis dictated by the available data is 1970–2005. 18 “Gross Capital Formation” consists of outlays on additions to the fixed assets of the economy plus net changes in the level of inventories. This variable differs from “Gross Fixed Capital Formation,” which we used in the TFP calculation. In principle, “Gross Capital Formation” and “Gross Fixed Capital Formation” should be very close. However, in Ghana’s case, from 1993 until the most recent year, the “Gross Capital Formation” in constant prices is only about half of the “Gross Fixed Capital Formation” (used to calculate TFP). It is for this reason that the contribution to the GDP growth by the “Gross Capital Formation” is so much lower than the “Gross Fixed Capital Formation” in the TFP calculation. We did not try to reconcile these two series; reconciling them would cause major inconsistencies in total GDP. This inconsistency, however, should not affect the conclusion that Ghana’s growth is mainly domestic absorption led rather than export led.

38
more (Malaysia, Mauritius). For the most recent 5-year period, 2001–05, Ghana’s export contribution to total GDP growth was only 6 percent, while government spending and investment accounted for 40 percent of growth. The remainder was due to private consumption.
Table 1.15: GDP growth and decomposition of the demand-side contributions, 1970-2004 (%)
Medium to long term* Ghana Botswana Mauritius Mozambique Malaysia
GDP growth 2.7 8.6 5.3 4.5 6.5 Contribution by demand equation Government final consumption 30 36 11 8 13 Household final consumption 65 26 59 45 44 Gross capital formation 3 26 31 40 40 Exports of goods and services 12 41 79 37 131 Imports of goods and services -11 -29 -80 -29 -127
Short term: 2001-2005 Ghana Botswana Mauritius Mozambique Malaysia
GDP growth 5.2 5.1 3.6 7.5 5.5 Contribution by demand equation Government final consumption 20 42 16 10 24 Household final consumption 73 19 20 78 59 Gross capital formation 11 67 50 25 23 Exports of goods and services 7 -23 61 63 162 Imports of goods and services -11 -5 -48 -75 -168
Source: WDI and authors’ calculations. Note: * = The medium- to long-term growth in Ghana occurred from 1970 to 2005, in Botswana from 1975 to 2005, in Mauritius and Mozambique from 1980 to 2005, and in Malaysia from 1970-2004. Malaysia’s short-term growth took place from 2001 to 2004. All others are as indicated.
External price shocks and growth
1.76 Ghana is a small, open economy with exports accounting for approximately 40 percent of GDP in recent years. Yet, despite policy pronouncements and some overall diversification, Ghana’s exports by commodity have not diversified significantly since the 1970s. Cocoa, gold, and timber combined still account for the largest share (70 percent) of total commodity exports. As a result, Ghana’s economy remains vulnerable to commodity price shocks. Ghana’s overall real GDP growth and export price change (one-year lag) appear to move quite closely together over the long term (Figure 1.20).

39
Figure 1.20: Ghana - GDP growth and annual % change of export price (1 year lag), 1985-2005
Source: WDI and authors’ calculations. Note: We use the 3-year average to smooth the volatility of the variables of export growth and TOT. However, by using the 3-year average, we lose the 2005 observation, which we replaced by the 3-year average of the 2004 figure (2003+2004+2005).
1.77 However, further analysis shows that, in the long run, the correlation between export price changes and GDP growth in Ghana is rather weak (1985 to 2005, Table 1.16). Nevertheless, large negative price shocks can have profound effects. For example, between 1998 and 2000, cocoa prices dropped by almost 50 percent, and although remaining positive, real GDP growth decelerated by 20 percent. Because such price drops are rare, they make headlines and lasting impressions. Even more significantly, they underline the fundamental vulnerability of economies such as Ghana’s. In contrast, between 2001 and 2005, prices for cocoa, timber, and gold rose more than they had dropped in the previous five years. Nevertheless, these price increases correlated only moderately with real GDP growth.
Table 1.16: Ghana - Co-movement between GDP growth and changes in external prices, 1985-2005
GDP Correlation with Annual Average Growth
Export price,
1-year lag Terms of Trade,
1-year lag GDP
growth Export price
Terms of Trade
1985-1990 0.20 0.44 4.7 15.7 -0.4 1991-2005 0.48 0.00 4.3 1.4 0.5 1991-1995 0.40 -0.23 4.0 2.0 0.6 1996-2000 0.79 0.89 4.2 -3.6 -1.9 2001-2005 0.47 -0.09 5.2 5.4 -2.8 1985-2005 0.28 0.01 4.3 0.8 -0.7
Source: WDI and authors’ calculations.
-40
-20
0
20
40
60
80
100
1985 1990 1995 2000 2005
Ann
ual c
hang
e in
exp
ort p
rice
, (1
year
lag,
%)
0
1
2
3
4
5
6
7
Ann
ual G
DP
grow
th, %
Export price
GDP growth

40
1.78 Reflecting the relative price between export and import prices, terms of trade (TOT) does not seem to affect Ghana’s GDP growth in a strong, systematic way. Since the mid-1990s, Ghana’s terms of trade has recovered from a sharp decline in the late 1980s (Figure 1.21).19 The income effect of the TOT changes is determined both by them and by the changes in the quantities of exports relative to those of imports. An increase in TOT may not always be associated with positive income effect if the gains from the additional export income as a result of the higher prices do not cover the cost of additional imports. This seems to be exactly Ghana’s case. Although Ghana has experienced relatively favorable TOT in recent years, the gains from TOT increase have been largely offset in the last three years by a rapid increase in resource deficit equivalent to more than 20 percent of GDP. The income effect of TOT has been volatile, corresponding little with GDP growth (Figure 1.22).
Figure 1.21: Ghana’s terms of trade and current account balance
Source: IMF WEO database.
1.79 In sum, since 1985 and, especially during recent years of macroeconomic stability, Ghana’s economy seems to have gradually grown more resilient to be able cushion price shocks even though its reliance on a small number of export commodities keeps it vulnerable to the shocks. Large, negative price shocks could cause downturns, whereas positive price changes affected the economy much more mildly, probably reflecting structural and supply constraints.
19 TOT is defined as export price index divided by import price index.
0
50
100
150
200
250
300
350
1980
1982
1984
1986
1988
1990
1992
1994
1996
1998
2000
2002
2004
2006
Ter
ms
of T
rade
Ind
ex
-30
-25
-20
-15
-10
-5
0
5
Cur
rent
acc
ount
bal
ance
as
% o
f G
DP
Resource Balance
Terms of Trade Index

41
Figure 1.22: Ghana - Income effect of TOT and GDP growth per diem, 1981–2006
Sources: IMF WEO database.
Box 1.5: Africa’s Success Stories - Mauritius and Botswana
Africa’s two success stories––Mauritius and Botswana––may hold important policy lessons. Both countries successfully overcame initial development disadvantages; both pursued sound macroeconomic policies over a long period; and both have maintained sustained economic growth for several decades. As a result, both have dramatically raised their per capita income and achieved middle income status. Despite the important differences detailed below, the underlying lessons seem to be that for sustained, long- term growth, the strength of economic policies, especially fiscal soundness, transparency, and export orientation, matter. Mauritius had a head start in human development with relatively higher life expectancy and educational attainment than many African countries. From a monoculture, sugar-based economy, in the 1970s Mauritius changed strategies toward a private-sector-led, diversified export-oriented economy. It managed to maintain an average annual growth of 4.5 percent for 4 full decades. Key to Mauritius’ success was a combination of export-promotion policies; channeling rents from preferential sugar export agreements with Europe to finance domestic private sector investment in export diversification, and export-oriented foreign direct investment (FDI), including from Hong Kong and China. Mauritius exploited global opportunities for growth by emphasizing political, social, and economic institutions for better functioning of the markets and policies aimed at manufactured-export-led growth. Since the mid-1980s, Mauritius’ openness ratio has increased from 70 percent to 100 percent. Preferential access implicitly subsidized export growth. Botswana has been the fastest growing African economy over the past several decades, and among the fastest growing globally. It is landlocked and natural resource dependent, and was never a settler colony. Hence, it is not a recipient of institutions that evolved where colonists settled. Its success story appears related to four major factors: (i) the strength of its state capacity; (ii) being part of Southern Africa’s relatively effective infrastructure system; (iii) belonging to the Southern African customs union and the monetary area, which served as a commitment instrument against rent-seeking; and (iv) most important, its self-disciplinary rule called the Sustainable Budget Index (SBI) for the use of mineral rents and managing reserves, combined with stringent public scrutiny of government’s expenditure and investment program. Source: Ndulu and others 2006.
-15
-10
-5
0
5
10
1981 1986 1991 1996 2001 2006
Inco
me
effe
ct o
f T
OT
and
GD
P g
row
th GDP growth %
Income effect of TO T, % of GDP

42
Trends in employment and earnings
1.80 The impressive poverty reduction enjoyed by Ghana during the last 15 years has also been associated with relatively good, overall labor market outcomes. Table 1.17 presents a series of basic employment indicators covering the period from 1991 to 2006 based on the three GLSS surveys. The figures are broken down by region, sex and quintile, and provided in percentage terms. In absolute terms, the data suggest that there has been rapid employment creation, with 2.8 million jobs created between 1991 and 2006 among the population aged 24-64. These gains are concentrated in agriculture (1.24 million), with close to one million new jobs in services (including Government), and more than half a million in industry.
1.81 Due in part to the fact that youth are remaining longer in school, the employment rate for the country as a whole has been declining from 75.9 percent to 70.5 percent. However, this overall decline hides different outcomes in urban and rural areas. While urban areas (particularly Accra) have experienced a small increase in employment rate, rural areas have seen a large decline from 83.6 to only 76.8 percent. A multivariate, microanalysis suggests that outcomes in the labor markets (better jobs, and better returns to jobs) were more important in urban than in rural areas in contributing to the increase in the consumption levels of households, and thereby to the decrease in poverty.
1.82 Unemployment overall does not seem to be a major problem,20 but Coulombe and Wodon (2007) found that unemployment was concentrated in the younger segment of the population (15–24 years) and in urban areas (Chapter 1 of Volume III of this CEM). Even if no recent study on labor force market in Ghana had been published, it is likely that the high economic growth and a fairly flexible labor market (Beaudry and Sowa 1994; Canagarajah and others 1998) has kept unemployment rate under control. However, Accra is having a more worrying unemployment problem. Close to 10 percent of the active population is available for work (broad unemployment), even if only about half percent of them is actively looking for a job. Underemployment seems also rather low and declining. In 2005–06, less than 6 percent of workers were looking for more work, mainly in rural areas.
1.83 Finally, there was a shift of employment from the public to the private sector. In the last 15 years, the percentage of public workers has declined continuously from nearly 12.9 percent in 1991–92 to 8.4 percent in the late 1990s to 8.0 percent in 2005–06. This relative decline in public employment has been compensated by an increase in the private sector, both formal and informal. The percentage of individuals working in the private sector as wage employees went up from 7.9 percent in 1991–92 to 15.8 percent in 2005–06. Following the increase of wage employees in the private formal sector, this sector now has a significant mass in Accra at more than 26 percent of the working population. Nevertheless, for the country as a whole, the overwhelming majority of the working population is still occupied in the informal sector. Although the formal sector represents more than 40 percent of the working population in Accra, it represents only 7.4 percent of the workers in rural areas, and even less if unpaid workers are taken into account.
20 We use two definitions of unemployment. Broad unemployment takes into account all nonworking individuals available for work, while the narrow definition is limited to those who are also actively looking for a job.

43
Tab
le 1
.17:
Em
ploy
men
t, un
empl
oym
ent,
and
unde
rem
ploy
men
t rat
es (%
), 19
91 to
200
6
Em
ploy
men
t (p
aid
or n
ot)
Em
ploy
men
t (p
aid
only
) U
nem
ploy
men
t (n
arro
w)
Une
mpl
oym
ent
(bro
ad)
Und
erem
ploy
men
t
91/9
2 98
/99
05/0
6 91
/92
98/9
9 05
/06
91/9
2 98
/99
05/0
6 91
/92
98/9
9 05
/06
91/9
2 98
/99
05/0
6 G
hana
75
.9
…
70.5
53
.5
52.5
51
.5
2.7
1.9
2.3
4.1
5.7
5.0
7.9
…
5.7
Sex
M
ale
76.2
…
71
.5
59.7
56
.1
57.1
2.
7 2.
3 2.
4 3.
8 5.
2 4.
6 8.
5 …
5.
8
Fem
ale
75.6
…
69
.6
48.3
49
.3
46.5
2.
6 1.
5 2.
3 4.
3 6.
1 5.
3 7.
3 …
5.
7 L
ocal
ity
M
ale
54.9
…
61
.4
53.3
53
.4
59.7
8.
9 6.
8 5.
5 11
.0
13.6
9.
7 6.
1 …
1.
8 Fe
mal
e 59
.3
…
53.4
54
.5
52.3
50
.2
5.0
3.1
4.2
8.1
12.3
8.
2 5.
7 …
2.
3
Acc
ra
All
57.4
…
57
.3
54.0
52
.8
54.8
6.
7 4.
9 4.
8 9.
4 12
.9
8.9
5.9
…
2.1
M
ale
63.3
…
66
.3
54.2
52
.6
57.8
5.
1 3.
3 3.
6 5.
8 6.
3 5.
3 5.
7 …
5.
3 Fe
mal
e 64
.4
…
62.1
53
.1
49.9
50
.5
6.2
2.5
3.7
7.8
6.6
7.1
6.9
…
4.7
Oth
er
Urb
an
All
63.9
…
64
.0
53.6
51
.1
53.8
5.
7 2.
9 3.
6 6.
9 6.
5 6.
3 6.
3 …
5.
0
Mal
e 84
.4
…
76.5
62
.8
57.9
56
.2
0.9
1.0
1.0
1.9
3.1
3.0
10
…
6.9
Fem
ale
82.8
…
77
.1
45.4
48
.5
43.7
0.
7 0.
8 1.
1 2.
3 4.
6 3.
8 7.
7 …
7.
0
Rur
al
All
83.6
…
76
.8
53.4
52
.9
49.5
0.
8 0.
9 1.
1 2.
1 3.
9 3.
4 8.
8 …
7.
0 Q
uint
ile
L
owes
t 81
.0
…
70.3
44
.5
40.6
35
.0
1.0
0.8
1.8
2.6
4.8
6.6
6.9
…
5.6
S
econ
d 77
.3
…
71.9
49
.3
50.9
47
.0
1.1
0.2
1.9
2.5
3.8
4.2
7.9
…
5.4
T
hird
75
.6
…
69.5
51
.8
50.9
51
.1
3.1
1.6
2.4
4.2
4.7
4.3
8.4
…
6.0
F
ourt
h 73
.5
…
70.3
55
.0
55.1
57
.6
3.2
3.1
2.3
4.9
6.1
4.2
8.4
…
6.5
H
ighe
st
73.3
…
70
.6
63.7
60
.5
62.1
4.
3 2.
9 2.
9 5.
7 7.
9 5.
6 7.
6 …
5.
1 P
over
ty S
tatu
s
Ver
y po
or
79.4
…
70
.7
46.7
43
.6
33.9
1.
1 0.
6 1.
7 2.
7 4.
9 6.
7 7.
5 …
5.
8
Poo
r 76
.4
…
71.4
51
.2
49.7
45
.3
2.3
0.5
2.5
3.2
3.3
5.5
8.2
…
5.4
N
on p
oor
73.5
…
70
.3
58.5
56
.3
56.0
3.
8 2.
6 2.
4 5.
2 6.
4 4.
6 8.
0 …
5.
7 So
urce
: C
oulo
mbe
and
Wod
on (
2007
).

44
Tab
le 1
.18:
Sha
res
of e
mpl
oym
ent b
y ty
pe o
f em
ploy
men
t and
geo
grap
hic
loca
tion
(%),
1991
to 2
006
Acc
ra
Oth
er U
rban
R
ural
G
hana
1991
/92
1998
/99
2005
/06
1991
/92
1998
/99
2005
/06
1991
/92
1998
/99
2005
/06
1991
/92
1998
/99
2005
/06
Stat
us in
Em
ploy
men
t
Wag
e Pu
blic
25
.5
14.6
15
.1
21.1
14
.1
13.3
7.
6 5.
0 3.
5 12
.9
8.4
8.0
W
age
Priv
ate
Form
al
16.7
14
.2
26.3
6.
7 7.
1 11
.2
2.5
3.0
3.9
4.9
5.4
9.2
W
age
Priv
ate
Info
rmal
6.
7 8.
9 12
.8
4.7
2.4
8.3
1.8
2.5
4.1
3.0
3.3
6.6
S
elf-
empl
oym
ent A
gric
ultu
re
0.2
2.6
0.5
14.8
20
.2
15.1
63
.5
61.0
62
.5
44.5
44
.0
39.6
Sel
f-em
ploy
men
t Non
Agr
. 51
.0
59.7
45
.3
52.8
56
.2
52.1
24
.7
28.5
25
.9
34.6
39
.0
36.5
All
100.
0 10
0.0
100.
0 10
0.0
100.
0 10
0.0
100.
0 10
0.0
100.
0 10
0.0
100.
0 10
0.0
Sour
ce:
Cou
lom
be a
nd W
odon
(20
07).

45
1.84 On the earnings side, analyzing earnings in an economy with a large rural and informal sector is a daunting task, and few clear cut conclusions can be made. Regarding wage employment, earning is easily defined as the salary received in cash plus the value of any other payment in kind. Other types of earnings are more difficult to capture and measure reliably. For Ghana as a whole, in 2005–06 the average annual earning in real terms was 8.96 million cedis per worker. This was an important increase from 5.36 million in 1991–92 and 5.82 million in the late 1990s.
1.85 Fortunately, the increase in earnings since 1998–99 has benefited all quintiles. However, the gender gap in earning remains important. The earnings increase was much larger for males (from 5.8 to 10.6 million cedis) than for females (from 4.9 to 7.2 million cedis). In 2005–06, on average, public sector wage earners were still enjoying the best salaries, followed by workers from the private formal sector and the self-employed in nonagricultural sectors. Self-employed farmers were still at the bottom of the earnings scale.
1.86 Looking at the large sectors of the economy, the highest earnings were registered in the financial sector, followed closely by utilities and mining. Next were transport and communication, community and other services, construction, trading and manufacturing with on average earnings about twice those in agriculture. Earnings were by far the lowest in agriculture (5.4 million cedis).

46
Table 1.19: Average Annual Earnings (in ‘000’ cedis, Accra January 2006 prices) and Weekly Hours Worked, 1991/2006
Earnings Hours Worked 1991/92 1998/99 2005/06 1991/92 1998/99 2005/06
Ghana 5,358 5,818 8,961 37.3 40.6 42.5 Sex Male 5,772 7,016 10,608 39.8 43.2 44.1 Female 4,926 4,635 7,173 34.8 38.0 40.8 Locality
Male 11,018 14,318 14,783 44.5 55.1 54.1 Female 8,310 9,880 8,989 42.4 57.6 52.0
Accra
All 9,488 12,055 12,072 43.3 56.4 53.1 Male 8,408 8,687 14,651 47.4 48.5 47.6 Female 6,732 6,321 9,811 41.2 42.4 42.2
Other Urban
All 7,506 7,395 12,199 44.1 45.2 44.9 Male 4,207 5,047 7,544 36.5 39.2 39.7 Female 3,418 2,817 5,204 30.2 32.0 37.0
Rural
All 3,846 3,963 6,449 33.6 35.7 38.4 Quintile Lowest 2,578 2,586 4,914 33.6 34.8 44.2 Second 3,884 3,633 6,089 34.9 34.5 38.4 Third 4,985 4,655 7,191 36.4 38.4 39.8 Fourth 5,278 5,755 8,988 37.4 41.8 43.1 Highest 8,042 9,277 13,454 41.4 47.2 45.4 Poverty Status Very poor 3,249 2,794 4,829 34.0 34.3 44.8 Poor 4,173 4,118 5,625 36.2 35.2 38.3 Non poor 6,714 6,968 9,838 39.3 43.3 42.6 Status in employment Wage Public 8,975 11,574 17,691 40.5 43.2 43.0 Wage Private Formal 7,664 9,515 12,530 48.2 52.4 52.0 Wage Private Informal 5,280 4,997 7,716 44.5 52.2 47.7 Self-employment Agriculture 2,696 2,730 5,187 31.8 33.9 36.3 Self-employment Non Agr. 7,112 7,159 10,336 41.1 43.9 45.5 Industry Agriculture 2,870 2,850 5,371 32.3 34.4 36.4 Mining/Quarrying 12,088 16,310 18,604 47.5 59.6 51.5 Manufacturing 6,478 6,177 9,711 38.1 40.1 42.8 Utilities 7,806 10,138 20,370 46.1 46.1 48.4 Construction 6,743 7,335 11,830 45.2 37.6 41.9 Trading 6,872 7,401 10,202 42.4 46.2 48.0 Transport/Communication 9,505 14,914 13,733 56.0 60.1 63.3 Financial Services 14,147 17,409 21,434 44.4 49.6 48.7 Community & Other Services 8,728 7,946 13,217 39.8 45.0 43.5 Source: Coulombe and Wodon (200Authors using GLSS data.
Ghana’s growth from a household perspective
1.87 Data from household surveys also can be used to analyze key contributing factors to growth, albeit from a household or microeconomic perspective. This analysis can be done by estimating regressions for the determinants of the consumption level of households, and

47
analyzing the contribution of changes in household characteristics as well as changes in the returns to these characteristics to the increase in household consumption over time. This exercise has been conducted by Coulombe and Wodon (2007). First, for the determinants of consumption levels at any point in time, the authors find that demographic characteristics have a large impact on expected consumption. An additional person in the household reduces consumption per equivalent adult by 13 percent to 17 percent (the impact is lower for elderly individuals). Consumption levels increase with education, but the effects become statistically significant only as of secondary schooling (similar results are obtained using wage regressions). After controlling for other variables, employment variables do not appear to have large and systematic impacts on consumption. Households who have not migrated tend to be slightly better off than households who have migrated (this does not mean that there are no gains for the households who did migrate).
Table 1.20: Contributions of key factors to growth in household consumption, 1991-2006 (%)
1991 to 1999 1999 to 2006 1991 to 2006
Change in Returns
Change in Characteristics
Change in Returns
Change in Characteristics
Change in Returns
Change in Characteristics
Urban Geography/overall 5.6 4.7 8.8 0.5 20.5 -1.0 Demographic -3.5 4.7 6.6 2.6 2.5 7.9 Education -1.6 3.9 1.7 2.9 -0.9 7.8 Employment 9.5 0.9 2.8 -1.3 12.2 -0.3 Others -2.4 -0.4 -0.3 0.4 -3.1 0.4 Total 7.6 13.7 19.6 5.2 31.3 14.8 21.3 24.8 46.1 Rural Geography/overall -2.0 1.3 40.7 -1.0 38.8 0.2 Demographic 1.3 2.5 2.1 -1.0 2.8 2.0 Education 4.1 3.9 -2.8 -1.9 2.0 1.4 Employment 10.5 1.7 -19.6 -1.0 -8.1 -0.3 Others -1.1 0.0 -0.4 0.4 -1.1 0.0 Total 12.8 9.4 20.0 -4.5 34.4 3.3
22.2 15.5 37.8 Source: Coulombe and Wodon 2007.
1.88 Changes in mean consumption over time resulted in substantial differences between urban and rural areas (Table 1.20). In urban areas, the improvement in general economic conditions accounted for approximately half of the total gains in consumption. In rural areas, basically all of the gains were due to the improvement in general economic conditions. The fact that urban areas also had gains associated with improvements in household characteristics (smaller household size and better education) and the returns to these characteristics (better returns to employment) helps explain why we observe a substantial difference in the total gains in urban as opposed to rural areas. Between 1991–92 and 2005–06, the increase in the average consumption of urban households was 46.1 percent. In rural areas, the increase was approximately 8 percentage points lower, at 37.8 percent. (For more on youth employment in two sectors, see Box 1.6). One key message from this analysis is that, in rural areas, more efforts

48
should be focused on helping households move faster through the education and demographic transitions.
Box 1.6: Ghana’s Urbanization, Youth, Education, and Poverty Reduction
Recent evidence for 1998–2006 based on GLSS5 indicates that poverty continues to decline in all localities, although progress has been slower in Accra. Similarly, earnings have been rising very fast outside Accra, whereas the earnings trend in Accra has been rather flat. Although earnings in Accra remain higher than in other urban areas and all rural areas, it is likely that pressure from migrants has restrained earnings. At the national level, the urbanization of the economy and the move toward higher-productivity sectors have increased wage employment and decreased non-farm self-employment, at least in the less efficient segments such as petty trade. The younger population, aged 15–24, has been responding rapidly to these changes by staying in (and even returning to) school, particularly in the rural sector. In urban areas, due to higher school enrollment rates, the youth employment rate has remained relatively low and stable at around 28 percent. In contrast, since 1998, rural areas have experienced a sharp decline in youth employment from around 72 percent to only 50 percent. In the absence of massive unemployment, it is likely that rural youth are remaining on school benches longer, or perhaps choosing to return to school, to acquire the basic skills necessary for a higher-productivity economy. Although rural areas are still experiencing lower school attendance rate than urban areas, the gross enrolment rate in primary schools is slowly catching up to the rising urban rate. This rural trend eventually should spill over to higher levels of schooling. However, the flatter trend in rural secondary school enrolment leads us to believe that the children who might want to continue from primary to secondary education would be constrained by a lack of nearby schools.
Employment and unemployment among 15–24 age group, 1991–92 to 2005–06
1991–92 1998–99 2005–06 Change Urban Employment 29.4 22.5 28.3 -0.9 Unemployment 8.5 7.7 8.1 -0.4 Rural Employment 71.9 37.9 49.6 -22.3 Unemployment 2.6 4.8 4.7 +2.1
Source: Ghana Living Standards Survey, 1991–92, 1998–99 and 2005–06. Source: Coulombe and Wodon 2007.
Constraints to Ghana’s accelerated growth
1.89 To accelerate growth and get on the path to middle-income status, Ghana faces at least four main policy challenges. These are: (1) closing the infrastructure gaps (especially in energy, water and sanitation, and rural roads), (2) improving productivity, especially in agriculture, and innovation, (3) improving the investment climate and (4) challenges in sustaining macroeconomic stability by maintaining prudent fiscal management and improving public sector efficiency and capacity; to this we could add environmental issues studied elsewhere. These constraints and challenges––identified in the course of the CEM work by macro, sectoral, and micro-based analyses––can be thought of as “binding constraints” to

49
accelerated growth in the sense that if they are addressed head on, a high payoff of additional growth is likely to occur.
1.90 The first two constraints––infrastructure and productivity––are “structural” and require upfront policy, efficiency and resource improvements. The last two could be thought of as “the fundamentals” that require constant, sustained policy attention. While Ghana has already reaped important gains from sustaining macroeconomic stability, safeguarding and building on these gains in the future will be critical to the success of its accelerated growth agenda. Meeting each of these challenges will require additional policy improvements and efficiency gains. Closing the infrastructure gaps also will require additional private and public resources targeted at the areas of maximum impact.
Box 1.7: Ghana’s Twin Infrastructure Crises: Energy, and Water and Sanitation
Economic costs of the energy crisis Mining and manufacturing and services growth have been significantly constrained by the energy crisis. Had there been no energy crisis, Ghana would have probably grown this year by 7.5%, maybe more. Remarkably, despite the energy crisis, the outlook for 2007 of about 6% remains strong, suggesting broad resilience and momentum of the economy. However, these must not be taken for granted. Evidence from local and foreign businesses suggest that Ghana is already foregoing major new investments, jobs, and growth as a result of the power cuts. In the larger Accra area, for example, from September 2006, load shedding has spanned over 12 hours in 3 days per week. Many small and medium-sized businesses have bought supplementary back-up generators to retain full business hours, substantially raising their costs. Large industry is also being cut by approximately 25% of its demand. A survey conducted by the Chamber of Mines indicates that a 50% cut in electricity provision would lead to revenue shortfalls of US$45 million per month for 4 companies alone. One major international company reported US$4,000 losses for each day of sustained power cuts. Businesses also report their inability to extend plant operations to secondary towns due to a combination of inadequate power and water. “Silent crisis” in the water and sanitation sector While the media and many observers are focusing on the energy crisis, Ghana, including in Accra, is facing a silent water crisis. This crisis threatens not only the achievement of important Millennium Development Goals (MDGs), but also constrains numerous economic and social activities in both private and public sectors that rely on the supply of clean water and adequate sanitation for its operations. Examples are large retail, wholesale, food and agro-processing sectors). It is estimated that half the population do not have access to safe water and two-thirds do not have access to adequate sanitation. Access to safe water in 2005 was estimated at 53% for rural areas and coverage for urban water supply was estimated at 58%, a drop of some 3%, compared to 2004. With respect to sanitation, coverage in 2004 was 35% (32% for rural/small towns and 40% in urban areas).
Source: Estache and Vagliasindi 2007.
1.91 Closing the infrastructure gap. The Ghanaian economy has important infrastructure bottlenecks that, if eliminated, could substantially boost short- to medium-term growth. The main bottlenecks are in energy, water and sanitation, rural roads, and ICT (Box 1.7). Restoring the energy balance would immediately improve prospects for large numbers of energy-intensive sectors, including some nontraditional exporting industries. Perhaps even more important is the “silent crisis” in the water and sanitation sector––even in the capital Accra. Urgent attention

50
from the investment, policy and operations, and maintenance fronts to this neglected infrastructure sector is essential.
Table 1.21: Ghana - Annual infrastructure funding gap (US$m)
GPRS2 Investment Funding Gap 1/ Funding Gap 2/
Transport (Roads) 198.64 -62.59 -51.36
Energy-electricity3/ 88.69 11.05 331.219
ICT 0.03 77.56 NA
Water and sanitation 91.22 25.56 58.78
TOTAL 379 53 340 Notes: 1/ The funding gap is assessed against the investment needs calculated based on the demand growth (see Table 1.10) 2/ The funding gap is assessed against the investment needs calculated based on the sectoral micro estimates (a minus sign indicates a surplus; a positive sign indicates a deficit). 3/ Funding Gap 1/ refers to generation only, while the second Funding Gap 2 includes also transmission and distribution.
1.92 In sum, a broad conclusion emerging from the in-depth CEM analysis of infrastructure is the presence of major gaps in infrastructure service provision in supply, quality, and reliability (Estache and Vagliasindi 2007) (Table 1.21).
1.93 Improving productivity, especially in agriculture, and strengthening innovation. Engendering existing, and fostering new gains in productivity is key to Ghana’s accelerated growth strategy. Ghana’s aggregate productivity is improving, but the level remains below the most productive African economies (for example, Mauritius and Botswana) and also well behind the rapidly growing Asian countries. The most important sources of future productivity improvements are likely to be through the competitive entry of new and more productive enterprises, as well as the growth of existing firms, and through increasing the available skilled labor.
1.94 Improvements also are possible by focusing on eliminating bottlenecks and widening the use of technology and ICT. For example, the recent significant productivity gains in the cocoa sector as a result of disease control, fertilizers, better product varieties, and other measures hold important lessons for the rest of agriculture: aggressive productivity-enhancing measures on privately owned farms can have major impacts on productivity and output. Outside agriculture, despite much talk about the promise of cellular and internet technology, the quality of and access to these services remains much below the potential necessary to spur the innovative strides observed in Asian economies. Finally, it is the productivity gains that ultimately underpin any gains in competitiveness and long-term growth. Hence, it is necessary to instill in the public sector a new value-for-money and productivity-enhancing mindset that will lead to better use of resources and wider space for private sector innovation in the new, technology-intensive sectors that offer opportunities for leapfrogging. That the private sector has already responded to the existing opportunities despite operating under the significant infrastructure constraints detailed

51
below is a testimony to the resourcefulness of the Ghanaian people. A more favorable climate for productivity and innovation would unlock this potential even more.
1.95 Strengthening investment climate. Recent World Bank’s Doing Business (2007) and Association of Ghana Industries (AGI) surveys indicate that while there is a move in the right direction accompanied by investor optimism, this movement is happening from a low base. Thus, the improvements in investment climate must be extended and sustained long term. Procedures for formal business start-ups are still too cumbersome and push firms to informality. The AGI survey also points to lack of access to and high cost of energy and the high cost of credit as major issues. Urban and the subsequent rural investment climate surveys being carried out under the Ghana CEM are expected to provide additional evidence and shed more light on the types and severity of investment climate constraints in Ghana (Clarke 2007).
1.96 Strengthening macroeconomic stability and public sector capacity. Increasingly, the cornerstone of Ghana’s recent macro stability has been prudent fiscal and monetary policies. This stability must continue if Ghana is to reduce interest rates, increase private investments, and continue to attract favorable investment ratings and donor support. The main short-term threats to fiscal prudence are: (a) pressures to raise the already large government wage bill beyond the levels justified by fiscal affordability and productivity; and (b) pressures for the budget to pay for the inefficient tariff policy and operations of the energy companies. Simply granting public sector wage increases alone will not improve public services nor help reduce poverty; increases in the productivity of public sector personnel and more efficient use of resources will. Hence, the all-important emphasis should be to improve efficiency and value-for-money at all levels of public sector activities.
1.97 Merely keeping electricity tariffs arbitrarily low for those who already have access will not help fight poverty since, despite past gains, most of the poor do not yet have access to electricity. Moreover, a distributional analysis of who benefits from the electricity subsidy shows clearly that it is the richer segments of the population who capture most of this subsidy (Coulombe and Wodon 2007). Hence, the argument that low electricity prices benefit mainly the poor is factually wrong. This policy is also undermining the finances of the sector and the declared goal of extending the service to the poor.
1.98 Last but not least, policy should seek to make Ghana’s future growth more equitable across space and more inclusive across various social groups (ISSER 2007). Despite major poverty reduction gains and the emerging middle class, inequality is increasing in both rural and urban areas, and the poorer areas of the country are benefiting less from the ongoing expansion of the Ghanaian economy. Greater equity is desirable for both social cohesion and stability. Conversely, excessive inequities could develop into a source of instability. A major policy instrument to address regional inequities is regional infrastructure policy. How precisely such policy can be used to address spatial inequities remains an analytical and policy challenge for the post-CEM period.
1.99 In the next chapter, we look forward from the present to 2015 to explore the prospects, policies, and trade-offs, and the possible role of scaling up of aid, if Ghana is to sustain its accelerated and shared growth in the next decade.

52
2. LOOKING FORWARD: ACHIEVING ACCELERATED AND SHARED GROWTH
2.1 The previous analysis has shown how Ghana’s recent, robust growth performance has significantly reduced poverty. Despite high oil prices, real GDP growth has increased steadily from 3.7 percent in 2000 to 6.2 percent in 2006. This strong performance reflects the improved macroeconomic and financial stability, which removed two of the key constraints to Ghana’s private sector growth (G-JAS 2007). Recent growth has been strongly poverty reducing. The proportion of the population in poverty declined steeply from approximately 52 percent in 1991–92 to just 28.5 percent in 2005–06.
2.2 This record of growth and poverty reduction underscores the primacy of economic growth in reducing poverty in Ghana and, therefore, the criticality of a pro-growth policy environment. In this section, we use Maquette for MDG Simulations (MAMS)–a dynamic, computable general equilibrium (CGE) model of the Ghanaian economy developed in the context of this CEM in collaboration with the Ministry of Finance and Economic Planning, Bank of Ghana, and the National Development Planning Commission (NDPC). With this model, we explore the implications of three different medium-term growth scenarios: (i) baseline scenario built on the continuation of the current trends, policies, and aid levels; (ii) accelerated growth scenario predicated on removing infrastructure bottlenecks and improving efficiency, and is domestically financed; and (iii) full, key MDG achievement scenario that assumes significant scaling up of donor aid. The base year for long-term growth simulations for 2004–15 is 2004, for which detailed data and a Social Accounting Matrix (SAM) is available. Simulations should not be interpreted as forecasts but rather as the long-term implications that Ghana may be facing in the next decade with alternative growth paths and policy and aid packages.
Table 2.1: MDG progress in Ghana, 1990–2004
1990 2004 Target
Poverty headcount (%) 52 30 26 Primary completion rate (%) 47 100 Under-5 mortality (per 1,000) 122 112 40 Maternal mortality (per 100,000) 740 503 185 Access to safe water (%) 54 56 85 Access to sanitation (%) 21 35 85
Note: poverty figure for 2004 is an interpolation from 1998-99 and 2005-06 data points (GLSS 4 and 5, respectively). The actual GLSS-5 data show that the 2005–06 poverty rate has been reduced to 28.5%.
2.3 Despite the impressive progress on the poverty MDG noted above, improvements in other MDGs have been more limited. Although important strides have been made in many areas of human development (HD), until now the progress on education, health, and water/sanitation MDGs has been moderate (Table 2.1). Precise assessment of progress is difficult due to data limitations and scarcity, but the broad messages are that improvements across the MDGs have been uneven. Significant progress is taking place in basic education, aided by the abolition of basic school fees in 2005 and enhanced expenditure allocation toward the lagging regions (G-JAS 2007). However, concerns about the quality of education (for example, test

53
performance) remain. Efforts to reduce child and maternal mortality have practically stalled since GPRS I. This problem is even more worrisome since health sector expenditures have risen over the same period (G-JAS 2007). Finally, aggregate figures show that access to water and sanitation services has been improving, but there is a crisis in the sector and quality has deteriorated significantly. Inequalities in access (particularly between rural and urban areas) and issues of quality in this sector remain major bottlenecks for development.
2.4 In this Chapter 2, we utilize the Ghana MAMS (Maquette for MDG Simulations) model to assess the growth and human development (HD) consequences of an accelerated growth and MDG achievement strategy. MAMS is a general equilibrium model that explicitly links progress in human development (HD) to the rest of the economy through public expenditure, labor markets, and private demand for public services. MDGs are modeled with a “production function” approach. Progress is conditional on improved levels of public service delivery (through increased expenditure and/or enhanced efficiency), demand for services, and progress on other MDGs and improvements in infrastructure (see Box 2.1 for the technical details of the MAMS approach). The base year for the Ghana MAMS model is 2004. The data needed to calibrate the model come from a SAM as well as detailed sector studies that describe the current situation in each of the HD sectors (education, health, water/sanitation) and quantify the progress required to reach the MDGs.21
21 The SAM for MAMS was constructed starting from a SAM built by the International Food Policy Research Institute (IFPRI) in cooperation with Ghana Statistical Services (GSS). The main difference of the MAMS SAM from the original IFPRI version is the disaggregation of public current expenditures and investments into the different activities covering education, health, water and sanitation, other infrastructure, and other public activities. This disaggregation is based mostly on public expenditure figures published in the Ghana External Review of Public Financial Management (World Bank 2006) and the Report of the Auditor General on the Public Accounts of Ghana (2004). The following studies were consulted for estimates of costs required to reach the MDGs. For education, the MAMS model relies on the Education Strategic Plan (2003) published by the GoG Ministry of Education. For health, the main source of information is the Marginal Budgeting for Bottlenecks (MBB) model developed by Bank HD experts. For water and sanitation, the main input is “Getting Africa on Track to Meet the MDGs on Water and Sanitation: A Status Review of Sixteen African Countries,” by the Africa Ministers’ Council on Water (2006).

54
Box 2.1: Maquette for MDG Simulations (MAMS) - Technical Details
The extrapolation of current trends has been carried out using MAMS, a dynamic general equilibrium model. MAMS links public expenditures on social services and infrastructure to social outcomes in MDG attainments and aggregate growth.22 A key objective of MAMS is to capture the key interactions between the pursuit of the MDGs and the evolution of the economy. MAMS focuses on a subset of MDGs for which numerical targets have been developed and the data is available.23 These are universal primary school completion (MDG 2), reduced under-five and maternal mortality rates (MDGs 4 and 5), and increased access to improved water sources and sanitation (part of MDG 7). To the extent that a package of interventions that curtails child and maternal mortality helps to reduce the incidence of major diseases other than HIV/AIDS, the model also implicitly tracks MDG 6. Achievements in poverty reduction (MDG 1) also are addressed, although the model does not contain mechanisms for specific MDG-1-related interventions. Production of a typical MDG is modeled as a system of two functions. The first models the production of an aggregate measure of MDG service delivery that depends on direct MDG spending and on other determinants. The second function relates MDG outcomes with this aggregate measure.
Box Table 2.1 Determinants of MDG achievement in MAMS
Other determinants MDG Per-capita Per-capita Wage Public Other service delivery consumption incentives infrastructure MDGs 1 Poverty X 2 Education X X X X 4, 7a, 7b 4 Infant mortality X X X 7a,7b 5 Maternal mortality X X X 7a,7b 7a Water X X X 7b Sanitation X X X
In the first function, the production of MDG-related services requires three broad categories of inputs: labor (disaggregated according to skill/education levels), capital goods, and intermediary products. These inputs basically account for spending on specific MDG interventions. In addition to them, the aggregate measure of MDG service delivery is determined by other variables (Box Table 2.2). For example, reaching the education MDG requires additional schooling services. However, MDG achievement is also facilitated by improvements in health conditions (proxied by MDG 4 and 5), better infrastructure (for example, better roads to schools), higher income levels (better-off parents may not need for their children to work), and good returns to education (proxied by the wage premium paid to skilled workers). The aggregate measure is strictly increasing in all of its components. The second function requires increasing improvements in aggregate service delivery for the same rate of improvement in the MDG indicator. Although improvements in public infrastructure are not part of the MDGs, they serve as a key input in the MDG production function. They also contribute to overall growth by adding to the productivity of other production activities. This means that real GDP growth (and poverty reduction) is partly influenced by government policies, particularly by its investment in public infrastructure (roads, ports, energy).24 The MAMS model does not explicitly track the progress of MDG 1. One simple approach to follow the progress on poverty reduction is to use an estimated elasticity of poverty with respect to growth in households’ per capita consumption. This study takes a more sophisticated approach by utilizing a macro-micro framework, wherein a set of aggregate results from MAMS are passed on to household survey data by means of a microsimulation module. The data for our microsimulations come from the most recent household survey for Ghana (GLSS5), in which employment and wages by skill and sector are easily identified. The simulations then apply changes in employment, skill levels, relative wages, and consumption per capita from MAMS to each individual in the survey, producing a new distribution of income and translating the evolution of macro variables into poverty outcomes. Unlike the simpler poverty-elasticity-based methods, the microsimulation approach allows for four main avenues of escaping poverty: moving from agricultural employment to nonfarm activities, in which the wages tend to be higher; upgrading individual skills (through schooling); changes in relative wages; and an economy-wide growth component that equally benefits all households.
22 A more detailed description of the model is available on request, and may be found in Lofgren and Diaz-Bonilla 2006. 23 Of the 8 MDGs of the 2000 Millennium Declaration, only 2 are omitted from the current version of the model due to measurement and data issues: MDG 3–Promote gender equality and empower women and MDG 8–Develop a global partnership for development. Some parts of MDG-7–Ensure environmental sustainability are also left out of the analysis. 24The empirical link between growth and public infrastructure has been analyzed widely, but there is no universal consensus on the strength of this link. Given the lack of consensus, this chapter does not consider any scenarios in which poverty (MDG 1) is actively targeted by boosting growth via increased public investment in infrastructure.

55
2.5 Importantly, MAMS estimates go beyond simple extrapolations of existing/expected trends by incorporating various feedback mechanisms from other MDGs as well as from the rest of the economy. These feedbacks notwithstanding, an analysis of the initial level and composition of public spending in each human development sector is a useful starting point. The base-year (2004) composition of expenditures is summarized in Table 2.3, which shows that some of the sectors are better positioned than others to deliver improved MDG performance. For example, the health sector employs relatively few tertiary-skilled workers (doctors and nurses). The paucity of these workers compromises the ability of health facilities to provide the high levels of care needed to significantly improve the performance of health indicators without large financial injections. In contrast, primary education requires fewer tertiary-skilled workers. Hence, in principle, this sector is capable of delivering improved education outcomes without a large increase in spending.
Table 2.2: Ghana - Public spending on infrastructure and human development, 2004
Cedis, b. % of total Employment
(000) % of total Wages, m. Intermediates 147 5 Labor 63 2
Unskilled 3 0 0.50 9 5.74 Skilled 33 1 3.61 68 9.18 Tertiary 27 1 1.22 23 22.19
Investment 2,682 93
Publ
ic in
fras
truc
ture
Total 2,892 100 5.33 100 Intermediates 17 3 Labor 28 5
Unskilled 2 0 0.58 6 3.45 Skilled 17 3 6.92 71 2.39 Tertiary 10 2 2.31 24 4.22
Investment 529 92
Wat
er a
nd s
anita
tion
Total 573 100 9.81 100 Intermediates 109 5 Labor 936 40
Unskilled 0 0 0.00 0 Skilled 495 21 31.74 72 15.60 Tertiary 441 19 12.12 28 36.36
Investment 1,277 55
Hea
lth
Total 2,322 100 43.85 100 Intermediates 125 5 0 Labor 1,700 74
Unskilled 29 1 2.88 4 10.07 Skilled 983 43 50.80 67 19.35 Tertiary 688 30 22.52 30 30.54
Investment 463 20 Prim
ary
educ
atio
n
Total 2,288 100 76.20 100

56
Ghana’s baseline growth scenario
2.6 Ghana has realistic prospects of maintaining a strong rate of growth for the medium and long terms (until 2015) and achieving even larger gains in poverty reduction. All forward-looking scenarios assume that Ghana continues to gradually benefit from the demographic dividend of slower population growth than in previous decades. The baseline scenario’s growth performance is predicated on a continued favorable overall policy environment. It includes the assumption of the rapid resolution of the energy crisis. This scenario is characterized by several key assumptions:
• Ghana will remain a strong policy reformer in terms of the World Bank CPIA index throughout the period, but policies will continue to improve only gradually.
2.7 The dynamic (2004–15) path of real GDP and external debt stocks is consistent with the assumptions and estimates of the latest Debt Sustainability Assessment (DSA), conducted jointly by the IMF and the World Bank in February 2007.25
2.8 The volume of public spending broadly as in the GPRS II (investment and recurrent expenditures on social sectors as well as other budget categories) grows at the rate of planned expenditures by the Government of Ghana or, in the absence of this information, is assumed to grow at the same rate as real GDP.26
Table 2.3: Ghana - Projected macro variables in the baseline scenario
Levels (B LCU) Growth rates (%) 2004 2015 Average 2004–15 Real GDP at market prices 79,888 165,943 6.9
Private consumption 63,396 142,338 7.6Government consumption 9,724 17,807 5.7Private investment 12,782 28,872 7.7Public investment 9,888 18,209 5.7Exports 32,329 65,275 6.6Imports 48,231 106,559 7.5
Real GDP per capita (000 LCU) 3,688 5,803 4.2Real exchange rate (LCU per US$) 1.00 0.97 -0.3 Trade-to-GDP (%) 100.8 103.6Investment-to-GDP (%) 28.4 28.4
Private 16.0 17.4Public 12.4 11.0
External debt-to-GDP (%) 55.5 28.0External debt service-to-exports (%) 2.9 1.5
Note: LCU stands for local currency unit (Cedi).
25 It is important to note that, as for most dynamic general equilibrium models such as MAMS, real GDP growth is exogenous during the calibration of the model. This means that, given the growth rate for the labor force and the accumulation of capital, the growth of the productivity parameter is calculated so that the targeted real GDP growth is achieved. To reach the strong GDP growth assumed by the DSA, significant efficiency gains are needed (Figure 2.1). These efficiency gains can be, at least in part, attributed to the favorable policy environment and investment climate (as reflected in the CPIA index). However, no attempt to econometrically estimate the link between these variables and efficiency gains was carried out for this study. 26 For more details, see appendix tables.

57
2.9 In this baseline, the results of the long-term simulations show that real GDP grows at an average annual rate of 6.9 percent through 2015, while population grows at 2.6 percent per year (Table 2.3). These rates lead to an impressive 4.2 percent annual improvement in per capita income. Consumption per capita grows even faster. The high and sustained pace of growth bodes well for reaching the poverty MDG, which is likely to be surpassed in this baseline scenario well ahead of the target year 2015.27 The scenario includes a solid growth in private investments responding to a favorable policy environment. The total investment-to-GDP ratio is maintained at the level of close to 29 percent, with the private sector contributing more than 17 percentage points to this ratio by 2015. The economy also shows a dynamic overall export growth of approximately 6.6 percent per year.
2.10 The real exchange rate appreciates by approximately 3 percent between 2004 and 2015, and the growth of exports lags behind import growth by 1 percentage point per year. The trade-to-GDP ratio rises by another 3 percentage points from an already high 2004 value of 101 percent. Due to debt relief under the Heavily Indebted Poor Countries (HIPC) initiative, the external debt-to-GDP ratio is almost halved over the 11-year period. The debt relief provides a significant reprieve from debt service obligations and frees up public resources for other spending areas, such as human resource development.
2.11 Growth in this baseline scenario––as in the other two scenarios discussed below––is broad based and supported by productivity gains. In terms of sectoral growth, manufacturing and services are the most dynamic sectors: they grow at 7.7 percent and 7.5 percent per year, respectively. Agriculture grows at approximately 6.2 percent per year, while the public sector growth is 5.4 percent per year. The contributions to growth are as follows: agriculture 36 percent, manufacturing 18 percent, services 38 percent, and public services 8 percent.
2.12 Figure 2.1 shows the roles played by labor, capital, and productivity in sustaining the growth of real GDP at factor cost in each of the three scenarios considered in this report. To attain the baseline growth path described in the previous paragraph, Ghana’s productivity growth must further accelerate from the recent (and already high by Ghana’s historical standards) growth of 1.6 percent per year to 2.6 percent per year. At this rate, the contribution of productivity to total GDP growth will be just under 39 percent. It is important to note that this is an ambitious productivity path. There is only one Sub-Saharan African country—Botswana—that was able to sustain higher total factor productivity growth rates over the 1981–2002 period (3.7 percent), although TFP in Uganda grew at an average annual rate of 2 percent during the same period (Akinlo 2005).28
2.13 Growth in this baseline scenario – as in the other two scenarios discussed below – is broad based and supported by productivity gains. In terms of sectoral growth, manufacturing and services are the most dynamic sectors: they grow at 7.7 percent and 7.5 percent per year, respectively. Agriculture grows at approximately 6.2 percent per year, while the public sector growth is 5.4 percent per year. The contributions to growth are as follows: agriculture 36 percent, manufacturing 18 percent, services 38 percent, and public services 8 percent.
27 Note that the poverty figures quoted in this chapter are estimated using a microsimulation technique that takes into account changes in the distribution of income and the heterogeneity of income sources across households (box 2.1). 28 Note that the sample in Akinlo (2005) does not include South Africa.

58
Figure 2.1: Ghana - Sources of growth in the 3 MAMS scenarios
2.14 If realized, the strong growth performance of the baseline scenario puts Ghana in a good position to reach the key poverty MDG well ahead of schedule. However, the country is unlikely to reach the full set of key MDGs. In this study, we are focusing on the four key MDGs––poverty, education, health, and water and sanitation––which are of particular interest for policy and for which adequate data are available. Moreover, their achievement and the interventions needed to reach them are likely to have general equilibrium effects throughout the economy. The poverty headcount for the year 2015 in the baseline scenario is estimated to be 12 percent, thus exceeding with a large margin the target of 26 percent (Table 2.4). Strong growth and a moderate increase in inequality support this remarkable continuation in poverty reduction. Even if this growth is not distributed equally across the population, as shown by the growth incidence curve in Figure 2.2, the 30 percent population at the bottom of the income distribution will still get an average cumulative income increase of approximately 50 percent, which is sufficient to move an additional 4.7 million people out of poverty.29
2.15 If growth is distributionally neutral, poverty reduction would be even stronger. To assess whether the increase in inequality is particularly detrimental by eroding the poverty-reducing effect of growth, the microsimulation model generates an additional counterfactual in which every individual gets the same average increase in his/her income––this is equivalent to an unusual, flat growth incidence curve across income/expenditure groups, but can serve as a useful benchmark to assess the distributional “bias” of the projected baseline growth. In this case, poverty would be reduced slightly more, and the headcount would be at 11 percent by 2015. The 1.0 percent point difference in headcount poverty in the final year between the baseline scenario and this distributionally neutral one is not negligible, but it does not appear major either. The moderate rise of inequality in the baseline is due to the underlying labor market dynamics in this scenario: the strong growth of Ghana and the gradual structural adjustment of its economy in which manufacturing and services play a larger role and create demand for more skilled workers. This demand, in turn, pushes up their wages (relatively more than for unskilled workers). This increase in the skill premium also may be seen as a positive development. Although it results in
29 The figure “4.7 million” people who escape poverty is calculated by subtracting the number of people who would be poor if the headcount of 2004 were applied to the population of 2015 minus the number of poor estimated by the microsimulations for 2015.
Annual growth rate, 2004-2015 (%)
0
1
2
3
4
5
6
7
8
Baseline High growth MDGachievement
Productivity
Capital
Labor

59
some increase of inequality, it creates the incentives to pursue investments in human capital, which helps long-term growth.
Figure 2.2: Ghana - Growth incidence curve for the baseline and MDG scenarios
2.16 Considering the other MDGs, MAMS’ estimates show that, under the baseline scenario, solid progress is likely to take place in education, but little progress would take place in health, especially in the key indicators of child and maternal mortality. The rightmost column of Table 2.4 summarizes the progress across different targets by computing a measure of “distance to target,” which is a ratio of improvement in each human development (HD) area in the baseline scenario to the total improvement required for MDG achievement. In education, 89 percent of children are expected to complete the primary cycle in 6 years by 2015. Although this figure falls short of the MDG of universal primary completion, 80 percent of distance to target is covered in the baseline scenario. In contrast, relatively little progress is likely to take place in water and sanitation, in which only 21 percent and 23 percent of total distance to target will be covered in the baseline. Finally, reductions in child and maternal mortality are even slower, with only one-fifth of the required improvement likely to take place by 2015.
Table 2.4: Ghana - Projected MDG achievements in the baseline scenario
1990 2004 2015 Target Distance to
target *
Poverty headcount (%) 52 30 12 26 Achieved Primary completion rate (%) 47 89 100 80% Under-5 mortality (per 1,000) 122 112 97 40 20% Maternal mortality (per 100,000) 740 503 440 185 20% Access to safe water (%) 54 56 62 85 21% Access to sanitation (%) 21 35 47 85 23%
*Note: Calculated as [MDG (2015, simulated) – MDG (2004]/[MDG (2015, target) – MDG (2004].
4050
6070
80
Per
cap
ita in
come gr
owth in
%
0 20 40 60 80 100Share of population ranked by per capita income
Growth incidence: base Average income gain: baseGrowth incidence: MDG Average income gain: MDG

60
2.17 Synergies across different MDGs play an important role: progress in education likely would be higher with more improvements in water and sanitation, which are identified in the Education Strategic Plan as a necessary condition for reaching the education MDG. Similarly, education is affected by the bottlenecks in health and infrastructure, and improvements in health outcomes are muted by the lack of progress in water and sanitation as well as other infrastructure.
Ghana’s accelerated growth scenario and removal of infrastructure gaps
2.18 The removal of bottlenecks in infrastructure (including energy) and water/sanitation can put Ghana on a path to an even more accelerated growth and poverty reduction. In this accelerated growth scenario, the growth in the level of service provision in the infrastructure sectors is raised with respect to the baseline. Compared with the baseline, there are three additional major assumptions in this scenario:
• Water and sanitation infrastructure spending is doubled, whereas spending increases by approximately 50 percent in the remaining infrastructure sectors (energy, communication, roads, and other transport services).30 This level of spending would address the infrastructure gaps identified in the in-depth infrastructure analysis (Estache, Vagliasindi, and others 2007).
• This additional public infrastructure spending is financed domestically by raising direct taxes. As such, this scenario outlines a potential growth path in a public-spending driven scenario, financed fully by domestic tax revenues. The idea is not to suggest a normative scenario, but to illustrate the long-term resource requirements and basic trade-offs under such accelerated growth outlook.
• Policy environment continues to improve. The model includes an endogenous positive relationship between the levels of capital stock in the infrastructure sectors and aggregate productivity as a result of closing of infrastructure gaps and spillover effects. Therefore, the faster infrastructure capital accumulation implied in this scenario results in stronger GDP growth via larger (than in the baseline) productivity gains.
2.19 Under these conditions, results of simulations indicate that growth of real GDP rises to 7.4 percent per year (Table 2.8). By design, public investments are higher than in the baseline, but the additional GDP growth that is generated crowds in additional private investment response.31 The additional growth is driven increasingly by productivity (TFP) gains throughout the economy. They are generated by closing of infrastructure gaps (Table 2.8 and Table 2.9) identified in an in-depth infrastructure analysis (Estache and Vagliasindi 2007) and by spillover effects from the improved service provision in infrastructure and water/sanitation.32 Productivity gains now contribute up to 41 percent of total growth, compared to a contribution of 39 percent in the baseline (In terms of sectoral growth, manufacturing and services are the most dynamic sectors: they grow at 7.7 percent and 7.5 percent per year, respectively. Agriculture grows at
30 The growth of current spending on water/sanitation and other infrastructure accelerates from 5.4% per year to 10.8% and 7.8% per year, respectively, while investment growth quickens from 5.4% to 16.2% and 10.8% per annum, respectively (tables A1.1 and A1.2). 31 Although the private investment declines as a share of GDP relative to baseline, it increases in absolute terms. 32 In technical terms, the model uses an elasticity that links investment in public infrastructure and water/sanitation to the growth of the economy-wide TFP.

61
approximately 6.2 percent per year, while the public sector growth is 5.4 percent per year. The contributions to growth are as follows: agriculture 36 percent, manufacturing 18 percent, services 38 percent, and public services 8 percent. (Figure 2.1).
2.20 Due to improvements in productivity, Ghanaian products become more competitive in world markets. This productivity gain offsets the negative effects of real exchange rate appreciation in the baseline and enables export volumes to increase more relative to imports. Compared to the baseline, the improvement in export growth is 1 percentage point per year, while import growth accelerates by 0.6 percentage points per year. The initial “push” comes from improvements in public infrastructure and water/sanitation. Nevertheless, faster export growth plays an important role in moving Ghana up to a higher growth path.
Table 2.5: Ghana - Projected macro variables in the accelerated growth scenario
Levels (Bn LCU) Growth rates
(%)
2004 2015 Average 2004-15
Real GDP at market prices 79,888 174,375 7.4Private consumption 63,396 144,351 7.8Government consumption 9,724 17,973 5.7Private investment 12,782 29,809 8.0Public investment 9,888 23,484 8.2Exports 32,329 70,555 7.4Imports 48,231 111,797 7.9
Real GDP per capita (000 LCU) 3,688 6,098 4.7Real Exchange rate (LCU per US$) 1.00 0.99 -0.1 Trade-to-GDP (%) 100.8 104.6Investment-to-GDP (%) 28.4 30.6
Private 16.0 17.1Public 12.4 13.5
External debt-to-GDP (%) 55.5 27.1External debt service-to-exports (%) 2.9 1.4
2.21 There is no free lunch such as costless, sustained acceleration in growth, and the private sector may have to bear part of the burden. In this accelerated scenario, the investments in infrastructure and water/sanitation sectors are financed through direct taxes. This arrangement results in the 2015 share of direct taxes to GDP rising from the 6 percent in the baseline to 7 percent. Raising direct taxes has a dampening effect on private consumption. The GDP growth rate increases by approximately half a percentage point per year (from 6.9 percent yearly growth rate in the baseline to 7.4 percent in the current accelerated scenario. However, the annual increase in the growth rate of private consumption is only 0.2 percentage points. It is possible to pursue alternative financing mechanisms for the investment projects in the bottleneck sectors, such as domestic or foreign borrowing. On the other hand, these alternatives also have their drawbacks, such as crowding out private investment or potentially unsustainable build-up of foreign debt (IMF/World Bank recent debt sustainability assessment 2007). The implications of each financing choice should be carefully considered.

62
2.22 Accelerated growth leads to faster poverty reduction, significant achievements in water and sanitation, and important spillovers for other HD targets. However, the non-poverty MDGs are likely to remain elusive. Table 2.6 shows the evolution of MDG indicators under the accelerated growth scenario. The largest improvements are observed in the water and sanitation sector, which benefits directly from increased public expenditures in this area and indirectly (through spillover effects) from the accelerated path of other infrastructure investment. In this scenario, an additional 13 percent of the Ghanaian population receives access to an improved water source (relative to the baseline), and an additional 23 percent of the population gains the use of safe sanitation facilities.
2.23 The United Nations Millennium Declaration stipulates that, for the water and sanitation MDGs, the percentage of population without access to safe water and sanitation should be reduced by one-half from the 1990 levels. The achievements under the accelerated scenario are more than sufficient to reach the goal on sanitation (61 percent) and nearly enough to reach the water target (77 percent). However, the Government of Ghana has set its sights on a more ambitious coverage ratio of 85 percent of population. This threshold is not attainable even in the high-growth scenario, underscoring the urgency of greater policy focus in this area.
2.24 In other areas, the performance of health and education targets also improves significantly relative to the baseline. For child and maternal mortality, the relevant incidence declines by 3 and 12 cases, respectively. In primary education, an additional 5 percent of school-aged population is able to complete the 6-year education cycle, approaching almost 90 percent of the way to universal completion. However, despite the acceleration in progress and improved prospects for reaching the health and education MDGs, none of the targets is likely to be met by 2015.
Table 2.6: Ghana - Projected MDG achievements in the accelerated growth scenario
1990 2004 2015 Target Distance to target (%)*
Poverty headcount (%) 52 30 10 26 AchievedPrimary completion rate (%) 47 94 100 89Under-5 mortality (per 1,000) 122 112 95 40 24Maternal mortality (per 100,000) 740 503 428 185 24Access to safe water (%) 54 56 75 85 65Access to sanitation (%) 21 35 70 85 69
*Note: Calculated as [MDG (2015, simulated) – MDG (2004]/[MDG (2015, target) – MDG (2004].
Absorption capacity
2.25 Two empirical simulations––using the Ghana MAMS and time-series analysis (El Badawi and Kaltani 2007)––indicate that from the macro perspective, Ghana can indeed take on additional resources under the accelerated growth scenario with closing of infrastructure gaps and spend them productively without suffering from the “Dutch disease.” In addition, Ghana’s institutional and financial management capacity, including the legal and regulatory set up for procurement has been improving, suggesting that the absorption constraint should not be binding (World Bank and IMF 2004). The World Bank’s annual external reviews of public financial management, including using the international PEFA indicators of PFM

63
performance, show gradual improvements (World Bank, External Review of Public Financial Management 2006, 2007). Under these conditions, it appears that stable and moderate increase in resources over the medium term could help the Government of Ghana reach accelerated growth and get closer to the key MDG objectives. At the aggregate, PFM, and institutional level, therefore, it appears that absorption capacity is likely to exceed the resources required for baseline and accelerated growth scenarios.
2.26 Given the much larger scale of resources required in the illustrative, full MDG achievement scenario discussed below, more analysis would be needed to ascertain associated absorption issues. Specifically, more detailed analysis at the sectoral level (such as health, education, water and sanitation) may be needed to ascertain the sectoral capacity to absorb much larger amounts of additional resources and channel them to the most productive uses, especially in the key areas of water and sanitation, other infrastructure, and health and education.
Ghana’s MDG achievement scenario
2.27 Additional scaling up of resources will be needed to reach the four key MDGs. Starting from the accelerated growth scenario, MAMS estimates show that a significant amount of additional resources may be required to meet the entire set of nonpoverty MDGs: water and sanitation, health and education.
2.28 The main additional assumptions in this full MDG achievement scenario beyond those in the accelerated growth scenario are:
• Additional public resources spent targeting the three main MDGs––water and sanitation, education, and health to the extent needed to achieve these MDGs.
• Additional public resources are all financed from foreign aid grants.
• Continued improvement in the policy environment and productivity gains.
2.29 Results of simulations show average annual growth of 7.8 percent in this full MDG achievement scenario. To achieve all four MDGs, grants would have to rise to an average of about 5.0 percent of GDP in the medium term 2007–09 and as much as to 10.5 percent of GDP in the final year 2015 (Table 2.7). This illustrates the magnitude of the challenge in reaching the water and sanitation, education, and health MDGs. The health goals are by far the most costly to achieve.33 These costs, therefore, play a large role in determining the total cost envelope.
2.30 Thus, even with accelerated growth, Ghana may require large amounts of additional resources to ensure the attainment of the full set of MDGs considered in the MAMS model (Table A1.3). The estimated amounts are an annual average of US$820 million per year during 2007–11 and another $1.8 billion during 2012–2015. In an illustrative sense, these amounts are the likely resource cost of achieving the health, education, and water and sanitation MDGs in Ghana, starting from the already accelerated growth scenario with closing of infrastructure gaps (since the poverty MDG is being achieved much earlier). Foreign grant
33 The Marginal Budgeting for Bottlenecks model partial equilibrium costing of achieving the health MDGs puts the total at over US$12 billion. The reason for the high cost of achieving the health MDG includes the much greater number of tertiary educated staff (physicians and nurses) and better equipped and more spatially dense health facilities relative to the initial conditions.

64
financing is not the only means of raising the fiscal revenues necessary to reach the MDGs. However, other financing mechanisms (raising taxes, borrowing domestically or from foreign sources) have important macroeconomic implications and are likely to give rise to the similar broad magnitudes of the required scaling up.
Figure 2.3: Resource requirements for the achievement of MDGs of alternative growth paths
Table 2.7: Ghana - Structure of public finance (% of nominal GDP)
Accelerated
growth MDG achievement with foreign grants
2004 2015 Total current revenues 29.92 29.13 27.92 Direct taxes 7.19 6.77 6.62 Indirect taxes 10.32 10.60 10.62 Import taxes 3.60 3.68 3.67 Export taxes 1.17 0.98 0.71 Current transfers 7.63 7.10 6.31 Total current expenditures 19.14 19.21 21.93 Consumption: MDG-related 6.47 6.42 9.62 Consumption: other 5.70 6.28 6.29 Transfers and interest payments 6.96 6.50 6.01 Public savings 10.78 9.93 6.00 Public investment 12.38 12.91 19.27 Overall balance -1.60 -2.98 -13.28 Domestic borrowing 0.33 2.42 2.25 Foreign borrowing 1.27 0.56 0.49 MDG-related foreign grants 0.00 0.00 10.54
0
1
2
3
4
5
2004 2005 2006 2007 2008 2009 2010 2011 2012 2013 2014 2015
Full MDGs
Closing of infrastructure gaps
Baseline
Foreign Aid, billions of 2004 US$

65
2.31 The four key MDGs could be achieved by a combination of scaled-up resources, better policy, and efficiency improvements. Rather than assuming that the increase in services required to achieve the MDGs is brought about entirely through an increase in the volume of public spending, it also is possible to contemplate increases in the efficiency of public spending, thereby reducing the need for additional financing. This possibility suggests itself in view of (1) the large amount of public spending that otherwise would be required to achieve the MDGs and (2) sectoral evidence of Ghana’s apparently low efficiency performance in education, health, and water/sanitation. For simplicity, to explore this case, we assume that the efficiency improvements are similar in all areas of public spending. In reality, it is likely that some sectors (for example, health) may need larger improvements in efficiency than others, for example, education.
2.32 MAMS estimates simulating such a “high efficiency sub-scenario” suggest that the level of foreign grants could be constrained, for example, to 40 percent of the amount needed in the “full” foreign grant MDG achievement scenario discussed above. In order to reach the MDGs under this foreign aid constraint, the overall level of public sector efficiency would need to rise by 61 percent relative to the 2004 levels. This level of efficiency improvement is significant. It means, for example, that in primary education, the same outcome could, in principle, be achieved with 24 percent fewer teachers (relative to the “full” foreign grant scenario). In health, the MDGs could be reached with 26 percent fewer doctors (but, of course, with more resources, facilities, and better equipment). Starting from the accelerated growth scenario and achieving the same MDGs targets as in the MDGs’ achievement scenario, over the 2004–15 period, overall cost savings from increased efficiency could equal US$7.4 billion. The two scenarios that we explored on how best to reach all four MDGs––an all-grants, full MDG achievement scenario, and a grants-cum-large efficiency gains sub-scenario––illustrate the boundaries of the likely resource requirements and efficiency gains that would need to be generated.
2.33 The pursuit of MDGs has important consequences for the macroeconomy. Due to the sustained inflows of foreign aid in the foreign grants MDG scenario, real GDP growth accelerates by an additional 0.4 percentage points per year relative to the high growth scenario (Table 2.8). The aid inflows could also have important “Dutch disease” implications for Ghana. By raising incomes and spending on consumption goods, they result in increased consumption of imports and loss of export competitiveness, which are manifested in a moderate real exchange rate appreciation (of about 8 percent over the entire period) (also see Elbadawi and Kaltani 2007).
2.34 In particular, the growth of exports is dampened relative to the accelerated growth scenario, although the former still remains above the baseline. In addition, at this level of resource inflows, we question whether institutional capacity, especially at the sectoral level, may become a binding constraint. In addition, a permanently higher level of the real exchange rate may not be a critical problem per se and may, in fact, represent a new equilibrium for the economy. However, the real danger under this scenario could lie in a sudden cessation of aid flows––a kind of aid equivalent of “sudden stops” of capital inflows—that could result in significant adjustment in domestic demand. Therefore, if the grants do rise to these significant levels required by the full achievement of 4 MDGs, it would be important to maintain the stability of such aid inflows over the next 7–10 years.

66
Table 2.8: Ghana - Projected macro variables in the foreign grant MDG scenario
Levels (Bn LCU) Growth rates
(%)
2004 2015 Average 2004-15
Real GDP at market prices 79,888 182,489 7.8Private consumption 63,396 149,825 8.1Government consumption 9,724 21,703 7.6Private investment 12,782 35,136 9.6Public investment 9,888 38,946 13.3Exports 32,329 65,198 6.6Imports 48,231 128,319 9.3
Real GDP per capita (000 LCU) 3,688 6,381 5.1Real Exchange rate (LCU per US$) 1.00 0.92 -0.7 Trade-to-GDP (%) 100.8 106.0Investment-to-GDP (%) 28.4 40.6
Private 16.0 19.3Public 12.4 21.3
External debt-to-GDP (%) 55.5 24.2External debt service-to-exports (%) 2.9 1.4
2.35 A sudden stop in aid could be detrimental and could lead to large adjustment costs in Ghana. Such a scenario implies that to compensate for the loss of aid while maintaining growth and MDG paths, the investment-to-GDP ratio would have to reach a very high level of 41 percent––up 10 percent points from the level reached in the accelerated growth scenario. Although private investment marginally increases, public investment (in MDG-related sectors) records a significant upsurge. Its average yearly growth rate reaches 13.3 percent. Clearly, reaching and maintaining this rate of growth might not be feasible. In this scenario, the GoG might have to solicit much more aggressively private sector participation in implementing its accelerated growth strategy. The point is that a more balanced, public (including donors) and private contribution to the achievement of high growth and MDGs, coupled with sectoral efficiency gains, may be the best overall strategy for the GoG to pursue. Such strategy is also more sustainable in the long term, when foreign grants will be eventually phasing out. In the final section below, we consider some labor market effects that may be important to understand high-quality, shared growth.
Labor market effects and trade-offs in the world of accelerated growth
2.36 Education policies and scaling up public spending affect labor market performance. The efforts to attain the MDGs generate several important feedback mechanisms to labor market performance. The policy of keeping children in school and encouraging them to continue on to higher education levels has two important consequences. Initially, this policy slows the growth of the supply of unskilled workers. However, later, the graduates enter the labor force at higher skill levels. These effects can be seen in the steadily falling growth rates of unskilled labor supply across the various simulations shown in Table 2.9 and the accelerating growth of the supply of skilled and tertiary-skilled workers.
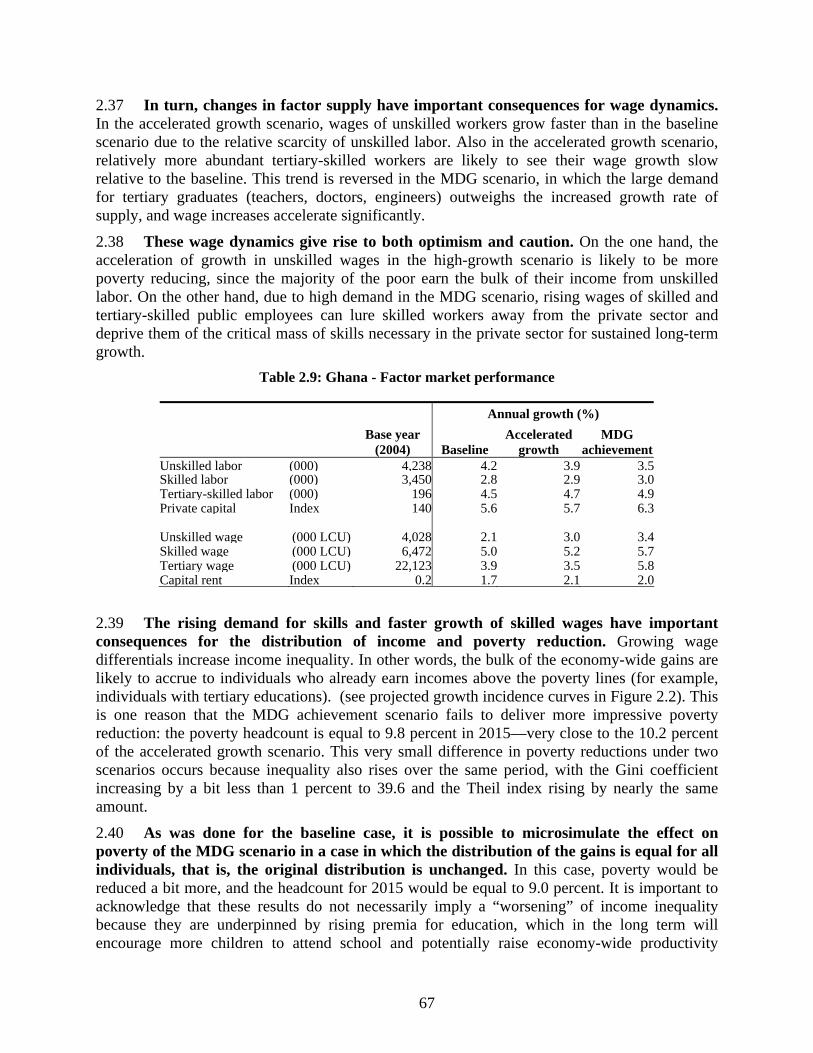
67
2.37 In turn, changes in factor supply have important consequences for wage dynamics. In the accelerated growth scenario, wages of unskilled workers grow faster than in the baseline scenario due to the relative scarcity of unskilled labor. Also in the accelerated growth scenario, relatively more abundant tertiary-skilled workers are likely to see their wage growth slow relative to the baseline. This trend is reversed in the MDG scenario, in which the large demand for tertiary graduates (teachers, doctors, engineers) outweighs the increased growth rate of supply, and wage increases accelerate significantly.
2.38 These wage dynamics give rise to both optimism and caution. On the one hand, the acceleration of growth in unskilled wages in the high-growth scenario is likely to be more poverty reducing, since the majority of the poor earn the bulk of their income from unskilled labor. On the other hand, due to high demand in the MDG scenario, rising wages of skilled and tertiary-skilled public employees can lure skilled workers away from the private sector and deprive them of the critical mass of skills necessary in the private sector for sustained long-term growth.
Table 2.9: Ghana - Factor market performance
Annual growth (%)
Base year
(2004) Baseline Accelerated
growth MDG
achievement Unskilled labor (000) 4,238 4.2 3.9 3.5Skilled labor (000) 3,450 2.8 2.9 3.0Tertiary-skilled labor (000) 196 4.5 4.7 4.9Private capital Index 140 5.6 5.7 6.3 Unskilled wage (000 LCU) 4,028 2.1 3.0 3.4Skilled wage (000 LCU) 6,472 5.0 5.2 5.7Tertiary wage (000 LCU) 22,123 3.9 3.5 5.8Capital rent Index 0.2 1.7 2.1 2.0
2.39 The rising demand for skills and faster growth of skilled wages have important consequences for the distribution of income and poverty reduction. Growing wage differentials increase income inequality. In other words, the bulk of the economy-wide gains are likely to accrue to individuals who already earn incomes above the poverty lines (for example, individuals with tertiary educations). (see projected growth incidence curves in Figure 2.2). This is one reason that the MDG achievement scenario fails to deliver more impressive poverty reduction: the poverty headcount is equal to 9.8 percent in 2015––very close to the 10.2 percent of the accelerated growth scenario. This very small difference in poverty reductions under two scenarios occurs because inequality also rises over the same period, with the Gini coefficient increasing by a bit less than 1 percent to 39.6 and the Theil index rising by nearly the same amount.
2.40 As was done for the baseline case, it is possible to microsimulate the effect on poverty of the MDG scenario in a case in which the distribution of the gains is equal for all individuals, that is, the original distribution is unchanged. In this case, poverty would be reduced a bit more, and the headcount for 2015 would be equal to 9.0 percent. It is important to acknowledge that these results do not necessarily imply a “worsening” of income inequality because they are underpinned by rising premia for education, which in the long term will encourage more children to attend school and potentially raise economy-wide productivity
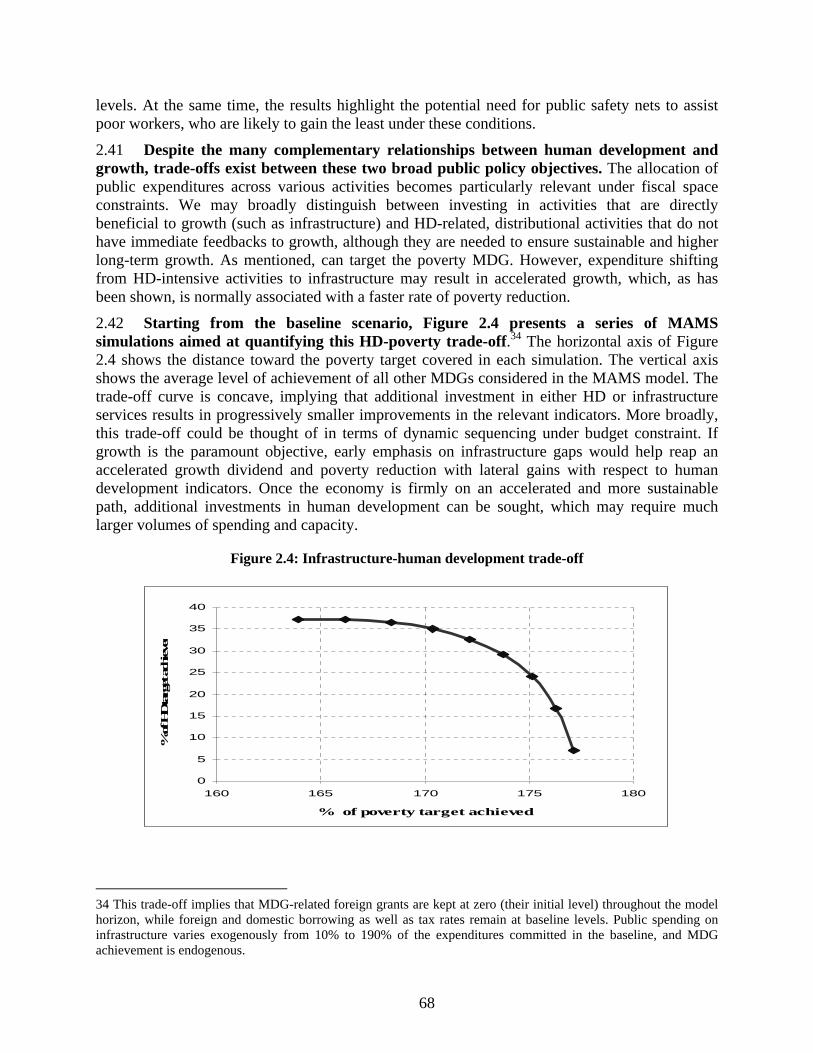
68
0
5
10
15
20
25
30
35
40
160 165 170 175 180
% of poverty target achieved
% of H
D ta
rget ach
ieve
d
levels. At the same time, the results highlight the potential need for public safety nets to assist poor workers, who are likely to gain the least under these conditions.
2.41 Despite the many complementary relationships between human development and growth, trade-offs exist between these two broad public policy objectives. The allocation of public expenditures across various activities becomes particularly relevant under fiscal space constraints. We may broadly distinguish between investing in activities that are directly beneficial to growth (such as infrastructure) and HD-related, distributional activities that do not have immediate feedbacks to growth, although they are needed to ensure sustainable and higher long-term growth. As mentioned, can target the poverty MDG. However, expenditure shifting from HD-intensive activities to infrastructure may result in accelerated growth, which, as has been shown, is normally associated with a faster rate of poverty reduction.
2.42 Starting from the baseline scenario, Figure 2.4 presents a series of MAMS simulations aimed at quantifying this HD-poverty trade-off.34 The horizontal axis of Figure 2.4 shows the distance toward the poverty target covered in each simulation. The vertical axis shows the average level of achievement of all other MDGs considered in the MAMS model. The trade-off curve is concave, implying that additional investment in either HD or infrastructure services results in progressively smaller improvements in the relevant indicators. More broadly, this trade-off could be thought of in terms of dynamic sequencing under budget constraint. If growth is the paramount objective, early emphasis on infrastructure gaps would help reap an accelerated growth dividend and poverty reduction with lateral gains with respect to human development indicators. Once the economy is firmly on an accelerated and more sustainable path, additional investments in human development can be sought, which may require much larger volumes of spending and capacity.
Figure 2.4: Infrastructure-human development trade-off
34 This trade-off implies that MDG-related foreign grants are kept at zero (their initial level) throughout the model horizon, while foreign and domestic borrowing as well as tax rates remain at baseline levels. Public spending on infrastructure varies exogenously from 10% to 190% of the expenditures committed in the baseline, and MDG achievement is endogenous.

69
Summing up: Ghana’s growth story looking forward
2.43 If it addresses its growth constraints––infrastructure gaps, productivity, and investment climate––and if it sustains macro stability by maintaining prudent fiscal policy and improving public sector efficiency and capacity, Ghana faces favorable medium-term growth prospects. A realistic baseline scenario presupposes continued improvement in the overall policy environment and the rapid resolution of the energy crisis. Under this baseline, real GDP grows at an average annual rate of approximately 7 percent through 2015, while population grows at 2.6 percent per year, leading to an impressive 4.2 percent annual improvement in per capita income. Dynamic export growth and further diversification into nontraditional products help support this growth path. The poverty MDG is achieved in 2008–09; and by 2015, Ghana could achieve a very low poverty rate of only 12 percent. Additional gains are likely in other MDGs in water and sanitation, health, and education, but their achievement would remain elusive due to large, additional resource requirements.
2.44 Even more accelerated growth and poverty reduction is possible if Ghana closes infrastructure gaps and ensures more productivity gains. Infrastructure gaps in energy and water and sanitation, as well as in rural roads, and ICT gaps would need to be closed before they begin to choke the ongoing economic expansion. Closing these gaps would require, over and above the GPRS II level of spending of nearly US$350-430 million per year in all 4 major infrastructure sectors. This level of additional funding appears moderate compared with the ongoing ODA levels of close to US$1.1 billion. While the illustrative scenario assumes tax-financed scale-up, foreign grants are an obvious and more favorable mode of financing that could be considered. Under this scenario, growth could accelerate to close to 7.4 percent per annum, and poverty reduction would accelerate, leading to a 10 percent poverty rate in 2015. Due to strong complementarities among growth, poverty reduction and key MDGs and infrastructure spending, progress on other MDGs would be made, closer to their full achievement.
2.45 The CEM analysis indicates that, from the macro perspective, Ghana can indeed take on additional resources under the accelerated scenario and spend them productively without suffering from the “Dutch disease.” Ghana’s overall institutional and financial management capacity has also been improving, suggesting that the overall absorption constraint should not be binding. Under these conditions, stable and rising amounts of aid over the medium term could help the Government of Ghana reach these objectives.
2.46 Finally, to reach three other key MDGs by 2015––health, education, and water and sanitation––Ghana may require much larger amounts of additional resources. They could entail an annual average of about US$820 million per year during 2007–11 and another US$1.8 billion during 2012–15. These significant resources may or may not be available from foreign aid sources alone. However, they indicate the magnitude of the likely resource requirement to achieve these ambitious social goals in Ghana, even with strong policy environment and continued productivity gains. Given the scale of resources involved in this scenario, further analysis of the institutional capacity, especially at the sectoral level, would be needed to ascertain the potential problem with the absorption capacity.
2.47 Finally, the Government of Ghana and its development partners––as well as the local and international private sector––will have to decide on a feasible mix and levels of
70
financing of Ghana’s ambitious but legitimate accelerated and shared growth agenda. It is hoped that this Ghana CEM has provided a useful contribution to such decision making.
2.48 The following two volumes provide detailed analyses of key building blocks of this CEM. They focus, in Volume 2, on main growth issues and some key constraints to accelerated growth: infrastructure, agriculture, investment climate, real exchange rate and macroeconomic challenges to scaling up aid to Ghana, and export diversification. In Volume 3, the focus of analysis shifts to social and political economy issues that underpin the policies and measures needed to more broadly share the benefits of accelerated growth. Detailed analysis and implications for policy are found in these two volumes.
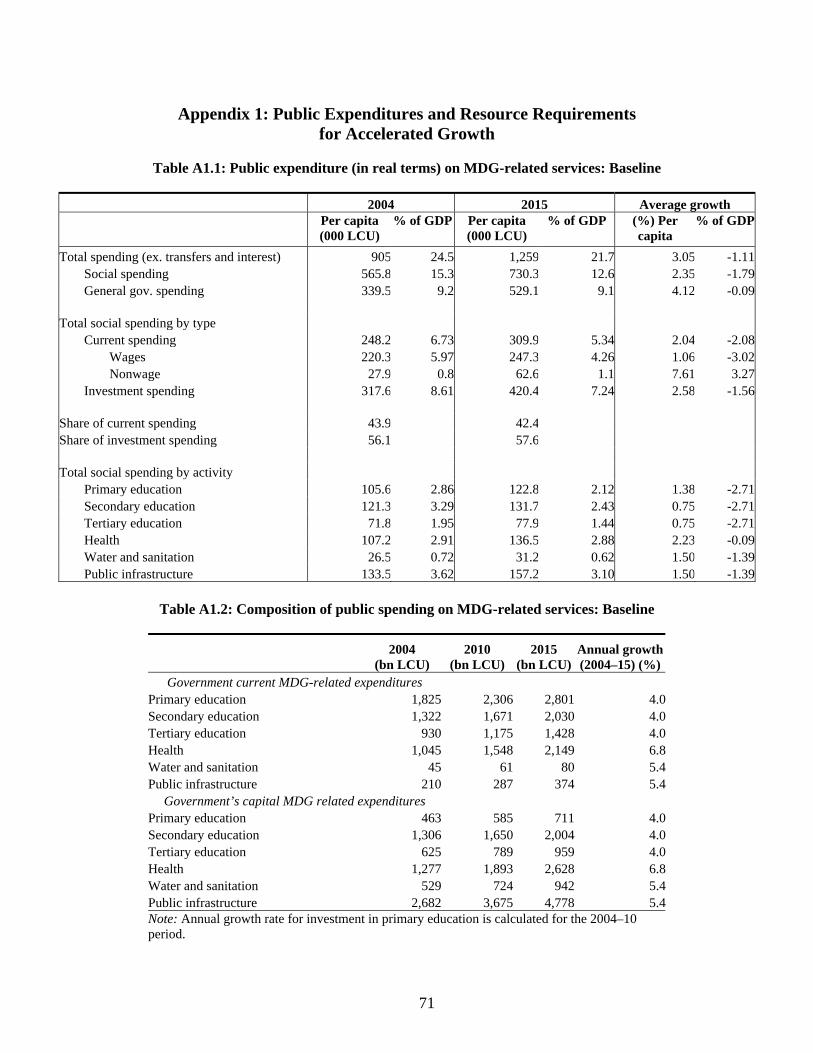
71
Appendix 1: Public Expenditures and Resource Requirements for Accelerated Growth
Table A1.1: Public expenditure (in real terms) on MDG-related services: Baseline
2004 2015 Average growth Per capita
(000 LCU) % of GDP Per capita
(000 LCU) % of GDP (%) Per
capita % of GDP
Total spending (ex. transfers and interest) 905 24.5 1,259 21.7 3.05 -1.11Social spending 565.8 15.3 730.3 12.6 2.35 -1.79General gov. spending 339.5 9.2 529.1 9.1 4.12 -0.09
Total social spending by type
Current spending 248.2 6.73 309.9 5.34 2.04 -2.08Wages 220.3 5.97 247.3 4.26 1.06 -3.02Nonwage 27.9 0.8 62.6 1.1 7.61 3.27
Investment spending 317.6 8.61 420.4 7.24 2.58 -1.56
Share of current spending 43.9 42.4 Share of investment spending 56.1 57.6
Total social spending by activity
Primary education 105.6 2.86 122.8 2.12 1.38 -2.71Secondary education 121.3 3.29 131.7 2.43 0.75 -2.71Tertiary education 71.8 1.95 77.9 1.44 0.75 -2.71Health 107.2 2.91 136.5 2.88 2.23 -0.09Water and sanitation 26.5 0.72 31.2 0.62 1.50 -1.39Public infrastructure 133.5 3.62 157.2 3.10 1.50 -1.39
Table A1.2: Composition of public spending on MDG-related services: Baseline
2004
(bn LCU) 2010
(bn LCU) 2015
(bn LCU) Annual growth (2004–15) (%)
Government current MDG-related expenditures Primary education 1,825 2,306 2,801 4.0Secondary education 1,322 1,671 2,030 4.0Tertiary education 930 1,175 1,428 4.0Health 1,045 1,548 2,149 6.8Water and sanitation 45 61 80 5.4Public infrastructure 210 287 374 5.4
Government’s capital MDG related expenditures Primary education 463 585 711 4.0Secondary education 1,306 1,650 2,004 4.0Tertiary education 625 789 959 4.0Health 1,277 1,893 2,628 6.8Water and sanitation 529 724 942 5.4Public infrastructure 2,682 3,675 4,778 5.4Note: Annual growth rate for investment in primary education is calculated for the 2004–10 period.

72
Table A1.3: Resource requirements for full achievement of MDGs fulfilled with foreign grants starting from the baseline or accelerated growth path
Year Accelerated
growth Baseline Accelerated
growth Baseline US$ bn % of GDP 2005 0.6 0.7 5.9 6.52006 0.4 0.5 3.6 4.32007 0.5 0.6 4.3 5.12008 0.7 0.8 5.1 5.92009 0.8 0.9 5.7 6.52010 1.0 1.1 6.4 7.42011 1.1 1.3 6.6 7.72012 1.3 1.5 7.5 8.62013 1.6 1.9 8.3 9.62014 2.0 2.3 9.4 10.82015 2.4 2.9 10.5 12.2Cumulative 2005-2015 12.3 14.3
Table A1.4: Growth of GDP at factor cost and sectoral components
Average yearly growth
Baseline Accelerated
growth MDG
scenario Agriculture 6.2 6.5 5.9Manufacturing 7.7 8.6 9.0Private services 7.5 8.0 8.8Public services 5.4 5.4 7.7GDP at factor costs 6.8 7.3 7.6

73
REFERENCES
Acemoglu, D., and J. Angrist, 1999. “How Large Are the Social Returns to Education?”
Al-Hassan, J.B., and D. Jatoe, 2002. “Adoption and Impact of Improved Cereal Varieties in Ghana.” Paper prepared for the Workshop on the Green Revolution in Asia and Its Transferability to Africa.
Aryeetey, E., A. Fosu, and M. Bawumia, 2001. “Explaining African Economic Growth Performance: The Case of Ghana.” Paper from the African Economic Research Consortium workshop organized by the GoG with support from DFID.
Aryeetey, Ernest, Augustin K. Fosu, 2006, “Economic Growth in Ghana: 1960-2000,” draft working paper, World Bank.
Asiedou, E., 2002, On the determinants of foreign direct investment to developing countries: Is Africa different? World Development. Vol. 30 (1):107-19.
Barro, R., and J-W. Lee, 2000. “International Data on Educational Attainment Updates and Implications.” NBER Working Paper Series No. 7911:1-36.
Barro, R., and X. Sala-i-Martin,. 1995. Economic Growth. New York: McGraw-Hill.
Bosworth, B.P., S. M. Collins, 1996. “Economic Growth in East Asia: Accumulation versus Assimilation.” Brookings Papers on Economic Activity, No. 32: 135-203.
Bosworth, B.P., S. M. Collins, 2003. “The Empirics of Growth: An Update”. Brookings Papers on Economic Activity.
Bussolo, Maurizio and Denis Medvedev, 2005. “Millenium Development Goals for Honduras: Current Achievements and Forthcoming Challenges,” World Bank, draft paper (September).
Coulombe. H., and Q. Wodon, 2007, Poverty, Livelihoods and Access to Basic Services in Ghana, in World Bank, Ghana: Meeting the Challenge of Accelerated and Shared Growth (Country Economic Memorandum), Volume 3, Washington, DC.
Diao, Xinshen, 2005. “Analyzing Growth Options and Poverty Reduction in Ghana: Preliminary Results of an Economy-wide Multimarket model of Ghana 1999-2015.” Development Strategy and governance Division, International Food Policy Research Institute (IFPRI).
Dollar, D., and A. Kraay, 2001. “Growth Is Good for the Poor.” Journal of Economic Growth 7 (3): 195-225.
Easterly, W., and R., Levine, 2001. “It’s Not Factor Accumulation: Stylized Facts and Growth Models.” World Bank Economic Review 15 (2): 177-219.
El Badawi and Kaltani, 2007. Chapter 4 of Volume 2 of the Ghana CEM.
74
Fan, S., P. B. R., Hazell, and S. Thorat, 1999. “Linkages between government spending, growth, and poverty in rural India.” No. 110, Research reports from International Food Policy Research Institute (IFPRI)
Fedderke, Johannes, 2005, Source Africa, Sources and Constraints of Long-Term Growth, 1970-2000, African Region Working Paper Series, No. 94, World Bank.
Fischer, S., 1993. “The Role of Macroeconomic Factors in Growth.” Journal of Monetary Economics 32: 485-512.
Frazer Garth, 2001. “Linking Firms and Workers: Heterogeneous Labor and Returns to Education”. Yale University.
Ghana Living Standards Survey, 1991/92, 1998/99 and 2005–06.
Government of Ghana, 2006. The Budget Statement and Economic Policy, November 16. 2006.
World Bank and DFID, 2005. Ghana: Natural Resource Management and Growth Sustainability, DFID and ISSER, June, World Bank.
Ghosh, R. Swati, and A. Kraay, 2000. “Measuring Growth in Total Factor Productivity.” PREM Note #42, World Bank, Washington, D.C.
Glewwe, Paul. The Economics of School Quality Investments in Developing Countries: An Empirical Study of Ghana. Houndmills, U.K.: Macmillan Press, 1999.
Hausmann, Ricardo, Dani Rodrik, and Andres Velasco (2004). “Growth Diagnostics,” Harvard University, Cambridge.
Heston A., R. Summers, and A. Bettina, 2002. Penn World Table Version 6.1. Center for International Comparisons at the University of Pennsylvania (CICUP), Pennsylvania.
Hulten, C.R., Dean, E.R., Harper, M.J., (2001). New Development in Productivity Analysis. National Bureau of Economic Research. Studies in Income and Wealth, Vol. 63.
IMF, 2007. Ghana: 2006 Article IV Consultation Discussions, IMF, Washington D.C.
ISSER, 2007. “Shared and Inclusive Growth in Ghana,” paper
Johnson, Simon, Jonathan D. Ostry, and Arvind Subramaniam, 2007. The Prospects for Sustained Growth in Africa: Benchmarking the Constraints,” IMF Working Paper WPS 07/52, IMF, Washington D.C.
Kaufmann D., A. Kraay, and M. Mastruzzi, 2005. Governance Matters IV: Governance Indicators for 1996-2004. World Bank.
Klenow, P., and A. Rodriguez-Clare,. 1997. “The Neoclassical Revival in Growth Economics: Has it Gone Too Far?” NBER Macroeconomics Annual 12: 73-103.
75
Klinger, B. and D. Lederman, 2004. “ Discovery and Development: An Empirical Explanation of “New Products”. World Bank Policy Research Working Paper No. 3450, November.
Levine, R. and D. Renelt, 1992. “Sensitivity Analysis of Cross-Country Growth Regressions.” American Economic Review 82: 942-63.
Lumbila, Kevin, 2007 “A Note on Growth Diagnostics for Ghana,” World Bank.
Mankiw, G., D. Romer, and D.Weil, 1992. “A Contribution to the Empirics of Economic Growth.” Quarterly Journal of Economics 107: 407-37.
Ndulu, B., S. O’Connell, 2000. "Africa's Growth Performance: A Focus on Sources of Growth". AER/Harvard African Growth Conference, Cambridge, MA.
Ndulu, Benno J., Chakraborti, Lijane, Ramachandran, and Wolgin, 2006, Challenges of African Growth, Opportunities, Constraints and Strategic Directions, Advanced Edition, World Bank.
Nehru, V., and A. Dhareshwar, 1993. “ A New Database on Physical Capital Stock: Sources, Methodology and Results.” Revista de Analisis Economico (Chile) 8:37:37-59.
Overseas Development Institute,2005. Economic Growth in Northern Ghana: Revised Report for DFID Ghana. Accra, London (October).
Pattillo, Catherine, Sanjeev Gupta and Kevin Carey, 2006, “Sustaining and Accelerating Pro-Poor Growth in Africa,” IMF Special Issues Paper (Washington: International Monetary Fund).
Poirson, H., 1998. “The Impact of Intersectoral Labor Reallocation on Economic Growth.” Journal of African Economies, Vol. 10., # 1, p. 37-63.
Ramey, G., and V. Ramey, 1995. “Cross-Country Evidence on the Link between Volatility and Growth.” American Economic Review 85: 1138-51.
Sacerdoti, E., S. Brunschwig, and J. Tang, 1998. “ The Impact of Human Capital: Evidence from West Africa. IMF Working Paper # 98/162.
Savadogo, K., Coulibaly, S. and C. McCracken, 2004. Analyzing Growth in Burkina Faso over the Last Four decades. Growth Working Paper No. 4, African Economic Research Consortium.
Tahari, A., D. Ghura, B. Akitoby, E. B. Aka, 2004. ”Sources of Growth in Sub-Saharan Africa.” IMF Working Paper # 04/176.
Temple, J., 1999. “The New Growth Evidence”. Journal of Economic Literature 37 (1): 112.
Tsikata, Yvonne M., 2001. “Ghana,” chapter 2 in Shantayanan Devarajan, David R. Dollar and Torgny Holmgren (eds.) Aid and Reform in Africa, World Bank, Washington D.C. 2001.
World Bank, 2003. Ghana - Land Administration Project. Project Appraisal Document.

76
_____. June 2004. Mauritius the New economic Agenda and Fiscal Sustainability. Report No. 26152-MU
_____. December 2004. Botswana toward Prosperity for All, a comprehensive development framework profile. Number 34145.
_____. December 2005. Joint Assistance Strategy for the Repubic of Uganda. Report No. 34310-UG
_____. (2005a). Ghana: Natural Resources Management and Growth Sustainability. Country Department 10, Africa Region.
_____. (January 2005). Country Assistance Strategy for the Republic of Cape Verde.
_____. (September 2005.). Mozambique Country Economic Memorandum. Report No. 32615-MZ.
_____. (2006). “The Scaling Up Agenda: Aid Commitments, Effectiveness and Early Opportunities for Scaling Up,” Staff presentation to the World Bank Board of Executive Directors, SecM2006-0371, August 31, 2006.
_____. (2003). “Ghana: Reducing Poverty and Improving Human Development.” Green cover report No. 26220-GH, June 13, 2003.
_____. (2006). Ghana–2006 External Review of Public Financial Management (Vol. 1 of 2).
_____. (2007). Ghana–2006 External Review of Public Financial Management (Vol. 1 of 2).
_____. (2007). Global Monitoring Report 2007, Millennium Development Goals: Confronting the Challenges of Gender Equality in Fragile States, Washington, D.C.
_____. (forthcoming). Building the Demand-side of Good Governance: Enhancing Conditions for Social Accountability in Ghana.
World Bank and IMF, 2006. The Republic of Ghana: Joint IDA-IMF Staff Advisory Note of the Growth and Poverty Reduction Strategy and 2004 Annual Progress Report. Report No. 3567-GH, April 21, 2006.
Young, A., 1995. “The Tyranny of Numbers: Confronting the Statistical Realities of the East Asian Growth Experience.” Quarterly Journal of Economics 110:641-80.
77
Annex 1: Managing Oil Revenues: Ghana’s Future Challenge and Lessons of Experience
1. Background. At the June 2007 Consultative Group meeting, President Kufuor announced significant find of oil in Ghana that would be commercially viable in the future. When it begins to produce significant revenues, Ghana must manage those revenues prudently to avoid the “resource 2. curse” of many African resource-rich but income-poor countries. Ghana’s challenge is to learn from good international practice and put in place mechanisms and institutions ensuring good governance and management of oil receipts before they begin to flow. 3. The oil challenge. Countries that derive a considerable portion of their revenue from exploiting non renewable resources such as hydrocarbons typically face two problems: the revenue stream is uncertain and volatile, and it does not last forever. Volatile and uncertain fiscal revenue makes it difficult to plan expenditure and to efficiently use public resources. In order to ensure fiscal sustainability, when revenue falls sharply and unexpectedly governments often respond with expenditure cuts. This can be expensive, inefficient, and politically unpopular. In addition, it is not easy to distinguish ex-ante between a permanent and transient price shocks: oil and gas prices have been known to be mean-reverting, but the mean they revert to may not be the same over time. If the price increases substantially, a government may be under pressure to increase its spending, but it may be difficult to do it efficiently. Finally, institutions and mechanisms must be in place to use public oil resources for productive expenditures rather than pork-barrel politics. Given all these challenges, it is not surprising that the presence of substantial amounts of oil and gas reserves is often seen as a mixed blessing. 4. Lessons of experience---potential problems. The performance of economies that receive a large proportion of government revenue and export earnings from the ownership and taxation of hydrocarbon resources is often poor when compared with similar countries without such resources. Therefore, countries with future oil windfalls such as Ghana are well advised to study lessons of experience of other countries and carefully plan for the future to avoid the oil “resource curse.” The potentially negative impact of oil resources on the economy may work through a number of channels:
• The real exchange rate appreciation and misalignment. Oil exports lead to foreign exchange inflows, which can have large economic effects that have been termed ‘Dutch disease’ in the economics literature. The term describes the effects that a real exchange rate appreciation, defined as the increase in the price of non-traded goods (e.g. services) over the price of tradable goods (non-oil exports such as agricultural commodities and manufactured goods) can have on domestic resource allocation and spending patterns. Real exchange rate appreciation can lead to a shift in the economic structure of a country away from the production of goods for exports, into the non-tradable sector, while consumption increasingly absorbs imported goods, resulting in deteriorating external account balance. Some oil exporting countries have experienced sectoral unemployment, as greater specialization in oil left traditional industries, such as agriculture, in secular decline. This may lead to a loss of economic diversification.

78
• Lack of domestic absorption capacity. Economies may lack sufficient current opportunities for domestic investment or consumption expenditure that provide the same current benefits as financial investment. Excessive levels of domestic spending, relative to the available capacity to produce, will result in an increase in prices of nontradable goods.
• Weak governance of public spending. Substantial amount of the new oil and gas revenue may result in higher budgetary expenditure but the ability of the civil service to manage such large and sudden expenditure increases may be limited. Poor choice of projects, lax contracting procedures, and weak project oversight could lead to a poor performance in terms of the outputs from public expenditures.
• Increased corruption. The oil windfall may also increase incentives for unproductive rent-seeking, and misuse of public resources for private gain—corruption. These may, for example, occur in the contracting procedures for projects or even in the diversion of resource payments due to the treasury. Widespread corruption weakens the investment climate and the economy’s attractiveness for foreign investments and can result in a steady erosion of the country’s economic performance.
5. Lessons of experience—good practices. Although natural resource revenues can lead to deteriorating economic performance, this is not inevitable. Some producing countries appear to have avoided many these problems: Botswana, Chile, and Malaysia offer some recent examples. Norway, one of the richest small countries in the world, has also managed its oil resources well for a long time. From their experience, the following tentative lessons can be derived:
• Stabilizing expenditure. The potential volatility of oil revenues, relative to the expected path determined by projected production levels and oil prices, can be very large. Governments have to face the possibility that their planned spending programs may have to be suddenly changed. Because it is difficult and costly to suddenly cut back spending on current items, or to halt a public investment project, there is a strong incentive to adopt a strategy that can provide a fairly smooth government expenditure scheme. This requires a stabilization approach in which a share of revenues is set aside at times of higher-than- average expected receipts, which can be used to supplement current revenues in times of below-average receipts. There are various institutional mechanisms for operationalizing this approach but the principle is important for policy.
• Saving for the future. The resource revenues from the production of oil and gas are only temporary, with their duration dependent on the size of reserves, the rate of extraction, and future prices. To achieve intergenerational equity and ensure that benefits accrue to all citizens of the country, both present and future, the revenues should generate future earnings streams. Saving part of the revenues and obtaining a return from their investment in financial instruments, or from reducing gross public debt, can be the most effective way of providing benefits for future generations and future needs of current generations, such as pension payments. Furthermore, investing abroad may also help sterilize the impact of the receipts on the domestic economy and help avoid the Dutch disease effect.
• Hedging against extraordinary events. In addition to “normal” volatility of revenues, a country may also be subject to extraordinary shifts in the fiscal situation. Unexpectedly

79
large needs for current expenditures (for example, following a natural disaster) or unexpected loss of revenue of a magnitude beyond that normally experienced in volatile markets (for example, following an environmental disaster or civil disturbance requiring shutdown of facilities, or war) face the government with an urgent need for extra financing. Accumulated resources, possibly held in a fund, can provide a precautionary cushion against such incidents.
• Defining the level of public expenditure on the basis of sustainable rate/capacity growth. Where economies lack sufficient current opportunities for domestic investment or consumption it may be better to partially restrict public spending until the capacity of the economy to respond has improved. This decision is often particularly difficult for newly oil-producing developing countries that have great needs for public spending, but very little capacity to produce that extra output in the short run. Popular sentiment may push the government to be seen to spend the newly acquired revenue, even though its benefits may be rather limited.
6. Considering a resource fund. To achieve these objectives many countries have chosen to use non-renewable resource funds dedicated to these purposes, which tend to be transparent and also help to sterilize some of the inflow of foreign exchange, thus leading to less pressure on the domestic economy. Countries’ experiences shows that non-renewable resource funds are best created after the discovery of the resource but before revenues from it have started to flow. This is because the size and distribution of revenue over time is an important element in defining the most suitable fiscal and revenue management policy, hence the opportunity for and objective of such a fund. In addition, once revenues begin to flow, the government may find itself under political and social pressure to spend it immediately, and efficiency and fairness principles may become more difficult to apply. Despite its potential benefits, however, the establishment of a hydrocarbon revenue fund in and of itself does not guarantee a prudent management of the oil and gas resource wealth. However, it could serve as a useful mechanism to separate spending from the hydrocarbon production/revenue profile. Provided it supports a sustainable fiscal policy strategy and productive expenditures consistent with macroeconomic stability and institutional capacity, and sound public finance management practices, a resource fund could be a useful tool to support a strategy of saving a substantial part of the hydrocarbon revenue to ensure a long-lasting and efficient financing of poverty reduction and economic development.
80
Annex 2: Forging a Mutually Beneficial Economic Relationship with China
1. The dramatic new trend in South-South economic relations is transforming traditional patterns of economic development. This is nowhere more evident than in African-Chinese trade and investment flows. Ghana’s trade with China, in particular, has grown extremely rapidly since 1995, with exports to China growing at 22 percent and imports from China growing at 36% per year. As of 2005, the trade between the two countries totaled $827 million, up from only $83 million in 1995. Ghana’s trade deficit with China has also grown rapidly and reached $650 million in 2005. Chinese investment in Ghana, however, is relatively small compared to that of other traditional investors, but is also growing rapidly.
2. The trade development between Ghana and China is driven by the economic complementarities. China has demand for Ghanaian natural resources, while Ghana has demand for inexpensive Chinese manufactured products, machinery and equipment. Although China increasingly imports from Africa labor-intensive raw or semi-processed agricultural commodities for further raw processing, such as timber, cotton and food products, Ghana’s export has not been diversified enough to take advantage of this opportunity. A good example of this is China’s new demand for imported chocolate, which has more than doubled in the last decade. Ghana, however, still exports only cocoa beans to China.
3. In recent years, the globalized market has witnessed a rise of trade in intermediate goods, parts and components, which constitutes a fundamental shift in the structure of the world trading system. Looking toward the future, the prospects for Ghana to engage in this producer-driven network trade are much greater if it succeeds in attracting substantial FDI by firms already plugged into such networks. Increasingly, Chinese firms have these attributes. The fear, however, is also real, that the economic relationship between Ghana and China will become one sided, with Ghana serving merely as a resource base and market for China’s growing economy. While China would need to do its part in addressing trade barriers, and technology transfers and employment generation of its FDI to Ghana, Ghana needs to provide the right mix of policies that will enable it to export products with medium and high level of labor and technology contents to not only Chinese markets, but also to the global production network and market.
4. Ghana has enjoyed a strong diplomatic relationship with China since its independence. This relationship has been further enhanced in recent years by high level government official visits and various treaties and agreements on the promotions of trade and investment between the two countries, as well as on the additional financial aid from China to Ghana. The two governments have also agreed for China to send more specialists to work in Ghana and to provide more scholarships for Ghanaian students to study in China. So far, China delivers its development assistance mainly through bilateral channels, although it is increasingly looking into multilateral options as well. Ghana has an opportunity to become a strong economic partner with China, given its 50 years of development experience and the increased awareness that the only sustainable economic relationship between countries is a mutually beneficial one.
Source: Harry Broadman, 2007, Africa’s Silk Road, China and India’s New Economic Frontier, World Bank WITS database, IMF Trade of Direction Database, and varies journal resources.