Report No. 373-PAK Pakistan Appraisal of Multan Fertilizer Expansion ... · PDF fileReport No....
185
Report No. 373-PAK FILE Copy Pakistan Appraisal of MultanFertilizer Expansion Project April 3, 1974 Industrial ProjectsDepartment Not for Public Use Document of the International Bank for Reconstruction and Development International DevelopmentAssociation This report was prepared for official use only by the BankGroup. It may not be published, quoted or cited without Bank Group authorization. The BankGroup does not accept responsibility for the accuracyor completeness of the report. Public Disclosure Authorized Public Disclosure Authorized Public Disclosure Authorized Public Disclosure Authorized
Transcript of Report No. 373-PAK Pakistan Appraisal of Multan Fertilizer Expansion ... · PDF fileReport No....

Report No. 373-PAK FILE CopyPakistanAppraisal ofMultan Fertilizer Expansion ProjectApril 3, 1974
Industrial Projects Department
Not for Public Use
Document of the International Bank for Reconstruction and DevelopmentInternational Development Association
This report was prepared for official use only by the Bank Group. It may not be published,quoted or cited without Bank Group authorization. The Bank Group does not accept responsibilityfor the accuracy or completeness of the report.
Pub
lic D
iscl
osur
e A
utho
rized
Pub
lic D
iscl
osur
e A
utho
rized
Pub
lic D
iscl
osur
e A
utho
rized
Pub
lic D
iscl
osur
e A
utho
rized

CURRENCY EQUIVALENTS WEIGHTS AND NWASURES
Except where otherwise indicated All units are metric., except gasall figures are quoted in Pakistan volume which is in cubic feet.Rupees (PRs).
PRs 1.0 US$0.10 1 Metric Ton (t) = 1,000 Kilograms (Kg)PRs 9.90 US$1.00 1 Metric Ton (t) = 2,204.6 PoundsPRs 1 million US$101,010 1 Kilometer (km) = 0.62 miles
1 Hectare = 2.47 acres1 Cubic Meter = 35.3 cubic feet
PRINCIPAL ABBREVIATIONS AND ACR0NY1S USED
ANL Ammonium Nitrate Limestone (26-0-0, i.e. 26% Nitrogen)CAN Calcium Amonium Nitrate (26-o-o, i.e. 26% Nitrogen)DAP Diammonium Phosphate (18-46-0, i.e. 18% Nitrogen, 46% P205)K20 (abbrev. K) Potassium Oxide, the Indicator of Potassium Content of
FertilizerMAP Mono-Ammonium Phosphate (11-55-0, i.e. 11% Nitrogen,
<5% P2o5)N Nitrogen, the Indicator of Nitrogen Content of FertilizerNP Nitrophosphate (23-23-0)P2O5 (abbrev.P) Phosphorus Pentoxide, the Indicator of Phosphorus Content
of FertilizerTSP Triple Super Phosphate (0-46-0, i.e. 46% P205)
KWH Kilowatt HourMCF Thousand Standard Cubic FeetPPm Parts per Milliontpd Metric Tons per Daytpy Metric Tons per Year
ADB Asian Development BankA.^OC Abu Dhabi National Oil CorporationDH Dawood Hercules Chemicals LimitedGOP, Government Islamic Republic of Pakistan, The GuarantorIFC International Finance CorporationNFC National Fertilizer CorporationNGFF Natural Gas Fertilizer CorporationPASC Punjab Agricultural Supplies CorporationPFL Pakarab Fertilizers Limited, The BorrowerSNGPL Sui Northern Gas Pipelines LimitedWPIDC West Pakistan Industrial Development Corporation
FISCAL YEAR
July 1 - June 30 for NGFFJanuary 1 - December 31 for PFL
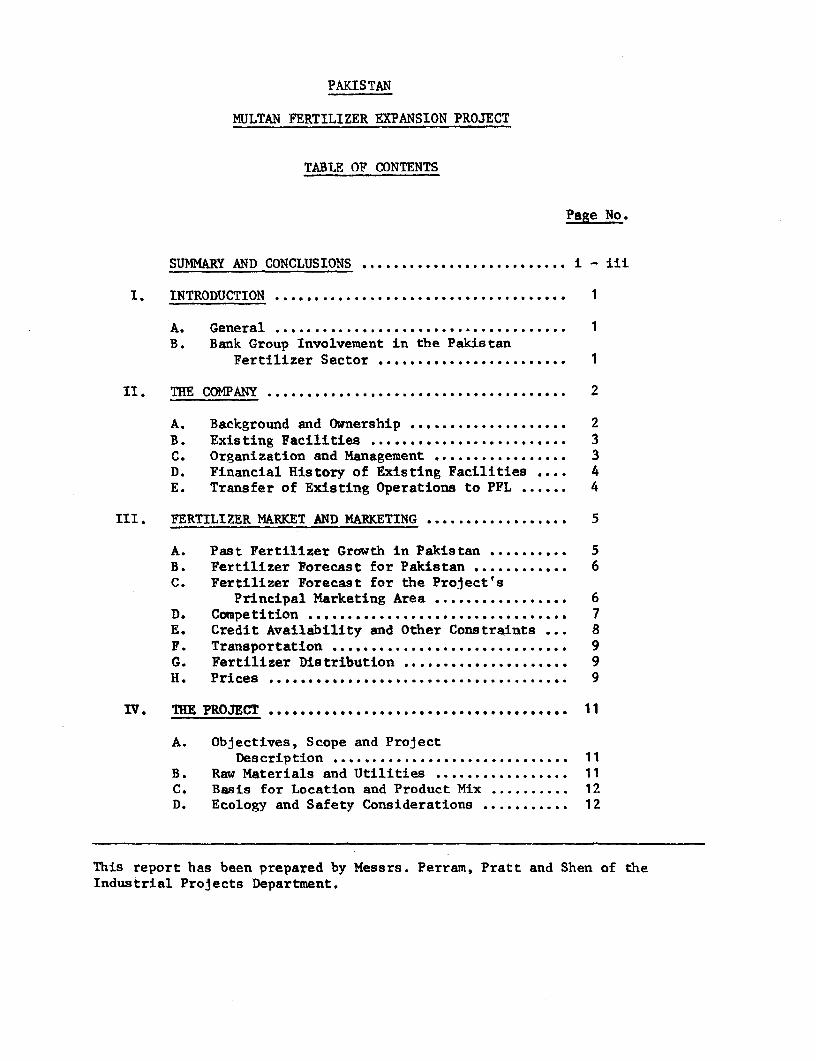
PAKISTAN
MULTAN FERTILIZER EXPANSION PROJECT
TABLE OF CONTENTS
Page No.
SUMMARY AND CONCLUSIONS ........................ i - i
I. INTRODUCTION ................. 1............
A. General ..................... 1B. Bank Group Involvement in the Pakistan
Fertilizer Sector .. ......
II. THE COMPANY .............................. 2
A. Background and Ownership ..... ............... 2B. Existing Facilities ...... ................... 3C. Organization and Management ..... ............ 3D. Financial History of Existing Facilities .... 4E. Transfer of Existing Operations to PFL ...... 4
III. FERTILIZER MARKET AND MARKETING ............ ... 5
A. Past Fertilizer Growth in Pakistan .... ...... 5B. Fertilizer Forecast for Pakistan .......... 6C. Fertilizer Forecast for the Project's
Principal Marketing Area ................ . 6D. Competition ................................... 7E. Credit Availability and Other Constraints ... 8F. Transportation .... .......................... 9G. Fertilizer Distribution ..... ................ 9H. Prices . . . . . . . . . . . ...................... . . 9
IV. THE PROJECT ... 1..............1
A. Objectives, Scope and ProjectDescription ......... 11
B. Raw Materials and Utilities ............... .. 11C. Basis for Location and Product Mix .......... 12D. Ecology and Safety Considerations ........... 12
This report has been prepared by Messrs. Perram, Pratt and Shen of theIndustrial Projects Department.

TABLE OF CONTENTS (Cont'd)
Page No.
E. Labor Force and Training .................... 13P. Project Implementation, Procurement and
Construction ............................. 13
V. CAPITAL COST AND FINANCING PLAN .................. 14
A. Project Cost ......... 4. .......... ............ 14B. Working Capital .............................. 16C. Financing Plan ....... ..... .................. 16D. Allocation and Disbursement ... .............. 17
VI. FINANCIAL ANALYSIS OF THE PROJECT ......... ....... 19
A. Basis of Analysis ............... ... ....... . 19B. Operating Costs and Revenues ............... . 19C. Financial Indicators .... .................... 21D. Profitability and Financial Return ........ . 21E. Financial Position, Debt Service Coverage
and Financial Covenants ................ .. 22F. Major Risks .............. ................... 24
VII. ECONOMIC ANALYSIS ................... ... 24
A. International Fertilizer Prices ............. 24B. Economic Rate of Return .... n................. 25C. Foreign Exchange Savings .................... 25D. Other Economic Benefits ....... .............. 26
VIII. AGREEMENTS REACHED WITH THE GUARANTOR, NATIONALFERTILIZER CORPORATION AND THE BORROWER .......... 26

TABLE OF CONTENTS (Cont'd)
ANNEXES
1-1 Glossary of Technical Terms1-2 Alternative Project Scope Studies1-3 Dawood Hercules Results1-4 Fauji Foundation Urea Project
2-1 Sponsors and Management2-2 Financial Statements - Existing Plants
3-1 Agricultural Sector in Pakistan3-2 Fertilizer Industry in Pakistan3-3 Fertilizer Distribution, Credit, Prices and Transportation
4-1 Project Description4-2 Production Flow Chart4-3 Production Processes4-4 Plant Layout4-5 Raw Materials4-6 Environmental Protection and Safety4-7 Project Schedule
5-1 Capital Cost Estimate5-2 Working Capital Requirements5-3 Projected Disbursement of Bank Loan
6-1 Production Costs6-2 Financial Forecasts6-3 Financial Return and Sensitivity Tests6-4 Break-Even Chart
7-1 Economic Return and Sensitivity Tests7-4 Foreign Exchange Savings
MAP
Present and Proposed Fertilizer Plants in Pakistan (IBRD 10818)


PAKISTAN
MULTAN FERTILIZER EXPANSION PROJECT
SUMMARY AND CONCLUSIONS
i. This report appraises the proposed expansion of the Government-owned Natural Gas Fertilizer Factory (NGFF) operated by the National FertilizerCorporation (NFC) at Multan in the Province of the Punjab. NGFF has producedurea and ammonium nitrate limestone since 1962 from natural gas from the Suigas field. To cater to the growing fertilizer requirements of the country,NFC will buiild a large new ammonia plant with a daily capacity of 910 tons-- thereby allowing it to shut down the existing small and obsolete ammoniaunits. The ammonia will feed the existing fertilizer plants as well as newfertilizer units which are to produce high water soluble nitrophosphate (1,020tons/day) and calcium ammonium nitrate (1,500 tons/day). A new company,Pakarab Fertilizer Ltd. (PFL) to be owned 70% by NFC and 30% by the Abu DhabiNational Oil Corporation (ADNOC), has been formed and will be the Borrower.The expansion, which will also be based on Sui gas and which will increasePakistan's annual fertilizer production by about 200,000 tons of nitrogen(N) and 70,000 tons of phosphate in terms of P20 , is expected to cost PRs928 million (US$94 million). Engineering work started in February 1974 andthe project is to be completed by the end of 1976.
ii. The Bank's only direct financing of industry in Pakistan to datehas consisted of a US$32 million loan in 1968 (together with an IFC investmentof US$2.9 million) for the Dawood Hercules Chemicals (DH) ammonia/ureafertilizer project, also located in the Punjab near Lahore. Constructionwas completed on schedule in July 1971 and was achieved with only a minorcost overrun, primarily due to increases in customs duties. DH has rapidlyattained and been able to sustain over 100% rated capacity production. Inappraising the DH project, the Bank pointed out the critical importance ofbalancing nitrogen with phosphatic fertilizers. The Multan project will helpto achieve this aim. No additional fertilizer plants have be en built inPakistan recently but other projects are now being planned, one of which -an ammonia/urea plant sponsored by the Pauji Foundation of Pakistan - IFC hasbeen asked to assist.
iii. Fertilizer consumption has increased rapidly in Pakistan since theearly 1960's. Sales of nitrogenous fertilizers went up from 41,000 nutrienttons in 1962/63 to about 400,000 tons in 1972/73, somewhat above the projec-tions made in the DH appraisal report. The rapid growth in fertilizer con-sumption has been due largely to the greater awareness of the benefits offertilizers among the farmers and to the Government's effort to increase itsavailability. With regard to future use of fertilizers, it is estimated thatby about 1980 demand will reach some 875,000 nutrient tons for nitrogenousand 220,000 nutrient tons for phosphatic fertilizers. Pakistan's productionincluding the expanded Multan plant and the Fauji project, is expected toamount to about 700,000 nutrient tons of N and 80,000 nutrient tons of P 0The project therefore is particularly urgent. Since nitrophosphate fertilizers

- ii -
arec -r-elatively new to the farmers in Pakistan, the Government has agreed toimport such fertilizers for promotional purposes prior to the completion ofthe project.
iv. The Gcvernment of Pakistan has asked IBRD and the Asian DevelopmentBank (ADB) for loans of US$35 and 27 million equivalent respectively; theUS$40 million balance of the US$102 million financing required will be coveredb,7 equity from NFC and ADNOC and local loans. The proposed Bank loan willf3nviace the cost of equipment and spares for the amonia plant and utilities,r-he f_i> fer related engineerirg and the technical advisor. The loan will befor 15 years, including four years of grace, with an effective interest rateto PFL of 9-1/2% per annum, including a guarantee fee accruing to the Govern-ment. The Bank loan will meet about 40% of the cost of the project or about50% of its foreign exchange needs. The balance of the foreign exchange expen-ditures will be covered by the ADB loan to be used primarily for the nitricacid and nitrophosphate plants, and by a portion of the equity, which is alsoto finance local expenditures. No cash generation from the existing planthas been assumed in the financing plan. Although not many local suppliersare expected to qualify for the type of equipment to be financed by the Bank,they will be allowed a preference of 15% or the customs duties for a non-exemptimporter whichever is lower.
v. The objectives of the project are: (1) to provide an economic-sizedplant (based on modern proven technology new to Pakistan) to help meet thecountry's phosphate needs, now met mostly by limited imports; (2) to avoidforeign exchange expenditures for imported sulfur by using nitric acid madefrom Pakistan natural gas instead of sulfuric acid; and (3) to supply nitrogento reduce the dependence on expensive, often hard to obtain, imports. Theproject is not designed to meet all of Pakistan's nitrogen and phosphateneeds as other urea plants and an additional phosphate plant are planned tocomplement the expanded Multan production at appropriate future intervals.
vi. The project is designed to assist Pakistan to utilize more fullyat an economic cost its agricultural potential particularly in the Punjab, itsmost fertile agricultural area. Pakistan's agronomic potential for fertilizerusage would be greater than assumed in this report were it not for constraintssuch as credit, water, seeds, pesticides, and shortage of foreign exchangefor imports. As in the past, insufficient production in the short run willcontinue to be the most serious handicap to more rapid increases in Pakistan'sagricultural output.
vii. The project has been developed with the assistance of a competentPakistani firm of chemical consultants. The project's Managing Director andGeneral Manager (Project) have been appointed. The Bank has emphasized theimportance of forging a strong and effective team to carry out the projectand has stressed the need for an experienced industrial management to thisend. PFL has appointed a qualified firm with nitrophosphate experience as"owner's representative"i or technical advisor to assist the project's manage-ment during construction and uatil all units can be run on a sustained basis

- iii -
of at least 90% of capacity without further outside assistance. The exist-ing plant currently employs a total of 1,700 workers including 42 technicaland 20 non-technical supervisors. Due to a substantial excess of labor atthe plant at present, no additional workers will be required for the expandedplant.
viii. The project's capitalization, based on about 64/36 debt/equityfinancing provides a sound basis. As the loans are repaid and reservesbuilt up out of earnings, the company's financial position will furtherimprove and further expansion should be possible. A satisfactory return onthe equity is sought by the Government as well as the shareholders to attractadditional capital to the fertilizer industry. To ensure PFL's financialviability, the Bank obtained agreement that the Government will not set: ferti-lizer prices at a level which would prevent PFL from reaching the earningstarget set by its shareholders, i.e., a 15% return on equity. Projectedcash generation for long-term debt service coverage is adequate. The finan-cial return, using an increased gas cost to take into account the returnrequired by the gas supply company (Sui Northern Gas Pipelines Ltd.), isestimated to be 23% before tax and 17% after tax. Even under adverse condi-tions, the financial return is not expected to drop below 10%.
ix. The project's estimated economic return is 34%, reflecting thecompetitive advantage of local production from indigenous gas compared tolong-term import prices (assumed in the report to be about 50% of currenthigh world market prices). Based on foreseeable adverse factors such asincreased gas, phosphate rock and bag costs not fully offset by higherprices, and a maximum production of 80% of capacity, the economic returnwould still be above 20%. Annual net foreign exchange savings ascribed tothe project at 90% capacity are estimated to be US$50 million.
x. Based on agreements reached as summarized at the end of the report,the project is suitable for a Bank loan of US$35 million equivalent.


I. INTRODUCTION
A. General
1.01 The Government of Pakistan has requested a Bank loan of US$35million equivalent for a project which is expected to cost US$94 millionequivalent and which is to increase more than five-fold the capacity of therather small and partly outdated Multan nitrogenous fertilizer unit of theGovernment-owned National Fertilizer Corporation (NFC). The Asian Develop-ment Bank (ADB) has agreed to lend US$27 million for the project and thebalance will be financed with equity and rupee loans on terms satisfactoryto the Bank. The proposed Bank loan would be made to Pakarab FertilizersLimited (PFL), a newly formed company owned by NFC (70%) and the Abu DhabiNational Oil Corporation (ADNOC) (30%) and would be guaranteed by Pakistanand NFC. The project, based on indigenous natural gas and imported phosphaterock would increase capacity by 306,000 tons per year (tpy) of nitrophosphate 1/(NP) and 450,000 tpy of calcium ammonium nitrate (CAN) 2/ and provide 57,000tpy of ammonia for the existing plant. Upon completion of the project theMultan fertilizer unit would have a total capacity of about 240,000 tpy ofnitrogen (N) and 70,000 tpy of phosphate (P205). Detailed engineeringcommenced in February 1974 and commercial production is scheduled to startby January 1977.
1.02 Multan, located in the center of the Punjab province, Pakistan'sprime agricultural area (IBRD MaplO818), is one of three NFC fertilizer units.The plant began production in 1962 and has never operated at full capacitydue to technical difficulties in the ammonia section. However, despitethese difficulties and the sub-economic size of most plant units, the factoryhas shown a profit in most years by virtue of subsidies paid by the provincialand central governments.
1.03 The project was first reviewed by the Bank in mid-1972 and alter-native projects (Annex 1-2) were evaluated by local consultants (ChemicalConsultants Pakistan, Ltd.) in early 1973 at the Bank's request. The proj-ect of the scope and size now proposed resulted from these comparativestudies.
1.04 The appraisal was carried out in Pakistan in September/October 1973by Messrs. Perram (Chief), Pratt and Shen of the Industrial Project Departmentconcurrently with an ADB appraisal mission.
B. Bank Group Involvement in the Pakistan Fertilizer Sector
1.05 The proposed loan would be the Bank's second for a fertilizer projectin Pakistan; the first loan of US$32 million equivalent together with an IFCequity investment of US$2.9 million was made in July 1968 to Dawood Hercules
1/ A Glossary of Technical Terms is contained in Annex 1-1.
2/ Equivalent to 187,000 tpy of N and 70,000 tpy of P as P 02 5

-2-
5he :llS6 11 (D) for their 620/1,100 tpd ammonia/urea plant (Report AA-4a datedJune 2C 8.6`). D. began production in July 1971 virtually on schedule andwithin the original foreign exchange budget. The plant reached rated capacityin record time and has been operating above capacity on a sustained basis.Local ca?itai costs were higher than estimated due primarily to increases incustom duties. Currency revaluations also increased the amount of the dollarequivaient of 4he Bank loan disbursemenlts to over US$35 million equivalentres:lting in a total cost of US$84.6 million versus the original US$78.2million estimate. Annex 1-3 describes the DH results to date.
1.06 At the time of the DH loan the Bank was considering a second similarfertilizer project to meet Pakistan's growing nitrogen needs. Due to avariety of factors including failure of the local and foreign partners toreach sntisfactory agreements between themselves and the Government, theGovrernment sanction expired. Since then no major fertilizer project hasboen implemented in Pakistan except DH. IFC is now considering anotherammonia/urea project sponsored by Pakistan's Fauji Foundation and the Bankmay also be asked to participate in the financing (Annex 1-4).
II. THE COMPANY
A. Background and Ownership
2.01 The project will be carried out by PFL, which has an authorizedcapital of PRs 1,000 million (US$101 million). The 70% owner, NFC, is agovernment agency whose primary purpose is to operate and promote fertilizerproduction in the public sector. It succeeded the West Pakistan IndustrialDevelopment Corporation (WPIDC) vhich grew into a large complex organization,having until recently operational responsibility for most of the 59 projectsit Promoted; it is now gradually divesting itself of these operational respon-sibilities in line with a reorganization announced in August 1973 and intendsincreasingly to play the role of a development corporation. WPIDC has notreceived any financing from the Bank. During construction of the project,NFC will exercise control over PFL through its majority on the PPL Board butit is anticipated that once PFL is operational the relationship will becomethat of a holding company to one of its investments. NFC has agreed to guar-antee the proposed Bank loan and not to dispose of any of its shares in PPLwithout Bank approval. In March 1973, ADNOC, the Abu Dhabi Government'snational oil corporation, agreed to acquire 30% of the equity of the new ferti-lizer company. ADNOC's interest in investing in a fertilizer plant in Pakistanis in accordance with an agreed plan of mutual cooperation between Pakistanand Abu Dhabi in certain ventures, including joint investments in industry,particularly oil refineries. ADNOC's role as a minority shareholder is clearlyone of an investor; the promotion, financing, organization and implementationof the project is being left to NFC. Annex 2-1 describes the sponsors, theinitial Board, the senior officers and L a organization chart.

-3-
B. Existing Facilities
2.02 These comprise two 100 tpd ammonia plants plus downstream unitsfor making 180 tpd crystalline urea, 200 tpd nitric acid (100% basis) and300 tpd ammonium nitrate-limestone (ANL-26% N). Offsites include boilers,water treatment and cooling, storage buildings, offices and a housing colony.The ammonia plants have never averaged more than about 80% of their capacityon a sustained basis and require excessive maintenance. Conversely, thedownstream units have worked well and can achieve 120% of design capacity,given sufficient ammonia. Consequently, as is described in more detail inconnection with the discussion of the project in Chapter IV, it is intendedto shut down the ammonia plants. PFL will keep the downstream units in opera-tion to produce, after some modification, prilled urea (46% N) and CAN (26%N). Economically produced ammonia from the project and the virtual elimina-tion of depreciation and financial charges on the existing plants is expect-ed to result in economic operation, even though the capacities are small andthe units are old.
C. Organization and Management
2.03 NFC has the right to appoint 8 and ADNOC 4 directors. PFL'sinitial Board was designated in November 1973. The full Board is beingconstituted. NFC has elected its Chairman Mr. Baber Ali as PFL's Chairmanand appointed a Managing Director who will have day to day responsibilityfor the Company's operations. The Chairman is well known to the Bank Groupand is considered to be an outstanding industrial executive with a successfulrecord in private industry. The Managing Director, Mr. Amman Ullah Loan, isthe former Technical Manager of Stii Northern Gas Pipelines, Limited. He isan engineer, well-known to Bank staff. He will coordinate the work of theTechnical Advisor, the engineering firms and the local Chemical Consultants.While he has no experience as an industrial executive, he has been associatedwith Bank financed projects and has demonstrated the drive and initiativeneeded for this new assignment. Furthermore, NFC's Chairman has been givenfreedom to offer salaries to attract experienced industrial executives, andas necessary, he will seek additional senior management with industrial experi-ence. The selected project manager, Mr. Zahur Ahmad Khan, has been with NFCand its predecessors for about 20 years and has the technical knowledge andability to direct work at the site. He also has general familiarity with theexisting facilities.
2.04 The existing plant will be operated by the present experiencedGeneral Manager, Mr. Hafizullah, under the Managing Director's control. Afterthe project is completed and operation of the old and new plants integrated,reassignments are anticipated.

D. Financial History of Existing Facilities
2.05 Detailed historical and forecast financial statements for theexisting Multan facilities without the project are contained in Annex 2-2.As the project will replace the existing ammonia units and provide the oldurea and ANL units with new ammonia, the financial history of Multan bearslittle relation to the project or PFL. Also, fertilizer price changes inPakistan in August 1973 and the up-grading of the urea product by prillinghave considerably changed the financial outlook of the existing unit.
2.06 Capacity of the existing plants is about 70,000 tpy of N based onthe 200 tpd ammonia units. However, the production since 1969 in terms ofN has been as follows:
Multan Production of Nitrogen('000 tons of N)
Year Ended June 30 1969 1970 1971 1972 1973
Urea 21 21 15 12 6
ANL 17 22 22 20 16
38 43 37 32 22
Results for 1973 were adversely affected by strikes and compressor failures.Production forecasts for the next three years show 42,000 tpy of N splitevenly between urea and ANL. This can be achieved but will depend primarilyon the sustained operation of the old ammonia units.
2.07 Financially the Multan operation has shown a total net profit ofonly PRs 14 million over the five years, 1969-73, after a subsidy 1/ of PRs 120million from the provincial and central governments. Cash generation (includingthe subsidy) over the period was PRa 100 million. With higher fertilizer prices,(para. 3.13) NFC requires less subsidy and Multan is expected to show improvedfinancial results during project implementation. However, the financing planfor the project does not take into account any cash generation that may becontributed by the existing plant. Of the original PRs 237 million investmentmade during the early 1960's (about US$50 million at the then current exchangerate), the Multan unit had by June 30, 1973 transferred PRs 207 million toWPIDC in lieu of debt repayments in addition to 7% interest on the investment(less transfers).
E. Transfer of Existing Operations to PFL
2.08 NFC intends to retain ownership of the existing operation untilthe project is completed to utilize the depreciation, tax and subsidy con-cessions granted to the unit. Upon project completion, NFC will transfer
1/ The subsidy was based on a margin of 6% between operating cost andrevenue including the subsidy.
the existing Multan fertilizer business to PFL at which time these conces-sions will expire. Pending such transfer NFC has agreed to limit its annualcapital expenditures relating to the Multan business to US$1 million equivalent.
III. FERTILIZER MARKET AND MARKETING
3.01 Past and projected consumption and production of fertilizer inPakistan, with special reference to the Province and District where theproject will be located, are detailed in Annex 3-1. An international con-sumption pattern is also given for comparison (Annex 3-2).
A. Past Fertilizer Growth in Pakistan
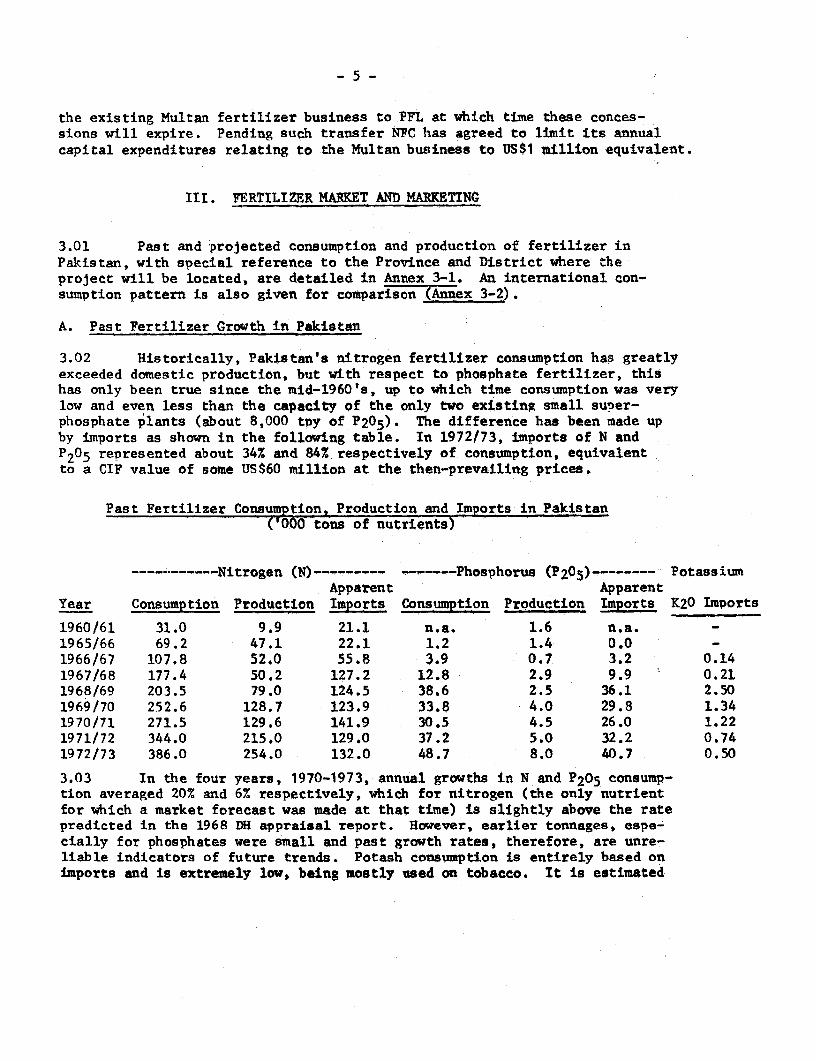
3.02 Historically, Pakistan's nitrogen fertilizer consumption has greatlyexceeded domestic production, but with respect to phosphate fertilizer, thishas only been true since the mid-1960's, up to which time consumption was verylow and even less than the capacity of the only two existing small super-phosphate plants (about 8,000 tpy of P205). The difference has been made upby imports as shown in the following table. In 1972/73, imports of N andP205 represented about 34% and 84% respectively of consumption, equivalentto a CIF value of some US$60 million at the then-prevailing prices.
Past Fertilizer Consumption, Production and Imports in Pakistan('000 tons of nutrients)
…---------Nitrogen (N) --- ------- Phosphorus (P205)-------- PotassiumApparent Apparent
Year Consumption Production Imports Consumption Production Imports K20 Imports
1960/61 31.0 9.9 21.1 n.a. 1.6 n.a.1965/66 69.2 47.1 22.1 1.2 1.4 0.0 -1966/67 107.8 52.0 55.8 3.9 0.7 3.2 0.141967/68 177.4 50.2 127.2 12.8 2.9 9.9 0.211968/69 203.5 79.0 124.5 38.6 2.5 36.1 2.501969/70 252.6 128.7 123.9 33.8 4.0 29.8 1.341970/71 271.5 129.6 141.9 30.5 4.5 26.0 1.221971/72 344.0 215.0 129.0 37.2 5.0 32.2 0.741972/73 386.0 254.0 132.0 48.7 8.0 40.7 0.50
3.03 In the four years, 1970-1973, annual growths in N and P205 consump-tion averaged 20% and 6% respectively, which for nitrogen (the only nutrientfor which a market forecast was made at that time) is slightly above the ratepredicted in the 1968 DH appraisal report. However, earlier tonnages, espe-cially for phosphates were small and past growth rates, therefore, are unre-liable indicators of future trends. Potash consusption is entirely based onimports and is extremely low, being mostly used on tobacco. It is estimated

-6-
that acttual fertilizer consumption would have grown faster, were it not forscme of the constraints described in Section E below; these have been, inparticular, lack of the foreign exchange to import fertilizer, and more re-cently the scarcity of fertilizer on world markets, coupled with unprecedentedprice increases.
B. Fertilizer Forecast for Pakistan
3.04 Demand estimates prepared by experienced agronomists in Pakistanand based 'on likely crop patterns as well as production forecasts, takinginto account existing and probable additional fertilizer capacity (Multanand Fauji) are summarized below. These are detailed in Annex 3-2 andrepresent average annual growth rates of 11% for N and 21% for P205.
…----Nitrogen (N)----- ----Phosphorus (P 20 5 ) - Potash (K20)Apparent Apparent
Year Demand Production Imports Demand Production Imports Imports
1973/74 430 281 149 60 9 51 101974/75 475: 290 185 73 10 63 151975/76 530 292 238 90 10 80 201976/77 590 346 244 108 40 68 251977/78 650 551 99 130 72 58 301978/79 720 678 42. 155 104 51 351979/80 790 697 93 185 112 73 401980/81 875 697 178 220 124 96 45
It can be seen that even after the Multan and Fauji projects will have comeon stream (expe'ted for 1977 and 1978 respectively), Pakistan would stillhave to import fertilizer to meet predicted demand for both N and P2 05 . Theabove forecasts are about in the middle of various demand predictions, sothat maximum fertilizer use in 1980/81 could be some 15% and 20% above therespective N and P2 05 forecasts used here. Furthermore, Pakistan's fertilizerapplication rates are still among the lowest in the world and on a per capitabasis are below those of India. Finally, Pakistan has still a very high N/P2 05application ratio of about 9/1 as compared to a world average of 1.6/1. Evenaccounting for varying soil conditions, there is therefore much room forPakistan to increase its usage of phosphate fertilizer. Furthermore, promptadditional use of phosphates (and potassium later) is essential, otherwisemuch of the extra nitrogen added and the benefits of planting high-yieldingvarieties of wheat, rice and other crops will be wasted. This matter wasemphasized during negotiations.
C. Fertilizer Forecast For the Project's Principal Marketing Area
3.05 As indicated in Annex 3-1, the Punjab (the major market area of theproject) reprev-ents some 65% of the country's cropped acreage and producesoYter 70% of it. !.a_or crops. This province, together with the North Westi! :^ier Province (NWFP), an adjoining small potential market area for thep.L, 4accounted for 75% of Pakistan's N and P2 05 consumption during the last

-7 -
three years. Based on agronomic forecasts, this proportionate demand isexpected to continue, thus giving the following projected demand and pro-duction pattern for these two provinces.
Projected Fertilizer Demand and Production in the Punjaband North West Frontier Provinces
('000 tons of nutrients)
…------ Nitrogen (N)-------- -- Phosphorus (P205)-------Surplus Surplus
Year Demand Production (Deficit) Demand Production (Deficit)
1973/74 322 281 (41) 45 9 (36)1974/75 356 290 (66) 55 10 (45)1975/76 398 292 (106) 67 10 (57)1976/77 443 346 (97) 81 40 (41)1977/78 490 551 61 97 72 (25)1978/79 540 678 138 117 75 (42)1979/80 593 697 104 139 79 (60)1980/81 658 697 39 165 79 (86)
D. Competition
3.06 The above production projections for nitrogen conservatively assumethat the Fauji Foundation will proceed with the larger of two project alterna-tives (530,000 tpy of urea or 240,000 tpy of N) and that all its output wouldbe available in the Punjab and the NWFP. While the Fauji plant would bebuilt in the Punjab, its proposed location is, however, only some 40 km fromthe Punjab/Sind border and most of its natural market therefore would be inthe Sind. On the other hand, the Multan plant lies in the Multan Districtand thus in the heart of the main marketing area which consumes 64% of N salesin the entire Punjab Province, and is some 330 km distant from the envisagedFauji plant. Therefore, even if the larger Fauji plant were to be built andeven if some excess of nitrogen fertilizer appears in the Punjab during thelate 1970's (as indicated by the above table), no really significant competi-tion is foreseen.
3.07 Regarding P205 competition, the only other phosphate plant thathas been sanctioned to date is a monoammonium phosphate (MAP) plant atKarachi, based on imported phosphoric acid. In addition phosphate rock hasbeen discovered in the NWFP and consideration of a fertilizer plant near thedeposits is under study. As phosphate fertilizer is likely to continue tobe in short supply throughout the forecast period, and the Karachi projectwould be about 800 km distant from Multan, competition would be insignificant,especially as the MAP is expected to find ready sales in the Sind. Projecteddomestic N and P205 production and demand in the project's marketing area arecompared in tabular and graphic form in Annex 3-3.

- 8 -
E. Credit Availability and Other Constraints
3.08 Many large and medium sized farms can pay cash or obtain short-term loans for fertilizers and other needs, such as from the AgriculturalBank at about 8% interest, but millions of subsistence cultivators have hadno access to credit on favorable terms. The Government planned to make PRs775 million credit available to the poorer farmers in 1973/74, via commercialbanks, agricultural supply corporations, cooperatives and the AgriculturalDevelopment Bank. Also, the newly-formed Punjab Agricultural Su;rplies Corpo-ration (PASC) intends not only to bring fertilizer and other inputs to thepoorer rural areas but also to provide credit to purchase them. It is intendedthat some of these loans would be interest-free and be secured by future crops.Nevertheless, as the potential for increasing agricultural output is largestwith the great number of small farms and increased fertilizer for such smallfarms has been assumed in the projections, the Government has agreed to makeavailable to the Bank by December 31, 1974 a detailed description of an agri-cultural credit program to be prepared and implemented by the Governmentthroughout Pakistan, and has agreed to afford to the Bank reasonable oppor-tunity to comment thereon. Such credit facilities will become increasinglyimportant as fertilizer consumption in Pakistan is expected to continuerising during the remainder of this decade.
3.09 Other major actual and potential constraints include increasinginternational fertilizer prices and decreasing fertilizer availability, limitedwater supplies, fixed crop prices and poor farmer education. Most farms aretotally dependent on irrigation or uncertain rainfall and during the earlymonths of 1970 and 1971, river and well levels were the lowest in 100 years.However, completion of the Tarbela Dam in 1974 will help to provide more regu-lar irrigation. Lack of sufficient fertilizer due to foreign exchange restric-tions and limited domestic production has curtailed use and appreciation ofthe benefits fertilizers provide. Greater availability from the expandedMultan plant will help to remedy this situation. Crop prices have a greatinfluence on fertilizer use and the Government has tended to delay priceincreases because of political repercussions; however, grain prices wereraised recently and the cost benefit ratio of fertilizer to crops shouldremain attractive even after further fertilizer price increases. Regardingfarmer education, producers in both the public and private sectors undertakefertilizer campaigns and demonstrations, but much additional work needs tobe done, especially in promoting greater use of phosphates. The Governmenthas agreed that it will make available to the Bank by December 31, 1974 astudy of improvements needed in fertilizer promotion and marketing to becarried out by the Government and afford to the Bank opportunity to commentthereon. The Government has also agreed to import nitrophosphate or similarphosphatic fertilizer into Multan's marketing area (equivalent to about 50,000,100,000 and 150,000 tpy of nitrophosphate in the years ending June 1974, 1975and 1976 respectively) during project implementation to prepare the farmersfor increased availability of phosphate once the project is completed and atthe same time, obtain a better N/P ratio sooner.

-9-
F. Transportation
3.10 Recent experience of Dawood Hercules and at Multan shows road trans-port to be speedier and cheaper, if distances from plant to distribution cen-ters are under 250 to 300 km. As typical distances between Multan and themajor warehouses are 130 to 160 km, it is estimated that about two-thirds ofthe project's output will be moved by road and one-third by rail. Multan hasa big truck depot and truckers are anxious to obtain extra loads. Regardingrail transport, Multan is about 60 km south and 100 km north of two of thelargest make-up yards in the country, hence no difficulty is anticipated inobtaining empty wagons and rapid turnarounds. Discussions with the railwayauthorities revealed no anticipated difficulties either in moving heavyequipment, phosphate rock and "seeding" fertilizer supplies from Karachi toMultan, or hauling finished fertilizer to railhead towns in the quantitiesrequired. Furthermore, agricultural materials are second in priority onlyto military needs.
G. Fertilizer Distribution
3.11 From 1967 to October 1973, fertilizers were distributed and soldeither by producers or by a group of Principal Agents, who had representativesin the mandi (market) towns throughout the country. In October 1973, thePunjab Provincial Government re-entered fertilizer marketing and issued adecree taking over full distribution and sales from all private and publicsector plants (except Esso which has an agreement with the Central Govern-ment to undertake its own sales of which only 15% are sold in the Punjab).Dawood Hercules obtained a concession to distribute half of its urea outputas it wishes; the remainder being handled by the Punjab Agricultural SupplyCorporation (PASC). However, the Multan plant has been instructed to sellall its current and future production through PASC.
3.12 This restricted marketing may place the Multan project at a seriousdisadvantage compared to other producers because PASC is inexperienced in thisfield. Also, absence of competition in marketing Multan's products because ofsole distribution and selling rights could reduce the educational and sal?sefforts needed to increase fertilizer use - especially by farmers with littleor no experience of proper fertilizer application. Therefore, the Governmenthas agreed that it will enable PFL to utilize or establish an efficient distri-bution network to market the project's production; the performance of thenetwork to be subject to periodic Bank review. While it is intended thatPASC should undertake this marketing, the representatives of the Governmentrecognized during negotiations that the network could be either the publicor private sector or a combination.
H. Prices
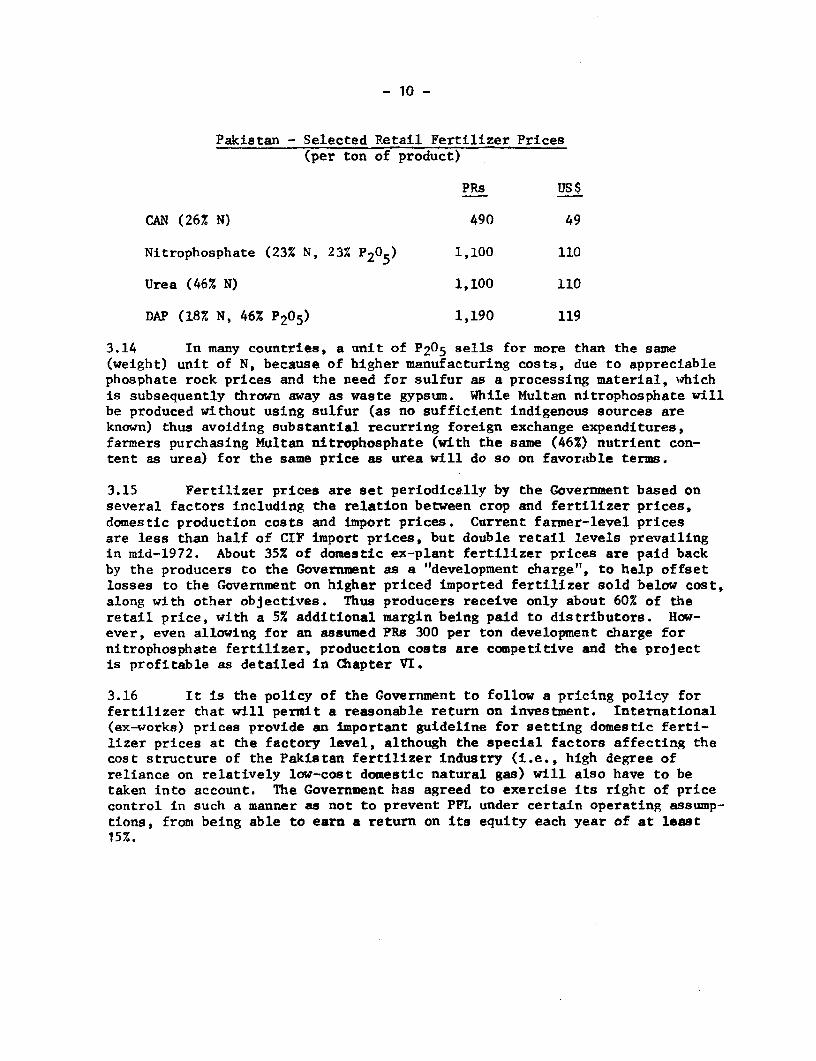
3.13 At full capacity utilization, the expanded Multan plant will producethe following types and quantities of fertilizer (in tpy): CAN 450,000;nitrophosphate 306,000; urea 72,600 and some 50,000 tons of ammonium nitratelimestone (ANL). Gazetted retail prices at farmer level after the latestincreases in August 1973 are:
- 10 -
Pakistan - Selected Retail Fertilizer Prices(per ton of product)
PRs US$
CAN (26% N) 490 49
Nitrophosphate (23% N, 23% P205) 1,100 110
Urea (46% N) 1,100 110
DAP (18% N, 46% P205) 1,190 119
3.14 In many countries, a unit of P205 sells for more than the same(weight) unit of N, because of higher manufacturing costs, due to appreciablephosphate rock prices and the need for sulfur as a processing material, wqhichis subsequently thrown away as waste gypsum. While Multan nitrophosphate willbe produced without using sulfur (as no sufficient indigenous sources areknown) thus avoiding substantial recurring foreign exchange expenditures,farmers purchasing Multan nitrophosphate (with the same (46%) nutrient con-tent as urea) for the same price as urea will do so on favoratble terms.
3.15 Fertilizer prices are set periodically by the Government based onseveral factors including the relation between crop and fertilizer prices,domestic production costs and import prices. Current farmer-level pricesare less than half of CIF import prices, but double retail levels prevailingin mid-1972. About 35% of domestic ex-plant fertilizer prices are paid backby the producers to the Government as a "development charge", to help offsetlosses to the Government on higher priced imported fertilizer sold below cost,along with other objectives. Thus producers receive only about 60% of theretail price, with a 5% additional margin being paid to distributors. How-ever, even allowing for an assumed PRs 300 per ton development charge fornitrophosphate fertilizer, production costs are competitive and the projectis profitable as detailed in Chapter VI.
3.16 It is the policy of the Government to follow a pricing policy forfertilizer that will permit a reasonable return on investment. International(ex-works) prices provide an important guideline for setting domestic ferti-lizer prices at the factory level, although the special factors affecting thecost structure of the Pakistan fertilizer industry (i.e., high degree ofreliance on relatively low-cost domestic natural gas) will also have to betaken into account. The Government has agreed to exercise its right of pricecontrol in such a manner as not to prevent PFL under certain operating assump-tions, from being able to earn a return on its equity each year of at least15%.

- t1 -
IV. THE PROJECT
A. Objectives, Scope and Project Description
4.01 The project is to produce simultaneously nitrogen and phosphatefertilizers to help mitigate current shortages of both nutrients in Pakistan,using domestic resources to the maximum extent possible. The existing in-efficient ammonia units will be shut down and replaced by one large, modern,910 tpd plant that will feed a new 1,020 tpd prilled nitrophosphate (NP) unit;a new 1,500 tpd prilled CAN unit; plus the existing urea and ANL units thatare in course of being modified to produce 220 tpd prilled urea and 200 to300 tpd granular CAN. Based on the new ammonia plant achieving 90% of an-nual capacity, Multan would produce about 275,000 tpy of NP (22.5% N and22.5% P205); 30,000 additional tpy of urea (46% N); and 425,000 tpy of extraCAN (26% N) equivalent to an additional 187,000 tpy of N and 63,000 of P205.At the same time existing facilities, offsites and labor will be used tothe optimum extent.
4.02 Nitrophosphates are not new or distinctive fertilizer compounds butmixtures of traditional fertilizer materials - ammonium phosphate and amoniumnitrate made by dissolving phosphate rock in nitric acid produced from ammonia.A product having a phosphate water-solubility of at least 80% will ensureagronomic results fully comparable with those based on phosphates such astriple superphosphate (TSP) or diammonium phosphate (DAP) made by dissolvingphosphate rock in sulphuric acid (Annex 3-3). These alternatives, as well asthe production of urea were studied and compared, as were plants of differentsizes. The products and processes chosen, as well as the plant sizes selectedrepresent the optimum combination for this specific project at the expectedlevel of fertilizer use and nutrient combination in Multan's marketing area.
4.03 The project is detailed in Annex 4-1 and the flow chart for theexisting and new facilities is shown in Annex 4-2. Ammonia will be producedfrom steam-reformed natural gas in a single train, and latest proven tech-nology based on steam turbine-driven centrifugal compressors will be used.The,selected engineering firm for design and construction of the ammonia plantand offsites is Kellogg International Corporation Ltd. (U.K.) who will alsobe responsible for general coordination and supervision of the entire project.The selected engineering firm for design and construction of the nitric acid,NP and CAN plants is Uhde GmbH (FRG). The ammonia plant will use the Kelloggprocess, the nitric acid and CAN units will use Uhde technology and the NP plantwill be based on Dutch States Mines process design. The various productionprocesses are described in Annex 4-3. The new facilities will be built withinthe existing plant boundaries as shown in the layout in Annex 4-4.
B. Raw Materials and Utilities
4.04 The availability and supply of the principal raw materials are de-scribed in more detail in Annex 4-5; these will be natural gas to be suppliedby Sui Northern Gas Pipelines Ltd. (SNGPL) from their Sui field some 300 kmdistant and phosphate rock from Jordan or elsewhere. Gas reserves are amplebut existing needs of the Multan plant will have to be supplemented by con-structing additional loops. The Government has agreed to finance on terms

- 12 -
and conditions satisfactory to the Bank, the cost of the additional invest-ments required for the gas supply (amounting to 1.56 million cubic meters,or 55 million cubic feet per day at full production including 10% contingency).In addition, it is a condition of effectiveness of the Loan that Sui Northernshall have agreed to supply to PFL such amount of gas on a long-term basisas from June 30, 1976. Phosphate rock has been purchased by WPIDC from Jordanfor many years and this can be extended to meet the needs of Multan (about220,000 tpy). In view of rapidly increasing world demand for phosphate rock,it is a condition of effectiveness of the Loan that satisfactory arrangementsfor the supply of phosphate rock to PFL shall have been made.
4.05 Major utilities are power, natural gas for steam generation andwater. The plant will produce its own power via steam raised in waste-heatrecovery units and gas-fired boilers. Water for processing and coolingpurposes will come from nearby deep wells.
4.06 Adequate supplies of bags are essential and, in addition to poly-ethylene-lined cotton bags now used, alternatives such as woven polyprophylenebags are being studied as well as bag-recycling. The Government has agreedto make arrangements satisfactory to the Bank for the supply to PFL of thenecessary quantity of fertilizer bags for the operation of the Multan plantand to make available to the Bank for review by June 30, 1975 a program forthe production of such bags.
C. Basis for Location and Product Mix
4.07 As reviewed in Annex 3-2 Multan is in the heart of the major agri-cultural area of the Punjab and is therefore ideally located in terms ofmarketing and distribution as well as nearness to its major feedstock -natural gas. The existing plant is well connected by road and rail to therest of the Province and the country. It has ample room for expansion andhas its own housing colony, plus plentiful additional labor resources inMultan city. Management, supervisors and operators are well experienced inmost of the fertilizer technology applied in the project. Expanding Multanis therefore logical. The product mix suits the fertilizer applicationpattern for many crops, namely, a 1:1 N to P2 05 ratio for basal (seed bed)application as nitrophosphate, followed by a subsequent top dressing of anall nitrogen fertilizer such as CAN or urea.
D. Ecology and Safety Considerations
4.08 These are reviewed in detail in Annex 4-6. Appreciable volumes ofharmless water vapor and carbon dioxide will be vented to the atmosphere.Fluorine vapors resulting from impurities in phosphate rock will be recoveredbefore venting exhaust gases to the atmosphere, and rendered harmless byappropriate chemical treatment. Nitrogen oxide vapors from the old and new

- 13 -
nitric acid plants will be reduced to acceptable levels. Dusts will beminimized in the interests of economy as well as ecology, and it was agreedthat the entire plant will meet gaseous and liquid pollution levels nowrequired in populated areas of Europe or USA, to be monitored by the Govern-ment. Safety and fire precautions will also meet standards acceptable over-seas.
E. Labor Force and Training
4.09 About 1,700 people are currently employed in the Multan plant whichis more than double present actual needs. This labor surplus will be ampleto operate the additional process units and meet expanded handling, baggingand other requirements, thus helping to reduce present plant overstaffing.Key supervisory and technical personnel (who are already experienced inammonia, nitric acid and CAN production) will be given training in largeammonia, NP and CAN plants overseas, in accordance with a plan to be preparedby the Technical Advisor. Some PFL staff will spend time on design and pro-curement in the offices of the plant contractors (Kellogg and Uhde).
F. Project_Implementation, Procurement and Construction
4.10 As mentioned, Kellogg has been selected to design and constructthe ammonia plant, offsites and tie-ins of existing and new facilities andUhde to design and construct the nitric acid, NP and CAN units. Both werechosen after international competition. Procurement of equipment and mate-rials will be undertaken in London and DDrtmund by PFL together with Kelloggand Uhde specialists. The design and construction of civil works (which arebeing financed by the Government) will be performed by qualified domesticfirms under the supervision of Kellogg. Financing of Kellogg's services willbe assisted by the proposed Bank loan, while the nitric acid, NP and CANplants' engineering will be financed by ADB. With the exception of pro-prietary equipment (estimated to cost US$1 million equivalent) and criticalitems affecting the process guarantees and/or the project completion schedule(estimated to cost US$4 million equivalent), all orders over an estimatedUS$25,000 to be financed by the proposed Bank loan will be procured by inter-national competitive bidding under the Bank's guidelines. Suppliers forcritical items will be recommended by Kellogg based on their experience,delivery times and competitive prices. Qualified Pakistani bidders will begiven a preference of 15% or the customs duties for non-exempt importers,whichever is lower. To expedite the project and avoid retroactive financing,preliminary engineering costs and down payments on long delivery items willbe financed from equity. On this basis design work commenced in early 1974and the construction is to be completed by the end of 1976. The anticipatedschedule is depicted in Annex 4-7; this schedule is tight but achievable,provided equipment delivery times are not significantly prolonged on accountof the sharp increase in the construction of fertilizer plants in the world.

- 14 -
4.11 To coordinate the project and assist PFL during design, procurementand construction, a Technical Advisor team from Stamicarbon (Netherlands)with experience in large-scale production of ammonia and nitrogen fertilizerincluding nitrophosphate has been engaged. This team can be retained afterplant start-up for a period satisfactory to the Bank to help assure thatproduction can quickly reach and be sustained at a high level of capacity.Close liaison between the Technical Advisor and PFL's local consultants(Chemical Consultants Ltd.) will be maintained throughout.
4.12 To ensure that delays and extra costs will not arise due to im-port procedures, the Bank has obtained assurances that import licenses willbe issued promptly according to an agreed Critical Path Schedule. It wasalso stated by the representatives of the Government during negotiations thatwith certain minor exceptions, imported equipment, materials and other itemsneeded for the project will be free of import duties, as assumed in thecapital cost estimates.
4.13 Sui Northern Gas Pipelines Limited (SNGPL) will be responsible forconstruction of the expansion of the capacity of the Multan line, by June 30,1976, in time for testing the gas line and the fertilizer facilities. TheBank in its supervision of its loans to SNGPL is following the pipelineproject. As PFL's Managing Director designate is SNGPL's former TechnicalManager the necessary close coordination between PFL and SNGPL should beassured.
4.14 The Government representatives also agreed that a proposed heavywater plant to be based on PnL's ammonia plant facilities will not interferewith PFL's operations and that PFL will be compensated for any additionalcapital or opcrating costs as a consequence of the heavy water plant.
V. CAPITAL COST AND FINANCING PLAN
A. Project Cost
5.01 The project is estimated to require total financing amounting toPRs 1,007 million (US$101.7 million) with the local currency portion accountingfor about 23%. Ay July 1, 1976 the fixed assets of the existing plant will betransferred from NFC to PFL at PRs 46.7 million (US$4.7 million). The de-tails of capital cost estimate are given in Annex 5-1 and its summary isgiven in the table below:

- 15
Project Cost - Summary
PRs (millions) US$ Equivalent (millions)Local Foreign Local ForeignCurrency Exchange Total Currency Exchange Total %
Engineering, Erectionand Procurement 105 101 206 10.5 10.2 20.7 22
Equipment, Freightand Spares, C&F - 477 477 - 48.1 48.1 51
Local Goods and Services 17 - 17 1.7 - 1.7 2
Furniture, Fixtures andVehicles 2 - 2 0.2 - 0.2 -
Training, Start-up andConsultancy 11 12 23 1.1 1.2 2.3 2
Sub-total: 134 589 723 13.5 59.5 73.0 78
Contingencies:
-Physical 5 59 64 0.5 6.0 6.5 7-Price 5 48 53 0.5 4.8 5.3 6
Sub-Total 10 107 117 1.0 10.8 11.8 13
Total Fixed Assets 144 696 840 14.5 70.3 84.8 91
Working Capital 70 18 88 7.1 1.8 8.9 9
Total Project Cost 214 714 928 21.6 72.1 93.7 100
Interest During Construction 19 60 79 2.0 6.0 8.0
Total Financing Required 233 774 1,007 23.6 78.1 101.7
Purchase of Existing Assets 47 - 47 4.7 - 4.7
Total Capitalization 280 774 1,054 28.3 78.1 106.4
5.02 The foreign exchange estimates are based on fixed engineering fees,indicative equipment costs prepared by the winning engineering firms in February1974 and civil construction costs in Pakistan in March 1974. Foreseeable es-calation through March 1974 and contingencies of 10% are already included in

- 16 -
these costs, i.e., outside the contingencies separately shown. It has beenassumed that all equipment will be imported although a small percentage maybe fabricated in Pakistan at competitive costs.' Thus, there may be somesavings in foreign exchange compared to the above estimates.
5.03 A 10% contingency allowance has been made on the fixed engineer-ing bids and on the indicative equipment cost items. In addition, a 10%allowance for price escalation has been made on all equipment costs. Con-sidering the advanced stage of the project and assuming equipment ordersare placed over the next 9 months, the escalation provisions appear reason-able. They have been revised following negotiations in the light of worldwidedevelopments since the original estimates were prepared in mid-1973. Localcosts are based on new contracts being negotiated by construction firms.To this has lbeen added 7-1/2% for contingencies, and at this time, theseestimates appear reasonable. Although not part of the project's capitalcosts, the additional gas line loops are expected to cost PRs 107 million.
B. Working Capital
5.04 Using conservative assumptions (Annex 5-2) for the level of receiv-ables, inventories and cash, the Bank has estimated maximum current assetsduring the first operating year (1977) to be about PRa 200 million, of whichsome 70% could be financed by normal working capital credits. The balancewould be provided in equity. Thus, we have used PRs 88 million as a con-servative amount to be included in the financing requirements for the initialworking capital. Of this, PRs 18 million is assumed to be required in foreignexchange for imported raw materials, primarily phosphate rock.
C. Financing Plan
5.05 The proposed financing plan is based on a concept of about 64% debtand 36% equity. Of the equity, about 30% is to be provided by ADNOC. Thebalance of the equity is to come from the Government through NPC, in localcurrency and - to the extent necessary to meet the project's needs - inforeign exchange (about US$5 million equivalanet). The ADB signed theirUS$27 million equivalent loan in January 1974, and ADNOC paid its initialequity subscription also in January 1974. The Government has agreed tofinance any local currency or foreign exchange overrun on the project, assurethat PFL has a maximum debt/equity ratio of 65/35 at project completion date, 1/and cover all costs of the related gas pipeline within the time required bythe project. In addition assurances have been obtained that (i) the Govern-ment will provide sufficient funds to NFC to allow it to subscribe in cashfor its portion of PFL's share capital and in the time as required by theproject; and (ii) share capital can be used for foreign exchange expendituresby the conversion of rupees, as necessary.
1/ Project completion is defined as one continuous month of productionat 80% capacity.
- 17 -
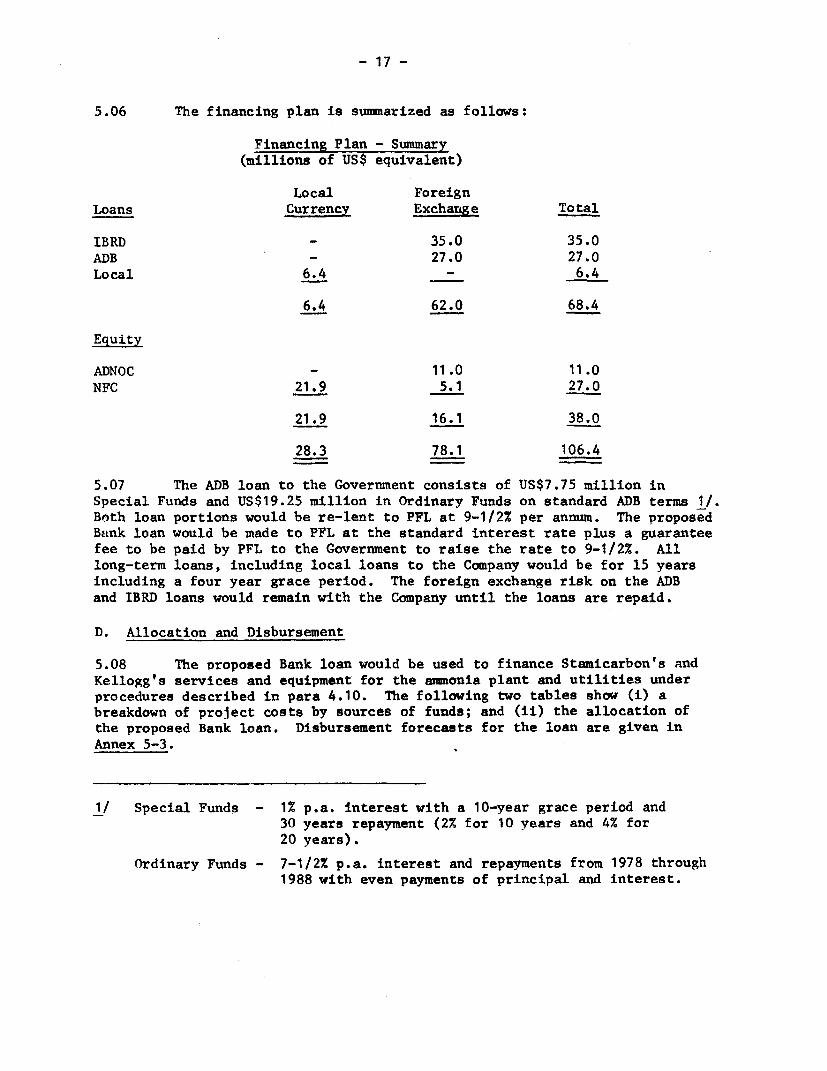
5.06 The financing plan is summarized as follows:
Financing Plan - Summary(millions of US$ equivalent)
Local ForeignLoans Currency Exchange Total
IBRD 35.0 35.0ADB - 27.0 27.0
Local 6.4 - 6.4
6.4 62.0 68.4
Equity
ADNOC - 11.0 11.0NFC 21.9 5.1 27.0
21.9 16.1 38.0
28.3 78.1 106.4
5.07 The ADB loan to the Government consists of US$7.75 million inSpecial Funds and US$19.25 million in Ordinary Funds on standard ADB terms 1/.
Both loan portions would be re-lent to PFL at 9-1/2X per annum. The proposed
Bank loan would be made to PFL at the standard interest rate plus a guarantee
fee to be paid by PFL to the Government to raise the rate to 9-1/2x. All
long-term loans, including local loans to the Company would be for 15 years
including a four year grace period. The foreign exchange risk on the ADB
and IBRD loans would remain with the Company until the loans are repaid.
D. Allocation and Disbursement
5.08 The proposed Bank loan would be used to finance Stamicarbon's and
Kellogg's services and equipment for the ammonia plant and utilities underprocedures described in para 4.10. The following two tables show (i) abreakdown of project costs by sources of funds; and (ii) the allocation ofthe proposed Bank loan. Disbursement forecasts for the loan are given in
Annex 5-3.
1/ Special Funds - 1Z p.a. interest with a 10-year grace period and30 years repayment (2% for 10 years and 4% for
20 years).
Ordinary Funds - 7-1/2% p.a. interest and repayments from 1978 through1988 with even payments of principal and interest.

- 18 -
Project Costs by Sources of Funds(PRs million)
Local Foreign Exchange -- GrandCurrency ADB IBRD Equity Total Total
Equipment and Services - 226 292 59 Ll 577 577Civil Works &
Local Erection 104 - - - - 104Training, Consultancy,Start Up andMiscellaneous 30 - 7 5 12 42
Contingencies 10 41 48 18 107 117Working Capital 70 - - 18 18 88Interest duringConstruction 19 - - 60 60 79
Purchase of ExistingAssets 47 - 47
Total 280 267 347 160 774 1,054
/1 Downpayment and initial engineering fees until ADB and IBRD loans areavailable, plus financing for part of utilities.
Allocation of Bank Loan
(million of US$ Equivalent)
IBRD
Engineering & Erection 2.0
Equipment & Spare PartsAmmonia Plant 20.0Utilities 7.5
Sub-total 27.5
Technical Advisory Services 0.7
Unallocated 4.8
Total 35.0

- 19 -
VI. FINANCIAL ANALYSIS OF THE PROJECT
A. Basis of Analysis
6.01 As mentioned, the project will produce ammonia for the existingnitric acid, urea and ANL plants as well as the new nitric acid, 11? and CANplants. In calculating the economic and financial returns, the entireproduction from the old and new plants are taken as benefits and the existingfacilities are taken at their depreciated value as of June 30, 1976.
6.02 Project expenditures by source are estimated as follows:
Multan - Project Expenditures by Source(PRa million)
Calendar Year 1973 1974 1975 1976 Total
Foreign Loans
IBRD - 25 252 70 347ADB - 52 200 15 267
= 77 452 85 614
Foreign Equity (ADNOC) - 46 61 3 110
Local Equity (NFC)and Loans 15 25 66 224 330
Total 15 148 579 312 1 054
Some of the guarantee payments on equipment will only be made in 1977 butthese are relatively small and have therefore no substantial effect on thefinancial and economic analyses.
B. Operating Costs and Revenues
6.03 Detailed operating costs for each of the major products of theexpanded plant are shown in Annex 6-1 and are summarized below:
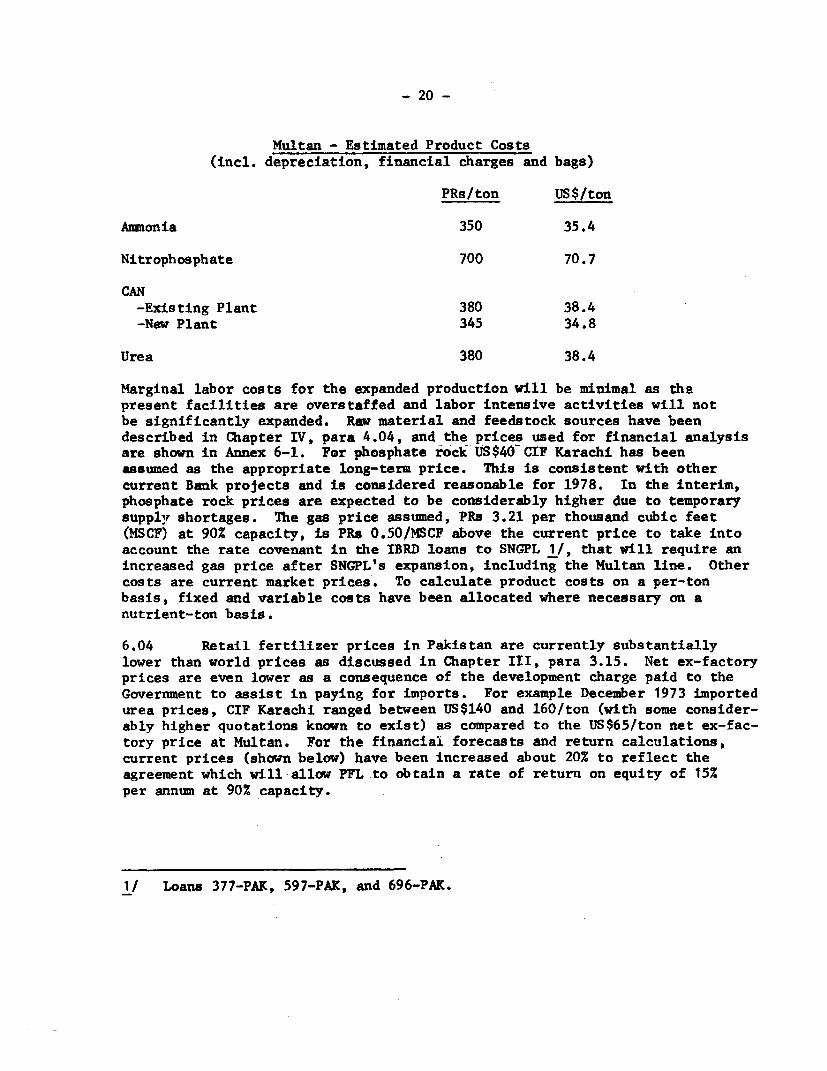
- 20 -
Multan - Estimated Product Costs(incl. depreciation, financial charges and bags)
PRs/ton US$/ton
Ammonia 350 35.4
Nitrophosphate 700 70.7
CAN-Existing Plant 380 38.4-New Plant 345 34.8
Urea 380 38.4
Marginal labor costs for the expanded production will be minimal as thepresent facilities are overstaffed and labor intensive activities will notbe significantly expanded. Raw material and feedstock sources have beendescribed in Chapter IV, para 4.04, and the prices used for financial analysisare shown in Annex 6-1. For phosphate rock US$40--CIF Karachi has beenassumed as the appropriate long-term price. This is consistent with othercurrent Bank projects and is considered reasonable for 1978. In the interim,phosphate rock prices are expected to be considerably higher due to temporarysupply shortages. The gas price assumed, PRa 3.21 per thousand cubic feet(MSCF) at 90% capacity, is PRs 0.50/MSCP above the current price to take intoaccount the rate covenant in the IBRD loans to SNGPL 1/, that will require anincreased gas price after SNGPL's expansion, including the Multan line. Othercosts are current market prices. To calculate product costs on a per-tonbasis, fixed and variable costs have been allocated where necessary on anutrient-ton basis.
6.04 Retail fertilizer prices in Pakistan are currently substantiallylower than world prices as discussed in Chapter III, para 3.15. Net ex-factoryprices are even lower as a consequence of the development charge paid to theGovernment to assist in paying for imports. For example December 1973 importedurea prices, CIF Karachi ranged between US$140 and 160/ton (with some consider-ably higher quotations known to exist) as compared to the US$65/ton net ex-fac-tory price at Multan. For the financial forecasts and return calculations,current prices (shown below) have been increased about 20% to reflect theagreement which will allow PFL to obtain a rate of return on equity of 15%per annum at 90% capacity.
1/ Loans 377-PAK, 597-PAK, and 696-PAK.
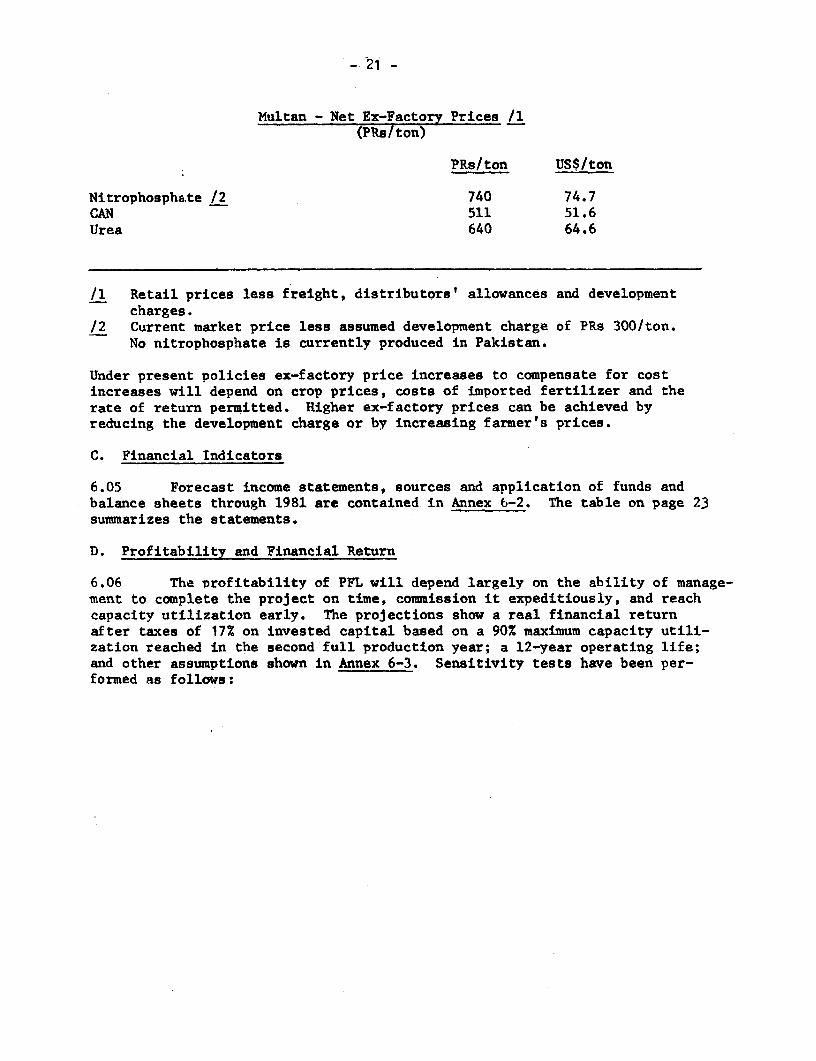
- 21 -
Multan - Net Ex-Factory Prices /1(PRa/ton)
PRs/ton US$/ton
Nitrophosphate /2 740 74.7CAN 511 51.6Urea 640 64.6
/1 Retail prices less freight, distributors' allowances and developmentcharges.
/2 Current market price less assumed development charge of PRs 300/ton.No nitrophosphate is currently produced in Pakistan.
Under present policies ex-factory price increases to compensate for costincreases will depend on crop prices, costs of imported fertilizer and therate of return permitted. Higher ex-factory prices can be achieved byreducing the development charge or by increasing farmer's prices.
C. Financial Indicators
6.05 Forecast income statements, sources and application of funds andbalance sheets through 1981 are contained in Annex 6-2. The table on page 23summarizes the statements.
D. Profitability and Financial Return
6.06 The profitability of PFL will depend largely on the ability of manage-ment to complete the project on time, commission it expeditiously, and reachcapacity utilization early. The projections show a real financial returnafter taxes of 17% on invested capital based on a 90% maximum capacity utili-zation reached in the second full production year; a 12-year operating life;and other assumptions shown in Annex 6-3. Sensitivity tests have been per-formed as follows:

- 2 2-
Financial Return and Sensitivity Tests
-Base Case - After Taxes 17Before Taxes 23
-2C% Increase in Project Cost and12 months delay in construction 13
-20% Decrease in Revenues 6
-Gas Costs Increased 100% 13
-Phosphate Rock Costs Increased 20% 16
From an equity point of view, the discounted return would be over 25%. Atcurrent sales prices the profit breakeven point is estimated to be 62% andthe cash breakeven point 50% (Annex 6-4). The above returns reflect therelatively low additional investment requirements on account of the largelyexisting infrastructure and the favorable feedstock price, measured by today'sworld standards of traded hydrocarbon resources.
E. Financial Position, Debt Service Coverage and Financial Covenants
6.07 With 15% dividend payments assumed to start in 1979, projectionsshow a current ratio of 1.4:1 or better for all years and a long-term debt/equity ratio of less than 60/40 after 1977. These ratios are sound and con-sidered achievable. Debt service would be covered 1.8 times from 1978 on-ward, the first year full loan repayment is due.
6.08 To ensure the financial viability of PFL, the following agreementshave been obtained: (a) the Government will take all necessary action tomaintain a current ratio of at least 1.5:1 as at Project Completion Date andthereafter of 1.2:1 and to assure that as at Project Completion Date the debtequity ratio of PFL shall be no more than 65:35; (b) further long-term bor-rowing and investments in fixed assets without prior approval of the Bank belimited to no more than US$3 million equivalent per year: (c) for purposes ofincurring debt the debt service coverage to be maintained at not less than1.5 times; and (d) limitation of dividends or other cash outlays, includingdebt pre-payments, to prior earnings and subject to the maintenance of a cur-rent ratio of not less than 1.5:1 after declaration or repayment. In addition,PFL will implement a satisfactory cost control, accounting and management infor-mation system, which, inter alia, will provide information suitable for support-ing requests to the Government for fertilizer price increases to offset highercosts as they arise.

- 23 -
SUMMARY FORECAST FINANCIAL STATEMENTS(PRs Millions)
Year Ending December 31 1976 1977 1978 1979 1980 1981Capacity Production Start-up 75% 290 20% 90% 90%
Income StatementRevenue_/ - 468 562 575 585 590Cost of Sales - 291 328 328 328 328Other Charges2/ - 73 71 66 60 55Gross Profit before T;xes - 104 165 191 197 207Taxes and Workers' Participation
Fund 64 103 119 123 130Net Profit - 40 62 72 74 77Net Profit as % of:Sales - 9 11 12 13 13Share C pital - 11 16 19 20 20Equity3. - 11 15 15 15 15
Sources & Application of FundsCash Generation & Interest - 180 204 200 207 205Debt Service Requirement - 67 112 109 110 107Debt Service Coverage - 2.7 1.8 1.8 1.9 1.9Dividend Payment - 15% - - - 56 56 56
Balance SheetCurrent Assets 87 236 236 236 236 236Current Liabilities 20 157 171 145 148 150Working Capital 67 79 65 91 88 86Current Ratio 4.3 1.5 1.4 1.6 1.6 1.6Net Fixed Assets 967 894 821 748 673 602Long-Term Debt (LTD) 658 615 570 522 470 415Share C3pital 376 376 376 376 376 376Equity4/ 376 416 478 494 512 533Total LTD and Equity 1,034 1,031 1,048 1,016 982 948
LTD/Equity Ratio 64:36 60:40 54:46 52:48 48:52 44:56
1/ Gross revenue less freight, distributbr's allowance and development charge.2/ Interest and management assistance.i/ Beginning of year.j/ Assuming 15% dividend beginning in 1979.
- 24 -
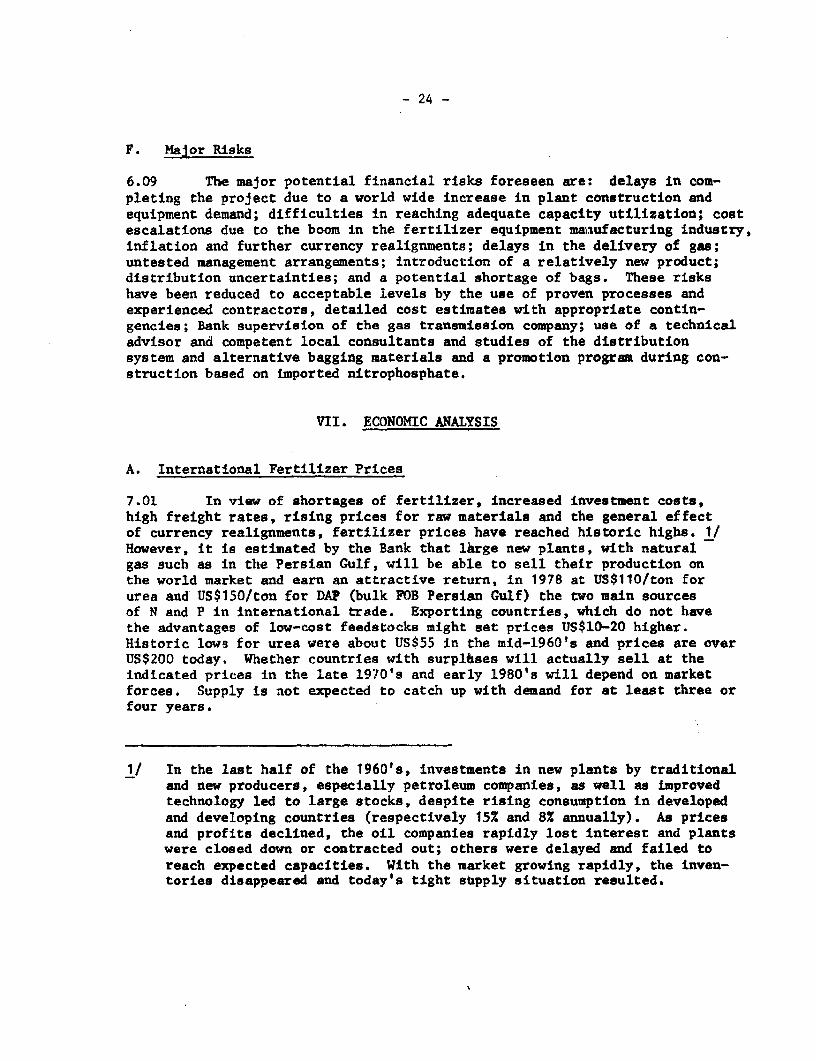
F. Major Risks
6.09 The major potential financial risks foreseen are: delays in com-pleting the project due to a world wide increase in plant construction andequipment demand; difficulties in reaching adequate capacity utilization; costescalations due to the boom in the fertilizer equipment maiufacturing industry,inflation and further currency realignments; delays in the delivery of gas;untested management arrangements; introduction of a relatively new product;distribution uncertainties; and a potential shortage of bags. These riskshave been reduced to acceptable levels by the use of proven processes andexperienced contractors, detailed cost estimates with appropriate contin-gencies; Bank supervision of the gas transmission company; use of a technicaladvisor and competent local consultants and studies of the distributionsystem and alternative bagging materials and a promotion program during con-struction based on imported nitrophosphate.
VII. ECONOMIC ANALYSIS
A. International Fertilizer Prices
7.01 In view of shortages of fertilizer, increased investment costs,high freight rates, rising prices for raw materials and the general effectof currency realignments, fertilizer prices have reached historic highs. 1/However, it is estimated by the Bank that lhrge new plants, with naturalgas such as in the Persian Gulf, will be able to sell their production onthe world market and earn an attractive return, in 1978 at US$110/ton forurea and US$150/ton for DAP (bulk FOB Persian Gulf) the two main sourcesof N and P in international trade. Exporting countries, which do not havethe advantages of low-cost feedstocks might set prices US$10-20 higher.Historic low3 for urea were about US$55 in the mid-1960's and prices are overUS$200 today. Whether countries with surplbses will actually sell at theindicated prices in the late 1970's and early 1980's will depend on marketforces. Supply is not expected to catch up with demand for at least three orfour years.
1/ In the last half of the 1960's, investments in new plants by traditionaland new producers, especially petroleum companies, as well as improvedtechnology led to large stocks, despite rising consumption in developedand developing countries (respectively 15X and 8X annually). As pricesand profits declined, the oil companies rapidly lost interest and plantswere closed down or contracted out; others were delayed and failed toreach expected capacities. With the market growing rapidly, the inven-tories disappeared and today's tight stapply situation resulted.

- 25 -
B. Economic Rate of Return
7.02 To calculate a realistic economic rate of return under currentuncertainties is difficult. Using US$130/ton for urea and US$170/ton 1/forDAP, both CIF Karachi in bulk form, plus US$15/ton for bags and freightfrom Karachi to warehouses in the Punjab would give ex-factory prices ofUS$145/ton for urea, Us$140 for NP and US$88 for CAN; these prices havebeen used for the economic return calculation of this project.
7.03 The cost of gas for the economic return has been taken at US$1.40per 1,000 cubic feet equivalent to US$54/ton or US$8 per barrel for fuel oil.This is necessarily an arbitrary assumption based on the Bank's review of theopportunity cost of gas for gas based fertilizer projects (Annex 7-1 page 3).Market prices, as in the financial return have been used for other rawmaterials. It was established that the gas to be used did not have a near-term alternative domestic use such as replacing oil imports 2/ and thatexporting gas (which is not contemplated) would require transportation andtransformation costs which would partially offset increased prices if exportsof liquified gas were used for the opportunity cost of gas.
7.04 Using the above assumptions and fund flows as detailed in Annex 7-1the project shows an economic return of 34% at 90% capacity utilization onthe basis of a 12-year operating life. The economic return is twice thefinancial return due to the elimination of high income taxes (60.5%) and theuse of forecast international fertilizer pr4ees which are more than twicethe current ex-factory prices in Pakistan. The economic return is sensitiveto selling prices, and gas and phosphate rock costs. However, the assumedprices have been calculated on a basis consistent with assumed costs andtherefore if input costs are raised, it is likely that international priceswill remain at levels which would provide good returns to the least costproducers. Sensitivity tests have been performed assuming a 12-month delayin start-up, maximum production of 80% and a 10% overrun on capital costs.Under the most adverse foreseeable combination of factors, the economicreturn is not expected to fall below 20%.
C. Foreign Exchange Savings
7.05 The estimated annual net foreign exchange savings attributable tothe project at 90% capacity is US$50 million and the foreign exchange invest-ment of about US$78 million can be recovered in less than two years (Annex 7-2).
1/ This is consistent with a price of US$40/ton CIF for rock phosphate usedas an economic cost.
2/ As indicated in Annex 4-5 latest estimates of Sui reserves are 8.9 trillioncubic feet out of which 4.9 trillion are committed. The project willdemand only about 4.3% of the uncommitted reserves over a 12-year operatinglife.

- 26 -
D. Other Economic Benefits
7.06 The unmeasured economic benefits of management and technical train-ing, and assured supplies of fertilizer, make this project particularly at-tractive. It is of high priority in the context of the Government's policyto attain self-sufficiency in food and to increase agricultural output andexports, and it puts to profitable use a valuable national asset, natural gas,which is presently under-utilized.
VIII. AGREEMENTS REACHED WITH THE GUARANTOR,NATIONAL FERTILIZER CORPORATION AND THE BORROWER
8.01 Agreements have been reached on the following major points:
The Guarantor (Pakistan)
(1) To provide funds to NFC for its equity subscriptionto PFL, to provide PFL further funds as needed to meet theMarch 1974 budget estimates and to charge a fee for itsguarantee on the Bank loan to raise the interest rate to9-1/2% per annum (paras 5.05-5.07).
(2) To provide additional funds as necessary in foreign exchangeand local currency to complete the project on terms and con-ditions satisfactory to the Bank (para 5.05).
(3) To assure that PFL will have a current ratio of at least1.5:1 at project completion date and of 1.2:1 thereafter andthat PFL will have a debt equity ratio as at project completiondate of not more than 65:35 (paras 5.05 and 6.08).
(4) To promptly issue import licenses as required by an agreedcrltical path schedule (para 4.12).
(5) To enable PFL to utilize an efficient and competitive dis-tribution network (para 3.12).
(6) To assure that prices will not be set at levels which wouldprevent PFL's shareholders from being able to achieve areasonable return on their investment (para 3.16).
(7) To use its best endeavors to import finished phosphate fertilizerfor promotional purposes through the construction period (para 3.09).
(8) To finance the expansion of the gas line capacity necessary forthe project (para 5.03 and 5.05).

- 27 -
(9) To make available for review by the Bank studies and programsto be prepared by December 31, 1974 and implemented by the Gov-erment relating to the provision of agricultural credit andthe improvement of fertilizer marketing and distribution(para 3.08 and 3.09).
(10) To assure the supply of the necessary quantity of fertilizerbags and to make available by June 30, 1975 for the Bank'sreview, a program for the production of such bags (para. 4.06).
(11) To ensure that the construction and operation of the heavywater unit will not interfere with the operations of PFLand to compensate PFL against any additional capital oroperating costs resulting therefrom (para 4.14).
National Fertilizer Corporation (;FC)
(1) To guarantee the Loan (para 2.01).
(2) To transfer its existing Multan fertilizer business toPFL by not later than June 30, 1976, and, in the meantime,to vest the management of the existing Multan plant in PFL(para 2.08).
(3) To limit its capital expenditures relating to the Multanfertilizer business prior to the transfer thereof to US$1million equivalent per year (para 2.01).
The Borrower (PFL)
(1) To employ a Managing Director and a General Manager (Project)with powers and responsibilities agreed by the Bank (para 2.05).
(2) To contract with a technical advisor and local engineeringconsultants acceptable to the Bank on terms and conditionssatisfactory to it (para 4.11).
(3) To observe the financial covenants regarding return on equity,debt and dividend limitations, current ratios and further capi-tal expenditures (para 3.16 and 6.08).
(4) To establish an adequate accounting, cost control and managementinformation system with the assistance of experienced consultants(para 6.08).
(5) To install and utilize pollution controls at Multan to meetenvironmental protection standards agreed with the Bank. Theoperation of these controls will be monitored by the Govern-ment (para 4.08).

- 2g --
8.02 In addition the making of satisfactory arrangements for the supplyof phosphate rock and natural gas for the project is a condition of effec-tiveness of the Loan (para 4.04).
8.03 Based on the above agreements, the project is suitable for a Bankloan of US$35 million equivalent for 15 years including a 4 year grace period.
Industrial Projects DepartmentApril 3, 1974

ANNEX 1-1
PAKIST _ Page 1
MULTAN FERTILIZER EXPANSION PROJECT
GLOSSARY OF TECHNICAL TERMS
1. Following is a description of the technical terms used in thisreport:
2. Plant Nutrients: Essential to plant growth are some 16 elements,6 in large and the remainder in small or micro quantities. Carbon, hydrogen,oxygen, nitrogen, phosphorus and potassium comprise the first six, and othersof lesser significance include calcium, magnesium, sulfur, silicon, zinc,iron, aluminium, manganese, boron, sodium, and copper. Carbon, hydrogen andoxygen are readily available from the atmosphere and water. Nitrogen,phosphorus and potassium -- three main nutrients -- and the other elementsare drawn from the soil. Unless supplemented by regular additions of materialscontaining the three main nutrients, soil is soon depleted of fertility bycropping. Uele of organic materials such as animal and vegetable wastes canbe utilized but the scale and intensity of modern agriculture have far exceededthe availability of natural "fertilizers." Consequently, the majority of theworld's primary plant nutrient needs are now supplied in the form of manu-factured or "chemical" fertilizers. To an increasing degree, secondarynutrients such as calcium, magnesiua, sulfur, and micro nutrients such asboron, zinc, copper and manganese are also added to soils along with theprimary nutrients in ratios prescribed by agronomists according to specificcrop and soil needs.
3. Chemical Fertilizers: Chemical compounds suitable as fertilizersshould be high enough in nutrient content; stable to avoid hazards and hand-ling problems; and readily water soluble and available to plant root systems.Commercially available materials meeting these requirements to a largedegree are:
Primary Fertilizer Materials
% of N % of P20 % of K20Nutrient Nutrient Nutrient
Urea 46% Triple Super- Potassium Chloride 61%Armonium Nitrate 34% phosphate 46% Potassium Sulfate 54%Amonium Sulfate 21% Single Super-Diammonium phosphate 18%
Phosphate 18% DiammoniumPhosphate 46%
Because of the high nutrient content of urea, diammonium phosphate andpotassium chloride (KCL), they are some of the most popular fertilizermaterials in the world today. It is the common practice to report thenutrient content of materials in terms of percentages of N and P2 05(phosphorus pentoxide) and potassium K20 (potassium oxide).

ANNEX 1-1Page 2
Complex or NPK Fertilizers: All three primary nutrients (N,P205, K2 0) are frequently applied to the soil at the same time in ratiosvarying with the nutrient requirements of different crops. To facilitatehandling, the several required chemicals are usually agglomerated into uni-form granules for distribution. The analysis of each nutrient is given asa ratio to describe the NPI product. Thus 15-15-15 complex fertilizercontains 15% each of N, P205 , and K20; and 12-24-12 complex fertilizercontains 12% N, 2h% P205 and 12% K20.
5. Phosphate Water Solubility: The agronomic availability (orefficiency) of phosphate materials vary substantially. A common practice isto use water solability as a criterion although in acidic soils it is a lesssignificant factor. Higher P205 water solubility permits the fertilizer tobe absorbed more rapidly. The minimum recommended in most cases is about60% solubility but in some cases up to80-85% solubility is preferred.
6. Ammonium Nitrate (AN) is produced by reacting ammonia with nitricacid. Nitric acid (HN03), in turn, is made from ammonia (NH3). AN contains34.S5 niiirogen, half in the ammonium form and half in t1he nitrnte form, andis very hydroscopic. It also is a commercial explosive. In many countries, adiluent -- e.g. limestone -- is added to lower the analysis and negate theexplosive properties as well as to minimize the hydroscopic properties.
7. Diammonium Phosphate (DAP)or chemically (NH4)2HP04, is producedby reactin-g NH3 with phosphoric acid (H3PO4) followed by granulation anddrying.
8. Partial Oxidation is a method of producing hydrogen from hydro-carbon fuels of almost any type by a non-catalytic reaction with oxygenfollowed by removal of the by-product, carbon monoxide.
9. Feedstocks are the hydrocarbons used to produce hydrogen for theammonia Jynthesis; in the propoaed Multan plant, the feedstock would benatural gas which is usually the most economical choice when available.Other potential feedstocks are naphtha, fuel oil, crude oil, coal or lignite.
10. Urea is known chemically as carbamide or NH2CCNH2 - the normalamide of caronic acid; this compound contains about 46% N, all in theawmonium form. It is considerably less hydroscopic than ammonium nitrateand it is the most widely used straight nitrogen fertilizer today.
11. Urea Sythesia: Urea is made by reacting ammonia with carbondioxide* Since both of the materials are produced during the ammoniasynthesis, urea production is usually undertaken alongside an ammonia plant.Unfortunately, the corresponding acid of carbon dioxide (carbonic acid) doesnot form stable ammonium salts as do nitric, sulfuric or phosphoric acids.

ABEI 1-1Page 3
Therefore, simple neutralization as used in making ammonium nitrate andsulfate fertilizers is not possible. Instead, ammonia and carbon dioxideare combined under heat and pressure to make ammonium carbomate which,although unstable, can be dehydrated under pressure to form urea, a stablecompound. Againiunfortunately, the overall reaction is completely reversibleand even at 300 atmospheres pressure and 2000C, the conversion to urea in asingle pass through the reactor is under 70%. This introduces severalcomplications: high pressure must be used to maximize conversion; unconvertedreactants must be separated and recycled; increased corrosion under the hightemperatures and pressures used musat be overcome, and urea decomposition intoundesirable products must be minimized. In recent years, several engineeringand producing companies have developed ways of surmounting these problems,and large plants capable of producing a thousand tons per day, or more, ofurea to rigid chemical and physical specifications are now operating success-fully for long periods throughout the world.
Petroleum Units and MeaBures
12. The petroleum industry historically has used units of measurebased on the English measuring system. Conversion rates for some unitsare given below:
1 barrel = 2 US gallons;. US gallon = 0.95 liters = 0.00095 M3 ;. ton crude oil = 7.0 barrels (approximately, based on the crude
oil specific gravity); and1 ton oil 1.25 Y3 of natural gas (approximately, based
on oil and gas compositions)
The conversion rates between volumetric units, such as gallons, and weightsare approximate since the specific gravity of the oil varies slightly withits composition.
13, Materials that exist in the form of gases, such as methane(natural gas), are measured in volumetric units. Since gases are compressible,standard conditions of temperature and pressure (00 C and 1.0 atmosphere )are used to define the quantity (in volume) of gas, and designated as"normal cubic meters" or "normal cubic feet."
Industrial Projects DepartmentMarch 197h


ANNEX 1-2Page 1
PAKISTAN
MULTAN FERTILIZER EXPANSION PROJECT
Alternative Eroject-Scope Studies
Background
Prior to approaching the Bank in early 1972, the Government ofPakistan had commissioned several studies on the Pakistan fertilizermarket and Multan plant expansion possibilities by companies such asHumphreys and Glasgow Ltd. (UK), Arthur D. Little Inc. (USA), and ChemicalConsultants Ltd. (Pakistan). All indicated a need to produce and use morephosphate fertilizer in addition to nitrogen. The availability of naturalgas in the country at reasonable prices, and the absence of indigenous sulfuremphasized to these consultants the potential advantages of making nitrophos-phates (NP). This was because (i) these products could be made by solubilizingphosphate rock with nitric acid made from amronia produced from Pakistan's ownnatural gas instead of using sulfuric acid made from imported sulfur; (ii) anitrophosphate such as 23-23-0 with the ;:l N to P205 ratio isideal for the major basal (seed) application markets; (iii) farmers who had notpreviously used phosphate (because of unavailability or reluctance) would auto-matically do so when applying nitrophosphate. Other reasons included a hightotal nutrient content (46%), a familiarity and liking for_the co-productcalcium anmonium nitrate (CAN) by many Pakistani farmers, plus the extensiveexperience of the Multan plant in making ammonia, nitric acid and CAN.
Most important, however, was the suitability of nitrophosphates forPakistan's soils and crops. This was studied intensively by international anddomestic agronomists with the general conclusion that modern nitrophosphateshavirg phosphate water solubilities up to 80% gave crop responses at leastcomparable with mixtures of other N and P fertilizer such as anmonium nitrate,anmoniui sulfate or urea, with diammonium phosphate and superphosphates (Annex 3-1).Accordingly, WPIDC decided to produce NP in conjunction with more CAN, based on alarge new ammonia plant that would have sufficient capacity to meet the needs ofthe existing CAN and urea units.
Possible Alternative Projects
Alternative Location
Various alternatives were investigated such as (i) building therequired additional facilities elsewhere; (ii) shutting down Multan and build-ing a new NP/CAN plus urea plant with a capacity equal to the combined capacitiesof the old and proposed new Multan plants at another site. The availability ofample experienced labor, space, transportation and existing amenities atl4ultan, plus operating downstream urea, nitric acid and CAN units outweighedany potential advantage of relocation.

AN1NEX 1-2Page 2
Alternative Products, Processes and Plant Sizes
At the request of the Bank, in early 1973, Chemical ConsultantsLtd., Pakistan, were asked to study the following alternative cases,the larger ones were included as Multan was understood to be the only ferti-lizer project sanctioned by GOP at that time.
CasesProduction 1 2 3 4 5
Ammonia, tpy capacity 300,000 400,000 400,000 400,000 300,000Ammonia, tpd capacity 910 1,200 1,200 1,200 910P205 tpy capacity 70,000 100,000 100,000 70,000 70,000P205 tpd capacity 235 335 335 235 235
Products! /
Nitrophosphate 23-23-0- Made at Multan, tpy 320,000 457,ooo - 320,000 -
CAN4 - Made in old and 2new Ntiltan plants, tpy 400,000 540,000 109,000 -/ 390,000 109,000i
Urea - Made in old andnew Mialtan plants 72,000 72,600 337,000 230,000 279,000Monoammonium Phosphate/
Urea (UAP) 28-28-0- from phosphoric acid
and urea made at Multan - - 356,ooo _ -
- from imported MAP andurea made at Multan - - - - 250,000
1/ Based on 90% ammonia plant capacity and optimum product mix.2/ In the old plants.
As can be expected, economies of scale resulted in higher calculatedrates of return for the larger plants, but the cases based on a smaller ammoniaunit (1 and 5) are quite viable. However, Case 5 using imported MAP is highlyconjectural, as this material is unlikely to be readily available on the inter-national market in reliable, substantial quantities for several years, and itsuse would expose Pakistan's fertilizer and food production to foreign exchangeavailability and other uncertainties. The rates of return comparisons areshown below, for the conditions prevailing when the study was made:
Cases1 ~-2 3 4 5
20 Year DCF 13.5 17.5 15.0 16.0 14.5

AN,ThJEX 1-2Page 3
Based on the larger plant sizes, producing urea-anmonium phosphatefrom urea and MAP made at Multan (from imported sulfur and phosphate rock)shows a slightly lower DCF than producing nitrophosphate (Cases 3 and 2). Inaddition, producing the required wet-process phosphoric acid would need annualforeign exchange expenditures of US$3.5 to $4 million for sulfur, which wouldnot be required in nitrophosphate manufacture.
Plant sizes must also be considered. In terms of other largefertilizer installations already built and operating successfully in develop-ing countries, the sizes of units indicated in Cases 1 and 5 are considered aboutthe maxima at the present time, especially as far as single-stream plants areconcerned. These are based on 910 tpd ammonia capacity, whereas the DawoodHercules plant which came on stream in November 1971 has only 620 tpd ammoniaunit. It is considered that building a 1,,200 tpd ammonia unit plus correspond-ingly large downstream plants, as indicated in Cases 2, 3 and 4 would at thistime, expose the project to greatly increased financial risk and loss of productbecause of urforeseen operating problems.
Because of the foregoing reasons, WPIDC and its consultants,recommended the adoption of Case 1 as the basis for the project, and this wasaccepted by ADB and IBRD.
Industrial Projects DepartmentMarch 1974


Page 1
PAKISTkA1
MULTAN FERTILIZER EXPANQSION PROJECT
Dawood Hercules (DH) Project
Results to Date
Summary
The Bank and IFC helped to finance the DH project with US$32 nillionloan and a US$2.9 million equity investment respectively (Report AA-4a datedJune 20, 1968). The plant, with a capacity of 341,000 tons of urea annuallyl/is located near Lahore. Commercial operations began on schedule in Noveniber1971 and DH produced 282,500 tons (82% capacity) in the fiscal year endedOctober 31, 1972. Production in the year ended October 31, 1973 over 100%capacity.
The actual cost of the project was US$84.6 million equivalentcompared with the appraisal estimate of US$78.2 million. The overrun was dueto increased customs duties and other governmental levies. The local currencyoverrun was financed by short-term credits. The Bm k loan disbursements, as aconsequence of currency realignments were equivalent to US$35 million atcompletion of the project.
ProfiCs for the year ended October 31 1973 were PRs 49 millionrepresenting a return on share capital of 33%.2. If the share capital wasrevalued to its original US$ equivalent, the return would be reduced to 17%.Since October 1973, the company's distribution have been interrupted by achange over in distribution from private agents to the Punjab governmentagency which is now distributing 50% of DH's sales in the Province (88% oftotal DH sales).
Pricing
The Company's ex-works price of PRs 648/ton was established inSeptember 1972 in conjunction with the new retail price of PRs 700 then set bythe government. DH was able to reduce its distribution margin from PRs 62/tonto PRs 52/ton at that time because of transportation economies possible in theLahore area. The effective ex-works price received by DH's competitors inhigher than PRs 6h8/ton.
Financial Performance
The Company's first full year of operation, ending October 31, 1972was adversely affected by the May 1952 rupee devaluation from PRs 4.76 = US$1.00to PRs 11.0 = US$1.00. Price relief was not granted to DHT until September 1972.At that time, the ex-works price was increased from PRs 508 /ton to the presentlevel of PRs 6h8/ton. The Company reported a small profit of PRs 0.5 millionfor FY 1972.
]/ 620 tons per day (tpd) of ammonia and 1,100 tpd of urea.2/ DH has used accelerated depreciation to reduce taxes to zero for 1972
and 1973. The deferred taxes (PRs 20 million in 1973) are included inequity but cannot be distributed. If DR paid normal taxes (60%), thereturn would be reduced from 33% to 13% on share capital.

ANNEX 1-3Page 2
Production Costs
The price of natural gas was increased in September 1973 by 22%,a cost increase equivalent of PRs 17/ton of urea. Annual profits will bereduced by PRs 6 million unless DH is permitted a compensating price increase.
The other manor operating cost item is bagging. DH uses cotton bagswith a polyethylene liner. The liner film is produced at the plant fromimported polyethylene beads. Cotton bags are locally purchased. In mid-1972, the bagging cost to DH was PRs 54/ton. Price increases of cottonraised this cost to PRs 76/ton by September 1973. Further cost increasesare expected and PRs 85/ton is the assumed future cost. Other productioncosts shown below are in line with recent experience.
PRODUCTION COSTSat 345,000 ton/year operating level (100%)
PRs/ton
Natural Gas 96Bags 85Labor 25Catalysts and Chemicals 17Use Taxes and Plant Overhead 21Maintenance Materials 10
Total Production Cost 25h
Depreciation 159
Total Manufacturing Cost 13
Mlanageraent
Although the Sponsors have equal equity positions, Hercules haddominated the company through its right under the original ManagementAgreement to select the General Manager. Dawood's position had beenweakened by the Government's cancellation of all Managing Agent agreements.
The sponsors have now reached a new agreement to share the manage-ment responsibilities. The new management agreement was approved by theDH Board of Directors in October 1973. Consistent with the agreement, theformer General Manager, John Eagan, has now assumed the post of ExecutiveDirector. The new General Manager is Razak Dawood.
Distribution System
Distributors
Wnen DH began operations in November 1971, it initially dividedproduction equally between three distributors - Dawood Corporation (DCL),Pakistan National Oil (PNO), and Jaffer Brothers. Subsequently, DH ad-iusted the production allocation based on the ratio of actual sales during

ANNEX 1-3Page 3
the first slack sales season. From April 1972 to September 1973, DCL received43%, PNO 27% and Jaffer Brothers 30% of output. Since October 1973, 50% ofDH's production is sold in the Punjab through PASC.
Distribution Margin
The initial distribution margin given to distributors was PRs 70/ton and DH product was distributed nationally. On July 1, 1972, fertilizerdistribution policy was made a provincial government responsibility. ThePunjab Government thereafter required DH to distribute 8&% of its output inPunjab, with 12% allocated to North West Frontier Provinca. Because ofresulting lower transportation costs, DH reduced its margin to an averagePRs 62/ton. DH initiated a further margin cut to PRs 52/ton in September1°72. PNO and Jaffer Brothers objected to reduced margins but the Govern-ment upheld DH. Apparently, distributors benefit from low truck haulagecharges prevailing in Lahore, a net surplus area for empty trucks.
Private Dealers
Punjab has had 1,200 private dealers in 372 locations. Thelocations nave been an average 25 miles apart and an estimated 90% of thefarmers live within 10 miles of a sales point. The average dealer hasbeen selling Loo tons of fertilizer per year. In taking over fertilizerdistribution, the Punjab Government claimed that the private sector hadmade insufficient effort to distribute in rural areas. PASC plans toestablish 450 sales points.
Sales Terms
DH sells on a cash basis with daily invoicing and a three day pay-ment lag. Plant receivables have been minimized by this procedure. PASChas also agreed to pay on this basis. DH has provided an average distribu-tion margin of PRs 52/ton by using a two-tier price system based on dealerdistance from the plant.

ANNEX 1-3Page 4
Below 150 miles Above 150 milesPRs PRs
Ex-Works Price 6 50/ton 640/tonDealer Margin 22/ton 22/tonDistributor Margin 8 /ton 8 /tonTransportation Cost 20/ton 30/ton
Fixed Retail Price 700/ton 700/ton
Financial Performance to October 31, 1973(PRs Millions)
Fiscal Year ending October 31 1972 1973
Production (tons) 282,500 350,000*Sales (tons) 285,800 350,000*
Sales 149.0 210.6
Cost of Sales
Material 28.6 43.6Labor 9.1 8.9Fuel and Power 14.7 16.3Repairs and Maintenance 7.4 4.2Insurance 5.4 1.3Other 4.8 4.oAmortization 1.0Depreciation 35.1 59.3Inventory Adjustment 1.1 (1&44)
Total Cost of Sales 107.1 123.2
Gross Income 87.4
Operating Expenses 2.2 4-9
Operating Income 32.6 79.4
Other Income .8 4.9Interest 32.6 32.8Other Expenses .2 2.6
Net Profit .5 49.3
*Estimated.

ANN.I!X 1.-3
Balance Sheet as of October 31, 1973*(PRs Millions)
Current Assets Current Liabili-ties
Cash and deposits 86.4 Payables 39.r-Receivables 22.8 Current maturity long-
term loans 50.4Inventories 56.3 Worker participation 2.6
Tot-al Current Assets 165.5 Total Current Liabilities 92.5
Fixed Assets Long7-Term Liabilities
Net Plant & Equipment 493.1 USAID Loan 67.6Deferred Expense 1.5 Custom Duty 6.9Exchange Equalization IBRD Loan 356.8
Rate 1.9 Other .3Current Maturity (50. 4 )
Total Fixed Assets 496.5 Net L.T. Debt 381.2
3quity
Undistributed Earnings 49.3Share Capital 13?.O
Total Equity 188.3
Total Assets 662.0 Total Liabilities 662.0
Current Ratio 1.8:1 Long-Term Debt Equity Ratio 67:33
Industrial Projects DepartmentJanuary 1974


ANNEX 1 -.4
PAKISTAN
MULTAN FERTILIZER EXPANSION PROJECT
The Fauji Foundation Urea Project
Fauji Foundation is a non-profit charitable trust set up in 1953 andoperated by ex-military personnel. It is active in sugar, cotton, textiles andfood production. It has received Government permission to set up an ammonia/urea plant based on Mari natural gas at Goth Macchi in the Punjab Province,about 40 km from the Sind/Punjab border. Initially it was intended for theplant to be a virtual duplicate of the Dawood Hercules anmonia/urea plant nearLahore (i.e. 620/1,l10 tpd) but a more economical larger sized plant of up to1,000/1,700 tpd ammonia/urea is now being considered, provided the necessaryfinancing can be obtained. On the invitation of IFC, U.S. Steel has expressedan interest, in principle, in making an investment ir the project and providingtechnical and marketing assistance. Based on the market forecast detailed inAnnex 3-2,no urea oversupply should be created in Pakistan if Fauji were to buildthe envisaged larger plant and commence production around 1977/78. In mid-1973project costs were estimated at US$95.3 million including all offsites, financ-ing charges and working capital for the (smaller) 1,100 tpd urea plant (thesimilar D-H plant completed at the end of 1971 cost US$84.6 million).
Consolidated financial data for the Fauji Foundation are given below:
Fauji Foundation
Consolidated Financial Data in PRs. Million
1970 1971 1972 1973 (est)
Capital Employed 135.6 143.4 282.0 351.1Net Worth 116.0 132.1 160.2 162.5Long-term Debt 19.6 11.2 121.8 188.6Debt:Equity Ratio 14:86 8:92 43:57 54:46
Net Fixed Assets 34.1 31.2 167.7 260.3Net Current Assets 21.6 26.5 40.1 42.7
Net Sales 121.8 111.2 202.4 346.3het Income 12.6 14.0 30.2 25.2
Income as > of Sales 10.4 12.6 14.9 7.3Income as % of Net Worth 10.9 10.6 18.8 7.2
Employment approximately 15,000
Production:
Sugar tons 45,732 21,965 40,992 58,523Cloth 1,000 yards 19,607 21,895 38,214 78,693Yarn 1,000 lbs. 9,628 9,180 13,900 23,623
Industrial Projects DepartmentDecember 1973

k

ASt s'. "' -
Page 1
FAKISTAN
MULJTAN FERTILIZER EXPANSION PROJECT
SPONSORS AND MANAGEMET
A. WEST PAKISTAN INDUSTRIAL DEVELOPMENT CORPORATION (WPIDC)
WPIDC, the owner until March 1974 (when its fertilizer business trans-ferred to the newly created National Fertilizer Corporation) of tLa presentnatural gas fertilizer facilitie- at Multan, is a government-owned and contrcKledcorporation established in 1962.1/ The main functions of WPIDC have been pro-'motion of the economic and industrial develo-pment of Pakistan through operationand management of completed projects and planning new schemes in accordance withthe targets laid down in the overall development plans of the country. Theauthorized share capital of the Corporation is PRs 10 million divided into 100shares of PRs 100,000 each, of which 45 shares have been issued and subscribedin full by the Government of Pakistan.
WPIDC has established and managed enterprises in various industriesincluding sugar, cement, fertilizers, chemicals, textiles and mining. As ofJune 30, 1973, WPIDC had completed 59 industrial projects (including 33 projectsinherited from its predecessor, PIDC) at a capital cost of PRs 1,230.4 million.
Under the Government's August 1973 decision to reorganize the publicindustrial sector with a view to making the sector more efficient, WPIDC isbeing restructured. Five new corporations have been set up to take over andmanage WPIDC projects in the fields of heavy engineering and machine tools,fertilizers, cement, heavy electricals and chemicals. In fertilizers, the NFCwas established to take over WPIDC's share of Pak-,nerican Fertilizers Ltd. atDaudkhel, the Multan Factory and Lyallpur Chemicals and Fertilizers Ltd.
WPIDC had a total staff of 22,406 as of June 30, 1972, of whom 1,228were at the head office at Karachi and the rest at branch offices and completedplants throughout the country. As a result of reorganization tf WPIDC announcedin August 1973, some of the WPIDC staff are being reassigned to NFC.
B. ABU DHABI NATIONAL OIL CORPORATION (ADNOC)
ADNOC was established in 1971 as an autonomous government company toexplore and exploit oil; search for natural gas; and refine, transport and selloil in Abu Dhabi and abroad. ADNOC's authorized capital is Bahraini Dinar 20million to be provided by the Government and it is empowered to borrow up tothree times its capital. The Company is tax exempt and obliged to pay 55% of itsannual profits to the state. ADNOC's headquarters are in Abu Dhabi and it mayestablish branches and agencies in other countries.
1/ Its predecessor, the Pakistan Industrial Development Corporation (PIDC),was created in 1952 and divided in 1962 into WPIDC and the East PakistanIndustrial Development Corporation (EPIDC). Its successor in the fertilizerbusiness (NFC) is a GOP owned, private company with an authorized share capitalof PRs 1,000 million. It was incorporated in August 1973 and WPIDC's ferti-lizer business was transferred to NFC by order in March 1974.

ANNEX 2-1Page 2
The Minister for Oil and Industry is chairman of the seven memberboard under the Abu Dhabi Council of Ministers. Cabinet approval is necessaryfor exploration and drilling for oil and gas, for the establishment ofpermanent companies or participation in other companies and for obtainingforeign or domestic loans. ADNOC's Director General is appointed by theCouncil o Ministers and he is assisted by four Directors-for TechnicalAffairs, Economic Affairs, Legal Affairs and Finance & Administration.
C. MANAGXMENT OF PAK-ARAB FERTILIZER LIMITED (PFL)
PFL has selected Mr. A. U. _,oan to be Managing Director and Mr. Z.A. Khan to be General Manager (Project) as shown in the attached organizationchart. The existing facilities will be managed by the General Manager (Plant)Mr. Hafizullah under the direction of the Managing Director.NFC has the right toappoint 8 board members and ADNOC 4. The initial Board of PFL is composed ofWPIDC and NFC executives, Government of Pakistan officers and representative ofADNOC. Further appointments including outside directors are to be made. Alist of present Board members is attached. The Managing Director has been withSui Northern Gas Pipelines Ltd. since 1967; most recently as the seniortechnical officer. He holds a degree in Mechanical Engineering from the PunjabUniversity and has received training at institutions in the United States,United Kingdom and Canada in Petroleum and Natural Gas Engineering. Mr. Loan'sexperience with IBRD projects and his familiarity with gas transmission shouldbe valuable to PFL. He is known to Bank staff and considered capable ofdirecting PFL's operations in concert with the consultants, technical advisors,and engineering contractors.
The General Manager. (Project),Mr. Khan has 20 years experience withWPIDC plants and will be responsible for site supervision of the Project. He isa graduate engineer from the Punjab University and has received training andvisited plants in several European countries, the United States and Japan.Mr. Khan's experience in construction and operation of WPIDC's plants andfamiliarity with the Multan plant should complement Mr. Loan's exDerience.
Mr. Hafizullah's qualifications include degrees in engineeringfrom the Puniab University and training in France. He has been with WPIDCfor 20 years including over 10 years at Multan.
All three executives are in their mid-forties and have demonstratedtheir abilities. With the assistance of outside project and management ad-visers as provided as well as suitable departmental heads they appear to bethe nucleus of a satisfactory management team.

Annex 2-1Page 3
PFL will have the following Directors as soon as the Loans are effective.
1. Mr. A. H. A. KaziChnirman WPIDC
2. Dr. A.K. QureshiGeneral Manager(Chemical Industries)WPIDCKarachi.
3. Mr. Amanullah DurraniMember FinanceBoard of Industrial Management
4. Mr. A.U. LoanManaging DirectorPFL
5. Mr. Syed Baber AliChairman -National Fertilizer Corporation
6. Mr. Fadbil KhanRepresentativeAIINOC
7. Mr. Sharef El DinRepresentstiveADNOC
Five Directors will be appointed later, 3 by NFC and 2 by ALDOC.


PAKISTANMULTAN FERTILIZER EXPANSION PROJECT
ORGANIZATION CHARTPAK-ARAB FERTILIZER, LIMITED
BOARDPAK-ARAB AUDITOR
(FERTILIZER) UIOBABER ALl -CHAIRMAN
MANAGING TECHNICAL
DIRECTOR ADVISORAMAN ULLAH LOAN
PROJECT EXISTING1PLANMANAGER AMANITAGERN MANAGER MANAGER EITN LN
ZAHUR AHMED ADMNPERATNNE FiNANCE & MARKETING MANAGERKHAN PERSONNEL CONTROL MR. HAFIZULLAH
(Mech) Duw w :Gn. Stre ing A Sf.C ion' motion
F1I
-TO BE CREATED IN THE SECOND .STAGE OF DEVELOPMENT.
World Bank-8372
INDUSTRIAL PROJECTS DEPAATMENTJANUARY 1974


ANNEX 2-2rage=
PAKISTAN
MULTAN FERTILIZER EXPANSION PROJECT
FINANCIAL RESULTS OF EXISTING PLANTS
Past Performance of NGFF
The summarized income statement of NGFF during the past five yearsis given in 'the Table below together with forecasts for the next three years.NGFF has been receiving subsidy from the Government to offset the operatinglosses during these years. With the subsidy, NOFF could barely meet thetotal expenses for the operation.
SUMMERY FINANCIAL. STATHMENTS(PRs. million)
Fiscal Year Ended Actual lorecastJune 30 1969 1970 1971 1972 1973 1974 1975 1976
---------------------------unousand tons------ -------------VolumeUrea
- Produced* 49 (21)* 48 (21) 29 (15) 27 (12) 14 (6)11 48 (21) 48 (21) 48 (21)*- Sold 52 31 15 47 15 48 48 48
ANL- Produced* 75 (17)* 86 (22) 87 (22) 78 (20) 67 (16) 85 (21) 85 (21) 85 (21)*- Sold 73 75 55 108 70 85 85 85
Revenue -------------------------millions of rupees-------------------------Sales 52 45 33 71 50 83 83 83Subsidy 28 31 13 32 16 8 8 8
Su 76 4T I5 6- pI pr 9
Profit (Loss) 7 12 (2) 1 (4) 16 18 19
Gash Generation2/ 24 28 16 19 13 36 38 39
A Fixed Assets (Net)Existing Plant 170 151 134 129 113 91 77 48
B Working Capital andSurplus Cash 80 109 105 64 32 79 117 156
C Transferred to WPIDC 47 47 67 160 207 189 189 189
Invested Capital (A+B+C) 297 307 306 352 352 359 383 393
*Figures in parenthesis show thousands of nutrient tons of nitrogen.
1/ Production reduced due to strikes and compressor failures in the ammonia units.7/ Profit (including subsidy) plus depreciation.

ANNEX 2-2Page 2
The high cost of production has been overcome by artificial means and theuncompetitive product (which is being remedied by ongoing investments) hasonly been successful in the years 1970/71, 1971/72, and 1972/73. Due tothe lack of ammoni-, one of the two ammonia units being frequently out ofoperation, the operating cost per ton was substantially higher than inter-national levels.
The unfavorable situation in production was reflected in NGFF'sbalance sheets and cash flow statements. T.le inventory reached the level ofmore than a year's sales in 1970/71, and the average during the past six yearswas eight months' sales. Accounts receivable were also at high levels,reaching in 1969/70 to seven months aales and averaging about four months salesfor the past six years. These high levels of current assets kept the averagecurrent ratio at a high level of W:1, reaching its highest of 7:1 in 1970/71.
Deficiencies in financial aspects derive from various reasons. Thebasic ideas applled in the financial management of NGUF were those of agovernment agency, not of "commercial" corporations.

ANNEX 2-2Page 3
Historical Income Statement(PRs. million)
Fiscal Years(Ended June 30) 1967/68 1968/69 1969/70 1970/71 1971/72 1972/73
Capacity Utilized (%)ANL 75.0 72.0 83.0 84.o 76 64.9Urea 73 82 80 49 !46 23.6
Tons Produced (000)ANL 77.2 74.6 85.8 87.0 77.9 66.9Urea 43.5 48.7 47.6 29.0 27.3 14.1
SalesANL 21).8 17.9 21.0 18.0 36.4 30.1Urea 20.9 25.1 15.1 7.0 21.5 14.7Others 8.2 9.2 9.3 7.6 12.7 5.6Sub-Total 53.9 522 7 2. 70.6 50.7
Subsidy 28,8 28.3 31.0 13.4 32.0 16.0Total Revenue 8288 76,.0 102,76 7
Variable Costs of ProductionSui Gas (Variable Portion) 3.5 3.5 4.6 4.7 4.8 3.9Power 7.5 7.5 10.6 10.0 12.0 9.7Other Raw Material .5 .5 .6 .7 .6 .6M;nnufacturing Chemicals 1.2 1.9 2.0 2.4 1.9 2.5Packing Material 9.4 9.0 9.9 5.8 9.0 5.5Ammonia Produced by Ammopac - 1.7 3.2 - - -
22.1 24.1 30.9 237 28.3 22.2
Change in Inventory 5.5 1.7 (13.0) (20.3) 22.3 10.5
Fixed ExpensesSui Gas (Fixed Portion) 2.0 2.4 2.4 2.4 2.4 2.4Stores & Spares Consumed 1.9 2.8 3.0 2.6 3.2 2.7Salaries (Maintenance) .9 1.4 1.8 1.7 1.5 1.7Repairs & Maintenance
(Outside) .1 .1 .1 .1 .1 .3Salaries & Wages 2.14 2.9 3.4 3.7 3.8 3.8Staff Expenses .8 1.4 1.9 1.h 1.4 1.4Administrative Expenses 1.2 1.2 1.4 .4 .6 .7Insurance .4 .3 .4 .4
9,8 12.7 14.4 12. 13. Selling & M4arketingExpensesVariable-
Incidents 7.1 7.l4 6.6 4.4 9.6 3.6Freight Outward 1.6 1.6 1.6 .2 .2 1.5
Fixed-Sales Expenses(Including Salaries) .1 .2 .2 1.0 2.4 .2
_T.7 9.2 -7T12.2 53Depreciation 16.6 16.6 16.3 18.0 18.2 16.4Interest 12.8 13.5 13.4 13.9 16.2 16.3Other Income 3.7 4.7 6.1 5.4 9.0 13.8Net Income BeLore Taxes 10.9 7.4 12.1 (2.0) (1.0) (3.9)Taxes - - -Net Income 10.9 7.4 12.1 (2.0) (1.0) (3.9)

ANNEX 2-2Page 4
Historical Sources and APplication of Funds(PRs. million)
1967/68 1968/69 1969/70 1970/71 1971/72 1972/73
Sources of Funds
Net Income beforeInterest & Taxes 21.9 20.9 25.6 11.9 15.9 12.9
Depreciation 16.6 16.6 16.3 18.0 18.2 16.4Borrowings (Foreign
& Local) 7.6 _ 5.4 12.0 3.0
Total 46.1 37.5 47.3 29.9 46.1 32.3
Application of Funds
Fixed Assets 18.3 (0.1) (3.2) (0.1) 13.3 0.7Inventories (5.9) 4.4 11.0 18.3 (20.4) (10.9)Receivables!/ 31.6 17.7 16.6 6.5 66.o 37.9Liabilities (2.1) 0.9 4.1 0.8 (1.5) (22.1)Interest 12.8 13.5 13.4 13.9 16.2 16.3Loan Repayment 0.7 0.8 0.8 0.8 3.8 2.3
Total 55.4 37.2 42.7 40.2 77.4 24_.2
Annual Cash Surplus (9.3) 0.3 4.6 (10-3) (31.3) 8.1Opening Balanceof Cash 63.7 54.4 54.7 59.3 49.0 17.7
Ending Balance ofCash 54.4 54.7 59.3 49.0 17.7 25.8
Debt Service Coverage 3.0 2.6 2.9 2.0 1.8 1.5
1/ Including transfers to WPIDC head office.

ANNEX 2-2Page 5
Historical Balance Sheets(PRs. millionJ
1967/68 1968/69 1969/70 1970/71 1971/72 1972/73
AssetsCurrent Assets
Cash 54.4 54.7 59.3 49.0 17.7 25.8Receivables 16.4 12.5 26.7 13.5 32.3 20.8Inventories 25.7 30.1 41.1 59.4 39.0 28.1Other Assets 0.4 0.6 0.5 0.2 1.0 3.7
96.9 M7 127.6 122.1 90.0 7u .7
Fixed AssetsGross Assets 276.8 277.3 271.3 271.2 284.5 285.2Less Depreciation 91.3 107.8 120.0 137.7 155.8 172.2Net Assets 185.5 169.5 15T1. 133.5 126T7 T11T30
WIPDC Accounts-9/ 40.9 47.3 46.5 66.5 159.9 206.6
Total Assets 323.3 314.7 325.4 322.1 378.6 398.0
LiabilitiesCurrent Liabilities 12.4 11.5 7.3 6.6 8.1 30.2Long-term Debt
Foreign Loansi/ 6.8 6.1 8.5 7.6 18.2 15.9Local Loans - - 2.3 2.3 - -
Total Liabilities T177r ibi5 :75 4:
CapitalCnover3nent Funds 237.5 237.5 237.5 237.5 237.5 240.5Special Reserve 45.1 45.1 45.1 45.1 45.1 45.1Surplus 21.5 14.5 24.7 23.0 69.7 66.3
Total Capital 304.1 297.1 307.1 305.6 362.3 351.9
Total Liabilities& Capital 323.3 314.7 325.4 322.1 378.6 398.0
1/ The loan from Germany for the ammonia plant, contracted in 1967(outstanding amountfPRs.8.7 million) and a Dutch loan for gas enJinecompressor, contractea in 1967 (outstanding amount PRs.7.3 million).
2 Surplus cash transferred to head office in lieu of repayment of Governmentfunds.
Industrial Projects DepartmentDecember 1973


Annex 3-1Page 1
PAKISTAN
MULTAN FERTILIZER EXPANSION PROJECT
The Agricultural Sector in Pakistan
1. Overview
Agriculture is the main industry in Pakistan and the largest singlecontributor to the national income, accounting at present for about 38% of theGross Domestic Product (GDP) and 40% of export earnings. Including animal hus-bandry and natural fibers, it also directly and indirectly provides work forsome 70% of the entire labor force. Current annual increases in population andGDP of 2.8% and 5.8% respectively, plus a national policy to improve livingstandards further emphasize the reliance of the country on an e#panding agricul-tural sector.
During the mid-1950s, the provinces of Punjab, Sind, Baluchistan andthe North West Frontier (NWF)I/, changed from a food exportersto a food impor-ters due to an increasing population and insufficient attention being given toagriculture. More recently, substantial corrective measures were taken andvirtual self-sufficiency in food grains was achieved in 1969 and 1970. In fact,0.5 million tons of grain (mostly high-grade rice) were exported in 1970/71.In the period 1971/72 to 1972/73, wheat production rose by 9% to 7.4 milliontons and sugarcane output increased by 7.2% to 21.1 million tons. Rice produc-tion declined slightly from 2.23 to 2.2 million tcns and cotton output fell by0.8% to 3.95 million bales, largely due to the pest problems. However, inAugust 1973, the agricultural sector suffered severe losses due to floods whichruined about 600(,000 tons of stored wheat plus substantial quantities ofother commodities. Furthermore, these floods are likely to have adverse effectson many 1973/74 crops. Consequently, large amounts of food grain imports willbe required during the next year or so, not only to replace these losses butto make up deficiencies in domestic production, which amounted to 1.5 milliontons of imported wheat in 1972/73.
To achieve higher agricultural production, the Government has en-deavored to increase the availability of major inputs such as water, fertili-zers, better seeds and pesticides, farmer credits and education. The privatesector has also assisted in making available more fertilizers and other agri-cultural needs. In the main farming areas, the country has extensive irriga-tion systems, including 10,000 miles of canals and 100,000 tubewells. Out ofa total cultivated area of about 45 million acres, 33 million or 73% areirrigated. Fertilizer use increased over tenfold in a decade, from 4l,000nutrient tons in 1962/63 to 437,000 tons in 1972/73, while imports in 1972/73were about 180,,000 nutrient tons or 41% of consumption. The Govermnent hasencouraged fertilizer use by heavy subsidies to farmers which have recentlyincreased considerably due to rising international fertilizer prices. Also,the Government has supported a distribution program of high-yield seeds;
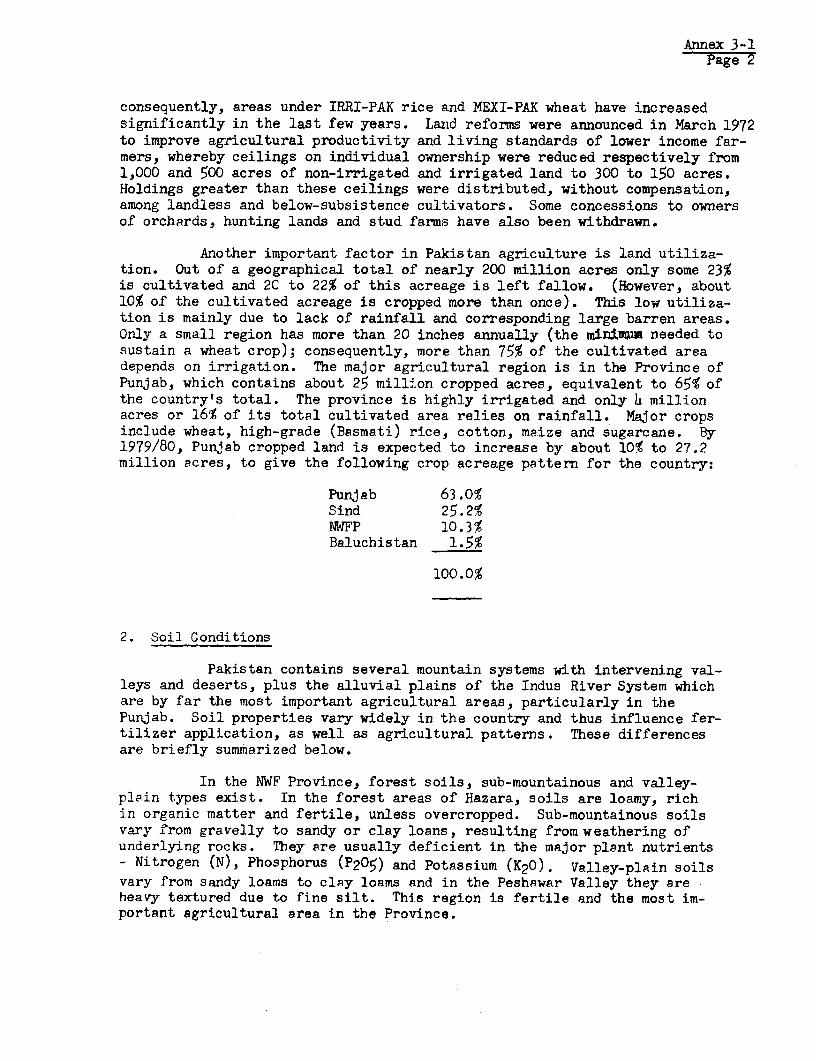
Annex 3-1Page 2
consequently, areas under IRRI-PAK rice and MEXI-PAK wheat have increasedsignificantly in the last few years. Laznd reforms were announced in March 1972to improve agricultural productivity and living standards of lower income far-mers, whereby ceilings on individual ownership were reduced respectively from1,000 and 500 acres of non-irrigated and irrigated land to 300 to 150 acres.Holdings greater than these ceilings were distributed, without compensation,among landless and below-subsistence cultivators. Some concessions to ownersof orchards, hunting lands and stud farms have also been withdrawn.
Another important factor in Pakistan agriculture is land utiliza-tion. Out of a geographical total of nearly 200 million acres only some 23%is cultivated and 20 to 22% of this acreage is left fallow. (However, about10% of the cultivated acreage is cropped more than once). This low utiliza-tion is mainly due to lack of rainfall and corresponding large barren areas.Only a small region has more than 20 inches annually (the minimum needed tosustain a wheat crop); consequently, more than 75% of the cultivated areadepends on irrigation. The major agricultural region is in the Province ofPunjab, which contains about 25 millfon cropped acres, equivalent to 659 ofthe country's total. The province is highly irrigated and only 4 millionacres or 161 of its total cultivated area relies on rainfall. Major cropsinclude wheat, high-grade (Basmati) rice, cotton, maize and sugarcane. By1979/80, Punjab cropped land is expected to increase by about 10% to 27.2million acres, to give the following crop acreage pattern for the country:
Punjab 63.0%Sind 25.21NWFP 10.3%Baluchistan 1.5%
100 .0%
2. Soil Conditions
Pakistan contains several mountain systems with intervening val-leys and deserts, plus the alluvial plains of the Indus River System whichare by far the most important agricultural areas, particularly in thePunjab. Soil properties vary widely in the country and thus influence fer-tilizer application, as well as agricultural patterns. These differencesare briefly summarized below.
In the NWF Province, forest soils, sub-mountainous and valley-plain types exist. In the forest areas of Hazara, soils are loamy, richin organic matter and fertile, unless overcropped. Sub-mountainous soilsvary from gravelly to sandy or clay loans, resulting from weathering ofunderlying rocks. They are usually deficient in the major plant nutrients- Nitrogen (N), Phosphorus (P205) and Potassium (K20). Valley-plain soilsvary from sandy loams to clay loams and in the Peshawar Valley they areheavy textured due to fine silt. This region is fertile and the most im-portant agricultural area in the Province.

Arirn;x s-1-
Page 3
The Punjab Province contsins the Himalayan region and sub-mountainoustracts, plus the arid plateau of the Salt Range and the arid South-WesternPlains, as well as the eastem portion of the Indo-Gangetic Plains. The mostimportant agricultural areas are the arid South Western and the Western Indo-Gangetic plains. These soils are mostly alluvial deposits containing 10 to 15%of clay, to a depth of 10 to 15 feet. They are usually alkaline and oftencontaminated with sodium salts, as well as exchangeable sodium in the claycomplex. Consequently, large areas may remain barren until "sweetened" byappropriate means. These soils may also contain nodular calcium carbonate andother calcareous minerals.
Sind soils are beyond the reach of the south-west and north-eastmonsoons. Thus, since rainfall is sparse, sodium and calcium salts are abun-dant and may be found as incrustations over large tracts of land or in barrenpatches among cultivated areas. In general, therefore, Sind soils are alkaline.
Much of Baluchistan comprises tertiary rocks covered by little orno soil or vegetation. Typical soil characteristics include high clay contentsplus appreciable quantities of sodium chloride, sodium sulfate and calciumcarbonate. Due to high summer temperatures, orgpnic matter is low and someareas may be lateritic. Therefore, most Baluchistan soils give a low cropresponse and the Province is only a minor contributor to Pakistan agriculture.
3. Water Supplies
Water is vital to efficient fertilizer use and crop growth. Thenatural distribution pattern in Pakistan varies widely and has been greatlymodified by irrigation. Major sources are surface water, ground water andrain, which ranges from none in some desert areas to 50 inches annually insub-mountainous districts such as Muree and Rawalpindi.
Precipitation in the Indus Plains ranges from 0 to 30inches annually,the average being 7.5 inches. However, most rain occurs in July to Septemberand, except for a few but important winter showers in some areas, the remainderof the year is dry. Irrigation is thus an increasing necessity for an expand-ing agricultural sector. Dry farming is only undertaken in areas receivingenough rain for specific crops and soils and usually in the Rabi (Winter)reason when evaporation is low.
Main sources of surface waters in the Indus Valley are the sixrivers - Sutlej, Bias, Ravi, Chenab, Jhelum and Indus. Except for the Bias,all flow through Pakistan, with a total average run-off of 164.5 millionacre feet (maf). Historical usage in Pakistan is 83 maf and this is expec-ted to rise to 112 maf when the Tarbela dam is commissioned, but this willallow only 32 maf to flow to the sea in the monsoon months. It is anticipatedth.t this dam will not begin filling before 1974, nor become effective until1976/77. A major factor for future development and extension of agriculturein Pakistan is water storage in dams and subsequent higher irrigation ratesin winter months, rather than additional distribution networks. Therefore,until the Tarbels basin is filled, additional crops grown in the Rabi season(and ultimately dependent on this water source) will hsve to rely on fpvorablewinter rains.

PAge 3-1Page 4
Water from the Indus Valley rivers is controlled and diverted by damsand barrages into a complex system of irrigation canals feeding the dependentagricultural areas, especially in the Punjab. Out of a total irrigated areaof some 33 million acres, about two-thirds are fed by canals. However, ground-water under the irrigated areas of the Indus plains constitutes another largesource and at least 30 million acres of land are known to contain undergroundwater supplies. Experience has shown that large-capacity tubewells can beconstructed virtually at any location in the central Punjab and also in someareas of the Sind. These underground reservoirs have been formed mainly byseepage of irrigation water from canals fed by Indus Basin rivers. At present,16% of irrigated land in Pakistan depends largely on tubewells fed by ground-water sources. It has been estimated that near tubewells will supply an addi-tional 2 maf each year during the next few years. Some of this water will goto intensive cultivation and some to creating an additional half million acresof farm land annually, to give a possible total cropped area of 43.1 millionacres by 1979/80.
4. Cropping Patterns and Practices
Pakistan has two cropping periods - the Kharif or summer season (Aprilthrough September) and the Rabi or winter period (October through March). Theusual cropping pattern is:
Kharif Rabi
Cotton WheatRice BarleyJowar GramMillet OilseedsMaize VegetablesSugarcane TobaccoFruits FoddersPulsesVegetables

Annex 3-1rage 5
The crop pattern by Provinces is shown in Tables 4.1 and 4.2:
Table 4.1
Pakistan Crop Area Pattern by Province(based on 1967/66 figures)
Millions of Acres
Sir.d N.W. Frontier PunjabMajor Crop Area Area _ Area %
Rice 1.73 19.4 0.11 3.3 1.65 6.7Wheat 2.13 23.9 1.51 43.7 10.56 [W.0Bajra 0.93 10.3 0.10 2.6 1.20 4.8Maize 0.0 O. 0.72 20.9 0.73 3.0Barley 0.03 0.3 0.14 3.6 0.25 1.0Gram 0.54 6.0 0.27 7.7 1.88 7.9Sugarcane 0.12 1.3 0.19 5.3 0.9k 3.8Rape & Mustard 0.49 5.5 0.17 4.6 0.78 3.1Sesamum & Groundnut 0.04 0.4 0.01 0.2 0.15 0.6Cotton 1.11 12.4 0.01 0.1 3.29 13.7Pulses 0.19 2.1 0.09 2.3 0.51 1.0Tobacco 0.01 0.1 0.08 2.3 0.08 0.3Linseed & Castor 0.02 0.1 - - - -Jowar 0.62 6.7 0.08 2.3 0.79 3.1Fodders & Other 1.00 11.1 0.0k 1.1 1.1h 6.0
Total 9.00 100.0 3.52 100.0 23.95 100.0
Table 4.2
Pakistan Crop Tonnage Pattern by Province(based on 1967/66 figures)
Thousands of TonsTotal
Major Crop Sind N.W. Frontier Pun.jab Pakistan
Rice 920 56 1,178 2,154Wheat 949 389 4,957 6,295Bajra 135 13 204 352Maize 16 371 385 772Barley 8 32 66 106Gram 1i5 14 34h 503Sugarcane 1,839 2,966 13,610 18,415Rape & Mustard 126 26 156 308Sesamum & Groundnut 1 k 68 73Cotton ('000 bales) (740) (3) (2,169) (2,912)Tobacco 3 81 41 125Vegetables 169 101 1,157 1,k27
Total 4,371 4,071 22,486 30,928
Source: Chemical Consultants, Pakistan Ltd.
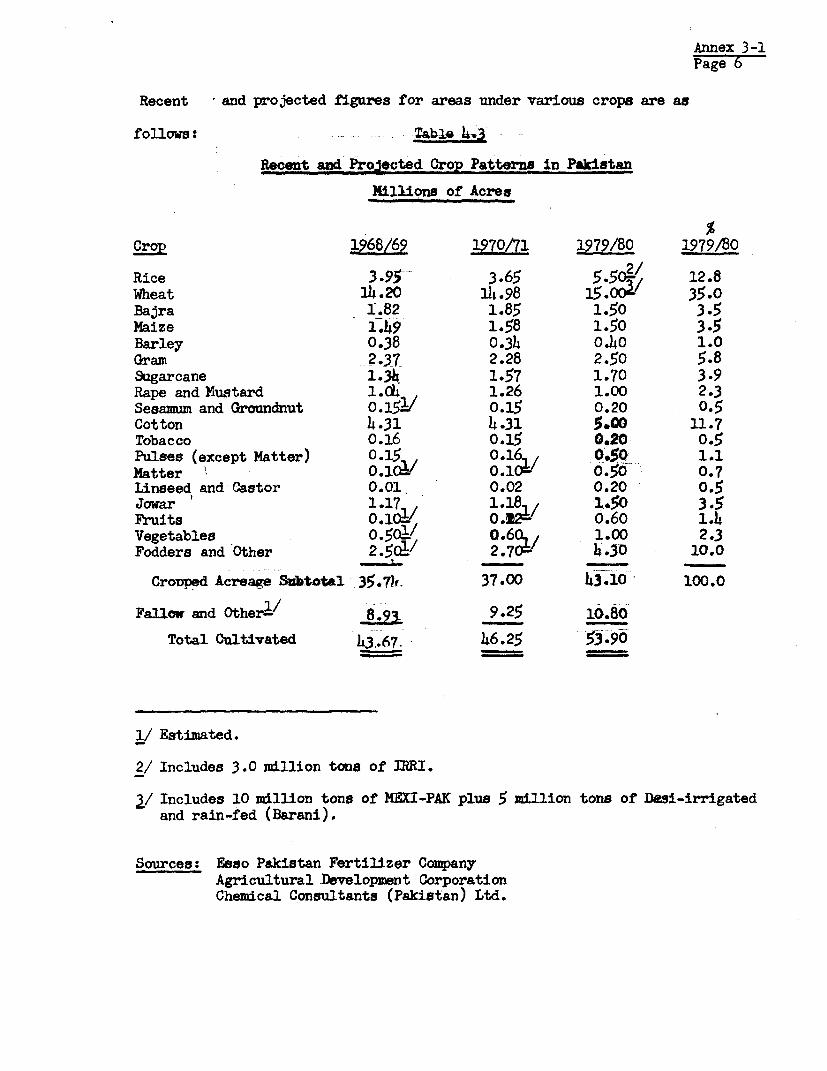
Annex 3-1Page 6
Recent and projected figures for areas under various crops are as
follows: Taba 4z3
Recent and Projected Crop Patterns in Pakintan
Millions of Acres
Crop 1968169 1970/7 1979/80 1979/80
Rice 3.95r 3.65 5 50- 12.8Wheat U1.2o 14.98 15:.003 35.0Bajra 1.82 1.85 1.50 3.5Maize 1.49 1.58 1.50 3.5Barley 0.38 0.3h 0.40 1.0Gram 2.37 2.28 2.50 5.8Sugarcane 1.3h 1.57 1.70 3.9Rape and Mustard 1.Ci 1.26 1.00 2.3Sesamum and Groundnut 0.151/ 0.15 0.20 0.5Cotton 4.31 h.31 5.00 11.7Tobacco 0.16 0.15 0.20 0.5Pulses (except Matter) 0.25 0.16,, 0.50 1.1Matter ' 0.1i4/ 0.1C 0.50 0.7Linseed and Castor 0.01 0.02 0.20 0.5Jowar 1.17 1.18,/ 1.50 3.5Fruits 0.1W :/. A 0.60 1.4Vegetables 0a5a'/ 0.6 1.00 2.3Fodders and Other 2.511 2.70i' 4.30 10.0
Crouped Acreage Subtotal 35.74k 37.00 3.10 100.0
Fallow and Other-/ 9.25 10.80
Total Cultivated 43.67. 6.25 %3.90
1/ Estimated.
2/ Includes 3.0 million tons of IRRI.
i/ Includes 10 million tons of MEXI-PAK plus 5 million tons of Desi-irrigatedand rain-fed (Barani).
Sources: Esso Pakistan Fertilizer CompanyAgricultural Development CorporationChemical Consultants (Pakistan) Ltd.

Anrex 3-1Page 7
The projected crop pattern for 1979/80 for the various provinces in terms ofcropped acreages (assuming about 20% of cultivated land lies fallow, uncul-tivated and unfertilized) is given in Table 4.4:
Table 4.4
Pakistan Projected Crop Pattern by Province 1979/80(millions of cropped acres)
Crop Total Pakistan Sind Frontier Punjab Baluchistan
Rice - IRRI 3.00 2.20 0.60 0.74 -
- Other 2.50 0.50 o.06 1.9hWheat - ?exi 10.00 1.90 0.80 7.30 -
- Other 5.00 0.50 0.80 3.20 0.50Bajra 1.50 0.80 0.10 0.60 -Maize 1.50 0.05 0.75 0.70 -Barley 0.40 0.03 0.10 0.27 -Gram 2.50 0.50 o.40 1.60 -Sugarcane 1.70 0.30 0.20 1.20 -Rapeseed and Mustard 1.00 0.30 0.15 0.55 -Sesamum and Groundnut 0.20 0.05 - 0.15 -Cotton 5.00 1.40 - 3.60 -Pulses (except matter) 0.50 0.10 0.10 o.40 -Vegetables 1.00 0.15 0.15 0.70 -
Hatter 0.50 0.40 - 0.20 -Tobacco 0.20 0.01 0.10 0.09 -Linseed and Castor 0.20 0.10 - 0.10 -Jowar 1.50 0.80 0.10 0.45 0.15Fruits 0.60 0.25 0.10 0.25 -Foddersand others 4.30 0.51 0.52 3.30 -
Total h3.10 l0.84 4.17 27.17 o.65
% of Tbtal 100.0 25.2 10.3 63.0 1.5

Annex 3-1Page
Recent production, acreage and yields for the principal crops are shown inthe following table:
Table L.
Production, Acreage and Yield of Principal Crops
. ~~~~1968/69 1971/72 1972/79]'Production ('000 tons)
Rice 2.,175 2,226 2,202
Wheat 6,51o75 6,782 7,4OOMaize 630- 69h 648Sugarcane 16,100 19,6h8 21,070Cotton ('000 bales) 5214 (3,00) 696 (3,984) 690 (3,950)
Acreage ('000 acres)
Rice 3,950 3,599 3,664Wheat 14,200 314,325 14,710Maize 1,490 1,563 1,495Sugarcane 1 i&0 1,3i0 1,423Cotton 4,310 4,837 4,968
Yield per Acre (tons)
Rice 0.55 0.62 0.61Wheat 0.45 0.47 0.50Maize 0.42 0.44 0.43Sugarcane 2/ 12.01 14.39 14.81Cotton (bales)- 0.12 (0.70) 0.14 (0.82) 0.114 (0.80)
1/ Provisional
2/ 38h lb. net basis.
Sources: Agricultural Development CorporationAsian Development BankIBRD Pakistan.

Annex 3-1Page 9
Future National Cropping Patterns and Trends
Wheat acreage is expected to remain about constant, but increasedproduction is anticipated because of greater use of MEXI-PAK varietiesand more fertilizer. Any surplus would doubtless find ready export markets.Increased rice acreage is planned, particularly in the Sind where more watershould be available, and the greater use of IRRI varieties plus heavier fer-tilizer applications should increase the yield per acre appreciably. Someadditional sugarcane acreage is anticipated, together with greater yieldsdue to use of more fertilizer, and more milling capacity is planned. Cottonacreage is expected to increase as this fiber is a major export and appreciablymore fodder wLll be needed to meet additional livestock requirements for foodand energy. In genernl, however, present overall crop patterns and rotationsystems are expected to continue, despite changes in acreages and improvementsin yields.
4- Agriculture in the Province of the Puni.ab
General: The location of the proposed fertilizer plant expansionproject is at Multan, a city almost in the center of the Punjab Province whichcontains 63% of the entire cropped acreage of the country. Punjab is there-fore the principal marketing area of the Multan plant and additional agricul-tural details of this Province will be appropriate.
Water Supplies: From a farming viewpoint, the Punjab can be dividedinto two main sections. One is the Potwar Plateau (and adjoining areas abovethe Indus River Plain and its tributaries) where crops are largely rain-fed(barani). The other is the main plains of the Indus and Punjab rivers where,except for the small Sialkot area in the north-east, crops are mostly fed byirrigation canals branching from the principal rivers, or by tubewells. Asshown in the following table, the irrigated areas predominate and are mostlysouth of the Salt Range. About 69% of this acreage is fed by Government canals,13% by tubewells and 9% by other wells; the remainder being supplemented byprivate canals and miscellaneous sources. Out of a total of nearly 27 millioncultivated acres, the areas relying on rain are only about 6 million acres,or 23% of the total; the remaining 77% being irrigated.
Table 4.6
Province of the PunJab Irrigation Patternkthousands of acres)
TanksGovernment Private and
Division Canals Canals Tubewells We-ls Other Total
Rawalpindi 419 12 3b 216 8 689Sarojodha 4,320 8 370 277 329 5,304Lahore 1,876 2 995 771 169 3,813Multan 5,253 15 956 375 1,023 7,622Bawaipur 2,500 - h3 217 1W5 3,305
Total 14,368 37 2,798 1,856 2,528 20,733
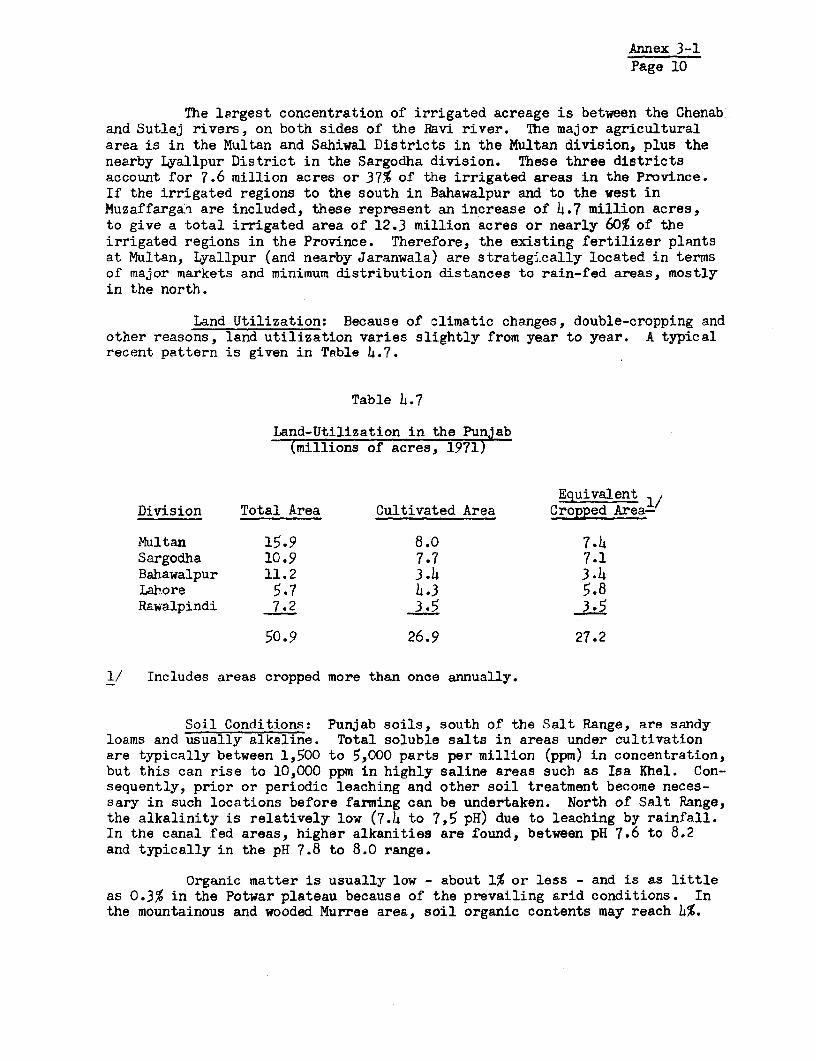
Annex 3-1Page 10
The largest concentration of irrigated acreage is between the Chenaband Sutlej rivers, on both sides of the Ravi river. The major agriculturalarea is in the Multan and Sahiwal Districts in the Multan division, plus thenearby Lyallpur District in the Sargodha division. These three districtsaccount for 7.6 million acres or 37% of the irrigated areas in the Province.If the irrigated regions to the south in Bahawalpur and to the west inMuzaffargahi are included, these represent an increase of 4.7 million acres,to give a total irrigated area of 12.3 million acres or nearly 60% of theirrigated regions in the Province. Therefore, the existing fertilizer plantsat Multan, Lyallpur (and nearby Jaranwala) are strategically located in termsof major markets and minimum distribution distances to rain-fed areas, mostlyin the north.
Land Utilization: Because of climatic changes, double-cropping andother reasons, land utilization varies slightly from year to year. A typicalrecent pattern is given in Table 4.7.
Table 4.7
Land-Utilization in the Punxab(millions of acres, 1971)
EquivalentDivision Total Area Cultivated Area Cropped Area-
Multan 15.9 8.0 7.4Sargodha 10.9 7.7 7.1Bahawalpur 11.2 3.4 3.4Labore 5.7 4.3 5.8Rawalpindi 7.2 3.5 3.5
50.9 26.9 27.2
1/ Includes areas cropped more than once annually.
Soil Conditions: Punjab soils, south of the Salt Range, are sandyloams and usually alkaline. Total soluble salts in areas under cultivationare typically between 1,500 to 5,000 parts per million (ppm) in concentration,but this can rise to 10,000 ppm in highly saline areas such as Isa Khel. Con-sequently, prior or periodic leaching and other soil treatment become neces-sary in such locations before farming can be undertaken. North of Salt Range,the alkalinity is relatively low (7.4 to 7,5 pH) due to leaching by rainfall.In the canal fed areas, higher alkanities are found, between pH 7.6 to 8.2and typically in the pH 7.8 to 8.0 range.
Organic matter is usually low - about 1% or less - and is as littleas 0.3% in the Potwar plateau because of the prevailing arid conditions. Inthe mountainous and wooded Murree area, soil organic contents may reach 4%.

Annex 3-1'Pae 11
Soil textures vary greatly, as they are usually heavier and higher in claycontent when near rivers and more sandy elsewhere. Phosphorus contents are
low (3 to 5 ppm) in rain-fed areas due to gradual leaching, and may varybetween 5 to 12 ppm in canal-fed areas. The prevalence of low organic andphosphorus contents in many districts and "tehsils" or sub-districts, as
shown in Table 4.9 indicates the need for supplental plant nutrients and
also organic matter.
Cropping Pattern: Major crops are wheat, rice, cotton, maize and
sugarcane. These account for nearly 18 million acres or 67% of the totalcropped area. The distribution pattern is given for 1970/71 in Table L,.8:
Table h.8
Distribution of Principal Crop Areas in the Province
)ab(00acres)
Totalcrop R'Pindi Saodha Lahore Maltan Bahawaipur Total Acreage
Wheat 1,780 2,676 2,163 3,139 1,089 10,8b7 53.0Rice 106 158 1,233 256 71 1,82L 8.8
Maize 161 259 140 120 5 725 365
Cotton 28 653 150 1,74.9 653 3,233 15.8Sugarcane 65 170 196 21i0 205 :L,176 5.7Tobacco 8.8 11.8 16.1 21.6 1.6 63 0.3Barley 20 43 55 3 25 177 0.8
Sesamum 5.6 3.6 11.9 8.3 2.5 32 0.1
Pulses (Kharif) 1Xo 8.9 3.5 13.1 5.0 75 0.3Mash 19.2 4 23.7 1].7 23.1 85 0°)4
Mhung 68.8 9.0 2.1 15.b 18.3 ilL 0.6
Gram 116.7 1,015. 93.5 21L.0 12.9 1,453 7.1
Groundnut 55 6 0.1 0.2 5 66 0.3
Potato 1.5 3.6 17.i 7.3 0.1 30 0.1
Rapeseed andMustard 73 84 113 180 186 636 3.1
Linseed 1.6 h.5 6.2 1.3 1.5 15 0.1
Total Acreage 20,551 100.0
(The proiected 1979/80 crop pattern for the Pun,ab and other Provinces has
been given in Table L.1).

ANNEX 3-1Page 12
Table 4.9
Punjab - Soil Conditions in Selected Areas
Total OrganicDepth Soluble pH Matter Phosphorus
Tehsil Inch Salts % - -% -PI=
Rawalpindi Rawalpindi 0-9" 0.188 7.67 1.297 5.5L9-18" 0.157 7.67 1.L10 7.83
Murree 0-9" 0.155 7.h4 3.6999-18" 0.159 7.L0 3.693 -
Gujar Khan 0-9" - 7.52 0.855 3.089-18" - 7.50 0.750 2.50
Gujrat 0-9" 0.351 7.82 1.10 12.059-18" 0.354 7.77 0.998 11.94
Kharian 0-9'' 0.307 8.3L 0.867 5.60
9-18" 0.325 8.25 0.7h3 3.00
Phalia 0-9"1 0.232 7.81 1.139 5.099-18"t 0.352 7.81 0.680 5.6h
Campbellpur Campbellpur 0-9" 0.314 7.82 0.916 7.889-18"1 0.h82 7.89 0.696 7.07
Talagang 0-9" 0.332 7.64 0.h00 7.509-18" 0.2h9 7.60 0.3h1 7.20
Fateh Jhang 0-9" 0.h97 7.83 0.8h0 44.09-18" 0.h16 7.81 0.783 L.70
Pindi Gheb 0-9" 0.273 7.93 0.85h 9-18" 0.282 7.92 0.708 -
Lahore Lahore 0-9" 0.156 8.23 0.746 3.419-18" 0.165 8.29 0.593 8.51
Sheikhupura Sheikhupura 0-9"1 0.1h9 8.03 0.936 5.509-18" 0.23)4 7.98 0.7214 1h4.
1',ankana 0-9" - 7.50 0.6h6 It.1407Sahib 9-18" - 7.55 0.595 3.29
Sialkot Sialkot 0-9" 0.308 7.80 - 5.409-18" 0.299 7.90 - 3.92
Daska 0-9" 0.267 8.ho 0.901 5.239-18" 0.234 9.00 0.636 3.11

ANNEX 3--LPage 13
Table 1.9
Puniab - Soil Conditions in Selected Areas (Cont'd)
Total OrganicDepth Soluble pH Matter Phosphorus
Tehsil Inch Salts % % pp_ _
Gujranwala Gujranwala 0-9" 0.173 8.00 0.939 13.809-18" 0.197 8.05 0.679 11.1,0
Hafizabad 0-9" 0.329 7.67 0.697 L.809-18 " 0.h13 7.66 0.325 3.LG
Sargodha Sargodha 0-9" 0.320 8.22 1.053 6.L,59-18" 0.380 8.30 0.967 6.59
Khushab 0-9"1 0.225 7.87 - -
0-18" - - -
Jhang Jhang 0-9" 0.273 7.93 0.648 h.29-18" 0.296 7.95 0.589 1,.66
h.ianwali Mianwali 0-9" 0.207 8.07 o.?h91, 6.629-18" 0.222 8.07 0.89C 1,.69
Bhakkar 0-9" 0.2)i3 7.85 0.Ii20 LI.1,39-18" O.AIhO 7.11 0.377 1.75
Isakhel 0-9" 0.852 8.02 1.061 h.219-18"1 0.383 7.99 0.6h9 3.01,
Lyallpur Lyallpur 0-9" 0.250 8.12 0.838 5.609-18" 0.239 8.10 0.566 4.36
Nultan Multan 0-9" 0.253 8.02 0.709 l,.809-18" 0.2h3 8.09 0.508 1.27
Niailsi 0-9"1 0.236 8.00 1.2h2 8.009-18 " 0.198 7.87 0.836 8.55
Vehari 0-9"i 0.233 8.11' 1.179 h.379-18" 0.196 8.16 1.108 2.98
Kabirwala 0-9"1 0.268 7.90 0.795 1'.89-18" 0.262 7.90 0.773 3.22
Khanewal 0-9" 0.177 8.00 0.37L 8.009-18" 0.225 8.00 0.1!76 h.00
D. G. Khan D. G. Khan 0-9" 0.269 8.08 0.928 6.19-18" 0.221t 8.09 0.720 5.9
Rajanpur 0-9" 0.323 7.93 1.195 5.99-18" 0.309 7.96 0.899 5.9
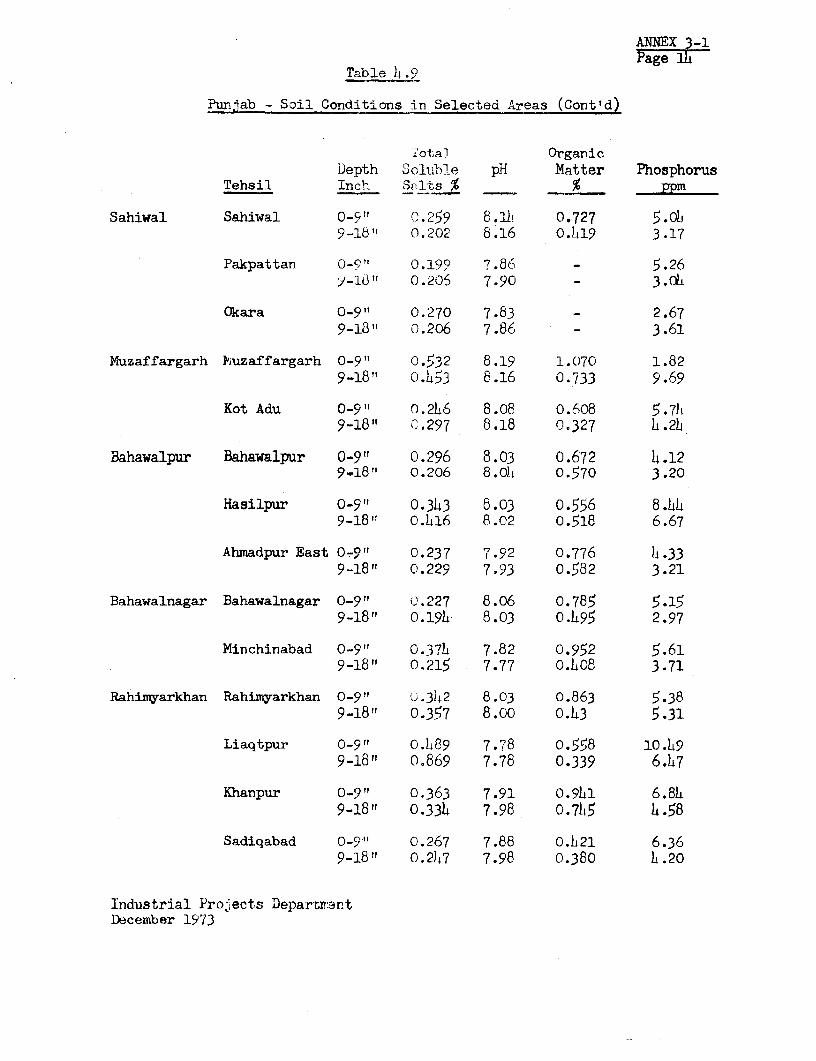
ANNEX 3-1
Table 4.9
Punjab - Soil Conditions in Selected Areas (Cont'd)
'lotal OrganicDepth 2oluble pH Matter Phosphorus
Tehsil Inch Salts % __% Ppm
Sahiwal Sahiwal 0-9_! %C.259 8.]Th 0.727 5.019-16"1 0.202 8.16 0.h19 3.17
Pakpattan 0-9" 0.199 7.86 - 5.26)-Wd" 0.206 7.90 - 3.oh
Okara 0-9" 0.270 7.83 - 2.679-18"1 0.206 7.86 - 3.61
Muzaffargarh Piuzaffargarh 0-9"1 0.532 8.19 1.070 1.829-18" 0.453 8.16 0.733 9.69
Kot Adu 0-9" O.2h6 8.08 0.608 5.7h9-18" 0.297 8.18 0.327 h.2b
Bahawalpur Bahawalpur 0-9" 0.296 8.03 0.672 4.129_18" 0.206 8.04 0.570 3.20
Hasilpur 0-9" 0.343 8.03 0.556 8.hh9-18", o.416 8.02 0.518 6.67
Ahmadpur East 0-9" 0.237 7.92 0.776 t.339-18"1 0.229 7.93 0.582 3.21
Bahawalnagar Bahawalnagar 0-9" 0.227 8.06 0.785 5.159-18" 0.191k 8.03 0.h95 2.97
Minchinabad 0-9" 0.37h 7.82 0.952 5.619-18" 0.215 7.77 0.4O8 3.71
Rahimnyarkhan Rahimyarkhan 0-9" .3-12 8.03 0.863 5.389-18"1 0.357 8.00 0.43 5.31
Liaqtpur 0-9t 0..L89 7.78 0.558 10.h99-18"1 0.869 7.78 0.339 6.h7
Khanpur 0-9"1 0.363 7.91 0.941 6.8h9-18"t 0.334 7.98 0.715 h.58
Sadiqabad 0-9 " 0.267 7.88 o.L21 6.369-18", 0.24t7 7.98 0.380 L.20
Industrial Projects DepartrantDecember 1973

ANNEX 3-2
Page 1
PAKISTANMULTAN FERTIL!n!ZM ANSION PROJECTTHE FETILIZER INDUSTRY IN PARISTAN
1. Overview
As indicated in Annex 3-1, many soils of Pakistan are alkalineand low in organic and phosphorus content. Agriculture is largely restrictedto areas irrigated by canals or wells fed by the main rivers and is thereforeintensive. As timber for fuel has been scarce, organic materials such asanimal manure, straw, brush, etc., has been burned over the centuries and notreturned to the land. Consequently, a gradual need has arisen to add in-creasing amounts of fertilizer chemicals to cultivated soils. This need isnow intensifying as newer, high-yield crop varieties, plus a rapidly expandingpopulation and increasing export markets, make continually greater demandson limited agricultural areas. Fortunately, in most of these areas, suppliesof water, labor and sunlight are sufficient to ensure a substantial economicresponse to correctly formulated and properly applied fertilizers.
An acute food shortage in the early 1950's prompted the firstimportation of fertilizer, and consumption grew slowly until 1957, when smallsingle superphosphate plants at Lyallpur and Jaranwala plus an ammoniumsulfate plant at Daudkhel were built by the Government. These were followedby another Government plant at Multan in 1961/62 for producing calcium ammoniumnitrate (CAN) and urea, an Esso Ltd. urea plant at Daharki in 1968 and aDawood-Hercules Ltd. urea plant near Lahore in 1971. However, as the followingtables show, consuwption has increasingly exceeded domestic production requiringin turn, progressively greater imports. Present-and near-future import require-ments are large enough to justify constructing more large domestic fertilizerplants, not only to produce nitrogen compounds but phosphate fertilizers aswell, with proviEions for including potassium and other essential plant foodelements, as required, by specific soils and crops.
Conpared to established fertilizer plant nutrient ratios in manyother countries, addition of phosphorus (P) and potassium (K) in relation tonitrogen (N) have been, and are, low. There are several reasons for this,such as a much greater intial response to N than to P and K and a correspon-ding preference by farmers for N fertilizers, plus a reliance on residual Pand K in soils, especially those in alluvial areas near the main rivers.
However, increased planting of high-yield wheat, rice and othercrops leads to greater removal of plant nutrients from the soil compared totraditional varieties and it is generally recognized that P and K applicationswill have to increase, in both total annual amounts and in relation to theannual amounts of N consumed in the country. Nevertheless, agreement by agron-omists on precise current and projected relative needs for N, P and K in Paki-stan has not yet been reached. Trend patterns in other countries with longerexperience in fertilizer application give some guidance and suggest the planningand provision for additional domestic phosphate fertilizer production to beprudent. Accordingly, the Multan project is designed to produce, in additionto CAN, a compound fertilizer (nitrophosphate) containing phosphatosequivalentto 70,000 tons per year of P205. These phosphates will be in a highly water -
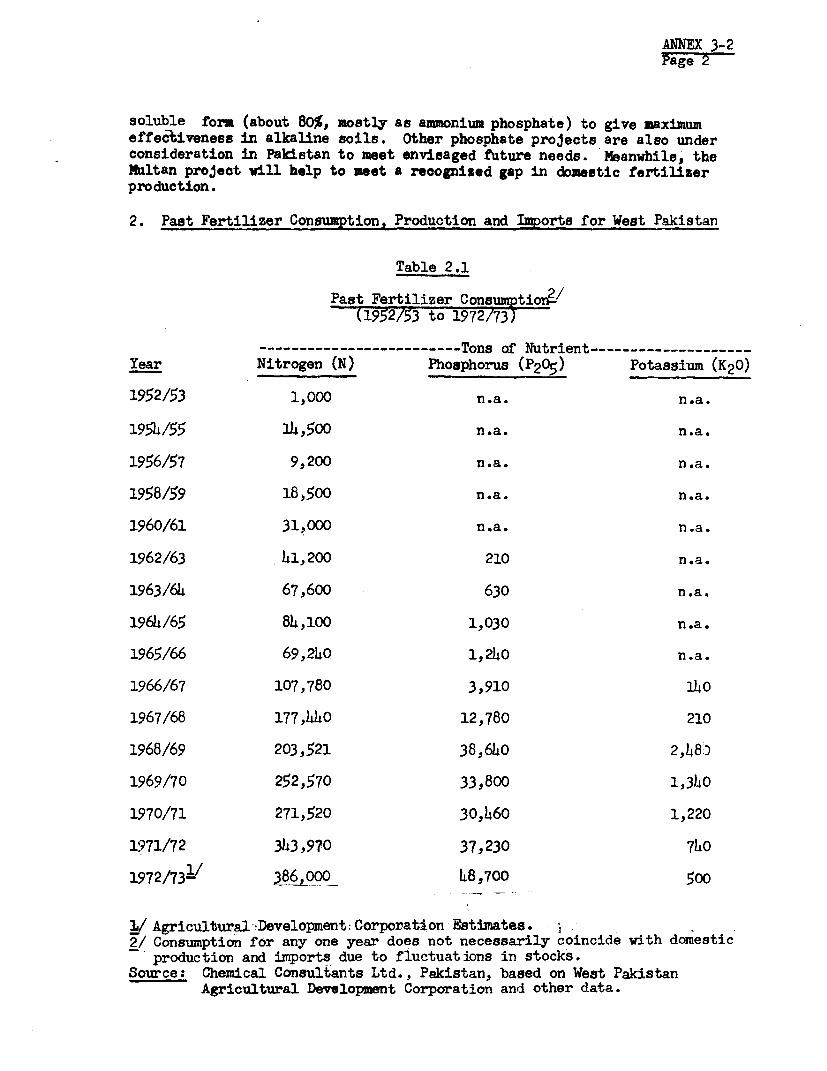
ANNEX 3-2Page 2
soluble form (about 80%, mostly as ammonium phosphate) to give maximumeffec1tiveness in alkaline soils. Other phosphate projecta are also underconsideration in Pakistan to meet enviBaged future needs. Meanwhile, theMultan project will help to meet a recognised gap in domestic fertilizerproduction.
2. Past Fertilizer Consumption, Production and Imports for West Pakistan
Table 2.1
Past Fertilizer Consumptior/(1952/53 to 1972/73
--------- Tons of Nutrient--------------------Year Nitrogen (N) Phosphorus (P205) Potassium (K2 0)
1952/53 1,000 n.a. n.a.
195h/55 14,500 n.a. n.a.
1956/57 9,200 n.a. n.a.
1958/59 18,500 n.a. n.a.
1960/61 31,000 n.a. n.a.
1962/63 41,200 210 n.a.
1963/64 67,600 630 n.a.
1964/65 84,100 1,030 n.a.
1965/66 69,240 1,240 n.a.
1966/67 107,780 3,910 140
1967/68 177,h40 12,780 210
1968/69 203,521 38,640 2,468')
1969/70 252,570 33,800 1,3h0
1970/71 271,520 30,460 1,220
1971/72 343,970 37,230 740
1972/731/ 38600o0 L8,700 500
1/ Agricultural *Development: Corporation Estimates.2/ Consumption for any one year does not necessarily coincide with domestic
production and imports due to fluctuations in stocks.Source: Chemical Consultants Ltd., Pakistan, based on West Pakistan
Agricultural Development Corporation and other data.

ANI'EX 3-2Page 3
Table 2.2
Past Domestic Fertil-izer Production in West Pakistan(1960/61 to 1972/73)
Nutrient Tons
WPIDCFactory: WPIDC WPIDC ESSO Dawood- Lyallpur/
Daudkhel Multan Hercules Jaranwala
Ammonium'-/ ---- Total------Product: Sulphate Urea AN Urea Urea SSP Nitrogen P20'G
1960/61 9,902 - - - - 1,618 9,902 1,618
1961/62 11,053 340 2,513 - - 1,442 13,906 1,442
1962/63 11,015 13,128 17,317 - - 1,108 41,460 1,108
1963/64 10,479 18,549 16,241 - - 1,205 45,269 1,205
1964/65 7,436 20,543 20,162 - - 1,467 48,141 1,467
1965/66 8,198 19,056 19,878 - - 1,438 47,132 1,438
1966/67 9,001 21,892 21,068 - - 724 51,961 724
1967/68 9,830 20,020 20,354 - - 2,894 50,204 2,894
1968/69 8,940 20,686 17,201 32,200 - 2,548 79,027 2,5H8
1969/70 12,194 21,386 21,533 73,544 - 44,069 128,657 14,069
1970/71 12,328 15,072 22,096 80,083 - 1,583 129,579 4,583
1971/72 13,288 11,552 19,770 76,901 93,559 h,948 215,070 4,948
1972/73/ 13,000 9,000 15,000 77,000 140,000 5,000 254,000 8,000
1/ Excluding sales of ammonia which could otherwise be converted into ammoniumsulphate.
2/ Estimated.
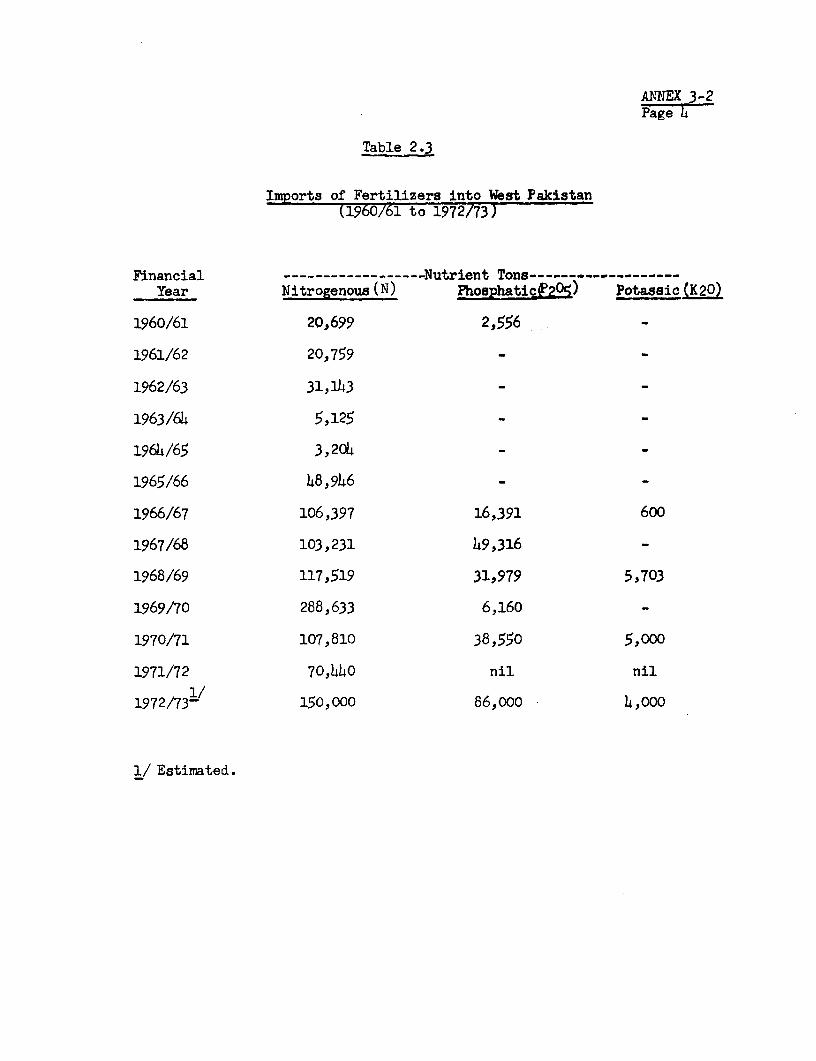
ANNEX 3-2Page 4
Table 2.3
Imports of Fertilizers into West Pakistan(1960/61 to 1972/73)
Financial ------------------Nutrient Tons----------------Year Nitrogenous (N) Phosphatic(P205) Potassic (K20)
1960/61 20,699 2,556
1961/62 20,759
1962/63 31,143
1963/64 5,125
1964/65 3,204
1965/66 48,946 -
1966/67 106,397 16,391 600
1967/68 103,231 49,316
1968/69 117,519 31,979 5,703
1969/70 288,633 6,160
1970/71 107,810 38,550 5,000
1971/72 70,440 nil nil
1972/73r 150,000 86,000 4,000
1/ Estimated.

Table 2.h
Imports of Fertilizers into West Pakistan(1960/61 to 1972n3)
Thousand Tons of Material
Type ofFertilizer 1960/61 1961/62 1962/63 1963/64 1964/ 6 5 1965/66 1966/67 1967/68 1968/69 1969/10 1970/71 1971/72 1972 /
Arnoniwa-Sulphate 97.98 86.25 102.46 24.40 15.27 20C.60 329.06 8.4h - - - - -
Urea .27 6.21 20.92 - - 13.00 57.86 192.15 205.13 607.57 193.78 153.13 250.00
Amonium-Sulphate-Nitrate - - _ _ -_ 41.07 37.50 34.00 22.27 2.00 - -
Single-Superhosphate 3.99 - - - - - - - - - - - -
Triple SuperPhosph-ate 3.99 - - - - - 35.63 99.99 3.50
Yuriate ofPotash - - - - - - 1.00 - - - - - -
1'itro-Phosphate - - - - - - - 16.60 20.00 7.80 21.90 - 48.00
Di-ArnoniumPhosphate - - - - - - - - 57.32 10.00 72.86 - 158.00
Suliphate ofPotash - - - - - - - - 11.40 - 10.00 - -
TOTA .a / 106.23 92.46 123.38 24.40 15.21 217.60 464.62 354.68 331.35 647.64 300.54 153.13 156.00
17/stimated. in t2/ Inports for any one year do not necessarily match the difference between consuimption and domestic production, due to
fluctuations in the quantities of fertilizers held in ttocks or in transportation.i/Rounided totals.
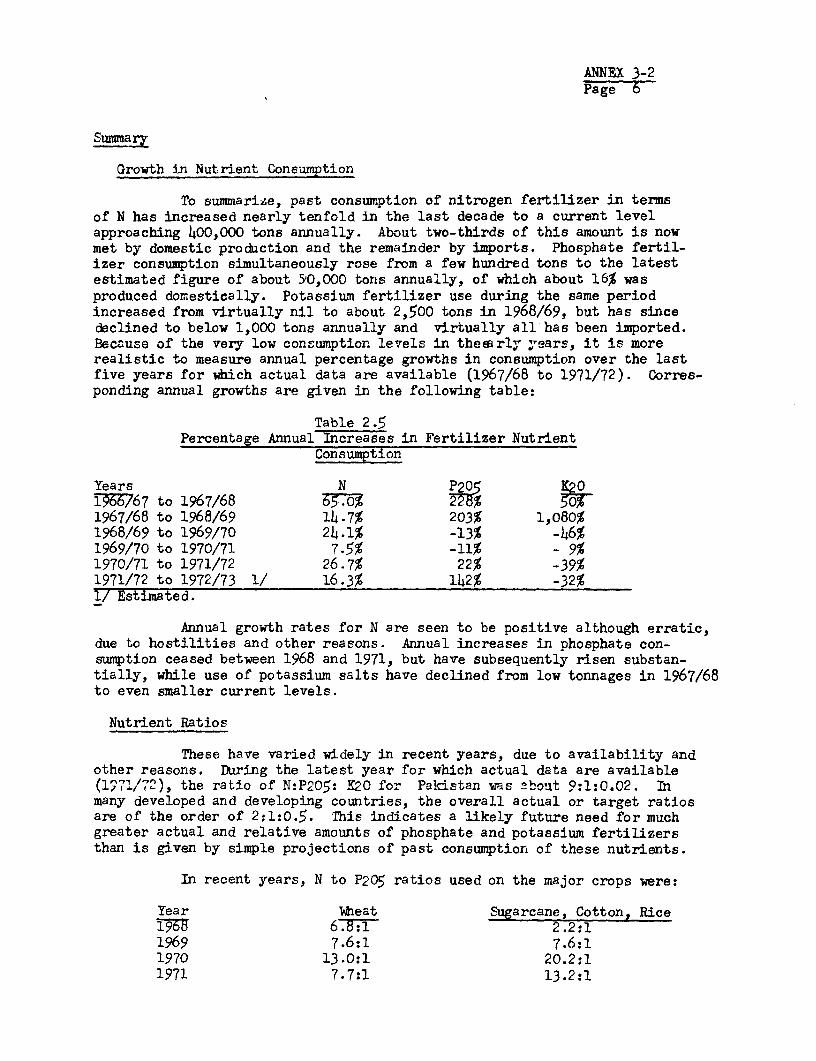
ANNEX 3-2Page6
Growth in Nutrient Consumption
To summarize, past consumption of nitrogen fertilizer in termsof N has increased nearly tenfold in the last decade to a current levelapproaching 400,000 tons annually. About two-thirds of this amount is nowmet by domestic production and the remainder by imports. Phosphate fertil-izer consumption simultaneously rose from a few hundred tons to the latestestimated figure of about 510,000 tons annually, of which about 16% wasproduced domestically. Potassium fertilizer use during the same periodincreased from virtually nil to about 2,50o tons in 1968/69, but has sincedeclined to below 1,000 tons annually and virtually all has been imported.Because of the very low consumption levels in the6Rrly -ears, it is morerealistic to measure annual percentage growths in consumption over the lastfive years for which actual data are available (1967/68 to 1971/72). Corres-ponding annual growths are given in the following table:
Table 2.5Percentage Annual Increases in Fertilizer Nutrient
Consumption
Years N P205 K201966/67 to 1967/68 35 TM% §5T1967/68 to 1968/69 14.7% 203% 1,080%1968/69 to 1969/70 24.1% -13% -46%1969/70 to 1970/71 7.5% -11% - 9%1970/71 to 1971/72 26.7% 22% -39%1971/72 to 1972/73 1/ 16.3% 142% -32%1/ Estimated.
Annual growth rates for N are seen to be positive although erratic,due to hostilities and other reasons. Annual increases in phosphate con-sumption ceased between 1968 and 1971, but have subsequently risen substan-tially, while use of potassium salts have declined from low tonnages in 1967/68to even smaller current levels.
Nutrient Ratios
These have varied widely in recent years, due to availability andother reasons. During the latest year for which actual data are available(1971/72), the ratio of N:Pc05: .K20 for Pakistan was about 9:1:0.02. Inmany developed and developing countries, the overall actual or target ratiosare of the order of 2:1:0.5. This indicates a likely future need for muchgreater actual and relative amounts of phosphate and potassium fertilizersthan is given by simple projections of past consumption of these nutrients.
In recent years, N to P205 ratios used on the major crops were:
Year Wh4eat Sugarcane, Cotton, RiceT =g 67&If- 2.2:11969 7.6:1 7.6:11970 13.0:1 20.2:11971 7.7:1 13.2:1

ANNEX 3-2Page r
AlthOugh these ratios denote severe P205 application deficiencies comparedto many other countries, they are better for Wheat than for sugarcane,cotton and rice.
Product Trenda
During the last decade, major trends have occurred in product use,as shown in the table below:
Table 2.6Trends in Pakistan Fertilizer Consumption
(based on nutrient tone)
YearsNitrogen Products 1961/62 1965766 1972/73 1/
Ammonium Sulfate 91% 53% 3.2%
Calcium Ammonium Nitrate 8% 21% 3.7%
Urea 1% 26% 84.4%
Nitrophosphate 0% 0% 2.5%
Diammoniun Phosphate 0% 0% 6.2%
Phosphate Products
Single Superphosphate 100% 100% 5-5%
Nitrophosphate 0% 0% 11.0%
Diammionium Phosphate 0% 0% 83.5%
I/ Estimated, based on domestic production plus imports.
The predominant trend towards urea as a nitrogen fertilizer isevident. The switch to diammonium phosphate as a major phosphate source in1972/73 is temporary, as this is intended to function as a water-solubleP205 "seeding t' product for nitrophosphates to be made later at Multan.
Seasonal Fertiliser Application Patterns
Nitrogen
Peak consumption months for nitrogen fertilizers are December andJanuary, with actual use during this peziod (Rabi) extending from about mid-October to mid-February. During the last five years, between 36% and 40% ofall nitrogen fertilizers consumed in Pakistan were applied during these fourmonths, largely on wheat. The months May through October

ANNEX 3-2Page 8
represent another high N application period (Karif) especiallv onsugarcane, cotton and rice. In the last five years, between 34 and 40% ofall N used was applied during these months.
Phosphates
October to December are the most active months for phosphateapplication (especially November). This is largely due to heavy seed-bedpreparation for the forthcoming wheat crop. Although recent phosphate con-sumption has been erratic due to restricted availability and other reasons,between 40% and 70% of all P2C5used during the last few years has beenapplied in these months. The balance was largely used during April and Juneon sugarcane, cotton and rice.
World Comparisons of Nitrogen Fertilizer Consumption
Wide variations in the consumption of fertilizers are foundthroughout the world, according to the availability of land, water, rawmaterials and other farm inputs, as well as inherent soil fertility, agri-cultural practices and cropping patterns. A recent comparison is givenbelow:
Table 2.7
World Nitrogen Fertilizer Consuption by CountrY(kg per hectare of arable land)
Application RatesCountry N P20c K Q Total Total Per CapitaNeth-er'ands 467 l28 156 749 50Belgium 197 174 218 589 52Taiwan 178 49 69 296 18Japan 157 118 110 385 21West Germany 140 113 147 390 54Egypt 106 16 0.5 122 10United Kingdom 110 75 73 259 34USA 41 25 22 88 75
* Pakistan 14 1.5 0.06 15.5 3India 9 3 1.4 13 4Australia 3.4 16.7 1.7 22 77Wbrld 22.1 13.8 11.5 47.4 18
Source: FAO et al, 1971.
It can be seen there is ample scope for increased fertilizer use in Pakistan,not only in terms of N but, as already indicated, larelative and actualgreater amounts of P205 and K20 . Corresponding N:P20: K2 0 ratios for culti-vated land are given in the following table:

ANNEX 3-2Page 9
Table 2.8
Comparative World Fertilizer Plant Nutrient Ratios
NutrientCountry N P20q K20
Netherlands 3.7 1 1.2Belgium 1.1 1 1.3Taiwan 3.6 1 1.hJapan 1.3 1 0.9West Germany 1.2 1 1.3UAR 6.7 1 0.03United Kingdom 1.5 1 1.0USA 1.6 1 0.9Pakistan 9.0 1 0.02India 3.0 1 0.5Australia 0.2 1 0.1World 1.6 1 0.8
NOTE: Differences in application ratios in kg per hectare and correspondingnutrient ratios reported by various sources sometimes arise due to double-cropping and the practice of leaving some land in fallow, especially in somesub-tropical and tropical countries. Thus, it may be difficult to distinguishbetween "cultivated" land and "arable" or "cropped land". The above compari-sons are made on a reported arable land basis to the extent discernable.
3. Fertilizer Use in the Punjab
As indicated in Annex 3-1, the Province of Punjab represents some65% of the country's cropped acreage and produces over 70% of its major crops.Since the Multan expansion project will be undertaken in the heart of thePunjab agricultural sector, it is relevant to examine the Punjab fertilizerpaLI'tenr in some detail.
Table 3.1 shows the comparative consumption of nitrogen fertilzierby Province, tonnage and percentage from 1965/66 to 1971/72. It indicates a450% increase in tonnage, even though this represents a fall from 74% to 66%of the total Pakistan annual consumption. Tables 3.2 and 3.3 show similarpatterns for phosphates and potash, even though yearly consumptions are erratic.

Table 3.1
Oonsuiption of Nitrogenous Fertilizers in Different Provinces, 1965/66 to 1971/72(Nutrient Tons)
Province 1965/66 % 1 61967/68 % 1968/69 % 9 1970/71 % 1971/72 %
N.W.F.P. 4-.° 5.8 9.80 9.1 20.96 11.8 23.78 11.7 22.65 8.3 ib.50 6.7 28.60 8.5
Punjab 50.70 73.6 81.90 76.1 121.81 68.7 138.23 67.9 183.95 67.5 164.90 64.5 227.20 65.8
Sind 14.00 20.3 15.90 1.7 34.5o 19.4 4o.51 20.1 65.69 24.1 71.70 28.6 87.60 25.5
Baluchistan 0.20 0.3 0.10 0.1 0.17 0.1 0.60 0.3 0.27 0.1 0.50 0 2 0.70 0.2
TOTAL 68.90 100.0 107.70 100.0 177.44 100.0 203.52 100.0 272.561/ 100.0 251.601/ 100.0 3h4.10 100.0
1/ Without the negative adjustment of 20,000 tons in 1969/70 and positive adjustment of 20,000 tons in 1970/71.

Table 3.2
Consuraption of Phosphatic Fertilizers in Different Provinces, 1965/66 to 1971/72(Nutrient Tons)
Province 1965/66 % 1966/67 % 1967/68 % 1968/69 % 1969/70 % 1970/71 % 1971/72 %
N.W.F.P. .30 20.0 .30 8.1 1.53 12.0 3.80 9.8 4.06 12.0 2.62 8.6 3.65 9.8
Punjab 1.20 80.0 2.4o 6h.8 8.98 70.3 28.93 7h.9 22.97 68.0 19.00 62.5 25.36 68.1
Sind - - 1.00 27.1 2.25 17.6 5.88 15.2 6.70 19.8 8.67 28.3 8.07 21.7
Baluchistan - - - - 0.01 0.1 o.o3 0.1 0.07 0.2 0.17 0.6 0.15 o.4
TOTAL 1.50 100.0 3.70 100.0 12.77 100.0 38.64 '00.0 33.8C 100.0 30.h6 100.0 37.23 100.0
H I4.Jf

Table 3.3
Consumption of Potassic Fertilizers in Different Provinces 1966/67 to 1971/72
(Nutrient Tons)
Province 1966/67 % 1967/68 % 1968/69 % 1969/70 % 1970/71 % 1971/72 %
N.W.F.P. - - - - 0.38 15.2 0.19 14.3 0.16 13.0 0.02 2.8
Punjab o.o8 57.0 0.10 47.7 1.13 L5.L 0.73 5L.5 0.43 35.4 0.42 56.8
Sind 0.06 43.0 0.01 52.3 0.98 39.4 0.41 31.1 0.63 51.6 0.30 40.4
Baluchistan - - - - - - 0.01 0.1 - - - -
TOTAL 0.314 100.0 0.11 100.0 2.149 100.0 1.34 100.0 1.22 100.0 0.74 100.o- _ * =-s
-~~~~~~~~~~~~~~~~~~~~~~ -

ANNEX 3-2Page 13
Overall fertilizer sales in recent years have comprised 65 to 70%in the Punjab, 20 to 25% in the Sind plue about 10% in the North West FrontierProvince and very small amounts in Baluchistan. Potassium fertilizer saleshave largely been limited to tobacco in the Punjab and the Sind. Sales offertilizer nutrients in the Punjab, expressed in tons and also percentages oftotal Pakistan sales during recent years are retabulated below, for convenience:
Table 3.4
Plant Nutrient Sales in the Punjab
N P205 K20Year 1000 Tons 1000 Tons T0 'OQO Tons
1965/66 50.7 73.6 1.0 80.01966/67 81.9 76.1 2.1i 61.2 0.11967/68 121.8 68.7 9.8 5h.5 0.11968/69 137.4 67.9 28.9 74.5 1.11969/70 183.9 67.5 23.0 67.6 0.71970/71 16h.9 65.2 19.0 62.5 0.1971/72 227.2 65.9 25.4 73.2 0Al
since the Pinjab consumes some.65% of all fertilizer in Pakistan, monthlysales patterns correspond in general to those for the whole country, aspreviously reviewed.
Sales by Districts in the Punjab
District fertilizer sales in recent years are given in Table 3.5:

ANNEX 3-2Page V.t
Table_.5
Punjab Fertilzjer.Sales According to District(Nutrient Tons)
--------- 1970/71 - ----------1971/72---------N P205 K2 0 N P205 K2 0
Rawalpindi 599 286 5 1,339 217
Gu-jrat ) h71 2~Jhelum ) 2,843 74 25 ,156 422 29
Campbellpur 709 1ll 6 1,187 100 _
Sargodha 9,124 1,238 35 11,108 1,829 45
Lyallpur 27,050 2,973 18 32,1140 3),424 29
Jhang 7,805 1,035 - 8,050 1,224 3
Mianwali 2,408 366 - 3,130 340 _
Lahore 8,362 1,341 54 17,048 1,917 153
Gujranwala 9,809 1,245 16 10,317 817 3
Sheikhupura 7,044 579 3 10,635 763 10
Sialkot 4,532 376 33 5,962 242 4
Multan 36,006 3,405 37 52,626 5,689 22
Sahiwal 23,883 3,242 20 30,518 3,924 117
D.G. Khan 1,599 1143 22 2,483 625 -
Muzaffargarh 3,772 355 4 4,863 718
Bahawalpur 4,565 356 - 7,536 592
Bahawal Nagar 3,599 151 1 5,653 428 9
Rahimyar Khan 11,174 1,323 155 18)428 2,144 1

ANNEX 3-2Pa ge 15-
Table 3.5 shows that the areas around the Multan plant, i.e.Bahawalpur, Bahawal Nagar and Rahinyar Khan, plus the Multan Sahiwal andLyallpur Districts accounted for over 106,000 nutrient tons of N in 1970/71or 61% of sales in the Province, and about 147,000 tons of N in 1971/72 or64% of provincial sales in 1971/72. Corresponding phosphate sales were11,450 and 16,200 nutrient tons of P2 05 , representing 60% and 64% of totalsales in the Province.
Conclusion
It can be concluded that the existing Multan plant and proposedexpansion project are very well located as regards fertilizer sales to localdistricts plus the rest of the Punjab - and also adjoining territories in theNorth West Frontier Province and the Sind, should temporary surpluses everhave to be sold in other Provinces, which seems unlikely.
Crop Responses to Different Fertilizers
Traditional fertilizers in Pakistan have been ammonium sulfate,calcium amonium nitrate and single superphosphate. Nbre recently, ureahas become the major nitrogen fertilizer and additional phosphate suppliesin the form of diasnonium phosphate and nitrophosphate are now being intro-duced (see Table 2.6). Because most Pakistan soils are alkaline, ammoniumsulfate and highly waterTsoluble phosphates are logical choices, as confirmedby trials and experience. However, the extra price of amonium sulfate on adelivered-to-farm N basis compared to urea or ammonium nitrate has not beenfound justifiable by the slightly higher yield per unit of N.
Numerous experiments by Pakistani and international agronomistsindicate all highly water-soluble phosphate fertilizers such as superphosphates,diammonium phosphates and modern nitrophosphates (which are mainly combinationsof ammonium phosphate and ammonium nitrate) have shown similar results onwheat - the largest crop using phosphate. In the Punjab, highly water-soluble1:1 nitrophosphates have given the best results, compared to other sources ofP205,probably because young wheat plants thrive on a basic 1:1 N to P205 ratioand absorb these nutrients at simultaneous rates. (Subsequent top dressingis with urea, or ammonium nitrate as CAN).
The results of some recent trials, made under the FA0/Governmentof Pakistan Soil Fertility Program, 1969/71, and other programs are given inTable 3.6:
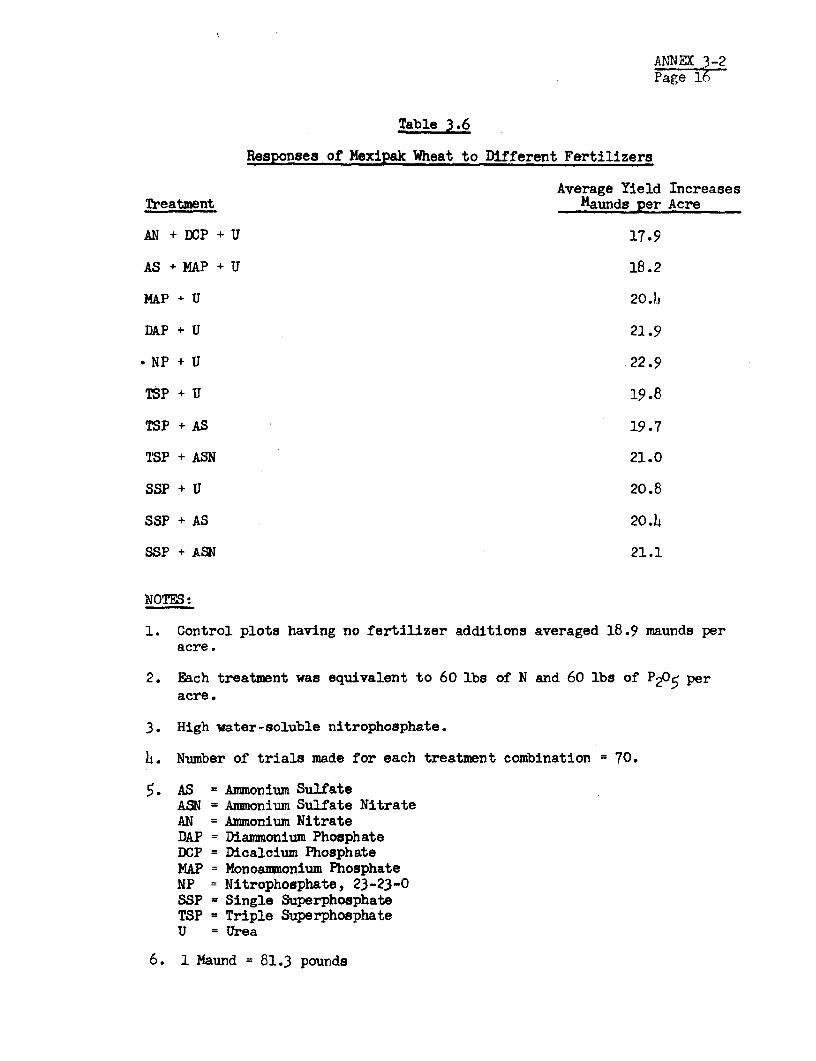
ANNEX 3-2Page 16
Table 3.6
Responses of Mexipak Wheat to Different Fertilizers
Average Yield IncreasesTreatment Maunds per Acre
AN + DCP + U 17.9
AS + MAP + U 18.2
MAP + U 20.h
DAP + U 21.9
NP + U .22.9
TSP + U 19.8
TSP + AS 19.7
ISP + ASN 21.0
SSP + U 20.8
SSF + AS 20.h
SSP + ASN 21.1
NOTES:
1. Control plots having no fertilizer additions averaged 18.9 maunds peracre.
2. Each treatment was equivalent to 60 lbs of N and 60 lbs of P205 peracre.
3. High water-soluble nitrophosphate.
h. Number of trials made for each treatment combination = 70.
5. AS =Ammonimu SulfateASN = Ammonium Sulfate NitrateAN = Ammonium NitrateDAP = Diamonium PhosphateDCP = Dicalcium PhosphateMAP = Monoammonium PhosphateNP = Nitrophosphate, 23-23-0SSP = Single SuperphosphateTSP = Triple SuperphosphateU =Urea
6. 1 Maund = 81.3 pounds

ANNEX 3-2Page 17
In the 70 trials made on each combination listed in Table 3.6,it can be seen the highest increase in yield was obtained with a nitro-phosphate-urea mixture, and the lowest yield was when dicalcium phosphatewas used. In view of DCP's low solubility in alkaline conditions, this isto be expected.
One surprising feature of these trials was that in the LahoreDistrict, much better yield increases resulted from each treatment when canalwater was used instead of tubewall water - the average yield for all treat-ments being 54% higher. Conversely, in the Sargodha District, tubewell water
gave 22% better average yields than when canal water was used. Differencesbetween using canal water in Bahawalpur and tubewell water in Rawalpindiamounted to a 36% greater average yield in favor of canal water for the same
treatments. These unexpected influences of water sources on crop yields arebeing further studied and may be due to differences in soluble phosphates ormicro-nutrients in the water used for irrigation, plus the influcence of mineralion-exchange and associated soil chemistry.
The effects of different fertilizer combinations on high-yieldIRRI-6 rice in the Punjab are given in Table 3.7:
Table 3.7Responses of IRRI-6 Rice to Different Fertilizer Combinations
Treatment Average Yield IncreasesMaunds Per Acre
Application Rates: 120 lbs N/acre 150 lbs N7acre80 lbs P205/acre 80 lbs P205/acre
AN + DCP + U 14.2 19.9AS + MAP + U 12.3 19.4
3AP + U 14.4 18.7MAP + U 20.5 22.8NP + U 16.5 23.4
SsP + U 16.8 20.9
Notes:I.7Number of trials with each treatment:
13 at 120 lbs N/acre18 at 150 lbs N/acre.
2. Average yield with no fertilizer = 39.2 maunds/acre.
Responses to different fertilizer combinations of fertilizer by
maize in several Districts in Punjab are given in Table 3.8t
Table 3.8
Responser of J-1 and DC-697 Maizes to Different Fertilizer Combinations
Treatment Average Yield Increases inMaunds Per Acre
J-1 DC-697AN + DCP + U ro 76 I2.1
AS + MAP + U 16.7 13.0
MAP + U 19.8 15.1DAP + U 19.6 14.5
NP + U 22.8 16.5TSP + U 17.4 14.9
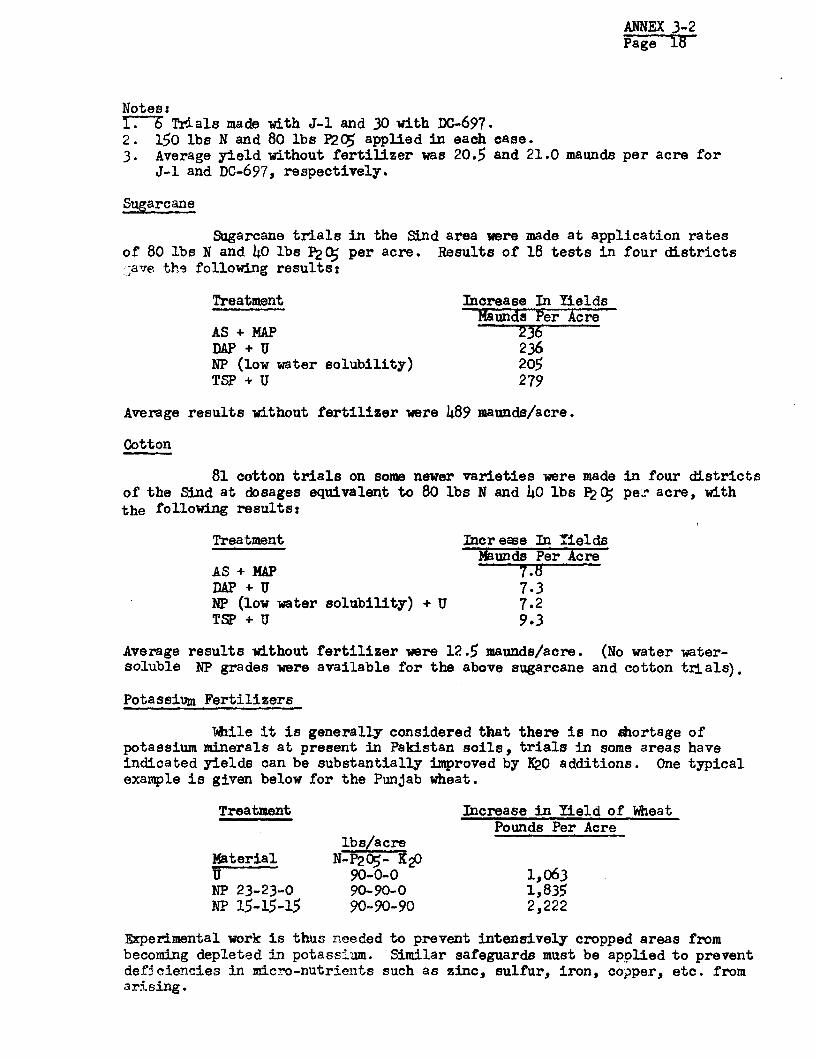
ANNEX 3-2Page 16
Notes:17. Trials made with J-1 and 30 with DC-697.2. 150 lbs N and 80 lbs P2C5 applied in each case.3. Average yield without fertilizer was 20.5 and 21.0 maunds per acre for
J-1 and DC-697, respectively.
Sugarcane
Sugarcane trials in the Sind area were made at application ratesof 80 lbs N and 40 lbs P2C5 per acre. Results of 18 tests in four districts;,ave the following results:
Treatment Increase In YieldsMaunds Per Acre
AS + MAP 236DAP + U 236NP (low water solubility) 205TSP + U 279
Average results without fertilizer were 489 maunds/acre.
Cotton
81 cotton trials on some newer varieties were made in four districtsof the Sind at dosages equivalent to 80 lbs N and 40 lbs FP(; per acre, withthe following results:
Treatment Increase In YieldsMaunds Per Acre
AS + MAP 7.tSDAP + U 7.3NP (low water solubility) + U 7.2TSP + U 9.3
Average results without fertilizer were 12.5 maunds/acre. (No water water-soluble NP grades were available for the above sugarcane and cotton trials).
Potassium Fertilizers
While it is generally considered that there is no shortage ofpotassium minerals at present in Pakistan soils, trials in some areas haveindicated yields can be substantially improved by K20 additions. One typicalexample is given below for the Punjab wheat.
Treatment Increase in Yield of WheatPounds Per Acre
lbs/acreMaterial N-P205- K20U 90-0-0 1,063NP 23-23-0 90-90-0 1,835NP 15-15-15 90-90-90 2,222
Experimental work is thus needed to prevent intensively cropped areas frombecoming depleted in potasslum. Similar safeguards must be applied to preventdeficiencies in micro-nutrients such as zinc, sulfur, iron, co?per, etc. fromarising.
ANNEX 3-2Page 19
4. Projected Fertilizer Demand, Production and Imports
Numerous projections of fertilizer demand and supply have beenmade for Pakistan by domestic and international specialists, and theirestimates vary widely. Some have been based on historical data which areerratic in Towth because of factors unrelated to demand, e.g. hostilities,weather or foreign exchange availability and the forecasts may be low.Others have been baEsed on recommended crop dosages or calorie requirementsper capita and have been too high. Accordingly, only those projectionsbelieved to be of the most reaListic nature will be briefly examined andcorresponding conclusions drawn.
Constraints
Water Availability
The majority of farmers are totally dependent on irrigation facili-ties, or uncertain and limited rainfall Which discourages risking outlaysfor fertilizer on crops that may largely fail. Even in irrigated areas watersuppiies xay vary from year to year, because of fluctuations in mountain snow-falls; during the early months of 1970 and 1971 river levels were the lowestin 100 years. (However, completion of the Tarbela Dam will help to providemore regular annual irrigation). Consequently, farmers have tended to reducerisks of financial loss by limiting investments in fertilizers. Even manylarger farms do not use more than 60 lbs/cre of N and 10 lbs or soor P205, compared to recommended applications of 120 lbs and 60 lbs, respec-tively, on high-yield wheat.
Credit Availability
Whereas many large and medium sized farms are able to pSy cashor obtain short-term loans without difficulty, milLions of small and subsis-tence farms have had no access to credit on favorable terms. On the assumD-tion that small farms make up about one-third of the agricultural compor.entof the GDP (Gross Domestic Product), and that these would respond rapidly torealistic credit availability, it is estimated their annual needs would amountto about Rs 5,000 million (US$500 million approximately).Present farm credit availability is only one-tenth of this sum. Hence, lackof credit facilities must be considered a major constraint that needs amelior-ating at once. Of course, only part of this sum wolId be required for fertil-izer purchases but these would be ineffective without simultaneously providingcredit for other related farm inputs.
Product Availability
In the past, lack of fertilizer availability due to foreign exchangerestrictions and limited local production has placed severe limits on unhamperedmarket growth. In the next few years international supply/demand imbalanceswill adversely affect consumption.

ANNEX 3-2Page 20
Crop Prices
Large and medium sized farmers producing cash crops, will notstrive for greater outputs and use corresponding additional fertilizer,unless crop prices justify the extra risk and effort. Consequently, theseprice levels must bear a profitable ratio to the cost of fertilizer andother inputs. However, the Government is acutely aware of the politicalovertones induced by increases in crop prices and avoids them to the extentpossible. As a result, agricultural expansion and increased fertilizer useare gradually retarded until new crop prices are authorited.
Farmer Education
Ignorance of, and resistance to, fertilizer use is eiminishingdue to the spread of education and demonstration campaigns by public andprivate sector producers and distributors. However, much promotional workrsmaina to be dDne, particularly in the poorer rural areas and increasedemphasis on regular use of recommended dosages will be necessary as morefertilizer, especially phosphate, becomes available.
Demand Projections by Sburce and Basis
Edwards has made the following projections according to thebasis and assumptions given below:
Basis: Indicated crop.increases and modified recommendedapp_ication rates
Iteat: Recent annual growth rates of 15% in the use of highyield varieties (HIV) will continue, and all irrigated-heat areas (nearly 12 million acres) plus 4 millionrain-fed (barani) acres will be planted to HYV by 1974/75.
Rice: The whole irrigated area of 4 million acres will beplanted to HYV Basmati seed by 1974/75.
Cotton: Higher prices and increased exports plus more pesticideavailability will encourage raising planted acrease to5 million by about 1975.
Other Crop yields and fertilizer ses similar to those forCropss wheat, rice and cotton will result on sugarca;-ie, maize,
oilseeds, fruit, fodder, etc., which represent 20% ofcurrent fertilizer demand.
Recommended Rates
Typical recommended application rates for the major crops are 68 lbsN and 53 lbs E2(5 per acre applied as a basal (seed) dressing in the form ofDAP or NP or SSP, plus CAN or urea. This is followed by a top dressing of 100lbs N as urea or CAN, to give a total N:P205 ratio of 3.2:l.
1/ W. Edwards, Agronomist, IBRD, Islamabad.

ANNEX 3-2Page Z
Modified Recommended Rates
In many countries and for most crops, 67 to 75% of the maximumeconomic return can be achieved by using 50% of recommended N dosages.Accordingly, Edwards adopts much lower relative rates for N and also loweraverage rates for N plus P205 , to give the following projected modifiedneeds:
Table 4.1Projected, Modified Fertilizer Needs 1974J/1975
('000 nutrient tons)
Crop *N P7 0 Whealt b5 1&o0Rice 164 66Cotton 204 83Other 211 85
Total l,5(N; P205 - 2.5:1)
Because of lack of availability, however, it is unlikely even these reducedneeds will be met by 1974J/75.
Projections based on recent actual consumption and probable expandedcrop acreage show the following pattern for 1974/75.
Table 4.2Projected Fertilizer Demand Based on Actual Consumption 1974/75
('000 nutrient tons)
Crop N P OMe-at Rice 55 12Cotton 120 17Other 122 20
Total(N:P205- 6.2:1)
Regarding N:P205 ratios, Edwards stresses that every effort mustbe made to reduce the present high figures to an average not greater than4:1 and, if possible, 3:1; otherwise, yields of high-yielding variety cropswill soon become seriously retarded. For example, in 1970 and 1971, theseratios for wheat were 13:1 and 7.1:1 while for sugarcane, cotton and rice theyranged from 20:1 to 13:1. The effect of nitrogen application-rate levels onphosphate intake must also be considered. Recent Esso Pakistan FertilizerLtd. trials have shown that use of phosphates, and in turn, additional N, onhigh-yield varieties of Wheat are only economic when niltrogen dosaige is morethan 60 to 65 lbs N per acre. It is likely that responses of other crops aresimilar, thus emphasizing the essential need for much greater phosphate use,to maximize the benefits of adding both nutrients. In many cases, use of Non MexiPak Wheat in Pakistan is now in the range of 40 to 45 lbs/acre.
Esso Pakistan Fertilizer Ltd. and the Agricultural DevelopmentCorporation have made projections of land use and fertilized acreages, as wellas estimates of typical crop nitrogen dosages for 1979/80. By this time,greater fertilizer availability and reduced application constraints due to

ANNEX 3-2Page 22
cited reasons can be anticipated. Moreover, to make economic use of thehigh-yielding varieties of the major crops - wheat, rice and cotton - itwill be essential to use the minimun recommended dosages and an average4.1 N:P205 nutrient ratio as advocated by Edwards. Combining these projectedland-use and fertilizer-use patterns for 1979/80 and allowing a conservative5% overall increase for 1980/81 gives the following demand estimate:
Table 4.3
Projected Fertilizer Nutrient Demand for 1980/81
Arable Land Dosaee Nutrient Consumption(Millions of Acres) lbs/acre (I000 tons)
Crop Total % Fertilized N N Lay
1. Rice:
Irri & HYV 3.0 97 86 11h.0 28.5Others 2.5 51 26 15.0 3.7
2. Wheat
MexiPak 12.0 92 86 430.0 107.0Barani 3.0 26 25 8.9 2.2
3. Bajra 1.5 11 10 0.8 0.24. Maize 1.5 67 I1 18.6 4.65. Barley 0.4. 10 11 0.2 0.16. Gram 2.5 0 0 0.0 0.07. Sugarcane 1.7 97 123 92.0 23.08. Rape & Mustard 1.0 11 11 0.5 0.19. Sesme &
Groundnut 0.2 11 11 1.1 0.310. Cotton 5.0 92 86 180.0 h5.O11. Tobacco 0.2 100 32 2.9 0.712. Pulses 0.5 11 10 0.2 0.113. Vegetables 1.0 21 40 3.8 1.014b. Fruit o.6 21 102 5.8 1.415. Jowar 1.5 0 0 0.0 0.016. Fodder 5.0 0 0 9.0 0.0
17. Total 43.1 873.8 217.9
1/ Based on a minimum target N:P 2 05 ratio of 4:1, as urged by Edwardsand others.

ANNEX 3-2Page 27-
Thus, the envisaged demand for nitrogen (N) and phosphorus(P205) fertilizer nutrients by 1980/81 are seen on the above basis as about875,000 tons and 220,000 tons respectively, assuming a minimum target ratioof 4:1 for N: P205 is achieved. By this time, some potassium fertilizermay also be needed and could amount to at least 25% of phosphate needs, or55,000 tons per year of equivalent K20.
5. Past, Present and Projected Domestic Fertilizer Production
Past and Present Installed Capacity
Phosphate: Fertilizer production in Pakistan commenced in 1957when a smalflr 1tp-dsulfuric acid plant at Lyallpur was complemented by a60 tpd (3,240 tpy P205) single superphosphate (SSP) unit. As phosphatefertilizer demand slowly increased, WPIDC expanded production by enlargingthe 4 yallpur unit to about 18,000 tpy and building another 100,000 tpycapacity at Jaranwala, 22 miles away. Thus, combined P205 capacity of0-18-0 SSP would be 118,000 tpy or 20,000 tpy N, providing sulfuric acidsupplies were sufficient.
However, SSP production and consumption in recent years has beenonly in the 4,000 to 5,000 ton range, due to much of the available sulfuricacid being used for other purposes and also, product acceptance. Discussionswith several farmers have indicated there is little reluctance to use SSPper se, but they showed a distaste for handling the WPIDC product. This isbecause it is bagged in a powdered, semi-cured form and often ar-rives atthe farm in lumpy masses which have to be manually pulverized before use.Also, even when powdered, the material cannot be spread mechanically on thelarger farms. Production of a well-cured granular product by simple mechan-ical means (as discussed with plant management) would do much to improvequality and farmer acceptance. Jordan rock has been consistly used in theseplants and sulfur is currently imported from Poland.
Nitrogen: In 1957/58, an ammonium sulfate plant of 50,000 tp;product capac'iy supplied under USAID, came on-stream at Daudkhel in mianwaliDistrict. Initially, it was based on producing 40 tpd of ammonia plus bV-product carbon dioxide from nearby coal-deposits and using these gases toconvert local gypsum to ammonium sulfate. In 1965, the plant was expanded andan additional 36 tpd of ammonia produced to yield a further 45,000 tpy ofsulfate. Recently, natural gas has become available via a Sui Northern Pipe-line from Dhulian and, by 1974, all production should be based on natural gasinstead of coal. Part of the ammonia output in the last ten years has beenused for refrigeration and defense purposes and this, together with plantmodifications plus fuel and other problems, has restricted annual sulfate out-put in recent yearsto 60,000 tons or so. The plants are old but well-maintainedand when fully on natural gas should be capable of achieving outputs of 90,000tpy ammonium sulfate (say 19,000 tpy of N).

ANNEX 3-2Page 24
In 1963, a crystalline urea plus calcium ammonium nitrate (CAN)plant, supplied under tied French aid, was started up by WPIDC at Multanbased on Sui natural gas. Plant capacities were 200 tpd ammonia (2 streams)plus 1W0 tpd (57,000 tpy) urea and 300 tpd (99,000 tpy) CAN using limestoneas a filler to give a 26.6% N product.
The ammonia units have never consistently achieved design capaci-ties and in 1968, an "Ammonopac" 60 tpd packaged ammonia plant was installedto remec4 the deficiency but thie, too, has never operated properly. In1965/66, for example, 41,000 tons of urea and 79,500 tons of CAN were produced,representing 71% of design production, while in 1971/72, corresponding outputswere 27,300 and 76,000 tons or 61% of design capacity. While the granularCAN product is liked by farmers, the crystalline bagged urea now made hardensinto "tombstones" and is often rejected as unusable, despite acute shortagesof N fertilizers. ( A prilling tower is under construction to remedy thisproblem ).
In 1968, Esso Pakistan Fertilizer Ltd. brought on-stream a prilledurea plant at Daharki in the SLnd based on MaNri natural gas, with an outputof 300 tons ammonia or 515 tpd (170,000 tpy) or urea equivalent to 72,000 tonsof N annually. At times, the plant has demonstrated urea capacities 115%of design rating, i.e. 83,000 tpy and output haa consistently been high. In1971, Dawood-Hercules brought into opetration a 345,000 tpy prilled urea plant(155,000 tpy N) at Chichoki-Mallian, 16 miles from Lahore, based on Sui gas.Apart from interruptions due to hostilities and one or two mechanical failures,this plant has demonstrated an ability to operate consistently 10% abovedesign rating and, like Esco's urea, the product has won ready acceptance byfarmers.
Historical production of fertilizer in Pakistan by source, typeand nutrient total is given in Table 2.2. and is reproduced here for conveniences

ANNEX 3:-2Page 25
Table 5.1
Production of Fertilizers at Various Plants in Pakistan
1960/61 to 1972/73(Nutrient Tons)
WPIDC WPIDC ES0 Dawood WPIDCDaudkhel Multan Hercules Lyallpur/Ammonium Jaranwala Total,
Product Sulhate/ Urea CAN Urea Urea SSP Nitrogen P205
1960/61 9,902 - - - - 1,618 9,902 1,6181961/62 11,053 340 2,513 - - 1,4h42 13,906 ]L!1a21962/63 11,015 13,128 17,317 - - 1,108 11,L,6o 1,1081963/64 10,479 18,549 16,241 - - 1,205 45,269 1,2051964/65 7,436 20,543 20,162 - - 1,167 L)8,1141 1,)!671965/66 8,198 19,056 19,878 - - 1,)438 h7,132 1,)4381966/67 9,001 21,892 21,068 - - 724 51,961 72)41967/68 9,830 20,020 20,354 - - 2,89)4 50,20)4 2,89111968/69 8,940 20,686 17,201 32,200 - 2,5h8 79,027 2,5b.81969/70 12,194 21,386 21,533 73,544 - L,069 128,657 4,0691970/71 12,328 15,072 22,096 80,083 - 4,583 129,579 1h,5831971/722/ 13,288 11,552 19,770 76,901 93,559 4,9)48 215,070 h,9481972/73- 13,000 9,000 15,000 77,000 110,000 5,000 25L4,000 8,000
1/ Excluding sales of ammonia which could otherwise be converted into anmoniumsulphate.
2/ Estimated.
Source: Chemical Consultants (Pakistan) Ltd.
Projected Capacity - Expanded and New Plants
Phosphate
As Single Superphosphate: The two S5P plants at Lyallpur andJaranvala should together produce about 108,000 tpy (19,500 tpy P205) ifoperated on a three-shift basis and supplied with sufficient sulfuric acid.Latest plans call for using all of the 20 tpd sulfuric acid at Lyallpur tomake SSP and expanded acid production at Jaranwala from 50 to 100 tpd. Thiswould produce about 300 tpd or 90,000 tpy SSP (16,000 tpy P20 ) assuming100 tpd of acid were consumed and 20 tpd were sold. Alternatively, a new100 tpd sulfuric acid plant might be installed at Jaranwala. 'This wouldenable 360 tpd of super to be made in both plants (108,000 tpy product or19,500 tpy P205), and still leave 50 tpd of sulfuric acid for sale. In viewof the forthcoming expansion at Multan, however, construction of the smalleracid plant, to give a total production of about 90,000 tpy SET or 16,000 tpyP205 is currently favored. This seems surprising as sulfuric acid is increas-ingly needed in most developing countries, not only for phosphate fertilizerproduction but for many industrial purposes.
ANNEX 3-2Page 26
As Nitrophosphate: The Multan expansion project described inthis appraisal is based on producing 70,000 tPY Of P205 plus 70,000 tpy Nas a nitrophosphate (NP) containing 22.5% P2C5 and 22.5% N, together with90,000 tpy of N as calcium ammonium nitrate CAN.
As Other Phosphate Products (Monoammonium Phosphate ( W ) andMAP Urea Mixtures): In 1968, a company known as Pakistan Fertilizers Ltd.sponsored by Jaffer Brothers Ltd., placed pro-forua orders idi PintachBamag A. G. (Federal Republic of Germany) for a plant to produce triplesuperphosphate (TSP) at Karachi based on imported phosphate rock and sulfurwith a capacity of 150,000 t py (70,000 tpy P205). This contractor becamebankrupt and a new contract was placed with Mannesman Exports (also FederalRepublic of Germany) but to make monoammonium phosphate (MAP) instead ofTSP, using imported ammonia and phosphoric acid during the first five years.The MAP would be combined with domestic urea to a granular 28-28-0 productknown as UAP (urea ammonium phosphate) developed by Tennessee Valley Authorityof USA. Permission to proceed was granted by GOP in November 1970 to JafferBros. who acquired land and assembled a project team but further work ceasedwhen management control was taken over by the Government under the EconomicReforms Order in February 1972. This project (Pakferco) was to be aided bya PICIC loan of about US$2 million, which is still valid.
In mid-1973, the Government again approved the project and followingnew tendering, SLnon Carves Ltd. of the UK was awarded the contract by thenow-Government controlled Pakistan Fertilizer Company Limited, for a MAP planthaving an output of about 140,000 tpy (equivalent to 13,000 tpy N and 50,000tpy P205). The product would be blended by Pakferco and/or others with ureato produce UAP. Estimated total cost is PRs 100 million or about US$10 millionHowever, as regular supplies of imported ammonia, phosphoric acid and evenMAP are very scarce and unlikely to be available for several years, the via-bility of this import-based project appears questionable at this time. Theuse of wet-process phosphoric acid to be made at the envisaged Sarhad projectin the North West Frontier Province (described below) has been suggested, butthis availability is also unlikely for several years, if at all. Anothersuggestion, if the Sarhad project materializes, is to move the Pakferco MAPproject to Sarhad and ship the product to urea plants in the Punjab and theSind to make granular UAP.
Phosphates Made from Ijdgenous Phosphate Rock
Existence of large alluvial tracts is Pakistan have led to specu-lation that commercial phosphate deposits may exist in the country, possiblyin the Salt Range and Potwar Plateau regions. Surprisingly, in 1969, somehard blue apatite rock was discovered near Abbottabad in the Hazara District,North West Frontier Province. Subsequent exploration in this province hasrevealed numerous phosphate deposits, albeit not large ones compared to thosein USA or North Africa, but big enough to be worth considering as commerciallysignificant for Pakistan. Some are fairly pure, high grade apatite, whichwould need little treatment, apart from grinding, to be used in phosphoricacid or superphosphate production. Others are low-grade ores contaminatedwith dolomite and would require beneficiation before use. The summary ofproven and likely deposits in the Abbottabad-Tarbela-Peshawar region is givenbelow:

ANNEX 3-2Page 27
Millions of Tons of RockDistrict Proven Probable PossibleLagarban 2.5 2.0 -Mirpur Kakul 1.4 o.6 -Abbottabad - 12.0Tarbela 5.0
Total 739 1T70
Although apatite outcrops in amall quantities near Abbottabad,many of the other deposits lie at depths of 200 to 500 feet. Of the provenreserves, about 1.7 million tons averaging 30% P205 and easily upgradeableto 32/3h% are available. These could feed a plant of 80,000 tpy P205capacity for 6 years or a 90,000 tpy P205 installation for 5½ years, allowingfor processing and handling losses. Afterwards, proven lower-grade depositswould have to be mined and beneficiated before use and might feed a 90,000tpy plant for 6 years or so. Possible additional reserves identified to date,with an assumed average P205 content of 20%, might supply a 90,000 tpy plantfor an additional 35 years. However, mining and beneficiation costs could behigh since many deposits are scattered and lie at depths from 300 to 500 feetin dolomitic beds. Also, as with Rajasthan rock in India, known methods ofeasily separating associated dolomite have not yet been commercially developed,apart from one specific case in Brazil.
Estimates of mining costs for the better and more accessible depositsvary considerably, but are reported to indicate a probable averaEe ex-mineprice of about Rs 70 (US$7 per ton). Transportation cost-estimates also covera wide range but are expected to average about Rs 80 to give a delivered priceto a proposed plant site at Tarbela of about Rs 15C (US$15) per tonTherefore, the possibilities of using these domestic phosphate deposits areappealing, especially as cif prices are over US$h0 per ton.
The extent of proven reserves may be toosmall to justify building at Tarbela a phosphate complex consisting of sulfuricacid, phosphoric acid and diammonium phosphate (DAP) or triple superphosphate(TSP) units, having a P205 equivalent output of about 300 tpd or 90,000 tpy,as proposed by the Sarhad Development Authority. Also, a later switch toimported rock would involve high transportation costs from Karachi to Tarbelain the NWFP. An alternative would be to use domestic rock tothe extent possible in the Lyallpur and Jaranwala single super plants and theMultan nitrophosphate plant - unless substantially bigger reserves are discov-ered. At design capacities, these fertilizer plants would together consumeabout 90,000 tb1 of P205, equivalent to the needs of the envisaged phosphatecomplex at Tarbela. This would avoid risking about US$15 million in capitaloutlay at Tarbela or the alternative possibility of having to pay high rocktransportation costs from Karachi to Tarbela, should domestic reserves proveinsufficient or unsuitable.

ANNEX 3-2Page Zd
Therefore, domestic phosphate producti n projections made atthis time -will assume that production equivalent to the plant sactioned by thethe Government at Karachi, will go ahead and will graduallyproduce up to ±3,000 tpy of N and 50,000 tpy of P205 annually as 148.,000tpy of MAP from 1977 onward, when sufficient phosphoric acid (and ammoniaif necessary)may be available from Mexico, North Africa or U.S.A. Projecteddomestic phosphate production on the above assumptions would therefore bes
Table 5.2
Pro,jected Domestic Phosphate Production 197h to 1981
Calendar Tons P205Year Single Super Nitrophosphate MAP Total
1973/74 9,000 0 0 9,000
1974/75 10,o000 0 0 1C,000
1975/76 10,000 0 0 10,000
1976/77 1J,OOu2 200-/ 0 L,0,200
1977/78 15,000 57,500Q/ 0 72,500
1978/79 16,000 63,0004/ 25,000o1 104,500
1979/80 16,000 63,000 33,000-/ 112,000
7/1980/81 16,000 63,000 ot5, 0ooo- 121[,000
1/ Based on installation of a new 50 tpd sulfuric acid plant.2/ 6 months at 75% capacity.3/ 6 months at 75% plus 6 months at 90% capacity.F! 12 months at 90% capacity.§/ 12 months at 50% capacity based on assumed availability of 50s of
phosphoric acid needs.6/ 12 months at 67% of capacity.7/ 12 months at 90% of capacity.
These domestic P205 productica estimates compare with projected demand asfollows:

ANNEX 3-2Page 29
Table 5.3
Corparisons of Projected P205 Domestic Production and Demand
Calendar Tons P20H ,Year Deand 2 Production Shortage
1973/76 60,000 9,000 51,000
1974/75 73,000 10,000 63,000
1975/76 90,000 10,000 80,000
1976/77 108,000 110,200 67,800
1977/78 130,000 72,500 57,500
1978/79 155,000 104,5002/ 50,500
1979/80 185,000 112,0002/ 73,000
1980/81 220,000 1211,0002/ )6,000
Note 1: If NWFP phosphate rock proves to be commercially viable, itis unlikely significant quantities could be made available before 1976/77,bearing in mind the appreciable mining, transportation and later beneficiationproblems to be overcome. Possibly, 100,000, 200,000 and 300,000 tpy might beproduced and used from 1976/77 onwards. This vould yield substantial savingsin foreign exchange, especially on imported rock prices in the anticipatedUS$40 per ton cif range.
Note 2: Based on anticipated increases in crop dosages shown in Table 4.3;the corresponding average annual increase in P2 05 consumption for the periodshown is about 21%.
Note 3: Although the above production figures include 25,000 tons, 33,000 tonsand 45,000 tons P20s for the last 3 years, these represent MAP made fromimported phosphoric acid.
It can be concluded from Table 5.3 and Figure 5.1 that by 1980/81a wet-process phosphoric acid plant with a capacity of at least 150,000 tpyor 500 tpd P20< , say, to supply Pakferco and the projected P205 shortageappears justified.
Mari Gas, Urea Project
A plan to build a 600,000 tpy urea plant in the Sind, operatingon Mari gas, with at least 200,000 tpy comnitted to export sales has beensanctioned by the Government. This proposed project has encountered financingproblems and it therefore has not been included in the following nitrogenproduaction projections.

Table 5.L
3;'Projected Nitrogen Fertilizer Production-
'000 Tons of N
Ammonium CAN, Multan NP Urea MAP-Calendar Sulfate 2/Year Daudkhel Existing New Multan Multan Esso D-H Fauji Pakferco Total
1973/7h 15 22 0 0 21 78 1h5 0 0 281
197h/75 18 22 0 0 21 79 150 0 0 290
1975/76 19 22 0 0 2'! 80 150 0 0 292
1976/77 19 0 44 26 22 80 155 0 0 3h6
1977/78 19 le 96 57 33 80 155 93 0 551
1978/79 19 19 105 63 33 80 155 20h 0 678
1979/80 19 19 105 63 33 80 155 223 0 697
1980/81 19 19 105 63 33 80 155 223 0 697
1/ Based on imported ammonia. If domestic ammonia were used, this could come from Fauji, whose urea output would bereduced accordingly (by about 13,000 tons N or 28,000 tons urea annually).
2/ Using same annual production basis in early years as assumed for NP project and 90% of design capacity thereafter(see Table 5.2).
3/ Multan products in early years are in proportion to ammonia availability except for existing granular CAN. Actual production of each material will depend on future prevailing circumstances. m
CD~
f\

ANNEX 3-2Page 31
Table 5.5
Cmpari8ons of Projected N Domestic Production and Demand
'000 Tons N
CalendarYear Demand- Production Deficit
1973/74 h30 281 Th9
1974/75 175 290 185
1975/76 530 292 238
1976/77 590 346 2hLI
1977/78 650 551 99
1978/79 720 678 L2
1979/80 790 697 93
1980/81 875 697 178
Note lt The projected growth, based on anticipated increases in crop dosagesshown i!n Table 4.3, correspond to an average yearly increased of 11% for the
period shown.
Note 2: If MAP were to be made at Karachi by Pakferco, using imported ammonia,the equivalent of N needed would be part of the differences shown above forthe last three years. If made from domestic ammonia, the N shortages shownabove would be the same, as some MAP would be substituted for domestic ureaon an equivalent N basis.
It can be concluded from Table 5.5 and Figure 5.2 that, even witha large Fauji urea plant (910 tpd ammonia and 530,000 tpy urea) on-streamat 90% of rated capacity, together with the Multan project and existing fer-tilizer plants, no excess domestic production should arise - based on theanticipated greater application rates shown in Table 4.3.
6. Fertilizer Bag Supplies
Additional production of some 2,500 tons of fertilizer daily fromMUltan plus the corresponding increase in foodgrains (and the probable laterimpact of the Fauji 1,500 tpd urea project) will impose a strain on the avail-ability of baga. Since jute became largely unavailable after the separationof Bangladesh, recourse to domestically-produced cotton bags lined with importedpolyethylene has become widespread. Typical price of a 50 kilogram (kg) bagfor urea is PRs 3.20 including PRs 0.60 for the liner, while a 37.8 kg bag forCAN costs Rs 2.95 including PRs 0.5 for the liner. To conserve domestically-grown cotton for export purposes, the use of woven polyethylene liner and basedon imported polymers is contemplated.
ANNEX 3-2Page 32
However, oil shortages in Europe, Japan and USA may drasticallyreduce the availability of these polymers. Proposals to make them fromdomestically available naphtha or heavier bydrocarbons have been prepared,but investment costs are in the US$100 million category for a suitableintegrated polyolefinea complex and ultimate availability of bags from thissource, even if approved in the mid-seventies, would be several years hence.Therefore, attention must be given now to ensure an adequate supply of bags
for the Multan project. This subject has been discussed in detail with NFC'sconsultants and possible use of alternative materials for bags, such as paperor straw, reuse of old bags, bulk handling and other suggestions are beingexplored.

Page 33
PAKISTANMULTAN FERTILIZER EXPANSION PROJECT
PROJECT P2 05 CONSUMPTION AND DOMESTIC PHOSPHATEFERTILIZER PRODUCTION FOR PAKISTAN
200n0 -n
is
LO
/ / ~~~~~~~PAKFERCO~~~PROJECT
/~~~~~~~~~~~~~200,000
NSNUMPTION MLA
/ ~~~NITROPHOSPHATE:/ ~~~PROJECT
/ PLUS
/ ~~~JARANWALA/ ~~~SUPERPHOSPHATE
/ EXPANSION
PRODUCTION
I~ @- 0 ,
*T LEXISTING SSP PLANTS
73 73/74 74175 75/76 76177 77178 78179 79180 80/18
Industrial Projects Deapartment World Bank-8373
January 1974


ANNEX -2Page 3
PAKISTANMULTAN FERTILIZER EXPANSION PROJECT
PROJECTED N CONSUMPl ION AND DOMESTIC NITROGENFERTILIZER PRODUCTION FOR PAKISTAN
1,000
//
900 /
800_
Boo~~~ -- -
700
S ~~~~~~FAJJIIr /UREA PROJECT
(LARGE)o 600_// -wC-
O
o 500
U.
MULTAN NITROPHOSPHATE<a MULTAN CANU) CONSUMPTION
40 MULTAN EXTRA UREAO 400 /
300 _ PRODUCTION ........ ,,,., ............... ,...,,,,,..
>>s*- ... ~~~~~~~~~~~~EXISTING PLA.NTS
200
100
73 73/74 74/75 76/76 76/77 77/78 78/79 79/80 80/81 YEAR
World Banik-8374Industrial Projects DepartmentJanuary 1974

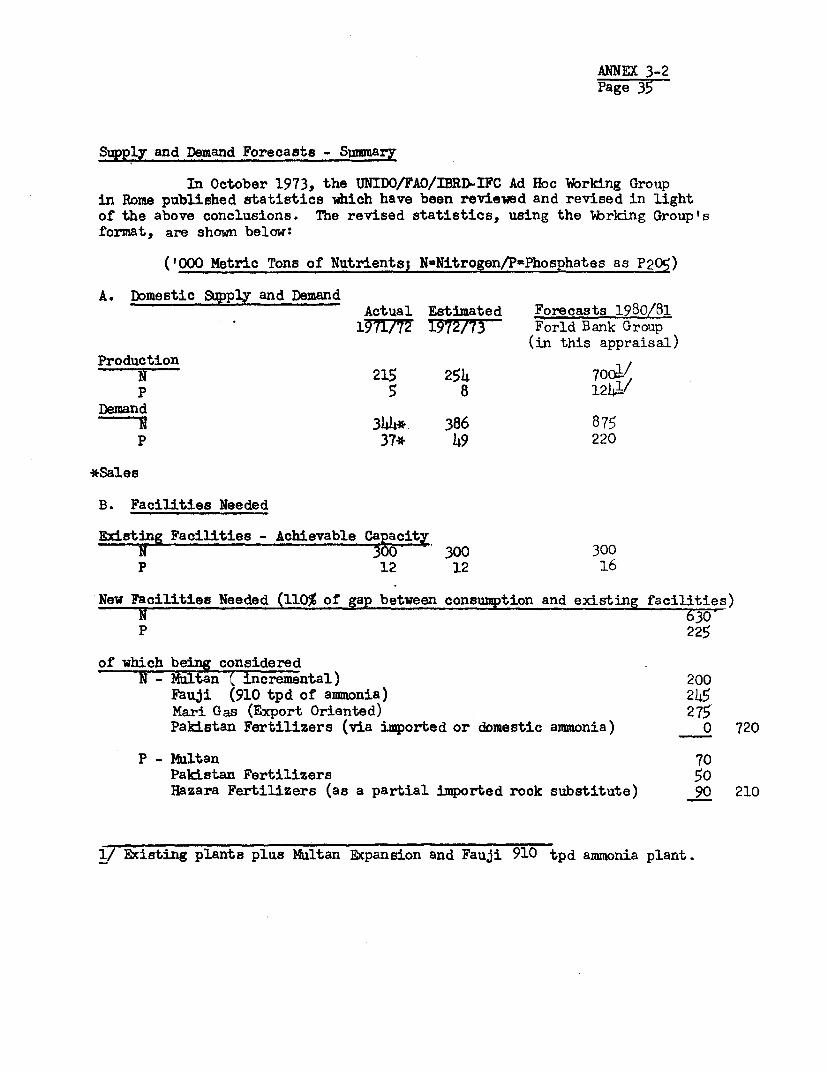
ANNEX 3-2Page 35
Supply and Demand Forecasts - Summary
In October 1973, the UNIDO/FAO/IBRD-IFC Ad Hoc Working Groupin Rome published statistics which have been reviewed and revised in lightof the above conclusions. The revised statistics, using the Wbrking Group'sformat, are shown below:
('000 Metric Tons of Nutrients3 N-Nitrogen/P-Phosphates as P205)
A. Domestic Supply and DemandActual Estimated Forecasts 1980/8119i727 1972/73 Forld Bank Group
(in this appraisal)Production
N 215 254 70012/P 5 8 1241/
Demand344* 386 875
P 37* 49 220
*Sales
B. Facilities Needed
Existing Facilities - Achievable CapacityN 300 300 300P 12 12 16
New Facilities Needed (110% of gap between consumption and existing facilities)N 630-P 225
of which being consideredN - Multan ( incremental) 200
Fauji (910 tpd of ammonia) 245Mari Gas (Export Oriented) 275Pakistan Fertilizers (via imported or domestic anmonia) 0 720
P - Multan 70Pakistan Fertilizers 50Hazara Fertilizers (as a partial imported rock substitute) 90 210
1/ Existing plants plus Multan Expansion and Fauji 910 tpd ammonia plant.

ANNEX 3-2Page 36
Demand and Supply of Fertilizer in the Punjab and North West Frontier Province
In recent years, the following percentages of fertilizers in pro-portion to the totals for the country have been consumed in the Punjab andthe NWFP
Averae of Last Three Years - 1968/69, 1969/70, 1971/72Nutrient Punjab NWFP Total
N 6-7r774P2 05 66% 10.1% 76.1%
It is anticipated that these proportions will continue. Thus, forN and P205 the projected demands in the Punjab and NWF provinces will beapproximately 75% of the totals for the country, as given in Table 5.3 and5.5. Projected increases in production will all be based in the Punjab, withthe exception of the proposed MAP plant at Karachi, which is anticipated tobe based on imported P2 05 and domestic N. The corresponding projected Nbalance for the Punjab is given in the following Table 5.7:
Table 5.7Projected N Fertilizer Balance - Punjab and NWF Provinces
('000 Tons of N)Year Demand Production (Shortfall Surplus1973774 1322 21 (41)1974/75 356 290 (66)1975/76 398 292 (106)1976/77 443 346 (97)1977/78 490 551 611978/79 540 678 1381979/80 593 697 1041980/81 658 697 39
Thus, it can be seen that in 1977/78, the Punjab wculd be producingsurplus nitrogen fertilizer if the large Fauji plant were built. IHowever, asthis plant would be only 20 miles or so from the Sind, which represents alarge and expanding market, no diffculties for the Multan or Fauji projectsare foreseen as there will be a net N shortage for the country, as shown inTable 5.5. Furthermore, since Multan is in a prime marketing area of the coun-try which also consumes about 64% of N sales in the Province, and the envisagedFauji plant would be located 200 miles away, no significant competition fromFauji or vice-versa is foreseen for N fertilizers. The corresponcing situationfor phosphate fertilizers is shown in Table 5.8, based on 75% of total countryP205 and assuming all Pakferco's MAP output is used in the Sind.
Table 5.8Projected P2 0c Fertilizer Balance-Punjab and NWF Provinces
(1000 tons of P2 05 )Year Demand Production (Shortfall)977/74 45 9 (36)-
197V75 55 10 (45)19753776 67 10 (57)1276/77 81 40 (41): 9 07 7/78 97 72 (25), -/79QJO 117 75 (42)
7/3v 139 79 (60)1;1 0/.8 165 79 (86)

ANNUX 3-2Page 37
Thus, there should be a continued and growing shortage of domesticallyproduced P205 fertilizers in the Punjab and NWF Provinces, even after theMultan nitrophosphate plant is built. Further domestic production thereforeis of high priority and during negotiations the Bank emphasized its interestin closely following Pakistan plans to meet its growing requirements.
Competition
Nationwide: Based on demand and supply calculations previouslyreviewed, except for the possibility of the large Mari gas urea project,no anticipated major competition is foreseen from any existing or newfertilizer plant likely to be built before 1980/81, either in terms of N orP 9 0. In fact, these projections show the need for additional domesticritgogen and phosphate production capacity in the late 1970's (see Tables5.3, 5.5 and Figures 5.1 and 5.2).
In the Punjab and NW Frontier Provinces: No significant N or P 0competition rmm exifing or proposed new plants Is foreeen.2 5
Industrial Projects flpartmentMarch 1974


ANNEX 3-3Page 1
PAKI6TAN
MJLTAN FERTILIZER EXPANSION PROJECT
Fertilizer Distribution, Credit, Prices and Transportation
Distribution
National
From 1967 to October 1973, fertilizers in Pakistan were sold anddistributed either by the producer (e.g. Esso) or via a group of PrincipalAgents who have representatives in mandi (market) towns throughout themajor agricultural areas. Major agents are: Dawood Corporation, PakistanNational Oils and Jaffer Brothers for domestically produced products, plusthe Agricultural Supply Organization (ASO) for imported materials, TheGovernment establishes the upper limit of allowable marketing expenses aswell as maximum sales prices to farmers, thus retaining control of allowablecosts. Total current marketing cost is estimated to be about PRs 50 per tonof product. Thus whether Pakarab Fertilizers Limited were to set up itsowmn sales and distribution organization or sell through others, the marketingmargin would be controlled. However, marketing zeal and efficacy woulddepend on the ability of the selling organization. From 1964 to 1966, WPIDCundertook its own marketing and NFC still retains a promotional group that isnow strongly emphasizing the use of more phosphate fertilizers. In the caseof Multan project, the Government has agreed to enable the company to utilizeor establish an efficient distribution network.
Punjab Province
In the Punjab Province, the provincial government re-entered ferti-lizer distribution in October 1973, and tried to take over full distributionfrom the private and public sector plants. One private sector plant (Esso),located outside the Punjab, is allowed, under agreements with the centralgitovernment, to distribute all of its output itself, including its sales int.he Punjab which are about 15% of Esso's production. The other private sectorplacnt (DH) located in the Punjab, has obtained a compromise allowing it todistribute half of its output through its three private agents with the otherhalf going to the provincial govermment's newly created Punjab AgriculturalSupply Corporabion (PASC). NFC distributes its entire output for the Punjabthrough PASC.
Credit
Credit is provided for fertilizer through the system of commercialbanks, agricultural supply corporation, cooperatives and the AgriculturalDevelopment Bank of Pakistan. More-affluent farmers often pay cash for ferti-lizer and other reeds. Credit is usually available to middle-income farmers viathe local cooperatives, which may borrow from member farmers of the AgriculturalBank at about 8% and lend to farmers at rates up to 10%. Some cooperatives

ANNEX ^-Page 2
obtain pledges or loans up to PRs 1,000 in the form of mortgages on chattelson future crops. In some cases, free loans may be given for 4 months andinterest charred thereafter. Interviews with several Punjab cooperativeorganizatiors in August 1972 indicated defaults are rare, as their committeesare free to extend a loan in genute hardship cases or demand repayment,according to circumstances.
Thus, subsistence farmers and cultivators in the remoter rural areasseem to have the most-pressing needs for credit facilities to buy fertilizersand othe7- inputs. This has been emphasized by PASC which has promised to bringnot only fertilizer, seeds and other inputs to these communities but also thecredit to purchase them. Some of these loans would be interest-free and securedby future crops. (It should be mentioned that a similar program undertaken bya foreunner of PASC some years ago failed because of major defaults on loans.)
Transportation
Until a few years ago, the majority of fertilizer was carried by railfrom Karachi port or the domestic plants to the railhead towns and from theseto the mandi (market) and village godowns (warehouses) by truck or cart. Morerecent experience of Dawood Hercules (DH) and Multan shows that road transportcan be speedier and cheaper if the distance is under 150 to 200 miles. Astypical distances between Multan and major godowns will be 90 to 100 miles, itis estimated that some two-thirds of the output will go by road and one-thirdby rail. Average road freight charges for DH are PRs 0.17 per ton/mile or PRs 17per ton of fertilizer. Rail transport is expected to cost more, as distanceswill be longer and typical freight rates are anticipated to be about PRs 20 perton.
Multan has a big truck depot where many empty vehicles are readilyavailable and truckers are always anxious to secure additional loads. Thecity is located 35 miles south and 60 miles north of two of the largestmake-up yards in the country, which should help the availability of emptywagons and expedite turnarounds.
Discussions with the Department of Railways in October 1973 indicated noanticipated difficulties in handling either phosphate rock and "seeding" ferti-lizer imports from Karachi to the Multan area, or subsequent bagged fertilizerfrom the plant to the railheads in the mandi towns. Mr. Abdul Qadid, ChiefOperating Superintendent was fully aware of Multan's additional transport needs.He plqns to run a "unit" rock train every other day from Karachi to the plantand will assemble unit loads of fertilizer at the plant that will be made upinto mixed traffic at major junctions for dispatch to the railheads. All keyagricu1tural areas are adequately supplied with railroad freight service andeven towns more than 150 miles from Lahore or Multan are scheduled to get atleas-t one freight train daily. Furthermore, agricultural materials are secondpriority only to military traffic.

ANNEX 3-3Page 3
Assuming 50% of Multan's production or about 1,400 tons per daywere moved by rail, this represents only one, or at the most, two trains perday and as main line traffic does not go through Multan, no bottlenecks areforeseen. As much as 16,000 tons per day of fertilizer and wheat has beenhandled in and out of the Karachi port yards. At Multan, the plant sidings aremanaged and maintained by the Department of Railways, and the costs billed tothe plant. Only minor additions will be needed to accommodate the additionalproduction.
Prices
Maximum retail prices in 1973 were:
Gazetted, August 11/73PRs
Max RetailSales Price PRs
Nitrogen Fertilizer Per Bag Lbs/Bag Per Ton
Urea 46-0-0 55 110 1,100A.mmonium Sulfate 21-0-0 25 112 490Calcium Ammonium Nitrate 26-0-0 25 87.5 630
Straight Phosphate
Triple Super 46-0-0 34 110 680Single Super 0-18-0 15 112 294
Compound Fertilizer
Diammonium Phosphate 18-46-0 57 110 1,190Nitrophosphate 23-23-0 55 110 1,100
Potassium Fertilizer
Sulfate of Potash 0-0-50 32 110 640
The sale price of urea includes a "development surcharge" ofPRs LOO per ton, payable by the producer to the Government, to be usedto subsidize imports that exceed the PRs 1,100 charged. A correspondingsurcharge of PRs 300 per ton for NP has been assumed in this projectappraisal on the basis that ex-factory prices would be similar (46% oftotal nutrients). It can be argued that, as there would be no need toimport for the time being significant amounts of NP once the Multan pro-ject is producing at high capacity, the logic of the surchbrge being usedt.o pay ror phosphate imports would be lost. However, it is likely GOPm;y continue to apply thLi development surcharge to help pay for nitrogenFertilizer imports too, as long, as thoy are brought in at prices higherthan t.ho;e ror dome;stically produced materials.


ANNEX 4-1Page 1
PAKISTAN
MULTAN FERTILIZER EXPANSION PROJECT
PROJECT DESCRIPTION
Facilities
The project consists of the modernization and expansion of theexisting nitrogen fertilizer plant known as the Natural Gas FertilizerFactory (NGFF) in the Province of Punjab at Multan. Major items include:
(a) Design and construction of a 910 metric ton per day(tpd) ammonia plant that will derive feedstock andfuel from natural gas supplied from the Sui gasfields by the Sui Northern Gas Pipeline Co. Ltd.
(b) Design and construction of a nitric acid plant intwo identical streams having a capacity totalling1,200 tpd (100% nitric acid basis).
(c) Design and construction of a nitrophosphate plant of1,020 tpd capacity as prilled NP fertilizer, con-taining 22.5% Nitrogen (N) and 22.5% P205, with pro-vision for adding potassium salts, as required, tomake NPK grades. The products will contain phosphateshaving at least 80% water solubility.
(d) Design and construction of a calcium ammonium nitrateplant to produce 1,500 tpd of calcium ammonium nitrate(CAN) containing 26.5% N. Part will be made byseparating calcium nitrate (CN) from the nitrophosphateand coverting it to ammonium nitrate (CAN) and part bydirectly reacting ammonia and nitric acid. The twosolutions will be mixed together with by-product chalkfrom the CN conversion step and prilled to form a solidCAN product.
(e) Integration of the above new plants with existing urea,ammonium nitrate limestone (ANL) and nitric acid plantsand their utilities.
(f) Construction of offsites and utilities including apower plant to supply all of the above units, to pro-vide maximum reliability and independence from outsidesources, plus lower utility and operating costs.Existing offsites such as housing, storage, maintenance

ANNEX 4-1Page 2
and office buildings, will be used to the optimumextent and integrated with the new facilities.
(g) Provision for the continuing employment of local con-sultants (Chemical Consultants Ltd., Pakistan), whohave made major contributions to the concept, designand detailing of the project as well as to marketingand cost studies.
(h) Provision for employing a team of Technical Advisorsto assist and advise on the construction and subsequentoperation of the expanded plant until average productionof the Project is 90% of rated annual capacity.
(i) Provision for training technical personnel in plantsusing technology similar to those to be employed inthe project.
Proaucts mentioned in (a) and (b) above are product intermediates andwill not normally be sold to others.
Production Flow Chart
Integration of existing and new process units, which are allfed from a new ammonia mother-plant is shown diagrammatically in Annex 4-2.It should be mentioned that some flexibility has been designed into thecomplex by providing a direct-neutralization ammonium nitrate plant slightlylarger than the process material balance requires. This is to ensure' thatwhen the NP or other units are taken off-stream for periodic cleaning orunscheduled stoppages, the ammonia plant need not be upset by reducing itsoutput sigriificantly.
The material balance indicated gives last ammonia priority tothe existing ammonium nitrate-limestone ANL (CAN) unit, which willoperate to the extent of available ammonia. In practice, there may besufficient reserve capacity in the new NP and CAN units to use allavailable ammonia. The existing CAN granulation plant will be retainedfor occasions when the new CAN units are off-stream and also for makinggranulated mixed fertilizers to special formulations.
Industrial Projects DepartmentDecember 1973

ANNEX 4-1Page 3
Future Provisions
Heavy-Water Production
Discussions have been held between NFC and the Pakistan AtomicEnergy Commission (AEC) on extracting heavy hydrogen from the reformedgas at Multan, prior to ammonia synthesis. AEC will pipe the gas to anextraction unit locate outside the Multan fertilizer plant and returnit to the synthesis section after removing the heavy hydrogen. Provisionsfor installing this unit have been made in the early design stages of theproject to avoid interruptions in the amonia plant.
N-P-K Compound Fertilizer Production
As mentioned in Annex 4-1, provision will be made in the newnitrophosphate plant to incorporate potash salts for producing prilledN-P-K grades, when required. Also, as indicated in Annex 4-3, theexisting ANL granulation unit can be -adapted to produce a wide variety ofgranular N-P-K fertilizers, according to specific agronomic needs.
Methanol Manufacture
Possibilities of modifying at least one of the existing ammoniaunits to produce methanol for plastics manufacture and other purposesare to be studied.
By-Product Recovery from Pollution Abatement Units
As mentioned in Annex 4-6, the commercial prospects for reducingnitrogen oxides emitted by the nitric acid plants by caustic washing andselling the resultant sodium nitrite are under review. Also to be investi-gated are possible markets for fluosilicate or fluoride salts produced fromfluorine-containing gases scrubbed from the nitrophosphate plant.
Use of By-Product Chalk for Cement Production
It is planned to stockpile this material as feed for an envisagedcement plant to be built near the 14ultan fertilizer factory.
Additional Fertilizer Production
Ample space exists inside and outside the factory boundary toaccommodate an additional ammonia plant and downstream facilities, ifthese be found justified in the future. In determining final layouts ofthe expanded plant and offsites, these future possibilities will beborne in mind.
Industrial Projects DepartmentJanuary 197h


ANNEX 4-2
PAKISTANMULTAN FERTILIZER EXPANSION PROJECT
PRODUCTION FLOW CHART
ROCK PHOSPHATE698 + 5%
NATURAL GAS FOR TRANSIT LOSS = 733 TPD49.8768 MMSCFT/DAY (21990 TPY)
TPD = METRIC TONS PER DAY 41480 NM3/HR 13395 NM
3/HR 301 NM
3tHR
TPY = METRIC TONS PER YEAR
MM5CFT MILLION CUBIC FEET LNEW STEAMNM /HR = NORMAL CUBIC METERS PER HOUR AMMONIA PROCESS STEAM
PLANT AND POWER ZGENERATION >
a:U0
132 TPD | 2536 TPD 137 8 TPD 339 2 TPD (43560 TPYP (D4886 TPY _ 1 A PY) (1N1L1950 TOY) 4
72,600~~~ ~~ TPY60 AND CA (CLCU AMMNDU NITATE
WITHIN2THE0NEW 0AMMONIA TPL BATTERY
LIMITS2BY,THE6PAKISTAN0ATOMIC ERR NER
Industrial Projects Department COMMISSION WHO WOULD BE RESPONSIBLEJanuary 1974 FOR ITS FINANCING AND OPERATION

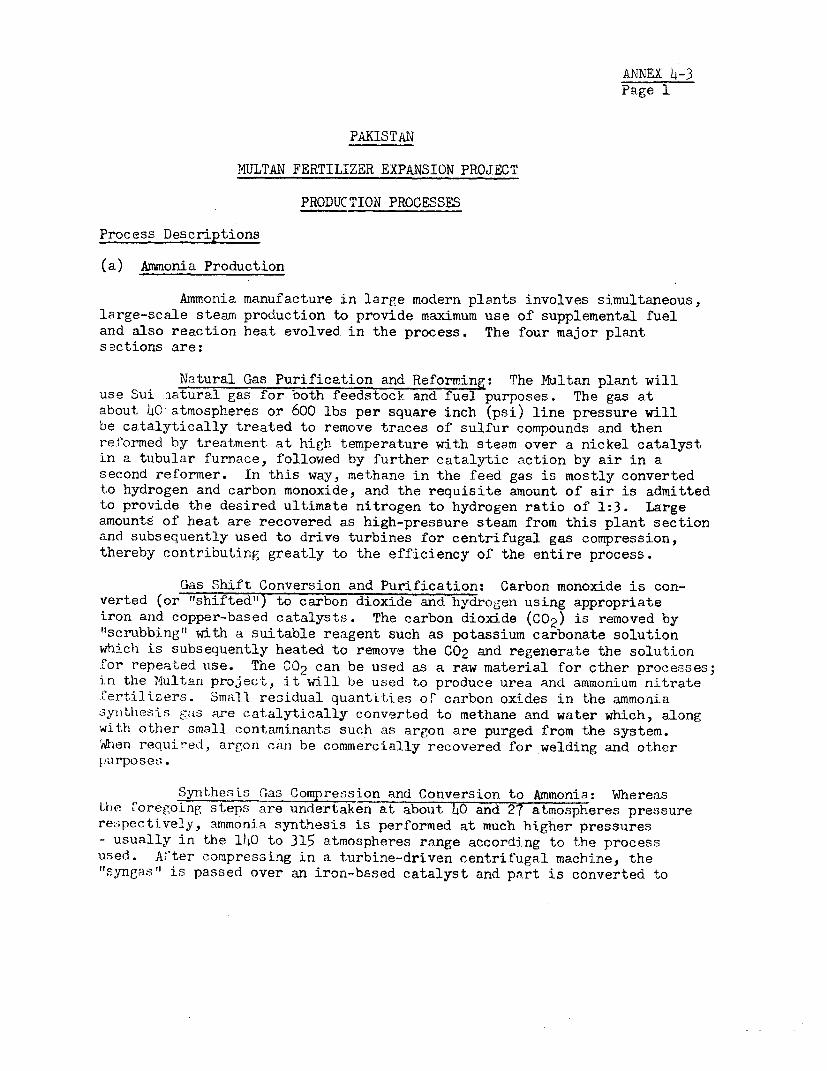
ANNEX 4-3Page 1
PAKISTAN
MULTAN FERTILIZER EXPANSION PROJECT
PRODUCTION PROCESSES
Process Descriptions
(a) Ammonia Production
Anmonia manufacture in large modern plants involves simultaneous,large-scale steam production to provide maximum use of supplemental fueland also reaction heat evolved in the process. The four major plantsections are:
Natural Gas Purification and Reforming: The Multan plant willuse Sui aatural gas for both feedstock and fuel purposes. The gas atabout 40 atmospheres or 600 lbs per square inch (psi) line pressure willbe catalytically treated to remove traces of sulfur compounds and thenreformed by treatment at high temperature with steam over a nickel catalystin a tubular furnace, followed by further catalytic action by air in asecond reformer. In this way, methane in the feed gas is mostly convertedto hydrogen and carbon monoxide, and the requisite amount of air is admittedto provide the desired ultimate nitrogen to hydrogen ratio of 1:3. Largeamounts of heat are recovered as high-pressure steam from this plant sectionand subsequently used to drive turbines for centrifugal gas compression,thereby contributing greatly to the efficiency of the entire process.
Gas Shift Conversion and Purification: Carbon monoxide is con-verted (or "shifted") to carbon dioxide and hydrogen using appropriateiron and copper-based catalysts. The carbon dioxide (C02) is removed by"scrubbing" with a suitable reagent such as potassium carbonate solutionwhich is subsequently heated to remove the C02 and regenerate the solutionC-.Lor repeated use. The 002 can be used as a raw material for other processes;in the l4ultan project, it will be used to produce urea and ammonium nitratefertilizers. Small residual quantitie.s or carbon oxides in the ammoniasynthessis Egas are catalytically converted to methane and water which, alongwith other small contaminants such as argon are purged from the system.Wdhen required, argorn can be commercially recovered for welding and otherpurposes,
Synthesis Gas Compression and Conversion to Ammonia: Whereasthe t'oregoing steps are undertaken at about 40 and 27 atmospheres pressurere:.pectively, ammonia synthesis is performed at much higher pressures- usually in the 1140 to 315 atmospheres range according to the processusedi. After compressing in a turbine-driven centrifugal machine, the"syngas" is passed over an iron-based catalyst and part is converted to

ANNEX h-3Page 2
ammonia (NHT3) which is liquefied by cooling and bled from the synthesisloop as product. Unconverted gas is recycled to the catalytic converterby another conpressor until conversion is complete. The syngas must bebrought to a high temperature (about 5000C) as well as a high pressurebefore being catalytically converted. As the synthesis reaction producesa large amount of heat, the temperature of the syngas can be suitablyraised and the hot, partially converted gas, cooled simultaneously by-passing both gases separately through an appropriate heat exchanger. Insome plants, was-te reaction heat is used to produce additional steam forenergy purposes.
Nitric Acid M4anufacture from Ammonia
Nitric acid production from ammonia takes place in two mainstages - conversion and oxidation-absorption. In the first stage, lique-fied ammonia is vaporized, mixed.with.the correct proportion of cleanedair and converted to nitrous oxides by burning over an assembly of platinum-rhodium alloy screens. The nitrous oxides are converted to nitric oxidesby the appropriate admission of air or oxygen and these gases. absorbed bywater in a tall column to produce a nitric acid solution containing 57 to6o'fOl HN03. The conversion reaction produces much heat, which is used toraise steam for driving a turbine which powers several gas compressorsused in the process. After absorption of most of the nitrogen oxides,proces; gas leaving the column is heated by transferring heat, via asuitable exchanger, from other in-process gas and expanded in a gas turbineto produce additional compressor power.
The turbine exhaust is normally diluted with air to yield astack gas containing 200 to 300 parts per million (ppm) of nitrogen oxides(NOx) before release to atmosphere. In some heavily-populated areas of theworld, waste gases from nitric acid plants are catalytically reduced withmnethane or another fuel to produce low levels of nitrogen oxides (200 to4 00 ppm) of nitrogen oxides plus oxygen. This results in a colorlesseffluient gas and one which is much less likely to contribute to smog byreactiing photosynthetically with hydrocarbons emitted by automobiles andother sources. Recently, a caustic wash treatment process for reducingN0x pollution from nitric acid plants has been developed and installedin Germany. This produces sodium nitrite and nitrate as by-products,which have commercial value. Both the catalytic method and the causticwash method are presently under study by the selected contractor (Uhde)for possible use at Multan.
There are numerous designs of nitrid acid processes available,mostly depending on the operating pressures chosen for the differentsteps. High pressures result in lower capital cost but increased powerneeds and platinum losses. The designer endeavors to optimize these costsaccording to circumstances. The MIultan plant will employ a combination of
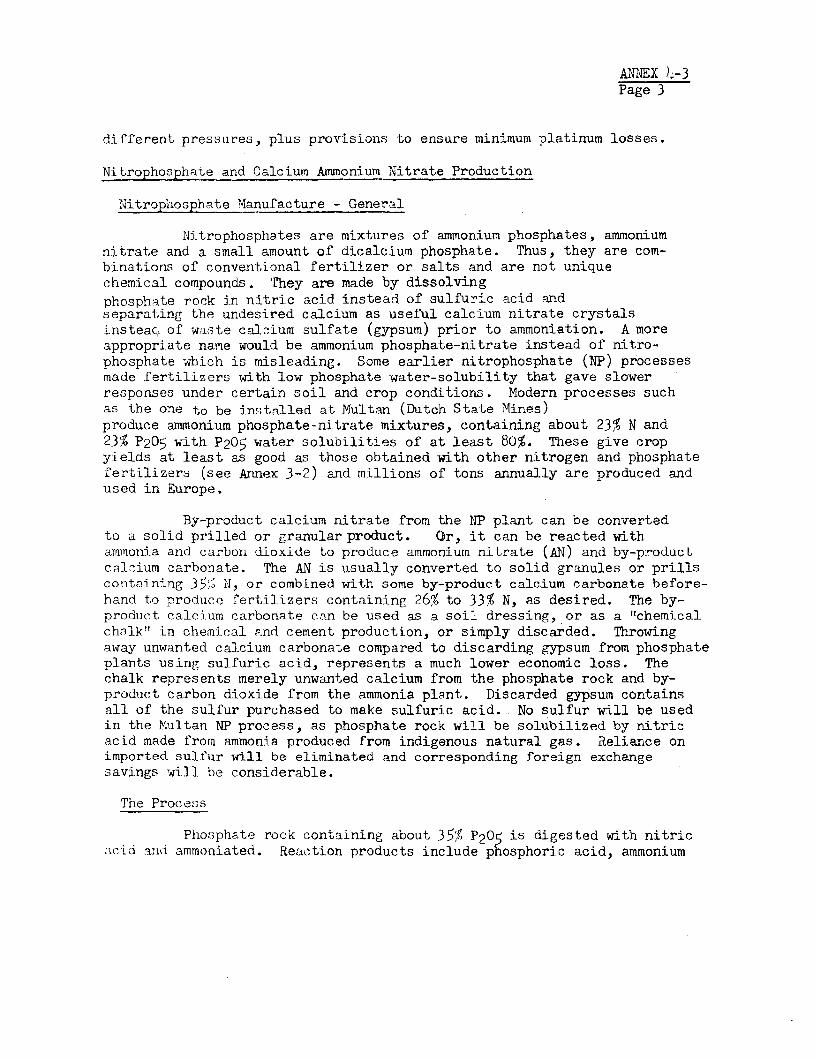
ANNEX L-3Page 3
different pressures, plus provisions to ensure minimum platinum losses.
Nitrophosphate and Calciurm Ammonium Nitrate Production
NitropAosphate Manufacture - General
Nitrophosphates are mixtures of ammonium phosphates, ammoniumnitrate and a small amount of dicalcium phosphate. Thus, they are com-binations of conventional fertilizer or salts and are not uniquechemical compounds. They are made by dissolvingphosphate rock in nitric acid instead of sulifuric acid andseparating the undesired calcium as useful calcium nitrate crystalsinsteac! of waste calc~ium sulfate (gypsum) prior to ammoniation. A moreappropriate name would be ammonium phosphate-nitrate instead of nitro-phosphate which is misleading. Some earlier nitrophosphate (NP) processesmade fertilizers with low phosphate water-solubility that gave slowerresponses under certain soil and crop conditions. Modern processes suchas the one to be instnlled at Multan (Dutch State Mines)produce ammonium phosphate-nitrate mixtures, containing about 23% N and23% P205 with P205 water solubilities of at least 80%. These give cropyields at least as good as those obtained with other nitrogen and phosphateLertilizer; (see Annex 3-2) and millions of tons annually are produced andused in Europe.
By-product calcium nitrate from the NP plant can be convertedto a solid prilled or granular product. Or, it can be reacted withammonia and carbon dioxide to produce ammonium nitrate (AN) and by-productcalTium carbonate. The AN is usually converted to solid granules or prillscorntaining 35;W N, or combined with some by-product calcium carbonate before-hand to produce fertilizers containing 26% to 33% N, as desired. The by-prodtuct calcium carbonate can be used as a soil dressing, or as a "chemicalchalk" in chemical and cement production, or simply discarded. Throwingaway unwanted calcium carbonate compared to discarding gypsum from phosphateplants using sulfuric acid, represents a much lower economic loss. Thechalk represents merely unwanted calcium from the phosphate rock and by-product carbon dioxide from the ammonia plant. Discarded gypsum containsall of the sulfur purchased to make sulfuric acid. No sulfur will be usedin the Multan NP process, as phosphate rock will be solubilized by nitricacid made from ammonia produced from indigenous natural gas. Reliance onimported sulfur will be eliminated and corresponding foreign exchangesavings will be considerable.
The Process
Phosplhate rock containing about 35% P20 is digested with nitricac',id and ammoniated. Reaction products include phosphoric acid, ammonium
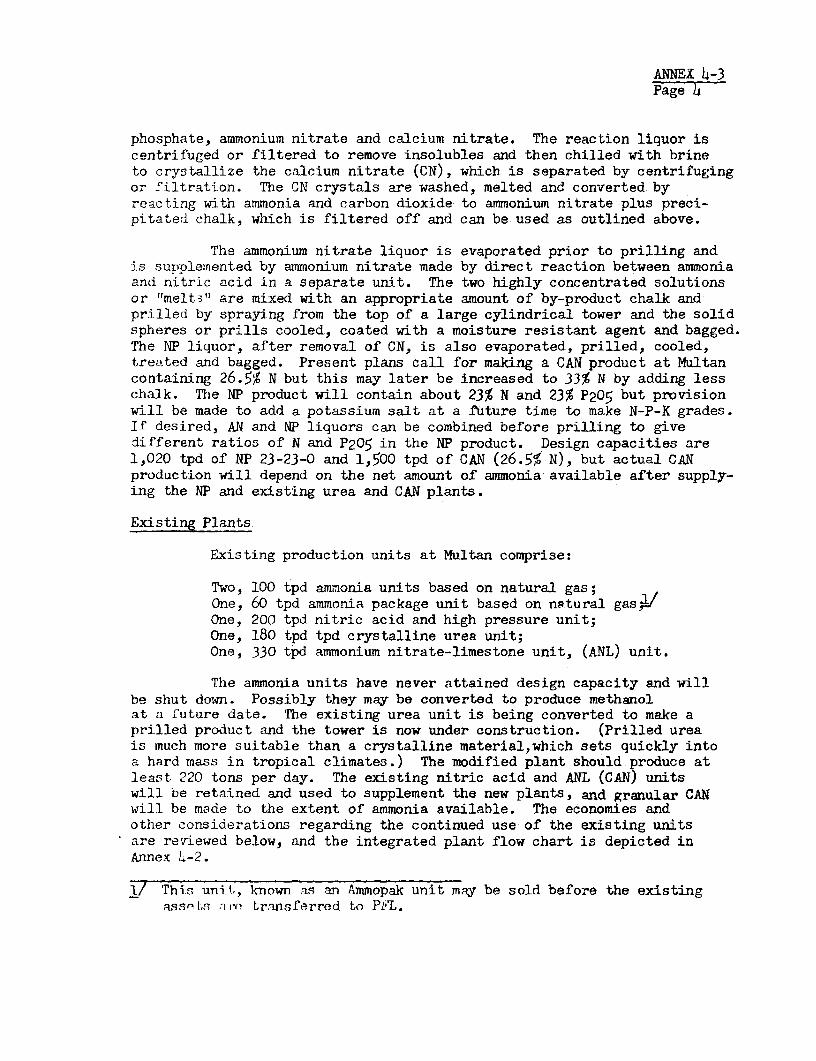
ANNEX 4-3Page 4
phosphate, ammonium nitrate and calcium nitrate. The reaction liquor iscentrifuged or filtered to remove insolubles and then chilled with brineto crystallize the calcium nitrate (CN), which is separated by centrifugingor filtration. The CN crystals are washed, melted and converted byreacting with ammonia and carbon dioxide to anmmonium nitrate plus preci-pitated chalk, which is filtered off and can be used as outlined above.
The ammonium nitrate liquor is evaporated prior to prilling andis supplemented by ammonium nitrate made by direct reaction between ammoniaand nitric acid in a separate unit. The two highly concentrated solutionsor rrmelt,3n are mixed with an appropriate amount of by-product chalk andprilled by spraying from the top of a large cylindrical tower and the solidspheres or prills cooled, coated with a moisture resistant agent and bagged.The TNP liquor, after removal of CN, is also evaporated, prilled, cooled,treated and bagged. Present plans call for making a CAN product at Multancontaining 26.5% N but this may later be increased to 33% N by adding lesschalk. The NP product will contain about 23% N and 23% P205 but provisionwill be made to add a potassium salt at a future time to make N-P-K grades.If desired, AN and NP liquors can be combined before prilling to givedifferent ratios of N and P205 in the NP product. Design capacities are1,020 tpd of NP 23-23-0 and 1,500 tpd of CAN (26.5% N), but actual CANproduction will depend on the net amount of ammonia available after supply-ing the NP and existing urea and CAN plants.
Existing Plants
Existing production units at Multan comprise:
Two, 100 tpd ammonia units based on natural gas;One, 60 tpd ammonia package unit based on natural gasW/One, 200 tpd nitric acid and high pressure unit;One, 180 tpd tpd crystalline urea unit;One, 330 tpd ammonium nitrate-limestone unit, (ANL) unit.
The ammonia units have never attained design capacity and willbe shut down. Possibly they may be converted to produce methanolat a future date. The existing urea unit is being converted to make aprilled product and the tower is now under construction. (Prilled ureais much more suitable than a crystalline material,which sets quickly intoa hard mass in tropical climates.) The modified plant should produce atleast 220 tons per day. The existing nitric acid and ANL (CAN) unitswill be retained and used to supplement the new plants, and granular CANwill be made to the extent of ammonia available. The economies andother considerations regarding the continued use of the existing unitsare reviewed below, and the integrated plant flow chart is depicted inAnnex )4-2.
I/ This unitJ, known as an Ammopak unit may be sold before the existingassot.s -n transferred to PFL.

ANNEX 4-3Page 5
Economic and Other Considerations Regarding the Continued Use of ExistingUrea, lNitric Acid and CAN Units
Urea Plant
This is an Inventa (Swiss) plant of the recycle type and wasdesigned to produce 180 metric tpd of crystalline urea. It has beencritically inspected by specialist contractors such as Humphreys andGlasgow,and Stamicarbon, who both have pronounced it to be in good operatingcondition, with many more years of additional life. They have recommendedseveral modifications, plus the addition of a prilling tower, to enable itto produce up to 220 tpd of prilled product, when sufficient ammonia isavailable from the new ammonia plant. These alterations and the construc-tion of a suitable tower are now being undertaken in conjunctionwith Stamicarbon engineers.
The plant is virtually fully depreciated and theloan on it has been repaid. Under these conditions (but including depre-ciation on the new equipment), the following estimated comparison on abattery-limits basis with a large new stripping plant and using Multanutility costs, is of interest.
PRs per Ton Palled UreaModified Old Plant' Stripping Plant'
220 tpd 1,000 tpd1/
Raw Materials 203.0 203.0Utilities 37.5 29.5Labor and Supervision, Administration 10.1 2.4Iaintenance 35.8 25.4Depreciation 4.0 42.3Interest on Loan 0.0 25.5Contingencies and Miscellaneous 8.7 7.9Bags and Bagging 85.0 85.0
Total Cost Rs/Ton 384.1 421.0
Cost Ratio G.91:1
1/ Ammonia transferred at Rs 350 ($35), based on Multan ammonia bid evalua-tions, August 1973. This is about half the estimated cost of ammoniaproduced in existing units a-t Multan.
2/ Typical recycle process requirements.3/ DSM-Stamicarbon data.T7/ Dawood-Hercules estimate for 1974.

ANNEX 4-3Page 6
It is of interest to note that the reported current cost forbagged urea mTde in the Dawood-Hercules plant in Pakistan is aboutPRs h13/ton.L
The above comparison indicates it is expedient to re-;ain andoperate the existing urea plant after suitable modification, as the extracosts per ton due to slightly less-efficient operation and smaller size,are more than offset by the high depreciation and interest costs incurredby a large new plant. Furthermore, the product will find a ready sale,as prilled urea is popular.
Nitric Acid Plant
The existing 200 tpd unit was designed and supplied by C & I Inc.of the USA, and is reported to be virtually trouble-free and good for manymore years of service. It is aliTmost fully depreciated and theloan has been repaid. Since it will use the same ammonia,utilities and other services as the two 600 tpd units planned for theexpansion project, it is very probable that comparative production costswill be of the same order as those calculated for a small, depreciatedurea unit and a large new one. Recent evaluations indicate a probablebattery-limits cost of PRs 186 per ton nitric acid (100%) for 600 tpdunits using ammonia at PRs 350 per ton and corresponding nitric acid costfrom the existing units about PRs 180 per ton.
Further considerations in wishing to retain the existing unitinstead of scrapping it and installing two new 700 tpd units (instead oftwo 600 tpd ones) were transportation problems and also the limitedexperience of contractors in building such large plants overseas.
ANL Plant
The present plant was supplied by the French ENSA group andhas proved reliable. It was designed to produce 330 tpd of granularproduct, but has shown it can easily do 15% more. The likelihood isthat a small depreciated plant of this nature, can produce for about thesame or slightly lower cost than a large new one (about US$38 per ton)using the same raw materials, utilities and other services. Furthermore,it is a rule of thumb in the fertilizer industry that granulation usuallycosts at least US$1 less per ton of product than prilling for outputsup to about 750 tpd. Also, granulation plants are more flexible and forthis reason, it is wished to retain the unit for probable future produc-tion of granular mixed fertilizers based on urea, NP and other materials.
1/ This operates between 100% and 110% of design capacity.

ANNEX 4-3Page 7
In addition, it will be a useful back-up unit when the main CAN plants arestopped for maintenance and cleaning.
There is the additional probability that sufficient reservecapacity will exist in the new CAN direct ammoniation and calcium nitrateconversion units to absorb all surplus ammonia and nitric acid remainingfrom nitrophosphate production. Under these circumstances, any doubtsregarding higher costs in making the granular product would not arise.In fact, projections indicate in 1976/77 (the first on-stream year), ifpriority is given to other products, no ammonia will be available to makeany granular CAN.
Utilities and Offsites
Main additional utilities required for the new process plants are:
Electrical Generators - Two, 10 MW (Steam) setsSteam Boilers - Three, 60 tph unitsCooling Towers - Two, with a total capacity of
30,000 cubic meters per hourBoiler Feedwater Installation - Two, 125 tph unitsInstrument and Plant Air - Two, 100 normal cubic meter setsWater Decarbonation Unit - One, 1,100 cubic meter per hour
No process or patent fees are required to be paid for purchase and use ofthese utility units.
These new utilities will be integrated with existing utilitiesand offsites to the optimum extent which include cooling towers, productand material storage buildings, offices, maintenance shops, laboratory,garage, railroad track, sewers, roads, boundary fences and gatehouses,plus a nearby housing colony for 600 families. Two existing gas-firedboilers each of 25 tph capacity will be placed on standby.
Industrial Projects DepartmentDec:ember 1973

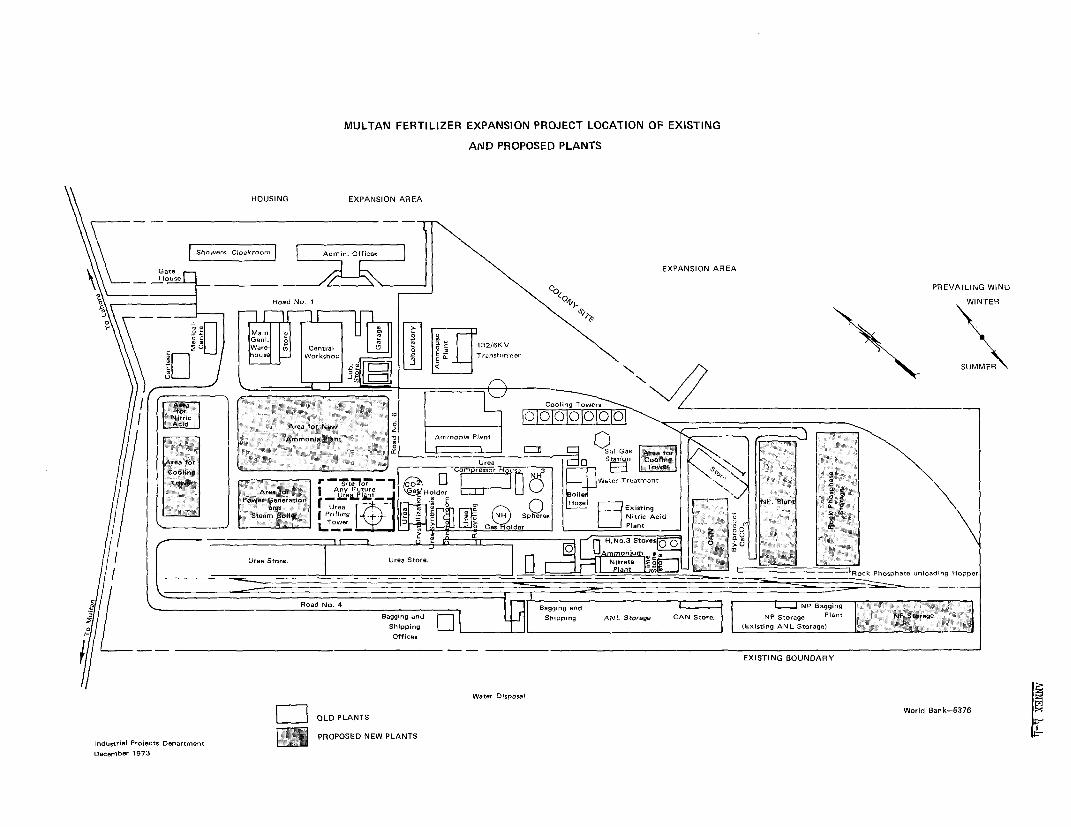
MULTAN FERTILIZER EXPANSION PROJECT LOCATION OF EXISTING
ArqD PROPOSED PLANTS
HOUSING EXPANSION AREA
EXPANSION AREA
PREVAILING WIND
top\ R..d No. 1 \ t WINTER
re- 0 [nr 132I6KVhousO Workshop E Transfor-er
//j L ~~~~~~~~~~~~~~~~~~~~~~~~~~~~EXISTING BOUNDARY
Water OloponelWorld Eank-8376
L .i OLD PLANTSm PROPOSED NEW PLANTSIndustrial Projects DeportmentOeoen,bC 1973


ANNE X aL-E
PAKISTANMULTAN FERTILIZER EXPANSION PROJECT
RAW MATERIALIS
Natural Gas
RIeserves: The Multan plant currently has a contract with SuiNorthern Gas Pipelines Ltd. (SNGPL) to supply 12.5 million standardcubic feet (M2scft) of gas per day from their system. In addition, theplant now purchases about 18,000 to 20,000 kw per hour from a nearbypower station, for which 5.7 M2scft of corresponding gas are requireddaily. Thus, present direct and indirect gas needs for Multan amount to18.2 M2scft per day. Feedstock and fuel needs for the expanded projectoperating at 100% capacity will be 50 M2scft/day, including all energyrequirements, which will be generated within the plant. Additionalgas needs, including 10% contingency will therefore be about 35 M2scft perday whirh, during the next 15 years, are equivalent to about 0.18 trillionsoft (M4scft). Latest estimates of Sui reserves are 8.9 (M4scft) out ofwhich 4.9 M4scft are already dommitted. Therefore, the expanded Projectwill make a demand of 0.18 M4scft on uncommitted reserves of 4 AM'scft,i.e. only about 4.5Y,which can be met easily.
Transmission: The existing SNGPL line capacity between Suiand Multan must be enlarged by installing short loops totalling 28 milesto meet Multan's expanded needs. SNGPL has developed a two-phase planknown as Project 4 to provide additional gas to Multan and other customers.Phase A covers Multan's extra needs up to 38 M2scft/day is scheduled tobe ready by June 1976. This would give a total system capacity of 3L41M?t2scft/day. Phase B is scheduled to be ready by December 1976 andwouLd increase system capacity to 393 M2scft/day, to meet anticipatedgrowth in demand up to 1978. Phase A would cost about $6.7 million in foreignexchange plus US$4.1 million equivalent local currency; about US$6.1 millionwould be for a 18-inch pipe and installation, and US$h.7 million for a100 M2cft/day purification unit if needed.
Completion of Phase A by early 1976 is believed realistic, provideda turnkey contract for the design, supply and installation of Phase A can beawarded in mid-1974. SNGPL does not anticipate a Bank loan for Phase A butwill do so for Phase B.

ANNEX 4-Page 2
AsSurances have been obtained from GOP and SNGPL that the required additionalgas for the Multan expansion will be availableon an uninterruptablebasis by the end of June 1976, and according to requisite pressureand purity specifications. (Gas delivered to the plant should notcontlain more than 35 parts per million of sulfur and it sometimescontains as little as 10 ppm).
Price: Future prices of gas delivered to the plant will varyaccording to consumption rate and cost increases are projected to be:
Consumption
Plant Operation as % of Total Capacity 100% 90% 75%Gas Consumption as % of Maximum 100% 92.5% 77.5%Gas Consumption as M2scft/day 49.9 46.1 41.4
Tariffs
Current Flat Rate - Rs per 1,000 scft 1.40 1.40 1.40Increase to Cover Expansiorin 0.50 0.50 0.50Tax 0.40 0.40 0.407ixed Rate 0.89 0.908 1.084
Total Price in Rs/100 scft 3.14 3.28 3.384
*This is subject to further review in light of the IBRD Loan Agreement covenants.
Phosphate Rock
About 220,000 tons of phosphate rock will be needed to meet Multan'sreauirements at 100% of capacity. Investigations show favorable contracts can bemade with Jordan which has suDnolied annuallv about 35,000 tons of rock to the twosingle-superDhosphate plants in Pakistan over many years. This rock contains anaverage of 34.35% P205 and less than 0.1% chlorides, as required for the nitro-phosphate plant. The rock would be shipped to Karachi and after bulk unloadingsent via rail to Multan in "unit trains," and discussions with the Department oRailways have indicated no problems should arise in moving this relativelysmall amount of additional material. Recently, phosphate rock depositshave been found in the Hazara District of the North West Frontier Province,but it is not yet known if the quality and quantity are adequate forMultan's needs. Therefore, it will be assumed that all phosphate rock willbe imported. The future estimated landed and delivered prices are:
Item US $ per Ton of Rock
C & F Cost,, Karachi 40.00Tmport Licence .40Bank Charges .20Port Charges 2.00Inland Rail Freight 3.40
Total Cost US$ 46.oo

ANNEX 4-5Page 3
Ancillary Tlaterials
Coating Agents: Major ancillary materials are Kieselguhr andamine solution for coating NP and CAM products to retard moisture absorption,and these are expected to be imported. At capacity operation, 8,670 tonsof Kieselguhr and 265 tons of amine will be needed. Their costs are:
US$ per Ton US$ Der kgItem Kieselmnhr Amne
Ce&F Karachi 120.00 1.00ITpnort Licence 1.20 0.51Bank and Port Charges o.60 0.02Inland Rail Freight 4.30 0.01
Total Cost US$ 126.10 1.5
Chem.icals and Catalysts
Ammonia and Nitric Acid: The ammonia plant will require theperiodic importation of iron-based and other catalysts. The nitric acidplant will need to have its platinum-rhodium catalyst screens and guardsrestored by the refiners. This is normally undertaken on a service-contract basis, with adjustments for fluctuations in world precious metalprices. Estimates of chemical and catalyst costs are:
Anmmonia Plant Nitric Acid PlatinumCatalysts Chemicals New Plant Old Plant
C& F Karachi 1.02 0.09 1.02 1.60Import Licence 0.52 0.05 0.26 0.40Bank and Port Charges 0.02 0.01 O.o6 0.10Inland Rail Freight 0.01 0.01
Totals:
US$ per Ton Ammonia 1.57 0.16 - -US Q Der Ton Nitric Acid - 1.34 2.10
h;ater Treatment Chemicals
These are principally acids, alkalies and chlorine obtained fromdomestic plants. These costs have been included in cost of productionwhere applicnblc.
B3aggingt
As reviewed at the end of Annex 3-2, it is anticipated packagingwill be underta4ken in cotton bags lined with polyethylene and a switch towoven polypropylene bags may be made later, if justified economicallyand financially. However, these polymers, as well as cotton, are becoming

ANNEX 4-5Page 4
increasingly scarce on the world market, and the Bank has obtained assurancesfrom GOP that regular and adequate supplies of' suitable bags to Multanwill be given highest priority, and that detailed plans to meet theseneeds will be forwarded to the Bank well before project start-up.
Industrial Projects DepartmentDecember 27, 1973

ANNEX 4-6Page 1
PAKISTAN
MULTAN FERTILIZER EXPANSION PROJECT
ENVIRONMENTAL PROTECTION AND SAFETY
There are presently no gaseous, liquid or solid effluent standardsestablished for the Province of Punjab. Therefore, typical acceptablelevels in developed countries will be used as a basis for pollution control.
New Ammonia Plant
Gaseous effluents from this plant vented to atmosphere are fluegases (water vapor and carbon dioxide (C02)) from the refor*ier furnacesand waste C02 from the syngas carbon dioxide stripper unit. These areharmless. Liquid effluents will be boiler blow-down and process conden-sate; the latter will be used as process and cooling water make-up. Nouse of toxic heavy-metal compounds in gas scrubbing, process cooling oreffluent water treatment is planned.
New Nitric Acid Plant
The contractor (Uhde) has made provisions for the nitrogenoxides concentration (NOx) in the stack gas to be below 200 parts per million(ppm), by use of efficient absorbers and final dilution with air. Thepossibility of installing a caustic wash and selling the resulting sodiumnitrite to others is under study. The 200 ppm NOx level is the acceptablelevel for plants in built-up areas of most developed countries and shouldtherefore be quite suitable for Multan.
New NP and CAN Plants
Gaseous effluents will be mostly water vapor from the prilltowers, possibly containing very small amounts of fertilizer dust. Itis planned to minimize the latter for economic reasons by installingexit-air baffles and filters. (Any small amount of dust escaping fromthe towers would benefit local farmers in the form of free, non-burningfertilizer.) Phosphate rock used in the NP section will contain 3% to4% fluorine and about 25% of this will pass to the vapor lines of thereaction and evaporation sections. These gaseous effluents will bewashed with water in highly efficient scrubbers before release toatmosphere, to remove gaseous fluorides. Scrubber liquors will betreated with lime to fix fluorides as insoluble calcium fluoride beforebeing pumped to settling ponds, and accumulated solids will be periodicallydug out and dumped in local ravines, along with small amounts of sand

ANNEX 4-6Page 2
separated from the reaction system. The effluent system will be monitoredand controlled by chemical analysis. Possibilities of recovering fluorineas sodium fluoride for sale to others, as well as recovery of rare earthsin the phosphate rock are to be studied. Surplus calcium carbonate willbe stockpiled for envisaged cement production in an adjacent plant.
New Utility Plants
Effluents from these plants will be mainly cooling-tower bleedand backwash from the water-treatment units. The cooling tower effluentwill contain no toxic components and will considerably dilute other wastestreams. Acid and alkali wastes from the water-treatment units will beused to neutralize each other to the extent possible and any excessacidity will be removed by limestone treatment before discharge to theeffluent pond. Evaporation will keep pond levels to a minimum and greatlyreduce or even eliminate overflow to a nearby canal. The final pond over-flow, as well as inflows, will be routinely monitored by chemical analysisto ensure effluent treatments are adequate.
Existing Plant Units
Gaseous effluents are mostly water vapor and carbon dioxide fromthe boilers, ammonia units and downstream production units. Gas-purificationeffluents from the existing ammonia plants will be eliminated, as these unitswill be shut down. The nitric acid unit produces a colored tail gas, andthis will be reduced to about 200 ppm, NOx content by improved absorptionand increased dilution (and perhaps caustic washing if a market for sodiumnitrite can be found). Dust from the new urea prill tower will be minimizedby filters for economic reasons and simultaneously reduced to acceptablelimits. Dust from the ammonium nitrate-limestone unit will be considerablyreduced as the use of by-product "chemical" chalk will eliminate the needto grind limestone.
General
All solids-conveying equipment and bagging machinery will beunder suction and these sytems will be provided with filters, for botheconomic and dust-prevention reasons.
The Multan Expansion Project has therefore been designed tomeet pollution levels acceptable in typical developed countries.

ANNEX 4-6Page 3
Safety and Precautions
The new plants will be designed with full recognition of operatorsafety and also environmental protection against spills and other hazards.These measures, as well as fire protection and first-aid facilities willbe of the same standards as are used in developed countries and will beextended to existing plant units, if found necessary.
Industrial Projects DepartmentDecember 1973


PAKISTANCONSOLIDATED SCHEDULE
MULTAN FERTILIZER EXPANSION PROJECT
YEARS *- -1973 1974 1975 1976
MONTHS 1 2 -10 -8 -6 -4 -2 0 2 4 6 8 10 12 14 16 18 20 22 24 26 28 30 32 34 36
PREQUALIFICATION OF PROCESSENGINEERING CONTRACTORS
APPOINTMENT OF CONSULTANTS/TECHNICAL ADVISORS
TENDER ENQUIRY VETTEDBY CONSULTANTS/WPIDC
ISSUE OF TENDERS TOCONTRACTORS
RECEIPT OF BIDS TECHNICAL ANDCOMMERCIAL
EVALUATION OF BIDS BY WPIDC/CONSULTANTS
NEGOTIATION AND AWARD OFCONTRACTS
PROCESS ENGINEERING
DETAILED ENGINEERING
PROCUREMENT (ENQUIRY ISSUESTO GOODS AT SITE)
SITE PREPARATION AND CIVILWORK
ERECTION OF EQUIPMENT . .
PRECOMMISSIONING
START UP/GUARANTEE TESTS
AWARD OF CONTRACT MONTHS MECHANICAL COMPLETION START UP
GUARANTEE TESTS LIndustrial Projects Department World Bank-8377 |2January 1974

I

ANNEX 5-1Page 1
PAKISTAN
MULTAN FERTILIZER EXPANSION PROJECT
SUMWMRY CAPITAL COST ESTIMATE
PRs (millions) US$ Ecuivalent (Millions)Local Foreign Local Foreign
CurrencY Exchan&Q Total Currency Exchange Total
1. Engineering Fees
Design and Know Hbw 67 67 - 6.8 6.8Procurement - 15 15 - 1.5 1.5Erection & Coordination 65 19 84 6.5 1,9 8.4Civil Works 40 40 Jj.0 4-
Sub-Total iW 1O 26 10.21/ 20.7
?. Equipment and Spares, C&F
Ammonia Plant - 190 190 - 19.2 19.2Nitric Acid & NP/CAN Plants _ 173 173 - 17.4 17.4Utilities - Offsites 75 75 - 7.6 7.6Spares 2
Sub-Total for Line 2 7 77 -
3. Local Goods and Services 17 - 17 1.7 - 1.7
4, Furniture, Fixtures and Vehicles 2 - .2 0.2 - 0.2
5. Trainingz, Start-up and Consultancy 11 12 23 1.1 1.2 2.3
6. Sub-Total, Lines 1-5 134 589 723 13.7 59.5 73.0
7. Contingencies
Physical 5 59 64 0.5 6.o 6.5Price 5 48 53 5.1 4.8 _
Sub-Total for Line 7 10 1. ___0.
8, Tnta, _4 824 70.3 8I4.8
9. Working Capital 70 18 88 . 1.8 9
10, Total Project Cost 214 7114 928 21.6 22.1 93.7
11. Interest Dahring Construction 19 60 79 2.0 6.o 8.0
12. Total Financing Required 233 774 1,007 23.6 78.1 101.7
13. Purchase of Existing Assets -47 _ 4.7 - 4.7
14. Total Capitalization 280 7 28.1 106.4
1/ Foreign engineering fees by:US$ (Millions)
Ammonia plant 4.2Nitric Acid and NP/CAN 4.6Utilities 1.0Coordination 0.4
10.2
Industrial Projects DepartmentApril 1974

ANNEX 5-1Page 2
PAKISTAN
MULTAN FERTILIZER EXPANSION PROJECT
DETAILED CAPITAL COST ESTIMATES(in millions,of PRs unless otherwise specified)
Foreign Exchange GrandItem Local AD_ IBRD Equity Total Total
1. Land .8 - - - - .82. Civil Engineering 40.0 - - - 40.03. Plant and Machinery
(a) Engineerins & Know-How (Fixed)-'Ammonia and Utilities - - 19.8 21.4 67.2 67.2Nitric Acid - NP/CAN - 26.0 - ) )_
(b) Equipment - 26.0 19.8 21.4 67.2 67.2
Ammonia and Utilities - - 243.1 21.6 264.7 264.7Nitric Acid - NP/CAN - 173.0 - - 173.0 173.0
- 173.0 243.1 21.6 437.7 437.7(c) Procurement Fee (Fixed) 16
Ammonia and Utilities - - ) 8.8 )14.8 ) 14.8Nitric Acid and NP/CAN 6.0 - ) )
- 6.0 - 8.8 14.8 14.8
4. Spare Catalyst & Parts - 12.0 27.3 - 39.2 39.2
5. laport License & Clearance - 1% of3(b)+3(c) 4.9 _ - - - 4.9
6. Other Charges - 2.2% of 3(b)+4 10.8 - - - - 10.8
7. Erection(a) Foreign (fixed)-'
Ammonia and Offsites - - 9,2 _ 9.2 9.2Nitric Acid and NP - __- -92 9.2
- 9.2 9.2 _ 18.4 18.4(b) Local Management Assistance 65.3 - - 65.3
Sub-total for 7 65.3 9.2 9,2 - 18.4 83.7
8. Training 1.2 - - 1.0 1.0 2.2
9. Start-up/Pre-production 8.2 - - 3.7 3.7 11.9
10. Furniture, Vehicles, & Fixtures 2.0 - - - - 2.0
11. Preliminary Expenses .9 - - .1 .1 1.0
12. Consultancy Fees(a) Local .9 - - .2 .2 1.1(b) Technical Advisor.!/ _ 6.7 _ 6.7 6.7
13. Sub-total 135.0 226.2 306.1 56.8 589.1 724.1
14. Contingency 9.4 41.1 40,4 25.6 107.1 116.5
15. 13 plus 14 144.4 267.3 346.5 82.4 696.2 840.6
16. Interest During Construction 20,o2/ - - 60.1 60.1 80.1
17. Total New Fixed Assets (15+16) 164.4 267.3 346.5 142.5 756.3 920.7
18. Transfer of Existing Fixed Assets: 46.7 - - 46.7Total Assets 211.1 267.3 346.5 142.5 756.3 967.4
19. Working Capital 69.7 - 17.3 17.3 87.0Grand Total 280.8 267.3 346.5 159.8 773.6 1.054.4
20. Translation into US Dollarat US$1 = PRs 9.9 28.3 27.0 35.0 16.1 78.1 106.4
Debt 6.4 27.0 35.0 - 62.0 68.4Equity 21.9 16.1 16.1 38.0
28.3 27.0 35.0 16.1 78.1 106.4
1/ Fixed fees for engineering services are in pounds sterling (Kellogg), deutsch marks (Uhde) and guilders(Stamicarbon) converted to rupees at Al = PRs 23.00; DM1 = PRs 3.70, and GLD1 = PRs 3.628. Equipment
estimates for the ammoonia plant were calculated by Kellogg in pounds sterling and for the nitric andNP/CAN plants by Uhde in deutsch marks, both in February 1974.
2/ Guarantee fee on IBRD loan and difference between ADB interest to Government and 97. charged to PFL.
Industrial Projects DepartmentApril 1974

ANNEX 5-1Page 3
The figures in this estimate are based on review of the Kellogg andUJhde cost estimates prepared in February 1974 and discussed in London at around table meeting in March 1974. Rupee costs were revised in Pakistan inMarch 197h.
For the purposes of this table: (a) the ADB is to finance all itemsrelated to the nitric acid and NP/CAN plants (except the down payment for thefirst 20% for engineering and know-how); (b) the IBRD is to finance all itemsrelated to the ammonia plant and offsite utilities (except the down payment forthe first 20% for engineering and know-how); and (c) the equity paid in by NFCand ADNOC is to finance, with foreign exchange, the first 20% for engineeringand know-how of all items.
All costs that are not specifically labelled "fixed" are indicativeestimates as of March 1974.
Industrial Projects DepartmentApril 1974

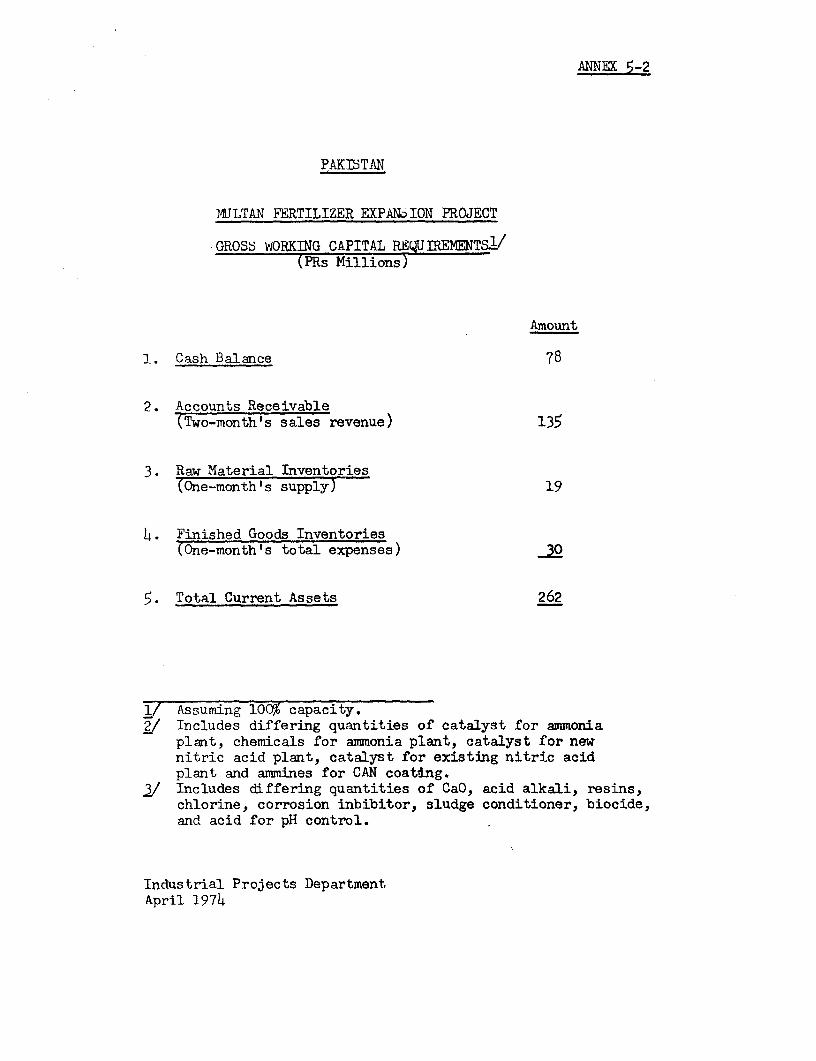
ANNEX 5-2
PAKISTAN
MULTAN FERTILIZER EXPANoION PROJECT
GROSS WORKING CAPITAL REQU IREMENTS.1/(PRs Millions)
Amount
1. Cash Balance 78
2. Accounts Receivable(Two-month's sales revenue) 135
3. Raw Material Inventories(One-month's supply) 19
4. Finished Goods Inventories(One-month's total expenses) 30
5. Total Current Assets 262
1/ Assuming 100% capacity.2/ Includes differing quantities of catalyst for ammonia
plant, chemicals for ammonia plant, catalyst for newnitric acid plant, catalyst for existing nitric acidplant and anmines for CAN coatilng.
_/ Includes differing quantities of CaO, acid alkali, resins,chlorine, corrosion inbibitor, sludge conditioner, biocide,and acid for pH control.
Industrial Projects DepartmentApril 1974


ANIP ,: K
FAKL3 TAN
MULTAN FERTILIZER EXPANSION PROJECT
ESTIMATED DISBURSrMNT OF BANK LOAN(Millions of US Dollars)
CalendarQuarter Disbursements Cumulative
197t4 - III 2 2IV 1 3
1975 - I 3 6II 4 10
III 5 15TV 6 21
1976 - I 4 25II 3 28
III 3 31IV 2 33
1977 - I 1 34TI 1 35
Industrial Projects DepartmentMarch 1974

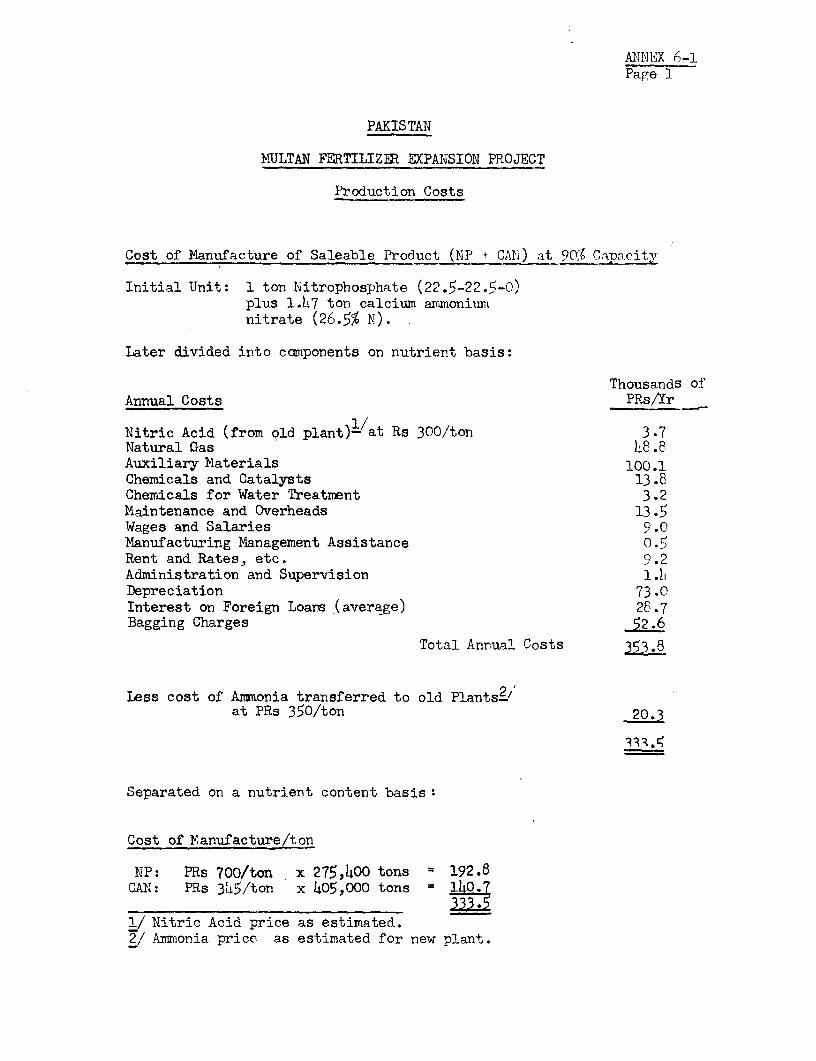
AINl'EX 6-1Page 1
PAKISTAN
MULTAN FERTILIZER EXPANSION PROJECT
Production Costs
Cost of Manufacture of Saleable Product (NP + CAlI) at 90% 7ap1citr
Initial Unit: 1 ton Nitrophosphate (22.5-22.5-0)plus 1.h7 ton calciun ammoniurinitrate (26.5% N).
Later divided into components on nutrient basis:
Thousands ofAnnual Costs PRs/Yr
Nitric Acid (from old plant)-/at Rs 300/ton 3.7Natural Gas ih8 .8Auxiliary Materials 100.1Chemicals and Catalysts 13.8Chemicals for Water Treatment 3.2Maintenance and Overheads 13.5Wages and Salaries 9.0Manufacturing Management Assistance 0.5Rent and Rates, etc. 9.2Administration and Supervision 1.1lDepreciation 73.0Interest on Foreign Loans (average) 28.7Bagging Charges 52.6
Total Annual Costs 353.8
Less cost of' Ammonia transferred to old Plantsi/at PRs 350/ton 20.3
Separated on a nutrient content basis:
Cost of Yanufacture/ton
NP: PRs 700/ton x 275,400 tons = 192.8CAN: PRs 345/ton x 405,000 tons = 10.7
1/ Nitric Acid price as estimated.2/ imnonia price as estimated for new plant.

ANNEX 6-1Page 2
ASSUMPTIONS FOR OPERATING COSTS
A. Consumption Cost of Natural Gas
1. Consumption of Natural Gas
(a) At 100% capacit,
Ammonia Plant - 41,480 Nm /hrCAN plant 301Boiler House * 13.995 "
55,776
_ 55,776 x 37.26 x 24 Scft/dayday
- 49.8768 MM Scft/day.
(b) At other capacitX operation
Year of Operation: 1st 2nd 3rd & onward
- Plant capacity averaged 75% 907. 100%- Gas Consumption 77.5% 92% 100%= Daily Gas Demand 0.775x49.88 0.925x49.88 lx49.88- MMScft/day 38.66 46.136 49.88- MM/Cft/year 1,2757 15,225 16,459
(330 days/year)
2. Price of Gas
(a) At 100% of contracted demand
- Gas Price before recent increase PRs./MScft
Flat Rate _ 1.30Fixed Rate 0.46Excise Duty _ 0.40Total 2.16Ptice Increase 0.98Total New Price at 100% ofcontracted demand 3.14

ANNtEX 6-1Page 3
(b) Price Break-up at 100% of contracteddemand (after increase)
PRs.
Flat Rate 1.40Fixed Rate 0.84Tax - 0.40
(c) Prices of different consumption rates
PRs./MScft
Rate of Consumption 77.5% 92.5% 100%
Flat Rate 1.9 1.9 1.9Tax = 0.400 0.400 0.400Fixed Rate 1.084 .908 .840Total 3.384 3.208 3.140
3. Annual Bill for Natural Gas
Demand MMcft 12,757 15,225 16,459Annual Bill (PRs.'000) 43,170 48,841 51,681

ANNEX 6-1Page 4
B. Consump,tion & Cost of Auxiliary Materials
1. Unit Cost of Raw Materials & Auxiliary Materials
The following are the cost components of laudedrrice o' various raw materials and auxiliary materials.
$/Ton PRsitonBank &
C & F Import Port InlandUnit Karachi Licence Charges Freight Total PRs/ton
Rock Phosphate tons ho.oo .40 .20 3.25 46.oo 455.402.00
Kieselguhr forcoating of NP!CAN tons 120,00 1.20 0.60 4.300 127r90=1266.849
2. Annual Demand of Materials at 100% CapacityOperation
Rock Phosphate 220,000 m tonsKieselguhr 8,672 "
3. Annual Cost of Raw Materials & Auxiliar Materials
(PRs. 1000)
Capacity 75% 90% 100%
Cost of material:Rock Phosphate(PRs. '000) 75,141 90,169 100,188Kieselguhr 8,240 9,887 lo,986
83,38± loo.o56 ULM
(1) Includes 5% loss in port, transit, unloading, etc.

ANNEX 6-1Page
C. Consumption & Cost of Chemicals and Catalysts
1. Cost of Chemicals & Catalyst for Process Plants ($)
Clear- InlandUnit Karachi Licence ance Wreight Total
Catalyst for $/ton 1.02 0.52 0.02 0.01 1.57Ammonia Plant NH3
Chemicals " 0.094 0.048 0.002 0.010 0.145
Ammonia forcoating ofNP/CAN kg 1.00 0.51 0.02 0.01 1.54
Platinum kg 6,400 1,600 / 400 1 8,400
2. Requirements and Cost of Chemicals & Catalystsat 100% Operation
tons/year cost/ton cost/year
Catalyst for AmmoniaPlant 300,300 1.57 4712471
Chemicals for AmmoniaPlant 300,300 0.145 43,544Catalyst for New NitricAcid Plant 396,000 1.344 532,224Catalyst for existingNitric Acid Plant 43,329 2.100 90,991Amines for CAN coating 265,364kg/yr 1.54 408,661
Total $ 1,546,981100% capacity PRs.15,323,50290% capacity PRs.13,791,15175% capacity PRs.11,492,626

ANNEX 6-1Page 6
D. Quantity and Cost of Chemicals for Water Treatment
1. Basis of Cost
(a) Analysis of tubewell water as given in thetender enquiry.
(b) Decarbonation with lime of 1100 m 3/hr of water
(c) Demineralization of 210 m3/hr of decarbonatedwater.
2. Chemicals Required at 100lQ capacity
Unit/yr PRs./Unit PRs./yr
CaO 1,012 tons 50 151,800Acid 1,064 " 900 957,600Alkali 413.28 " 2,500 1,033,200Resins - - 300,000Chlorine 150,000 lb. 0.3 45;000Corrosine Inhibitor 66,000 " 2.5 165,000Sludge Conditioner 66,000 ' 3.5 231,000Biocide - - 20,000Acid for pH control - - 619,000
Total 3,523,120
At 100% capacity PRs. 3,523,120/year90% capacity PRs. 3,170,808/year75% capacity PRs. 2 ,642,340/year

ANNEX 6-1Page 7
E. Cost of Maintenance Materials and Spares
Basis: 2.5% of the hardware
Hardware Price Price
Indicative PRs.'000
Main Plants 343,530 Equipment13,506 Procurement
Utilities 75,940 Equipment2,061 Procurement
105.140 Contingency
540-3177,
Cost of Materials/year 540,177 x 2.5100
- PRs13S04,000
Expenditure is independent of the plant capacity operation.
F. Wages and Salaries
The annual cost of PRs. 8,960,000 per year isassumed. This figure is based on a compound wage hikeof 5% per annum and then averaged over 10 years.
G. Manufacturing & Management Assistance
It is estimated that eight ngineers will be requiredin the first year, six in the second year and two in the thirdyear.
The expenditure estimated for this account is
PRs. 2,750,000 in the 1st yearPRs. 1,650,000 in the 2nd yearPRs. 550,000 in the 3rd year
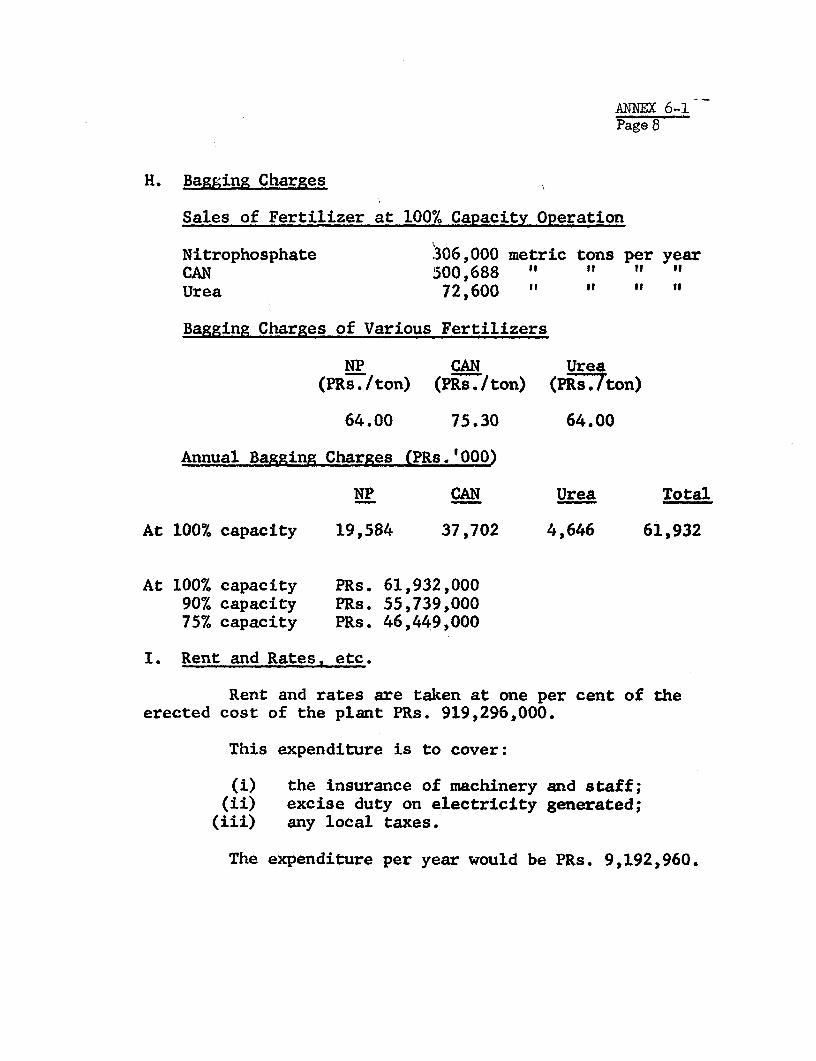
ANNEX 6-1Page 8
H. Bagging Charges
Sales of Fertilizer at 100% CaPacity Operation
Nitrophosphate 306,000 metric tons per yearCAN 500,688 " It I
Urea 72,600 " " " "
Bagging Charges of Various Fertilizers
NP CAN Urea(PRs. Iton) (PRs./ton) (PRston)
64.00 75.30 64.00
Annual Bagging Charges (PRs.'000)
NP CAN Urea Total
At 100% capacity 19,584 37,702 4,646 61,932
At 100% capacity PRs. 61,932,00090% capacity PRs. 55,739,00075% capacity PRs. 46,449,000
I. Rent and Rates. etc.
Rent and rates are taken at one per cent of theerected cost of the plant PRs. 919,296,000.
This expenditure is to cover:
(i) the insurance of machinery and staff;(ii) excise duty on electricity generated;(iii) any local taxes.
The expenditure per year would be PRs. 9,192,960.
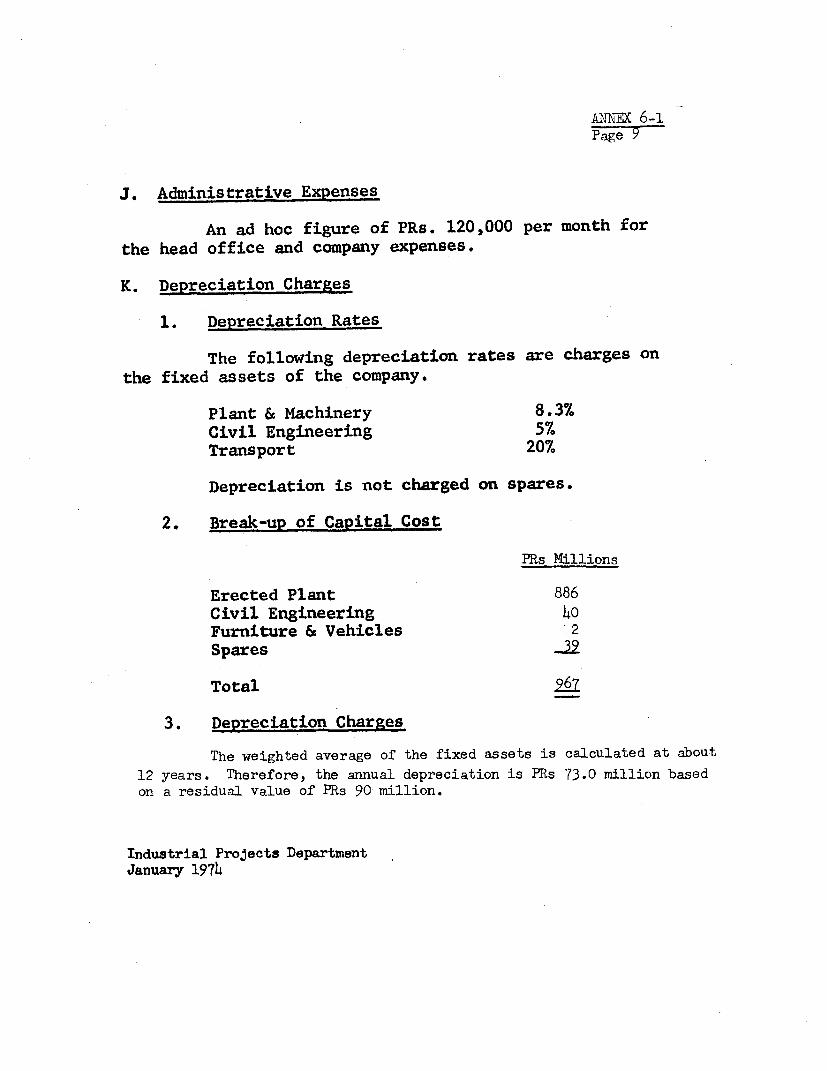
ANNEX 6-1Page 9
J. Administrative Expenses
An ad hoc figure of PRs. 120,000 per month forthe head office and company expenses.
K. Depreciation Charges
1. Depreciation Rates
The following depreciation rates are charges onthe fixed assets of the company.
Plant & Machinery 8.3%Civil Engineering 5%Transport 20%
Depreciation is not charged on spares.
2. Break-up of Capital Cost
PRs Millions
Erected Plant 886Civil Engineering 40Furniture & Vehicles 2Spares 39
Total 26
3. Depreciation Charges
The weighted average of the fixed assets is calculated at about
12 years. Therefore, the annual depreciation is PRs 73.0 million basedon a residual value of PRs 90 million.
Industrial Projects DepartmentJanuary 1974


ANNEX 6-2Page 1
PAKISTAN
MULTAN FERTILIZER EXPANSION PROJECT
FORECAST INCOME STATEMENT(PRs millions)
Calendar Year 1977 1988 1979 1 198Year of Operation 1 2 3 4 5Capacity 75% 90% 90% 90% 90%
Revenue 468 562 575 585 590
Operating Expanses.Natural Gas 43 49 49 49 49Auxiliary Materiqis 53 64 64 64 64Added Rock Cost," 28 36 36 36 36Chemicals/Catalysts 12 14 14 14 14Chemicals/Wkter Treatment 3 3 3 3 3Maintenance and Overhead 14 14 14 14 14Wages and Salaries 9 9 9 9 9Bagging Charge 46 56 56 56 56Depreciation 73 7 7
Sub-total 21 31 318 1
Administrative and Selling ExpensesManufacturing Assistance 6 2 1 - -Selling Costs 9 9 9 9 9Administrative Supervision 1 1 1 1 1
Sub-total 16 12 11 10 10
Operating Profit 171 234 246 257 262
Non-Operating ExpensesInterest on IBRD Loan 32 32 30 27 25Interest on ADB Loan 25 25 23 21 19Interest on Local Loan 10 12 12 12 11
Sub-total 67 69 65 -Z 55
Gross Profit Before Tax 104 165 191 197 207
Taxes (60.5%) 62 99 115 119 126
Workers' Participation Fund2 2 4 4 4 4
Net Profit 40 62 72 74 77
Net Profit as % of Equityat Beginning of Year 11% 15% 15% 15% 15%
1/ To bring, to U$40 per ton, cif Karachi..g/ 5% of profit after taxes.

ANNEX 6-2Page 2
PAKISTAN
MULTAN FERTILIZER EXPANSION PROJECT
ASSUMPTIONS FOR REVENUE CALCULATIONS
1. Annual Sales of Fertilizer at 100% Capacity Operation
Nitrophosphate a 306,000 tons per yearCalcium Ammonium Nitrate a 500,688 "Urea a 72,600
2. Current Sale Prices of Various Fertilizers
Nitro-phosphate CAN Urea(PRs./ton) (PRs./ton)(PRs.7/ton)
Farmer Price with1,100.00 645.00 1,100.00
Less:Development Charge 300.00(1) 98.00 (2) 400.00(2)Marketing Expenses 60.00 36.00 60.00
Net received by Factory 740.00(3) 511.00(3) 640.00(3)
3. Annual Sale Proceeds (PRs.'000)PriceA
NP CAN Urea Total Increase
At 100% capacity 226,440 + 255,852 + 46,464 - 528,756 95,°0090% capacity : 475,880 86,ooo75% capacity a 396,657 71,000
(1) Assumed;at present there is no NP production inPakistan and thus no development charge
(2) Presently paid by NFC Multan(3) In 50 kg. bags.(4) In 38.76 kg. (85.5 lb.) bags.(5) Application of rate of return of at least 15% on equity as
specified in Guarantee Agreement (Section 2.05b ). Total revenuealso includes interest earned on surplus funds.

ANNEX 6-2Page 3
PA]B TAN
MJLTAN FERTILIZER EXPANSION PROJECT
FORECAST SOURCES AND APPLICATION OF FUNDS(PRs millions)
Calendar Year 1977 1978 1979 198 1981Year of Operation 1 2 3 IF 5
Source of Funds
Net income before Tax and Interest 171 2314 246 257 262Depreciation 73 73 73 73 73Increase in Accounts Payable 94 12 -20)
Total Sources 338 319 299 330 335
Application of Funds
Increase in Receivables andInventories 129
Interest on Local Loan 10 12 12 12 11Tnterest on Foreign Loans I 57 57 52 49 44Repayment on Loans 1 43 45 49 52Tax or Income 62 99 115 119 126Worker's Participation Fund 2 4 14 4 4Payment on Dividends (151) - 56 56 56
Total Applications 360 :215 284 289 293
Annual Cash Surplus 78 104 15 41 42
Accuw?ryalated Cash 128 232 247 288 330
Long-Term DebL Service Coverage(times) 2.5 3.8 1.9 1.9 1.9

ANNEX 6-2Page 4
PAKISTAN
MULTAN FERTILIZER EXPANSION PROJECT
FORECAST BALANCE SHEET STATEMENT(PRs millions)
December 31 1976 1977 1978 1979 1 1981Year of Operation Start-Up 1 2 3 5Capacity - 75% 90% 90% 90% 90%
ASSETS
Current AssetsCishl_/ 50 70 70 70 70 70Receivables2/ - 122 122 122 122 122Inventories:
-Raw MaterialY 20 17 17 17 17 17-Finished Goods4/ 17 27 27 27 27 27
Total Current Assets 87 236 236 236 236 236
Surplus Cash - 58 162 177 218 260
Fixed AssetsGross Fixed Assets 967 967 967 967 967 967Less: Accumulated Depreciation - 73 146 219 292 365
Net Fixed Assets 967 894 821 748 675 602
Total Assets 1.054 1,188 1,219 1,161 1.129 1,098
LI4BILITIaS AND EQUITY
Current LiabilitiesLocal Loan Due - 4 4 4 4 4IBRD Loan Due - 22 23 25 27 29ADB Loan Due - 17 18 19 21 22Accounts Payable and Other 20 114 126 97 96 95
Total Current Liabilities 20 157 171 145 148 150
Long-Term LoansLocal 44 40 36 32 27 24IBRD 347 325 302 277 250 221ADM 267 250 232 213 192 170
Total Long-Term Loans 658 615 570 522 k69 415
Equitybhare Capital
ADNOC 110 110 110 110 110 110NFC 266 266 266 266 266 266
Total Share Capital 376 376 376 376 376 376
Retained Earnings - 40 102 118 136 157
Total Equity 376 2416 478 494 _. 512 533
Total Liabilitiesand Equity 1.054 1.18 1,219 1,161 1.129 1,098
Current Ratio 4.3 1.5 1.4 1.6 1.6 1.6Long-Term Debt/Aquity Ratio 64:36 50:40 54:46 52:48 48:52 44:56
1/ Equivalent to two months' total expenses._/ Equivalent to two months' sales revenues at farmer's prices.2/ Equivalent to one month's supply of phosphate rock, kieselguhr, chemicals/catalyst,
chemicals/water treatment and bags.E/ 3quivalent to one month's total expenses. Initial finished goods from existing operations.
i/ Long-term loans assumed for permanent working capital, not part of project financing plan.
Industrial Projects DepartmentApril 1974

PAKISIAN
MULTAN FERTILIZER EXPANSION PROJECT
FINANCIAL RATE OF RETURN: COST AND BENEFIT STREAMS-/
Cost I Cost 2 Cost 3 Cost 4 Cost 5 Cost 6 Cost 7Calendar Operating Capital Other Variable Fixed Capital
Year Year Cost2/ Gas Rock!3/ Operating Costs4/ Costs5/ Improvements?! Taxes7/
1974 - 3 150 - - - - _1975 - 2 525 - -
1976 - 1 300 - - - -
1977 1 - 43.2 75.1 71.5 19.6 13.5 34.51978 2 - 48.8 90.2 84.6 19.6 13.5 64.11979 3 - 48.8 90.2 83.2 19.6 13.5 66.91980 4 - 48.8 90.2 82.6 19.6 13.5 69.71981 5 - 48.8 90.2 82.6 19.6 13.5 72.31982 6 - 48.8 90.2 82.6 19.6 13.5 75.11983 7 - 48.8 90.2 82.6 19.6 13.5 78.11984 8 - 48.8 90.2 82.6 19.6 13.5 81.31915 9 - 48.8 90.2 82.6 13.5 13.5 84.71988) 10 - 48.8 90.2 82.6 19.6 13.5 88.4198. 11 - 48.8 90.2 82.6 19.6 13.5 92.31988 12 - 48.8 90.2 82.6 19.6 13.5 95.5
975
Calendar Operating Benefit 1 Benefit 2Year Year Sales Rerapn/
1974 - 3 _ _1975 - 2 - -
1976 - 1 - -1977 1 468 -1978 2 562 -
9l79 3 562 -1980 4 562 -1981 5 562 -1982 6 562 -1983 7 562 -1984 8 562 -1985 9 562 -1986 10 562 -1987 11 562 -1988 12 562 164
1/ Derived from the income statement unless otherwise specified.2/ Consisting of the cost of the enitre project including the depreciated valuc of existing assets less interest
during construction; see cost stream 6 for capital improvements.i Consisting of the sum of Auxiliary Materials plus Added Rock Cost in the Income Statement minus the cost of kieselguthur.
4/ Consisting of the cost of kieselguhr, Chemicals/Catalysts, Chemicals/Water Treatment, Manufacturing Assistance andBagging Charge in the Income Statement.
5/ Consisting of Wages an- Selart's, Sel'in- Cests, snJ Ad..iinlstrctie Supervisi- lin the lscou.e SLat.menL.6/ Consisting of Maintenance and Overhead in the Income Statement.7/ Consisting of Taxes plus Workers' Participation Fund in the Income Statenment.8! Including 10°/. of fixed assets (PRs 97 million) and initial working capital of PRs 67 million. -3
Financial Rat. of Return ,(base case): 171 T
Industrial Projects DepartmentApril 1974

ANNEX 6-3Page 2
FINANCIAL RATE OF RETURN AND SENSITIVITY TEST
(On After-Tax Basis Unless Otherwise Specified)
Base Cases:
- After Tax 17.75%- Before Tax 23.15%
20% Cost Overrun 1X.15%
One-year Delay in Construction 15.95%
One-year Delay in Constructionand 20% Cost Overrun L.85%
20% Decrease in Sales Revenue 6.45%
20% Increase in Sales Revenue 26.45%
50% Increase in Gas Cost 15.55%
100% Increase in Gas Cost 13.25%
20% Increase in Rock Cost 16.15%
Industrial Projects DepartmentApril, 1974

PAKISTAN
MULTAN FERTILIZER EXPANSION PROJECT
RATE OF RETURN ON EQUITY: COST AND BENEFIT STREAMS COMBINED
Cost 1 Cost 2 Cost 3 Cost 4 Cost 5 Cost 6 Cost 7 Cost 8 Cost 9Calendar Operating Investment Other Variable Capital
Year Year of Equity Gas Rock Operating Costs Costs Improvements Taxes Repay Loan' Interest
1974 - 3 86 - -1975 - 2 1271976 - 1 163 - - - - - - -
1977 1 - 43.2 75.1 71.5 19.6 13.5 34.5 - 671978 2 - 48.8 90.2 84.6 19.6 13.5 64.1 43 651979 3 - 48.8 90.2 83.2 19.6 13.5 66.9 45 611980 4 - 48.8 90.2 82.6 19.6 13.5 69.7 49 571981 5 - 48.8 90.2 82.6 19.6 13.5 72.3 52 511982 6 - 48.8 90.2 82.6 19.6 13.5 75.1 58 461983 7 - 48.8 90.2 82.6 19.6 13.5 78.1 61 401984 8 - 48.8 90.2 82.6 19.6 13.5 81.3 64 331985 9 - 48.8 90.2 82.6 19.6 13.5 84.7 67 271986 10 - 48.8 90.2 82.6 19.6 13.5 88.4 70 221987 11 - 48.8 90.2 82.6 19.6 13.5 92.3 73 131988 12 - 48.8 90.2 82.6 19.6 13.5 95.5 76 6
376 658
Calendar Operating Benefit 1 Benefit 2Year Year Sales Scrap
1974 - 3 _ _1975 - 2 - -1976 - 1 - -1977 1 468 -1978 2 562 -1979 3 562 -1980 4 562 -1981 5 562 -1982 6 562 -1983 7 562 -1984 8 562 -1985 9 562 -1986 10 562 - Rate of Return 27%1987 11 562 -1988 12 562 164 e >
Industrial Projects DepartmentApril 1974

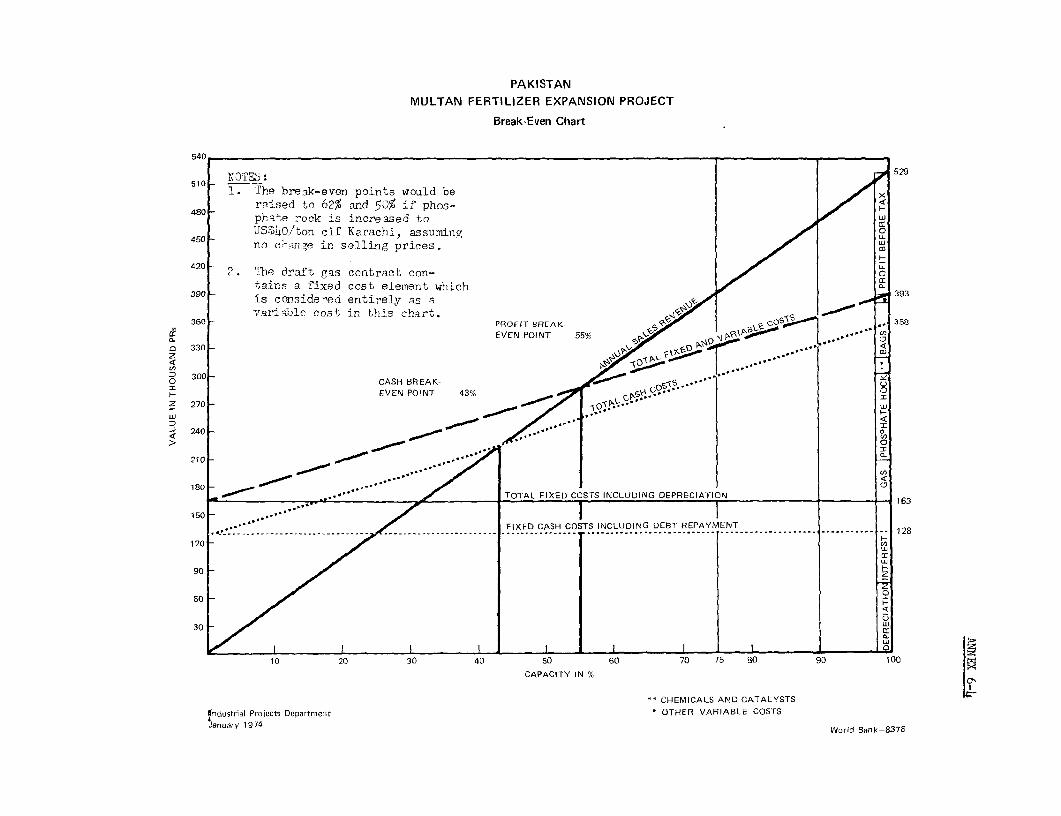
PAKISTANMULTAN FERTILIZER EXPANSION PROJECT
Break-Even Chart
540
NOTF.S: ~~~~~~~~~~~~~~~~~~~~~~~~~~~~~~~~~529510 -1. The break-even points vould be x
rgised to 62% and 50% if phos-phate rock is increased to u
Us$4O,'ton cif Karachi, assuming ono cKinge in selling prices.
420 ~ 2. The draft gas contract con- o
tains a fixed cost element which 9339o - is considered entirely ns a
variable cost in this chart. PROI s360 - PROFIT BREAK- t co 5. 358
c EVEN POINT 55% '.
o330 -
300 - CASH BREAK-I-
Z 270 ~~~~~~~~~EVEN PO'hlT 43°/, Ft*(- Z270 -L
240-
210-_ 2 . I0-o
TOTAL FIXED COSTS INCLUOING DEPRECIATION 163
150- I I 6
FIXED CASH COSTS INCLUDING DEET REPAYIENT
60 _ / Z
30
_ _ _ _ _ _ _ _ __I_ _ _ _ _ _ ___ I IIiII .I.I
10 20 30 40 50 60 70 75 s0 90 100
CAPACITY IN %
CHEMICALS AND CATALYSTS
Industrial Projects Department OTHEH VARIABLE COSTSJanuary 1974 World Bank-8378

I

ANNEX 7-1
Page 1
PAKISTAN
MULTAN FERTILIZER EXPANSION PROJECT
ECONOMIC RATE OF RETURN: COST AND BENEFIT STREAMS1'
Cost 1 Cost 2 Cost 3 Cost 4 Cost 5 Cost 6
Calendar Operating Capita Other Variable Fixed Capital 6/
Year Year Cost2
Gas- Rock-l Operating Costs4/ Costs' Improvements-
1974 - 3 150 - -
1975 - 2 525 - - _ _
1976 - 1 300 - - - - -
1977 1 - 166 75.1 71.5 19.6 13.5
1978 2 - 202 90.2 84.6 19. 6 13.5
1979 3 - 202 90.2 83.2 19.6 13.5
1980 4 - 202 90.2 82.6 19.6 13.5
1981 5 - 202 90.2 82.6 19.6 13.5
1982 6 - 202 90.2 82.6 19.6 13.5
1983 7 - 202 90.2 82.6 19.6 13.5
1984 8 - 202 90.2 82.6 19.6 13.5
1985 9 - 202 90.2 82.6 19.6 13.5
1986 10 - 202 90.2 82.6 19.6 13.5
1987 11 - 202 90.2 82.6 19.6 13.5
1988 12 - 202 90.2 82.6 19.6 13.5
975
Calendar Operating Benef72 1 Benefit 2 Benefit 3 Benefit 4
Year Year NP- ANL/CANZ/ Urea.7/ Scrap!8/
1974 -3 - _ _
1975 -2 - _ _
1976 - 1 - - - -
1977 1 315 334 78 -
1978 2 382 402 94 -
1979 3 382 402 94 -
1980 4 382 402 94 -
1981 5 382 402 94 -
1982 6 382 402 94 -
1983 7 382 402 94 -
1984 8 382 402 94 -
1985 9 382 402 94 -
1986 10 382 402 94 -
1987 11 382 402 94 -
1988 12 382 402 94 164
1/ Derived from the Income Statement unless otherwise specified.
2/ Consisting of the cost for the entire project including the purchasing price of existing assets less interest
during construction; see cost stream 6 for capital improvements.
3/ Consisting of the sum of Auxiliary Material plus Added Rock Cost in the Income Statement minus the cost of
kieselguhr.4/ Consisting of the cost of kieselguhr, Chemicals/Catalyst, Chemicals/Water Treatment, Manufacturing Assistance,
and Bagging Charge in the Income Statement.
5/ Consisting of Wages and Salaries, Selling Costs, and Administrative Supervision in the Income Statement.
6/ Consisting of Maintenance and Overhead in Income Statement.
7/ Price per ton of NP, ANL/CAN, and Trea derived as follows:
NP ANL/CAN Urea
Price per ton, bulk cif Karachi(based on US$283 per nutrient ton
of N and US$259/ton per P205) 125 73 130
Freight:
To warehouse from port: 10 10 10
To warehouse from PFL: (3) _ (3) _ (3)_
Net Freight: 7 7 7
Bags 8 8 8
Economic ex-factory price per ton: 140 88 145
Price per ton in rupees 1,386 893 1,435
Annual value (PRs millions)
757. Capacity 315 334 78
907% capacity 387 402 94
8/ Including 107. of fixed assets and initial working capital.
9/ Economic price of US$1.40/MCF = PRs 13.86/MCF.
Economic Rate of Return (base case): 34%
Industrial Projects Department
April 1974

ANNEX 7-1Page 2
ECONOMIC RATE OF RETURN AND SENSITIVITY TEST
Base Case 3h.o5%
20% Cost Overrun 29.1l5%
One-year Delay in Construction 29.75%
One-year Delay in Constructionand 20% Cost Overrun 25.65%
20% Decrease in Sales Revenue 22.25%
20$ Increase in Sales Revenue 43.95%
10% Increase in Gas Cost 32.85%
2C% Increase in Rock Cost 33.o5%

ANNEX 7-1Page 3
The opportunity cost of natural gas and its effect on the economicreturn of the project presents a special case in view of rapidly changingpetroleum (including natural gas) supply conditions and prices. Ihe price ofnatural gas, delivered and suitable for fertilizer feedstock, can range fromabout US$0.30-0.50/MCF (US$10-17/ton fuel oil) for surplus gas currently beingflared (as in the Persian Gulf); to about US$0.50-1.00/MCF (US$17-35/ton fueloil) as feed to an export liquified natural gas (LNG) or urea plant; toUS$1.40-2.00/MCF (US$54-70/ton fuel oil) as a substitute for domestically con-sumed petroleum for fuel purposes. The above range of gas prices compares toUS$0.32/MCF used in the financial return. The opportunity cost of natural gasvaries considerably more than that of liquid petroleum since the conversioncost of gas to other useful products (such as LNG or urea) and its transporta-tion costs (by pipeline or as LNG) vary over a much wider range than that ofoil. As a result, the opportunity cost of gas (or gas products) for export isusually much lower than for domestic consumption. Therefore, for this project,since the products are for domestic use and the natural gas, at least in part,displTces domestic liquid fuel consumption, an equivalent heating value of fueloil and gas has been used in determining the opportunity cost of gas. Theeconomic return is based on a gas price of US$1.40/MCF (equivalent to US$54/tonheavy fuel oil or about US$7-8 per barrel. If petroleum prices in world tradecontinue at a relatively high level of US$6-12/barrel (US$42-84/ton), equivalentto a natural gas price of about US$1-2/MCF, then the economic price of fertilizerproducts must increase also. At the higher price levels for gas, alternativefuels such as coal and lignite on a world-wide basis, are likely to becomeeconomic feedstocks for nitrogen fertilizers. Numbers in parenthesis are equi-valent prices for heavy fuel oil based on heating value, and are included forinformation only, not to impute a corresponding opportunity cost of oil.
Industrial Projects DepartmentMarch 197h


ANNIX 7-2
PAKISTAN
MULTAN FERTILIZER EXPANSION PROJECT
ANNUAL FOREIGN EXCHANGE SAVINGS-'/(PRs millions)
PRs MillionsCost of Goods Sold Foreign
Natural Gas Pi71ine Facilities - Depreciation 5-5Phosphate RockK 80.4Kieselguhr 9.3Chemicals (Catalyst) 9.5Chemicals (Water Tretment) o.6Maintenance, Procurement rid Spares 13.0Manufacturing Assistance 0o.4Deprecintion 58.o10% Return on Foreign Exchange Componentminus Working Capital 75.0
Total 251.7
US$ MillionsGross Foreign Exchgpge Value ofFertilizer Sales- 75
Estimated Foreign Exchange Content ofProduction Costs as above 25
Net Foreign Exchange Savings o
1/ Assuming 90% capacity.2/ US$h0/ton cif Karachi.3/ Total amount for manufacturing assistance averaged over 12 years.)j/ Assuming these prices bulk, cif Karachi: Urea, US$130/ton; NP, US$125/ton
and CAN, US$73/ton.
Industrial Projects DepartmentApril 1974

I

IBRD 108186 2- h7 °7 - FEB R U A R Y 19 74
62- 1'~~~~~66' 70. 74'
U. S. S.R. HNPA KI STAN ( . J__-\HINA
PRESENT -' JAMMUI S A PRESENT AND PROPOSED FERTILIZER PLANTS
AND 364KASHMI
FERTILIZER PLANTS A , -
NITROGEN: PHOSPHATES:
* * Completed ........ ..
Li 16)~ Under Construi-tionarnAb ab"* 0 Proposed A- * 'elianto
+ Natural Gas Fields N R L DNatural Gas PipelinesCropland
Roads ri----- Railwaysan
Divisionol Boundaries D.32- 2'
Provincial Boundaries argo- - International Boundaries ARG
06)' / J& r iiW/
XG>uetro~~~~ ~ ~~~~~~ Vr/ 4 ( i3'-f
z~~~~~~~~~~~~~~~~~~ UR E T TA A AdM
t-- l-/J \A N g----t.Cz <ar
fl , DI / |~~~~~~~~~~IDI
-28' a >< KAL$T ,f ha $oohMcchi 28'-
I~~~~~~~~~~~~~~~~~~~q R A 0 20 3 D:)- O^^rR 400|
6 X t X 2 6 6 ° M 1 E E 5 300
H YDERAB~YDEiAAD 74
Kaw 7 R oin s.tt7
-24- 4 gP *(vYs.--~~~~~~~~~~~~~~~~~~~~~L-2J -- S -r^ ;
-24-~~~~ -24'-r X'
,~~~~ ~~~ ~ z Q, Cf H 4I N DIAurAll
. -\ ARebtet >, r^, "~~~~L~V'bW -
62- 66- mkmm4at i E 0-~W . i )LANKA,+


![State Bank Pakistan - Multan [Report]](https://static.fdocuments.us/doc/165x107/5466940db4af9f2f738b462e/state-bank-pakistan-multan-report.jpg)