Report No. 2490-IND Public Disclosure ... - The World...
160
Report No. 2490-IND Indonesia Cottage and Small Industry in the National Economy FILE COPY (In Two Volumes) Volume 11: Annexes and Statistical Tables November 9, 1979 Projects Department East Asia and Pacific Regional Office FOR OFFICIAL USE ONL'Y Document of the World Bank This document has a restricted distribution and may be used by recipients only in the performance of their official duties. Its contents may not otherwise be disclosed without World E,ank authorization. Public Disclosure Authorized Public Disclosure Authorized Public Disclosure Authorized Public Disclosure Authorized
Transcript of Report No. 2490-IND Public Disclosure ... - The World...

Report No. 2490-IND
Indonesia Cottage and Small Industry in theNational Economy FILE COPY(In Two Volumes)
Volume 11: Annexes and Statistical TablesNovember 9, 1979
Projects DepartmentEast Asia and Pacific Regional Office
FOR OFFICIAL USE ONL'Y
Document of the World Bank
This document has a restricted distribution and may be used by recipientsonly in the performance of their official duties. Its contents may nototherwise be disclosed without World E,ank authorization.
Pub
lic D
iscl
osur
e A
utho
rized
Pub
lic D
iscl
osur
e A
utho
rized
Pub
lic D
iscl
osur
e A
utho
rized
Pub
lic D
iscl
osur
e A
utho
rized

CURRENCY EQUIVALENTS
Before November 15, 1978
US$1.00 = Rp 415
Rp 1.00 = US$0.0024Rp 1 million = US$2,410
After November 15, 1978
US$1.00 = Rp 625
Rp 1.00 = US$0.00116Rp 1 million = US$1,600
ABBREVIATIONS AND ACRONYMS
ASKRINDO - Indonesian Credit Insurance CorporationBAPPEDA - Regional Planning AgenciesBAPPENAS - Badan Perencanaan Pembangunan Nasional - National Development
Planning BoardP.T. BAHANA - Public Equity Financing Corporation for Small and Medium-Scale
EnterprisesBIPIK - Guidance and Development of Small-Scale IndustryBPS - Biro Pusat Statistik - Central Bureau of StatisticsBUUD - Badan Usaha Unit Desa - Forerunner of KUD - Village Unit Cooperative
KIK - Kredit Investasi Kecil - Small Investment CreditKMKP - Kredit Modal Kerja Permanen - Small Permanent Working Capital CreditNAFED - National Agency for Export DevelopmentREPELITA I - First Development Plan, 1969/70-1973/74REPELITA II - Second Development Plan, 1974/75-1978/79REPELITA III - Third Development Plan, 1979/80-1983/84UPPINDO - IDFC: Indonesian Development and Finance Corporation
DEFINITIONS BY EMPLOYMENT
CIs - Cottage and Household Industry Units, Employing 1-4 WorkersSIs - Small Industry Units, employing 5-19 workersMIs - Medium Industry Units, employing 20-99 workersLIs - Large Industry Units, employing 100 or more workersCSIs - Cottage and Small Industry Units, employing up to 19 workersSMIs - Small and Medium Industry Units, employing from 5-99 workersMLIs - Medium and Large Industry Units, employing 20 or more workers
FISCAL YEAR
Government - April 1 - March 31
Bank Indonesia - April 1 - March 31
State Banks - January 1 - December 31

FOR OFFICIAL USE ONLY
This sector report is based on the findings of a mission whichreturned from Indonesia at end-December 1978. The mission consisted ofthe following members:
Fateh Chaudhri - Mission ChiefRogelio David - Non-financial ProgramsHans Lesshafft - Financial ProgramsKeith Marsden - Policies and IncentivesVinod Prakash - General Economics and Statistics
The report was discussed with GOI officials in June, 1979 andincorporates the ideas expressed during those discussions.
The Report consists of two volumes:
Volume I : The Main ReportVolume II : Annexes and Statistical Tables
This documont has a ratricted distribution and may be used by recipients only in the performanceof their official duties. lii contents may not otherwise be discose without World Bank authorization.


INDONESIA
COTTAGE AND SMALL INDUSTRY IN THE NATIONAL ECONOMY
VOLUME II - CONTENTS
Page No.ANNEXES
I Repelita III and the Development of Small-scale Industries ... 7II Basic Statistics on Manufacturing Sector . . 19
III Research and Development Institutes ........................ 35
STATISTICAL TABLES
IntroductionIndonesia Industrial Classification0.1 Overview of Household and Cottage Industry Sector by
Rural, Urban Areas and Sec. 1974/750.2 Overview of Household and Cottage Industry Sector per
Establishment and Persons Engaged, 1974/750.3 Overview of Manufacturing Sector by Scale of Operation,
1974/750.4 Top Eight Indust:ry Groups in Household and Cottage Small,
Medium and Large Scale Industrt, 19740.5 Top Eight Provinces in Household & Cottage, Small,
Medium and Large Scale Industry, 19741.1 Number of Manufucturing Establishments by Employment
Size and Industry Group, 19741.2 Number of Manufacturing Establishments by Employment
Size and Prov:Lnce, 19742.1 Number of Estab:Lishments Using Power Equipment by Size
and Industry Group, 19742.2 Number of Estab:Lishments Using Power Equipment by
Employment Size and Province, 19743.1 Number of Persons Engaged (Total, Paid & Unpaid) as % of
Total for a Segment by Industry Group, 19743.2 Number of Persons Engaged (Total, Paid, Unpaid) and Paid &
Unpaid as % oE Total for a Segment by Province, 19744.1 Number of Persons Engaged per Establishment, No. of Days
per Person Engaged, & Wages and Salaries per Employeeper Day by Indlustry Group, 1974
4.2 Number of Persons Engaged per Establishment, Number ofDays per Person Engaged and Wages and Salaries perEmployee per Day by Province, 1974


-5-
Page No.
5.1 Number of Man-Days, Wages & Salaries, Value Added, GrossOutput, Value Added/Person Engaged, and Value Added/Gross Output (%) by Industry Group, 1974
5.2 Number of Man-Days., Wages & Salaries, Value Added, GrossOutput, Value Added/Person Engaged and Value Added/Gross Output (%) and No. of Man-Days by Province, 1974
6.1 Percentage Distribution of Number of Establishments,Number of Persons Engaged, Number of Man-Days, ValueAdded and Gross Output by Industry Group, 1974
6.2 Percentage Distribution of Number of Establishments,Number of Person-, Engaged, Number of Man-Days, ValueAdded and Gross Output by Province, 1974
7.0 Number of Establishments, Number of Persons Engaged, ValueAdded, Gross Output, Labor Productivity, Value Added/Gross Output, Number of Days/persons Engaged, and Wagesand Salaries per Man-Day by Major Industries, 1974
8.0 Percentage Distribution of Number of Establishments, Numberof Persons Engaged, Value Added and Gross Output by MajorIndustries, 1974
9.0 Percentage Dstribution of No. of Persons Engaged, ValueAdded and Gross Output, and Index of Labor Productivityby Segments and Major Industries, 1974
10.0 Number of Establishments by Industries, 197411.0 Number of Persons Engaged by Industries, 197412.0 Value Added (Total in Rp Million) by Industries, 197413.0 Gross Output (Total in Rp Million) by Industries, 197414.1 Number of Establishments, Number of Persons Engaged, Value
Added, Labor Productivity and Wages and Salaries byMajor Industries, Central Java - 1974
14.2 Number of Establishments, Number of Persons Engaged, ValueAdded, Labor Prcductivity and Wages and Salaries byMajor Industries, Jakarta, 1974
14.3 Number of Establisgments, Number of Persons Engaged, ValueAdded, Labor Prcductivity and Wages and Salaries byMajor Industries, North Sumatra, 1974
15.0 Gross Output, Merchandise Imports and Total Supply byMajor Industries, 1974
16.1 Cumulative Number of Establishments by Year of Commencementof Production by Industry Group, 1969-74
16.2 Cumulative Number of Establishments by Year of Commencementof Production by Province, 1969-74
17.0 Number of Establishments and Persons Engaged by MajorIndustry Group, 1970-77
18.0 Number of Establishments and Persons Engaged in Small &Handicraft Industry by Rural-Urban Areas andIndustry Group, 1969-74
19.0 Number of Establishments & Persons Engaged by Province,1973-77

Page No.
20.0 Growth of Manufacturing Employment, 1961, 1971, 197621.0 Scores of Industrial Branches Suitable for Small- and
Medium-Scale Operation22.0 Production of Selected Industrial Products23.0 Small-Scale Industry Sector Study KIK Lending Operation
by Bank as of December 31, 1974-1977 and as ofSeptember 1978
24.0 Small-Scale Industry Sector Study KMKP Lending Operation byBank as of December 31, 1974 and as of September 1978
25.0 Small-Scale Industry Sector Study Cumulative KIK and KMKPLoan Approvals by Economic Sector as of September 30, 1978
26.0 Small-Scale Industry Sector Study Cumulative Industrial KIKand KMKP Industrial Loan Approvals by Provinces as ofSeptember 30, 1978
27.0 Small-Scale Industry Sector Study Total KIK and KMKP Arrearsas of December 31, 1975-77 and September 30, 1978
28.0 Small-Scale Industry Sector Study Estimated IndustrialKIK and KMKP Arrears as of December 31, 1975-77 andSeptember 30, 1978
29.0 Characteristics of Cumulative KIK and RMKP LoanApprovals as of September 30, 1978
30.0 Characteristics of Cumulative Industrial KIK and KMKPLoan Approvals as of September 30, 1978
ADDITIONAL STATISTICAL TABLES
Introduction (includes the List of Tables 1 to 21 by size class ofemployment):
IA to 21A by Industries (26 three-digit codes)1B to 21B by Provinces (26 two-digit codes)Province Codes and Names

ANNEX I
INDONESIA
COTTAGE AND SMALL INDUSTRY IN THE NATIONAL ECONOMY
Repelita III (1979-84) and the Development of Small Scale Industries
Table of Contents
Page No.
Introduction .... . . . . . . . . . . . . . . . . . . .... 1Need for Developing Base Line Data . . . . . . . . . . . . . . 3Development Strategy and Emphasis . . . . . . . . . . . . . . . 4Target Groups . ...... .. ....... . . . . ....... 4Development Budget for CSI ... . . . . . . . . .... . 5Coordination of Assistance ... . . . . . . . . .... . 6Ground Rules and Modes of Coordination . . . . . . . . . . . . . 7Modes of Delivering Assistance to CSI . . . . . . . . . . . . . 8Scouting the Talent for Extension Workers . . . . . . . . . . . 9Enlarging Market Channels . . ... ....... .... ... . 9
Subcontracting .... . . . . . . . . . . . .... . 9Bulk Procurement . . . . . . . . . . . . . . . . . . . . . . . 11


Annex 1Page 1
REPELITA III (1979-84) AND THEDEVELOPMENT OF SMALL-SCALE INDUSTRIES
Introduction
1. Before analyzing the Third Five Year Plan and its relevance toCSIs, the following points are also worth mentioning. The First Five YearPlan (Repelita I) concentrated on stabilization of the economy and rehabi-litation of certain important sectors such as agriculture, industry (mainlyresource based) and infrastructure such as power, telecommunications andtransport. Industrial priorities related primarily to sectors supportingagriculture, such as fertilizers, agricultural machinery and processing ofagricultural products. While the bulk of capital formation took place in thetraditional branches of industries (such as food and textiles), significantamount of capital was also channelled to the resource based industries,including petroleum.
2. The Second Five Year Plan (Repelita II) continued the broadstrategies of Repelita I. Within the industrial sector heavy emphasis wasgiven to import substituting industries, protected by import controls,tariffs, and the investment licensing system. In general, the industrialstrategy encouraged large scale capital intensive projects being highlydependent on foreign capital and technology and related (a) to the processingof national resources for exports (e.g. mineral ore smelter, liquid naturalgas, etc.); (b) to the domestic production of intermediate products (e.g.steel, cement, fertilizer, chemicals, pulp and paper); and (c) to factoryproduced consumption goods. The majority of public sector and foreigninvestment went to the first two categories of industries and a substantialpart of private investment to the last category of industries.
3. The main policy instruments used for promoting industrial develop-ment were: investment incentives; protective measures and policies relatedto industrial cooperation between foreign and national companies. The mainelements of the investment incentive system included tax holidays, reductionor exemption of import levies and accelerated depreciation allowances.
4. These policies and incentives while resulting in rapid manufac-turing sector growth (about 12 percent p.a.) also lowered the price ofcapital relative to labor and hence encouraged the adoption of more capitalintensive technologies with lower labor absorption potential. In fact duringRepelita II less than half of the industrial sector employment target (600,000jobs over 5 years as against the target of 1.2 million jobs) was achieved.
5. Due largely to these polices and practices, the present industrialstructure shows two distinct characteristics. On the one hand there existsfairly modern, large scale, capital intensive, resource based industrysector being highly dependent upon foreign capital and technology. Thismodern sector has limited impact on industrial employment and few linkageswith the general manufacturing sector which in itself remains dependent upon

-8-Annex 1Page 2
imported capital goods, spare parts and raw materials. On the othc- handthere exists the traditional indigenous small scale industry which employsmore than four million persons and artisans but has been relatively unaffectcdby developments in the modern sector.
6. On the eve of the Third Five Year Plan (Repelita III: April 1979-March 1984) government planners and policy makers are reassessing the pastperformance and future role of the manufacturing sector. They seem to beconcerned, as the Bank staff are, with the relatively (a) small (10 percent)share of manufacturing in total employment and slow growth in industrialemployment; (b) low share of manufactured goods in merchandise exports(two-three percent) and the sector's heavy orientation to the domesticmarket; (c) predominance of consumer goods subsectors; (d) overconcentrationof manufacturing activities in Java and urban centers like Jakarta; (e)underdeveloped processing sector primarily located in outer islands; (f)considerable gap between the traditional small scale and the large modernmanufacturing sector and the lack of linkages between the two; and (g) highdependency on imported capital goods and raw material of domestic manufactur-ing industries.
7. It is being increasingly recognized that while large scale projectsin a resource rich country are required at some stage of development, theymust form part of the overall efforts and must be accompanied by developmentsof other industries that contribute to employment of a large part of thepopulation. Without an employment oriented strategy in the industrialsector, yearly additions of about 1.5 million persons to the labor forcewould threaten the orderly development process and gains of past developmentefforts.
8. In addition to encouraging and bringing more balance between largecapital intensive and small/medium labor intensive manufacturing industries,the future industrial strategy should also aim at achieving a better balancebetween domestic and outward orientation of the manufacturing sector as wellas between the public and private sector investment in the manufacturingsector. The latter has gone down in recent years. A comprehensive analysisis needed to clarify elements of a viable strategy to achieve these goals.
9. As a first step towards identifying the problems and constraintsfacing small industry, the Bank has initiated a sector study, the resultsof which appear in the present report. In what follows, we have attempteda brief review of the development strategy and emphasis of the Third FiveYear Plan, its relevance to CSIs, the proposed development budget and programsof assistance for the promotion of CSIs, as well as the choice of targetgroups envisaged in the Plan.

-9-
Annex 1Page 3
Need for Developing Base Line Data
10. The Third Five-Year Plan to develop the CSI sector (of which thevast majority are traditional cottage industries) /1 was drawn up before thefinal evaluation of the achievements of the previous plan. Therefore, thequantitative targets set forth in the Plan can only be taken as broad ordersof magnitude. Based on preliminary and incomplete data, the Plan calls for agrowth rate for the CSI sector of 7% a year during the period 1979-84 (upfrom the 5% p.a. growth rate estimated by the Bank for the previous halfdecade), which would enable it to contribute 12% in the manufacturing sectorvalue-added and generate additional jobs for 434,000 workers, at a cost of$500 each (at the old exchange rate of Rp 415:US$1). The broad targets forthe CSI sector are brought into focus in the following table:
THIRD FIVE-YEAR PLAN (FYP) TARGETS FOR THE CSI SECTOR, 1979-84
Gross Total Assumedvalue % of incremental % of growth of K:L
added 1984 total employment total output ratio(Bn. Rps) ('000) p.a. (US$/Job)
1. Strategicindustries 597 31 47 4 14 50,000
2. Consumptionindustries ],096 57 633 57 11 5,000
3. Cottage & CSIindustries 238 12 434 39 7 500
Total ].,931 100 1,114 100 11 -
Source: Draft Repelit:a III Document.
11. The Plan does not elaborate the underlying assumptionsand bases of the projections, perhaps because of the paucity of baselinedata on which it is based. In fact, the lack of reliable data on the CSIsector not only hampers planning efforts but also prevents a meaningfulevaluation of the current situation and proposed assistance in this sector.Particularly lacking are statistical series that would show the growthtrends and other characteristics of subsectors as well as provide guidancefor a rational direction of assistance programs. Some of these CSI character-istics - product type:, employment, location, factor inputs, etc. - areanalyzed elsewhere in this report, but the absence of accurate time seriesand analysis of the growth performance of the various subsectors make
/1 The first Industrial Census of 1974/75 showed that this sector consistsof 1,235,000 cottage industries employing 3.9 million persons and 45,000units of small industries with total employment of 0.3 million persons.

- 10 - Annex 1Page 4
identification of priority areas difficult. Clearly this information gapmust be bridged as soon as possible, especially since the CSI sector develop-ment constitutes one of the important features of the Third Five Year Plan.
12. During the first year of Repelita III, attempt must be made to assemblesuch a statistical base. A number of sectoral and project studies conductedover the past number of years under BIPIK's auspices (by universities andprivate consulting organizations) could serve as secondary sources tosupplement the 1974/75 census data on which the projections above are based.These studies should be analyzed and used to the extent possible to assistplanners in translating broad directives into action programs. In additionto more representative sample surveys - perhaps another census - of the CSIsector should be undertaken in 1979/80 - the first year of the Plan - todetermine what changes or structural shifts have taken place since the lastone was conducted five years ago. The results of this census should beprocessed and made available as soon as possible to the planning authoritiesso that they could formulate more concrete plans and adjust their targetsand policies. Establishing the baseline data is of utmost importance notonly for planning but also for project design purposes./l In the nextsection a qualitative assessment of the main features of the Plan, its newemphasis, and direction is presented.
Developtnent Strategy and Emphasis
13. While the Third Plan's strategy, broad objectives, sectoral/geo-graphic coverage, and integrated assistance programs are not too differentfrom that of the previous Plan's, both in terms of investment in the sectorand in terms of assistance expenses, it proposes to put more emphasis on(a) promoting closer coordination among assistance agencies, financial andtechnical; (b) opening up new markets (and demand) for CSI products throughsubcontracting with the Government or larger trading firms; (c) developingbulk procurement schemes with government purchasing agencies; (d) and thestrengthening of as well as continued experimentation with the various modesof delivering assistance. Clustering of scattered CSI and organizing theminto cooperatives (in accord with Presidential Decree No. 2, 1978) will alsobe continued, although as in the past individual CSI seeking assistancestill get some attention. Inasmuch as the quantitative basis of the Plan isnot yet fully established comments will be confined to the basic strategyindicated above and the proposed new emphasis.
Target Groups
14. Although it is desirable and politically expedient to help all CSIenterprises throughout the country, experience in the Second FYP has shownthat it is not possible to do so with the limited supply of adequate manpoweravailable for a nationwide extension services and the absence of effectivecoordination among agencies involved. The socio-political reasons behindthe high priority placed by Government on assisting the "economically weak"
/1 See Annex II for a more comprehensive write up on this issue.

- 11 - Annex 1Page 5
segments of the population are understandable. However, since thesesegments are found in all walks of life throughout the country, resourceshad to be spread out thinly, and credit and technical assistance has reachedonly a sma'l fraction of CSI entrepreneurs needing assistance. KIK/KMKPcredits have reached only about 15,000 CSI clients (about 1% of totalCSI) operating in the manufacturing sector, and these are often not the sameones who were affected by the technical assistance programs, an estimated55,000 enterprises (4' of CSI firms). Since both constraints cannot beovercome in the short-term (recruitment, training, and deployment of extensionworkers now take an average of about 12 months), a fundamental issuefacing the Government during the Third FYP is whether it is prudent to tryto reach all CSIs as in the past with the meager supply of extension workersor focus assistance efforts only on selected groups of CSI in specificlocations, while the capacity of extension services is being built up.
15. As discussed in Chapter V, Volume I of this report there arecertain advantages of a more limited development approach. Briefly, itenables extension services to concentrate assistance on and address individualCSI problems, since the number of clients and areas to be covered is reducedwithin manageable limits. It also permits the essential follow-up, not nowpossible, that is needed to ensure that assistance coming from other agenciesis obtained on time and more importantly, it is implemented properly. Alimited approach moreover is conducive to sustained assistance effort in acoordinated fashion, because it involves only a few (usually 5-6) agenciesto be coordinated on a specific, well-defined area. To initiate such anapproach, however, agreement must be obtained on specific projects/areas tobe assisted. In Chapter 5, para. 5.52 this report specifies some criteriathat could be considered in the selection of such areas. One drawback thatsuch a limited approach has is that it may not be politically "sellable" asit gives the appearance of favoring certain groups of CSI or regions overothers. But this impression can be partly corrected by increased promotionalefforts through the media to be disseminated to all types of CSI industriesspecifying that the government will still continue to assist any CSI thatseeks help. In any case, a political decision has to be taken on this issue,bearing in mind the trade-offs involved and the pervasive manpower andorganizational constraints facing the Government. The report recommendsstrongly the selectivity in Government approach.
Development Budget for CSI
16. The development budget allocated for the CSI sector, amounting toRp 50 billion (exclusive of credit assistance), reflects on the whole thenew emphasis of the Third FYP. Although nearly 85% of the budget is allocatedfor extension services and raw material support (as in the previous Plan),there are increased allocations for marketing assistance, data collection/processing and training of extension workers - three important areas inwhich the overall assistance framework has suffered deficiencies. Anadditional 2,650 extension workers are going to be trained over the nextfive years, an overly ambitious target when compared with about 300 extension

- 12 -Annex 1Page 6
workers trained over the past five years. On balance the budget allocationsdo not appear to be adequate for the tasks involved. The budget allocationsare presented below:
ALLOCATION OF DEVELOPMENT BUDGET FOR CSI(1979-84)
% shareType of expenditures Third FYP budget of total
(Rp billion)
I. Extension services 20.5 41.0(a) Production assistance 6.5 13.0(b) Marketing assistance 6.5 13.0(c) Entrepreneurial training 7.5 15.0
II. Raw material/machinery assistance 21.7 43.4
III. Data collection & processing 2.0 4.0
IV. Training of extension workers 1.6 3.2
V. Overhead 4.2 8.4
Total 50.0 100.0
Source: Repelita III Document. Reclassification of expendituresis done by the mission. No estimates of the foreign exchangecomponent of the planned investment is given. It is not certain ifthese figures are exclusive of that component.
Coordination of Assistance
17. Even if budgetary resources are increased to carry out developmentplans for the CSI sector, lack of coordination among the various agencies,particularly between financial banking institutions and other technicaldepartments (ministries) may continue to be a major stumbling block, unlessremedial steps are taken to promote closer coordination during the Planperiod. Under the Third Plan, coordination by DOI of only a limited numberof agencies, i.e., Department of Trade and Cooperatives, Bank Indonesia,Department of Public Works, Department of Manpower and Transmigration, andthe Local Government, is envisaged. As has been borne by several projectstudies, on a working level the close cooperation of only these agencies isall that is needed to implement effective assistance programs in an integratedway. However, the Plan does not spell out the mechanism for developing thisminimum amount of coordination.
18. In Chapter 5 of this report a mechanism for effecting such acoordination is suggested. To recapitulate, essentially the proposedmechanism consists of (i) a formal sanction or approval at a supra-ministerial
- 13 - Annex lPage 7
level (by Bappenas and/cr Ministry of Finance) which would reduce or eliminatethe basic budgetary constraints and overcome departmental sectoral interestswhich have hampered coordination efforts in the past, and (ii) agreement bythe five specific agencies mentioned (spearheaded by DOI) to provide anintegrated package of credit and technical assistance to a predeterminedtarget group. For this limited coordination effort to succeed in practice,it must be focused on a limited number of largest cluster/project areas, andnot as in the past on a broad range of groups scattered nationwide. Moreover,the coordination must be obtained only after these areas have been properlyidentified and surveyed. It must also involve specific bank branches and aspecified local governme!nt body, whose cooperation is essential to the successof any assistance progrELm. In the past, attempts to cement coordination waspromoted at the ministerial level, on assistance areas that have not yet beenidentified nor surveyed. Consequently, local government participation wasalmost completely ignorEd.
19. A number of project area studies that could serve as basis for thisform of coordination are now available. The University of Indonesia studieson wood, rattan, clay and leather products are particularly useful asinitial endeavors; they are analytical, they identify CSI problems in fairlyspecific terms, and preesent an outline of the sources and types of assistancerequired to solve those problems. Further groundwork will still be neededto transform these basic: studies into project documents, but in theirpresent form they could be used as bases for coordination. Other studies orproject profiles are being prepared by loan officers of state banks, andthese the Third Plan proposes to use extensively as bases for drawing upwork programs jointly with banks. BIPIK is also continuing the financing ofmore project/area studies to supplement its data base and develop projectideas These too can be analyzed and used as a guide for future cooperativeaction. There is thus no particular shortage of project identificationstudies or surveys. It is project appraisal reports, evaluating the projectmerits and viability as well as specifying needed credit and technicalassistance, that are badly needed. These appraisal reports should bedeveloped jointly by appropriate staff of banks and technical assistanceagencies so that appropriate project designs emerge and grassroot coordi-nation at project level is developed.
Ground Rules and Modes of Coordination
20. Developing closer links between banks and technical assistanceprograms in Indonesia as in other countries poses special difficulties onaccount of divergent cr:Lteria and varying standards of project evaluationand staff quality, in general, of these two sets of institutions. Bankpersonnel on the whole tend to be more commercially oriented and profitconscious than the civi:L servant extension workers, so that there aredifferent and sometimes conflicting sets of motivation involved. However,experience in other counitries and to a limited extent in Indonesia also showsthat cooperation between these two sets of institutions is not impossible,even only in an informaL fashion and on a working level. Analysis of thesead hoc forms of cooperation shows that this type of cooperation depends to agreat extent on the personalities involved, e.g., the branch manager of abank and the BIPIK chieE, but also depends on a number of ground rules thatwere observed by both parties. One is that the bank in question retains theright for final approvaL or rejection of the loan in question and that no

- 14 -Annex 1Page 8
pressure is exerted by the technical agency to influence banks' decision.Secondly, the bank must also have a say on the format and content of theappraisal made by the technical agency. With these two considerations inmind different modes of bank-nonbank cooperation on specific projects shouldbe explored over the next Plan period.
21. There are different modes of coordination that can be tried, eachto be considered in light of the peculiar nature of the products involved,the location, the entrepreneurs, the marketing prospects, etc. A workinglevel committee, convened preferably by the head of a local governmententity (such as the Governor's office) could be formed to determine andprovide the credit and other technical assistance requirements of a specificarea or cluster. Bank officials in this case may initiate the project cycleby identifying potential areas suitable for bank lending and preparing theseareas to qualify for credits and fulfill other bank requirements; the localextension workers could then provide nonfinancial inputs needed. A similarapproach is now being tried (with World Bank assistance) in three provincesEast and Central Java and West Sumatra - but its success will ultimatelydepend on the availability and sustained application of other technicalassistance to the project area after financial assistance is given.Another approach would be to form a team consisting of a loan officer, anextension worker, and a local government official to identify and surveypotential areas of development within a specific region, and prepare jointlyan assessment of the credit and other assistance needs of the area based ona joint analysis of the project merits and growth prospects. Assessment ofthe entrepreneur's creditworthiness in this appraisal report, however,should be reserved exclusively to the bank officials, as would the finalapproval or rejection of the loan in question. Yet another approach thatmight promote closer coordination would be to have a bank representative sitin or serve on call at the extension Service Center as part of the expertteam dealing on a day-to-day basis with CSI clusters. While his role isbasically to inform CSI on how to fulfill bank requirements, to fill outapplication forms, and to monitor the use of credit proceeds, he could alsoinform the other extension experts of banks' credits, terms and borrowingconditions. In all these different modes, the idea of working together fora common goal and thereby developing mutual respect and confidence over timeshould be a primary consideration. Since these modes are basically experi-mental in nature, flexibility in procedures, adaptation to local conditions,free exchange of views and information (except on matters that would violatebank clients' confidence) should be stressed. For these experimental modesto be replicable elsewhere, however, they must be evaluated periodically,noting both the reasons for their success and/or failures.
Modes of Delivering Assistance to CSI
22. In the Third Plan, the same modes of delivering assistance asthose experimented in the previous plan will be used, namely, CSI developmentcenters, common service centers and demonstration centers, sales emporia,processing/marketing centers and shop clusters (or mini industrial estates).An analysis of these various modes shows that in the particular circumstancesof CSI in Indonesia, these various modes could, if organized properly,provide satisfactory channels for credits and technical assistance. The

- 15 -Annex 1Page 9
clustering of CrI, moreover, is also found to be an efficient system ofmaximizing tLie use of limited manpower resources. These approaches and modesof delivery should therefore over the next five years be further developedand strengthened. A number of ways to accomplish this objective are presentedin Chapter 5 of this report.
Scouting The Talent for Extension Work
23. However, channels or modes of assistance are only as effective asthe extension workers manning them. Hence, while the required number ofstaff are being trained - allow at least 24 months to establish regulartraining courses - maximum use should be made of private sector and othermanpower resources to provide staffing and organizational assistance to thesevarious centers. In view of the importance of these modes of deliveringassistance, a separate budgetary allocation for hiring consultants or payingadditional remuneration for other qualified civil servants may be justifiedand needed. (No budgetary allocation for this purpose is given in the ThirdFYP.) For instance, bank loan officers in the regional branches may beinvited to give informational talks to clusters to explain what creditfacilities are availa'ble for CSI, their terms and conditions. Privateentrepreneurs engaged in trading, may also be "invited" for a fee or profit-sharing basis to provide short-term consultancy to sales emporia and othermarketing cooperatives. There are also a large number of civil servantsemployed in various government departments who have had foreign and localtraining in industrial extension and project work. They too can be tapped tosupplement the supply of extension workers while the training of regularworkers is proceeding. The Manpower Volunteers (BUTSI) consisting of collegestudents who are deployed to the rural areas to assist in community developmentprojects could also provide useful "extension" of extension services. Atotal of 4,000 volunteers with varying skills are planned to be dispatched torural areas in the Third Five-Year Plan period. The point of all this isthat CSI needs are urgent and cannot wait for the build-up of adequate staffand development of polic-ies to meet those needs. This also underlines theneed to establish as soon as practicable not only training facilities andcourses for extension workers, but also service centers, demonstration units,and processing centers, equiping them with appropriate materials and tools tobe used for instructional purposes.
Enlarging Market Channels
Subcontracting
24. Subcontracting as a means of expanding marketing outlets for CSIproducts is being emp'hasized in the Third Plan. For handicrafts and art-basedCSI, subcontracting is planned to be developed by "trading houses." For sub-contracting arrangements between the more progressive small industries thatare one step above the family-owned traditional enterprises, and which arebetter suited for subcontractual arrangements, individually or collectively,no specific agency is proposed to help them. No mention is made of who will

- 16 -
Annex 1Page 10
finance or establish these trading houses./l Elsewhere in this report it isargued that as far as practicable private sector trading firms should beencouraged for this purpose.
25. The important issue to remember in this regard is that subcontract-ing arrangements are best encouraged by a regime of incentives for both thesuppliers of products and the users of those products. Some of these policyincentives - credit, tax, tariff, and nontariff facilities - are discussedelsewhere in this report. For the bulk of CSI, however, policy incentivesand stable market conditions may not be sufficient to enable them to live upto subcontracting arrangements. Because of their size and limited productioncapacity, their scattered location, lack of uniform quality and productstandards, these CSI will not be able to meet large orders, unless someagency were to organize them collectively. Such an agency would essentiallyprocure orders for CSI products, allocate these orders among individualCSI's, and ensure that the orders are met on time and of the right specifi-cations. These primary subcontractors could also perform quasi-financialfunctions by acting as channels for credits in kind or in cash to enable CSIenterprises to meet orders. The rationale, functions, and organization ofsuch agencies are discussed in more detail in Chapter VII of the SSE ProjectIdentification Report./2 Even in this case the potential for the use ofprivate sector trading firms has been stressed. Also initially, some ofthese arrangements have to be on experimental basis.
26. Special consideration should be given to those CSI's engaged inthe manufacture of products that could be used by or "subcontracted" fromlarger industries and assembly plants, e.g., the automobile assemblies, TV,radio and electrical appliances, and electronic assemblies, or sold ascomponents overseas. This aspect of CSI promotion is still small in relationto the CSI and the whole manufacturing sectors, but there is wide scope forfurther growth. Most of its basic raw materials are produced locally.Besides, Indonesia has the technological capability and institutions todevelop subcontracting. However, before or simultaneous with subcontractualarrangements, a substantial amount of technological assistance and supervisionwould be needed to improve product quality and design as well as to expandoutput. The Metal Industries Development Center (MIDC) and Electrical Institutein Bandung could contribute significantly in this respect. At present, however,their extension services have not reached a sufficient number of CSI engagedin this sector due to budgetary and manpower constraints. Their presentorganization and salary scales have prevented these institutes from hiringand keeping high quality staff. BIPIK has also been instrumental in providingtechnological and marketing assistance to a group of foundry shops in Ceper(Central Java), and this experience appears to be replicable also in otherareas of the country where metal and plastic products are being produced.Apart from the technological inputs required in this sector, the Governmentshould also provide other incentives - credits for working capital, prefe-
/1 Certain financial institutions such as UPPINDO, P.T. Bahana are reportedto be interested in supporting these trading houses.
/2 Report of a Mission to Identify and Prepare a Small-Scale EnterpriseProject for World Bank Support, January 1979.

Annex 1Page 11
rential pricing of raw materials, tax and duty rebates and the like - tostimulate production. On the demand side, large assembly plants may also beencouraged in similar ways to procure components from these small firms.Trading houses could alsoi be motivated to organize procurement and subcon-tracting arrangements ancl in collaboration with MIDC or BIPIK could ensurethat proper specifications are met. All this can be encouraged if specificincentives (fiscal, monetary, etc.) are provided to promote subcontractingarrangements to the parties involved.
STRUCTURE OF THE METAL AND PLASTIC FABRICATION INDUSTRIES1974/75
Output Value added EmploymentCSI MLI CSI MLI CSI ILI(Rp billion) (Rp billion) ('000Y-
Metal products, fabrications,machinery 14.9 173.8 6.9 60.3 78.0 56.0
Plas.ic fabrications 3.2 11.3 1.0 3.1 10.0 10.0
Total Manufacturing 358.4 1,293.8 135.6 476.9 732.0 622.0
Metal and plastic in % of total 5.1 14.3 5.8 13.3 12.0 10.0
Source: Statistical Appendix.
Bulk Procurement
27. As noted elsewlhere in this report, the wood products, buildingmaterials, and to some eXtent metal fabrication industries - three major sub-sectors within the CSI sector - could develop adequate markets domesticallythat could sustain their viability. The Third Plan for CSI therefore proposesto explore bulk procurement schemes with the Department of Public Works andthe Department of Transmigration. It should, in addition, (although notmentioned in the Plan) eXplore possibilities of obtaining orders for theseproducts from the Government Procurement Office for other departmental officeuse in the center and in regions. Due to the scale of operation and scatteredlocation of CSI in these subsectors, however, meeting bulk procurement ordersparticularly those destined for various locations (e.g., low cost housingsites in various cities) will present difficult mobilization and transportproblems that individual or even a group of CSI firms would find insurmount-able. Hence, there must also be an intermediary mechanism or institutionthat could ensure that bulk orders are met and delivered on time.
28. The Government in the course of the Third Plan could take anumber of specific steps to promote bulk procurement schemes. First of all,an inventory of those wood, cement, clay, and metal products that are nowbeing produced by CSI - or could be produced by small firms using local laborand materials - should be taken immediately. The results of this inventoryshould then be matched with the list and specification of products that are

- 18 -Annex 1Page 12
commonly purchased by the Government on a fairly regular basis./I Once thepreliminary survey and analysis are done, the Government could then select
a few products - perhaps office desks, chairs, bookshelves, bricks, roofingtiles - that could be set aside for CSI manufacturers or given an appropriateprice preference. Experience in other countries has shown that this system
of bulk procurement works best if carried out in stages, either by increasingthe number of items, the number of offices designated to buy them or bothover a specified period of time. Also to ensure repeat orders, after-salesservice must also be provided by the CSI suppliers.
29. It is in the area of policy and incentives, however, that theGovernment could best promote bulk procurement of CSI products. Procurementpolicies may be influenced to give preferential treatment to bids comingfrom trading companies that specialize in CSI produced items. Tax, credit,and nontariff incentives may also be given to both traders and producers.If justified protective tariffs for some local CSI industries may also beenforced vis-a-vis domestic large-scale industries and imports. Largeforeign and local contracts awarded for building government projects mayalso be required, as far as practicable, to utilize locally produced CSIproducts. While all these measures are not new to Indonesian policymakersand have been tried with mixed records of success in the past, they could inthe next Five-Year Plan be given fresh impetus and new directions, parti-cularly since the basic "linkages" of the whole industrial sector are nowbetter known than in the past and small industry establishments have reacheda stage of development where they can be expected to take advantage ofincentives offered.
LI The Department of Public works (DG of Construction) has the capabilityto assist CSI engaged in producing wood products and other wooden articlesin meeting specificaitons through its kiln drying, wood preserving, andbrick plants.

ANNEX II
INDONESIA
COTTAGE AND SMALL INDUSTRY IN THE NATIONAL ECONOMY
Basic Statistics on Manufacturing Sector
Table of Contents
Page No.
Introduction . . . . .. . . .. . . . . . . . . . . . . . . . . . IDescription of Industrial Census, 1974/75 . . . . . . . . 1Planning, Designing and Methodology . . . . . . . . . . 1Presentation of Stat:istics ... . . . . . . . . . . . .... 4Industrial Classification and Coverage . . . . . . . . . . . . 4Characteristics Covered and Special Tabulation . . . . . . . . 5
Adequacy of the Present Data Base . . . . . . . . . . . . . . . 7Description of the )ata Base . . . . . . . . . . . . . . . . . 7Evaluation of the Data Base ... . . . . . . . .. . . ... 8
Suggestions for Improving the Data Base . . . . . . . . . . . . 12

- 19Z -ANNEX IIPage 1
BASIC STATISTICS ON MANUFACTURING SECTOR
Introduction
1. This Annex should be read in conjunction with the Main Report(particularly its Chapter 3: Characteristics of Cottage and Small Indus-tries), because it either elaborates certain points only briefly mentionedthere or discusses additional issues. It consists of two sections: The firstsection describes Industrial Census, 1974/75. The second section brieflydescribes and evaluates the present manufacturing data base, and suggestsimprovements in it.
2. The Industrial Census 1974/1975 (the Census) is by far the singlemost important source of manufacturing data on Indonesia. Therefore, besidesdescribing its design, presenting results and coverage (including indus-trial structure, geographical concentration, socio-economic characteristics),the Mission evaluated the Census in the context of the new challenges facingthe industrial development planners of Indonesia. Thus, the evaluation mustnot be construed as a criticism of the Industrial Census in the context ofits own objectives and resource availability. Actually, given the mandateand resources of BPS, it may not be easy to suggest improvements in theCensus. But as mentioned in Repelite III, the Government of Indonesia wantsto improve the empirical basis of its industrial development programs andpolicies. Therefore, the Census can be one of the important and effectivevehicle to meet those objectives, and hence, the evaluation (see para 17 below)was attempted by the Mission.
A. Description of Industrial Census 1974/75
Planning. Designing and Methodology
3. The Central Bureau of Statistics (BPS) under its five year develop-ment program conducted a census/survey of all industrial establishments inIndonesia during 1974/75. The Industrial Sector consisted of manufacturingmining, quarrying, electricity generation and distribution, gas productionand distribution, and water works. The manufacturing activity was dividedinto four segments classified according to the new definition of size by thescale of operation (in terms of the number of persons engaged in an estab-lishment), which differs from the old definition as shown below:

-20-
ANNEX IIPage 2
| SeRment | New definition I Old definition l
iLarge (LI) I 100 or more persons engaged | 100 or more employees withoutlI I I power equipment
l 50 or more employees with ll l| power equipment l
IMedium (MI) | 20-99 " I 10 to 99 employees with lI I I power equipment l
IlI 5 to 49 employees without lI I power equipment
ISmall (SI) I 5-19 f | 1 to 9 employees withI l power equipment
l l Ii1 to 4 employees without ll l I power equipment
ICottage & | 4 or less " _I Household(CI)I l l
It appears that the small industry according to the old definition could in-clude entire cottage and household industry provided the distinction between"persons engaged" and "employees" is disregarded.
4. Planning, designing and preparation for this massive fieldinvestigation, involving enumeration of almost a quarter million manufacturingunits (including 192,700 sample CIs out of 1,234,500 in the universe), werecompleted by June 1974. The operation procedure, geographical coverage,timing and duration of the field work, and the reference period naturallydiffered among the segment as shown below:

- 21 -
ANNEX IIPage 3
Item CI | SI | MLI l
1Operation procedure 1 8 % Sample I Complete enumeration
IGeographical coverage I Whole Indonesia I Whole IndonesiaI l except low l
| density rural ll l area /a l
ITiming of field operation I Aug 74 - Jul 75 | June 75 - Aug 75
IDuration of field II operation 1 12 months I 3 monthsI I IIReference period lI I
la. Field operation I Last 30 days I Last 3 months I Full yearlIlI I 1974
lb. Published results I Jul 74 - Jun 75 | 1975 j 1974
5. The CIs were covered by a stratified random sample, wherein 8% ofthe 1971 population census blocks from each subdistrict, separately for therural and urban areas of each province, were selected. The number of sampleblocks in each stratum was adjusted to the nearest multiple of 12 so thateach month one sample block could be covered. This is an excellent way toavoid seasonal effects, but somehow similar approach was not adopted forSIs for which the data related only to the last three months (and not a wholeyear). The observed value of a characteristic for a small establishment is,therefore, multiplied by the following adjustment factor:
Average number of working days in a month X Number of operatingmonths in a year + Number of working days in the last three months.
/a The excluded seven provinces are: East Nusatenggara, Central & EastKalimantan, Central and Southeast Sulawesi, Maluku and Irian Jaya. Thisexclusion is unlikely to seriously affect the results at the nationallevel, the uncovered population being less than five percent. Someprovincial totals, however, might be seriously affected.

- 22 -
ANNEX IIPage 4
Thus, the SI estimates do not relate to either 1974 or 1975 in a strict sense.Further, errors in statistical estimates may be large, partly due to inevi-table problems in measurement of economic activities in cottage and smallindustries and partly due to the field staff which was not specialized in thisarea. The estimates, therefore, may be valid for either 1974 or 1975; theMission considered them valid for 1974 mainly because the MLI data clearlypertains to 1974. It should, nevertheless, be recognized that the statis-tical profile thus emerging for any manufacturing activity, first aggregatedby segments and then by industries or provinces, is only an artifact for1974.
Presentation of Statistics
6. The statistical results are published in 26 volume: 5 for CIs,11 for SIs and 10 for MLIs. The results for whole Indonesia at five digitindustry codes (also at three digit industry code for CIs) and those for aprovince for an entire segment are given in the respective volume I.Other volumes naturally differ from segment to segment. For instance, allthe 26 provincial totals are provided for CIs in volume III. But thesetotals for SIs are given for seven provinces (North Sumatra and SouthSulawesi besides Java island's five provinces) in the respective sevenvolumes, which also contain data by regencies/municipalities; the remainingthree volumes present data for the four provinces each in Sumatra andSulawesi islands and for the remaining nine provinces respectively. Thedata on individual industries by each province, however, are not publishedfor MLIs due to limited number of observations, nor are published byregencies/municipalities for the same reason. The data on industries atprovincial level are, however, published for four or five provinces of Javaisland. The data on processing and manufacturing at estates is contained inan exclusive volume on MLIs, which is not yet published. Finally, CIsegment has three more volumes, out of which volume II is of particularinterest because it shows data on labor force participation, cross-tabulatedby sex and age-group, by rural/urban for whole Indonesia as well as for eachprovince, some regencies and municipalities./l
Industrial Classification and CoveraRe
7. Manufacturing industries are classified into 28 (three digit code)industry groups and 127 (five digit code) industries according to theIndonesian Industrial Classification (IIC), available in most census volumes.It is reproduced (with minor editing) in the Statistical Annex, pp. 48-49. Theclassification closely resembles with the International Standard Industrial
/1 Volume IV shows itemized inputs and outputs (quantity and value) byprovince, and volume V shows investment in the new buildings constructedin rural areas.

- 23 -
ANNEX IIPage 5
Classification (ISIC). /1 However, it excludes two important industry groups:ISIC Code 353: Petroleunm Refineries and 354: Misc. Products of Petroleum andCoal. It also misses another industry group, namely code 372: Non-ferrousMetal Basic Industries, although the data are included in the census. Thereare other ambiguities. For instance, IIC Code 32210 and 32290 relate towearing apparel without appropriate distinction. Because IIC Code 382 is notsplit into four or five (Ligit codes, entire non-electric machinery is lumpedtogether. Sub-codes of 1IC 383 and 384 also need refinement.
8. The household and cottage industry (CI) data are available onlyfor the 53 five digit industries, because very limited manufacturingoperations were found in the remaining industries. The remaining operationswere found so limited that seven industry groups had to be lumped together.These goups are: Other Mlanufacturing Industries (Code 390), IndustrialChemicals (Code 351), Glass and Glass products (Code 362), Iron and SteelIndustry (Code 371), Machinery except Electrical (Code 383), and Scientific,Precision, Optical and Photographic Equipment (Code 385).
9. The small scale industry (SI) data on the number of establish-ments and persons engaged are available for all the 127 industries, but thedata on inputs and output: are available for only 112 to 114 industries,since the remaining 14 industries had only 1 to 2 establishments each. Howthese 14 industries are accounted for in the SI totals is not clear.
10. The medium and large scale industry (MLIs) data are avialable forthe 114 five digit codes.. The six industries pooled together, because thefirst four industries had only one establishment each and the last two hadonly two each, are: Other Soyabean Products (Code 31249), Furniture &Smallware from Bamboo, Cane, Reed, Willow, etc. (Code 36220). Moreover, thethree industries combined, because the total number of establishments wasonly four, are: Musical instruments (Code 39020), Toys (Code 39040), andStationery (Code 39060). Finally, (Code 31162) and (code 31164) WheatFlour are combined, although description of the former is not availablebecause it is shown in the classification together with Code 31161, whichis Rice Milling, Cleaning and Polishing.
Characteristics Covered and Special Tabulation
11. The characteristics covered by segments are generally but notalways the same. The comamon characteristics for which one can have acomprehensive view of the manufacturing activity by the scale of operation
/1 The International Standard Industrial Classification of All EconomicActivities, Series M No. 4, Rev. 2, United Nations, New York, 1968.

- 24 -
ANNEX IIPage 6
(or segments such as CI, SI) as well as by an industry for whole Indonesiaand also for principal regions are the following: /1
(a) Number of establishments by year of commencement of production:before 19.69 and onwards;
(b) Number of establishments with/without power equipment by thenumber of persons engaged: 5-9, 10-14, 15-19, 20-49, 50-99,100-499, 500+;
(c) Number of persons engaged: paid - production workers, andother employees, unpaid - household members;
(d) Value of input: raw materials and auxiliary materials, fuelsand lubricants, electricity purchased, packing materials, othermaterials, industrial services, repairs and maintenance;
(e) Value of output (at market prices): goods produced, industrialservices rendered, profit from resale of goods in the sameform as purchased;
(f) Census value added (at market price).
12. As the legal status, and consumption of fuel lubricants by typeof fuel may not be very important for manufacturing establishments, thedata are published for them by province but without industrial breakdown.As mentioned in para. 6 above, several other characteristics were coveredfor CIs. Further, many more characteristics were covered in the census ofMLIs for which results are also published, but they are not of particularinterest in the context of the present report. Moreover, the data on thenumber of mandays worked and wages & salaries etc. were collected but some-how not published for SIs. Finally, published reports provide data onlyon the number of establishments by the size of employment. Of course, nopublication can provide every conceivable tabulation. The Mission has,therefore, done some special tabulation from the data tapes on SMLIs. Thespecial tabulation estimates sometimes differ from the published estimates asshown below and presented it in the Annex: "Additional Statistical Tables"pp. 105-148.
/1 For the characteristic which are seldom important for CIs, a comparativepicture can be drawn only for SMLIs. Such characteristics include yearof commencement of production, use of power equipment, paid employeesother than production workers, detailed input categories, resale of goods.
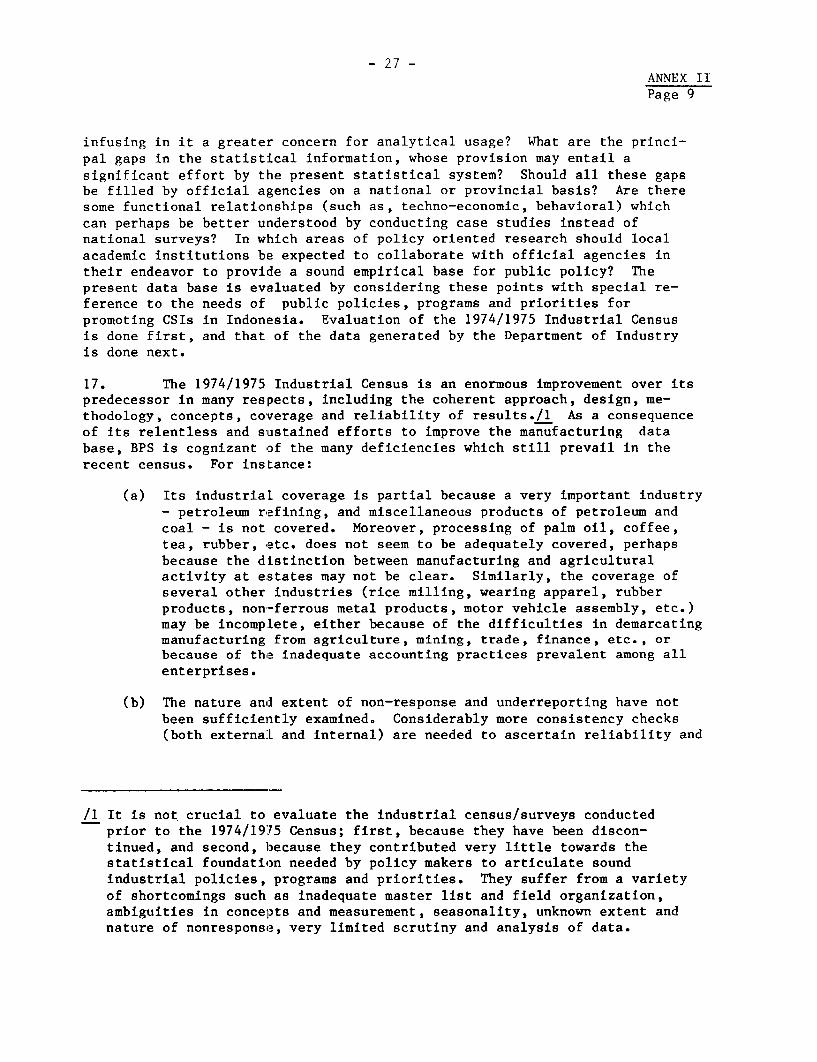
- 25 -ANNEX IIPage 7
SIs MLIsCharacteristics Unit Tape Pub. Tape Pub.
Total number of establishments no. 43,381 48,186 7,386 7,091Total number of using power no. 324 341 4,259 4,308
Total number of persons engaged (000) 329.73 343.24 691.53 667.59Total number of paid emp:Loyees " 254.35 269.00 684.46 661.70Total number of unpaid workers " 72.38 74.24 7.07 5.88
Total number of mandays mln 54.66 n.a. 164.39 163.02
Total wages & salaries bln Rp 15.56 16.30 93.72 93.29
Total inputs " 98.56 104.53 816.92 816.84
Total outputs " 149.44 157.56 1,303.79 1,293.79
Census value added 50.88 53.03 486.87 476.95
In general, the data on SIs do not differ significantly, but the data on MLIsconsiderably differ for most characteristics, particularly on the value addedand output. These differences may be due to differences in the estimationprocedures used by the Mission and BPS, or due to pre-publication editing doneby BPS, or both.
B. lidequacy of the Present Data Base
13. Sound policy decisions depend on accurate information, and the rele-vance and adequacy of iniormation changes with the changing needs of a country.Indonesia formulated and implemented Repelita I and II on the basis of theof the statistical information available until recently. Repelita III posesnew challenges, and implementation of its industrial development programsneeds new, more accurate monitoring system. The development programs ofRepelita I, II and III will constitute a basis for formulating subsequentplans which will need even more improved statistical information system.Improvement of a statistical data base is gradual and often more complex andtime consuming than is generally assumed. After briefly describing and eva-luating the existing manufacturing data base, the Mission sketches the dimen-sion of a possible manufacturing data base necessary for meeting Indonesia'sindustrial development needs.
Description of the Data Base
14. The main sources of statistical information on manufacturing sectorare the industrial censuses/surveys carried out by BPS, mostly annually, overthe last decade and a ha].f. The first industrial census was conducted in 1964,

- 26 -
ANNEX IIPage 8
and the second in 1974/1975 whose results were published during September-December 1978./1 The latest survey for which results are now availablerelates to 1977, but it covers only MLIs. The first survey of SIs, subse-quent to the 1964 Census, was conducted in 1969 and then annually until 1974.In 1974/1975, however, an industrial census was conducted in which establish-ment coverage was extended, probably for the first time, to include all CIs.These censuses/surveys cover data on number of establishments, employment,value added, gross output, etc. by segments (such as CIs, SIs). Moreover,BPS has been intermittently conducting the national socio-economic survey(SUSENAS) for a long time. The recent SUSENAS assembled statistical inform-ation directly pertaining to manufacturing activity, such as employment byeconomic activity/status, consumer expenditure on manufactured (and otherproducts. The ongoing 1979 SUSENAS also encompasses data assembly on CIssimilar to that of the 1974/1975 Industrial Census./2
15. Besides BPS, the Department of Industry has been assembling manu-facturing data at least since the early seventies through its vast networkof regional (provincial/district/sub-district) offices. The mission finds itvery difficult to describe this data base as the information on concepts,measurements, methodology, evaluation, etc. is not available. The data per-taining to various facets of the manufacturing activity are periodicallygathered by the Department for "monitoring and policy purposes." Por in-stance, the data on prices, production and employment are gathered weekly on47 major commodities. Similar data are gathered quarterly on 32 importantindustries. Some provinces seem to be gathering similar data on a monthlybasis. The quarterly data gathering exercise appears to be most comprehen-sive as it completely enumerates not only MLIs or SIs but also CIs, and theinformation sought virtually covers the same general ground as that of anindustrial census/survey conducted by BPS. Moreover, information is alsogathered quarterly, in some provinces even monthly, regarding problems facedby a manufacturing establishment in its operations.
Evaluation of the Data Base
16. The questions raised by the existing data collection and assemblyprocedures are: whether the available data meet the usual considerations ofconsistency, reliability, validity, timeliness, etc. Are there any missinglinks which can be easily provided by the existing statistical system by
/1 Except for the agro-processing and manufacturing activity at estatesfor which the report is not yet published.
/2 BPS also periodically assembles data on production and prices ofselected manufactured products as well as on the index of manufac-turing production for selected industry groups, besides others.Since these statistics are not assembled by the manufacturingsegments, they are not reviewed here.
- 27 -ANNEX IIPage 9
infusing in it a greater concern for analytical usage? What are the princi-pal gaps in the statistical information, whose provision may entail asignificant effort by the present statistical system? Should all these gapsbe filled by official agencies on a national or provincial basis? Are theresome functional relationships (such as, techno-economic, behavioral) whichcan perhaps be better understood by conducting case studies instead ofnational surveys? In which areas of policy oriented research should localacademic institutions be expected to collaborate with official agencies intheir endeavor to provide a sound empirical base for public policy? Thepresent data base is evaluated by considering these points with special re-ference to the needs of public policies, programs and priorities forpromoting CSIs in Indonesia. Evaluation of the 1974/1975 Industrial Censusis done first, and that of the data generated by the Department of Industryis done next.
17. The 1974/1975 Industrial Census is an enormous improvement over itspredecessor in many respects, including the coherent approach, design, me-thodology, concepts, coverage and reliability of results./l As a consequenceof its relentless and sustained efforts to improve the manufacturing database, BPS is cognizant of the many deficiencies which still prevail in therecent census. For instance:
(a) Its industrial coverage is partial because a very important industry- petroleum refining, and miscellaneous products of petroleum andcoal - is not covered. Moreover, processing of palm oil, coffee,tea, rubber, etc. does not seem to be adequately covered, perhapsbecause the distinction between manufacturing and agriculturalactivity at estates may not be clear. Similarly, the coverage ofseveral other industries (rice milling, wearing apparel, rubberproducts, non-ferrous metal products, motor vehicle assembly, etc.)may be incomplete, either because of the difficulties in demarcatingmanufacturing from agriculture, mining, trade, finance, etc., orbecause of thie inadequate accounting practices prevalent among allenterprises.
(b) The nature and extent of non-response and underreporting have notbeen sufficiently examined. Considerably more consistency checks(both externaL and internal) are needed to ascertain reliability and
/1 It is not- crucial to evaluate the industrial census/surveys conductedprior to the 1974/1975 Census; first, because they have been discon-tinued, and second, because they contributed very little towards thestatistical foundation needed by policy makers to articulate soundindustrial policies, programs and priorities. They suffer from a varietyof shortcomings such as inadequate master list and field organization,ambiguities in concepts and measurement, seasonality, unknown extent andnature of nonresponse, very limited scrutiny and analysis of data.
- 28 -
ANNEX IIPage 10
validity of the data. Such checks will involve (but not confinedto) greater use of the data on household consumer expenditure,imports, agricultural and mineral production, labor force surveys,etc./I
(c) Nonavailability of the data on mandays, wages and salaries andlocation by rural/urban areas regarding SIs is quite conspicuous./2
(d) Statistical analyses such as by size class of employment, by estab-lishments using or not using power equipment (use of power can be asurrogate measure of capital intensity), by commencement year ofproduction have not been done, although information, solicited inthe census and already processed, lends to such analyses.
(e) The duration and reference period of the field inquiry for the threesegments of the manufacturing sector (CIs, SIs and MLIs) are suchthat they do not lead to any common period of time. Moreover,results on SIs are not immune from seasonality because both thereference period and the field operations were confined to onlythree months.
(f) The labor force is often engaged in CIs on a partime time basisbecause it participates in other economic activities such asagriculture, trade. The information on participation in otheractivities is essential for an accurate assessment of laborproductivity, work intensity and earnings./3
(g) The master list of manufacturing establishments showing their uni-verse may be deficient particularly regarding the coverage of SIs asapparent from the recent field work done by BPS in two or moreprovinces.
/1 The wide discrepancy in the estimates of value added in manufacturingactivity is apparent from a comparison of the GDP originating in themanufacturing sector, as reported in the national accounts and in the1974/1975 Census which excludes several important activities mentionedabove. The former being almost 50% more than the latter. Reconciliationof these two estimates will involve substantial effort, but will be worththe cost. The Department of Industry in collaboration with BPS shouldundertake this task.
/2 The information on these characteristics, solicited in the questionnaireon SIs, is useful for policy-oriented analysis.
/3 This assessment is also handicapped by defining full time participationonly in terms of the number of mandays in which a person worked for fiveor more hours. Even with additional data processing the census will notlead to an accurate measure of work intensity.

- 29 -
ANNEX IIPage 11
18. The evaluation of the vast amount of data periodically compiled bythe Department of Industry through its field offices at various levels ofgovernment can be summarily done as the program seems to be lacking a tech-nical approach in virtually all its stages: planning, designing, concepts,methodology, field operations, data processing, editing, analysis, end useand so on. /1 The overall quality of the data assembled by the Departmentneeded so much improvement that the Mission had to forego its use. Forinstance, the guidelines issued for this purpose were ambiguous; theconcepts and measurements were not defined. Also, the assembled data did notuniformly relate to the same manufacturing segments, nor was the consistencybetween these segments by various characteristics (that is, employment,value added, etc.) always maintained. The unit of quantity or valuation wasoften missing. The data were hardly scrutinized for completeness andinternal consistency. Annual fluctuations in the number of establishmentsand employment at provincial level were often incomprehensible./2 Finally,the response was quite delayed and poor since only 13 provinces (out of 26)responded, over a period, of several months. /3
19. Besides the abovementioned periodic generation of manufacturingdata there have been other studies that have generated data on certainfunctional relationships in the manufacturing sector. For instance, BIPIKpublished 21 or more project profiles which contain information on relation-ships such as input-output, capital-labor. However, the reliability of theprofiles showing norms is sometimes questionable because little seemsto be known about the assumptions, methodology, sources of engineering andother data used, which constitute the empirical basis of those prototypemodel projects in the small industry segment./4
/1 Moreover, there appears to be a considerable overlap with BPS in thecollection of statistical information; the latter, however, is essen-tially managed and run by technical and experienced statisticians.
/2 Out of 4,400 MLIs, a province lost 2,000 units in one year. Anotherprovince lost and gained 400 SIs (out of 1,200) in the two consecutiveyears. The average number of persons engaged per MLI varied from 11to 18 in some provinces although by definition, no MLI should have lessthan 20 persons engaged in it.
/3 A portion of the assembled data are presented in Annex Table 19 whichshows that the data from three or four provinces could not be used at all.
/4 The Department of Industry also sponsored studies on regional developmentpotential, one in each province done by a local university. A scanningof a few studies and their limited follow up did not enlighten a readerabout the empirical foundation of certain functional relationships (usedtherein.

-30-
ANNEX IIPage 12
Some Suggestions for Improving the Data Base
20. The above discussion clearly indicates that Indonesia's existingmanufacturing data base is extensive but needs considerable improvement for itto be useful to decision makers for promoting CSIs. Even the recent industrialcensus does not provide data on capital/labor-skill intensities, it does notcover the entire manufacturing activity, and its data are often insufficientlydisaggregated to provide an adequate base for policy oriented analysis.Virtually little is available on demand for manufactured products, or linkagesbetween various manufacturing segments, or on marketing or procurement ofindustrial goods. Most importantly, no accurate time-series data are availableon industrial employment or investment. Further, very limited data seem to beavailable at establishment level or on functional relationships to support theempirical foundation of the national industrial development plans.Government's inability to meet its industrial employment target in Repelita IIalso suggests that the policy makers may wish to assign a high priority forimproving the empirical basis of their decisions to ensure an effectiveformulation, monitoring, evaluation and implementation of the programs andpolicies./1
21. The best institutional arrangement for improving the data base seemsto be a joint effort by BPS, Department of Industry and BAPPENAS in collabora-tion with research institutions, manufacturers' associations, etc. whereincomparative advantage of each one is fully exploited to further the nationalinterest. In particular, BPS as the principal data generating agency possessesthe professional expertise and experience needed for periodic collection ofbasic industrial statistics. It also possesses the necessary resources fortimely processing and editing of the data, though they will have to beaugmented in order to meet its additional responsibilities. The Department ofIndustry as the principal user agency can ensure that the statistical informa-tion needed by it is collected, processed, edited, analyzed, and made availableto policy makers in a useable form. Because of its continuous contacts withmanufacturing units, the Department can also help BPS in updating its masterlist or universe. BAPPENAS as the central planning and budgeting authority canensure that resources allocated for the aforesaid data improvement effort areconsistent with overall national priorities. It can also ensure that the dataimprovement plan appropriately subsumes the implications of inter-sectoralinterdependence so as to meet the needs of other official agencies as well,besides the Industrial sector. Perhaps an Inter-Departmental Steering Group,drawn from the top management of these three institutions may be established toevolve and oversee broad guidelines, basic principles and overall priorities.This Steering Group may be supported by an Inter-Departmental Technical Groupwhich will provide the necessary technical guidance and oversee implementationof mutually agreed programs.
/1 Performance of a Repelita depends on numerous factors whose considera-tion is beyond the scope of this report. Significance of the industrialemployment is briefly stated in Chapter 2 of the Main Report.

- 31 -ANNEX IIPage 13
22. The aforesaid joint effort of the three official agencies needs tobe supplemented by drawingt upon the resources of certain non-officialagencies. For instance, it can be far more cost effective to contract localacademic or research institutions to conduct certain studies than to conductthem in-house by either of the official agencies./I In general, studieswhich are exploratory in nature, which are not periodic, which involvelimited field operations, which need in-depth analysis of complex relation-ships and so on may be most appropriate for contracting to these institu-tions. For instance, studies on economies of scale, effective protection,economic efficiency, comparative advantages, etc. can be suitably formulatedand implemented only if designed and conducted by experts in the respectivefields. But the user agency must be clear on the objective and scope ofwork in these studies and should draw up the terms of reference for themand monitor the program on. the studies contracted out. Finally, it will bedesirable to forge close links with manufacturers' associations, chambers ofcommerce, etc. partly to ensure that government's data gathering operations donot unduly divert manufacturers' attention from their prime concern, namely,manufacturing operations, and partly to ensure their full cooperation inimproving the manufacturing data base.
23. An effective implementation of the above scheme will entail im-portant changes both in BPS and the Department of Industry. Perhaps afundamental weakness of manufacturing data gathered by BPS stems from thepresent organization of its field operations where responsibility isessentially allocated by geographical areas and not by kind of field inves-tigation, such as manufacturing, agriculture, household inquiries./2 Nowalmost all the 3,000 field investigators collect manufacturing statisticsand only a few among them may fully comprehend the complexities of a manu-facturing enterprise. For instance, no data on investment and capital stockwas collected even in the 1974/1975 Census, probably because the pilot studyrevealed that the field staff had to be far more familiar with businessaccounting practices for eliciting the appropriate information. Ricemilling, cleaning and poliShing in CSIs was not fully accounted, probably
/1 Also the end product can be of a better quality because of the use ofmost appropriate (perhaps latest) methodology, conceptual refinementsand broader perspective. Moreover, academic/research institutions arethe source of supplying qualified and trained professional staff toofficial and other agencies. Through those contracts these institutionscan strengthen their capability to provide the training and experiencethat are needed by the government staff for conducting economic andstatistical analyses.
/2 Though it is administratively convenient and may have served BPSeffectively until now, it is not entirely satisfactory from atechnical angle especially in the context of collecting complicatedmanufacturing data which have not been available to date.

-32-
ANNEX IIPage 14
because a small manufacturing unit usually does not maintain proper accountingrecords, which cannot be constructed without an expert's assistance. Agro-processing and manufacturing activities in plants at estates were notappropriately integrated with the similar activities in plants outsideestates, probably because demarcation between manufacturing and agriculturalactivity was beyond the capability of most field staff.
24. Can the aforesaid shortcomings of the present manufacturing statis-tics be overcome? Probably yes, provided field staff is intensively andeffectively trained in manufacturing statistics and survey methodology to-gether with data collection techniques. And such a training can be impartedby only a small team of field workers, say 100 to 200, for whole Indonesia. Aswith any developmental effort, strengthening of field operations is not a onetime task; it is a continuing process involving continuous improvement throughformulation, implementation, monitoring, evaluation and reformulation.Moreover, the field operations should be directly guided by BPS to ensureuniform standards and methodology. More quality check procedures should beestablished for field operations with a provision for referring back torespondents, whenever necessary. The proposed reorganization of BPS, which isawaiting a Presidential Decree, if it comes through, may facilitate theabovementioned strengthening of the field operations, besides furtherstrengthening its heaquarters staff, particularly in the area of statisticalanalysis.
25. A review of all the periodic manufacturing surveys (quarterly,annual, quinquennial and decinnial) now conducted by BPS will be needed toensure that all the four segments of manufacturing sector (that is, CIs,SIs, MIs, and LIs) are periodically covered through suitably modifiedquestionnaires and field procedures. In particular, CIs should be coveredannually through SUSENAS as planned in 1979 and through an industrialcensus as done in 1974/1975, only every five years or so, mainly becausethe reporting unit (a household) may be engaged in multi-sectoral productiveactivities instead of almost exclusively in manufacturing. SIs should beannually covered through a sample survey. MLIs should have a shorter ques-tionnaire for their annual survey to reflect a more realistic balancebetween data collection and statistical analysis./1 In general, the detailedinquiry may be conducted only once every three to five years. Periodically,however, a special sample survey should be conducted to collect informationon characteristics whose measurement is more problematic than those covered
/1 For instance, the size of the questionnaire (now having about 500 dataelements) can be drastically reduced if the main objective of thesurvey is to provide annual data on broad economic characteristicssuch as employment, wages and salaries, investment, value added, grossoutput. The itemized detailed information on employment, inputs, output,etc. is seldom used except for constructing an input-output table orconducting a special study, none being annual.

- 33 -ANNEX IIPage 15
in a routine annual survey./l Further, as a practical approach to maximizeeffectiveness of limited resources that can be allocated for improving manu-facturing statistics, one should take advantage of the regional concentrationin manufacturing activity as well as of the sophisticated sampling proce-dures./2
26. The recent reorganization of the Department of Industry should beconducive to a thorough evaluation of its role in improving the manufacturingdata base. The Department recognizes that a pragmatic and professionalapproach to the statistical information system will be essential to meet mosteffectively the new challenges it faces as Indonesia's industrial base becomesmore and more sophisticated over time. The industrial policy makers, morethan ever before, need the statistical information distilled through rigorousdata evaluation and sound economic analysis. Perhaps the best the Depart-ment can do in this area is to concentrate on this vital area of work whichseems to be a neglected link to date between generation of abundant basicdata and its limited use *by the policy makers. In order to fully digest theimplications of thousands of numbers produced periodically and to feed backeffectively to correct any deviation from expected path and incorporatefurther improvements, the policy makers need a strong support from a core ofeconomic and data analysts. The statistical information, even if it isabundantly available in an improved form as suggested above, will not, byitself, be of much use to policy makers unless the Department simultaneouslyintensifies its input into quantitative analytical studies. It is, there-fore, anticipated that the new Planning and Statistics and the PolicyPlanning Bureaus will assign high priority to strengthen its analyticalcapabilities.
27. The Department should discontinue periodic collection of routinebasic statistics, which can be done more effectively by BPS as suggestedabove./3 Moreover, BPS as a statistical agency that guarantees complete
/1 For instance, knowledge regarding the size of installed capacity, theextent of its utilization, the causes and consequences of underutiliza-tion in manufacturing establishments should assist the government inmonitoring the effectiveness of its investment policies. Such a studycannot be meaningfully conducted without participation of a specialized,well-trained and experienced staff.
/2 For instance, every periodic survey (and more so special studies) may notbe conducted in every province, and overlapping samples may be used inevery two consecutive rounds of a survey.
/3 This suggestion should apply to almost all periodic collections. If BPSis currently not collecting information that is periodically needed bythe Department, BPS will be expected to take all necessary steps in accor-dance with the directions to be issued by the suggested Steering Group.

- 34 -
ANNEX IIPage 16
confidentiality of data to all reporting units and is perceived to maintaincredibility among them, should be in a better position than any administra-tive functional department to have access to "correct information." Mis-reporting or distortions in statistical information cannot be completelyeliminated. But their seriousness and extent can be reduced by adoptingappropriate measures including an effective use of a non-administrativeofficial agency. It is then clear that BPS should not be expected, underany circumstances, to divulge information in a way that an individualreporting unit can be identified. For the sake of preserving the confi-dentiality of BPS data and for some other reasons, the Department maycollect basic manufacturing statistics which is of special operationalinterest to it. For instance, while monitoring the implementation offinancial and technical assistance programs, it may like to have inform-ation not only at district or sub-district level but also at establishmentlevel, with full identification. It may require statistical informationfor some urgent policy considerations (say, arising from a new monetarypolicy) at such a short notice that BPS cannot deliver it in time (suchinstances, of course, are not always avoidable).
28. It is apparent that the planning and budgetary implications ofthe abovementioned suggestions will have to be worked out in detail. Atthis stage, nonetheless, some points are mentioned to abet serious thinking,expedite action and ensure effective implementation of urgently neededimprovements in manufacturing data base. For instance, intensive trainingof field staff will require personnel for training, who, in turn will re-quire considerable time for planning, designing and other necessary prepa-ration; field staff may need motor vehicles and also telephones, because ofthe larger geographical coverage and possibly follow up visits to a report-ing unit; pilot studies may be necessary for almost all special studies, andeach study will require adequate staff support even if it may be contractedto a university; new demands will be created on the data processing faci-lities, not only for processing basic data but also for editing and analysis;better planning and coordination may be necessary to ascertain that differentstages of the information system, from planning of a survey to designing thequestionnaire, to analysis of the data, are well integrated; establishing acore of sound economic and data analysts requires considerable lead timeand these analysts, in turn, need well-trained supporting staff.

ANNEX III
INDONESIA
COTTAGE AND SMALL INDUSTRY IN THE NATIONAL ECONOMY
Research and Development (R&D) Institutes of the Department of Industry
Table of Contents
Page No.
Introduction .... . . . . . . . . .. .... . . . . . . . . 1Principal Activities and Clients ... . . . . . . .. . 3
Organization and StafEing ... . . . . . . . .. . 4Promotional Measures .... . . . . . . . . . . . . . . . . . . 4
Budgetary and Financial Problems ... . . . . . . . . . . ... 5Foreign Aid and Technical Assistance Requirements . . . . . . . 6
Industrial Research Iastitute (Jakarta) . . . . . . . . . . . . 6
Chemical Research Institute (Semarang) . . . . . . . . . . . . . 7
Leather Research Institute (Jogjakarta). . . . . . . . . . . . . 8
Batik and Handicraft Institute (Jogjakarta) . . . . . . . . . . 9
Cellulose Research Institute (Bandung) . . . . . . . . . . . . . 10
Metal Industries Development Center (Bandung) . . . . . . . . . 11
Chemical Research Institute (Medan). . . . . . . . .. . 12
Chemical Research Institute (Surabaya) . . . . . . . . . . 12
Chemical Research Institute (Bogor) . . . . . . . . . . . . . . 12
Chemical Research Institute (Banjarbaru) ... . . . . . . .. . 13Materials Testing Institute (Bandung) . . . . . .. . . . 13


- 35 -ANNEX IIIPage 1
RESEARCH AND DEVELOPMENT (R & D) INSTITUTES OF THE DEPARTMENT OF INDUSTRY
A. Introduction
1. The Department of Industry (DOI) controls and finances 14 R & Dinstitutes consisting of 7 major industrial research institutes (Batik andHandicraft, Ceramics, Chemicals, Leathers, Materials, Pulp and Paper,Textiles), and 6 smal:l regional ones, mostly chemical research institutesengaged in testing, quality control, and advisory services. In addition,an annually funded project (the Metal Industries Development Center inBandung) also comes under the control and budget of the DOI./1
2. The recent establishment of a Directorate General of Planning andDevelopment in the DO]: is one more effort at the departmental level tocoordinate and synchronize activities of the 14 institutes under DOI'sjurisdiction. Apart from sharing a common source of funding, these 14institutes operate more or less independently of one another and too oftenare isolated from the main industrial extension activities. And yet, asnoted in Volume I of t:his report, present industrial extension services haveto rely on the technical support of these institutes. Only since 1974, whenBIPIK was established, did some of these institutes begin to recognize theirrole in industrial development, i.e. to develop and transfer appropriatetechnology. As the notes below indicate, the majority of these industrial aR&D institutes are sti'll developing their industrial extension services andon the whole have not yet succeeded in developing the technology suitable forlocal and small industry. Closer coordination of activities is a first steptowards a better focussed and more effective technological help to smallindustry.
3. To promote coordination of institutes, however, it is necessary toassess their essential functions, organizational capability, relativestrengths and weaknesses. Since a mission of four weeks cannot fully andfairly evaluate each institute individually or as a whole, the following notesonly highlight the type of functions performed and problems faced by theseinstitutes. To obtain data for this preliminary assessment, a fairly compre-hensive questionnaire was sent to all 14 institutes and other field extensionservice agencies under DOI. Nearly all (11 out of 14) R & D institutes sentin replies with supporting documents (annual reports, brochures, pamphlets)describing in some detail their main activities over the last three years. In
/1 There are over 100 technological institutes throughout the countryemploying nearly 2,O00 staff. Although located in various regions manyinstitutes have identical and overlapping functions. The IndonesianInstitute of Science (LIPI) was therefore established to coordinateactivities of the various R & D institutes in the field of science andtechnology at the national and regional levels. Such coordination efforthas, however, not diminished the duplication of efforts characteristic of
the various institutes, due to a complex set of organizational, policy,budgetary and other factors which are beyond the scope of this annex.

ANNEX i IiPage 2
INDONESIm Selected Characteristics of Eleven (11) Research and Development Institutes I/
1 2 3 4 5 6 7 8 9 10i. Types of Services Provided (1) a'
a) Labor-tory TeatliS/PIlot pl-nts 50 40 62 10 40 20 70 60 60 63 50b) Research 30 20 25 10 40 20 20 20 20 32 20c) Industrial extension Services/Tr-aining 20 40 13 80 20 60 10 20 20 5 30
11. Clients Serveda) Government Ageocles/ltate Enterpri.e. 70 60 5 5 50 10 65 60 15 40 70b) Private Egterprisee 30 40 95 95 50. 90 35 40 85 60 30
III. Total Staffing (no. of workers) 101 57 206 108 246 169 23 14 112 29 134a) college gr-duates 13 21 n.a. 6 29 52 11 8 21 4 27b) High School and below 88 36 n..A 102 217 117 12 6 91 25 107c) Trained extension wrkers n.a7 5 0 0 25 0 2 0 1 0
iV. Promotional Measures (Yes/No)a) Printed media (pamphlets, brochures, journ-1.) Yes Yen No No Y.e Yes Yes Yes Yes Yea Nob) Lectures, eminars, exhibito No yes - Yes Yes Yes Yes Yes Yer Yea Ye. Venc) Plant vLaLts Ye. Yes Yes Yea yes yes Yes Yes Yes Yao YeT
V. Source of Funds eod Earnings (Rp million) 1976/77 197817S 1978/79 1977/78 1977/78 1977/78 n.a. 1977/78 1977/78 1977/78 1977178a) Covernment udgect 46.1 94.3 380.0 15.0 225.0 319.8 ne . 103.6 117.5 40~7 8ib) Self-generated U.S. 3.0 53.0 43.5 30.0 - na. 25.0 20.0 1.2 n.e.
Sub-total 46.1 97.3 433.1 58.5 255.0 319.8 n.a. 128.6 137 5 42.0 240.0c) Returned to Treasury n.a. 1.3 10.2 .S. n. A. - n.a. n.-. n..a 0.2 n..-
VI, Foreign Aid Received (Yes/No) Yes no No No yes yes No No Ye. No Yes
VlI. Regular Subacriptione to Scientific Journals (Yes/No) No No No No No Yes No No Ye$ No No
VIII. Renking ,f Kain Problemsa) Budgetary/slaries 2 3 3 2 2 2 3 1 1 2 2b) Inadequate st5ffi0g 1 2 1 3 3 3 1 2 2 1 1c) Lck of modern technology 4 4 2 5 4 5 5 5 4 4 4d) Lack of adequate equipment 3 1 4 4 5 4 4 1 5 1 3e) other (organfeational nolicy, et.) 5 5 5 1 1 1 b/ 2 4 3 5 5
1/ souce- Date based on replIes to the mission's Questionnaire.
*/ Mission's estimate based on budget, manpower end otber operstionhl dat
b/ Relates to ditfticulties encountered by field extension workers. e.g. lad of access to investmut credit, policy disincentives, resistance of entrepr-enersto change traditional production methods, tc.

- 36 -
ANNEX IIIpage 3
the table below, the highlights of these replies are presented to show thesalient characteristics of these institutes. Through these replies it ishoped that the beginnings of a more profound assessment of R&D institutescould be made as part of the government's drive to improve the technologicalassistance to the CSI sector. This assessment should also evaluate theprogress made by these institutes in identifying and developing Technologythat is appropriate to local conditions.
B. Principal Activities and Clients
4. The majority of respondents to the Questionnaire (7 out of 11)indicated that at leaEst 50% of their activities is involved with laboratorytesting of various industrial raw materials and finished products. Food,beverages, chemicals, and other agricultural products account for over 70%of products tested. This is said to be a legally required function in linewith one of the original aims of R & D institutes, namely, to providelaboratory testing services to industries and government agencies in chargeof testing products sold in the market either for licensing purposes orconsumer protection. As a result, the majority of clients served by 6 of theinstitutes are government agencies, principally the DOI, Department of Trade,Local Governments, Departments of Agriculture, Public Works and the ArmedForces. Largescale state-owned enterprises engaged in productioni of cement,fertilizer, textiles, oil products, and minerals are also frequent clients ofR & D institutes and t:hus avail themselves of the low-cost testing servicesoffered by these institutes.
5. The technological needs of the private sector, particularly CSI,therefore have not been the main concern of many institutes. This is due inpart to the reasons mentioned above, but due also to the structural changesin demand for improved technology in recent years. Since the enactment ofthe Foreign (1967) and Domestic (1968) Investment Incentives Acts, Indonesiawas able to attract industrial investors from abroad who brought with themmodern technology and quite often foreign technicians, who had no need for
the often antiquated laboratory techniques and services offered atgovernment-owned institutes. Similarly, the medium and large industriesfounded by domestic investors tended to rely also on foreign equipment andtechnology in order to compete with foreign owned companies. This left onlythe much smaller (in investment and output terms) CSI sector which lacksaccess to foreign capital and technology to the care of local R & Dinstitutes. While it is this smallscale sector that is in greatest need oftechnical assistance, most institutes have continued to cater to the needs ofall sizes of industries which were expected to bring their problems to theinstitutes. Industrial extension for many institutes represents only 5-20%of their activities, and as a result, only a small number of small-scaleproducers are reached.
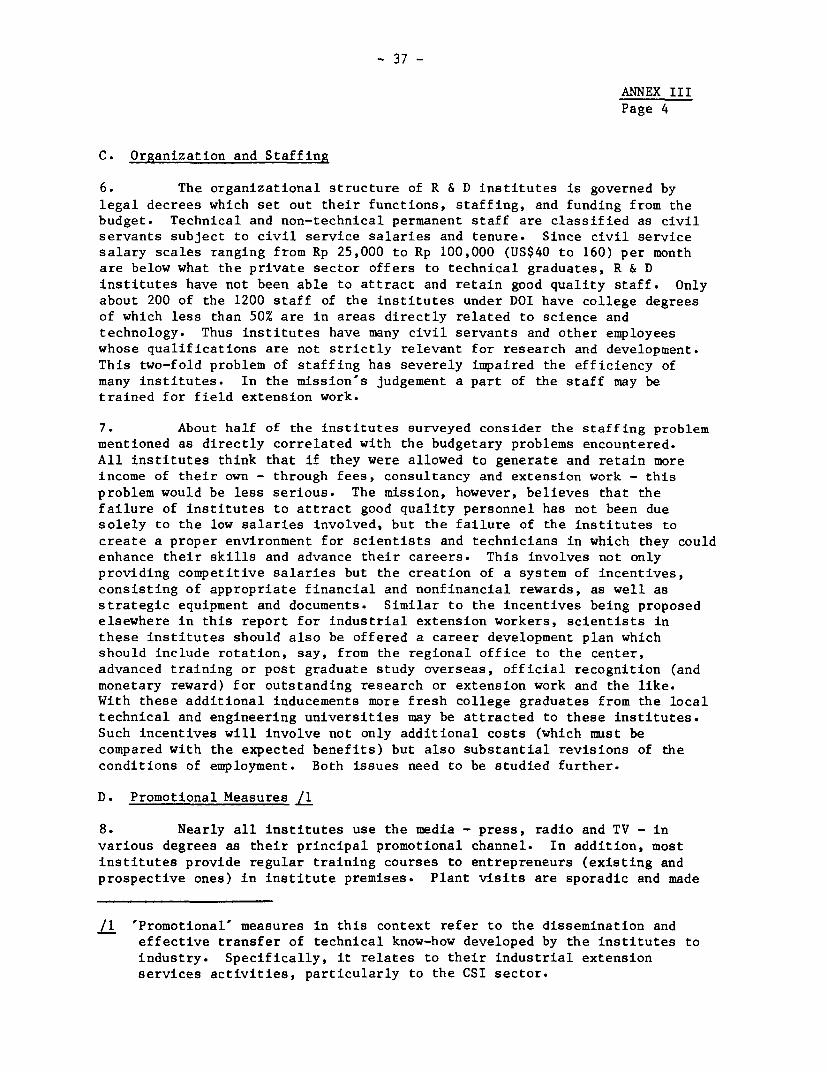
- 37 -
ANNEX IIIPage 4
C. Organization and Staffing
6. The organizational structure of R & D institutes is governed by
legal decrees which set out their functions, staffing, and funding from thebudget. Technical and non-technical permanent staff are classified as civil
servants subject to civil service salaries and tenure. Since civil servicesalary scales ranging from Rp 25,000 to Rp 100,000 (US$40 to 160) per monthare below what the private sector offers to technical graduates, R & D
institutes have not been able to attract and retain good quality staff. Only
about 200 of the 1200 staff of the institutes under DOI have college degreesof which less than 50% are in areas directly related to science and
technology. Thus institutes have many civil servants and other employeeswhose qualifications are not strictly relevant for research and development.
This two-fold problem of staffing has severely impaired the efficiency of
many institutes. In the mission's judgement a part of the staff may betrained for field extension work.
7. About half of the institutes surveyed consider the staffing problemmentioned as directly correlated with the budgetary problems encountered.
All institutes think that if they were allowed to generate and retain more
income of their own - through fees, consultancy and extension work - this
problem would be less serious. The mission, however, believes that the
failure of institutes to attract good quality personnel has not been duesolely to the low salaries involved, but the failure of the institutes to
create a proper environment for scientists and technicians in which they could
enhance their skills and advance their careers. This involves not onlyproviding competitive salaries but the creation of a system of incentives,
consisting of appropriate financial and nonfinancial rewards, as well as
strategic equipment and documents. Similar to the incentives being proposedelsewhere in this report for industrial extension workers, scientists in
these institutes should also be offered a career development plan whichshould include rotation, say, from the regional office to the center,
advanced training or post graduate study overseas, official recognition (and
monetary reward) for outstanding research or extension work and the like.With these additional inducements more fresh college graduates from the local
technical and engineering universities may be attracted to these institutes.
Such incentives will involve not only additional costs (which must be
compared with the expected benefits) but also substantial revisions of the
conditions of employment. Both issues need to be studied further.
D. Promotional Measures /1
8. Nearly all institutes use the media - press, radio and TV - in
various degrees as their principal promotional channel. In addition, most
institutes provide regular training courses to entrepreneurs (existing and
prospective ones) in institute premises. Plant visits are sporadic and made
_1 'Promotional' measures in this context refer to the dissemination andeffective transfer of technical know-how developed by the institutes to
industry. Specifically, it relates to their industrial extensionservices activities, particularly to the CSI sector.

- 38 -ANNEX IIIPage 5
only when requested by other government agencies to investigate plantfacilities, processes, or product quality for possible infractions. Thereare, however, some exceptions (e.g. the MIDC, the Leather Institute) ofinstitutes that conduct regular visits to enterprises for the purpose ofextending assistance, but these too have limited impact due to the shortageof trained extension workers and travel funds. For instance only 5 out of 11institutes surveyed had any trained extension workers among their staff.Many of the institutes, moreover, felt that technical extension work andfield visits are the primary responsibility of BIPIK.
9. Since small--scale industries are located in scattered areas,sometimes in small groupings or "clusters", there is a limit or thresholdbeyond which promotion of technological information or guidance would befruitless. Therefore., actual extension visits and follow-up should beselective and concentrated on the more promising enterprises that could"absorb" the advice gLven. For the majority of enterprises, wider distribu-tion of brochures and pamphlets, presented in simple language and graphics,would probably suffice bearing in mind the generally low cognitive skills ofmany small entrepreneurs. Budget funds should be allocated for this purpose.Less than 5% of the budget of institutes to date is devoted to the dissemina-tion of scientific inEormation through the media. Similarly, hardly any fundare allocated to buy regular subscriptions to foreign scientific journalssome of whose articles may be adopted to local use and translated for widercirculation. As the table illustrates, only 2 of the institutes surveyed hadany regular subscription to such journals.
E. Budgetary and Financial Problems
10. The budgetary problem faced by the R & D institutes seems to be notso much the lack of funds but the difficulty of withdrawing approved budgetfunds from the Treasury. For current expenditures such as staff salaries andmaterials, the budgets allocated seem to be on the whole adequate. Fordevelopment purposes, there may be shortages of funds sometimes, but most ofthe institutes, due to poor staffing and lack of clear work programs, alsohave a limited capacity to formulate and implement development projects.Besides, the majority of institutes feel that they possess sufficient equip-ment and technological know-how for the type of demands made on them, andtherefore see the need for modernization and expansion as of low priority.(See Table in this Annex, which indicates that lack of equipment and tech-nology is ranked low in the list of problem areas.) The mission tends to agreewith this judgment, but would prefer to leave this issue to the judgment oftechnical experts after a more indepth study.
11. A common feeling shared by all institutes in relation to thebudgetary problem is the need to review or revise the present ruling thatnet earnings should be returned to the Treasury. This is a well-justifiedrule, inasmuch as nearly 100% of the funding of institutes comes from theTreasury. On the other hand, there are a few institutes that could reapadditional benefits (e.g. hire better qualified staff, expand promotional

- 39 -
ANNEX IIIPage 6
efforts, improve facilities, etc.) if allowed to retain mos, or Lil oftheir self-generated incomes. In any case, a review of this regulation toadapt it to changing demand for technical services is necessary, sincethis provision seems to be depriving several institutes of opportunitiesto expand their activities. One possibility that must be avoided is thatinstitutes do not become too commercialized and serve only the needs offull-paying clients or become full-fledged consulting companies when theyare allowed to keep all their own earnings.
F. Foreign Aid and Technical Assistance Requirement
12. Relatively small amounts of foreign technical and financial aid hasso far been channelled to R & D institutes. Aid donors have not channeled asmuch resources into R & D institutes as they have in other agencies. Themost significant - and visibly effective - foreign aid given so far has comefrom the Belgian Government to the MIDC, amounting to a total of $3.25 mil-lion. The bulk of this assistance is in the form of technical consultantswho helped build up the technical capabilities of MIDC and its staff indeveloping the local metal industries. The other 4 recipients of foreign aidreceived less than $1.0 million each to date, in the form of laboratory andproduction equipment for demonstration purposes. The greatest need thatforeign donors could meet is in the field of technical assistance., princi-pally expert advice in raw materials processing, intermediate technologysuitable to local skills levels, and overseas training. Establishment andmaintenance of scientific libraries for use initially by scientists andstudents, later on by entrepreneurs, would also be useful. Regular corres-pondence or linkages with international sources of scientific informationsuch as TECHNONET of Asia and ISO (International Standards Organization)could also expand the institutes' sources of current technical know-how.Structured overseas training and study tours, financed partly and arranged byhost countries would also help upgrade the quality of staff. Such toursshould be in more developed and in other Asian countries with similarindustrial structures as Indonesia.
13. In the following sections a description of some of the R & Dinstitutes is presented, showing their main functions and the type oftechnical assistance that they provide to the CSI sector.
(a) Industrial Research Institute (Jakarta)
14. The Industrial Research Institute (IRI) was established to providetechnological support to manufacturing industries throughout the country,conduct research on industrial products, design, and processes, as well asprovide product standards. About 80% of IRI's activities at present consistof product testing, mostly of an obligatory nature requested by othergovernment agencies responsible for licensing and for consumer protection.Over half (52 %) of products tested are samples of beverages sent from themarket by government agents to ensure compliance with quality standards; 26%are other food products, 13% soaps, detergents and cosmetics, and the balancerepresents testing of products voluntarily sent in by entrepreneurs.

- 40 -
ANNEX IIIPage 7
IRI operates a microbiological laboratory and a diesel engine workshop used
for regular 12 month courses on diesel mechanics. It trains an average of 28
persons a year. Due to lagging demand for its services IRI's laboratory and
other facilities appear underutilized (several pieces of new equipment still
remain to be installed).
15. IRI industrial extension services which represent about 28% of its
present activities are handicapped by lack of active promotion and
trained staff. Promotional measures consist of a limited number of brochures
and pamphlets distributed to other government agencies, sporadic plant visits
and lectures to entrepreneurs. IRI also publishes a Research Bulletin
quarterly but has only limited circulation. In 1976/77 short-term courses
were offered in the regions to entrepreneurs engaged in food technology, wood
processing and handicrafts by IRI staff. Most of IRI's staff of 101 workers
are nontechnical personnel (only 13 have degrees in science), but efforts
are being made to send 2-3 staff for overseas training yearly. Over 55% of
IRI's budget is absorbed by staff salaries and administrative expenditures,
leaving little else to Einance extension services work. IRI is just
beginning to work more closely with BIPIK, but lack of trained technical
extension workers among its staff will prevent IRI from expanding present
technical support to BIPIK. The small number of CSI in the Jakarta
metropolitan area will also continue to be a factor adversely affecting the
demand for IRI's services.
(b) Chemical Research Institute (Semarang)
16. The Chemical Research Institute of Semarang (CRIS) serves the whole
Central Java Region including Jogjakarta, where there is a heavy concentration
of small industries. Properly developed it could thus provide a great service
in assisting a significant number of CSI in technical matters. The rapid
growth of the number of CSI in the region has also accelerated the demand for
CRIS' technological services over the last three years, resulting in a 20%
increase in the number of products tested to 1,911 in 1978 over 1977 or more
than double the figure for 1976. About 40% of products tested were essential
oil products destined for overseas markets and 60% were manufactured products
food, beverages, medicines - that were sent in for testing and quality
determination by entrepreneurs. Applied research in response to local demand
is also conducted for instance in 1978 on shrimp processing, wine making,
cashew nuts and perfume essences. CRIS' industrial extension activities take
up roughly about 40% of its manpower time and 20% of its total budget (Rp 94
million in 1978/79). However, out of its total staff of 57 only 7 are
trained extension workers, and only 29 have any college background. CRIS
augments its staff by hiring local experts to help in its extension work. In
plant consultancy by CRIS costs Rp 500-Rp 1,500 per case, a very low fee
compared to going commercial rates. With the rise in demand for consulting
services, self-generated earnings (most of which have to be returned to the
Treasury) have also risen sharply from Rp 3.2 million in 1976 to Rp 6.6
million in 1978.

- 41 -
ANNEX IIIPage 8
17. CRIS appears to have the capability of handling an expandedindustrial extension program and is suitably located close to the site ofmany small industries that could benefit from its services. While itstesting and laboratory facilities are adequate for the present, a largernumber of extension workers, say an additional 15-20 who could devotefull-time to plant visits and consultations, plus additional vehicles toincrease staff mobility throughout the region appear to be neededimmediately. Financing these investments may be partly solved by allowingCRIS to retain some of its earnings for this purpose. Staff upgradingthrough overseas training in extension work may also ease presentdifficulties of hiring and keeping good quality personnel.
(c) Leather Research Institute (Joglakarta)
18. The Leather Research Institute (LRI) was established in 1936 tohelp develop the then budding leather industry. Located in Central Java,close to leather goods manufacturers and tanneries, LRI assists small, mediumand large industries in leather processing, tanning, quality control andproduction. Its facilities include a laboratory for testing leather quality,chemicals, and water used for tanning, a variety of machinery for leatherprocessing used for demonstration, a prototype cobbler shop and trainingequipment. The institute also provides consultancy services at Rp 2,500(US$4) per man-day for large enterprises and charges only material costs fortechnical assistance given to smaller enterprises. In addition it receivessmall orders for leather shoe manufacturing and supplies processed leather toother manufacturers. Its biggest customer is the Armed Forces whose ordersaverage about Rp 50 million a year.
19. Despite LRI's inability to hire and retain good quality staff,because it cannot offer salaries higher than the civil service, it seems tobe overstaffed for the type of services that it performs. There arepresently (1978/79) 214 staff including 30 non-civil service casual workers.LRI is organized into 5 departments as follows: Research (30 permanent and7 casual staff), Technology (72 and 5), Industrial and Economic Development(9 and 6), Extension Services (5 and 6), and General Administration (68 and6). Civil service employees of LRI receive salaries ranging from Rp 8,600 toRp 126,000 a month, and as a result most of them hold second jobs tosupplement income.
20. The institute's extension services have been limited by a numberof factors, most of them beyond its control. It lacks a sufficient number oftrained extension workers who could travel outside of Jogyakarta to visitother regions where leather goods manufacturers are located. In 1978 forinstance only 24 staff members or about 10% of staff resources could bedevoted to this important task. LRI, however, has been collaborating moreclosely with BIPIK over the past few years. Domestic supply of hidescurrently meets only 50-60% of existing manufacturing and tanning capacityand what is available locally is usually of poor quality. The 100,000 headsof cattle imported by the Government with intention of improving quality of

- 42 -
ANNEX IIIPage 9
hides through cross-breeding have not yet shown any material impact. This rawmaterial shortage seriously impairs both the volume and quality of leatherthat the industry, and LRI, could process. Besides it is reported thatgovernment protective measures and other regulations do not favor locallabor-intensive manufacturing. Consequently LRI's impact to date has beenlimited to a relatively small proportion of the industry. As of 1978 LRI hasextended technical assistance to 18 leather tanneries in Java and SouthSumatra, 58 shoe factories in Java, and 17 leather goods "clusters" in Java,Lombok and Ujung Pandang.
21. LRI's budgetary problems stem mainly from its inability to keepits own earnings for investment purposes and to a lesser extent from therigid disbursement procedures affecting the government budget. Over 80% ofits annual income of sabout Rp 400 million is from the Central Governmentand its own earnings amounted to Rp 90 million or 20% of total revenues in1978. However, this latter amount barely covers cost and whatever extraprofits are realized are returned to the Treasury in accordance with govern-ment regulations.
22. Due to the quality of present staff, organizational problems,and the supply shortages encountered by the leather industry which are notlikely to be eased in the immediate future, it is not certain to what extentLRI could expand its extension services activities effectively if it wereallowed to retain its own earnings. Allowing it to do so now might alsoshift its focus to the full-paying clients at the expense of the smallerfirms who could not afford to pay consultancy fees. On the other hand, ifthe institute were able to finance some of its capital investments, such asmachinery for demonstration purposes to small industries, it could alsosubstantially improve its extension work. This issue needs to be examinedfurther, but such an examination need not postpone essential reform. LRIimmediately needs more modern equipment (e.g. sewing machines, presses,shaving, ironing, and rolling equipment) as well as technical assistance toupgrade its extension services to CSI.
D. Batik and Handicraft Institute (Jogjakarta)
23. Handicrafts in Indonesia are defined as "artifacts made of wood,copper, silver, rattan, bamboo, and natural fibers, plus the original area,batik." Thus the two main sections of the Batik and Handicraft Institute(BHI) were established in 1950 and 1972 respectively to help develop thisparticular industry. To this end BHI provides training, raw materials,designs, and technical advice to handicraft manufacturers throughout thecountry, principally to batik manufacturers. BHI has 108 staff, consistingof 86 workers for batik industries and 22 for handicrafts. Six (6) of thestaff have college degrees. The Batik Center provides training to about1,800 batik makers annually, who are members of the Batik ProducersCooperative of Indonesia. This is BHI's most successful venture, since thebatik making industry is spread natonwide and is dominated by cottage andsmall-scale industries. Private persons may also' take courses at the
- 43 -
ANNEX IIIPage 10
Institute for Rp 6,000 for a 3-month course or Rp 25,000 for the full course.The handicraft section is however, less known, largely because of lack ofpromotion and in part because it simply does not respond to the needs ofhandicraft industries. It has a number of motorized lathes that areperenially underutilized and other power tools that are clearly not suitableto the majority of handicraft manufacturers.
24. While a major limitation of BHI is the shortage of trained ex-tension workers (it has only recently begun working with BIPIK field workers)more basic problems have been inhibiting the institute from expanding itsoperations. The Management is not sure of the Batik center's role or itsfuture and what the Government expects from it. It seems to be torn betweenthe technical assistance demands from the Batik makers throughout Java andother islands and government pressure to cater to a wider clientele. Mean-while, management has repeatedly requested (to no avail) for increasedbudget funds to hire and train more extension workers. It is at present"marking time" doing its regular training in-house and selling batik andother handicrafts to tourists. BHI has become just another touristattraction where visitors can watch the process of batik making.
E. Cellulose Research Institute (Bandung)
25. The Cellulose Research Institute (CRI) conducts R&D activities inconnection with the development of the pulp and paper industry in Indonesia.It caters principally to the needs of 5 state-owned and a few private pulpand paper companies to which it provides laboratory testing services for afee. Consulting fees range from Rp 500 to Rp 1,000 per hour, depending onthe seniority of consultants assigned. CRI has a total staff of 246 workers,of whom 18 are senior technicians (one PhD in Polymer Science) and 11 arejunior level technicians. The rest of the staff are nontechnical personnelwho, like their technical counterparts, are also civil service employees.CRI also conducts regular training courses on laboratory techniques and rawmaterial (pulp, bagasse, sawdust) preparation. As the paper industry isbasically a large scale one, CRI's role in the development of the small-scalesector has been relatively minor.
26. The demand for CRI's laboratory and consulting services appears tohave been going down over the last several years as shown by the sharpdecline in its self-earned revenues from Rp 75.0 million in 1975/76 to Rp 31million in 1976 and Rp 30 million in 1977/78. Consequently CRI has had torely more heavily on government funding which had to be increased proportion-ately. Since this drop in demand seems to reflect fundamental supply/demandfactors affecting the lagging paper industry, the question of CRI's futurerole must be resolved before any assistance is given to the institute. Thisissue should be explored not only with the Department of Industry, but alsowith the 5 state-owned pulp and paper mills which are the principal clients.

- 44 -
ANNEX IIIPage 11
F. Metal Industries Developent Center - MIDC (Bandung)
27. MIDC is an example of a successful R&D institute both in terms ofits effectiveness in carrying out its specific role in the framework ofoverall industrial development and in terms of its effective use of foreigntechnical assistance. Its management and work organization could thus be usedas models for similar R&D institutes in their future expansion plans.(Organizationally, MIDC is still an annually-funded project, but a morepermanent status is under consideration.)
28. MIDC has 169 staff working out of its main plant in Bandung andserving the needs of the metal industry throughout Indonesia. Among thestaff are 12 graduate engineers and 40 technical specialists as well as 30staff who had received training in Belgium for periods of 4 to 8 months.Since its establishment in 1970 (it became operational in 1974), MIDC hasbeen the beneficiary of Belgian and German bilateral technical assistanceand UNIDO/UNDP multilateral assistance. A total of 19 technical expertsfrom these countries and institutions have worked in MIDC between 1974-78.Total aid received to date including technical assistance amounted to theequivalent of US$3.25 million.
29. The general objective of MIDC is to help develop the metal industryby improving production technology, specifically through upgrading of localpredominantly traditional skills. For this purpose, MIDC provides technicalassistance to firms and entrepreneurs on general and production management,product design, welding, machining, heat treatment, metal forming and forging,quality control, repair and maintenance. It is organized into 3 divisions tofulfill these tasks: the Technological Development division, IndustrialDevelopment division and General Services. Assistance to metal industries isgiven in-house through training courses, seminars, in plant visits, andthrough brochures and publications. MIDC appears to be well-equipped and haslearned to fully use the machinery it has installed in its premises.
30. Nearly 50% of MIDC's technical staff are available and capable ofdoing extension services in the field, but even this is not sufficient dueto the large number and scattered locations of metal industries and foundriesthroughout the country. Consequently, only about 5% of MIDC's budget hadbeen absorbed by industrial extension services. Most technical problemsbrought to MIDC's attention are still solved in MIDC premises althoughprocesses may be examined in the field. Training courses for small entre-preneurs, such as welding, metal fabrication and forging are also conductedin the MIDC so that this limits attendance to these courses. There is a needto expand MIDC's capabilities - and manpower resources - to extend technicalassistance in the field. Training of new extension officers who could workclosely with BIPIK in extension services and development centers isimmediately needed. Use of mobile units to transport heavy equipment andmachinery may also be considered, although the use of such mobile units fortraining purposes has not been successful in the past due to frequentbreakdowns and lack of needed spare parts for the vehicles and machinery.
- 45 -ANNEX IIIPage 12
G. Chemical Research Institute (Medan) (CRIM)
31. This institute is like the other regional chemical R&D institutesestablished in the regions to conduct basic laboratory testing and research.CRIM has 23 staff organized into two divisions reflecting the two mainfunctions of the institute mentioned. Since the main emphasis is on chemicalanalysis and testing, 10 staff members are assigned to this task. Itsprincipal technical assistance to CSI's also consist of quality testing ofraw materials and finished products and advice on how to improve the same,from a technological standpoint. However, CRIM reports that its extensionservices are severely limited by the lack of trained extension officers amongits staff, and hence it proposes to fill this gap in the future by sendingsome of its staff to the Indextrac courses conducted by TECHNONET ofSingapore.
H. Chemical Research Institute (Surabaya)
32. The industrial extension services of the institute extended to CSIhas been of recent origin and consists of technical assistance to smallproducers of food, soy sauce, alcoholic and non-alcoholic beverages, cookingoil, vinegar and soap, located in East Java. With 14 staff to carry out boththe institute's main task of product and material testing, requested by othergovernment agencies and extension services in some 36 towns of East Java, theinstitute is clearly understaffed. The institute reportedly faces severestaffing problems due to limited budget and would like to hire some collegegraduates to do both laboratory and field extension work. It proposes toexpand its extension work, provided adequate funding from the budget isavailable, by offering technical courses to CSI and setting up demonstration(pilot) processing plants for a number of important food products madelocally. Its laboratory facilities are reported to be in poor condition andoutdated.
I. Chemical Research Institute (Bogor)
33. The Chemical Research Institute of Bogor (CRIB) is strategicallylocated in West Java close to the main city of Jakarta and appears to be wellmanaged by qualified technocrats. Its principal activities, due in part toits proximity to the main trading and business center of Jakarta, haveconcentrated on laboratory testing of essential oil exports, food, beveragesand other industrial products, at the request mainly of private (mostlylarge) enterprises and traders. Its total staff of 112 workers include only21 college graduates and 1 PhD (the director). While this is considered amajor constraint to CRIB's technical assistance to small industries, itsinability to retain its earned income from consultancy is reported to be amuch more binding one, since it limits its capacity to purchase more modernequipment and/or replace existing ones. The Institute realizes that it needsto train future extension officers (presently none) not only in providingtechnical advice but also practical advice on management and financing. TheInstitute had a budget of Rp 117.5 million in 1978. It also received projectaid of US$500,000 from UNIDO in 1978 to establish a processing laboratoryand about US$200,000 in technical assistance from the UK.

- 46 -
ANNEX IIIPage 13
J. Chemical Research Institute (Banjarbaru, So. Kalimantan)
34. The institute was established in 1971 to provide chemical labora-tory testing and industrial extension to the whole province of SouthKalimantan. With a total staff of 29, the institute is organized into threedepartments, General Services (15 staff), Laboratory Testing (9) and ExtensionServices (5). Only one of the staff has had any training on industrial exten-sion, and consequently this type of activity represents only a minor propor-tion of the work program. Four staff members were devoted to industrialextension services in 1978 which accounted for Rp 2.5 million or just over 3%of the budget. Laboratory testing and quality control services providedmostly to small entrepreneurs, however, constituted over 60% of the insti-tute's activity in that year.
35. The institut:e could with adequate staffing and budgetary andtechnical assistance support perform a key role in developing entrepreneurshipin the province. South Kalimantan is rich in forestry resources, mineralsand other agricultura:l products which could be developed either for directexports as raw materials or processed locally. With the civil servicessalary scales and laclc of other amenities available in the province, theinstitute has been unable to attract good quality staff from Java and otherislands. Hence, additional incentives may need to be given to the staff andnew recruits to attract and retain them in this rather remote outpost.Upgrading existing technical staff (the majority of whom are technical highschool graduates) should be done immediately, preferrably using theinstitute's own facilities.
K. Materials Testing Institute (Bandung)
36. The Materials Testing Institute (MTI) provides a variety of servicesrelated to laboratory analyses and testing of raw materials chiefly chemicals,metals, minerals, and building materials that are used by local industries.Although it is designated differently from chemical research institutes,chemical analyses and testing constitute more than 35% of its activities,which are dominated by metallurgical testing (49%). Its staff of 134 workers(probably excessive in light of its operations) are organized into sectionscorresponding to the type of materials tested. Sixty-five (65) technicianswork on materials testing and analysis. Requests for services come mainlyfrom other government agencies, including state-owned industrial enterprisessuch as cement, fertilizer and chemicals. Services cover all of Indonesia.
37. MTI does not directly offer its services to small-scale industriesnor does it have an industrial extension staff as such. However, informationon materials and product quality and standards can be obtained from theinstitute for a nominal fee. MTI has difficulties hiring and retaining goodquality staff. Its principal role, moreover, is uncertain since many of itsfunctions overlap with those of other R&D institutes also located in theBandung area - e.g. MIDC, Electric/Electronic Institute, and the NationalInstitute for Instrumnentation.


Vi ml-'- ~~~~~~~~~~~~~~~~~~~~~~BRD 12696 R3-i'oS THAILAND Ar 1A iI5T 1i5oC lioY 130 I NS' 'Q FETRUEY 1933BandA AceT
6t j _.J\ ... PHILIPPINES AIIA
,GruT l /5 PHILIPPI ADMINISTRATION AND POPULATIONI | -: . 7 ChiZna Sea o BRUNEI , PROVINCIAL EDARIES'~~~~~~~~~ j- t / L....... ' 9 INTRNATONAL OUNCAPIE5
rM Aj Ij _ - /t F~ L AEY S I A T A A T' ' _! %~~~~~, .I / 55 w -4 *; * -< ' SR- i '... I -~ / I - T...W
' I. . 1 ,- fV , )..
9:. ~ WEST SUAMAHERA PacificAL;:MHR O n I , c a8 ~~~~~~~~~~~~~~~~~~~~~~~~~~~~~~~~~~~~~~~~~~~~~~~~~~~~~~~~~~~~~M
1.3 I-'- t O
:2.SRECRA. .ERR:TORT ACEU .%: :, g.: . F- ) O
,,9g -A.MAMSAN .... dP .............................................l .- 2 '' A
5 I)IAN Java Sea Sea A
JO- AT A K / 5
'. 1, ,,2 a11? 12F' ,2,+ ,20- ,35 %40
IN NCNTCALIODNTAN ~ ~ ~ ~ 4WATAo o a 5
L0 A_iTNLAN
i~~~l :1,-AL T .. ITO- A ~ ~ ~ ~ ~ ~ 26 0 so* 1.-
0 oEPIA-L C=VN, .- .
IA'A II-A0TACIAA0A(-- < I.I,I 131 . IR-ATHALACA
- Im 00 TA
- -AEA - - I -* A2.0 ADD . DD 5 000. 9
lAY - - I-O.EivlY A'ND'NN'D


-47-
STATISTICAL TABLES
Introduction
Tables 0.1 to 16.2 are derived essentially from 25 volumes of theIndustrial Census 1974/75 publication. All these tables except the firsttwo (0.1 and 0.2) present the data by the scale of operation or segments(CIs, SIs and MIIs). The first two tables relate exclusively to CIs; thenext three (0.3, 0.4 and 0.5) tables present a comparative picture emergingfrom Tables 1.1 to 6.2. Tables 1.1, 2.1, etc. present data by three-digitindustry code and Tables 1.2, 2.2, etc present data by province. Tables 7to 13 present data by i-ive-digit industry codes./I Tables 6.1 and 8 present% distribution for a characteristic in each manufacturing segment byindustry. Table 6.2 presents similar distributions by province. Table 9presents % distribution for a characteristic in each industry by the segment.Tables 10 to 13 present: data for a characteristic by five-digit industrycode, and the list of codes along with the description is given in pages 93and 94. Tables 14.01, 14.02 etc., present data for a province; Central Java,D.K.I. Jakarta and North Sumatra were selected for this purpose. Table 15relates to manufacturing output and imports. Tables 16 to 20 present time-series data; all except: Tables 16.1 and 16.2 relate to manufacturing employ-ment. Tables 17 and 18 present the industrial survey data published by BPS,on the number of establishments and persons engaged in SMLIs by majorindustry group. Table 19 presents some of the data on SMLIs assembled bythe Department of Industry for the Mission. Table 20 presents the employmentdata assembled throughthe labor force/employment surveys. Tables 21 isreproduced from a report of the International Development Center of Japan.Table 22 presents volume indexes and annual growth rates of selected indus-trial products. Tables 23 to 29 present data on the lending oerations of KIKand K4KP programs for assistance to the smal 1 scale industry.
/1 Tables 7 to 9 also present data by two-digit Industry Codes.
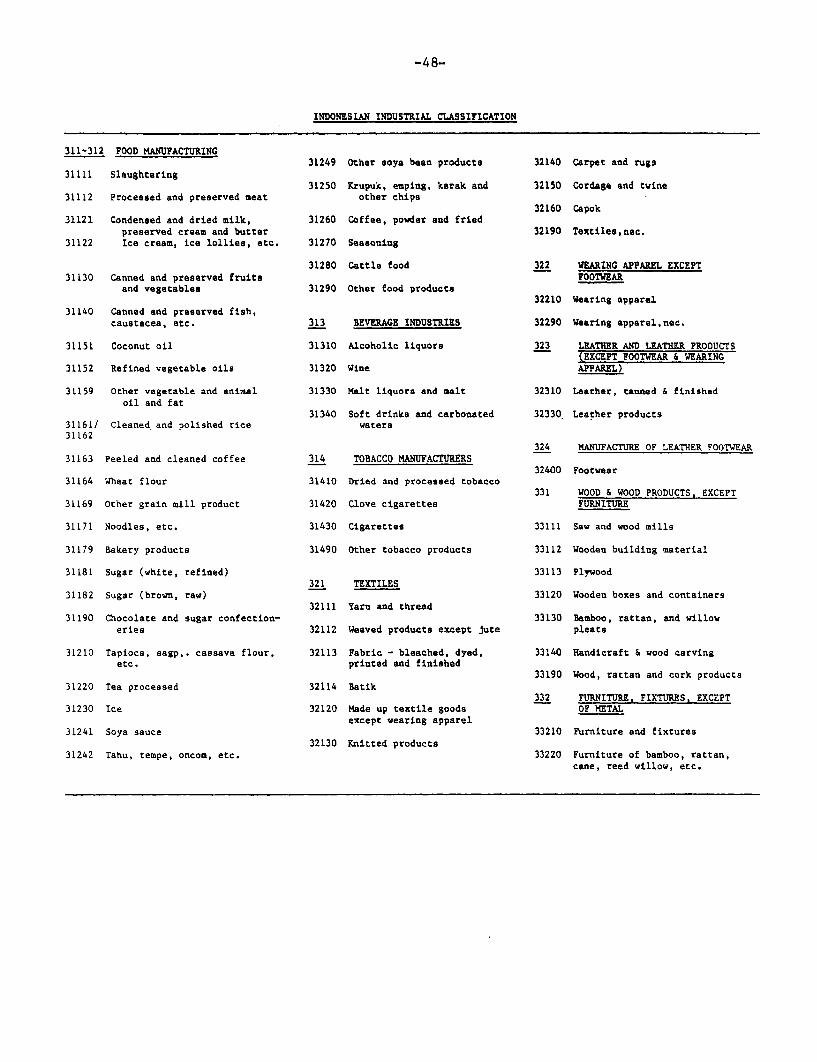
-48-
INDONESIAN INDUSTRIAL CLASSIFICATION
311-312 FOOD MANUFACTURING31249 Other soya bean products 32140 Carpet and rugs
31111 Slaughtering31250 Krupuk, emping, kerak and 32150 Cordage and twine
31112 Processed and preserved meat other chips32160 Capok
31121 Condensed and dried milk, 31260 Coffee, powder and friedpreserved cream and butter 32190 Textiles,nec.
31122 Ice cream, ice lollies, etc. 31270 Seasoning
31280 Cattle food 322 WEARING APPAREL EXCEPT31130 Canned and preserved fruits FOOTWEAR
and vegetables 31290 Other food products32210 Wearing apparel
31140 Cahned and preserved fish,caustacea, etc. 313 BEVERAGE INDUSTRIEZS 32290 Wearing apparel,nec.
31151 Coconut oil 31310 Alcoholic liquors 323 LEATHER AND LEATHER PRODUCTS(EXCEPT FOOTWEAR & WEARING
31152 Refined vegetable oils 31320 Wine APPAREL)
31159 Other vegetable and animal 31330 Malt liquors and malt 32310 Leather, tanned & finishedoil and fat
31340 Soft drinks and carbonated 32330, Leather products31161/ Cleaned and polished rice waters31162
324 MANUFACTURE OF LEAT ER FOOTWEAR31163 Peeled and cleaned coffee 314 TOBACCO MANUFACTURERS
32400 Footwear31164 Wheat flour 31410 Dried and processed tobacco
331 WOOD & WOOD PRODUCTS, EXCEPT31169 Other grain mill product 31420 Clove cigarettes FURNITURE
31171 Noodles, etc. 31430 Cigarettes 33111 Saw and wood mills
31179 Bakery products 31490 Other tobacco products 33112 Wooden building material
31181 Sugar (white, refined) 33113 Plywood321 TEXTILES
31182 Sugar (brown, raw) 33120 Wooden boxes and containers32111 Yarn and thread
31190 Chocolate and sugar confection- 33130 Bamboo, rattan, and willoweries 32112 Weaved products except jute pleats
31210 Tapioca, sagp, . cassava flour, 32113 Fabric - bleached, dyed, 33140 Handicraft & wood carvingetc. printed and finished
33190 Wood, rattan and cork products31220 Tea processed 32114 Batik
332 FURNITURE, FIXTURES. EXCEPT31230 Ice 32120 Made up textile goods OF METAL
except wearing apparel31241 Soya sauce 33210 Furniture and fixtures
32130 Knitted products31242 Tahu, tempe, oncom, etc. 33220 Furniture of bamboo, rattan,
cane, reed willow, etc.

-49-
341 PAPER * PhUE4 PRODUCTS 35322 Ramilled rubber 38113 Kitchen apparatus
34111 Paper 35523 Crumb rubber 38114 Metal other than aluminum
34112 Paper & fiber board, etc. 33590 Rubber products n.e.c. 38120 Metal furniture & fixtures
34120 Containers & boxes of paper 356 PLASTIC PRODUCTS 38130 Structural metal products* paper board
35600 Plastic wares 38140 Metal containers34190 Pulp, paper A paper board
articles 361 POTIERY CRINAS 382 MACHINERY EXCEPT ELECTRICALEART BEMNARES
342 PRINTING 6 PUBLISHING 38200 Machinery, except electrical36110 Ceramics and porcelain
34200 Printing & publishing 383 ELECTRICAL MACHINERY ETC.36120 Earthenware
351 INDUSTRLAL CEZIICALS 38311 Storage batteries36190 Art 6 ornamental potterqy,
35110 Basic ehmicals except stoneware, etc. 38312 Dry cell batteryfertilizer
362 GLASS GLASS PRODUCTS 38320 Coaunication equip. & apparatus35120 Fertilizer
36210 Glass 6 glass products 38330 Electrical apparatus & supplies35130 Reeins, plastic mnterial
and synthetic fiber 36220 Sheet glass 38340 Repair of electrical appliances
35140 mosquito incense coil 363 CEMENT, LDME & CEMENT 384 TRANSPORT EQUIPMENTPRODUCTS
352 OTMER CHEMICAL PRODUCTS 38411 Ship building and repairing36310 Cement36320 Cement products 38420 Railroad equipment
35210 Paint, varnisher, laquers36330 Lime 38430 Motor vehicles
35221 Medicine except native med.364 STRUCTURAL CLAY PRODUCTS 38440 Motorcycles & three-wheel motor
35222 Native medicine vehicles36410 Bricks
35231 Soap, detergent & cleaning 38450 Bicycles & becaspreparation 36420 Roofing tiles
38460 Motor vehicles body & components35232 Matches 36490 Structural clay products
38490 Other transport equipment35233 Perfumes, cosmetics, 6 369 OTHER NON-METALLIC MIMERAL
other preparations PRODUCTS 385 MANUFACTURE OF SCIENTIFIC,MEASURING, OPTICAL AND PHOTO-
35290 Other chemical products 36900 Other nonmetallic mineral GRAPHIC EQUIPMENTnot elsewhere classified products
38500 Manufacture of scientific, measuring,353 PETROLEUM REZINERIES 371 IRON & STEEL BASIC INDUSTRIES optical and photographic equipment
35300 Petroleum refineries 37100 Basic iron and steel 390 OTHER MANUFACTURING INDUSTRIES
354 MISC. PRODUCTS OF PETROLEUM 372 BASIC NON-FERROUS METALS 39010 JewelryAND COAL
37200 Basic non-ferroUS metals 39020 Musical instruments35400 Misc. products of petroleum
and coal 381 CUTLERY, HAND TOOLS AND 39030 Sporting & athletic goodsGENERAL HARDWARE
355 RUBBER MANUFACTURES 39040 Toys38111 Agricultural & hand tool equip.
35510 Tyree end tubes 39060 Stationery38112 Cutlery, nails, screws, bolts,
35521 Smoked rubber etc. 39090 Industries n.e.c.

-50.-. Table 0.1
INDONESIA
OVERVI1W OF HOUSEHOLD AND COTTAGE INDUSTRY SECTOR BY RURAL URBAN-AREAS AND SEC, 1974/75
Rural Urban TotalUnit Male Female Total Male Female Total Male Female Total
No. of persons engaged th. 1,038.6 2,609.1 3,647.8 197.0 55.1 252.1 1,235.6 2,664.6 3,899.9(Z) (28.5) (71.5) (100.0) (78.1) (-21.9) (100.0) (31.7) (68.3) (100.0)(2) (84.1) (97.9) (93.5) (15.9) (2.1) (6.5) (100.0) (100.0) (100.0)
No. of man-days worked min. 195.1 203.2 398.3 19.8 11.4 31.2 214.9 214.6 429.5(%) (49.0) (51.0) (100.0) (63.4) (36.6) (100.0) (50.0) (50.0) (100.0)(%) (90.8) (94.7) (92.7) (9.2) (5.3) (7.3) (100.0) (100.0) (100.0)
- by full time (only) mln. 115.9 140.1 256.0 10.3 7.6 17.9 126.2 147.7 273.9- by part time (only) mln. 107.9 115.9 223.7 3.8 4.8 8.6 111.6 120.7 232.4
No. of hired labor th.. 124.9 17.6 142.6 29.0 5.6 34.6 153.9 23.3 177.2(%) (87.6) (12.4) (100.0) (83.9) (16.1) (100.0) (86.8) (13.2) (100.0)(%) (81.2) (76.2) (80.5) (18.8) (23.8) (19.5) (100.0) (100.0) (100.0)
No. of days worked by iln. 26.1 4.3 30.4 7.6 1.4 9.0 33.7 5.8 177.2hired labor (%) (87.6) (12.4) (100.0) (83.9) (16.1) (100.0) (86.8) (13.2) (100.0)
(%) (81.2) (76.2) (80.5) (18.8) (23.8) (19.5) (100.0) (100.0) (100.0)
Hired/all persons engaged (2) (12.0) (0.7) (3.9) (14.7) (10.2) (13.7) (12.5) (0.9) (4.5)Hired day/all days (2) (13.4) (2.1) (7.6) (38.2) (12.5) (28.8) (15.7) (2.7) (9.2)
No. of day per person engaged no. 188 78 - 100 207 - 174 81 110No. of days per hired labor no. 209 244 213 260 260 260 219 247 222
No. of establishments th. - - 1,163.0 - - 71.5 - - 1,234.5/a- reported th. - - 1,120.8 - - 68.4 - - 1,189.2- in operation () - - (94.3) - - (5.7) - - (100.0)
Gross output Rp. bln. - 160.9 - - 39.9 - - 200.8Value added Rp. bln. - - 66.7 - - 15.8 - - 82.6
(2) - - (81.0) - - (19.0) - - (100. 0)
/a Out of which only 97 thousand establishments hired labor.

-51-
Table 0.2
INDONESIA
OVERVIEW OF HOUSEHOLD AND COTTAGE INDUSTRY SECTORPER ESTABLISHMENT AND PERSONS ENGAGED. 1974/75
Per estab-Unit Total Unit lisment Unitle Total
No. of establishments- all 000 1,234.5- with hired labor 000 97.0 - -
No. of persons engaged, all th. 3,899.9 No. 3.0- household members th. 3,722.7 No. 3.0- hired labor th. 177.2 No. 2.0
No. of man-days ofparticipation mln. 542.6 No. 440.0- by full-time miln. 273.9 No. 222.0- by part-time mln. 232.4 No. 188.0- nominal mln. 36.3 No. 30.0
No. of man-days worked by- by all participants mln. 429.4 No. 348.0/a No. -
- by household members mln. 390.0 No. 316.0 No. -
- by hired labor mln. 39.4 No. 407.0/b No. -
Wages & salaries ELp bln. 10.0 No. 103.5 Rp.per day 255Value added ltp. bln. 82.6 No. 66.9 Rp.per day 192/cGross output Rlp. bln. 200.8 No. 162.7 Rp.per day 468
- goods produced lip. bln. 192.1 No. 155.6 Rp.per day 447- services rendered lip. bln. 8.7 No. 7.1 Rp.per day 21- rural ELp. bln. 160.9 No. 138.0 Rp.per day 404
- urbamn RLp. bln. 39.9 No. 558.0 Rp.per day 1,282
/a Rural 342, Urban 436.
/b Relates to 97 thousand esitablishments with hired labor. If all household and cottageestablishments are consiclered, then the national average is 32, consisting of 26 forrural and 126 for urban.
/c Gross profit, estimated as value added minus wages and salaries, comes to only Rp. 186per household person day.,

-52- Table 0.3
INDONESTA
OVERVIEW OF MANUFACTURtNG SECTOR BY SCALE OF OPERATION, 1974/75
Absolute levels Index: All mfp. - 100Unit CI Si MLI All CI SI MLI
TotalNo. of establishments '000 1,234.5 48.2 7.1 1,289.8 95.0 3.7 0.5No. of persons engaged '000 3,899.9 343.2 661.7 4,904.8 79.5 7.0 13.5No. of man-days /a Mln 429.4 57.2 163.0 649.6 66.1 8.8 25.1Wages and salaries Rp bln 10.0 16.3 93.3 119.6 8.4 13.6 78.0Cost of input Rp bln 118 105 817 1,040 11.3 10.1 78.6Gross output Rp bln 201 157 1,295 1,653 12.2 9.5 78.3Value added Rp bln 83 53 477 613 13.5 8.6 77.8
No. of estab. using power No. - 341 4,308 4,649 - 7.3 92.7No. of unpaid workers '000 3,722.7 74.2 5.9 3,802.8 97.9 2.0 0.2No. of paid workers '000 177.2 269.0 655.8 1,102.0 16.1 24.4 59.5Output: Goods produced Rp bln 192 145 1,265 1,602 12.0 9.1 79.0Output: Services rendered Rp bln 9 12 30 51 17.6 23.5 58.8
Per EstablishmentNo. of persons engaged No. 3 7 93 4 75 175 2,325No. of man-days /a No. 348 1,186 22,990 504 69 235 4,562Gross output Rp mln 0.16 3.3 182.5 1.3 13 255 1,424Value added Rp aln 0.07 1.1 67.3 0.5 14 232 14,163
Per Person Employed/EngagedWages and salaries per year Rp'000 57 61 142 109 52.3 56.0 130.3Value added per. year Rp'OOO 21 155 721 125 17.0 123.7 577.1Wages and salaries per day Rp 255 285 572 461 55.3 61.8 124.1Value added per day Rp 193 928 2,926 944 20.4 98.3 310.0
RatiosValue added/gross output X 41.1 33.7 36.9 37.1 110.8 90.8 99.5Goods produced/gross output X 95.7 92.0 97.6 96.9 98.8 94.9 100.7
/a Except for CI, relates to only paid employees; CIs have only 39.4 million man-days for paid employees.

_53 Table 0.4Page 1
INDONESIA
TOP EIGHT INDUSTRY GROUPS IN HOUSEHOLD AND COTTAGE,SMA LL, MEDIUM AND LARGE SCALE INDUSTRY, 1974
No. of per- Labor pro- No. of esta- Wages &Industry group ranked by sons engaged ductivity Value added blishments salariesNo. of persons engaged (% of total) (Rp'000/year) (% of total) (Z of total) (Rp/day)
Household & Cottage IndustryWood & wood products 39.40 11.5 21.11 40.67 343Food manufacturing 35.40 27.7 43.67 34.77 226Textiles 10.23 12.5 5.93 10.48 146Bricks, tiles & clay products 4.26 50.8 8.83 4.03 255Furniture & fixtures 2.76 47.9 5.48 2.66 300Other manufacturing 1.80 31.7 2.50 1.76 265Pottery, china & earthernware 1.58 13.8 1.01 1.70 191Fabricated metal products, except machinery 1.27 63.9 3.08 1.10 264
Total 96.70/a 21.17/b 91.61/a 97.17/a 255/b
Small Scale IndustryFood matnufacturing 41.93 172.0 46.69 46.82 266Textiles 13.62 102.6 1.29 9.65 218Bricks, tiles & clay products 8.22 64.5 3.43 8.60 224Wood & wood products 7.45 177.7 8.57 6.69 373Fabricated metal products, except nachinery 4.71 142.9 4.36 4.70 377Cement, lime and products 4.70 148.8 4.53 4.72 307Furniture & fixtures 4.69 151.9 4.62 4.63 371Other manufacturing 1.60 130.9 1.36 1.47 308
Total 86.92/a 154.49/b 74.85/a 87.28/a 285/b
Medium & Large Scale IndustryTextiles 24.94 411.0 14.22 27.30 436Food manufacturing 20.50 812.0 23.09 21.69 586Tobacco manufactures 19.35 798.0 21.42 10.84 270Rubber products 6.91 834.3 8.00 6.60 656Other chemicals 3.67 678.1 3.45 3.22 1,084Fabricated metal products, except machinery 3.22 572.2 2.55 3.37 742Wood & wood products 2.88 595.1 2.38 4.54 782Printing & publishing 2.22 435.1 1.34 3.23 636
Total 83.69/a 720.78/b 76.45/a 80.79/a 572/b

Table 0.4-54- Page 2
Labor No. of per- No. of esta- Wages &Industry grouo ranked productivity Value added sons engaged blishments salariesby labor productivity (Rp'000/year) (X of total) (X of total) (2 of total) (Rp/day)
Household & Cottage IndustryFootwear 131.6 0.70 0.15 0.12 405Leather manufactures 97.7 0.36 0.11 0.08 236Tobacco manufactures 93.2 1.26 0.38 0.27 469Printing & publishing 88.8 0.33 0.11 0.09 230Plastic products 79.7 0.53 0.17 0.15 259Transport equipment 75.5 0.51 0.16 0.15 318Cement, lime & products 73.8 1.26 0.49 0.37 286Other chemicals 68.9 0.49 0.21 0.16 289
Total 21.17/b 5.44/a 1.78/a 1.39/a 255/bSmall Scale IndustryElectrical machinery, appliances, etc. 558.2 0.58 0.16 0.13 366Industrial chemicals 418.5 0.86 0.32 0.25 311Rubber products 308.6 2.41 1.21 0.94 292Non-ferrous metal basic industries 272.4 0.01 0.01 0.008 377Transport equipment 247.1 1.65 1.03 0.88 402Other chemicals 239.8 1.92 1.24 1.04 382Printing & publishing 219.5 3.07 0.22 1.66 360Leather manufactures 213.0 0.47 0.34 0.32 298
Total 154.49/b 10.97/a 4.53/a 5.228/a 285/b
Medium & Large Scale IndustryBeverage industries 3,068.7 3.03 0.71 0.85 2,176Non-ferrous metal basic industries 2,812.0 0.66 0.17 0.13 1,468Transport equipment 1,550.4 4.75 2.21 1.58 1,470Electrical machinery, appliances, etc. 1,319.0 3.37 1.84 0.93 1,156Machinery, except electrical 1,263.3 1.94 1.10 0.96 866Other manufacturing 1,257.0 2.21 1.27 0.92 1,587Cement, lime & products 1,069.5 2.58 1.74 3.05 986Industrial chemicals 1,050.0 0.99 0.68 0.93 895
Total 720.78/b 19.53/a 9.72/a 9.33/a 572/b

-55- Table 0.4Page 3
No. of per- Labor No. of esta- Wages &Industry group ranked Value added sons engaged Productivity blishments salaries
by value added (% of total) (X of total) (Rp'OOO/year) (X of total) (Rp/day)
Household & Cottage IndustryFood manufacturing 43.67 35.40 27.7 34.77 226Wood & wood products 21.11 39.40 11.5 40.67 343Bricks, tiles & clay products 8.83 4.26 50.8 4.03 255Textiles 5.93 10.23 12.5 10.48 146Furniture & fixtures 5.48 2.76 47.9 2.66 300Fabricated metal products, except machinery 3.08 1.27 63.9 1.10 264Other manufacturing 2.50 1.80 31.7 1.76 265Wearing apparel 1.66 0.67 58.0 0.63 278
Total 92.26/a 95.79/a 21.17/b 96.10(a 255/b
Small Scale IndustryFood manufacturing 46.69 41.93 172.0 46.82 266Textiles 9.05 13.62 102.6 9.65 218Wood & wood products 8.57 7.45 177.7 6.69 373Furniture & fixtures 4.62 4.69 151.9 4.63 371Cement, lime & products 4.53 4.70 148.8 4.72 307Fabricated metal products, except machinery 4.36 4.71 142.9 4.70 377Bricks, tiles & clay products 3.43 8.22 64.5 8.60 224Printing & publishing 3.07 0.22 219.5 1.66 298
Total 84.32/a 85.44/a 154.49/b 87.4 7/a 285/b
Medium & Large Scale IndustryFood manufacturing 23.09 20.50 812.0 21.69 586Tobacco manufactures 21.42 19.35 798.0 10.84 270Textiles 14.22 24.94 411.0 27.30 436Rubber products 8.00 6.91 834.3 6.60 656Transport equipment 4.75 2.21 1,550.4 1.58 1,470Other chemicals 3.45 3.67 678.1 3.22 1,084Electrical machinery, appliances, et:. 3.37 1.84 319.0 0.93 1,156Beverage industries 3.03 0.71 3,068.7 0.85 2,176
Total 81.32/a 80.13/a 720.78/b 73.01/a 572/b
/a Cumulative total./b National average.

-56-Table 0.5Page 1
INDONESIA
TOP EIGHT PROVINCES IN ROUSEHOLD & COTTAGE, SMALL,MEDIUM & LARGE SCALE INDUSTRY 1974
No. of per- Labor No. of esta- Wages &Province ranked by sons engaged productivity Value added blishments salariesNo. of persons engaged (% of total) (Rp'OOO/year) (Z of total) (% of total) (Rp/day)
Household & Cottage IndustryJava, Central 41.88 13.9 27.49 42.19 178Java, East 14.59 21.9 15.09 13.91 209Java, West 12.11 23.7 13.54 12.11 263Jogyakarta 6.87 11.6 3.77 6.99 198Sulawesi, South 5.25 22.7 5.63 5.37 241Sulawesi, North 2.52 32.4 3.85 2.36 576Nusatenggara, West 2.06 14.2 1.38 2.43 166Kalimantan, South 1.90 31.0 2.77 1.84 354
Total 87.18/a 21.2/b 73.52/a 87.20/a 255/b
Small-Scale IndustryJava, Central 21.57 130.7 18.25 19.12 245Java, West 20.82 135.5 18.27 20.91 277Java, East 20.73 143.3 19.23 23.70 229Jakarta 5.39 263.1 9.18 4.11 429Sulawesi, South 4.62 79.9 2.39 5.25 207Sumatra, North 4.59 218.6 6.49 4.12 344Sumatra, South 3.54 239.5 5.50 4.83 371Jogyakarta 2.71 130.1 2.28 2.41 222
Total 83.97/a 154.5/b 81.59/a 84.44/a 285/b
Medium & Large Scale IndustryJava, East 31.13 642.5 27.74 25.65 446Java, Central 22.35 493.6 15.30 22.34 392Java, West 17.63 777.1 19.00 22.54 568Jakarta 13.29 1,056.4 19.48 12.38 1,107Sumatra, North 3.82 1,098.9 5.82 3.84 508Jogyakarta 2.09 460.3 1.33 2.19 552Sumatra, South 1.68 1,085.6 2.53 1.03 1,188Kalimantan, West 1.21 1,213.7 2.04 0.82 914
Total 93.20/a 720.8/b 93.24/a 90.79/a 572/b
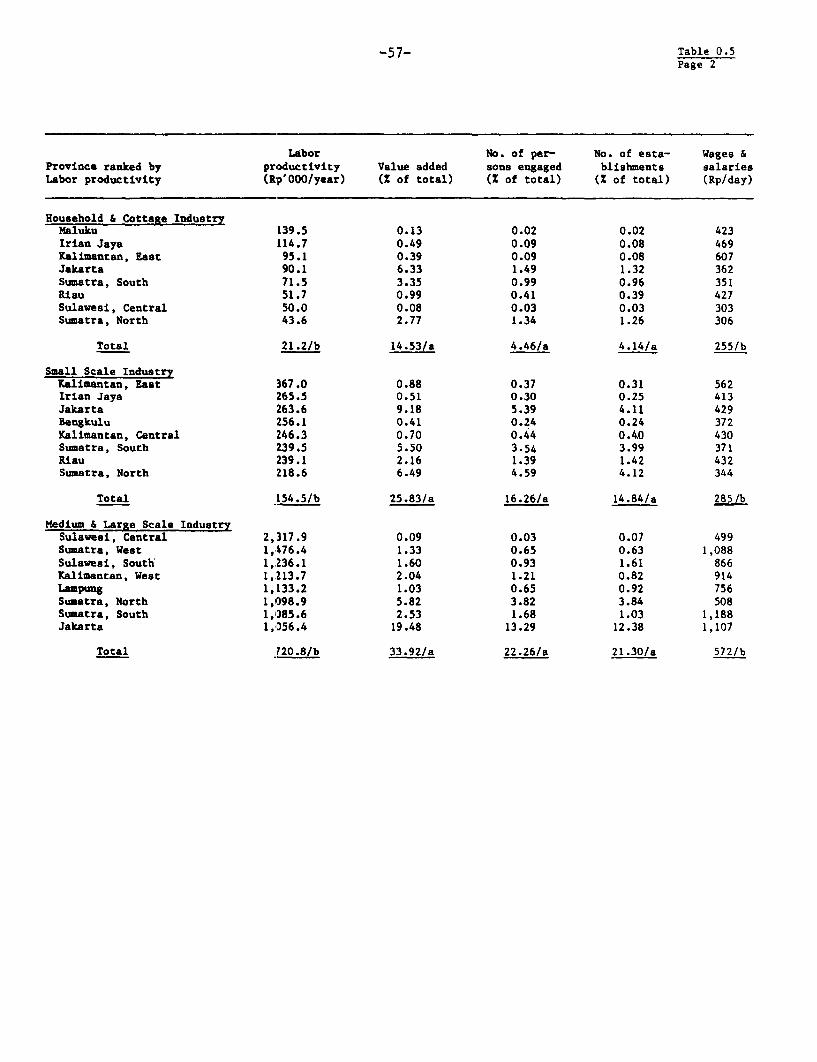
-57_ Table 0.5Page 2
Labor No. of per- No. of esta- Wages &Province ranked by productivity Value added sons engaged blishments salariesLabor productivity (Rp'OOO/year) (Z of total) (X of total) (Z of total) (Rp/day)
Household & Cottage IndustryMaluku 139.5 0.13 0.02 0.02 423Irian Jaya 114.7 0.49 0.09 0.08 469Kalimantan, East 95.1 0.39 0.09 0.08 607Jakarta 90.1 6.33 1.49 1.32 362Sumatra, South 71.5 3.35 0.99 0.96 351Riau 51.7 0.99 0.41 0.39 427Sulawesi, Central 50.0 0.08 0.03 0.03 303Sumatra, North 43.6 2.77 1.34 1.26 306
Total 21.2/b 14.53/a 4.46/a 4.14/a 255/b
Small Scale IndustryKalimantan, East 367.0 0.88 0.37 0.31 562Irian Jaya 265.5 0.51 0.30 0.25 413Jakarta 263.6 9.18 5.39 4.11 429Bengkulu 256.1 0.41 0.24 0.24 372Kalimantan, Central 246.3 0.70 0.44 0.40 430Sumatra, South 239.5 5.50 3.54 3.99 371Riau 239.1 2.16 1.39 1.42 432Sumatra, North 218.6 6.49 4.59 4.12 344
Total 154.5/b 25.83/a 16.26/a 14.84/a 285/b
Medium & Large Scale IndustrySulawesi, Central 2,317.9 0.09 0.03 0.07 499Sumatra, West 1,476.4 1.33 0.65 0.63 1,088Sulawesi, South 1,236.1 1.60 0.93 1.61 866Kalimantan, West 1,213.7 2.04 1.21 0.82 914Lampung 1,133.2 1.03 0.65 0.92 756Sumatra, North 1,098.9 5.82 3.82 3.84 508Sumatra, South 1,1385.6 2.53 1.68 1.03 1,188Jakarta 1,056.4 19.48 13.29 12.38 1,107
Total 720.8/b 33.92/a 22.26/a 21.30/a 572/b
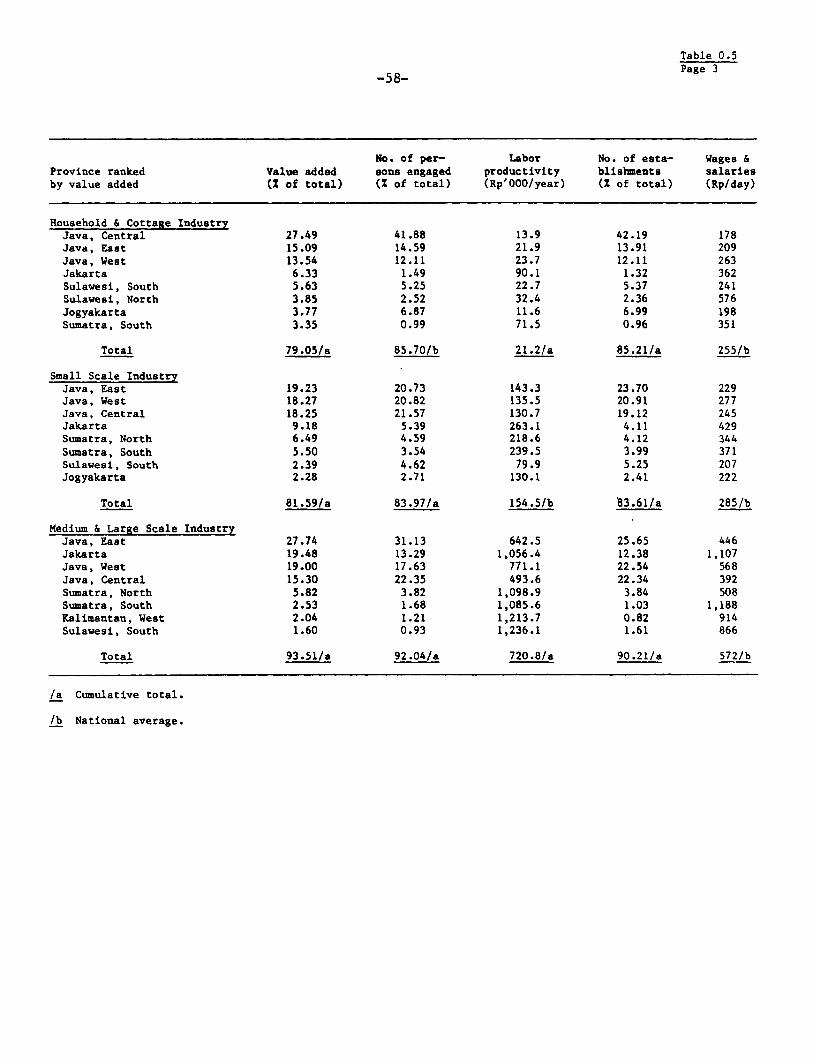
Table 0.5
-58- Page 3
No. of per- Labor No. of esta- Wages &Province ranked Value added sous engaged productivity blishments salariesby value added (X of total) (% of total) (Rp'000/year) (X of total) (Rp/day)
Household & Cottage IndustryJava, Central 27.49 41.88 13.9 42.19 178Java, East 15.09 14.59 21.9 13.91 209Java, West 13.54 12.11 23.7 12.11 263Jakarta 6.33 1.49 90.1 1.32 362Sulawesi, South 5.63 5.25 22.7 5.37 241Sulawesi, North 3.85 2.52 32.4 2.36 576Jogyakarta 3.77 6.87 11.6 6.99 198Sumatra, South 3.35 0.99 71.5 0.96 351
Total 79.05/a 85.70/b 21.2/a 85.21/a 255/b
Small Scale IndustryJava, East 19.23 20.73 143.3 23.70 229Java, West 18.27 20.82 135.5 20.91 277Java, Central 18.25 21.57 130.7 19.12 245Jakarta 9.18 5.39 263.1 4.11 429Sumatra, North 6.49 4.59 218.6 4.12 344Sumatra, South 5.50 3.54 239.5 3.99 371Sulawesi, South 2.39 4.62 79.9 5.25 207Jogyakarta 2.28 2.71 130.1 2.41 222
Total 81.59/a 83.97/a 154.5/b 83.61/a 285/b
Medium & Large Scale IndustryJava, East 27.74 31.13 642.5 25.65 446Jakarta 19.48 13.29 1,056.4 12.38 1,107Java, West 19.00 17.63 771.1 22.54 568Java, Central 15.30 22.35 493.6 22.34 392Sumatra, North 5.82 3.82 1,098.9 3.84 508Sumatra, South 2.53 1.68 1,085.6 1.03 1,188Kalimantan, West 2.04 1.21 1,213.7 0.82 914Sulawesi, South 1.60 0.93 1,236.1 1.61 866
Total 93.51/a 92.04/a 720.8/a 90.21/a 572/b
/a Cumulative total.
/b National average.
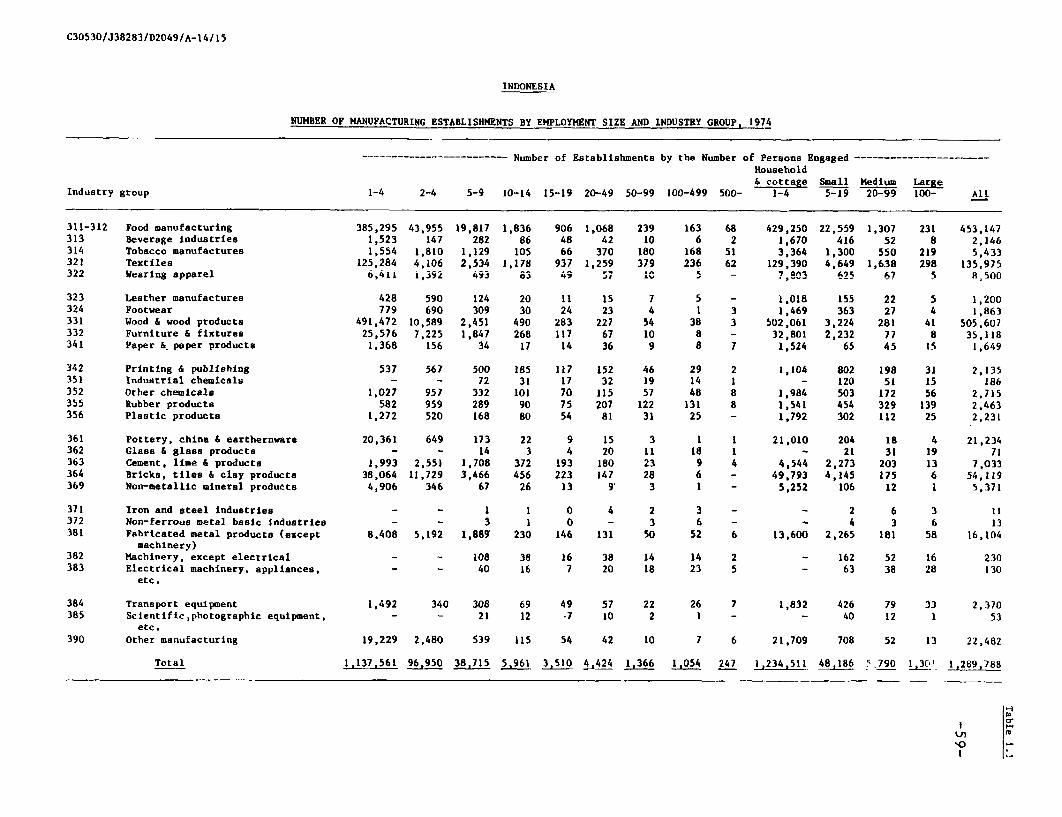
C30530/J38283/D2049/A-14/15
INDONESIA
NUMBER OF MANUFACTURING ESTABLISHMENTS BY EMPLOYMENT SIZE AND INDUSTRY GROUP, 1974
… ------------------------ Number of Establishiments by the Number of Persons Engaged ----------------------HouseholdB cottage Small Medium Large
Industry group 1-4 2-4 5-9 10-14 15-19 20-49 50-99 100-499 500- 1-4 5-19 20-99 100- All
311-312 Food manufacturing 385,295 43,955 19,817 1,836 906 1,068 239 163 68 429,250 22,559 1,307 231 453,147313 Beverage industries 1,523 147 282 86 48 42 10 6 2 1,670 416 52 8 2,146314 Tobacco manufactures 1,554 1,810 1,129 105 66 370 180 168 51 3,364 1,300 550 219 5,433321 Textiles 125,284 4,106 2,534 1,178 937 1,259 379 236 62 129,390 4,649 1,638 298 135,975322 Wearing apparel 6,41i 1,392 493 o3 49 57, 0 ' - ?,803 e2s 67 5 R 500
323 Leather manufactures 428 590 124 20 11 15 7 5 - 1,018 155 22 5 1,200324 Footwear 779 690 309 30 24 23 4 1 3 1,469 363 27 4 1,863331 Wood & wood products 491,472 10,589 2,451 490 283 227 54 38 3 502,061 3,224 281 41 505,607332 Furniture & fixtures 25,576 7,225 1,847 268 117 67 10 8 - 32,801 2,232 77 8 35,118341 Paper & paper products 1,368 156 34 17 14 36 9 8 7 1,524 65 45 15 1,649
342 Printing & publishing 537 567 500 185 117 152 46 29 2 1,104 802 198 31 2,135351 Industrial chemicals - - 72 31 17 32 19 14 1 - 120 51 15 186352 Other chemicals 1,027 957 332 101 70 115 57 48 8 1,984 503 172 56 2,715355 Rubber products 582 959 289 90 75 207 122 131 8 1,541 454 329 139 2,463356 Plastic products 1,272 520 168 80 54 81 31 25 - 1,792 302 112 25 2,231
361 Pottery, china & earthernware 20,361 649 173 22 9 15 3 1 1 21,010 204 18 4 21,234362 Glass & glass products - - 14 3 4 20 11 18 1 - 21 31 19 71363 Cement, lime & products 1,993 2,551 1,708 372 193 180 23 9 4 4,544 2,273 203 13 7,033364 Bricks, tiles & clay products 38,064 11,729 3,466 456 223 147 28 6 - 49,793 4,145 175 6 54,119369 Non-vmetallic mineral products 4,906 346 67 26 13 9 3 1 - 5,252 106 12 1 5,371
371 Iron and steel industries - - I 1 0 4 2 3 - - 2 6 3 11372 Non-ferrous metal basic Industries - - 3 1 0 - 3 6 - - 4 3 6 13381 Fabricated metal products (except 8,408 5,192 1,889 230 146 131 50 52 6 13,600 2,265 181 58 16,104
machinery)382 Machinery, except electrical - - 108 38 16 38 14 14 2 - 162 52 16 230383 Electrical machinery, appliances, - - 40 16 7 20 18 23 5 - 63 38 28 130
etc.
384 Transport equipment 1,492 340 308 69 49 57 22 26 7 1,832 426 79 33 2,370385 Scientific,photographic equipment, - - 21 12 *7 10 2 1 - - 40 12 1 53
etc.390 Other manufacturing 19,229 2,480 539 115 54 42 10 7 6 21,709 708 52 13 22,482
Total 1,137,561 96950 38,715 5,961 3,S10 4,424 1,366 1 4 247 1,234,S11 481A .790 1 3" 1,289,788
m"0
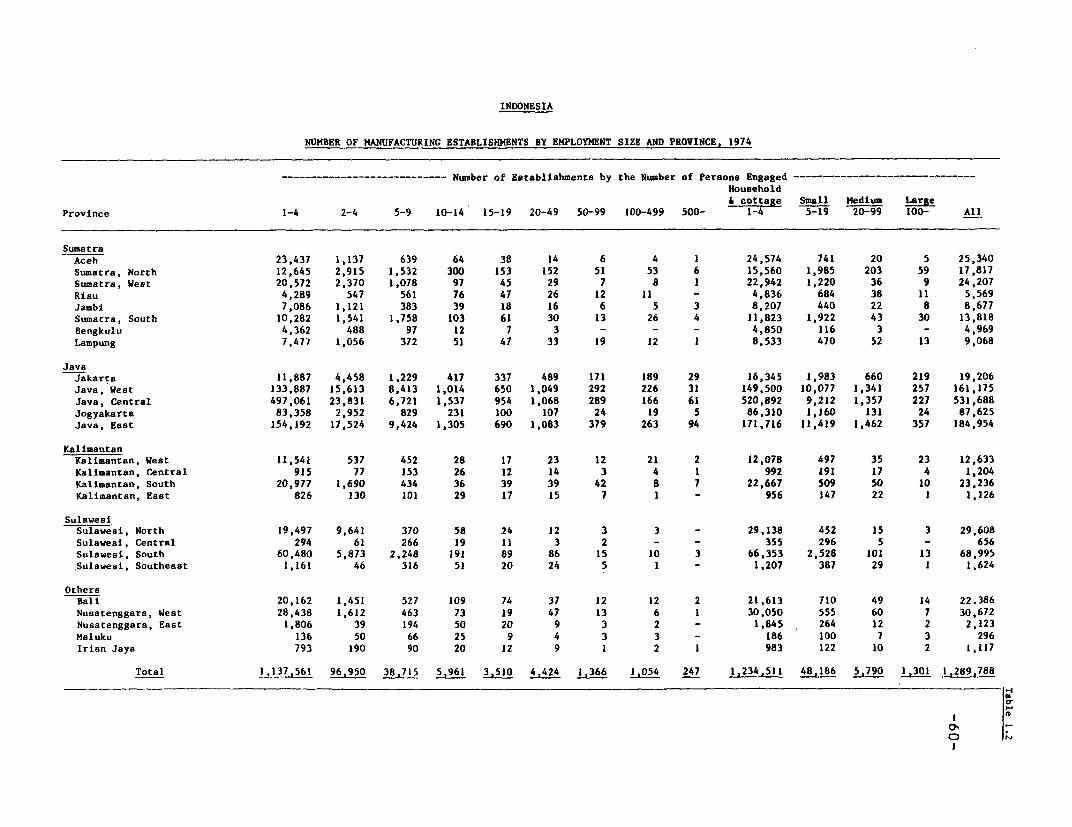
INDONESIA
NUMBER OF MANUFACTURING ESTABLISHMENTS BY EMPLOYMENT SIZE AND PROVINCE, 1974
-------------------------- Number of Establishments by the Number of Persons Engaged ----------------- …-----------
Household& cottage Small Medium Large
Province 1-4 2-4 5-9 10-14 15-19 20-49 50-99 100-499 500- 1-4 5-19 20-99 100- All
SumatraAceh 23,437 1,137 639 64 38 14 6 4 1 24,574 741 20 5 25,340Sumatra, North 12,645 2,915 1,532 300 153 152 51 53 6 15,560 1,985 203 59 17,817Sumatra, West 20,572 2,370 1,078 97 45 29 7 8 1 22,942 1,220 36 9 24,207Riau 4,289 547 561 76 47 26 12 11 - 4,836 684 38 11 5,569Jambi 7,086 1,121 383 39 18 16 6 5 3 8,207 440 22 8 8,677Sumatra, South 10,282 1,541 1,758 103 61 30 13 26 4 11,823 1,922 43 30 13,818Bengkulu 4,362 488 97 12 7 3 - - - 4,850 116 3 - 4,969Lampung 7,477 1,056 372 51 47 33 19 12 1 8,533 470 52 13 9,068
JavaJakarta 11,887 4,458 1,229 417 337 489 171 189 29 16,345 1,983 660 219 19,206Java, West 133,887 15,613 8,413 1,014 650 1,049 292 226 31 149,500 10,077 1,341 257 161,175Java, Central 497,061 23,831 6,721 1,537 954 1,068 289 166 61 520,892 9,212 1,357 227 531,688Jogyakarta 83,358 2,952 829 231 100 107 24 19 5 86,310 1,160 131 24 87,625Java, East 154,192 17,524 9,424 1,305 690 1,083 379 263 94 171,716 11,419 1,462 357 184,954
KalimantanKalimantan, West 11,541 537 452 28 17 23 12 21 2 12,078 497 35 23 12,633Kalimantan, Central 915 77 153 26 12 14 3 4 1 992 191 17 4 1,204Kalimantan, South 20,977 1,690 434 36 39 39 42 8 7 22,667 509 50 10 23,236Kalimantan, East 826 130 101 29 17 15 7 1 - 956 147 22 1 1,126
SulawesiSulawesi, North 19,497 9,641 370 58 24 12 3 3 - 29,138 452 15 3 29,608Sulawesi, Central 294 61 266 19 11 3 2 - - 355 296 5 - 656Sulawesi, South 60,480 5,873 2,248 191 89 86 15 10 3 66,353 2,528 101 13 68,995Sulawesi, Southeast 1,161 46 316 51 20 24 5 1 - 1,207 387 29 1 1,624
OthersBali 20,162 1,451 527 109 74 37 12 12 2 21,613 710 49 14 22.386Nusatenggara, West 28,438 1,612 463 73 19 47 13 6 1 30,050 555 60 7 30,672Nusatenggara, East 1,806 39 194 50 20 9 3 2 - 1,845 264 12 2 2,123Maluku 136 50 66 25 9 4 3 3 - 186 100 7 3 296Irian Jaya 793 190 90 20 12 9 1 2 1 983 122 10 2 1,117
Total 1,137,561 96,950 38,715 5,961 3,510 4,424 1,366 1,054 247 1,234.511 48,186 5,790 1,301 1,289,788
ID0%
l

-61-
Table 2.1
INDONESIA
NUMBER OF ESIABLISHMENTS USING POWER EQUIPMENT BY SIZE & INDUSTRY GROUP. 1974
Number of Establishments by the Number of Persons EngagedIndustry group 5-9 10-14 15-19 20-49 50-99 100-499 500 + SI MI LI All
311-312 Food manufactures 115 40 30 739 208 151 68 155 947 219 1,321313 Beverage industry 1 3 3 26 5 5 2 7 31 7 45314 Tobacco manufactures 1 1 2 35 26 66 51 4 61 117 182321 Textiles 7 11 16 400 229 196 62 34 629 258 921322 Wearing apparel - - - 30 5 5 - - 35 5 40
323 Leather manufactures - 1 - 13 6 5 - 1 19 5 25324 Footwear - - - 11 3 1 3 - 14 4 18331 Wood & wood products 5 7 5 139 44 36 3 17 183 39 239332 Furniture & fixtures - 1 - 31 6 8 - 1 37 8 46341 Paper & paper products - - - 31 7 7 7 - 38 14 52
342 Printing & publishing 7 7 6 115 40 29 2 20 155 31 206351 Industrial chemicals - 1 3 27 15 12 1 4 42 13 59352 Other chemicals 1 2 1 64 42 44 8 4 106 52 162355 Rubber products 3 5 9 163 109 127 8 17 272 135 424356 Plastic products 1 5 4 66 31 24 - 10 97 24 131
361 Pottery, China & earthenware - - 1 12 2 - 1 1 14 1 16362 Glass & glass products - - 1 15 11 16 1 1 26 17 44363 Cement, lime & products 1 - 1 60 11 8 4 2 71 12 85364 Bricks, tiles & clay products - - - 37 21 5 - - 58 5 63369 Non-metallic mineral products - - - 7 2 1 - - 9 1 10
371 Iron & steel industry - - - 2 2 3 - - 4 3 7372 Non-ferrous metals basic
industries - - - - 3 6 - - 3 6 9381 Fabricated metal products
(except machinery) 21 4 9 105 45 51 6 34 150 57 241382 Machinery, except electrical 7 2 3 35 14 14 2 12 49 16 77383 Electrical machinery,
appliances, etc. 2 - - 17 17 22 5 2 34 27 63
384 Transport equipment 7 3 1 46 19 26 7 11 65 33 109385 Scientific photographic
equipment, etc. - - - 7 2 - - - 9 - 9390 Other manufacturing 1 - 3 23 7 5 6 4 30 11 45
Total 150 93 98 2,256 932 873 247 341 3,188 1,120 4,649

-62- Table 2.2
INDONESIA
NUMBER OF ESTABLISHMENTS USING POWER EQUIPMENT BY EMPLOYMENT SIZE AND PROVINCE, 1974
Number of Establishments by the Number of Persons EngagedProvince 5-9 10-14 15-19 20-49 50-99 100-499 500+ SI MI LI All
SumatraAceh 1 - 1 11 5 4 1 2 16 5 23Sumatra, North 16 10 11 134 58 52 6 37 192 58 287Sumatra, West 8 3 - 16 6 7 1 11 22 8 41Riau 3 2 2 20 12 11 - 7 32 11 50Jambi 2 1 - 12 5 5 3 3 17 8 28Sumatera, South 5 1 1 24 13 26 4 7 37 30 74Bengkulu 1 - - 2 - - - 1 2 - 3Lampung 1 1 4 27 19 11 1 6 46 12 64
JavaJakarta 18 16 22 366 157 187 29 56 523 216 795Java, West 33 19 17 686 256 213 31 69 942 244 1,255Java, Central 19 14 11 312 122 131 61 44 434 192 670Jogyakarta - - 3 23 9 16 5 3 32 21 56Java, East 23 19 19 468 211 155 94 61 679 249 989
KalimantanKalimantan, West 1 - 1 19 11 21 2 2 30 23 55Kalimantan, Central 2 - - 9 2 4 - 2 11 4 17Kalimantan, South - 1 3 30 7 7 3 4 37 10 51Kalimantan, East 2 - - 11 6 1 - 2 17 1 20
SulawesiSulawesi, North 2 1 - 6 3 2 - 3 9 2 14Sulawesi, Central 2 - - - 2 - - 2 2 - 4Sulawesi, South 1 1 - 34 12 7 3 2 46 10 58Sulawesi, Southeast - - - 3 1 - - - 4 - 4
OthersBali - 1 2 16 5 6 2 3 21 8 32Nusatenggara, West 2 - - 16 4 2 1 2 20 3 25Nusatenggara, East 5 3 1 6 3 2 - 9 9 2 20Maluku 2 - - 3 3 1 - 2 6 1 9Irian Jaya I - - 2 - 2 - 1 2 2 5
Total 150 93 98 2,256 932 873 247 341 3.188 1,120 4,649

INDONESIA
NUMBER OF PERSONS ENGAGED (TOTAL, PAID & UNPAID), AND PAID AND UNPAID AS Z OF TOTAL FOR A SEGMENT BY INDUSTRY GROUP, 1974
Number of persons engagedHousehold & cottage Small scale Medium & large
Paid Unpaid Paid Unpaid Paid UnpaidIndustry group employees workers Total employees workers Total employees workers Total
311-312 Food manufacturing 77,582 1,303,138 1,380,720 -105,695 38,213 143,908 134,423 1,220 135,643313 Beverage industries 262 5,233 5,495 2,814 698 3,512 4,677 27 4,704314 Tobacco manufactures 3,788 11,174 14,962 3,081 693 3,774 127,550 491 128,041321 Textiles 8,419 390,436 398,855 39,365 7,392 46,757 162,390 2,608 164,998322 Wearing apparel 2,635 23,653 26,288 3,740 1,030 4,770 2,542 75 2,617
323 leather man,,factsirea 1:224 3.001 4.225 960 222 1.182 1,529 20 1.549324 Footwear 1,383 4,373 5,756 2,224 442 2,666 5,040 42 5,082331 Wood & wood products 17,431 1,518,941 1,536,372 20,897 4,669 25,566 18,880 154 19,034332 Furniture & fixtures 13,129 94,503 107,632 12,628 3,486 16,114 3,252 82 3,334341 Paper 6 paper products 393 4,751 5,144 579 81 660 7,240 41 7,281
342 Printing & publishing 1,238 3,096 4,334 6,536 871 7,407 14,619 82 14,701351 Industrial chemicals - - - 964 120 1,084 4,474 35 4,509352 Other chemicals 2,099 5,914 8,013 3,578 677 4,255 24,205 87 24,292355 Rubber products 1,841 4,434 6,275 3,721 420 4,141 45,663 82 45,745356 Plastic products 1,131 5,527 6,658 2,516 394 2,910 9,187 69 9,256
361 Pottery, china & earthernware 1,065 60,484 61,549 1,025 403 1,428 1,048 20 1,068362 Glass & glass products - - - 161 35 196 5,098 26 5,124363 Cement, lime & products 4,847 14,093 18,940 13,497 2,636 16,133 11,319 177 11,496364 Bricks, tiles & clay products 22,447 143,650 166,097 21,955 6,244 28,199 5,862 187 6,049369 Non-metallic mineral products 961 15,656 16,617 824 136 960 851 9 860
371 Iron & steel industries - - - 19 2 21 930 3 933372 Non-ferrous metal basic industries - - - 27 2 29 1,127 - 1,127381 Fabricated metal products (except machinery) 9,762 39,769 49,531 12,847 3,318 16,165 21,135 157 21,292382 Machinery, except electrical - - - 1,210 209 1,419 7,274 37 7,311383 Electrical machinery, appliances, etc. - - - 464 89 553 12,169 6 12,175
384 Transport equipment 680 5,562 6,242 2,973 563 3,536 14,539 68 14,607385 Scientific,photographic equipment, etc. - - - 338 52 390 469 13 482390 Other manufacturing 4,869 65,282 70,151 4,358 1,141 5,499 8,329 65 8,394
Total 177,186 3,722,670 3,899,856 269,005 74,235 343,240 655,821 5,883 661_,704
W.

No. of persons enRaged X o f t o t a lAll manufacturing Household & cottage Small scale Medium & large
lndustry group Paid Unpaid Grand Total Paid Unpaid Paid Unpaid Paid Unpaid
311-312 Food manufacturing 317,700 1,342,571 1,660,271 5.62 94.38 73.45 26.55 99.1 0.90313 Beverage industries 7,753 5,958 13,711 4.77 95.23 80.12 19.87 99.4_. 0. .314 Tobacco manufactures 134,419 12,358 146,777 25.32 74.68 81.64 18.36 99.62 0..321 Textiles 210,174 400,436 610,610 2.11 97.89 84.19 15.81 98.4' 1.58322 Wearing apparel 8,917 24,758 33,675 10.02 89.98 78.41 21.59 97.1 2.87
323 Leather manufactures 3,713 3,243 6,956 28.97 71.03 81.22 18.78 98.71 1.'>324 Footwear 8,647 4,857 13,504 24.03 75.97 83.42 16.58 99.17 0.83331 Wood & wood products 57,208 1,523,764 1,580,972 1.13 98.87 81.74 18.26 99.19 0.81332 Furniture & fixtures 29,009 98,071 127,080 12.20 87.80 78.37 21.63 97.54 2.46341 Paper & paper products 8,212 4,873 13,085 7.64 92.36 87.73 12.27 99.44 0.56
342 Printing & publishing 22,393 4,049 26,442 28.56 71.44 88.24 11.76 99.44 0.56351 Industrial chemicals 5,438 155 5,593 - - 88.93 11.07 99.22 0.78352 Other chemicals 29,882 6,678 36,560 26.19 73.81 84.09 15.91 99.64 0.36355 Rubber products 51,225 4,936 56,161 29.34 70.66 89.86 10.14 99.82 0.18356 Plastic products 12,834 5,990 18,824 16.99 83.01 86.46 13.54 99.25 0.75
361 Pottery, china & earthernware 3,138 60,907 64,045 1.73 98.27 71.78 28.22 98.13 1.87362 Glass & glass products 5,259 61 5,320 - - 82.14 17.86 99.49 0.51363 Cement, lime & products 29,663 16,906 46,569 25.59 74.41 83.66 16.34 98.46 1.54364 Bricks, tiles & clay products 50,264 150,081 200,345 13.51 86.49 77.86 22.14 96.91 3.09369 Non-metallic mineral products 2,636 15,801 18,437 5.78 94.22 85.83 14.17 98.95 1.05
371 Iron & steel industries 949 5 954 - - 90.48 9.52 99.68 0.32372 Non-ferrous metal basic industries 1,154 2 1,156 - - 93.10 6.90 100.00 0.00381 Fabricated metal products (except machinery) 43,744 43,244 86,988 19.71 80.29 79.47 20.53 99.26 0.74382 Machinery, except electrical 8,484 246 8,730 - - 85.27 14.73 99.49 0.51383 Electrical machinery, appliances, etc. 12,633 95 12,728 - - 83.91 16.09 99.95 0.05
384 Transport equipment 18,192 6,193 24,385 10.89 89.11 84.08 15.92 99.53 0.47385 Scientific, photographic equipment, etc. 807 65 872 - - 86.67 13.33 97.30 2.70390 Other manufacturing 17,556 66,488 84,044 6.94 93.06 79.25 20.75 99.23 0.77
Total 1,102,012 3,802,788 4,904,800 4.54 95.46 78.37 21.63 99.11 0.89
ma
s
Iz

Table 3 .2-65- Page 1
INDONESIA
NO. OF PERSONS ENGAGED (TOTAL, PAID, UNPAID) AND PAID & UNPAID AS % OF TOTAL FORA SEGMENT BY PROVINCE, 1974
No. of Persons Engaged (Total)Household & Cottage Small Scale Medium & Large
Paid Unpaid Paid Unpaid Paid UnpaidProvince employees workers Total employees workers Total employees workers Total
SumatraAceh 2,294 71,268 73,562 4,162 854 5,016 2,884 3 2,887Sumatra, North 4,938 47,469 52,407 12,462 3,288 15,750 25,117 141 25,258Sumatra, West 4,302 61,577 65,879 4,747 2,963 7,710 4,256 32 4,288Riau 882 14,949 15,831 3,793 989 4,782 3,226 18 3,244Jambi 2,461 24,938 27,399 2,103 726 2,829 3,689 12 3,701Sumatra, South 2,866 35,870 38,736 8,635 3,550 12,185 11,085 26 11,111Bengkulu 573 14,264 14,837 619 228 847 60 3 63Lampung 2,117 26,656 28,773 3,051 582 3,633 4,302 17 4,319
JavaJakarta 8,734 49,215 57,949 15,920 2,590 18,510 87,512 431 87,943Java, West 29,750 442,649 472,399 56,366 15,101 71,467 115,416 1,213 116,629Java, Central 41,078 1,592,373 1,633,451 59,678 14,348 74,026 146,014 1,848 147,862Jogyakarta 5,193 262,667 267,860 6,802 2,489 9,291 13,524 280 13,804Java, East 33,301 535,670 568,971 56,824 14,333 71,157 204,433 1,537 205,970
KalimantanKalimantan, West 1,045 37,955 39,000 2,020 1,084 3,104 7,998 24 8,022Kalimantan, Central 206 3,203 3,409 1,289 219 1,508 1,223 1 1,224Kalimantan, South 3,601 70,160 73,761 2,951 743 3,694 4,407 27 4,434Kalimantan, East 348 3,021 3,369 1,090 177 1,267 944 14 958
SulawesiSulawesi, North 16,409 81,775 98,184 2,418 803 3,221 1,005 8 1,013Sulawesi, Central 114 1,129 1,243 1,058 781 1,839 187 3 190Sulawesi, South 10,418 194,201 204,619 10,955 4,888 15,843 6,097 77 6,174Sulawesi, Southeast 104 3,686 3,790 1,642 1,036 2,678 914 27 941
OthersBali 3,062 61,380 64,442 4,693 937 5,630 5,726 85 5,811Nusatenggara, West 2,893 77,399 80,292 2,504 844 3,348 3,254 34 3,288Nusatenggara, East 76 5 297 5,373 1,616 413 2,029 775 10 785Maluku 110 659 769 700 155 855 1,020 3 1,023Irian Jaya 311 3,.240 3,551 907 114 1,021 753 9 762
Total 177,186 3 702,670 3,899,856 969,005 74,235 343,240 655.821 5,883 661,704

:able 3.2-66- Page 2
No. of Persons Engaged % of TotalAll Manufacturing Sectors Household & Cottage Small Scale Medium & LargePaid Unpaid Grand Paid Unpaid Paid Unpaid Paid Unpaid
Bro':ince employees workers total employees workers erployee- -orke- emplov"'q workers
SumatraAceh 9,340 72,125 81,465 3.1 96.9 83.0 17.0 99.9 0.1Sumatra, North 42,517 50,898 93,415 9.4 90.6 79.1 20.9 99.4 0.6Sumatra, West 13,305 64,572 77,877 6.5 93.5 61.6 38.4 99.3 0.7Riau 7,901 15,956 23,857 5.6 94.4 79.3 20.7 99.4 0.6Jambi 8,253 25,676 33,929 9.0 91.0 74.3 25.7 99.7 0.3Sumatra, South 22,586 39,446 62,032 7.4 92.6 70.9 29.1 99.8 0.2Bengkulu 1,252 14,495 15,747 3.9 96.1 73.1 26.9 95.2 4.8Lampung 9,470 27,255 36,725 7.4 92.6 84.0 16.0 99.6 0.4
JavaJakarta 112,166 52,236 64,402 15.1 84.9 86.0 14.0 99.5 0.5Java, West 201,532 458,963 660,495 6.3 93.7 78.9 21.1 99.0 1.0Java, Central 246,770 1,608,569 1,855,339 2.5 97.5 80.6 19.4 98.8 1.2Jogyakarta 25,519 265,436 390,955 1.9 98.1 73.2 26.8 98.0 2.0Java, East 294,558 551,540 846,098 5.9 94.1 79.9 20.1 99.3 0.7
KalimantanKalimantan, West 11,063 39,063 50,126 2.7 97.3 65.1 34.9 99.7 0.3Kalimantan, Central 2,718 3,423 6,141 6.0 94.0 85.5 14.5 99.9 0.1Kalimantan, South 10,959 70,930 81,889 4.9 95.1 79.9 20.1 99.4 0.6Kalimantan, East 2,382 3,212 5,594 10.3 89.7 86.0 14.0 98.5 1.5
SulawesiSulawesi, North 19,832 82,586 102,418 16.7 83.3 75.1 24.9 99.2 0.8Sulawesi, Central 1,359 1,913 3,272 9.2 90.8 57.6 42.5 98.4 1.6Sulawesi, South 27,470 199,166 226,636 5.1 94.9 69.1 30.9 98.8 1.2Sulawesi, Southeast 2,660 4,749 7,409 2.7 97.3 61.3 38.7 97.1 2.9
OthersBali 13,481 62,402 75,883 4.8 95.2 83.4 16.6 98.5 1.5Nusatenggara, West 8,651 78,277 86,928 3.6 96.4 74.8 25.2 99.0 1.0Nusatenggara, East 2,467 5,720 8,187 1.4 98.6 79.6 20.4 98.7 1.3Maluku 1,830 817 3,647 14.3 85.7 81.9 18.1 99.7 0.3Irian Jaya 1,971 3,363 5,334 8.8 91.2 88.8 11.2 98.8 1.2
Total 1.102.012 3,802.788 4,904,800 4.5 95.5 78.4 21.6 99.1 0.9

INDONESIA
NUMBER OF PERSONS ENGAGED PER ESTABLISHMENT, NUMBER OF DAYS PER PERSON ENGAGED,AND WAGES AND SALARIES PER EMPLOYEE PER DAY BY INDUSTRY GROUP, 1974
No. of personsengaged/estabishment No. of days/person engaged Wages & salaries
Hshid. & cottage Household & cottage Rp per employee/dayHousehold With Household Withmembers hired Small Medium members hired Small Medium Household Small Mediuim
Industry group only labor scale 6 large only labor All scale 6 large 6 cottage scale & large
311-312 Food manufacturing 3 2 6 88 129 212 134 209 235 226 266 586313 Beverage industries 3 2 8 78 79 210 85 229 187 245 286 2,176314 Tobacco manufactures 3 2 3 166 104 158 118 126 277 469 188 270321 Textiles 3 2 10 85 86 256 89 222 255 146 218 436322 Wearing apparel 3 2 8 36 90 258 107 215 250 278 310 397
323 Leather manufactures 3 2 8 57 97 232 136 264 243 236 298 458324 Footwear 3 2 7 164 101 273 142 212 230 405 436 1,241331 Wood & wood products 3 2 8 59 89 222 91 201 221 343 373 782332 FurnJture 6 fixtures 3 2 7 39 90 231 107 244 246 300 371 659341 Paper & paper products 3 3 10 121 97 275 111 224 224 370 199 1,067
342 Printing & publishing 3 2 9 64 88 275 141 271 229 230 360 636351 Industrial chemicals - - 9 68 - - - 226 220 - 311 895352 Other chemicals 3 2 8 106 62 143 83 225 213 289 382 1,084355 Rubber products 3 2 9 98 69 209 110 230 239 210 292 656356 Plastic products 3 2 10 67 81 271 113 244 251 259 304 449
361 Pottery, china & earthernware 3 2 7 53 120 192 121 208 246 191 235 441362 Glass & glass products - - 9 102 - - - 234 235 - 266 860363 Cement, lime 6 products 3 2 7 53 86 193 114 196 248 286 307 986364 Bricks, tiles 6 clay products 3 2 7 33 119 245 136 180 258 255 224 268369 Non-metallic mineral products 3 2 9 66 96 284 107 210 254 169 272 568
371 Iron & steel industries - - 10 104 - - - 275 245 - 350 910372 Non-ferrous metal basic industries - - 7 125 - - - 299 203 - 377 1,468381 Fabricated metal products (except machinery) 3 2 7 88 92 227 119 228 223 264 316 742382 Machinery, except electrical - - 9 107 - - - 277 225 - 389 866383 Electrical machinery, appliances, etc. - - 9 184 - - - 264 223 - 366 1,156
384 Transport equipment 3 2 8 130 71 215 87 249 214 318 402 1,470385 Scientific,photographic equipment,etc. - - 10 37 - - - 278 263 - 328 452390 Other manufacturing 3 2 8 i29 97 252 108 222 222 265 308 1,587
Total 3 2 7 93 105 222 110 213 246 255 285 572
_ _ _ _ _ _ _ _ _ _ _ _~~~~~~~~~~~~~~~a
lJ 0

-68- Table 4.2
INDONESIA
NUMBER OF PERSONS ENGAGED PER ESTABLISHMENT, NUMBER OP DAYS PER PERSON ENGAGEDAND WAGES AND SALARIES PER EMPLOYEE PER DAY BY PROVINCE, 1974
No. of personsengaged/estabishment No. of days/person engaged Wages & salaries
Eshid. & cottage Household & cottage Rp per employee/dayHousehold With Household Withmembers hired Small Medium members hired Small Medium Household Small Medium
Industry group only labor scale & large only labor All scale & large 6 cottage scale & large
SumatraAceh 3 2 7 115 65 219 70 166 196 351 388 674Sumatra, North 3 2 8 93 84 223 97 230 250 306 344 508Sumatra, West 3 2 6 95 77 245 88 218 266 342 460 1,088Riau 3 2 7 66 77 236 86 201 214 427 432 744Jambi 3 2 6 123 78 147 84 171 265 691 373 671Sumatra, South 3 2 6 152 81 247 93 172 241 351 371 1,188Bengkulu 3 1 7 21 60 232 67 225 210 307 372 845Lampung 3 2 8 66 83 231 94 194 203 247 342 756
JavaJakarta 3 2 9 100 103 286 131 236 227 362 429 1,107Java, West 3 2 7 73 92 213 99 199 250 263 277 568Java, Central 3 2 8 93 119 250 123 227 255 178 245 392Jogyakarta 3 2 8 89 107 238 108 265 250 198 222 552Java, East 3 2 6 113 116 250 124 217 251 209 229 446
KalimantanKalimantan, West 3 3 6 138 63 212 67 194 205 391 393 914Kalimantan, Central 3 3 8 58 80 218 88 168 241 292 430 706Kalimantan, South 3 2 7 74 101 231 107 211 186 354 325 769Kalimantan, East 3 3 9 42 72 198 85 226 232 607 562 923
SulawesiSulawesi, North 3 2 7 56 47 80 53 166 235 576 719 389Sulawesi, Central 3 2 6 38 64 246 80 181 231 303 277 499Sulawesi, South 3 2 6 44 84 206 90 189 227 241 207 866Sulawesi, Southeast 3 2 7 31 59 221 64 161 249 315 363 250
OthersBali 3 2 8 92 86 242 94 243 253 192 224 320Nusatenggara, West 3 2 6 49 74 215 79 212 220 166 205 201Nusatengarra, East 3 2 8 56 43 237 42 168 272 190 239 288Maluku 4 2 9 102 67 264 95 217 255 423 432 431Irian Jaya 3 2 8 64 117 299 133 226 142 469 413 1,165
Total 3 2 7 93 105 222 110 213 246 255 285 572

INDONESIA
NUMBER OF MAN-DAYS, WAGES & SALARIES, VALUE ADDED, GROSS OUTPUT, VALUE ADDED/PERSONENGAGED, AND VALUE ADDED/GROSS OUTPUT (2) BY INDUSTRY GROUP, 1974
Number of man-days ('000)/a Wages 6 Salaries (Rp million) Value added (Rp million)Household Small Medium Household Small Medium Household Small Medium
Industry group & cottage scale & large 6 cottage scale 6 large A cottage scale 6 large
311-312 Food manufacturing 184,891 22,072 31,840 3,703.7 5,877.0 18,678.4 36,053.3 24,756.2 110,114.2313 Beverage industries 469 641 882 13.5 182.9 1,920.4 205.6 540.5 14,435.1314 Tobacco manufactures 1,764 385 35,422 280.7 72.4 9,035.1 1,040.9 340.9 102,174.4321 Textiles 35,665 8,714 42,125 314.3 1,902.6 18,407.6 4,892.9 4,798.4 67,807.9322 Wearing apparel 2,805 802 655 188.8 248.9 260.0 1,372.0 683.8 536.8
323 Leather manufactures 573 253 377 67.0 75.4 172.7 293.2 251.8 749.7324 Footwear °:' 468 i,16i i52.6 203.8 1,450.0 575.3 528.9 3,118.2331 Wood & wood products 139,590 4,193 4,215 1,328.8 1,564.7 3,297.5 17,426.2 4,543.0 11,327.6332 Furniture & fixtures 11,556 3,068 822 911.5 1,138.5 542.0 4,522.4 2,448.5 1,207.0341 Paper & paper products 570 130 1,628 40.0 25.8 1,738.0 206.4 72.4 6,300.7
342 Printing & publishing 611 1,773 3,371 78.1 638.7 2,144.4 274.8 1,626.1 6,396.2351 Industrial chemicals - 217 994 - 67.5 889.8 - 453.7 4,734.3352 Other chemicals 668 806 5,166 86.6 307.6 5,600.5 407.6 1,020.2 16,472.8355 Rubber products 689 841 10,946 80.9 245.7 7,186.8 291.8 1,277.8 38,165.7356 Plastic products 755 613 2,326 79.5 186.4 1,046.1 440.7 587.8 3,121.6
361 Pottery, china & earthernware 7,458 213 262 39.0 50.2 115.7 834.9 119.2 254.5362 Glass 6 glass products - 38 1,206 - 10.0 1,037.8 - 34.2 2,617.4363 Cement, lime & products 2,155 2,633 2,857 267.9 808.1 2,818.4 1,040.1 2,400.9 12,294.4364 Bricks, tiles & clay products 22,619 3,932 1,563 1,398.8 882.5 418.5 7,292.4 1,819.3 1,155.7369 Non-metallic mineral products 1,778 173 218 46.2 47.2 123.8 367.3 129.5 310.3
371 Iron 6 steel industries - 5 228 - 1.8 207.8 - - 829.6372 Non-ferrous metal basic industries - 8 229 - 2.0 336.5 - 7.9 3,169.1381 Fabricated metal products (except machinery) 5,885 2,928 4,959 586.0 926.3 2.678.8 2,540.1 2,309.7 12,183.3382 Machinery, except electrical - 335 1,644 - 130.4 1,424.5 - 301.0 9,236.3383 Electrical machinery, appliances, etc. - 123 2,717 - 44.9 3,141.8 - 308.7 16,058.5
384 Transport equipment 543 739 3,131 46.4 297.2 4,604.2 419.9 873.8 22,646.8385 Scientific,photographic equipment,etc. - 94 127 - 30.8 57.3 - 73.2 155.4390 Other manufacturing 7,596 969 1,865 325.6 298.5 2,960.4 2,066.6 720.1 10,550.9
Total 429,450 57,171 163,020 10,035.9 16,270.3 93,294.8 82,564.5 53,027.5 76_,947.2
/a Except for CI, relates to only paid employees; CIa have only 39.4 million man-days for paid employees.
ma
aa

Gross output (Rp million) Value added (Rp)/person engaged Value added/Gross output (X)Household Small Medium Household Small Medium Household Small Medium
Industry group 6 cottage scale 6 large & cottage scale & large & cottage scale 6 large
311-312 Food manufacturing 111,004.9 83,393.5 287,614.7 27,666 172,028 812,015 32.48 29.68 38.30313 Beverage industries 427.9 1,372.4 20,867.3 39,289 153,901 3,068,686 48.05 39.38 69.17314 Tobacco manufactures 2,659.9 1,263.4 235,390.1 93,154 90,328 797,982 39.13 26.98 43.41321 Textiles 12,331.1 16,876.1 220,660.3 12,532 102,624 410,962 39.68 28.43 30.73322 Wearing apparel 3,715.2 2,215.1 1,439.8 58,005 143,354 205,120 36.93 30.86 37.28
323 Leather manufactures 746.1 820.7 3,263.5 97,701 213,029 483,990 39.30 30.68 22.97324 Footwear 1,399.0 1,200.7 7,511.1 131,557 198,387 613,577 41.12 44.04 41.51331 Wood & wood products 29,520.9 11,414.1 26,216.2 11,473 177,697 595,125 59.02 39.80 43.21332 Furniture & fixtures 9,351.3 5,099.4 2,475.1 47,855 151,949 362,028 48.36 48.01 48.77341 Paper & paper products 411.5 184.5 18,034.2 43,443 109,697 865,362 50.16 39.24 34.94
342 Printing & publishing 450.0 3,543.3 12,108.0 88,760 219,536 435,086 61.07 45.89 52.83351 Industrial chemicals - 914.0 10,224.6 - 418,542 1,049,967 - 49.63 46.30352 Other chemicals 1,240.7 2,976.3 48,392.5 68,921 239,765 678,116 32.85 34.27 34.04355 Rubber products 811.5 3,490.4 124,338.0 65,810 308,573 834,314 35.96 36.60 30.70356 Plastic products 990.6 2,198.2 11,279.6 79,736 201,993 337,252 44.49 26.74 27.67
361 Pottery, china & earthernware 1,276.7 228.9 595.2 13,804 83,473 238,296 65.40 52.07 42.76362 Glass & glass products - 74.8 5,862.5 - 175,385 510,812 - 45.72 44.65363 Cement, lime 6 products 2,136.9 6,503.7 23,601,6 73,802 148,819 1,069,450 48.67 36.91 52.09364 Bricks, tiles 6 clay products 11,784.1 2,926.6 1,720.8 50,765 64,516 191,056 61.88 62.16 67.16369 Non-metallic mineral products 624.8 257.8 464.5 23,461 134,896 360,814 58.79 50.23 66.80
371 Iron 6 steel industries - - 4,639.2 - - 889,175 - - 17.88372 Non-ferrous metal basic industries - 30.2 14,166.0 - 272,414 2,811,979 - 26.15 22.37381 Fabricated metal products (except machinery) 5,293.0 5,860.1 40,073.1 63,871 142,883 572,201 47.99 39.41 30.40382 Machinery, except electrical - 596.7 15,326.1 - 212,121 1,263,343 - 50.44 60.26383 Electrical machinery, appliances, etc. - 674.4 39,204.5 - 558,228 1,318,973 - 45.77 40.96
384 Transport equipment 622.0 1,687.0 78,786.9 75,494 247,115 1,550,407 67.51 51.79 28.74385 Scientific,photographic equipment,etc. - 190.8 389.9 - 187,692 332,407 - 38.36 39.86390 Other manufacturing 4,028.4 1,575.0 19,362.7 31,656 130,951 1,256,957 51.30 45.72 54.49
Total 200,826.5 157,558.0 1,293,786.5 21,171 154.491 720,786 41.11 33.65 36.86
_ _~~~~~~~~~~~~~~~~~~~~~_
_l
lW
m I

Table 5.2
-71- Page 1
INDONESIA
NUMBER OF MAN-DAYS, WAGES & SALARIES, VALUE ADDED, GROSS OUTPUT, VALUE ADDED/PERSONENGAGED AND VALUE ADDED/GROSS OUTPUT (%) AND NO. OF MAN-DAYS BY PROVINCE, i974
Number of man-days ('000) Wages & Salaries (Rp million) Value added (Rp ml lion)Household Small Medium Household Small Medium Household Small Medium
Province & cottage scale & large & Cottage scale & large & cottage scale & lar6e
SumatraAceh 5,132 686 567 176.0 266.6 382.4 2,558.2 888.7 1,557.7Sumatra, North 5,100 2,858 6,312 337.3 982.5 3,206.7 2,283.7 3,442.3 27,756.5Sumatra, West 5,770 1,022 1,141 360.8 470.4 1,241.7- 2,264.2 1,117.6 6,330.7Riau 1,355 762 696 88.9 329.5 517.5 818.8 1,143.5 2,586.5Jambi 2,310 358 982 250.0 133.3 658.8 1,114.4 448.2 2,546.5Sumatra, South 3,612 1,479 2,678 248.8 548.5 3,182.0 2,768.7 2,918.0 12,062.3Bengkulu 995 139 13 40.8 51.8 11.2 376.3 216.9 23.2Lampung 2,710 592 875 120.7 202.4 661.9 820.6 695.7 4,894.4
JavaJakarta 7,589 3,758 19,921 905.7 1,611.1 22,058.7 5,222.7 4,869.6 92,906.3Java, West 46,897 11,143 29,135 1,663.4 3,088.5 16,562.2 11,175.5 9,686.9 90,635.7Java, Central 200,198 13,520 37,647 1,824.5 -3,318.9 14,769.6 22,693.7 9,675.4 72,977.7Jogyakarta 28,905 1,800 3,447 .244.6 398.8 1,902.7 3,116.3 1,208.7 6,353.6Java, East 70,549 12,354 51,640 1,742.2 2,834.6 23,025.7 12,462.2 10,198.1 132,326.3
KalimantanKalimantan, West 2,631 392 1,930 8.5 53.1 21.9 1,215.1 564.0 9,736.1Kalimantan, Central 300 216 295 516.3 427.6 1,213.4 119.5 371.4 861.2Kalimantan, South 7,933 622 824 7.2 96.2 58.5 2,285.5 695.7 1,759.6Kalimantan, East 287 247 223 86.9 154.2 1,763.4 320.3 465.0 669.3
SulawesiSulawesi, North 5,203 40i: 238 13.1 92.9 208.5 3,176.8 373.5 984.1Sulawesi, Central 99 191, 44 293.9 201.8 633.3 62.2 177.3 440.4Sulawesi, South 8,458 2,065 1,402 41.9 138.6 205.5 4,652.3 1,266.5 7,631.9Sulawesi, Southeast 241 265 234 759.9 289.0 92.6 75.5 256.1 109.3
OthersBali 6,050 1,14) 1,468 142.4 256.0 470.5 1,283.3 1,158.6 1,410.7Nusatenggara, West 6,346 530 724 102.8 108.7 145.6 1,136.9 494.0 621.1Nusatenggara, East 224 27; 214 3.4 65.2 61.6 47.3 256.4 174.1Maluku 73 15:! 261 12.3 65.5 112.6 107.3 168.1 855.1Irian Jaya 471 205 108 43.6 84.6 126.3 407.3 271.1 235.6
Total 429,458 57,17J. 163,020 10,035.9 16,270.3 93,294.8 82,564.5 53,027.5 476.947.2

Table 5.2
-72- Page 2
Gross output (Rp million) Value added (Rp)/person engaged Value added/gross output (M)Household Small Madium Household small Medium Household Small Medium
Province & cottage scale 6 large 6 cottage scale 6 large 6 cottage scale 6 large
SumatraAceh 4,940.4 3,358.1 4,022.1 34,776 177,173 885,937 51.78 26.46 38.72Sumatra, Nortb 5,836.0 12,973.5 66,825.7 43,576 218,559 1,098,919 39.13 26.53 41.53Sumatra, West 4,859.3 3,525.2 16,675.1 34,369 144,559 1,476,376 46.59 31.70 37.96Riau 1,226.0 3,082.1 10,292.9 51,721 239,126 797,318 66.78 37.07 25.12Jambi 1,710.5 1,734.1 18,352.9 40,673 158,431 688,057 65.15 38.19 13.87Sumatra, South 5,344.2 7,651.4 41,089.4 71,476 239,475 1,085,618 51.80 38.31 29.35Bengkulu 717.5 531.2 31.2 25,362 256,080 368,254 52.44 40.83 74.35Lampung 1,859.8 2,797.5 16,063.3 28,520 191,495 1,133,225 44.12 24.86 30.46
JavaJakarta 12,688.7 13,097.5 288,013.0 90,126 263,079 1,056,438 41.16 37.18 32.25Java, West 27,443.5 28,326.3 205,186.6 23,657 135,544 777,128 40.72 34.20 44.17Java, Central 58,976.6 29,483.8 24,218.7 13,893 130,703 493,553 38.47 32.82 32.54Jogyakarta 9,755.9 3,693.4 20,166.2 11,634 130,094 460,272 31.94 32.73 31.01Java, East 32,893.3 30,941.9. 304,668.5 21,903 143,318 642,454 37.88 32.96 43.43
KalimantanKalimantan, West 3,219.3 1,892.4 26,952.9 31,156 181,701 1,213,675 31.03 29.80 36.12Kalimantan, Central 234.5 844.8 2,836.4 35,054 246,286 703,595 50.95 43.96 30.36Kalimantan, South 4,637.1 1,608.5 5,976.3 30,985 188,332 396,843 49.28 43.25 29.44Kalimantan, East 440.3 1,090.4 1,888.3 95,072 367,009 698,643 72.74 42.64 35.44
SulavesiSulawesi, North 7,300.3 880.8 3,555.7 32,355 115,958 971,471 43.51 42.40 27.67Sulavesi, Central 157.8 330.3 1,499.8 50,040 96,411 2,317,895 39.41 53.68 29.36Sulavesi, South 8,486.0 3,165.7 19,942.4 22,736 79,941 1,236,135 54.82 40.01 38.26Sulawesi, Southeast 134.1 376.4 156.9 19,921 95,631 116,153 56.30 68.04 69.66
OthersBali 4,134.5 3,958.1 7,310.4 19,914 205,790 242,764 31.03 29.27 19.29Nusatenggara, West 2,728.2 1,183.6 3,277.0 14,160 147,551 188,899 41.67 41.74 18.95Nusatenggara, East 145.7 716.3 404.3 8,803 126,368 221,783 32.46 35.80 43.06Maluku 192.0 347.4 3,932.0 139,532 196,608 835,875 55.88 48.39 21.74Irian Jaya 762.9 559.8 448.4 114,700 265,524 309,186 53.38 48.43 52.54
Total 200,826.5 157,558.0 1.293,786.5 21.171 154.491 720.786 41.11 33.65 36.86

INWDNESIA
PERCENTAGE DISTRIBUTION OF NUMBER OF ESTABLISHMENTS, NUMBER OF PERSONS ENGAGED,NUMBER OF KAN-DAYS. VALUE ADDED AND GROSS OUTPUT BY INDUSTRY CROUP. 1974
limber of persona en.gaged (total)Number of establishe.ts _ Household 6 cottage Number of man-days Value added Gross output
Household Small Medium Household With Small Medium Household Small Medium Household Small Hedium Nousehold Small Medium
Industry group 6 cottage scale & large me,mber hired All scale S large I, cottage scale 4 large * cottage scale I large 6 cottage scale S largeonly labor
311-312 Food manufacturing 34.77 46.82 21.69 35.00 43.79 35.40 41.93 20.50 43.05 38.61 19.53 43.67 46.69 23.09 55.27 52.93 22.23313 Beverage Industries 0.14 0.86 0.85 0.14 0.15 0.14 1.02 0.71 0.11 1.12 0.54 0.25 1.02 3.03 0.21 0.87 i.61314 Tobaco .anufactures 0.27 2.70 10.84 0.30 2.14 0.38 1.10 19.35 0.41 0.67 21.74 1.26 0.64 21.42 1.32 0.80 18.19321 Textilea 10.48 9.65 27.30 10.49 4.75 10.23 13.62 24.94 8.30 15.24 25.84 5.93 9.05 14.22 6.14 10.71 17.06
322 Wearing apparel 0.63 1.30 1.02 0.64 1.49 0.67 1.39 0.40 0.65 1.40 0.40 1.66 1.29 0.11 1.85 1.41 0.11
323 Leather manufactures 0.08 0.32 0.34 0.08 0.69 0.11 0.34 0.23 0.13 0.44 0.23 0.36 0.47 0.16 0.37 0.52 0.25324 Footwear 0.12 0.75 0.44 0.12 0.78 0.15 0.78 0.77 0.19 0.82 0.72 0.70 1.00 0.65 0.70 0.76 0.58331 Wood 6 wood products 40.67 6.69 4.54 40.80 9.84 39.40 7.45 2.88 32.50 7.33 2.59 21.11 8.57 2.38 14.70 7.24 2.03
332 Furniture 4 fixturea 2.66 4.63 1.20 0.13 0.22 0.13 0.19 1.10 2.69 5.37 0.50 0.25 0.14 1.32 0.20 0.12 1.39
341 Paper 6 paper products 0.12 0.13 0.85 0.08 0.70 0.11 0.22 2.22 0.13 0.23 1.00 0.33 3.07 1.34 0.22 2.25 0.94
342 Printing & publiahing 0.09 1.66 3.23 - - - 0.32 0.68 0.14 3.10 2.07 - 0.86 0.99 - 0.58 0.79351 Industrial chemical - 0.25 0.93 0.16 1.18 0.21 1.24 3.62 0.38 0.61 0.49 1.92 3.45 0.62 1.89 3.74
352 Other chemlcals 0.16 1.04 5.22 0.12 1.04 0.16 1.21 6.91 0.16 1.41 3.17 0.35 2.41 8.00 0.40 2.22 9.61355 Rubber products 0.12 0.94 6.60 0.15 0.64 0.17 0.85 1.40 0.16 1.47 6.71 0.53 1.11 0.65 0.49 1.39 0.87
356 Plastic products 0.35 0.63 1.93 1.62 0.60 1.58 0.42 0.16 0.18 1.07 1.43 1.01 0.22 0.05 0.64 0.14 0.05
361 Pottery, chIna 6 earthernware 1.70 0.42 0.28 - - - 0.06 0.77 1.74 0.37 0.16 - 0.06 0.55 - 0.05 0.45362 Glass 6 glsaa products - 0.04 0.71 0.38 2.74 0.49 4.70 1.74 - 0.07 0.74 1.26 4.53 2.58 1.06 4.13 1.82363 Cem.ent, lime S products 0.37 4.72 3.05 3.86 12.67 4.26 8.22 0.91 0.50 4.61 1.75 8.83 3.43 0.24 5.87 1.86 0.13364 fricks, tiles. clay prod-ts 4.03 8.60 2.55 0.42 0.54 0.43 0.28 0.13 5.27 6.88 0.96 0.44 0.24 0.07 0.31 0.16 0.04369 Non-etallIc mineral products 0.43 0.22 0.18 - - - 0.006 0.14 0.41 0.30 0.13 - - 0.17 - - 0.36
371 Iron 4 steel industries - 0.004 0.13 - - - 0.006 0.14 - 0.01 0.14 - - 0.17 - - 0.36
372 Non-ferrou. metal basic induastres - 0.008 0.13 - - - 0.008 0.17 - 0.01 0.14 - 0.01 0.66 - 0.02 1.09381 Fabricated metal product. (except achinery) 1.10 4.70 3.37 1.07 5.51 1.27 4.71 3.22 1.37 5.12 3.04 3.08 4.36 2.55 2.64 3.72 3.10382 Machinery. escept electrical - 0.34 0.96 - - - 0.41 1.10 - 0.59 1.01 - 0.57 1.94 - 0.38 1.18
383 Electrical machinery, appliances, etc. - 0.13 0.93 - - - 0.16 1.84 - 0.22 1.67 - 0.58 3.37 - 0.43 3.03
384 Transport equipment 0.15 0.88 1.58 0.15 0.38 0.16 1.03 2.21 0.13 1.29 1.92 0.51 1.65 4.75 0.31 1.07 6.09385 Scie.tific,ph.tographic squipment,eatc. - 0.08 0.18 - - - 0.11 0.07 - 0.16 0.08 - 0.14 0.03 - 0.12 0.03390 Other asnufactu.lng 1.76 1.47 0.92 1.75 2.75 1.80 1.60 1.27 1.77 1.69 1.14 2.50 1.36 2.21 2.01 1.00 1.50
Total 100.00 100.10 100.00 100.00 100.00 100.00 3IO0.O 100.00 100.00 100.00 100.00 100.00 100.00 100.00 100.00 100.00 100.00

INDONESIA
PERCENTAGE DISTRIBUTION OF NuMBER OF ESTABLISHMENTS, NUMBER OF PERSONS ENGAGED,
NUMBER OF MAN-DAYS VALUE ADDED AND GROSS OUTPUT BY PROVINCE, 1974/75
Number of persons enga_ed (total)
Number of establishinents Household &_cottage Number of man-days Value added Gross output
Household Small Nedium Household With Small Medium Household Small Medium Household Small Medium Household Small Medium
Province & cottage scale & large members hired All scale & large & cottage scale 6 large 6 cottage scale & large & cottage scale & large
only labor
SumatraAcelha 1.99 1.54 0.35 1.91 1.29 1.89 1.46 0.44 1.19 1.20 0.35 3.10 1.67 0.33 2.46 2.13 0.31
Sumatra, North 1.26 4.12 3.84 1.27 2.79 1.34 4.58 3.82 1.19 5.00 3.87 2.77 6.49 5.82 2.91 8.23 5.17
Sumatra, West 1.86 2.53 0.63 1.65 2.43 1.69 2.24 0.65 1.34 1.79 0.70 2.74 2.11 1.33 2.42 2.24 1.29
Riau 0.39 1.42 0.69 0.40 0.50 0.41 1.39 0.49 0.32 1.33 0.43 0.99 2.16 0.54 0.61 1.96 0.80
Jambi 0.66 0.91 0.42 0.67 1.39 0.70 0.82 0.56 0.54 0.63 0.60 1.35 0.84 0.53 0.85 0.74 1.43
Sumatra, South 0.96 3.99 1.03 0.96 1.62 0.99 3.54 1.68 0.84 2.59 1.64 3.35 5.50 2.53 2.66 4.83 3.18
Bengulu 0.39 0.24 0.04 0.38 0.32 0.38 0.24 0.01 0.23 0.24 0.008 0.46 0.41 0.005 3.57 0.34 0.002
Lampung 0.69 0.98 0.92 0.72 1.19 0.74 1.05 0.65 0.63 1.04 0.54 0.99 1.31 1.03 0.93 1.78 1.24
JavaJakarta 1.32 4.11 12.38 1.32 4.93 1.49 5.39 13.29 1.77 6.57 12.22 6.33 9.18 19.48 6.32 8.31 22.26
Java, West 12.11 20.91 22.54 11.89 16.79 12.11 20.82 17.63 10.92 19.49 17.87 13.54 18.27 19.00 13.67 17.98 15.86
Java, Central 42.19 19.12 22.34 42.78 23.18 41.88 21.57 22.35 46.62 23.65 23.09 27.49 18.25 15.30 29.37 18.71 17.33
Jogyakarta 6.99 2.41 2.19 7.06 2.93 6.87 2.71 2.09 6.73 3.15 2.11 3.77 2.28 1.33 4.86 2.34 1.56 1
Java, East 13.91 23.70 25.65 14.39 18.79 14.59 20.73 31.13 16.43 21.61 31.68 15.09 19.23 27.74 16.38 19.64 23.55 -_j
KalimantanKalimantan, West 0.98 1.03 0.82 1.02 0.59 1.00 0.90 1.21 0.61 0.69 1.18 1.47 1.06 2.04 1.60 1.20 2.08
Kalimantan, Central 0.08 0.40 0.30 0.09 0.12 0.09 0.44 0.18 0.07 0.38 0.18 0.14 0.70 0.18 0.12 0.54 0.22
Kalimantan, South 1.84 1.06 0.85 1.88 2.03 1.90 1.08 0.67 1.85 1.09 0.51 2.77 1.31 0.37 2.31 1.02 0.46
Kalimantan, East 0.08 0.31 0.32 0.08 0.20 0.09 0.37 0.14 0.07 0.43 0.14 0.39 0.88 0.14 0.22 0.69 0.15
SulawesiSulawesi, North 2.36 0.94 0.25 2.20 9.26 2.52 0.94 0.15 1.21 0.70 0.15 3.85 0.70 0.21 3.64 0.56 0.27
Sulawesi, Central 0.03 0.61 0.07 0.03 0.06 0.03 0.54 0.03 0.02 0.33 0.03 0.08 0.33 0.09 0.08 0.21 0.12
Sulawesi, South 5.37 5.25 1.61 5.22 5.88 5.25 4.62 0.93 4.30 3.61 0.86 5.63 2.39 1.60 4.23 2.01 1.54
Sulawesi, Southeast 0.10 0.80 0.42 0.10 0.06 0.10 0.78 0.14 0.06 0.46 0.14 0.09 0.48 0.02 0.07 0.24 0.01
OthersBall 1.75 1.47 0.89 1.65 1.73 1.65 1.64 0.88 1.41 2.00 0.90 1.55 2.18 0.30 2.06 2.51 0.57
Nusatenggara, West 2.43 1.15 0.94 2.08 1.63 2.06 0.98 0.50 1.48 0.93 0.44 1.38 0.93 0.13 1.36 0.75 0.25
Nusatengarra, East 0.15 0.55 0.20 0.14 0.04 0.14 0.59 0.12 0.05 0 48 0.13 0.06 0.48 0.04 0.07 0.45 0.03
Maluku 0.02 0.21 0.14 0.02 0.06 0.02 0.25 0.15 0.02 0.27 0.16 0.13 0.32 0.18 0.10 0.22 0.30
Irian Jaya 0.08 0.25 0.17 0.09 0.18 0.09 0.30 0.12 0.11 0.36 0.07 0.49 0.51 0.05 0.38 0.36 0.03
Total 100.00 100.00 100.00 100.00 100.00 100.00 100.00 100.00 1l)1.0O 100.00 100.00 100.00 100.00 100.00 100.00 100.00 100.0(
-~~~~~~~~~~~~~~~~~~~~~~~~~~~~~~~~~~~~~~~~~~~~~~~~~~~~~~~~~~~~~~~~~~~~~~~~~~~~~~~~~~~~~~~~~~a

-75- L~~~~~~~~~~~~~~~ablIe 7Page I
INDONESIA
NUMBER OF ESTABL.ISHMENTS, N4UMBER OF PERSONS ENGAGED, VALUE ADDED. *GROSS OUTPUT,LABOR PRODUCTIV'ITY, VALUE ADDED/GROSS OUTPUT, NUMBER OF DAYS/PERSONS ENGAGED.
AND WAGES ANI8) SALARIES PER MANl-DAY BY MAJOR INDUSRTRES AND gpmhEIFFS. 194
No. o01 Establishments No. of persons engalged Value added (Rp jjn.) Cross output (Rp aml.)Division/Industries CI Si MLI CI Si 30.1 CI ST MLI CI Si MIL
31 Food. Beverages and Tobacco 434, 28' 24,27 2.367 1.401.177 151.194 26,8 37.300 2563 22,5 11403 86,029 54,731120 Dairy products 1,434; 988 18 5,625 6,797 1,202 364 941 5,687 77 3 2,034 19,59531140 Fish preserved & canned 4,66;' 544 67 15,905 3,409 6,417 1,276 330 2,284. 4,383 L,224 12,38631151 Coconut oil 9.59', 468 95 32,447 3,781 5,550 788 1,463 2,751 3.373 6.552 32,31731152 Vegetable oils 38 9 - 344 495 - 221 294 - 1.310 3,16331159 Vegetable & animal fat 979 53 17 3,427 334 1,649 170 38 11.536 498 336 20,461
31161/62 Rice, cleaned & polished 13,362 10,926 179 54,870 64,148 4,972 7,086 L1,592 1,670 19,395 36,183 11,04531163 Coffee, cleaned 73 62 - 663 5,282 - 2,384 - - 6,22431164 Wheat flour - 3 - - 1,059 - - 6,364 - - 22,88231169 Other grain products 24,8711 486 97 83,912 3,367 4,207 3,487 746 2,187 11,073 3,392 9,95531179 Bakery products 6,2311 1,015 132 23,287 7,500 7.161 1,386 1,646 1,344 4.816 4.749 3,862
31181 Refined sugar 240,8711 1 54 - - 55,717 - - 56,690 - - 101,73531182 Raw sugar - 1.243 43 730,223 6,383 2,343 8.795 347 531 15,567 1,143 I,b4031210 Other flour 5,011 840 137 13,760 5.961 3,953 333 620 2,296 754 2.289 3,12631220 Tea 8311 368 135 3,602 2,747 14,677 105 315 8,650 463 1,875 1 6 ,7 5731242 Tahu, tempe, etc. 61,5811 1,106 16 203,692 6,463 398 6.523 814 97 28,814 3,525 394
31250 Krupuk, kerak, etc. 25,261 2,083 55 88,751 14.835 1.566 2,516 1,307 168 8,626 4,359 43831260 Co.:fee powder 200 12 - 1,369 5.46 - 1.136 163 - 2,941 46131290 Food products NI.E.C. 31,60? 880 75 106,846 5,196 2,462 2,231 574 359 7,918 2,058 1,38031330 Malt liquors 4 3 - 26 1,779 - - 10,772 - - 13,82431420 Clove cigarettes 99 168 - 758 81,161 137 54,372 - 573 158,00531430 Cigarectes - 26 17 - 273 6,108 - 17 41,267 - 50 59,305
32 Textiles, Wearing Appareland Leather 139 *683 5,792 2,6 435j14 5537 174246 7,133 6,6 72,213 18,191 21,113 232,81
32111 Yarn & thread 3,27.3 33 45 11,097 274 20,731 271 65 12,654 780 152 4 9 ,3 1332112 Woven products except jute 37,439) 2,232 1,216 114,282 22,800 100,483 1,250 1,493 44,614 3.660 5,489 138.44832114 Batik 49,61:8 1,594 342 152,934 16,469 13,105 1,765 2,051 2,757 4,347 7,469 9,45732210 Wearing apparel 6,314 524 56 21,761 3,922 1,937 1,263 580 404 3,413 1.899 1,07932400 Footwear 1,46) 363 31 5,756 2,666 5,082 575 529 3,118 1.399 1,201 7,511
33 Wood and Wood Products 53,6 6,456 407 1,644.004 4168 2236 2194 69 1253 38,872 16,514 28,6133111 Saw 6 Wood mills 14,9835 2,248 215 51,136 18,336 14,519 4,358 3,617 9,154 7,529 9,129 21,37633130 Bamboo, rattan & willow
pleats 476,895 341 44 1,451,194 2,481 822 11,798 89 42 19.525 179 7833210 Wooden furniture 24,623) 1,947 85 81,280 14,440 3,334 14,192 2,329 1,207 8,774 4,873 2,i75
34 Paper. Printing and publishing 2.623 867 289 9,47 8.067 21,982 48 1,9 12,69 862 3,728 301434200 Printing 6 publishing 1,104 802 229 4,334 7,407 14,701 275 1,626 6,396 4~50 3,543 12,108
35 Chemicals and Chemical Products 5,317 1,37 899 20,946 12.390 8380 1,4 3234 6249 3,043 9,7 19235221 Medicine 33 69 - 405 7,858 - 170 7,795 - 405 17.19435231 Soaps, detergents, etc.- 226 36 - 1,875 3,272 - 410 3,127 - 1,480 16,53935510 Tires & tubes - 14 35 - 120 5,139 - 46 7,828 - 118 19,77335523 Crumb rubber - 1 59 - 14 10,991 - - 11,371 - - 60,86435600 Plastic products 1,792 302 137 6,658 2,910 9,256 441 588 3,122 991 2.198 11,280
36 Non-Metallic Mineral Products 80,598 6J749 482 263,203 46,916 24 597 9,535 4,503 16.632 1582 9,992 32i245
36310 Cement * - 3 ~ ~ - - ,0 - - 9,280 - - 17,01336320 Cement products - 802 151 - 7,773 6,800 - 1,664 2,680 - 3.952 5,61936330 Lime 3,588 1,471 62 15,169 8,360 1,689 632 737 334 1,327 2,552 97036410 Bricks 17,390 2,196 61 62,012 14,462 1,668 4,240 1,090 330 6,798 1,716 48636420 Roofing tiles 31,289 1,896 120 100,580 13,365 4,381 2,988 692 826 4,855 1,135 1,235
37 Basic Metals - 6 18 - 50 2.060 - 8 399 - 30 1880
38 Metal Products and Machinery i54~ ,5 498 55,773 22,063 55.867 2.960 3,866 60,.328 5,15 20_ 9, 173,78138130 Structural metal products - 261 57- 1,984 6,900 - 416 6,360 - 973 22,411138200 Machinery, except electrical - 162 68 - 1,419 7,311 301 9,236 - 597 15,32638320 Communica?tion equipment - 9 17 - 70 4,368 - - 15 6,578 - 30 20,33838330 Electrical supplies - 20 25 - 191 3,976 - 89 7,451 - 222 13,89238411 Ship/boat building/repairing 1,646 90 32 5.371 636 5,469 345 187 5,219 490 327 11,17838440 Motorcycles - 10 7 - 58 2,018 - 6 10,700 - 11 55,237
39 Other Manufacturied Products 21,709 708 65 701 1 5 49 9 2.067 720 j9 551 4 028 57 19,363
Total 1,234,51 481 7,091 3,899,856 34,240 661,704 82,564 53,07 476,947 20,2 157j,j58 _1937
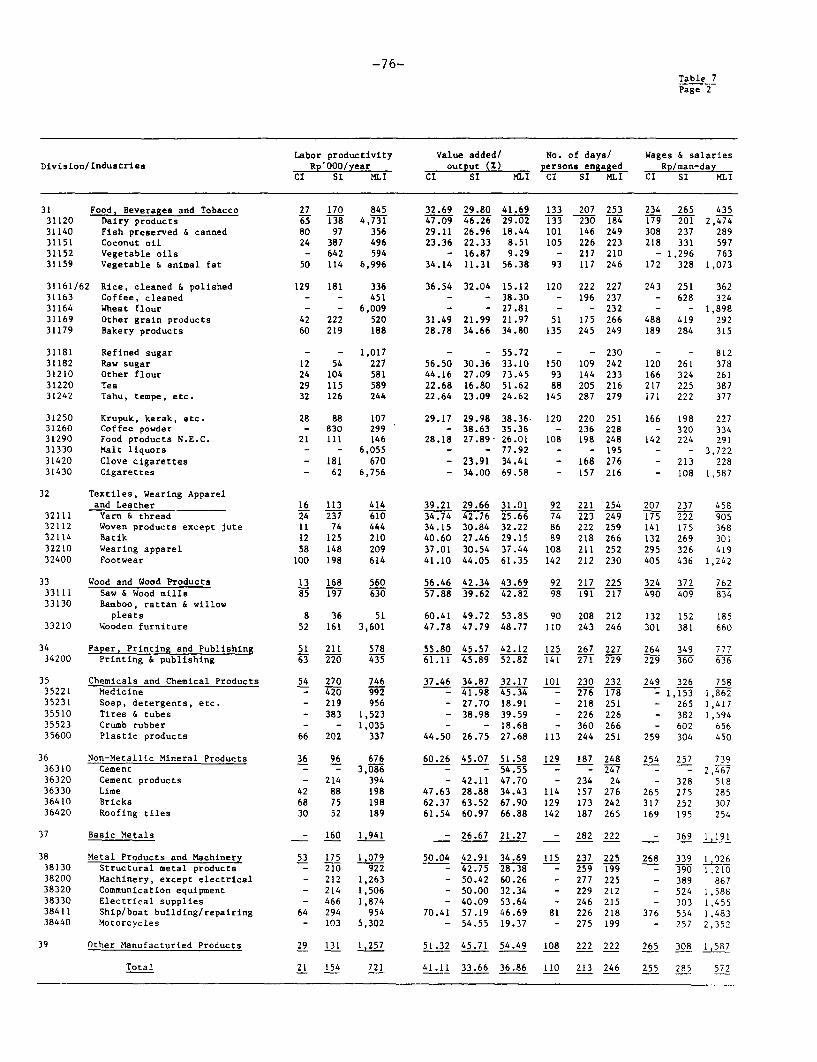
-76-Table 7Page 2
Labor productivity Value added! No. of days! Wages & salariesD3ivision/Industries Rtp'000/year output (Z persons engaged Rp/man-day
CI Si NL-I CI Si MLI CI Si MLI CI Si MLI
31 Food, Beverages and Tobacco 27 170 845 32.69 29.80 41.69 133 207 253 234 265 43531120 Dairy products 65 13-8 4 ,73-1 47.09 46.26 29.02 133 2T30 1F84- 179 2101 2,47431140 Fish preserved 6 canned 80 97 356 29.11 26.96 18.44 101 146 249 308 237 28931151 Coconut oil 24 387 496 23.36 22.33 8.51 105 226 223 218 331 59731152 Vegetable oils - 642 594 - 16.87 9.29 - 217 210 - 1,296 76331159 Vegetable & animal fat 50 114 6,996 34.14 11.31 56.38 93 117 246 172 328 1,073
31161/62 Rice, cleaned & polished 129 181 336 36.54 32.04 15.12 120 222 227 243 251 36231163 Coffee, cleaned - - 451 - - 38.30 - 196 237 - 628 32431164 wheat flour - - 6,009 - - 27.81 - - 232 - - 1,89831169 Other grain products 42 222 520 31.49 21.99 21.97 51 175 266 488 419 29231179 Bakery products 60 219 188 28.78 34.66 34.80 135 245 249 189 284 315
31181 Refined sugar - - 1,017 - - 55.72 - - 230 - - 81231182 Raw sugar 12 54 227 56.50 30.36 33.10 150 109 242 120 261 37831210 Other flour 24 104 581 44.16 27.09 73.45 93 144 233 166 324 26131220 Tea 29 115 589 22.68 16.80 51.62 88 205 216 217 225 38731242 Tahu, tempe, etc. 32 126 244 22.64 23.09 24.62 145 287 279 171 222 377
31250 Krupuk, kerak, etc. 28 88 107 29.17 29.98 38.36. 120 220 251 166 198 22731260 Coffee powder - 830 299 - 38.63 35.36 - 236 228 - 320 33431290 Food products N.E.C. 21 111 146 28.18 27.89, 26.01 108 198 248 142 224 29131330 Malt liquors - - 6,055 - - 77.92 - - 195 - - 3,72231420 Clove cigarettes - 181 670 - 23.91 34.41 - 168 276 - 213 22831430 Cigarettes - 62 6,756 - 34.00 69.58 - 157 216 - 108 1,587
32 Textiles, Wearing Appareland Leather 16 113 414 39.21 29.66 31.01 92 221 254 207 237 458
32111 Yarn & thread 24 23-7 61-0 34.74 42.76 25.66 74 T223 2~49 1i 75- 222 905-32112 Woven products except jute 11 74 444 34.15 30.84 32.22 86 222 259 141 175 36832114 Batik 12 125 210 40.60 27.46 29.15 89 218 266 132 269 30132210 Wearing apparel 58 148 209 37.01 30.54 37.44 108 211 252 295 326 41932400 Footwear 100 198 614 41.10 44.05 61.35 142 212 230 405 436 1,242
3 3 Wood and Wood Plroducts 13 168 560 56.46 42.34 43.69 92 217 225 324 37 2 76233111 Saw & Wood mills 85 19-7 6~30 5~7. 88 3~9.62 -42.82 98 1f9-1 2~17 490- 4~09 83433130 Bamboo, rattan & willow
pleats 8 36 51 60.41 49.72 53.85 90 208 212 132 152 18533210 Wooden furniture 52 161 3,601 47.78 47.79 48.77 110 243 246 301 381 660
34 Paper, Printing and Publishing 51 211 578 55.80 45.57 42.12 125 267 227 264 349 77734200 Printing & publishing 63 420 ~ 3-5 61.11 45.89 52.82 141 27-1 f229 2f29 3i60 6~36
35 Chemicals and Chemical Products 54 270 746 37.46 34.87 '32.17 101 230 232 249 326 75835221 Medicine - 420 992 - 41.98 45.34 - 276 178 - 1,153 1,86235231 Soap, detergents, etc. - 219 956 - 27.70 18.91 - 218 251 - 265 1,41735510 Tires & tubes - 383 1,523 - 38.98 39.59 - 226 226 - 382 1,59435523 Crumb rubber - - 1,035 - - 18.68 - 360 266 - 602 65635600 Plastic products 66 202 337 44.50 26.75 27.68 113 244 251 259 304 450
36 Non-Metallic Mineral Products 36 96 676 60.26 45.07 51.58 129 187 248 254 257 73936310 Cement - - 3,086 - - 54.55 - - 2-47 - -- 2),46736320 Cement products - 214 394 - 42.11 47.70 - 234 24 - 328 51836330 Lime 42 88 198 47.63 28.88 34.43 114 157 276 265 275 28536410 Bricks 68 75 198 62.37 63.52 67.90 129 173 242 317 252 30736420 Roofing tiles 30 52 189 61.54 60.97 66.88 142 187 265 169 195 254
37 Basic Metals 160 1,941 26.67 21.27 - 282 222 - 369 1,1913
38 Metal Products and Machinery 53 175 1,079 50.04 42.91 34.69 115 237 225 268 339 1,02638130 Structural metal products - 210 922 - 42.75 28.38 - 259 199 - 390 1,21038200 Machinery, except electrical - 212 1,263 - 50.42 60.26 - 277 225 - 389 86738320 Communication equipment - 214 1,506 - 50.00 32.34 - 229 212 - 524 1,58838330 Electrical supplies - 466 1,874 - 40.09 53.64 - 246 215 - 303 1,45538411 Ship/boat building/repairing 64 294 954 70.41 57.19 46.69 81 226 218 376 554 1,48338440 Motorcycles - 103 5,302 - 54.55 19.37 - 275 199 - 257 2,352
39 Other Manufacturied Products 29 131 1,5 51.32 45.71 54.49 108 222 222 265 308 58
Total 21 154 72 1 41.11 33.66 36.86 110 213 246 255 28 5 57 2

-77-
Table 8
INDONESIA
SMALL-SCALE INDUSTRY SUBSECTOR REPORT
Percentage Distribution of Number of Establishments, Number of Persons Engaged,Value Added & Gross Output by Malor Industries, 1974
Number of Number of
Division/industries establishments persons enga%ted Value added Grass outputCI Si M41I CI Si MLI CI Si MLI CI Si MLI
31 Food, Beveragtes & Tobacco 35.18 50.38 33.38 35.93 44.05 40.56 45.18 48.35 47.54 56.81 54.60 42.0431120 Dairy products 0.11 2.05 0F. 25 0j. 14 -1.98- 0.1-8 0.44 1.77 C1.9 0.f3-8 1 .29 1.5131140 Fish, preserved & canned 0.38 1.13 0.94 0.41 0.99 0.97 1.55 0.62 0.48 2.18 0.78 0.9631151' Coconut oil 0.78 0.97 1.34 0.83 1.10 0.84 0.95 2.76 0.58 1.68 4.16 2.5031152 Vegetable oils - 0.08 0.13 - 0.10 0.07 - 0.42 0.06 - 0.83 0.2431159 Vegetable & animal fat 0.08 0.11 0.24 0.09 0.10 0.25 0.21 0.07 2.42 0.25 0.21 1.5831161/62 Rice, cleaned & polished 1.08 22.67 2.52 1.41 18.69 0.75 8.58 21.86 0.35 9.66 22.96 0.8531163 Coffee, cleaned - 0.15 0j7 - 0.19 0.80 - - 0.50 - - 0.4831164 Wheat flour - - 0.04 - - 0.16 - 1.33 1.7731169 other grain products 1.97 1.01 1.37 2.15 0.98 0.64 4.22 1.41 0.46 5.51 2.15 0.7731179 Bakery products 0.51 2.11 1.86 0.60 2.19 1.08 1.68 3.10 -0.28 2.40 3.01 0.3031181 Refined sugar - 0.00 0.76 - - 8.42 - - 11.89 - - 7.8631182 Rav sugar 19.51 2.58 0.61 18.72 1.86 0.35 0.65 0.65 0.11 7.75 0.73 0.1231210 other flour 0.41 1.74 1.93 0.35 1.74 0.60 0.40 1.17 0.48 0.38 1.45 0.2431220 Tea 0.07 0.76 1.90 0.09 0.80 2.22 0.13 ~0.59 1.81 0.23 1.19 1.3031242 Tahu, tampe, etc. 4.99 2.30 0.22 5.22 1.88 0.06 7.90 1.54 0.02 14.35 2.24 0.0331250 Krapuk. kerak, etc. 2.05 4.32 0.78 2.28 33.46 0.24 '3.05 2.46' 0.04 4.30 2.77 0.0331260 Coffee powder - 0.42 0.17 - 0.40 0.08 - 2.14 0.03 - 1.87 0.0431290 Food products N.E.C. 2.56 1.83 1.06 2.74 1.51 0.37 2.70 1.08 0.08 3.94 1.31 0.1131330 Malt liquors - 0.01 0.04 - 0.01 0.27 - - 2.26 - - 1.0731420 Clove cigarettes - 0.21 2.37 - 0.22 12.27 - 0.26 11.40 - 0.36 12.2131430 Cigarettes - 0.05 0.24 - 0.08 0.92 - 0.03 8.65 0.03 4.58
32 Textiles, Wearing Appaerl&Leather 11.31 12.02 29.13 11.16 16.13 26.33 8.64 11.81 15.14 9.06 13.40 18.00
32111 Yarn & threat 0.27 0.07 0.63 028 0.0 313 0.3-3 0.1-2 2.65 0.3-9 0.10 3.8132112 Woven products except jute 3.03 4.63 17.15 2.93 6.64 15.19 1.51 3.19 9.35 1.82 3.48 10.7032114 Batik 4.02 3.31 4.82 3.92 4.80 1.98 2.14 3.87 0.58 2.16 4.74 0.7332210 Wearing apparel 0.51 1.09 0.79 0.56 1.14 0.29 1.53 1.09 0.08 1.70 1.21 0.0832400 Footwear 0.11 0.75 0.44 0.15 0.78 0.77 0.70 1.00 0.65 0.70 0.76 0.58
33 Wood &Wood Products 43.32 11.32 5.74 42.16 12.14 3.38 26.58 13.19 2.63 19.36 10.48 2.2233111 Saw &wood mills 1.21 4T.66 3. 03 -1.31 5.34 2.1-9 5. 28 6. 82 1.9-2 3. 75 5.7 9 1.6533130 Bamboo, rattan & willow
pleats 38.63 0.71 0.62 37.21 0.72 0.12 14.29 0.17 0.01 9.74 0.11 0.0133210 Wooden furniture 1.99 4.04 1.20 2.08 4.21 0.50 17.19 4.39 0.25 4.37 3.09 0.19
34 Paper. Printing & Publishing 0.13 1.80 4.08 0.24 2.35 3.32 0.10 3.20 2.66 0.43 2.37 2.3334200 Printing & publishing T0.08 1.6-6 3.2-3 0.1-1 2.16 2. 22 03-3 3.07 13-4 0.2-2 0.34 0.94
35 Chemicals & Chemical Products 0.43 2.86 12.68 0.54 3.61 12.66 1.38 6.30 13.10 1.52 6.08 15.0135-221 Medicine - 0.07- 0.97 7 01-2 r1.9 - 0.3 2 - 163 0.72-6 1.3335231 Soaps, detergents, etc. - 0.47 0.51 - 0.55 0.49 - 0.77 0.66 - 0.94 1.2835510 Tires & tubes - 0.03 0.49 - 0.03 0.78 - 0.09 1.64 - 0.07 1.5335523 Crumb rubber - 0.00 0.83 - 0.00 1.66 - - 2.38 - - 4.7035600 Plastic products 0.14 0.63 1.93 0.17 0.85 1.40 0.53 1.11 0.65 0.49 1.40 0.87
36 Non-metallic Mineral Products 6.53 14.01 6.80 6.75 13.67 3.72 11.55 8.49 3.49 7.88 6.34 2.4936-310 Cement - - 0.04 - - 0.4-5 - - 1.95 - - 1.3136320 Cement products - 1.66 2.13 - 2.26 1.03 - 3.14 0.56 2.51 0.4336330 Lime 0.29 3.05 0.87 0.39 2.44 0.26 0.77 1.39 0.07 0.66 1.62 0.0736410 Bricks 1.40 4.56 0.86 1.59 4.21 0.25 5.14 2.06 0.07 3.39 1.09 0.0436420 Roofing tiles 2.53 3.93 1.69 2.58 3.89 0.66 3.62 1.30 0.17 2.42 0.72 0.10
37 Basic Metals - 0.01 0.25 - 0.01 0.31 - 0.02 0.84 - 0.02 1.45
38 Metal Products & Machinery 1.25 6.13 7.02 1.43 6.43 8.44 3.59 7.29 12.64 2.95 5.72 13.4338 130 S-gtructural metal products 0.65-4 0.8-0 - 0.-58 -1.04 - 0.7-8 1.34 -- 0.62 1.338200 Machinery, except electrical - 0.34 0.96 - 0.41 1.10 - 0.57 1.94 - 0.38 1.1838320 Communication equipment - 0.02 0.24 - 0.02 0.66 - 0.03 1.38 - 0.02 1.5738330 Electrical supplies - 0.04 0.35 - 0.06 0.60 - 0.17 1.56 - 0.14 1.0738411 Ship/boat building/repairing 0.13 0.19 0.45 0.14 0.19 0.83 0.42 0.35 1.09 0.24 0.21 0.8638440 motorcycled - 0.02 0.10 - 0.02 0.30 - 0.01 2.24 0.01 4.27
39 other Manufactured Products 1.76 1.47 0.92 1.80 1.60 1.27 2.50 1.36 2.21 2.01 1.00 1.50
Total 100.00 100.00 100.00 100.00 100.00 100.00 100.00 100.00 100.00 100.00 100.00 100.00

-78-
Table 9
INDONESIA
PERCENTAGE DISTrRIBUTION OF NO. OF PERSONS ENGAGED, VALUE ADDED AND GROSS OUTPUT,AND INDEX OF LABOR PRODUCTIVITY BY SEGMENTS AND MAJOR INDUSTRIES, 1974
(All Manufacturing: 100.0)
----------- ~-- -Prcentage Distribution -- Index ofNo. of persons engaged Value added Gross output Labor productivity
Diviaion/industries CI Si MiLI CI St biLl CI Si bLl CI Si bLI
31 Food. Beverages ankd Tobacco 77.0 8.3 14.7 12.9 8.9 78.3 15.3 11.6 73.1 17.0 106.9 531.431120 Dairy products 413 499 8. .2 1.5- 81.3 3. 9.1 87.5 12.7 2T6.9 9f22 .231140 Fish preserved & canned 61.8 13.3 24.9 32.8 8.5 58.7 24.4 6.8 68.8 53.0 64.2 235.831151 Coconut oil. 77.7 9.1 13.3 15.8 29.3 55.0 8.0 15.5 76.5 20.0 322.5 413.331152 Vegetable oils - 41.0 59.0 - 42.9 57.1 - 29.3 70.7 - 104.6 96.731159 Vegetable & animal fat 63.4 6.2 30.5 1.5 0.3 98.2 2.3 1.6 96.1 2.3 5.2 322.1
31161/62 Rice, cleaned & polished 44.3 51.7 4.0 34.8 57.0 8.2 29.1 54.3 16.6 78.7 110.4 204.931163 Coffee, cleaned - 11.2 88.9 - 100.0 - - 100.0 - - 100.031164 Wheat flour - - 100.0 - - 100.0 - - 100.0 - - 100.031169 Other grain products 91.7 3.7 4.6 54.3 11.6 34.1 45.3 13.9 40.8 60.0 317.1 742.931179 Bakery products 61.4 19.8 18.9 31.7 37.6 30.7 35.9 35.4 28.8 52.2 190.4 163.5
31181 Refined sugar - - 100.0 - - 100.0 - - 100.0 - - 100.031182 Raw sugar 98.8 0.9 0.3 90.9 3.6 5.5 85.0 6.2 8.8 92.3 415.4 1,746.031210 Other flour 58.1 25.2 16.7 10.3 19.1 70.7 12.2 37.1 50.7 17.5 75.9 424.131220 Tea 17.1 13.1 69.8 1.2 3.5 95.4 2.4 9.8 87.8 6.7 26.7 136.731242 Tahu, tempe, etc. 96.7 3.1 0.2 87.8 11.0 1.3 88.0 10.8 1.2 91.4 360.0 697.1
31250 Rrupuk, kerak, etc. 84.4 14.1 1.5 63.0 32.8 4.2 64.3 32.5 3.3 73.7 231.6 281.631260 Coffee powder - 71.5 28.5 - 87.5 12.6 - 86.5 13.6 - 122.4 44.131290 Food products N.E.C. 93.3 4.5 2.2 70.5 18.1 11.4 69.7 18-.1 12.2 75.0 396.4 521.431330 Malt liquors - 1.4 98.6 - - 100.0 - 100.0 - - 100.031420 Clove cigarettes - 0.9 99.1 - 0.3 99.8 - 0.4 99.6 - 27.2 100.831430 Cigarettes - 4.3 95.7 - 0.0 100.0 - 0.1 99.9 - 1.0 104.4
32 Textiles, Wearing Appareland Leather 65.5 8.3 26.2 8.3 7.3 84.4 6.7 7.8 85.6 12.4 87.6 320.9
32111 Yarn & thread 34 .6 0.79 64_.6 2-.1 0 .5 97 .4 1.-6 0-.3 '98.2 -5.9 -58.5 150.632112 Woven products except jute 48.1 9.6 42.3 2.6 3.6 93.8 2.5 3.7 93.8 5.5 37.0 222.032114 Batik 83.8 9.0 7.2 26.9 31.2 41.9 20.4 35.1 44.5 33.3 347.2 583.332210 Wearing apparel 78.8 14.2 7.0 56.2 25.8 18.0 53.4 29.7 16.9 71.6 182.7 2 58 .032400 Footwear 42.6 19.7 37.6 13.6 12.5 73.9 13.8 11.9 74.3 31.9 63.3 196.2
33 Wood and Wood Products 96.3 2.4 1.3 52.9 16.9 30.2 46.2 19.6 34.1 54.2 700.0 2,3.33111 Saw 6 Wood mills 60-.9 21. 178 iT.-3 25.4 21 .1 533.4 -19.8 24.0 5-6.2 '4 1.7 9§6.6 308.833130 Bamboo, rattan & villow
pleats 99.8 0.2 0.1 98.9 0.7 0.4 9.7 0.9 0.4 100.0 450.0 637.533210 Wooden furniture 82.0 14.6 3.4 54.2 30.1 15.6 54.4 30.2 15.4 66.7 206.4 4,617.0
34 Paper, Printing and Publishing 24.0 20.4 55.6 3.2 11.4 85.3 2.5 10.7 86.8 13.6 56.1 153.7320 Printing & publishing 1. 280 56 33 196 77. . 20 7. 01 7. 3.
35 Chemicals and Chemical products 17.9 10.6 71.5 1.7 5.0 93.3 1.5 4.6 93.9 9.4 47.2 130.435 2 21 Medicine - 4.9 95. 7 - 2.1 97.9 -- 2.3 97.77 - '43.6 102.935231 Soap, detergents. etc. - 36.4 63.6 - 11.6 88.4 8.2 91.8 - 31.9 139.235510 Tires & tubes - 2.3 97.7 - 0.6 99.4 - 0.6 99.4 - 25.6 101.735523 Crumb rubber - 0.1 99.9 - - 100.0 - - 100.0 - - 100.035600 Plastic products 35.4 15.4 49.2 10.6 14.2 75.2 6.8 15.2 78.0 30.1 92.2 153.9
36 Non-Metallic Mineral Products 78.6 14.0 7.3 31.1 14.7 54.2 27.3 17.2 55.5 39.1 104.3 734.836310 Cement - I- 100.0 - - I100.0 o -- - 1T00.0 - - 100.036320 Cement products - 53.3 46.7 - 38.3 61.7 - 41.3 58.7 - 71.8 132.236330 Line 60.2 33.2 6.7 37.1 43.3 19.6 27.4 52.6 20.0 61.8 129.4 291.236410 Bricks 79.4 18.5 2.1 74.9 19.3 5.8 75.5 19.1 5.4 94.4 104.2 2 7 5.036420 Roofing tiles 85.0 11.3 3.7 66.3 15.4 18.3 67.2 15.7 17.1 78.9 136.8 497.4
3 7 Basic Metals - 2.4 97.6 - 0.2 99.8 - 0.2 99.8 - 8.4 102.2
38 Metal Products and Machinery 41.7 16.5 41.8 4.4 5.8 89.8 3.1 4.8 92.1 10.6 34.9 214.938130 Structural metal products 22.3 77.7 - 6.1 93.9 - 4.2 95.8 - 27.5 120.838200 Machinery, except electrical - 16.3 83.7 - 3.2 96.8 - 3.7 96.3 19.4 115.738320 Communication equipment - 1.6 98.4 - 0.2 99.8 - 0.1 99.9 - 14.4 101.338330 Electrical supplies - 4.6 95.4 - 1.2 98.8 - 1.6 98.4 - 25.8 103.638411 Ship/boat building/repairing 46.8 5.5 47.7 6.0 3.3 90.7 4.1 2 .7 93.2 12.8 58.7 190.43b440 Motorcycles - 2.8 97.2 - 0.1 99.9 - 0.0 100.0 - 2.0 102.8
39 Other Manufactured Products 83.5 6.5 10.0 15.5 5.4 79.1 16.1 6.3 77.6 1.8 8.3- 79.2
Total 79.5 7.0 13.5 13.5 8.7 77.9 12.2 9.5 78.3 16.8 123.2 576.8
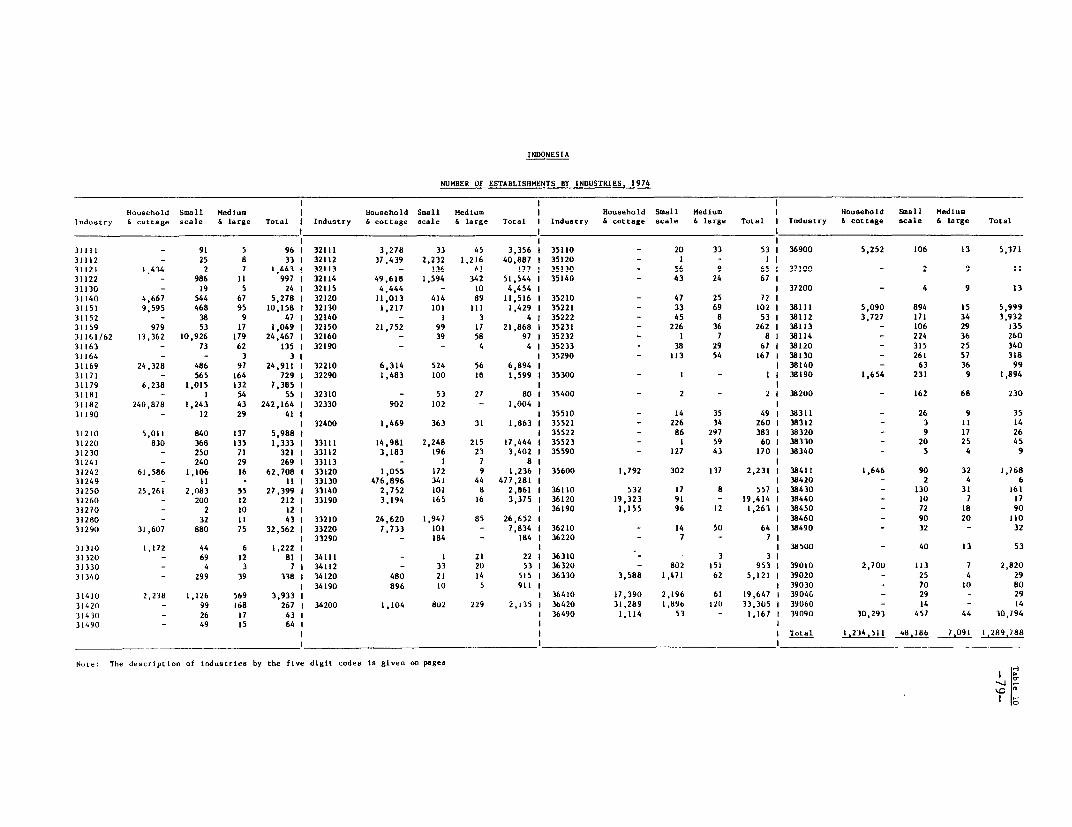
INDONESIA
NUMBER OF ESTABLISHMENTS BY INDUSTRIES, 1974
Household Small Medium Household Small Medium Household Small Medium Household Small MediumIndustry 6 cottage scale & large Total I Industry & coLtage scale &larg. Total I Industry &Cottage scale large Total I Industry BCOttage scale &large Total
31111 - 91 5 96 I 32111 3,278 33 45 3,356 1 35110 - 20 33 53 I 36900 5,252 106 13 5,37131112 - 25 8 33 I 32112 37,4 39 2,232 1,216 40,887 I 35120 - I - I 131121 1 43/4 2 7 1,443 I 32113 - 136 A ? 53 - -- 96: ?C - 2~31122 - 986 II 997 1 32114 49,618 1,594 342 51,544 1 35140 - 43 24 67 I31130 - 19 5 24 I 32115 4,444 - 10 4,454 I 1 37200 - 4 9 1331140 4,667 544 67 5,278 I 32120 11,013 414 89 11,516 I 35210 - 47 25 72 I31151 9,595 468 95 10,158 I 32130 1,217 101 III 1,429 I 35221 - 33 69 102 I 38111 5,090 894 IS 5,99931152 - 38 9 47 I 32140 - 1 3 4 1 35222 - 45 8 53 I 38112 3,727 17l 34 3,93231159 979 53 17 1,049 I 32150 21,752 99 17 21,868 I 35231 - 226 36 262 1 38113 - 106 29 13531161/62 13,362 10,926 179 24,467 1 32160 - 39 58 97 I 35232 - 1 7 8 I 38114 - 224 36 26031163 - 73 62 135 I 32190 - - 4 4 I 35233 - 38 29 67 I 38120 - 315 25 34031164 - - 3 3 I I 35290 - 113 54 167 I 38130 - 261 57 31831169 24,328 486 97 24,911 1 32210 6,314 524 56 6,894 I I 38140 - 63 36 9931171 - 565 164 729 1 32290 1,483 100 16 1,599 I 35300 - I - I 1 38190 1,654 231 9 1,89431179 6,238 1,015 132 7,385 1 I31181 - 1 54 55 I 32310 - 53 27 80 I 35400 - 2 - 2 I 38200 - 162 68 23031182 240,878 1,243 43 242,164 I 32330 902 102 - 1,004 1 31190 - 12 29 411 I 35510 - 14 35 49 I 38311 - 26 9 35
I 32400 1,469 363 31 1,863 I 35521 - 226 34 260 I 38312 - 3 11 1431210 5,011 840 137 5,988 I 1 35522 - 86 297 383 1 38320 - 9 17 2631220 830 368 135 1,333 I 33111 14,981 2,248 215 17,444 I 35523 - 1 59 60 I 38330 - 20 25 4531230 - 250 71 321 I 33112 3,183 196 23 3,402 I 35590 - 127 43 170 I 38340 - 5 4 931241 - 240 29 269 1 33113 - 1 7 8 1 31242 61,586 1,106 16 62,708 1 33120 1,055 172 9 1,236 1 35600 1,792 302 137 2,231 I 38411 1,646 90 32 1,76831249 - II - I1 33130 476,896 341 44 477,281 I I 38420 - 2 4 631250 25,261 2,083 55 27,399 I 33140 2,752 101 8 2,861 I 36110 532 17 8 557 1 384 30 - 130 31 16131260 - 200 12 212 I 33190 3,194 165 16 3,375 I 36120 19,323 91 - 19,414 I 38440 - 10 7 1731270 - 2 10 1 2 I 36190 1,155 96 12 1,263 I 38450 - 72 18 9031280 - 32 II 43 I 33210 24,620 1,947 85 26,652 1 I 38460 - 90 20 11031290 31,607 880 75 32,562 I33220 7,733 101 - 7,834 I 36210 - 14 50 64 I 38490 - 32 - 32
133290 - 184 - 184 136220 - 7 - 7 131310 1,172 44 6 1,222 I I 38500 - 40 13 533i320 - 69 12 81 I 34111 - I 21 22 I 36310 - - 3 3 131330 - 4 3 7 1 34112 - 33 20 53 I 36320 - 802 151 953 1 39010 2,700 113 7 2,82031340 - 299 39 338 I 34120 480 21 1 4 515 1 36330 3,588 1,471 62 5,121 I 39020 - 25 4 29
1 34190 896 10 5 911 I 1 39030 - 70 10 8031410 2,238 1,126 569 3,933 I 1 36410 17,390 2,196 61 19,647 I 3904G - 29 - 2931420 - 99 168 267 I 34200 1,104 802 229 2,135 i 3b420 31,269 1,896 1211 33,305 I 39060 - 14 - 1431430 - 26 17 43 I I 36490 1,114 53 - 1,167 1 39090 30,293 457 44 30,79431490 - 49 IS 641 I
1 Total 1.234.511 4816 ,9
1 ,29,8
N.As: The d-scription of InduStries by the five digit codes ts given on pages

INDONESIA
NUMBER OF PERSONS ENCAGED BY INDUSTRIES, 1974
Household Small Medium I Household Small Medium I Household Sma11 Medium I Household Small MediumIndustry & cottage scale & large Total I Industry 6 cottage scale & large Total I Industry & cottage scale & large Total I Industry 6 cottage scale 4 large Total
31111 - 645 274 919 1 32111 11,097 274 20,731 32,102 1 35110 - 129 2,811 2,940 1 36900 16,617 960 860 18,43731112 - 180 830 1,010 1 32112 114,282 22,800 100,483 237,565 1 35120 - 10 - 10 131121 5,625 19 843 6,457 1 32113 - 1,400 2,509 3,909 1 35130 - 484 397 881 1 37100 - 21 933 95431122 - 6,778 389 7,167 1 32114 152,934 16,469 13,105 182,508 1 35140 - - 461 1,301 1,762 131130 - 204 1,164 1,368 1 32115 13,338 - 10,019 23,357 1 1 37200 - 29 1,127 1,15631140 15,905 3,409 6,417 25,731 1 32120 33,978 3,640 5,018 42,636 I 35210 - 408 2,032 2,440 131151 32,447 3,781 5,550 41,778 1 32130 3,369 1,076 8,974 13,419 3 35221 - 405 7,858 8,263 1 38111 19,800 5,469 886 21,23531152 - 344 495 839 1 32140 - 14 383 397 1 35222 - 378 2,035 2,413 1 38112 12,617 1,300 2,890 16,80731159 3,427 334 1,649 5,410 1 32150 67,867 861 1,358 70,086 1 35231 - 1,875 3,272 5,147 1 38113 - 882 2,900 3,78231161/62 54,870 64,148 4,972 123,990 1 32160 - 223 2,103 2,326 1 35232 - 0 4,659 4,659 1 38114 - 1,680 3,332 5,01231163 - 663 5,282 5,945 1 32190 - - 315 315 1 35233 - 348 1,874 2,222 1 38120 10,779 2,435 1,201 14,41531164 - - 3,059 1,059 1 1 35290 - 841 2,562 3,403 1 38130 - 1,984 6,900 8,88431169 83,912 3,367 4,207 91,486 1 32210 21,761 3,922 1,937 27,620 1 i 38140 - 548 2,732 3,28031311 - 4,929 5,310 10,239 1 32290 4,504 831 680 6,015 1 35300 - 18 - 18 1 38190 5,629 1,867 451 7,94731179 23,287 7,500 7,161 37,948 1 1 131181 730,223 - 55,717 785,940 1 32310 - 470 1,549 2,019 1 35400 - 14 - 14 1 38200 - 1,419 7,311 8,73031182 - 6,383 2,343 8,726 1 32330 3,692 732 - 4,404 1 131190 - 129 2,255 2,384 1 - 1 35510 - 120 5,139 5,259 1 38311 - 228 396 624
1 32400 5,756 2,666 5,082 13,504 1 35521 - 1,761 2,906 4,667 1 38312 - 16 3,015 3,03131210 13,760 5,961 3,953 23,674 1 1 35522 - 954 24,168 25,122 1 38320 - 70 4,368 4,43831220 3,602 2,747 14,677 21,026 1 33111 51,136 18,336 14,519 83,991 1 35523 - 14 10,991 11,005 1 38330 - 191 3,976 4,16731230 - 2,240 2,930 5,170 1 33112 10,622 1,577 1,435 13,634 1 35590 - 1,292 2,541 3,833 1 38340 - 48 420 46831241 - 1,893 1,003 2,896 1 33113 - 15 762 777 1 131242 203,692 6,463 398 210,553 1 33120 4,037 1,210 216 5,463 1 35600 6,658 2,910 9,256 18,824 1 38411 5,371 636 5,469 11,47631249 - 62 - 62 1 33130 1,451,194 2,481 822 1,454,497 1 1 38420 - 24 314 33831250 88,751 14,835 1,566 105,152 1 33140 9,151 783 470 10,404 1 36110 1,788 137 644 2,569 1 38430 - 1,134 4,306 5,44031260 - 1,369 546 1,915 1 33190 10,232 1,164 810 12,206 1 36120 56,448 569 - 6,217 1 38440 - 58 2,018 2,07631270 - 25 1,121 1,146 I 1 36190 3,313 722 424 4,459 1 38450 - 625 956 1,58131280 - 306 1,100 1,406 1 33210 81,280 14,440 3,334 99,054 1 1 38460 - 884 1,544 2,42831290 306,846 5,194 2,462 114,502 1 33220 24,872 622 - 25,494 3 36210 - 147 5,124 147 1 38490 - 175 - 175
1 33290 - 1,052 - 1,052 1 36220 - 49 - 49 331310 3,632 301 255 4,188 1 1 1 38500 - 390 482 87231320 - 493 603 1,096 1 34111 - 0 4,382 4,382 1 36310 - - 3,007 - I31330 - 26 1,779 1,805 1 34112 - 398 774 1,172 1 36320 7,773 6,800 14,573 1 39010 8,776 912 825 10,513331340 - 2,692 2,067 4,759 1 34120 1,472 176 1,977 3,625 1 36330 15,169 8,360 1,689 25,218 1 39020 - 217 158 375
1 34190 3,149 86 148 3,383 1 1 39030 - 554 883 1,43731410 9,831 2,290 39,762 51,883 1 1 36410 62,012 14,462 1,668 78,142 1 39040 - 234 - 23431420 - 758 81,161 81,919 1 34200 4,334 7,407 14,701 26,442 1 36420 100,580 13,365 4,381 118,326 1 39060 - 100 - 10031430 - 273 6,108 6,381 1 1 36490 3,505 372 - 3,877 1 39090 106,927 3,482 6,528 116.93131490 - 453 1,010 1,463 1 1
Total 3,89,856 343,240 661,704 4,894,800
Note: The description of induscries by the five digtt codes is given on pages
C 1
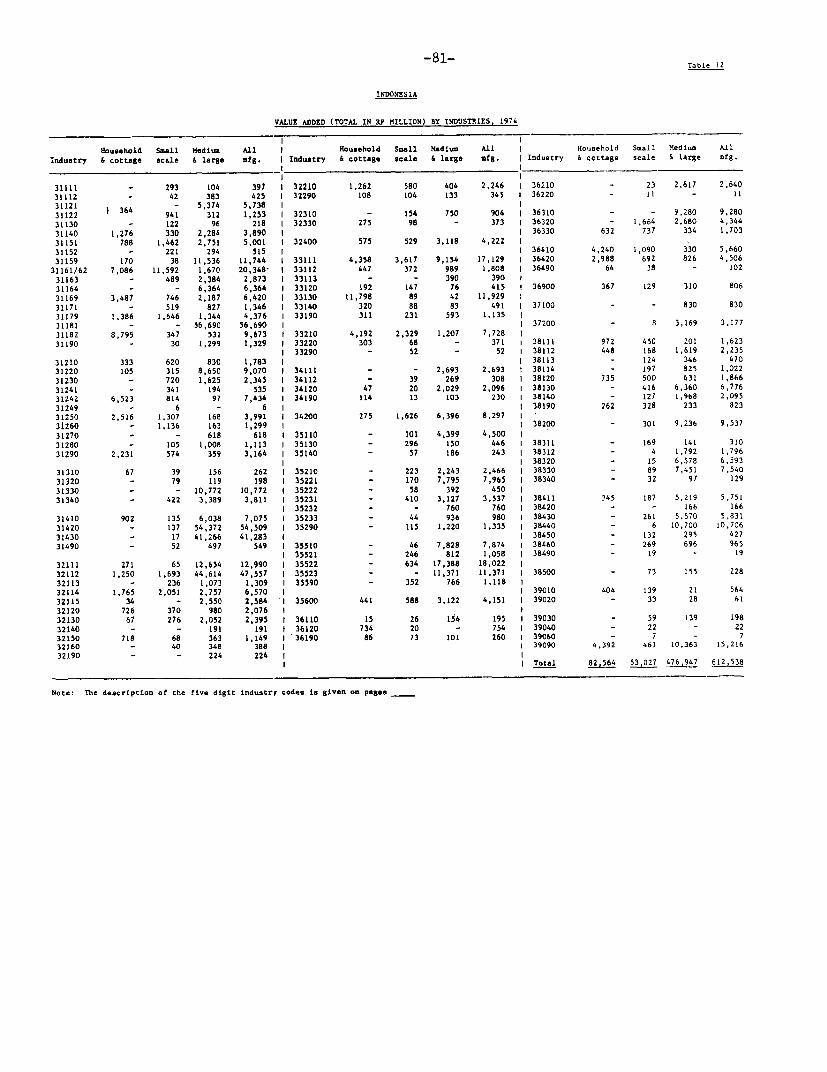
-81-Table 12
INDONESIA
VALUE ADDED (TOTAL IN RP MILLION) BY INDUSTRIES, 1974
Household Small Medium All I Rousehold Smll Medium All I Household Small Medium AllIndustry 6 cottage scale & large Mfg. I Industry 6 cottage scale 6 large Mfg. I Industry 6 cottage scale & large Mfg.
31111 - 293 104 397 i 32210 1,262 580 404 2,246 1 36210 - 23 2,617 2.64031112 - 42 383 425 1 32290 108 104 133 345 1 36220 - 11 - 1131121 ) 36'. - 5,374 5,738 i 131122 941 312 1,253 1 32310 - 154 750 904 1 36310 - - 9,280 9.28031130 - 122 96 218 1 32330 275 98 - 373 1 36320 - 1,664 2,680 4,34431140 1,276 330 2,284 3,890 1 1 36330 632 737 334 1,70331151 788 1,462 2,751 5,001 1 32400 575 529 3,118 4,222 131152 - 221 294 515 1 1 36410 4,240 1,090 330 5,66031159 170 38 11,536 11,744 1 33111 4,358 3,617 9,154 17,129 1 36420 2,988 692 826 4,506
31161/62 7,086 11,592 1,670 20,348' 1 33112 447 372 989 1,808 1 36490 64 38 - 102
31163 - 489 2,384 2,873 1 33113 - - 390 390 131164 - - 6,364 6,364 1 33120 192 147 76 415 1 36900 367 129 310 80631169 3,487 746 2,187 6,420 1 33130 11,798 89 42 11,929 1
31171 - 519 827 1,346 i 33140 320 88 83 491 1 37100 - - 830 83031179 1,386 1,646 1,344 4,376 1 33190 311 231 593 1,135 131181 - - 56,690 56,690 1 1 37200 - 8 3,169 3,17731182 8,795 347 531 9,673 1 33210 4,192 2,329 1,207 7,728 131190 - 30 1,299 1,329 1 33220 303 68 - 371 1 38111 972 450 201 1,623
1 33290 - 52 - 52 1 38112 448 168 1,619 2,23531210 333 620 830 1,783 1 1 38113 - 124 346 47031220 105 315 8,650 9,070 1 34111 - - 2,693 2,693 1 38114 - 197 825 1,02231230 - 720 1,625 2,345 1 34112 - 39 269 308 1 38120 735 500 631 1,86631241 - 341 194 535 1 34120 47 20 2,029 2,096 i 38130 - 416 6,360 6,77631242 6,523 814 97 7,434 1 34190 114 13 103 230 1 38140 - 127 1,968 2,09531249 - 6 - 6 1 1 38190 262 328 233 82331250 2,516 1,307 168 3,991 1 34200 275 1,626 6,396 8,297 i3i260 - 1,136 163 1,299 1 i 38200 - 301 9,236 9,537
31270 - - 618 618 1 35110 - 101 4,399 4,500 131280 - 105 1,008 1,113 1 35130 - 296 150 446 1 38311 - 169 141 31031290 2,231 574 359 3,164 i 35140 - 57 186 243 1 38312 - 4 1,792 1,796
i 38320 - 15 6,578 6,59331310 67 39 156 262 1 35210 - 223 2,243 2,466 i 38330 - 89 7,451 7,54031320 - 79 119 198 1 35221 - 170 7,795 7,965 1 38340 - 32 97 12931330 - - 10,772 10,772 1 35222 - 58 392 450 131340 - 422 3,389 3,811 1 35231 - 410 3,127 3,537 1 38411 345 187 5,219 5,751
1 35232 - - 760 760 1 38420 - - 166 16631410 902 135 6,038 7,075 1 35233 - 44 936 980 i 38430 - 261 5,570 5,83131420 - 137 54,372 54,509 1 35290 - 115 1,220 1,335 i 38440 - 6 10,700 10,706
31430 - 17 41,266 41,283 1 1 38450 - 132 295 42731490 - 52 497 549 1 35510 - 46 7,828 7,874 1 38460 - 269 696 965
1 35521 - 246 812 1,058 1 38490 - 19 - 1932111 271 65 12,654 12,990 1 35522 - 634 17,388 18,022 132112 1,250 1,693 44,614 47,557 i 35523 - - 11,371 11,371 1 38500 - 73 155 22832113 - 236 1,073 1,309 i 35590 - 352 766 1,118 132114 1,765 2,051 2,757 6,570 i 1 39010 404 139 21 56432115 34 - 2,550 2,584 1 35600 441 588 3,122 4,151 1 39020 - 33 28 6132120 726 370 980 2,076 1 132130 67 276 2,052 2,395 1 36110 15 26 154 195 1 39030 - 59 139 19832140 - - 191 191 f 36120 734 20 - 754 1 39040 - 22 - 2232150 718 68 363 1,149 1 36190 86 73 101 260 1 39060 - 7 - 732160 - 40 348 388 1 1 39090 4,392 461 10,363 15,21632190 - - 224 224 1 1
I I Total 82,564 ,027 476,947 612,538
Note: The description of the five digit industry codes is given on pages

-82-Table 13
INDONESIA
GROSS OUTPUT (TOTAL IN RP MILLION) By INDUSTRIES. 1974
Houaehold Small medium All I Rousehold Small Medium All I Household Sm all Medium AllIndustry & cottage scale & large mfg. I Industry 6 cottage scale & large Mfg. I Industry & cottage scale & large Mfg.
31111 - 1,029 647 1,676 1 32210 3,413 1,899 1,079 6,391 1 36110 41 48 377 46631112 - 265 1,861 2,899 1 32290 300 316 361 977 1 36120 1,042 29 - 1,07131 121 I73 - 18,948 i8,948 I 1 36190 194 152 219 56531122 -2,034 648 2,682 1 32310 - 510 3,263 3,773 131130 - 235 552 787 1 32330 647 310 - 957 1 36210 - 47 5,863 5,91031140 4,383 1,224 12,386 17,993 1 1 36220 - 28 - 2831151 3,373 6,552 32,317 42,242 1 32400 1,399 1,201 7,511 10,111 1 36310 - - 17,013 17,01331152 - 1,310 3,163 4,473 1 1 36320 - 3,952 5,619 9,57131159 498 336 20,460 21,294 1 33111 7,529 9,129 21,376 38,034 1 36330 1,327 2,552 970 4,849
31161/62 19,395 36,183 11,045 66,623 1 33112 901 860 1,650 3,411 131163 - 2,897 6,224 9,121 1 33113 - - 778 778 1 36410 6,798 1,716 486 9,00031164 - - 22,882 22,882 1 33120 448 375 129 952 i 36420 4,855 1,135 1,235 7,22531169 11,073 3,392 9,955 24,420 1 33130 19,525 179 78 19,781 1 36490 131 76 - 20731171 - 1,997 2,820 4,817 1 33140 556 141 179 876 131179 4,816 4,749 3,862 13,427 1 33190 562 731 2,207 3,500 1 36900 625 258 464 1,34731181 - - 101,736 101,736 1 I31182 15,567 1,143 1,603 18,313 1 33210 8,774 4,873 2,475 16,122 1 37100 - - 4,639 4,63931190 - 77 3,130 3,207 1 33220 531 132 - 663 1
1 33290 - 94 - 94 1 37200 - 30 14,166 14,19631210 753 2,289 3,126 6,168 1 131220 463 1,875 16,757 19,095 1 34111 - - 9,556 9,556 1 38111 1,727 930 388 3,04531230 - 1,262 2,701 3,963 1 34112 76 81 522 679 1 38112 807 556 5,397 6,76031241 - 997 625 1,622 1 34120 - 38 7,611 7,649 i 38113 - 436 1,209 1,64531242 28,814 3,525 394 32.733 1 34190 224 65 345 634 1 38114 - 558 2,349 2,90731249 - 25 - 25 1 1 38120 1,830 1,338 1,556 4,72431250 8,626 4,359 438 13,423 1 34200 450 3,543 12,108 16,101 1 38130 - 973 22,411 23,38431260 - 2,941 461 3,402 1 1 38140 - 413 5,970 6,38331270 - - 2,524 2,524 1 35110 - 158 9,078 9,236 1 38190 667 655 793 2,11531280 - 626 4,969 5,595 1 35120 - - - - 131290 7,918 2,058 1,380 11,356 1 35130 - 641 626 1,267 1 38200 - 597 15,326 15,923
1 35140 - 115 520 635 131310 206 112 586 904 1 1 38311 - 371 589 96031320 - 234 327 561 1 35210 - 462 5,832 6,294 1 38312 - 13 4,255 4,26831330 - - 13,824 13,824 1 35221 - 405 17,194 17,599 i 38320 - 30 20,338 20,36831340 - 1,027 6,130 7,157 1 35222 - 139 762 901 1 38330 - 222 13,892 14,114
1 35231 - 1,480 16,539 18,019 1 38340 - 39 130 16931410 1,636 453 16,963 19,052 1 35232 - - 1,826 1,826 131420 - 573 158,005 158,578 1 35233 - 111 2,879 2,990 1 38411 490 327 11,178 11,99531430 - 50 59,305 59,355 1 35290 - 379 3,361 3,740 1 38420 - - 262 26231490 - 187 1,117 1,304 1 1 38430 - 508 9,812 10,320
1 35300 - - - - 1 38440 - 11 55,237 55,24732111 780 152 49,313 50,245 1 1 38450 - 298 977 1,27532112 3,660 5,489 138,448 147,597 1 35400 - - - - 1 38460 - 511 1,321 1,83232113 - 1,006 3,982 4,988 1 i 38490 - 32 - 3232114 4,347 7,469 9,457 21,273 1 35510 - 118 19,773 19,891 1 38500 - 191 390 58132115 71 - 6,011 6,082 1 35521 - 767 2,435 3,202 132120 1,524 1,369 3,177 6.070 1 35522 - 1,629 58,685 60,314 1 39010 962 295 28 1,28532130 134 1,046 6,580 7,760 1 35523 - - 60,864 60,864 1 39020 - 82 151 23332140 - - 277 277 1 35590 - 975 2,354 3,329 1 39030 - 159 436 59532150 1,614 185 1,035 2,835 1 1 39040 - 46 - 4632160 - 159 1,351 1,510 1 35600 991 2,198 11,280 14,469 1 39060 - 20 - 2032190 - - 1,035 1,035 1 1 39090 12,583 973 18,747 32,303
1 Total 200,826 157,558 1,293,786 1,652.170
Note7 The description of the five digit industry codes is given on pages

INDONESIA
NUMBER OF ESTABLISHMENTS, NUMBER OF PERSONS ENGAGED, VALUED ADDED, LABOR PRODUCTIVITY,AND WAGES AND SALARIES BY MAJOR INDUSTRIES, CENTRAL JAVA - 1974
WaRes/SalsrlesNo. of Establishments No. of Persons Engaged Value Added (million RP) --- Labor Produ/ctivic (0o0i8D) (Rp ean-d)
Kajor Industries CI ST MLI ALL Cl Si MLI ALL CI Si MLI ALL CI SI MLi ALL Cl MLI
31122 Ice cream, ice lollies, etc. - 244 - 224 - 1,624 - 1,624 - 253 - 253 - 156 - 156 - -31161 Cleaned & polished rice 856 1,220 14 2,090 4,279 8.007 345 12,631 513 2,424 67 3,004 120 303 194 238 218 240
31181 Refined sugar - - 14 14 - - 13.751 13,751 - 13,758 13,758 - - 1,000 1,000 - 80031182 Ra. sugars 151,099 215 5 151,319 457,817 13194 670 459,681 5,563 50 93 5,706 12 42 139 12 77 25031242 Tabh, tempe etc. prod. 29,328 353 4 29,685 96,221 2,031 91 98,343 2,349 284 12 2,636 24 140 132 27 148 207
31250 Krupuk, kerak etc. chips 13,296 603 4 13,883 48,859 4,197 78 53,134 890 383 13 1,286 18 91 167 24 157 12631290 Food products nec 14,611 129 34 14,774 50,836 889 1,109 52,834 845 92 122 1.059 17 103 110 20 128 204
31420 Clove cigarettes - 31 72 103 - 234 33,455 33,689 - 68 21.076 21,144 - 291 630 628 - 18931410 Cigarettes - - 3 3 - - 13143 1,143 - - 10,445 10,445 - - 9,138 9,138 - 1,985
32111 Yarn & thread 621 15 11 647 2,071 112 9,592 11,775 21 44 5,153 5,218 10 393 537 443 120 1,130
32112 Woven products (ex. Jute) 5,987 13309 392 7,688 20,325 13,748 28,346 62,419 312 954 5,150 6,416 35 69 182 103 137 227 032114 Batik 42,465 1,018 231 43,714 130,495 10,781 9,338 150,614 1,085 988 1,589 3,662 8 92 170 24 79 265 W33210 Wooden furniture 8,435 455 10 8,900 26,758 3,647 350 30,755 850 455 79 1,384 32 125 226 45 227 43935522 Re.illed rubber - - 22 22 - - 3,096 3,096 - - 1,551 1,551 - - 503 501 - 498
36410 Brtcks 8,075 166 6 8,247 27,003 962 220 28,185 1,629 74 124 1,827 60 77 564 65 268 164
36420 Roofing tiles 16,269 197 18 16,484 51,781 1,376 756 53.913 1,405 66 43 1,514 27 48 57 28 169 12138111 Agricultural equlpment 1,151 158 - 1,309 4,670 979 - 5,649 239 95 - 334 51 97 - 59 246 -
38200 Machinery except electrical - 41 16 57 - 364 910 1,274 - 94 584 678 - 258 642 532 - 848
00000 Unidentified 8,018 - 24 8,042 27,520 - 5,576 33,096 1,267 - 3,018 4,285 46 - 54 129 214 802
Total Major lndustrtes 300,191 6,134 880 307,205 948,635 50,145 108826 1,107,606 16.959 6.324 62,877 86.160 18 126 578 78 - -
TOTAL ALL INDUSTRIES 520,892 9,212 1.584 531,688 1,633,451 74,026 147,826 1,855,303 22,694 9,676 72,978 105,348
14 133 494 57 178 392
Major/All (S) 57.6 66.6 55.6 57.8 58.1 67.1 73.6 59.7 74.7 65.4 86.2 81.8 _- _- -_
Central Java/lndonesia (2) 42.2 19.1 22.3 41.2 41.9 21.6 22.3 37.8 27.5 18.2 15.3 17.2 66.7 85.1 68.5 45.6 69.8 68.5

INDONESIA
NUMBER OF ESTABLISHMENTS, NUMBER OF PERSONS ENGAGED, VALUE ADDED,LABOR PRODUCTIVITY AND WAGES AND SALARIES BY MAJOR INDUSTRIES, JAKARTA, 1974
Wages and salariesNumber of eatablishments Number of persons engaged Value added (Rp million) Labor productivity (Rp'000) (Rp/Wan-das)
Division Major industries CI SI MLI All CI SI MLI All CI SI HLI All CI SI MLI All CI MLI
31171 - 34 14 48 - 288 703 991 - 100 206 306 - 347 293 309 - 49431179 Bakery products 670 98 29 797 2,457 821 2,021 5,299 370 217 488 1,075 151 264 241 203 194 39131230 Ice - 14 7 21 - 170 252 422 - 103 104 207 - 606 413 491 - 1,26231242 Tahu, tempe, etc. products 1,711 22 6 1,739 6,497 184 155 6,836 592 52 57 701 91 283 368 103 304 61631250 Krupuk, kerak, etc. chips - 72 - 72 - 620 - 620 - 115 - 115 - 185 - 185 -
31340 - 57 16 73 - 688 1,345 2,033 - 97 2,612 2,709 - 141 1,942 1,332 - 2,30032112 Woven products (except jute) - - 13 13 - _ 4,460 4,460 - - 4,504 4,504 - - 1,010 1,010 - 76632114 Batik 602 186 53 841 2,105 1,956 1.650 5,711 435 536 735 1,706 207 274 445 299 445 58532210 Wearing apparel 1,063 76 37 1,176 3,843 768 1,364 5,975 355 138 322 815 92 180 236 136 394 49732400 Footwear 681 60 13 754 2,775 519 3,103 6,397 405 123 2,042 2,570 146 237 658 402 517 1,76133111 Saw and vood mills - 65 5 70 - 521 188 709 - 159 32 191 - 305 170 269 - 32733210 Wooden furniture 2,140 191 22 2,353 7,692 1,534 1,125 10,351 755 411 592 1,758 98 268 526 170 436 92634200 Printing and publishing - 181 76 257 - 1,672 5,625 7,297 - 515 3,016 3,531 - 308 536 484 - 87135210 Paint varnish, lacquers - - - - - - - - - 115 1,883 1,998 - - - - -35221 Medicine - 1o 27 37 - 139 3,725 3,864 - 78 3,679 3,757 - 561 988 972 - 2,01035231 Cleaning preparations - 31 6 37 - 287 1,966 2,253 - 73 2,781 2,854 - 254 1,414 1,267 -72 3,10535600 Plastic products - 92 81 173 - 917 5,885 6,802 - 203 2,109 2,312 - 221 358 340 - 47936320 Cement products - 156 33 189 - 1,495 1,222 2,717 - 443 413 856 - 296 338 315 - 55038120 - 62 8 70 - 485 528 1013 - 117 355 472 - 241 672 466 - 72138130 Structural metal products - 87 17 104 - 608 3,008 3,616 - 151 3,706 3,857 - 298 1,232 1,067 - 1,48038200 Machinery, except electrical - 29 12 41 - 277 1,221 1,498 - 65 2,024 2,089 - 235 1,658 1,395 - 1,33738320 Communication equipment - 4 10 14 - 42 3,235 3,277 - - 5,447 5,447 - - 1,684 1,684 - 1,62638411 Ship/boat building/repair - - 11 11 - - 3,233 3,233 - - 4,071 4,071 - - 1,259 1,259 - 1,98238430 Motor vehicles - 5 9 14 - 68 2,656 2,724 - - 3,244 3,244 - - 1,221 1,221 - 2,00438440 Motorcycles - - 6 6 - - 1,982 1,982 - - 10,695 10,695 - - 5,396 5,396 - 2,40400000 UnidenEifted 4,374 - 9 4,383 17,148 - 1,694 18,842 1,787. 82 2,607 4,476 104 - 1,539 238 351 765
Total Malor Industries 11,241 1,532 520 13,293 42,517 14,059 52,346 108.922 4.699 3,893 57,724 66.316 I 265 1,067 590 -
Total All Industrtes 16,345 1,983 878 19,206 57,949 18,510 87,943 164,402 5,223 4,870 92,906 102,999 90 263 1,056 627 362 1,107
Major/All (X) 68.8 77.3 59.2 69.2 73.4 76.0 59.5 66.3 90.0 79.9 62.1 64.4 123.3 100.8 101.0 94.1Jakarta/Indonesia (X) 1.3 4.1 12.4 1.5 1.1 4.1 7.9 2.2 6.3 9.2 19.5 16.8 - 169.7 146.7 -
0.

INDONESIA
NO. OF ESTABLISHMENTS, NO. OF PERSONS ENGACED, VALUE ADDED, LABOR PRoDUCTIVITY.AND WAGES NiD SALARIES BY MAJOR INDUSTRIES, NORT0I SUMATRA, 1974
Wages & salariesNo. of establishments No. of persons engaged Value added (Rp million) Labor productivity (Rp'OOO) Rp/.n-ddasMajor industries CI Si mL1 All Cl Sl mLu All C! Si mu! All C! SI ml All CI mLI
31122 Ice cream, ice lollies, etc. - 83 - 83 - 649 - 649 - 74 - 74 - 114 - 114-31140 Fish, preserved 6 canned - a8 4 92 - 637 3,145 3,782 - 82 919 1,001 - 129 292 265 - 28331151 Coconut oil - 52 8 60 - 500 226 726 - 188 81 269 - 376 358 371 - 43731159 Vegetable & animal fat - - 6 6 - - 634 634 - - 10,279 10,279 - - 16,213 16,213 - 77131161 Cleaned 6 polished rice 1,981 399 _ 2,380 7,552 2,353 - 9,905 695 1,000 - 1,695 92 425 - 171 29531179 Bakery products - 89 4 93 - 669 174 843 - 129 28 157 - 193 161 186 2sg31182 Raw sugar 1,458 9 - 1,467 4,559 95 - 4,654 133 14 - 147 29 147 - 32 4 - 0(31430 Cigarettes - - 4 4 - - 1,537 1,537 - - 6,072 6,072 - - 3,951 3,951 n 484 J33111 Saw & wood mills - 146 26 172 - 1,583 784 2,367 - 240 153 393 - 152 195 166 - 536 133130 Rattan 6 willow pleats 6,234 - - 6,234 19,232 - - 19,232 327 - - 327 17 - - 17 274 -33210 Wooden furniture 595 104 4 703 2,178 834 211 3,223 155 160 66 381 71 192 313 118 399 47034200 Printing & publishing - 43 16 59 - 430 777 1,207 - 71 665 736 - 16 856 610 - 67t35522 Remilled rubber - 10 45 55 - 116 4,756 4,872 - 109 2,834 2,943 - 940 596 604 - 59935523 Crumb rubber - 1 8 9 - 14 1,570 1,584 - - 1,466 1,466 - - 934 934 - 44635600 Plastic products - 31 7 38 - 298 546 844 - 60 237 297 - 201 434 352 38636320 Cement products - 45 5 50 - 416 164 580 - 88 93 181 - 212 567 329 - 61738130 Strucutral metal products - 27 8 35 - 198 560 758 - 36 851 887 - 182 1,520 1,170 - 1,10538190 Metal products N.E.C. - 39 - 39 - 261 - 261 - 47 - 47 - 180 - 180 -38200 Machinery, except electrical - 19 6 25 - 132 688 820 - 20 405 425 - 152 589 518 - 85438430 Motor vehicles - 10 3 13 - 81 212 293 - 25 556 581 - 309 2,623 1,983 - 1,39039090 Industries N.E.C. - 55 3 58 - 421 617 1,038 - .31 398 435 - a8 645 419 - 1,19100000 Unidentified 3,429 - 11 3,440 12,966 - 639 13,605 791 - 488 1,279 61 - 764 94 307 834
Total Major Industries 13,697 1,250 168 15.115 46.487 9,687 17,240 73,414 2,101 2,380 25,591 30,072 45 246 1,484 410
Total All Industries 15,560 1,985 272 17,817 52,407 15,750 25,258 93,415 2,284 3,442 27,756 33,482 44 219 1,099 358 306 50
Major/all (I) 88.0 63.0 61.8 84.8 88.7 61.5 68.3 78.6 92.0 69.1 92.2 89.8 102.3 112.3 135.0 114.5Norch Sumatra/Indonesia (1) 1.3 4.1 3.8 1.4 1.3 4.6 3.8 1.9 2.8 6.5 5.8 5.5 209.5 141.3 152.4 120.0 88.8

-86-Table 15
INDONESIA
GROSS OUTPUT, MERCHANDISE IMPORTS AND TOTAL SUPPLY BY MAJOR INDUtSTRIES, 1974
Gross output Total Imports/Industries CI SI MLI All Imports supplies supplies (%
31120 Dairy products 773 2,034 19,596 22,403 18,865 41,268 45.7131181 Refined sugar - - 101,736 101,736 12,220 113,956 10.72314 Tobacco manufactures 2,660 1,263 235,390 239,313 8,417 247,730 3.3932111 Yarn & thread 780 152 49,313 50,245 62,047 112,292 55.2532112 Woven products, ex. jute 3,660 5,489 138,448 147,597 23,802 171,399 13.88
32115 Jute & plastic bags 71 - 6,011 6,082 4,952 11,034 44.8732120 Textile goods, ex. wearing apparel 1,524 1,369 3,177 6,070 6,699 12,769 52.4632130 Knitted products 134 1,046 6,580 7,760 7,664 15,424 49.6834100 Paper & fiberboard 861 3,728 30,142 34,731 38,981 73,712 52.8835110 Basic chemicals, ex. fertilizer - 158 9,078 9,236 92,705 101,941 90.93
35130 Pesins, plastic i synthetic material - 641 626 1,267 43,929 45,196 97.1935210 Paint, varnish, laquers - 462 5,832 6,294 6,724 13,018 51.6535221 Medicines - 405 17,194 17,599 21,448 39,047 54.9235233 Perfumes, cosmetics, etc. - 111 2,879 2,990 8,538 11,528 74.0635290 Other chemical products, NEC - 379 3,361 3,740 48,007 51.747 92.77
35510 Tires & tubes - 118 19,773 19,891 10,527 30,418 34.6035590 Rubber products, NEC - 975 2,354 3,329 2,938 6,267 46.8836210 Glass & glass products - 47 5,863 5,910 - 4,580 10,490 43.6636310 Cement - - 17,013 17,013 42,713 59,726 71.5137100 Iron 6 steel, basic metals - - 4,639 4,639 223,086 227,725 97.96
37200 Nonferrous metals - 30 14,166 14,196 43,160 57,356 75.2438111 Agricultural tools & equipment 1,727 930 388 3,045 11,099 14,144 78.4738130 Structural metal products - 973 22,411 23,384 30,530 53,914 56.6238140 Metal containers - 413 5,970 6,383 8,184 14,567 56.1838190 Metal products, NEC 667 655 793 2,115 7,275 9,390 77.47
38200 Machinery, ex. electrical - 597 15,326 15,923 446,341 462,264 96.5538300 Electrical machinery, appliances, etc. - 674 39,205 39,879 169,911 209,790 80.9938320 Communication equipment - 30 20,338 20,368 38,267 58,635 65.2638330 Electrical apparatus & supplies - 222 13,892 14,114 95,565 109,679 87.1338411 Ship/boat building/repair 490 327 11,178 11,995 23,578 35,573 66.28
38420 Railroad equipment - - 262 262 2,523 2,785 90.5938430 Motor vehicles - 508 9,812 10,320 142,666 152,986 93.2538440 Motorcycles - 11 55,237 55,248 33,373 88,621 37.6538450 Bicycles - 298 977 1,275 4,492 5,767 77.8938460 Vehicles body & parts - 511 1,321 1,832 13,191 15,023 87.80
38490 Other transport equipment - 32 - 32 22,104 22,136 99.8538500 Scientific, photographic equipment - 191 390 581 22,063 22,644 97.4339000 Other manufacturing 4,028 1,575 19,363 24,966 21,283 46,249 46.01
Total Major Industries /a 17,375 26,102 875,804 919.281 1.946,989 2.866,270 67.92
Total All Industries , 157,558 1,293,786 1.652.170 2,092,393/b 3,744,563 55.87
Major/all (%) 0.09 16.56 67.69 55.64 93.05 76.54 -
/a Imports includes data for 3512, 353, and 354./b Manufactured imports/all merchandise imports - 86.8%.
Source (for Imports Data): UN, Trade Yearbook, 1976, Volume I.
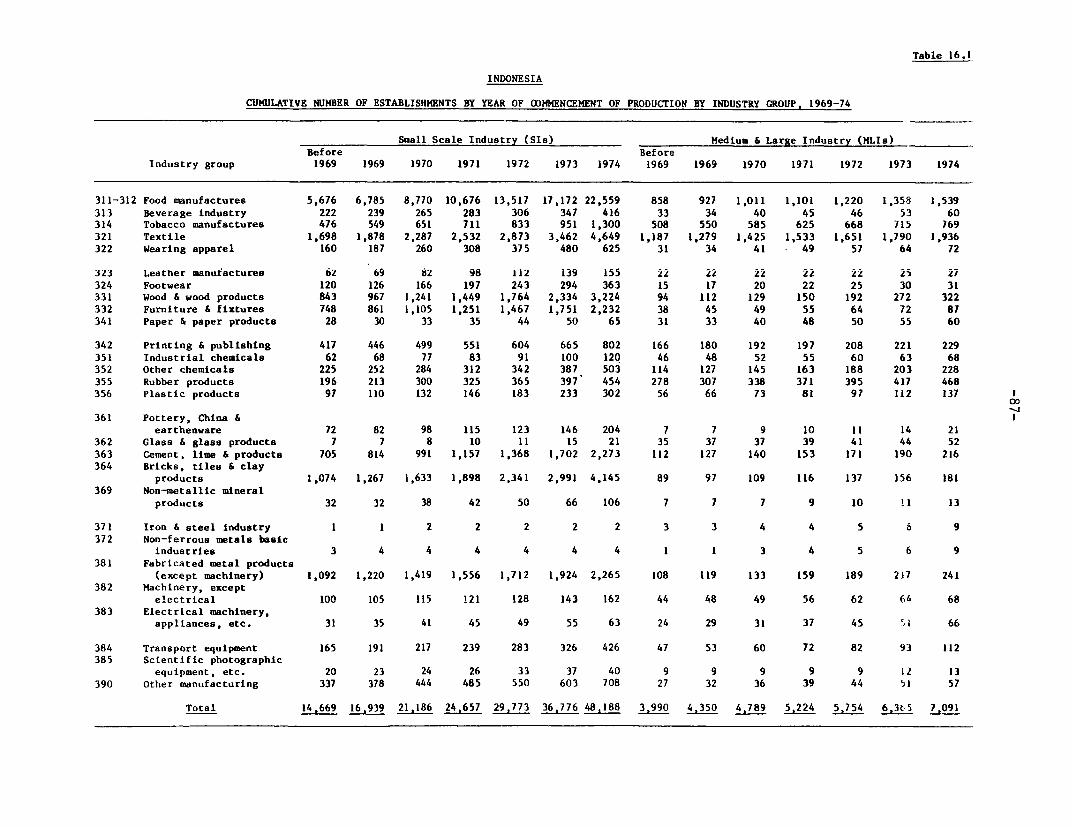
Table 16.1
INDONESIA
CUMULATIVE NUMBER OF ESTABLISHMENTS BY YEAR OF OOMMENCEMENT OF PRODUCTION BY INDUSTRY GROUP, 1969-74
Small Scale Industry (SIs) Medium & Large Industry (MLIs)Before Before
Industry group 1969 1969 1970 1971 1972 1973 1974 1969 1969 1970 1971 1972 1973 1974
311-312 Food manufactures 5,676 6,785 8,770 10,676 13,517 17,172 22,559 858 927 1,011 1,101 1,220 1,358 1,539
313 Beverage industry 222 239 265 283 306 347 416 33 34 40 45 46 53 60
314 Tobacco manufactures 476 549 651 711 833 951 1,300 508 550 585 625 668 715 769
321 Textile 1,698 1,878 2,287 2,532 2,873 3,462 4,649 1,187 1,279 1,425 1,533 1,651 1,790 1,936
322 Wearing apparel 160 187 260 308 375 480 625 31 34 41 * 49 57 64 72
3Z3 Leather manufactures tz 69 8Z 98 li2 i39 155 22 22 22 22 22 25 27
324 Footwear 120 126 166 197 243 294 363 15 17 20 22 25 30 31
331 Wood & wood products 843 967 1,241 1,449 1,764 2,334 3,224 94 112 129 150 192 272 322
332 Furniture & fixtures 748 861 1,105 1,251 1,467 1,751 2,232 38 45 49 55 64 72 87
341 Paper & paper products 28 30 33 35 44 50 65 31 33 40 48 50 55 60
342 Printing & publishing 417 446 499 551 604 665 802 166 180 192 197 208 221 229
351 Industrial chemicals 62 68 77 83 91 100 120 46 48 52 55 60 63 68
352 Other chemicals 225 252 284 312 342 387 503 114 127 145 163 188 203 228
355 Rubber products 196 213 300 325 365 397 454 278 307 338 371 395 417 468
356 Plastic products 97 110 132 146 183 233 302 56 66 73 81 97 112 137 1
361 Pottery, China &earthenware 72 82 98 115 123 146 204 7 7 9 10 11 14 21
362 Glass & glass products 7 7 8 10 11 15 21 35 37 37 39 41 44 52
363 Cement, lime & products 705 814 991 1,157 1,368 1,702 2,273 112 127 140 153 171 190 216
364 Bricks, tiles & clayproducts 1,074 1,267 1,633 1,898 2,341 2,991 4,145 89 97 109 116 137 156 181
369 Non-metallic mineralproducts 32 32 38 42 50 66 106 7 7 7 9 10 11 13
371 Iron & steel industry 1 1 2 2 2 2 2 3 3 4 4 5 6 9
372 Non-ferrous metals basicindustries 3 4 4 4 4 4 4 1 1 3 4 5 6 9
381 Fabricated metal products(except machinery) 1,092 1,220 1,419 1,556 1,712 1,924 2,265 108 119 133 159 189 217 241
382 Machinery, exceptelectrical 100 105 115 121 128 143 162 44 48 49 56 62 64 68
383 Electrical machinery,appliances, etc. 31 35 41 45 49 55 63 24 29 31 37 45 51 66
384 Transport equipment 165 191 217 239 283 326 426 47 53 60 72 82 93 112
385 Scientific photographicequipment, etc. 20 23 24 26 33 37 40 9 9 9 9 9 12 13
390 Other manufacturing 337 378 444 485 550 603 708 27 32 36 39 44 51 57
Total 14,669 16,939 21,186 24,657 29,773 36,776 48,188 3,990 4,350 4,789 5,224 5754 7,091

Table 16.2
INDONESIA
CUMULATIVE NUMBER OF ESTABLISHMENTS BY YEAR OF COMMENCEMENT OF PRODUCTION BY PROVINCE. 1969-74
Small Scale Industry (SIs) Medium & Large Industry (MLIs)Before Before
Province 1969 1969 1970 1971 1972 1973 1974 1969 1969 1970 1971 1972 1973 1974
Sumatra
Aceh 165 197 252 305 379 517 741 17 18 20 21 21 24 25Sumatra, North 741 882 1,050 1,184 1,331 1,573 1,985 145 158 171 195 218 240 272Sumatra, West 392 437 526 602 740 921 1,220 21 23 26 29 38 42 45Riau 268 318 391 449 519 588 684 7 15 20 27 33 40 49Jambi 156 186 217 242 280 337 440 7 8 12 15 17 24 30Sumatra, South 560 672 870 1,041 1,245 1,543 1,922 41 45 52 62 66 70 73Bengkulu 17 21 34 41 50 73 116 - - - - - 2 3Lampung 87 110 146 182 244 335 470 33 35 39 43 46 54 65
JavaJakarta 767 844 947 1,091 1,287 1,498 1,983 427 479 547 634 718 798 878Java, West 2,287 2,634 3,574 4,184 5,357 7,174 10,077 814 885 1,011 1,095 1,228 1,386 1,598Java, Central 3,197 3,593 4,352 4,998 5,970 7,252 9,212 1,002 1,089 1,172 1,259 1,375 1,475 1,584Jogyakarta 629 678 756 816 907 1,022 1,160 122 126 134 138 144 150 155Java, East 3,956 4,615 5,667 6,538 7,745 9,131 11,418 1,167 1,256 1,340 1,420 1,513 1,626 1,819
KalimantanKalimantan, West 203 235 284 330 371 414 497 13 17 20 30 39 54 58Kalimantan, Central 24 30 39 50 71 109 191 5 5 6 9 14 16 21Kalimantan, South 112 143 186 239 306 405 509 22 29 29 35 42 51 60Kalimantan, East 26 32 41 55 64 89 147 6 7 8 8 14 19 23
SulawesiSulawesi, North 89 101 128 162 193 238 452 6 9 10 11 13 14 18Sulawesi, Central 30 39 61 74 89 122 296 - - I I 1 2 5Sulawest, South 520 672 998 1,257 1,557 1,989 2,528 42 47 58 62 65 107 114Sulawesi, Southeast 34 38 89 100 135 190 387 5 6 9 15 18 23 30
OthersBali 146 175 228 295 409 549 710 39 41 49 51 54 60 63Nusatenggara, West 155 168 208 257 308 416 555 31 33 34 41 51 60 67Nusatenggara, East 74 80 93 104 133 164 264 9 9 10 10 10 10 14Maluku 23 24 30 37 46 63 100 5 6 6 8 9 10 10Irian Jaya 8 12 16 21 34 60 122 4 4 5 5 7 8 12
Total 14,666 16 936 21,183 24,654 29,770 36,772 48,186 3,990 4,350 4,789 5,224 5,754 6,365 7,091
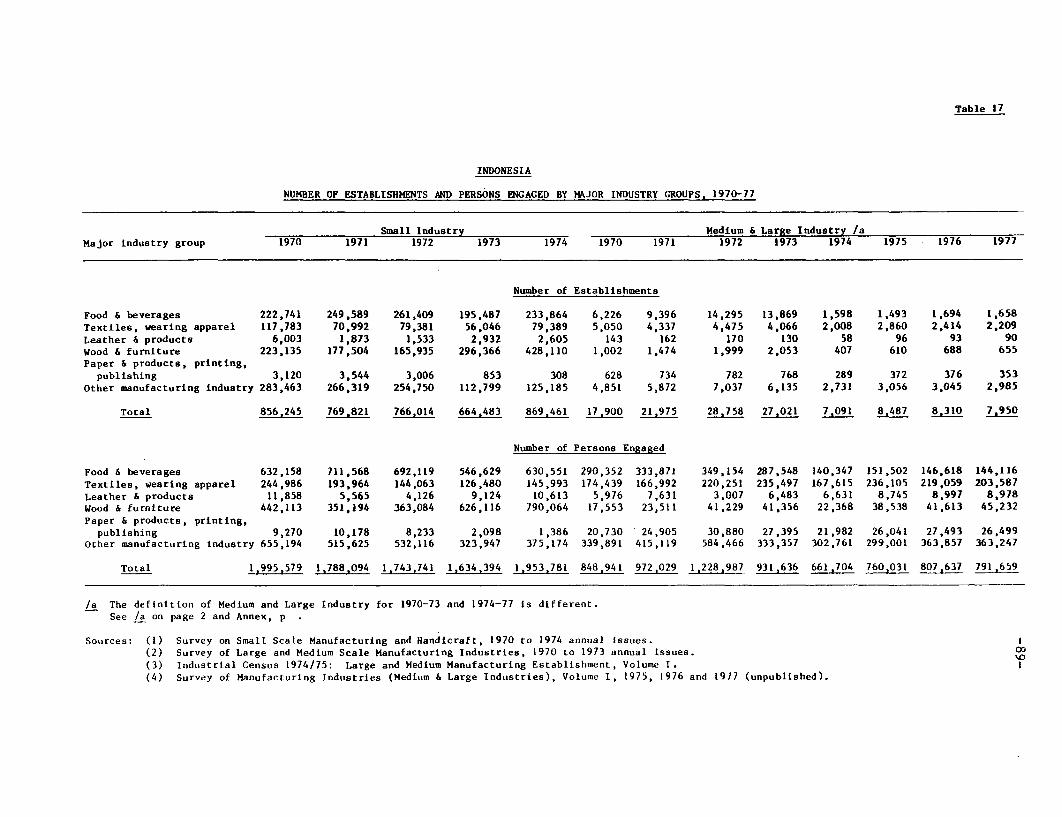
Table 17
INDONESIA
NUMBER OF ESTABLISHMENTS AND PERSONS ENGAGED BY MAJOR INDUSTRY GROUPS, 1970-77
Small Industry Medium & Large Industry /aMajor industry group 1970 1971 1972 1973 1974 1970 1971 1972 1973 1974 1975 1976 1977
Number of Establishments
Food & beverages 222,741 249,589 261,409 195,487 233,864 6,226 9,396 14,295 13,869 1,598 1,493 1,694 1,658Textiles, wearing apparel 117,783 70,992 79,381 56,046 79,389 5,050 4,337 4,475 4,066 2,008 2,860 2,414 2,209Leather & products 6,003 1,873 1,533 2,932 2,605 143 162 170 130 58 96 93 90Wood & furniture 223,135 177,504 165,935 296,366 428,110 1,002 1,474 1,999 2,053 407 610 688 655Paper & products, printing,
publishing 3,120 3,544 3,006 853 308 628 734 782 768 289 372 376 353Other manufacturing industry 283,463 266,319 254,750 112,799 125,185 4,851 5,872 7,037 6,135 2,731 3,056 3,045 2,985
Total 856,245 769,821 766,014 664,483 869,461 17,900 21,975 28,758 27,021 7,091 8.487 8,310 7.950
Number of Persons Engaged
Food & beverages 632,158 711,568 692,119 546,629 630,551 290,352 333,871 349,154 287,548 140,347 151,502 146,618 144,116Textiles, wearing apparel 244,986 193,964 144,063 126,480 145,993 174,439 166,992 220,251 235,497 167,615 236,105 219,059 203,587Leather & products 11,858 5,565 4,126 9,124 10,613 5,976 7,631 3,007 6,483 6,631 8,745 8,997 8,978Wood & furniture 442,113 351,194 363,084 626,116 790,064 17,553 23,511 41,229 41,356 22,368 38,538 41,613 45,232Paper & products, printing,
publishing 9,270 10,178 8,233 2,098 1,386 20,730 24,905 30,880 27,395 21,982 26,041 27,493 26,499Other manufacturing industry 655,194 515,625 532,116 323,947 375,174 339,891 415,119 584,466 333,357 302,761 299,001 363,857 363,247
Total 1,995,579 1,788,094 1,743,741 1,634,394 1,953,781 848,941 972,029 1,228,987 931,636 661,704 760,031 807,637 791,659
/a The definition of Medium and Large Industry for 1970-73 and 1974-77 is different.See /a on page 2 and Annex, p
Sources: (1) Survey on Small Scale Manufacturing and Handicraft, 1970 to 1974 annual issues. 1(2) Survey of Large and Medium Scale Manufacturing Industries, 1970 to 1973 annual issues. Co(3) Industrial Census 1974/75: Large and Medium Manufacturing Establishment, Volume I.(4) Survey of Manufacturing Industries (Medium & Large Industries), Volume 1, 1975, 1976 and 1977 (unpublished).

-90-Table 18
INDONESIA
Number of Establishments and Persons Engaged in Small & Handicraft Industry byRural/Urban Areas and Industry Group, 1969-74
No. of Establishments No. of Persons EngagedMajor Industry Group Rural Urban Total Rural Urban Total Rural Urban Total Rural Urban Total
1969 --------- 1970 ---- 1969 -------- 1970
Food & beverages 184,358 19,130 203,488 203,276 19,465 222,741 512,752 61,756 574,508 566,699 65,459 632,158
Textiles, wearing apparel 88,645 8,672 97,317 106,311 11,472 117,783 179,945 22,245 202,190 213,630 31,356 244,986
Leather 6 products 4,261 1,311 5,572 1,305 4,698 6,003 7,181 2,365 9,546 8,694 3,164 11,858
Wood & furniture 202,214 10,349 212,563 213,818 9,317 223,135 373,908 21,775 395.683 419,164 22,949 442,113
Paper & products, print.,publishing 1,397 1,051 2,448 1,220 1,900 3,120 3,667 3,819 7,486 1,900 7,370 9,270
Other mfg. industry 248,597 17,112 265,709 264,907 18,556 283,463 548,655 47,972 596,627 606,222 48,972 655,194
Total 729,472 57,625 787,097 794,230 62,015 856.245 1.626.108 159,932 1,786.040 1,816,309 7,270 1,995,579
1971 ---- ----- 1972 - - 1971 ------ ------- 1972 …
Food & beverages n.a. n.a. 249,589 235,891 25,518 261,409 n.a. n.a. 711,568 616,651 75,468 692,119
Textiles, wearing apparel n.a. n.a. 70,992 64,933 14,448 79,381 n.a. n.a. 193,964 110,340 33,723 144,063
Leather 6 products n.a. n.a. 1,873 468 1,065 1,533 n.a. O.a. - 5,565 1,872 2,254 4,126
Wood & furniture n.a. n.a. 177,504' 161,096 4,839 165,935 n.a. n.a. 351,194 347,903 15,181 363,084
Paper S products, print.,publishing n.a. n.a. 3,544 1,935 1,071 3.006 n.a. n.a. 10,178 4,973 3,260 8,233
Other mfg. industry n.a. n.a. 266,319 236,652 18,098 254,750 n.a. n.a. 515.625 489,884 42,232 532,116
Total n.a. n.a. 769,821 700.975 65,039 766.014 n.. n.a. 1,788,094 1.571,623 172,118 1,743,741
1973 -- -- 1974 - -- 1973 ---- ------ 1974 ---------
Food 4 beverages 167,871 27,616 195,487 208,476 25,388 233,864 451,158 95,471 546,629 549,833 80,718 630,551
Textiles, wearing apparel 50,484 5,562 56,046 75,229 4,160 79,389 109,393 17,087 126,480 137,785 8,208 145,993
Leather & products 1,092 1,840 2.932 2,168 437 2,605 3,072 6,052 9,124 8.428 2,185 10,613
Wood & furniture 283,317 13,049 296,366 414,092 14,018 428,110 591,594 34,522 626,116 754,262 35,802 790,064
Paper 6 products, print.,publishing 505 348 853 n.a. 308 308 1,010 1,088 2,098 n.a. 1,386 1,386
Other mfg. industry 95,912 16,887 112,799 104,034 21,151 125,185 271,898 52,049 323,947 311,154 64,020 375,174
Total 599,181 65,302 664,483 803,999 65,462 869,461 1,428,125 206,269 1,634,394 1,761,462 192,319 3,781
Source: BPS: Survey on Small-Scale Manufacturing and Nandicraft, 1969 to 1974 (annual issues).

-91-
Table 19
INDONESIA
NUMBER OF ESTABLISHMENT & PERSONS ENGAGED BY PROVINCE, 1973-77
Small Industry Medium & Large IndustryProvince 1973 1974 1975 1976 1977 1973 1974 1975 1976 1977
Number of Establishments
Aceh N.A. N.A. 4,032 4,765 5,588 N.A. N.A. 166 153 160Sumatra, North - … N.A. - ---------- -------------- N.A. - ----- …-----
Riau /a 2,199 2,452 2,527 2,448 2,483 104 117 115 122 130Jambi 7a 1,057 1,154 768 1,220 1,264 171 186 297 296 320Jogyakarta N.A. 1,131 1,086 968 N.A. N.A. 155 179 175 N.A.Java, East 4,469 5,730 6,218 7,483 9,522 4,107 4,295 4,458 4,432 2,376Kalimantan, West 973 1,187 1,163 1,162 1,041 185 191 148 133 127Sulawesi, Central /a 96 96 178 565 775 31 31 37 42 45Nusatenggara, West N.A. 973 1,182 1,289 1,390 N.A. 75 105 139 134Nusatenggara, East 171 209 629 903 1,538 11 18 31 35 35
Total /b 5 538 9.11 7 9,827 16,232 18,316 0 4,951 5421 5,405 2197
Persons Engaged/Establishment 17 6 8 5 3 43 55 57 58 106
Number of Persons Engaged
Aceh N.A. N.A. 3 3 2 N.A. N.A. 12 18 23Sumatra, North /a ------------- N.A. ------------- -…--------- N.A. -------------Riau /a /c 2 2 2 2 2 13 15 12 17 18Jambi /a 3 2 4 3 3 26 25 18 20 21Jogyakarta N.A. 8 7 7 N.A. N.A. 104 80 80 N.A.Java, East 20 7 9 7 4 44 56 62 62 131Kalimantan, West 2 2 1 2 2 39 39 57 56 57Sulawesi, Central /c 3 3 11 4 3 11 11 13 16 23Nusatenggara, West N.A. 4 4 5 5 N.A. 46 42 48 52Nusatenggara, East -------------- N.A. ------------- 40 37 38 37 37
Total /b 17 6 8 5 3 43 55 57 58 106
/a Small industry includes handicraft./b Total for small industry excludes Riau, Jambi and Nusatenggara East, and
total for MLIs exclude Riau./c Data on large scale industry are not available.
Source: Department of Industry, Government of Indonesia (unpublished data,December 1978).

-92-Table 20
INDONESIA
GROWTH OF MANUFACTURING EMPLOYMENT, 1961, 1971, 1976
Rural Urban TotalYear Male Female Total Male Female Total Male Female Total
Manufacturing Employment
1961 663,857 518,063 1,181,920 500,525 183,716 684,241 1,164,382 701,779 1,866,1611971 1,062,567 1,225,574 2,288,141 461,202 200,271 661,473 1,523,769 1,425,845 2,949,6141976 1,488,501 1,502,663 2,991,164 451,998 232,967 684,955 1,940,489 1,735,630 3,676,119
Change in Manufacturing Employment (Absolute)
1971/1961 398,710 707,511 1,106,221 -39,323 16,555 -22,768 359,387 724,066 1,083,4531976/1971 425,934 277,089 703,023 -9,204 32,696 23,482 416,720 309,785 726,5051976/1961 824,644 984,600 1,809,244 -48,527 49,251 714 776,107 1,033,851 1,809,958
Change in Manufacturing Employment (%)
1971/1961 160.05 236.57 193.59 92.14 109.01 96.67 130.86 203.17 158.061976/1971 140.08 122.61 130.72 98.00 116.32 103.55 127.35 121.73 124.63
1976/1961 224.22 290.05 253.08 90.30 126.81 100.10 166.65 247.32 196.99
Total Employment
1961 20,733,025 7,920,374 28,653,399 3,248,239 1,049,621 4,297,860 23,981,264 8,969,995 32,951,2591971 22,140,971 11,537,045 33,678,016 4,216,509 1,579,967 5,796,476 26,357,480 13,177,012 39,474,4921976 28,819,553 19,272,332 48,091,885 5,093,025 2,124,657 7,217,682 33,912,578 21,396,989 55,309,567
Manufacturing Employment/Total Employment (I)
1961 3.20 6.54 4.12 15.41 17.50 15.92 4.86 7.82 5.66
1971 4.80 10.62 6.79 10.94 12.67 11.41 5.78 10.87 7.471976 5.16 7.80 6.22 8.87 10.96 9.49 5.72 8.11 6.65
Annual Growth Rate (I)
1971/1961 4.82 8.99 6.83 -0.81 0.87 -0.34 2.73 7.35 4.681976/1971 6.97 4.16 5.50 -0.40 3.07 0.70 4.95 4.01 4.50
1976/1961 5.53 7.36 6.39 -0.68 1.60 0.01 3,46 6.22 4.62
Source: Employment and Income Distribution in Indonesia.(World Bank, Development Economics Department, October 1978).

-93- Table 21Page 1
INDONESIA
SCORES OF INDUSTRIAL BRANCHES SUITABLE FOR SMALL- AND MEDIUM-SCALE OPERATION
Factorendow- Skilled Re-
Commodity or service Growth ment labor Size Exports sources Total
Food IndustriesFish processing I I I I I I 6Rice milling I I I I I I 6Other cereals I II II II I V 13Bakery products I I II I I V 11Vegetable oil III III III II I I 13Margarine I II II I III I 10Coffee III II II II I I 11Tea V II II I I I 12
TextilesCotton fabric II I II II I V 13Rope I I II II I I 8Hemp I I I II I II 8Knitting mill products I I II I I V 11Wearing apparel I I II I I III 9
LeatherLeather goods excent
footwear II I II I I III 10Leather footwear II I III I I III 11
Wood, Paper and RelatedIndustriesSawmill IV I II I I I 10Bamboo, vines & cork III I I I II I 9Wood furniture III I II I I I 9Other wood products III I II I II I 10Paper boxes & containers II I II I V III 14Corrugated board II I II I V III 14
Chemical IndustriesPigments I I III I IV I 11Matches I I I I V III 12
PetroleumLubricants III IV IV II I I 15Briquettes IV I III I V I 15

-94- Table 21Page 2
Factorendow- Skilled Re-
Commodity or service Growth ment labor Size Exports sources Total
Rubber IndustriesBicycle tires & tubes I I II II I I 8Rebuilt tires I I II I I II 8Rubber footwear I I II II I I 8Rubber hose I I II II V I 12Rubber-coated textiles III II III II IV I 15
Non-Metallic MineralIndustries
Tiles II I II II V I 13Clay bricks II I II II V I 13Clay products II I I I V I 11Earthenware II I I I V I 11Glassware I I II II V I 12Cement products I II II I V I 12Plaster & its products III I II I V I 13
Iron, Steel & Other MetalsMolding and casting iron II II III I V V 18Aluminum second alloy III III III I I V 16Molding of non-ferrous
metals except aluminum III I II I I V 13Enamel products I III II II II V 15Cutlery & tableware II I II I I IV 11Farm & implements I I II I I IV 10Hand tscls II IV I I V 15Bolts, nuts, nails,
spikes, etc. I I II I I V 11Aluminum alloy products III I I I I V 12Metal furniture II III III II V V 20Metal constructionmaterials II II IV II II V 17
MachineryNon-electrical powermachinery I II IV II I V 15
Metalworking machines I I III I I V 12Textile machines I I III II I V 13General industrial
machines II I III I V V 17Light bulbs I I II II I V 12Batteries I II II III I IV 13
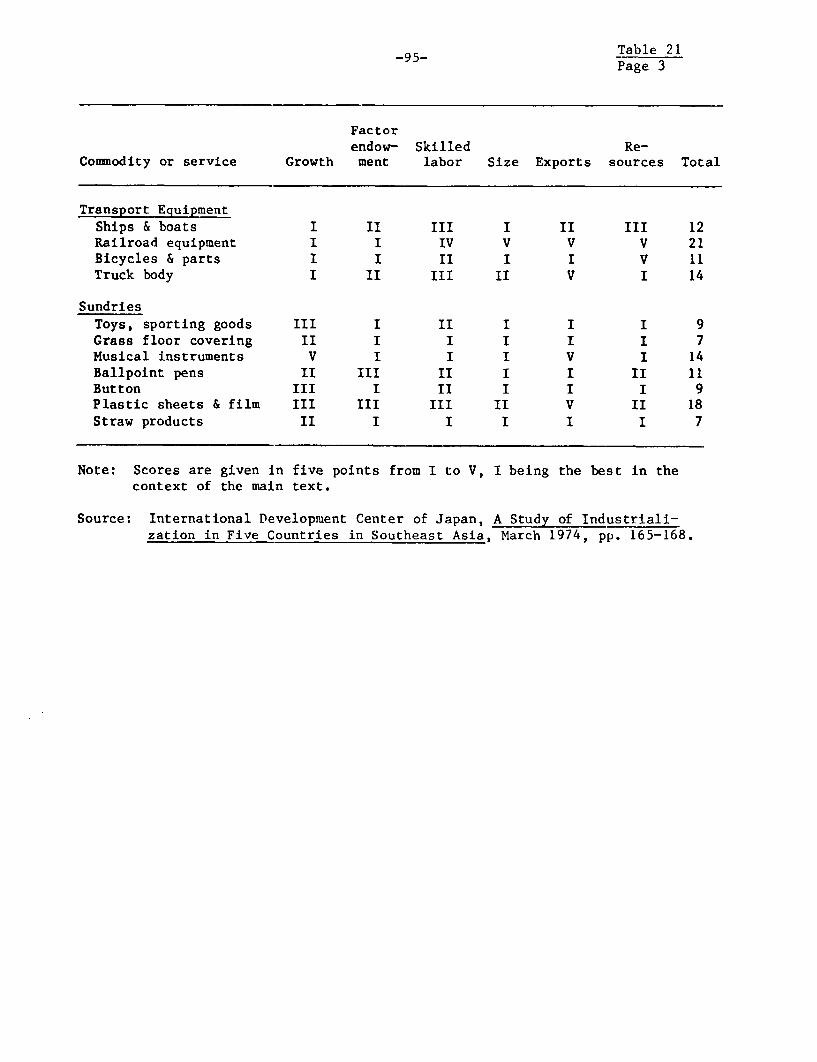
-95- Table 21Page 3
Factorendow- Skilled Re-
Commodity or service Growth ment labor Size Exports sources Total
Transport Equipment
Ships & boats I II III I II III 12Railroad equipment I I IV V V V 21Bicycles & parts I I II I I V 11Truck body I II III II V I 14
Sundries
Toys, sporting goods III I II I I I 9Grass floor covering II I I I I I 7Musical instruments V I I I V I 14Ballpoint pens II III II I I II 11Button III I II I I I 9Plastic sheets & film III III III II V II 18Straw products II I I I I I 7
Note: Scores are given in five points from I to V, I being the best in thecontext of the main text.
Source: International Development Center of Japan, A Study of Industriali-zation in Five Countries in Southeast Asia, March 1974, pp. 165-168.

-96-
Table 22
Production of Selected Industrial Products
Annual growthrates (%)
Absolute Volume index: 1969/70 1969/70level 1969/70 = 100 to to
Products Unit 1976/77 1973/74 1976/77 1973/74 1976/77
Vegetable oil '000 tons 309 101.0 106.6 0.1 0.1Cigarettes Bil. pieces 61 170.0 203.3 14.2 10.7Textile yarn '000 bales 623 173.6 342.3 14.7 19.2Fabrics Mil. meters 1,240 206.0 275.6 20.0 15.6Matches Mil. boxes 772 206.7 287.0 20.0 16.3Soap '000 tons 176 98.5 132.3 -0.4 4.1Toothpaste Mil. tubes 104 213.3 693.3 21.0 32.0Radio sets '000 pieces 1,100 247.3 302.2 25.5 17.1Television sets '000 pieces 213 1,200.0 4,260.0 87.0 72.0Sewing machines '000 pieces 400 3,571.0 2,857.1 200.0 63.0Motorcycles '000 pieces 2678 714.3 1,271.1 64.0 44.0Car batteries '000 pieces 480 437.5 1,500.0 45.0 47.0Drycell batteries Mil. pieces 420 244.4 777.8 25.0 34.0Car tires '000 pieces 1,883 371.9 514.5 38.0 26.5Bicycle tires '000 pieces 7,297 266.7 330.1 28.0 18.6Paper '000 tons 54 276.5 317.6 29.0 17.7Urea '000 tons 412 136.5 484.7 8.0 25.5Reinforcing iron '000 tons 296 2,400.0 5,920.0 170.0 78.0Zinc plate '000 tons 156 777.8 1,733.3 68.0 50.0Steel pipes '000 tons 107 4,000.0 5,350.0 300.0 76.0Glass bottles '000 tons 57 308.0 475.0 40.0 25.0
Main new products (1973/74 = 100) Annual growth rate (1976-77)1973-74
Acytelene '000 m3 100.0 291.9 - 43.0Glass sheet square ft 100.0 138.0 - 11.5Steel cables 100 tons 100.0 283.3 - 30.0
Source: Draft World Bank report "Indonesia: Basic Economic Report", Table 8.1.(Index and growth rates derived by the mission).
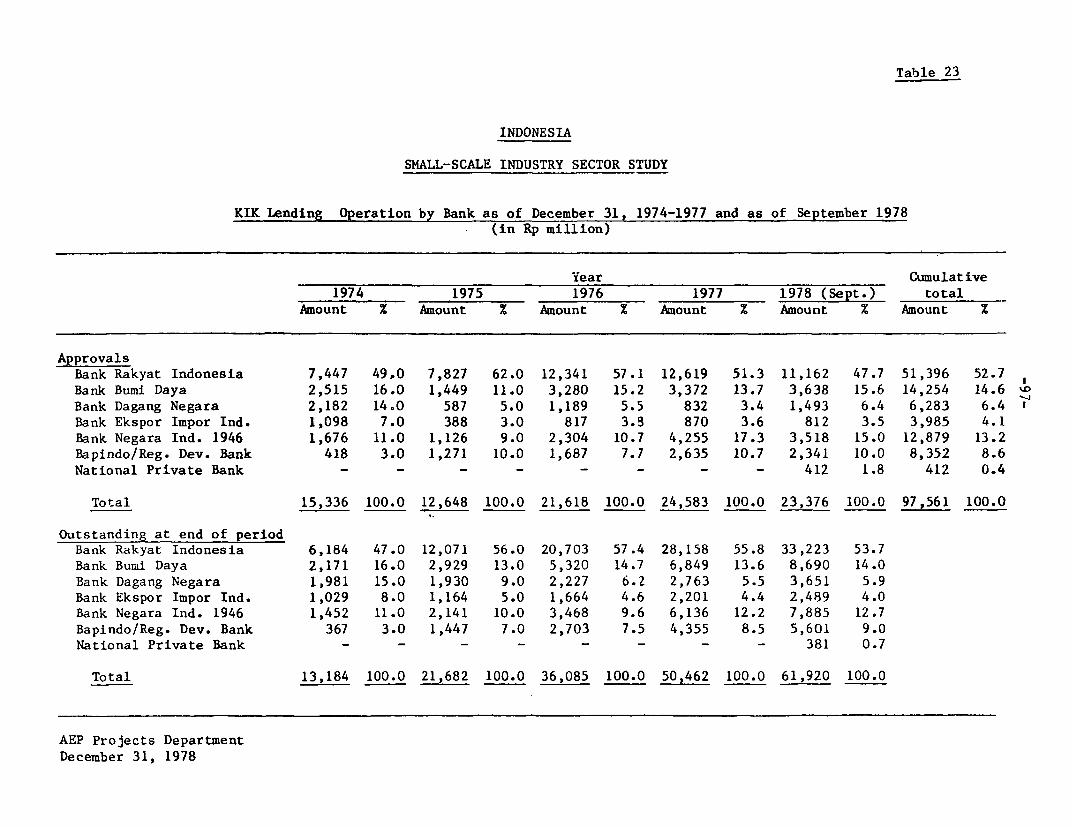
Table 23
INDONESIA
SMALL-SCALE INDUSTRY SECTOR STUDY
KIK Lending Operation by Bank as of December 31, 1974-1977 and as of September 1978(in Rp million)
tear Cumulative1974 1975 1976 1977 1978 (Sept.) total
Amount % Amount % Amount % Amount % Amount % Amount I
ApprovalsBank Rakyat Indonesia 7,447 49,0 7,827 62.0 12,341 57.1 12,619 51.3 11,162 47.7 51,396 52.7Bank Bumi Daya 2,515 16.0 1,449 11.0 3,280 15.2 3,372 13.7 3,638 15.6 14,254 14.6Bank Dagang Negara 2,182 14.0 587 5.0 1,189 5.5 832 3.4 1,493 6.4 6,283 6.4Bank Ekspor Impor Ind. 1,098 7.0 388 3.0 817 3.3 870 3.6 812 3.5 3,985 4.1Bank Negara Ind. 1946 1,676 11.0 1,126 9.0 2,304 10.7 4,255 17.3 3,518 15.0 12,879 13.2Bapindo/Reg. Dev. Bank 418 3.0 1,271 10.0 1,687 7.7 2,635 10.7 2,341 10.0 8,352 8.6National Private Bank - - - - - - - - 412 1.8 412 0.4
Total 15,336 100.0 12,648 100.0 21,618 100.0 24,583 100.0 23,376 100.0 97,561 100.0
Outstanding at end of periodBank Rakyat Indonesia 6,184 47.0 12,071 56.0 20,703 57.4 28,158 55.8 33,223 53.7Bank Bumi Daya 2,171 16.0 2,929 13.0 5,320 14.7 6,849 13.6 8,690 14.0Bank Dagang Negara 1,981 15.0 1,930 9.0 2,227 6.2 2,763 5.5 3,651 5.9Bank Ekspor Impor Ind. 1,029 8.0 1,164 5.0 1,664 4.6 2,201 4.4 2,489 4.0Bank Negara Ind. 1946 1,452 11.0 2,141 10.0 3,468 9.6 6,136 12.2 7,885 12.7Bapindo/Reg. Dev. Bank 367 3.0 1,447 7.0 2,703 7.5 4,355 8.5 5,601 9.0National Private Bank - - - - - - - - 381 0.7
Total 13,184 100.0 21,682 100.0 36,085 100.0 50,462 100.0 61,920 100.0
AEP Projects DepartmentDecember 31, 1978

Table 24
INDONESIA
SMALL-SCALE INDUSTRY SECTOR STUDY
KM11P Lending Operation by Bank as of December 31, 1974 and as of September 1978(in Rp million)
Year Cumulative1974 1975 1976 1977 1978 (Sept.) total
Amount % Amount % Amount % Amount % Amount % Amount %
ApprovaisBank Rakyat Indonesia 7,445 48.0 11,873 66.0 22,756 68.2 34,773 76.0 26,691 68.0 103,548 67.0Bank Bumi Daya 1,796 11.0 981 5.0 1,988 6.0 2,622 4.8 4,351 11.0 11,738 8.0Bank Dagang Negara 1,829 12.0 957 5.0 1,537 4.6 2,051 3.8 2,458 6.0 8,832 6.0Bank Ekspor Impor Ind. 1,768 11.0 861 5.0 1,439 4.3 1,947 3.6 1,076 3.0 7,091 5.0Bank Negara Ind. 1946 2,329 15.0 2,186 12.0 4,021 12.1 4,487 8.2 2,569 7.0 15,592 10.0 IBapindo/Reg. Dev. Bank 429 3.0 1,257 7.0 1,618 4.8 2,030 3.6 1,203 3.0 6,537 3.6 I'DNational Private Bank - - - - - - - 1,031 2.0 1,031 0.4 I
Total 15,606 100.0 18,115 100.0 33,359 100.0 47,910 100.0 39,379 100.0 154,369 100.0
Outstanding at end of periodBank Rakyat Indonesia 7,337 52.4 15,241 61.0 25,681 62.0 39,824 64.4 51,509 63.0Bank Bumi Daya 1,385 9.9 1,857 7.0 3,130 7.6 4,322 7.0 6,898 8.0Bank Dagang Negara 1,428 10.0 1,497 6.0 2,128 5.1 2,829 4.6 3,906 5.0Bank Ekspor Impor Ind. 1,581 11.3 1,881 8.0 2,716 6.5 3,727 6.0 4,011 5.0Bank Negara Ind. 1946 1,919 14.0 3,016 12.0 5,591 13.5 7,941 12.8 10,609 13.0Bapindo/Reg. Dev. Bank 340 2.4 1,390 6.0 2,200 5.3 3,195 5.2 3,360 4.0National Private Bank - - - - - - - 911 2.0
Total 13,990 100.0 24,882 100.0 41,446 100.0 61,838 100.0 81,204 100.0
AEP Projects DepartmentDecember 31, 1978
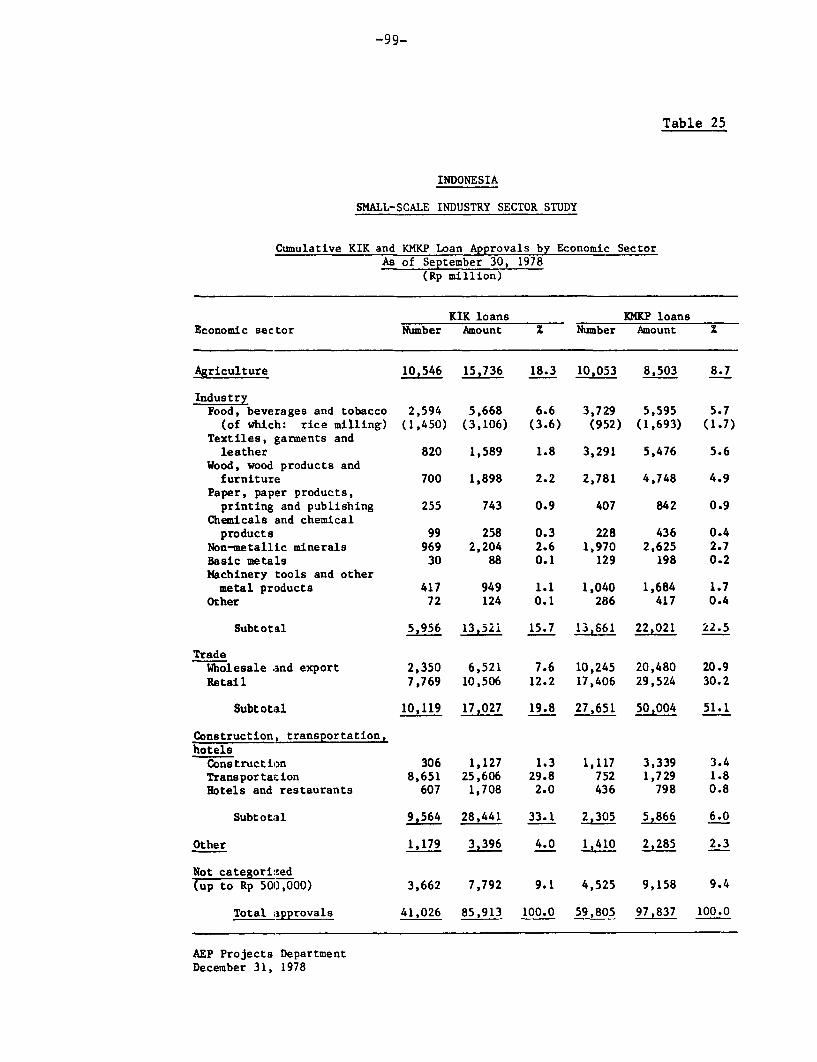
-99-
Table 25
INDONESIA
SMALL-SCALE INDUSTRY SECTOR STUDY
Cumulative KIK and KMKP Loan Approvals by Economic SectorAs of September 30, 1978
(Rp million)
KIK loans XMKP loansEconomic sector Number Amount Z Number Amount z
Agriculture 10,546 15,736 18.3 10,053 8,503 8.7
IndustryFood, beverages and tobacco 2,594 5,668 6.6 3,729 5,595 5.7
(of which: rice milling) (1,450) (3,106) (3.6) (952) (1,693) (1.7)Textiles, garments and
leather 820 1,589 1.8 3,291 5,476 5.6Wood, wood products and
furniture 700 1,898 2.2 2,781 4,748 4.9Paper, paper products,
printing and publishing 255 743 0.9 407 842 0.9Chemicals and chemical
products 99 258 0.3 228 436 0.4Non-metallic minerals 969 2,204 2.6 1,970 2,625 2.7Basic metals 30 88 0.1 129 198 0.2Machinery tools and othermetal products 417 949 1.1 1,040 1,684 1.7
Other 72 124 0.1 286 417 0.4
Subtotal 5,956 13,521 15.7 13,661 22,021 22.5
TradeWholesale .nd export 2,350 6,521 7.6 10,245 20,480 20.9Retail 7,769 10,506 12.2 17,406 29,524 30.2
Subtotal 10,119 17,027 19.8 27,651 50,004 51.1
Construction, transportation,hotels
Construction 306 1,127 1.3 1,117 3,339 3.4Transporta,cion 8,651 25,606 29.8 752 1,729 1.8Hotels and restaurants 607 1,708 2.0 436 798 0.8
Subtotal 9,564 28,441 33.1 2,305 5,866 6.0
Other 1,179 3,396 4.0 1,410 2,285 2.3
Not categorized(up to Rp 501),000) 3,662 7,792 9.1 4,525 9,158 9.4
Total approvals 41,026 85,913 100.0 59,805 97,837 100.0
AEP Projects DepartmentDecember 31, 1978

-1.00-
Table 26INDONESIA
SMALL-SCALE INDUSTRY SECTOR STUDY
Cumulative Industrial KIK and KMKP Industrial Loan Approvals by ProvincesAs of September 30, 1978
(Rp million)
Provincialpopulation
as percentageof national Industrial KIK Loans Industrial KMKP Loans
Province population Number Amount % Number Amount X
SumatraAceh 1.7 200 554 3.8 267 477 2.0North Sumatra 5.6 327 882 6.0 583 1,244 5.2West Sumatra 2.4 228 612 4.2 192 444 1.9Riau 1.4 86 245 1.7 121 243 1.0Jambi 1.0 69 156 1.1 98 168 0.8South Sumatra 2.9 117 267 1.8 175 368 1.5Bengkulu 0.4 21 56 0.4 30 68 0.3Lampung 2.3 89 263 1.6 116 304 1.3
Subtotal 17.7 1,137 3,035 20.6 1,582 3,336 14.0
JavaWest Java 18.3 760 2,048 13.9 1,859 3,576 15.0Jakarta 2.8 209 717 4.9 301 882 3.6Central Java 18.5 1,015 2,218 15.1 3,437 5,884 24.5Yogyakarta 2.1 379 656 4.5 948 1,495 6.3East Java 21.5 1,490 3,112 21.2 4,461 5,689 23.8
Subtotal 64.2 3,853 8,751 59.6 11,006 17,486 73.2
KalimantanWest Kalimantan 1.7 20 58 0.4 48 101 0.4South Kalimantan 1.4 94 265 1.8 160 281 1.2Central Kalimantan 0.6 54 166 1.1 54 124 0.5East Kalimantan 0.6 23 68 0.2 42 88 0.4
Subtotal 4.3 191 557 3.8 304 594 2.5
SulawesiNorth Sulawesi 1.5 84 151 1.0 136 221 0.9Central Sulawesi 0.7 76 128 0.9 140 167 0.7South Sulawesi 4.4 388 800 5.4 475 695 2.9Southeast Sulawesi 0.6 49 80 0.6 72 94 0.4
Subtotal 7.2 597 1,159 7.9 823 1,177 4.9
Other ProvincesMaluku 0.9 13 24 0.2 28 35 0.2Irian Jaya 0.1 44 139 1.0 54 133 0.6West Nusa Tenggara 1.9 20 44 0.3 32 41 0.2East Nusa Tenggara 1.9 146 300 2.0 177 177 0.7Bali 1.8 342 677 4.6 654 906 3.7
Subtotal 6.6 565 1,184 8.1 945 1,292 5.4
Total approvals 100.0 6,343 14,686 100.0 14,660 23,885 100.0
AEP Project DepartmentFohrl-ry 17, 1979

-101-
Table 27
INDONESIA
SMALL-SCALE INDUSTRY SECTOR STUDY
Total KIK and KMKP ArrearsAs of Dec, 31, 1975-77 and Sep. 30, 1978
(Rp billion)
Classification /a 1975 1976 1977 1978(Sep. 30)
Kurang LancarKIK 1.24 2.37 5.77 7.34KMKP 0.85 5.06 4.89 7.48
DiragukanKIK 0.07 0.50 1.30 1.49KMKP 0.29 2.02 3.14 4.09
Dianggap RugiKIK 0.00 0.00 0.08 0.26KMKP 0.00 0.69 0.24 0.14
Tidak TerperinchiKIK 0.06 0.54 0.62 0.17KMKP 0.02 0.69 0.24 0.14
Total ArrearsKIK 1.37 3.41 7.77 9.26KMKP 1.16 7.77 8.33 11.87
As % of outstandingportfolioKIK 6.3 9.4 15.4 15.0KMKP 4.7 18.7 24.9 18.5
/a The lending banks report their KIK/KMKP arrearages according to BankIndonesia's classification, which is based on the following definitions:(1) Kurang Lancar - Principal and interest amount overdue for more than
3 months and 1 months respectively, which are considered fullyrecoverable.
(2) Diragukan - overdue amounts as under (1), with a collection probability ofat least 50%.
(3) Dianggup Rugi - as under (2) with a collection prrobability of lessthan 50%.
(4) TIDAK Terperinchi - write-offs.
AEP Project DepartmentDecember 31, 1978

-102-Table 28
INDONESIA
SMALL-SCALE INDUSTRY SECTOR STUDY
Estimated Industrial KIK and KMKP ArrearsAs of Dec, 31, 1975-77 and Sep. 30, 1978
(Rp billion)
1975 1976 1977 1978(Sep. 30)
Estimated/a Industrial ArrearsKIK 0.04 1.99 2.63 2.72
KMKP 0.08 2.48 3,66 3.74KMKP (adjusted)/b 0.08 1.00 2.00 2.00
Arrears as % of outstandingIndustrial portfolio
KIK n.a. n.o. n.a. 11.3.KMKP n.a. n.a. n.a. 15.7.
KMKP (adjusted) n.a. n.a. n.a. 8.4.
Estimated number of loans in_arrears as % of total loanoutstanding
KIK n.a. n.a. n.a. 8.9.KMKP n.a. n.a. n.a. 8.9.
/a Estimates are based on the mission's discussions in the field with various
lending banks and on actual data for one particular bank, whose industrialportfolio accounts for some 30% of all industrial KIK/KMKP Laos.
/b Estimated KMKP arrearages for 1976-1978 have been adjusted by eliminating 15loans in one particular province (Jakarta Raya) which were not strictly theindustrial KMKP Loans.
AEP Project DepartmentFebruary 17, 1979
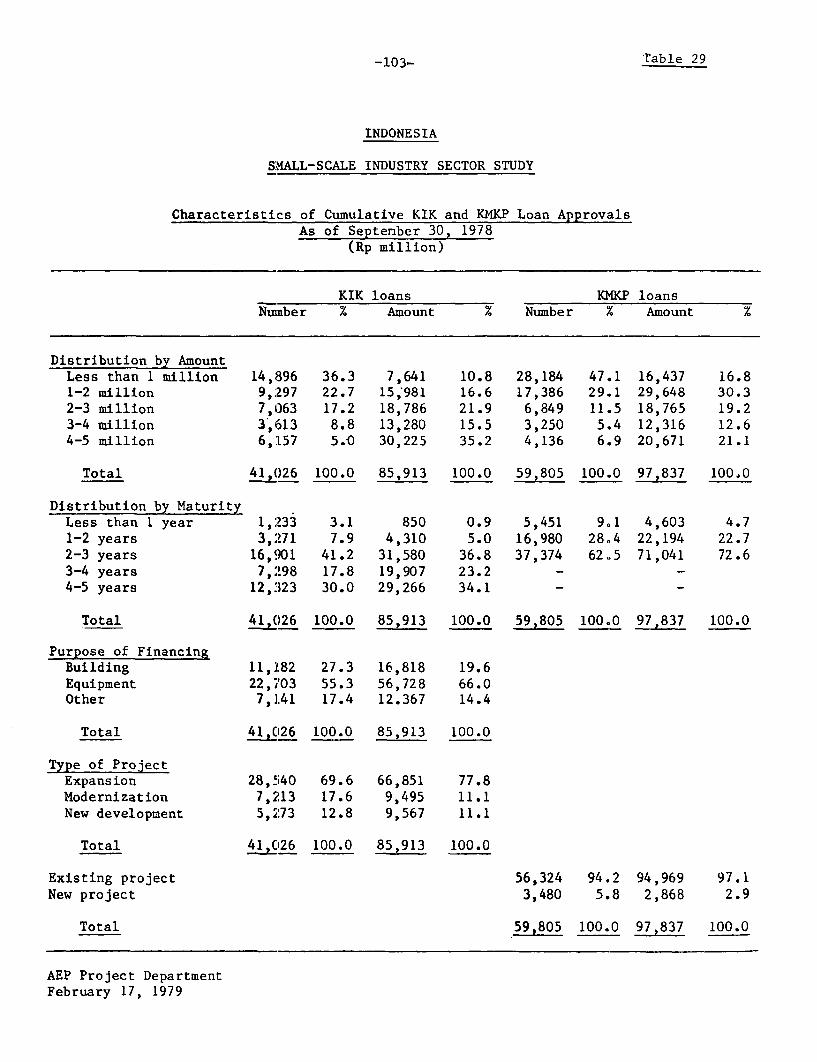
-103- Table 29
INDONESIA
SHALL-SCALE INDUSTRY SECTOR STUDY
Characteristics of Cumulative KIK and KMKP Loan ApprovalsAs of September 30, 1978
(Rp million)
KIK loans KMKP loansNumber % Amount % Number % Amount 7.
Distribution by AmountLess than 1 million 14,896 36.3 7,641 10.8 28,184 47.1 16,437 16.81-2 million 9,'297 22.7 15,'981 16.6 17,386 29.1 29,648 30.32-3 million 7,063 17.2 18,786 21.9 6,849 11.5 18,765 19.23-4 million 3',613 8.8 13,280 15.5 3,250 5.4 12,316 12.64-5 million 6,'157 5.0 30,225 35.2 4,136 6.9 20,671 21.1
Total 41,026 100.0 85,913 100.0 59,805 100.0 97,837 100.0
Distribution by MaturityLess than 1 year 1,233 3.1 850 0.9 5,451 9.1 4,603 4.71-2 years 3,271 7.9 4,310 5.0 16,980 28.4 22,194 22.72-3 years 16,901 41.2 31,580 36.8 37,374 62.5 71,041 72.63-4 years 7,2!98 17.8 19,907 23.2 - -4-5 years 12,323 30.0 29,266 34.1 - -
Total 41926 100.0 85,913 100.0 59,805 100.0 97,837 100.0
Purpose of FinancingBuilding 11,L'82 27.3 16,818 19.6Equipment 22,703 55.3 56,728 66.0Other 7,1.41 17.4 12.367 14.4
Total 41,026 100.0 85,913 100.0
Type of ProjectExpansion 28,'540 69.6 66,851 77.8Modernization 7,2,13 17.6 9,495 11.1New development 5,273 12.8 9,567 11.1
Total L1026 100.0 85,913 100.0
Existing project 56,324 94.2 94,969 97.1New project 3,480 5.8 2,868 2.9
Total 59,805 100.0 97,837 100.0
AEP Project DepartmentFebruary 17, 1979
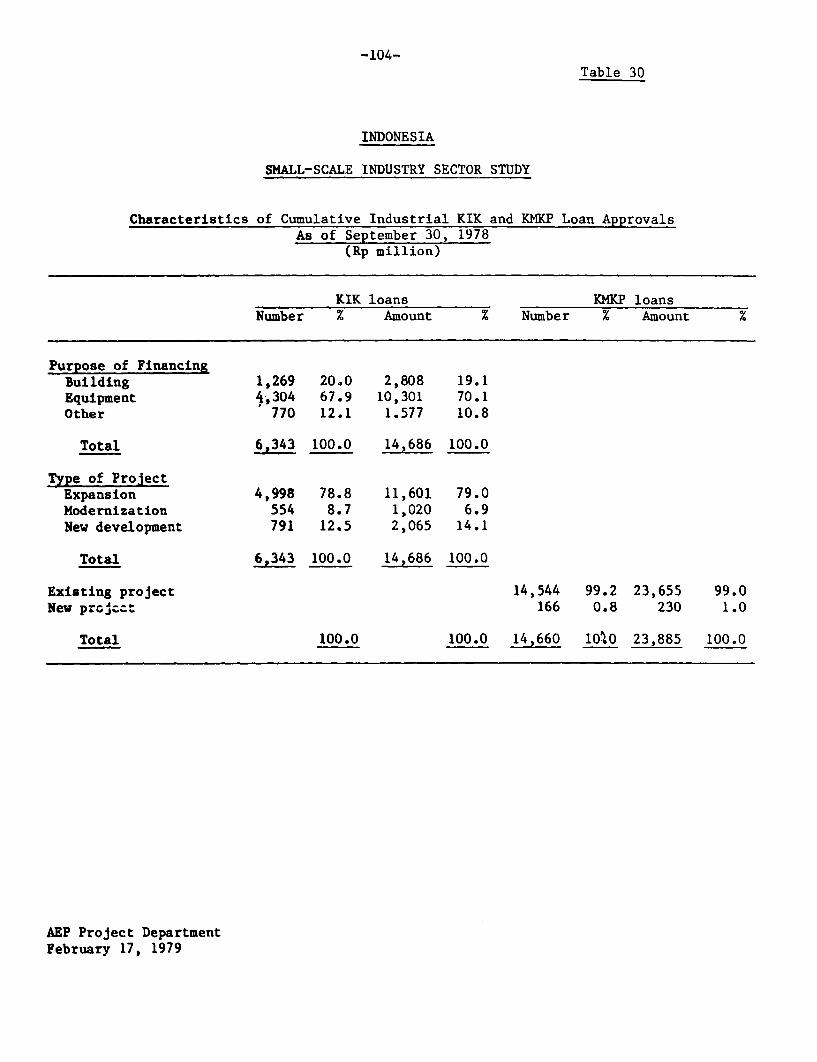
-104-Table 30
INDONESIA
SMALL-SCALE INDUSTRY SECTOR STUDY
Characteristics of Cumulative Industrial KIK and KMKP Loan ApprovalsAs of September 30, 1978
(Rp million)
RIK loans KMKP loansNumber % Amount % Number % Amount %
Purpose of FinancingBuilding 1,269 20.0 2,808 19.1Equipment 4,304 67.9 10,301 70.1Other 770 12.1 1.577 10.8
Total 6,343 100.0 14,686 100.0
Type of ProjectExpansion 4,998 78.8 11,601 79.0Modernization 554 8.7 1,020 6.9New development 791 12.5 2,065 14.1
Total 6,343 100.0 14,686 100.0
Existing project 14,544 99.2 23,655 99.0New projc:t 166 0.8 230 1.0
Total 100.0 100.0 14,660 1050 23,885 100.0
AEP Project DepartmentFebruary 17, 1979
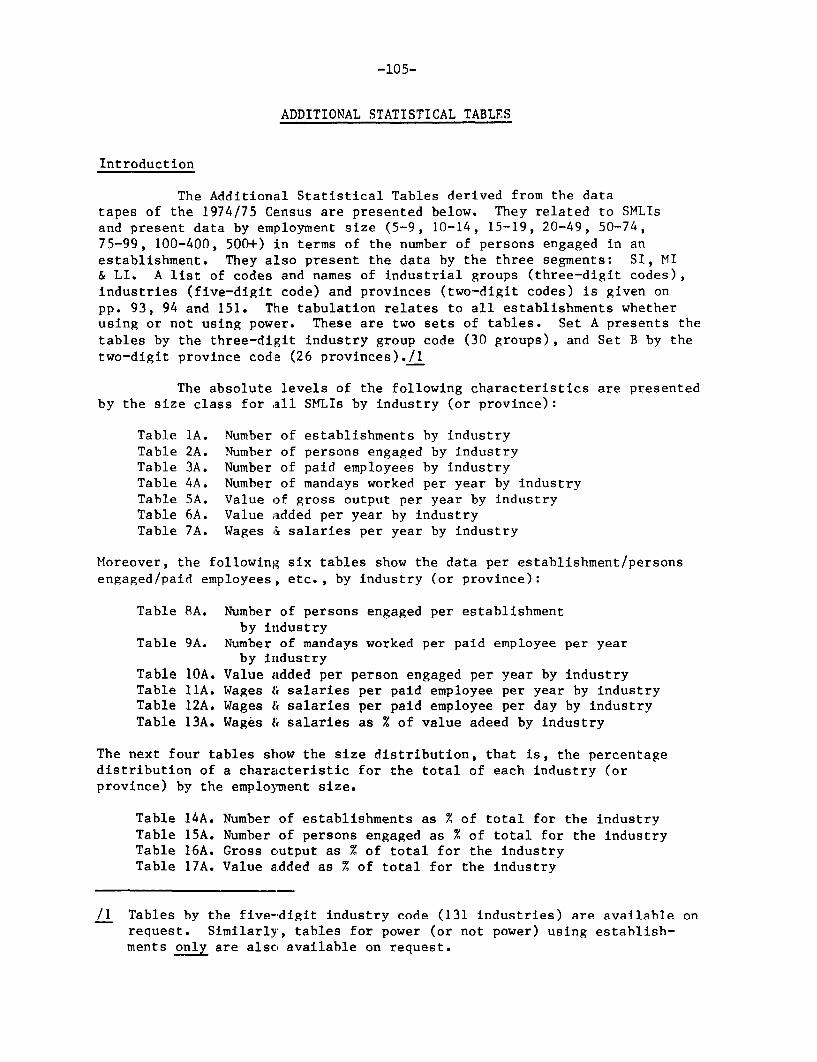
-105-
ADDITIONAL STATISTICAL TABLES
Introduction
The Additional Statistical Tables derived from the datatapes of the 1974/75 Census are presented below. They related to SMLIsand present data by employment size (5-9, 10-14, 15-19, 20-49, 50-74,75-99, 100-400, 500+) in terms of the number of persons engaged in anestablishment. They also present the data by the three segments: SI, MI& LI. A list of codes and names of industrial groups (three-digit codes),industries (five-digit code) and provinces (two-digit codes) is given onpp. 93, 94 and 151. The tabulation relates to all establishments whetherusing or not using power. These are two sets of tables. Set A presents thetables by the three-digit industry group code (30 groups), and Set B by thetwo-digit province code (26 provinces)./1
The absolute levels of the following characteristics are presentedby the size class for all SMLIs by industry (or province):
Table IA. Number of establishments by industryTable 2A. Number of persons engaged by industryTable 3A. Number of paid employees by industryTable 4A. Number of mandays worked per year by industryTable 5A. Value of gross output per year by industryTable 6A. Value added per year by industryTable 7A. Wages & salaries per year by industry
Moreover, the following six tables show the data per establishment/personsengaged/paid employees, etc., by industry (or province):
Table 8A. Number of persons engaged per establishmentby industry
Table 9A. Number of mandays worked per paid employee per yearby industry
Table IOA. Value added per person engaged per year by industryTable 11A. Wages & salaries per paid employee per year by industryTable 12A. Wages & salaries per paid employee per day by industryTable 13A. Wages & salaries as % of value adeed by industry
The next four tables show the size distribution, that is, the percentagedistribution of a characteristic for the total of each industry (orprovince) by the employment size.
Table 14A. Number of establishments as % of total for the industryTable 15A. Number of persons engaged as % of total for the industryTable 16A. Gross output as % of total for the industryTable 17A. Value added as % of total for the industry
/1 Tables by the five--digit industry code (131 industries) are available onrequest. Similarly, tables for power (or not power) using establish-ments only are also available on request.

-106-
Finally, the last four tables show the percentage distribution of acharacteristic for each size class by industry (or province).
Table 18A. Number of establishments as % of total for the sizeclass by industry
Table 19A. Number of persons engaged as x of total for the sizeclass by industry
Table 20A. Gross output as % of total for the size class byindustry
Table 21A. Value added as % of total for the size class byindustry
Tables lB to 21B represent the above statistical data by a province (insteadof an industry).
Provinces Codes and Names
Serial No. Code Name
1 11 D.I. Aceh2 12 Sumatra, North3 13 Sumatra, West4 14 Riau5 15 Jambi
6 16 Sumatra, South7 17 Bengkulu8 18 Lampung9 31 D.K.I. Jakarta
10 32 Java, West
11 33 Java, Central12 34 D.I. Jogyakarta13 35 Java, East14 51 Bali15 52 Nusa Tenggara, West
16 53 Nusa Tenggara, East17 61 Kalimantan, West18 62 Kalimantan, Central19 63 Kalimantan, South20 63 Kalimantan, East21 71 Sulawesi, North22 72 Sulawesi, Central23 73 Sulawesi, South24 74 Sulawesi, Southeast25 81 Maluku
26 82 Irian Jaya

-10 7-DATE 04/13/79 TIME 6:39PMTable IA. I ?1ONE SI A SURVEY OF SML*mEo+LGE ESTABLISHMENTS. 1974
NUIMBER OF ESTABLISHMENTS BY SIZE CLASS
SIZE CLUSS BY NUMBER OF PERSONS ENGAGED PER ESTABLISHMENT
CODES 5- 9 10- 14 15- 19 20- 49 50- 74 75- 99 100-499 500 a UP 5- 19 20- 99 100 & UP ALL
¶ 311+312 17886. 1B36. 784. 1148. 156. s0. 163. 68. 20506. 1384. 231.. 22121.2 313 267. a6. 45. 45. 7. 3. 8. 2. 398. 55. 8. 461.3 314 213. 104. 60. 372. 121. 54. 168. 51. 377. 547. 219. 1143.4 321 2394. 1178. 814. 1363. 252. 125. 236. 62. 4386. 1740. 298. 6424.B 322 478. 83. 43. 59. 10. 0. S. 0. 604. 69. 5. 678.
6 323 121. 20. S. 16. 5. 1. S. 0. 149. 22. S. 176.7 324 300. 30. 22. 24. 2. 2. 1. 3. 352. 28. 4. 384.B 331 2256. 489. 238. 271. 38. 17. 38. 3. 2983. 324. 41. 3348.9 332 1782. 268. 109. 75. 8. 2. S. 0. 2159. 85. 8. 2252.10 341 29. 17. 13. 36. 8. I- 8. 7. 59. 45. 1s. 119.
li 342 477. lBs. 105. 160. 35. li. 29. 2. 767. 206. 31. 1004.12 351 63. 31. 14. 35. 10. 9. 14. 3. 108. 54. 17. 179.13 352 291. 101. 65. 119. 39. 18. 48. 8. 457. 176. 56. 689.14 355 264. 89. 64. 214. 85. 37. 131. 8. 417. 336. t3g. 892.15 356 155. 80. s0. 84. 21. 10. 25. 0. 285. 115. 25. 425.
16 361 167. 22. 8. 16. 2. 1. I. 1. 197. Is. 2. 218.1 7 362 14. 3. 4. 21. 10. I1. 1a. 2. 21. 32. 20. 73.la 363 1326. 370. 171. 195. 18. 4. 9. 4. 1867. 217. 13. 2097.19 384 30S4. 453. 196. 140. 22. S. 6. 0. 3713. 167. 6. 3888.20 369 64. 26. 12. 9. 3. 0. 1. 0. 102. 12. 1. 115.
21 381 1802. 230. 129. 147. 35. Is. 54. 6. 2i61. 197. 60. 2418.22 382 lOS. 38. 14. 40. II. 2. 14. 2 . 157. 53. 16. 226.23 363 38. 16. 6. 21. 10. S. 23. 5. 60. 39. 28. 127.24 384 280. 69. 36. 66. 9. 12. 26. 7 . 387. 87. 33. 507.25 385 21. 12. 5. 12. 2. 0. I1. 0. 38. 14. 1. 53.
26 390 500. 115. 47. 45. 3 . 5. 7. 3 . 662. 53. 10. 725.…-- - - - - - - - - - - - - - - - - - - - - - - - - - - - - - - - - - - - - - - - - - - - - - -: - - - - - - - - - - - - - - - - -
27 TOTAL 34363. 5953. 3045. 4737. 921. 427. 1054. 247. 43381 6085. 1301 50767.…-- - - - - - - - - - - - - - - - - - - - - - - - - - - - - - - - - - - - - - - - - - - - - - - - - - - - - - - - - - - - - - - - -
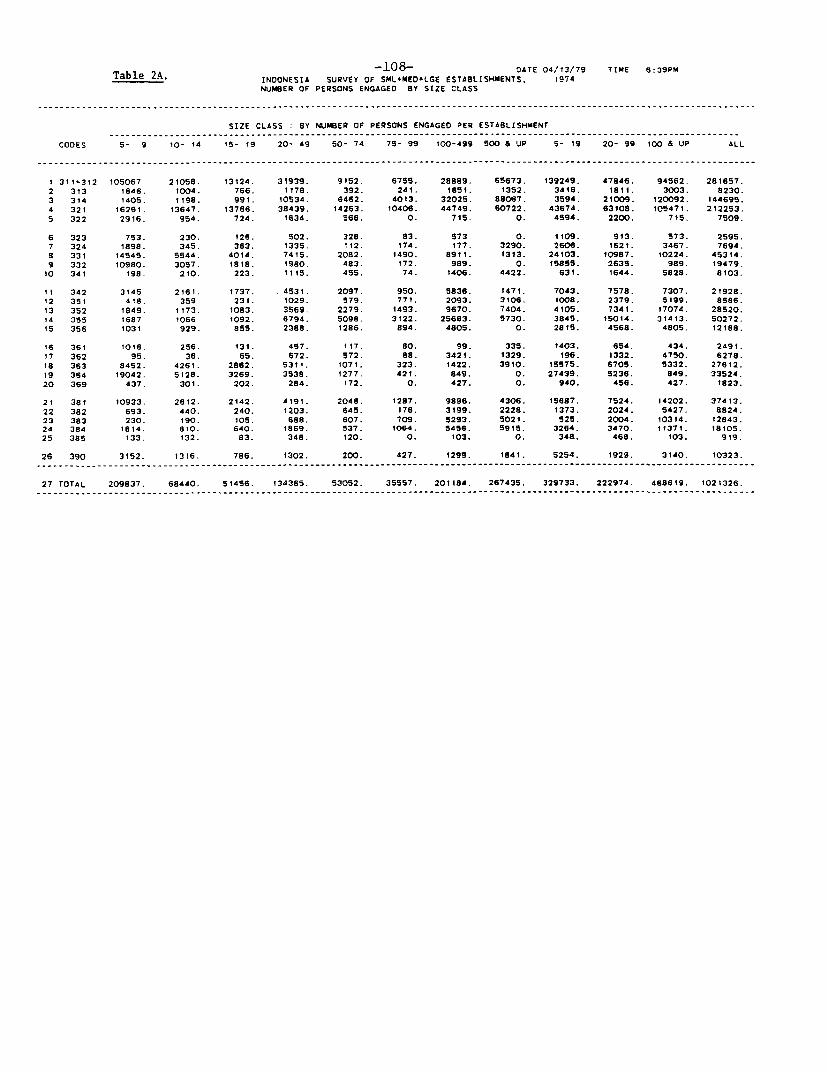
-108- DATE 04/13/79 TIME 6:39PMTable 2A. INDONESIA SURVEY OF SML+MED+LGE ESTABLISHMENTS. 1914
NUMBER OF PERSONS ENGAGED BY SIZE CLASS
SIZE CLASS : BY NUMBER OF PERSONS ENGAGED PER ESTABLISHMENT__________________________--_____________________--_______---_________--__--________________---______________________
CODES 5- 9 10- 14 Is- l9 20- 49 50- 74 75- 99 100-499 500 B UP 5- 19 20- 99 100 & UP ALL
I 31.+312 105067 21058. 13124. 31939. 9152. 6755. 28889. 65673. 139249. 47846. 94562. 281657.2 313 1646. 1004. 766. 1178. 392. 241. 1651. 1352. 3416. 1811. 3003. 8230.3 314 1405. tt98. 991. 10534. 6462. 4013. 32025. 88067. 3594. 21009. 120092. 144695.4 321 ¶6261. 13647. 13766. 38439. 14263. 10406. 44749. 60722. 43674. 63108. 105471. 212253.S 322 2916. 954. 724. 1634. 566. 0. 715. 0. 4594. 2200. 715. 7509.
6 323 753. 230. 126. 502. 328. 83. 573 0. 1109. 913. 573. 2595.7 324 1898. 345. 363. 1335. 112. 174. 177. 3290. 260e. 1621. 3467. 7694.8 331 14545. 5544. 4014. 7415. 2082. 1490. 8911. 1313. 24103. 10987. 10224. 45314.9 332 10980. 3057. t8t8. t980. 483. 172. 989. 0. 15855. 2635. 989. 19479.1O 341 198. 210. 223. 1115. 455. 74. 1406. 4422. 631. 1644. 5828. 8103.
II 342 3145 2161. 1737. .4531. 2097. 950. 5836. 1471. 7043. 7578. 7307. 21928.12 351 418. 359 231. 1029. 579. 771. 2093. 3106. 1008. 2379. 5199. 8586.13 352 1849. 1173. 1083. 3569. 2279. 1493. 9670. 7404. 4105. 7341. 17074. 28520.14 355 1687 1066 1092. 6794. 5098. 3122. 25683. 5730. 3845. 15014. 31413. 50272.15 356 1031 929. 855. 2388. 1286. 894. 4805. 0. 2815. 4568. 4805. 12188.
16 361 1016. 256. 131. 497. 117. 80. 99. 335. 1403. 654. 434. 2491.17 362 95. 36. 65. 672. 572. 88. 3421. 1329. I96. 1332. 4750. 6278.18 363 8452. 4261. 2862. 5311. 1071. 323. 1422. 3910. 15575. 6705. 5332. 27612.19 364 19042. 5128. 3269. 3538. 1277. 421. 849. 0. 27439. 5236. 849. 33524.20 369 437. 301. 202. 284. 172. 0. 427. 0. 940. 456. 427. 1823.
21 381 10933. 2612. 2142. 4191. 2046. 1287. 9896. 4306. 15687. 7524. 14202. 37413.22 382 693. 440. 240. 1203. 645. 176. 3199. 2228. 1373. 2024. 5427. 8824.23 383 230. 190. 105. 688. 607. 709. 5293. 5021. 525. 2004. 10314. 12843.24 384 1814. 810. 640. 1869. 537. 1064. 5456. 915. 3264. 3470. 11371. 18105.25 385 133. 132. 83. 348. 120. 0. 103. 0. 34a. 468. 103. 919.
26 390 3152. 1316. 786. 1302. 200. 427. 1299. 1841. 5254. 1929. 3140. 10323.
27 TOTAL 209837. 68440. 51456. 134365. 53052. 35557. 201184. 267435. 329733. 222974. 468619. 1021326.-- ------ ------ ------- ---------- ------------- --- ------ --- ---- _ _ ------- --------_ _ --- ------------------ --- ------- --------- --------- ----

-109-DATE 04/13/79 TIME 6:39PM
Table 3A. INDONESIA : SURVEY OF SML+MED+LGE ESTABLISHMENTS, 1974NUMBER OF PAID EMPLOYEES BY SIZE CLASS
......................... ..................................................... _._............ ............................................................................................ __ ................._..
SIZE CLASS : BY NUMBER OF PERSONS ENGAGED PER ESTABLISHMENT
CODES 5- 9 10- 14 1s- 19 20- 49 50- 74 75- 99 100-499 SOO & UP 5- 19 20- 99 100 & UP ALL
------------------------------- _--------.-_---------------.-----_-______-----__-----------------------------------------______------
I 311+312 72184. 17850. 11965. 30636. 8990. 6692. 28873. 65673. 101999. 46318. 94546. 242863
2 313 1164. 867. 699. 1152. 389. 241. 1648. 1352. 2730. 1782. 3000. 7512.
3 314 1012. 1017. 886. 10024. 6293. 3953. 31911. 8805S. 2915. 20270. 1t9966. 143151.
4 321 12436. 11696. 12441. 36209. 13927. 10249. 44609. 60697. 36573. 60385 105306. 202264.
5 322 2131. 798. 659. 1555. 560. 0. 712. 0. 3588. 2115. 712. 6419.
6 323 576. 199. 118. 481. 326. 83. 570. 0. 893. 890. 570. 2353.
7 324 1544. 295. 331. 1305. 99. 174. 177. 3290. 2170. 1578. 3467. 7215.
8 331 11030. 4827. 3722. 7219. 2060. 1488. 8902. 1313. 19579. 10767. 10215. 40561.
9 332 8137. 2682. 1608. 1891. 473. 172. 988. 0. 12427. 2536. 988. 15951.
10 341 i54. 189. 209. 1068. 452. 73. 1405. 4422. 552. 1593. 5827. 7972.
11 342 2598. 1971. 1622. 4459. 2087. 950. 5835. 1471. 6191. 7496. 7306. 20993.
12 351 337. 335. 220. 999. 571. 765. 2092. 3106. 892. 2335. 5198. 8425.
13 352 1402. 1044. 1012. 3499. 2265. 1489. 9661. 7404. 3458. 7253. 17065. 27776.
14 355 1408. 988. 1043. 6720. S085. 3120. 25679. 5730. 3439. 14925. 31409 49773.
is 356 812. 817. 795. 2313. 1284. 894. 4805. 0. 2424. 4491. 4805. 11720.
16 361 655. 227. 119. 445. 113. 80. 93. 335. DOOl. 638. 428. 2067.
17 362 76. 28. 57. 652. 565. 88. 3419. 1329. 161. 1305. 4748. 6214.
18 363 6659. 3717. 2629. 5118. 1056. 318. 1421. 3910. 13005. 6492. 5331. 24828.
19 364 13994. 4396. 2888. 3356. 1261. 414. 845. 0. 21278. 5031. 845. 27154.
20 369 359. 260. 186. 278. 170. 0. 427. 0 805. 448. 427. 1680.
21 381 8217. 2267. 1955. 4053. 2022. 1282. 9880. 4304. 12439. 7357. 14184. 33980.
22 382 546. 394. 224. 1170. 642. 176. 3198. 2228. 1164. 1988. 5426. 8578.
23 383 178 161. 99. 681. 607. 709. 5293. 5021. 438. 1997. 10314. 12749.
24 384 1403. 725 S91. 1807. 532. 1063. 5454. 8915. 2719. 3402 11369. 17490.
25 385 106. 120. 75. 332. 119. 0. 101. 0. 301. 451. 101. 853.
26 390 2371. 11O3. 660. 1245. 198. 419. 1294. 1840. 4134. 1862. 3134. 9130
27 TOTAL 151524. 58995. 46830. 128784. 52200. 35236. 200840. 267395. 257349. 216220. 468235. 941804.- - - ----- --- --- - ---- -- - - --- --- ----_ --- --- - --- ---- _ _ - ---- --- --- _ - --- --- ---- - -- - --- -_ - --- ---- - --- - -- ---- -- -

-110-OATE 04/13/79 TIME 6.39PM
Table 4A. INDONESIA SURVEY OF SML.MED+LGE ESTA8LISHMENTS. 1974MAN-DAYS WORKED PER YEAR BY SIZE CLASS
SIZE CLASS BY NUMBER OF PERSONS ENGAGED PER ESTABLISHMENT
CODES 5- 9 10- 14 15- 19 20.- 49 50- 74 75- 99 100-499 500 & UP 5- I9 20- 99 1OO & UP AL,
1 311431214631998. 3924201. 2766619. 6985639. 2046040. 1588753. 6728383. 14933738. 21322818. 10620432. 21662121. 53605371.2 313 235245. 212206. 179379. 253610. 90112. 53601. 231999. 275460. 626830. 387323. 507459. 1521612.3 314 120225. 124299. 109801. 1387038. 1014057. 660178. 7580574 24728233. 354325. 3061273. 32308807. 35724405.4 321 2529639. 2579156. 2945396. 9644774. 3782405.' 2708443. 11613762. 14905557. 8054191. 16135622. 265t9319. 50709132.5 322 430509. 185067. 158504. 354316. 134523. 0. 162562. 0. 774080. 488839. 162562. 1425481.
6 323 146683. 58288. 33780. 123690. 84122. 23760. 134346. 0. 238751. 231572. 134346. 604669.7 324 302417. 74112. 82205. 352960. 27722. 43473. 42156. 706323. 458734. 424155. 748479. 1631368.8 331 2086706. 1030147. 821975. t496365. 455587. 350940. 1821054. 303157. 3938828. 2302892. 2124211. 8365931.9 332 1866654. 705117. 449896. 475469. 108809. 34324. 247076. 0. 3021667. 618602. 247076. 3887345.10 341 36300. 40878. 46868. 259464. 105618. 9386. 317990. 937130. 124046. 374468. 1255120. 1753634.
11 342 672381. 546682. 455i44. 1085599. 514304. 215206. 1260381. 348708. 1674207. 1815109. 1609089. 5098405.12 351 65592. 80003. 59428. 224783. 98897. 172554. 435059. 628432. 205023. 496234. 1063491. 1764748.13 352 273221 247330. 260680. 781005. 496645. 296065. 1863330. 1741777. 781231. 1573715. 3605107. 5960053.14 355 317841. 228984. 250542. 1557382. 1146631. 748407. 6164222. 1353907. 797367. 3452420. 7518129. 11767916.15 356 171866. 206114. 210592. 571901. 296205. 228380. 1244853. 0. 588572. 1096486. 1244853. 2929911.
16 361 121771. 56708. 27752. 103753. 33643. 18496. 22251. 94432. 206231. 155892. 116683. 478806.17 362 19106. 5364. 13131. 162825. 118019. 22338. 719901. 331860. 37601. 303182. 1051761. 1392544.la 363 1112862. 790581. 636633. 1265801. 260175. 71107. 366935. 960217. 2540076. 1597083. 1327152. 5464311.19 364 2407872. 826326. 569502 823197. 314974. t14463. 233066. 0. 3803700. 1252634. 233066. 5289400.20 369 65485. 48943. 53064. 64996. 41627. 0. 110268. 0. 167492. 106623. 110268. 384383.
21 381 1744788. 562646. 514566. 1033008. 478577. 280654. 2264389. 988468. 2822000. 1792239. 3252857. 7867096.22 382 141579. 113739. 65756. 295867. 142639. 50678. 675631. 481607. 321074. 489184. 1157238. 1967496.23 383 44946. 41O37. 29456. 155858. 125801. 148131. 1158334. 1136265. 115439. 429790. 2294599. 2839828.24 384 323933. 183364. 160711. 454261. 134832. 236896. 1200032. 1141930. 668008. 825989. 2341962. 3835959.25 385 29798. 30704. 22668. 90493. 34080. 0. 13000. 0. 83170. 124573. 13000. 220743.
26 390 514332. 253400. 145908. 297137. 56862. 94758. 350150. 365768. 913640. 448757. 715918. 2078315.
27 TOTAL 30423745. 13161156. 11071231. 30334412. 12143140. 8250795. 47296033. 66362969. 54656132. 50728347.113659002 219043481.-------- ------- --------- --- ------------ ----------- ------------- ---_ _ ---------_ _ -----_ ------ --------------- ------- -- ---------- -------

*~~~~~~~~~r I a 000W 0 00I0 r)t- D 0- Q 0 4'9of 0-(9 (9D
* I I (9 NN ~~~~~~~~N 1I t
* II CO t I
* *~~ * (93031 (9(9000 OrIPIN- 00(93101 (~~9(9000 01 -
K Ip * I0i 0I i 01-W om-( NWN 090 ml ,o,-- o' (Sp
* I ~~~I .- . ..S I.. . . . . .
* I I I~~~~~~~~~~~~~~M ' N 00
* 101 I~~~~~~~~~~~~~~~~~~~~~~~~~~~~~~~~~~~~~~~~~~~~~~0
* 150001CI (9(9~~~~~r-0 v n ;zm 4(9 -CO Or mp 0 0o4w .eIf NI to* 0 ~~~~~~~~- o - OW-Q~~~~~~00 0 1- Mm 01* to S 0 CD Lo a,
14 'W* I IN* I
(9- IIWw1 31,r U~ m (13 in. 11.39 v)(9
I E VI 01(9 0 Iv p c 0) (9(9( ONt 0 -w v,0
I X . IQ .I .3..T D400r OC CO" t D CPGuI if)I * 1--0 (v 1-0(9 mOn IOWC4NW I
.3 *4IGI(9.-01Q ~~~~~~~~~~~~~~~~~~(9 - .W I~~~~~~~0
1-I I 5*11: I1 .I I
. . . . . . .
I- v. to (P W r-01 0 la 0 00- a qa 1-0 (11) 30 00 010228 .- SD-~t,t, n mOOl-, I,) nWO9 - 9
6. * 41 I I I~~IOtWIUP 0co I--4
.4fl 5 3 Ir
* * ZI S I I~~~~~0 C 1 t Ma0)- 5 0101 I~~~~~~~~~~~~~~~~~~~~~~~~0
I00 5 *01 I 010-NN0 -mWO(9 0(9001 OW1~~~~~~~~~~0O V 4- 0
I 0.31 * 31 -1 -(9(90-~to tvg v vw i i 0 (9-~ It XVI * O N S N
I 01~~~~~~~~~n v c
1111 I El I I~~~~~v )P; V; i; n v 0 I0 I WI I I~~~~~~~~~" , m , ww w ww w ww 0 I
* 0.1 I I~~~~~~~~~~~~~~~~~~~~~~~~~~~;OoW

-112-
DATE 04/13/79 TIME 6:39PM
Table 6A. INDONESIA : SURVEY OF SML+MED+LGE ESTABLISHMENTS. 1974VALUE AODED (ML.RUPIAHS) BY SIZE CLASS
SIZE CLASS BY NUMBER OF PERSONS ENGAGED PER ESTABLISHMENT----------------------------------------------------------- __----------------__-------------------------------------
CODES 5- 9 10- 14 15- 19 20- 49 50- 74 75- 99 100-499 500 S UP 5- 19 20- 99 100 E UP ALL
1 311+312 15896. 4321. 3745. 12353. 3658. 11157. 2B566. 61925. 23963. 27168. 90491-. 141622.2 313 222. 152. 153. 392. 98. 592. 4810. 8686. 528. 1082. 13496. 15105.3 314 112. 113 90. 1203. 702. 715. 16113. 87343. 315. 2619. 103456. 106389.4 321 1302. 1455. 1651. 19798. 2739. -850. 14969. 31527. 4408. 21687. 46497. 72591.5 322 353. 174. 140. 372. 80. 0. 89. 0. 667. 453. 89. 1209.
6 323 108. 67. 62. 171. 102. 46. 370. 0. 237. 319. 370. 926.7 324 301. 120. 92. 1650. 40. 55. 65. 2587. 513. -1555. 2652. 1610.8 331 2340. 1215. 762. 2075. 831. 490. 7358. 817. 4318. 3396. 8175. 15888.9 332 1463. 566. 436. 483. 92. 110. 544. 0. 2465. 685. 544. 3694.10 341 24. 21. 26. 345. t77. t. 774. 3796. 71. 524. 4571. 5165.
II 342 638. 481. 430. 1123. 1114. 802. 2758. 645. 1550. 3040. 3404. 7993.12 351 176. 141. 160. 479. 520. 707. 3026. 6626. 478. 1706. 9652. 11836.13 352 334. 442. 229. -1602. 1458. 1340. 8034. 4618. 1004. 1196. 12652. 14852.14 355 343 483. 441. 3447. 4547. 2643. 19412. 8095. 1268. 10637. 27507. 39412.15 356 194. 198. 170. 694. 332. 434. 1688. 0. 562. 1460. 1688. 3710.
16 361 56. 34. 30. 231. 9. 9. 5. -9. 120. 249. -4. 364.17 362 19. 2. 13. 268. 119. 9. 1739. 2871. 34. 396. 4610. 5040.18 363 889. 724. 621. -2306. 350. 178. 484. 1077. 2234. -1779. 10660. 11116.19 364 1187. 335. 223. 517. 451. 40. 153. 0. 1745. 1008. 153. 2906.20 369 38. 23. 63. 50. 160. 0. 100. 0. 124. 210. 0OO. 434.
21 381 1345. 409. 475. 1242. 843. 736. 3375. 4885. 2229. 2822. 8260. 13310.22 382 123. 115. 55. 523. 335. 1236. -975. 506t. 293. 2094. 4086. 6472.23 383 57. 79. 149. 448. 343. 321. 8977. 5725. 285. 1111 14702. 16099.24 384 354. 190. 230. 773. 506. 982. 10872. 9630. 774. 2262. 20501. 23537.25 385 21 15. 21 141. 20. 0. II. 0. 57. 161. It. 230.
26 390 328. 200. 91. 308. 36. 93. 569. 590. 618. 437. 1159. 2215.
27 TOTAL 28235. 12080. 10560. 41892. 19686. 22983. 136711. 255595. 50875. 84561. 392306. 527742.----- ------- -------- ------ -- --- ---------- ------------ --- -----_ _ --- -----------_ _ ----------- -------------- ---------- ---------- --------
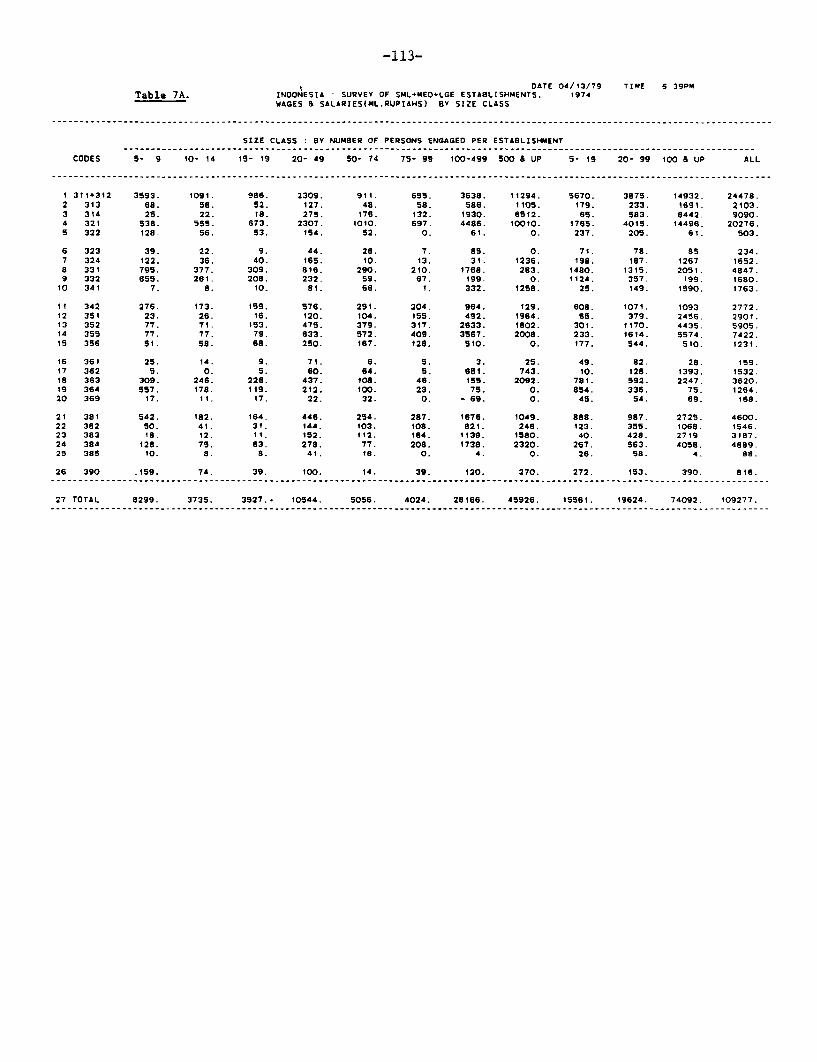
-113-
DATE 04/13/79 TIME 6 39PMTable 7A. INOONESIA * SURVEY OF SML-tED+LGE ESTABLISHMENTS, 1974
WAGES & SALARIES(ML.RUPIAHS) BY SIZE CLASS
SIZE CLASS : BY NUMBER OF PERSONS ENGAGED PER ESTABLISHMENT
CODES 5- 9 10- 14 15- 19 20- 49 50- 74 75- 99 100-499 500 & UP S- 19 20- 99 100 a UP ALL
1 311+312 3593. 1091. 986. 2309. 911. 655. 3638. 11294. 5670. 3875. 14932. 24478.2 313 68. 58. 52. 127. 48. 58. 586. 1105. 179. 233. 1691. 2103.3 314 25. 22. l8. 275. 176. 132. 1930. 6512. 65. 583. 8442. 9090.4 321 538. 555. 673. 2307. 1010. 697. 4486. 10010. 1765. 4015. 14496. 20276.5 322 128. 56. 53. 154. 52. 0. 61. 0. 237. 205. 61. 503.
6 323 39. 22. 9. 44. 28. 7. a5. 0. 71. 78. 85 234.7 324 122. 36. 40. 165. 10. 13. 31. 1236. 198. 187. 1267 1652.8 331 795. 377. 309. 816. 290. 210. 1768. 283. 1480. 1315. 2051. 4847.9 332 855. 261. 208. 232. 59. 67. 199. 0. 1124. 357. 199. 1680.10 341 7. 8. 10. 81. 66. 1. 332. 1258. 25. 149. 1590. 1763.
I1 342 276. i73. 159. 576. 291. 204. 964. 129. 608. 1071. 1093 2772.12 351 23. 26. 16. 120. 104. 155. 492. 1964. 65. 379. 2456. 2901.13 352 77. 71. 153. 475. 379. 317. 2633. 1802. 30i. 1170. 4435. 5905.14 355 77. 77. 79. 633. 572. 409. 3567. 2008. 233. 1614. 5574. 7422.15 356 5t. 58. 68. 250. 167. 126. 510. 0. 177. 544. 5tO. 1231.
16 361 25. 14. 9. 71. 6. 5. 3. 25. 49. 82. 28. 159.17 362 5. 0. 5. 60. 64. 5. 651. 743. 10. 128. 1393. 1532.Is 363 309. 246. 226. 437. 108. 46. 155. 2092. 781. 592. 2247. 3620.19 364 557. 178. t19. 212. 100. 23. 75. 0. 854. 336. 75. 1264.20 369 17. it. 17. 22. 32. 0. - 69. 0. 45. 54. 69. 168.
21 381 542. 182. 164. 446. 254. 287. 1676. 1049. 888. 987. 2725. 4600.22 382 50. 41. 31. 144. 103. 108. 821. 248. 123. 355. 1068. 1546.23 383 18. 12. II. 152. 112. 164. 1139. 1580. 40. 428. 2719 3187.24 384 128. 75. 63. 278. 77. 208. 1738. 2320. 267. 563. 4058. 4889.25 385 10. 8. 8. 41. 18. 0. 4. 0. 26. 58. 4. 8S.
26 390 .159. 74. 39. 1OO. 14. 39. 120. 270. 272. 153. 390. 816.27---TOTAL----8299.---3735.----3527.-------_0544.----5056.----4024.__--2--166._--45926.----15----1.---19624.----74092.----109277.---
27 TOTAL 8299. 3735. 3527.. 10544. 5056. 4024. 28166. 45926. 15561. 19624. 74092. 109277.---- ------ -------- --------------- -------- ---------- -----------_ _ ------------ -_ _ -------- -- ------------- ----------- ------- -------- ----
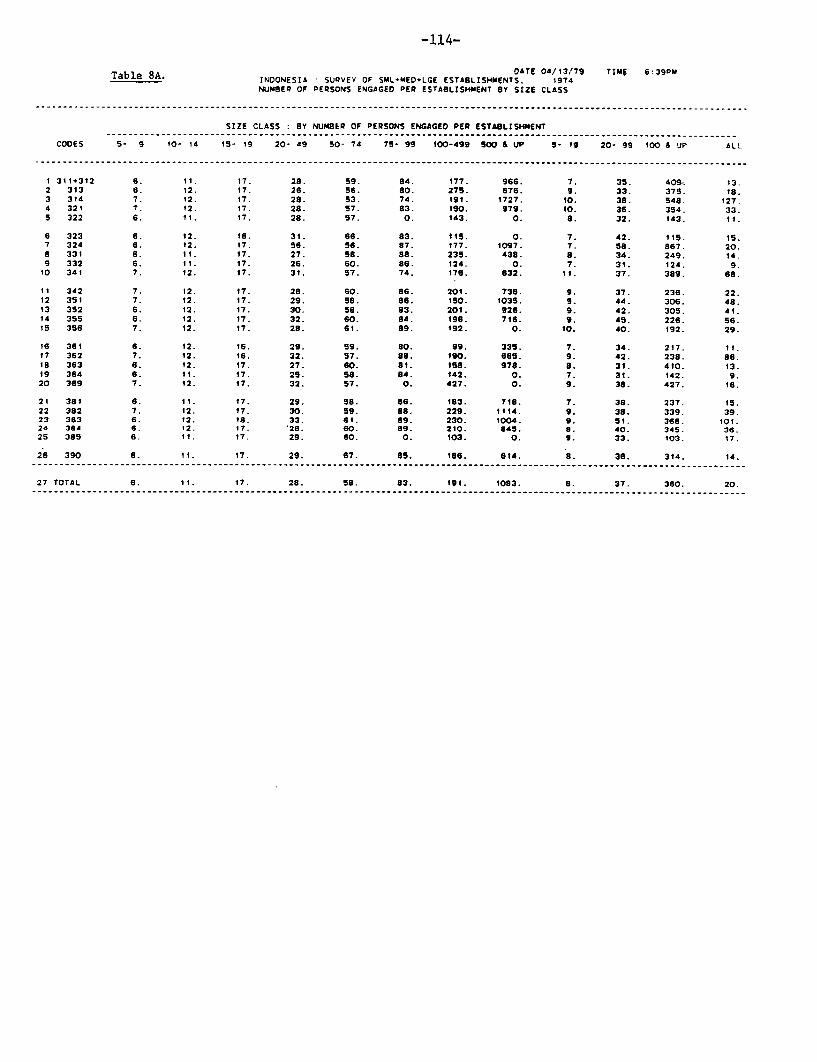
-114-
DATE 04/13/79 TTMN 6:39PMTable 8A. INDONESIA SURVEY OF SML*MED+LGE ESTABLISHMENTS. 1974
NUN9ER OF PERSONS ENGAGED PER ESTABLISHMENT BY SIZE CLASS
SIZE CLASS BY NUM8ER OF PERSONS ENGAGED PER ESTABLISHMENT
CODES 5- 9 10- 14 15- 19 20- 49 50- 74 75- 99 100-499 500 & UP 5- 19 20- 99 100 & UP ALL
I 311+312 6. II. 17. 28. 59. 84. 177. 966. 7. 35. 409. 13.2 313 6. 12. 17. 26. 56. 80. 275. 676. 9. 33. 37S. 18.3 314 7. 12. 17. 28. 53. 74. 191. 1727. 10. 38. 548. 127.4 321 7. 12. 17. 28. 57. 83. I90. 979. 10. 36. 354. 33.5 322 6. II. 17. 28. 57. 0. 143. 0. 8. 32. t43. II.
6 323 6. 12. 16. 31. 66. 83. 119. 0. 7. 42. 115. Is.7 324 6. 12. 17. 56. s6. 87. 177. 1097. 7. S5. 867. 20.8 331 6. 11. 17. 27. 58. 88. 235. 438. 8. 34. 249. 14.9 332 6. I1. 17. 26. 60. 86. 124. 0. 7. 31. 124. 9.
10 341 7. t2. 17. 31. 57. 74. 176. 632. II. 37. 389. 68.
11 342 7. 12. 17. 28. 60. 86. 201. 736. 9. 37. 236. 22.12 351 7. 12. 17. 29. 58. 86. 150. 1035. 9. 44. 306. 46.13 352 6. 12. 17. 30. s8. 83. 201. 926. 9. 42. 305. 41.14 355 6. 12. 17. 32. 60. 84. 196. 716. 9. 45. 226. 56.15 356 7. 12. 17. 28. 61. 89. 192. 0. 10. 40. t92. 29.
16 361 6. 12. 16. 29. 59. B0. 99. 335. 7. 34. 217. 11.17 362 7. 12. 16. 32. 57. se. I90. 665. 9. 42. 238. 86.1l 363 6. 12. 17. 27. 60. Sa. 158. 978. 8. 31. 410. 13.19 364 6. II. I7. 25. 58. 64. 142. 0. 7. 31. 142. 9.20 369 7. 12. 17. 32. 57. 0. 427. 0. 9. 38. 427. 16.
21 381 6. II. 17. 29. 58. 86. 183. 718. 7. 36. 237. IS.22 382 7. 12. 17. 30. 59. 88. 229. 1114. 9. 38. 339. 39.23 383 6. 12. is. 33. 61. 89. 230. 1004. 9. S1. 368. 101.24 384 6. 12. 17. '28. 60. 89. 210. 849. S. 40. 345. 36.25 385 6. II. 17. 29. 60. 0. 103. 0. 9. 33. 103. 17.
26 390 6. I1. 17. 29. 67. 85. 166. 614. 8. 36. 314. 14.27-----TOTAL---------6.--------------17.------28.------58.------83.-__-------1.-----1083.__-------6-_-_-37.------360.--------20.---
27 TOTAL 6. I1. 17. 28. 58. 83. 19t . tO93. S. 37. 360. 20.-------------------------------------------------------------------- __-------__-----------------------_----------------------------

-115-
OATE 04/13/79 TIME 6 39PMTable 9A. INDONESIA SURVEY OF SML+MED+LGE ESTABLISHMENTS. 1974
NIAN-DAYS WORKED PER PAID EMPLOYEE BY SIZE CLASS
SIZE CLASS BY NUMBER OF PERSONS ENGAGED PER ESTABLISHMENT
CODES 5- 9 10- 14 15- 19 20- 49 50- 74 75- 99 100-499 500 & UP 5- 19 20- 99 100 & UP ALL
1 311+312 203. 220. 231. 228. 228. 237. 233. 227. 209. 229. 229. 221.2 313 202. 245. 257. 220. 206. 222. 141. 204. 230. 217. 169. 203.3 314 119. 122. 124. 138. 161. 167. 238. 281. 122. 151. 269. 250.4 321 203. 221. 237. 266. 272. 2e4. 260. 246. 220. 267. 252. 251.5 322 202. 232. 241. 228. 240. 0. 228. 0. 216. 231. 228. 222.
6 323 255. 293. 286. 257. 258. 286. 236. 0. 267. 260. 236. 257.7 324 196. 251. 248. 270. 280. 250. 238. 215. 211. 269. 216. 226.8 331 189. 213. 221. 207. 221. 236. 205. 231. 201. 214. 208. 206.9 332 229. 263. 280. 251. 230. 200. 250. 0. 243. 244. 250. 244.10 34t 236. 216. 224. 243. 234. 129. 226. 212. 225. 235. 215. 220.
11 342 259. 277. 281. 243. 246. 227. 216. 237. 270. 242. 220. 243.12 351 195. 239. 270. 225. 173. 226. 208. 202. 230. 213. 205. 209.13 352 195. 237. 258. 223. 219. 199. 193. 235. 226. 217. 211. 215.14 355 226. 232. 240. 232. 225. 240. 240. 236. 232. 231. 239. 236.15 356 212. 252. 265. 247. 231. 255. 259. 0. 243. 244. 259. 250.
16 361 186. 250. 233. 233. 298. 231. 239. 282. 206. 244. 273. 232.17 362 251. 192. 230. 250. 209. 254. 211. 250. 234. 232. 222. 224.18 363 167. 213. 242. 247. 246. 224. 258. 246. 195. 246. 249. 220.19 364 172. 188. 197. 245. 250. 276. 276. 0. 179. 249. 276. 195.20 369 182. 188. 285. 234. 245. 0. 258. 0. 208. 238. 258. 229.
21 381 212. 248. 263. 255. 237. 219. 229. 230. 227. 244. 229. 232.22 382 259. 289. 294. 253. 222. 288. 211. 216. 276. 246. 213. 229.23 383 253. 255. 298. 229. 207. 209. 219. 226. 264. 215. 222. 223,24 384 231. 253. 272. 251. 253. 223. 220. 193. 246. 243. 206. 219.25 385 281. 258. 302. 273. 286. 0. 129. 0. 276. 276. 129. 259,
26 390 217. 230. 221. 239. 287. 226. 271. 199. 221. 241. 228. 228.
27 TOTAL 201. 223. 236. 236. 233. 234. 235. 248. 212. 235. 243. 233.
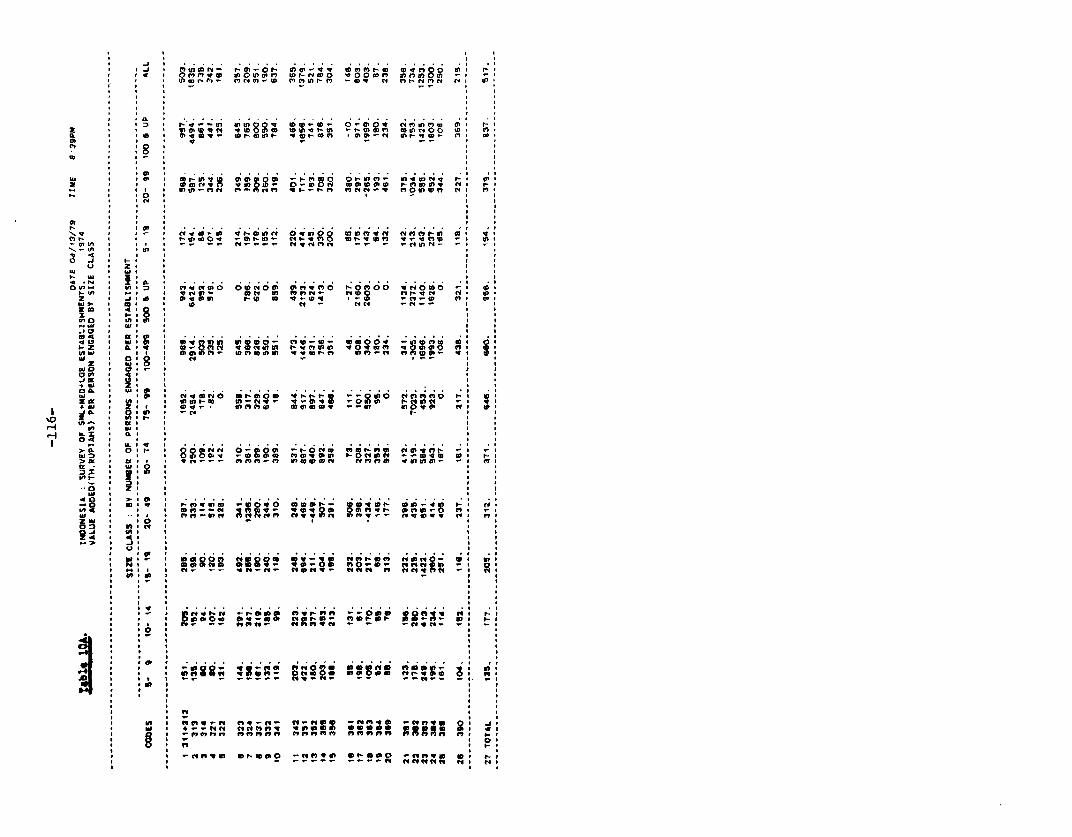
* u t Iumn- t- C -01- Mtf au-n uou'ufr-ur C uVf go d '4 * n five atnu ato -nW 00C C annr)um -j-* u h fle~~~~ r.C,. u'n to ffl 1-fl WWV r Cl fl Nl C I
( u u - - -~~VW op 0%N r- m
a u u u -f I- t c e
ID u p go--Llv ( 90 0r It I Iu I I
w up u u1-a~~I,!?v m memo -unu 01-mfl avmnV u- pua u u u esfyfi~~t m tao- 0eo eMeme MR-nmm fl
V. u uu tm-t i"nnf tiuf in n -v MOCflfluf
u u
M-t u umt f
S u nWuW Wt-w
am u mu inu unO ln l u
'I: ug Lu M" W u u.40 '
&4 Iu u . . .. . ........
: * :
0*. u -. IZ 01 MA ., ,
*w *:l u, u
~~C. O~~C u ut~~ . 1- ... ..... .I
tn. u flu I~~~ u H mu kuu - fftt 9 m" "" m
H LS : ~~~~~~- n m r"0 vr r Lo:!I!

-117-
DATe 04/13/79 TIME 6:39PMTable 1A. INDONESIA : SURVEY OP SML*MEO+LGE eaTABLISHMeNTSI 1974
WiGE5 AND SALARIES PER PAID BMPLOYEE (TH.RUPTAHS) BY SIZE CLASS
SIZE CLASS : BY NUMBER OF PERSONS ENGAGED PER ESTABLISHMENT
CODES 5- 9 tO- 14 1s- 19 20- 49 50- 74 78- 99 100-499 500 & UP 9- 19 20- 99 100 b UP ALL
I 311+312 So. G1. 82. 75. 101. 99. 126. 172. 56. 84. 158. 1o0.2 313 59. 67. 74. 11o. 123. 241. 386. 817. 66. 131. 564. 280.3 314 25. 22. 21. 27. 28. 33. 60. 74. 22. 29. 70. 63.4 321 43. 47. 54. 64. 73. 68. 101. l1s. 48. 66. 138. 100.s 322 60. 71. 81. 99. 92. 0. B6. 0. 66. 97. 86. 78.
6 323 68. 112. 80. 91. 84. 85. 148. 0. go. a8. 148. 99.7 324 79. 123. 121. 126. 97. 72. 177. 376. 91. 119. 366. 229.a 331 72. 78. 83. 113. 141. 141. 199. 21e. 76. 122. 201. 119.9 332 80. 97. 130. 122. 124. 386. 202. 0. 90. 141. 202. 109.10 341 46. 40. 48. 76. 147. 1s. 236. 284. 45. 93. 273. 221.
11 342 106. a8. 98. 129. 139. 215. 16s. 88. 98. 143. 150. i32.12 391 69. 77. 74. 120. 183. 202. 235. 632. 73. 162. 473. 344.13 352 S5. 68. 151. 136. 167. 213. 273. 243. 87. 161. 260. 213.14 358 58. 78. 76. 94. 112. 131. 139. 350. G8. 108. 177. 149.Is 356 63. 71. 86. 108. 130. 141. 106. 0. 73. 121. 106. 108.
16 361 39. a1. 79. 160. 55. 60. 38. 78. 49. 129. 6e. 7717 362 60. 1s. 87. 92. 113. 52. 190. 859. 62. 98. 293. 247.18 363 46. 6e. as. a5. 103. 146. 109. 538. 60. 91. 421. 146.19 364 40. 41. 41. 63. 79. se. 8s. 0. 40. 67. 88. 47.20 369 47. 44. 90. 80. 187. 0. 161. 0. 56. 120. 161. too.
21 381 66. so. 84. 110. 126. 224. 170. 244. 71. 134. 192. 135.22 382 92. 104. 140. 123. 160. 612. 257. I11. 106. 179. 197. 180.23 383 99. 73. 109. 222. 185. 232. 215. 315. 92. 214. 264. 250.24 384 92. 104. 107. 194. 146. 196. 319. 392. 98. t66. 357. 28025 385 90. 68. IIl. 122. 149. 0. 36. 0. 86. 129. 36. 103.
26 390 67. 67. 59. 81. 70. 94. 93. 147. 66. 82. 125. 89
27 TOTAL 55. 63. 75. 82. 97. 114. 140. 172. 60. 91. 158 t16.---------- -- -- --- --- --- -- - -- --- - -- --- -- -- - --- --- -- - -- --- --- -- --- --- --- - -- -- -- - --- --- -- --- --- - -- --

-118-
OATE 04/13/79 TIME 6 39PMTable 12A. IINDONESIA SURVEY OF SML+MED-LGE ESTABLISHMENTS. 1974
Table *12A. WAGES AND SALARIES(RUPIAHS) PER PERSON PER DAY BY SIZE CLASS
SIZE CLASS BY NUMBER OF PERSONS ENGAGED PER ESTABLISHMENT
CODES 5- 9 10- 14 15- 19 20- 49 50- 74 75- 99 100-499 500 & UP 5- 19 20- 99 100 A UP ALL
I 311.312 246. 278. 356. 331. 445. 412. 541. 756. 266. 365. 689. 457.2 3t3 291. 275. 290. 502. 596. 1084. 2525, 4012. 285. 602. 3332 1382.3 314 206. 178. 167. 199. 173. 200. 255 263. 184. 190. 261. 254.4 321 213. 215. 228. 239. 267. 257. 386 672. 219. 249. 547. 400.5 322 296. 305. 335. 434. 363. 0. 375. O. 306. 420. 375. 353.
6 323 266. 384. 280. 353. 327. 297. 629. 0. 298. 338. 629. 387.7 324 402. 466. 486. 468. 347. 289. 742. 1750. 431. 441. 1693. 1013.a 331 381. 366. 376. 545. 636. 597. 971. 934. 376. 571. 966. 579.9 332 351. 370. 463. 467. 539. 1942. 807. 0. 372. 577. 807. 432.
10 341 194. 186. 214. 314. 629. 120. 1044. 1342. 199. 398. 1267. 1005.
11 342 410. 317. 349. 530. 566. 948. 765. 370. 363. 590. 679. 544.t2 351 357. 321. 275. 534. 1055. 895. 1132. 3125. 319. 764. 2310. 1644.13 352 281. 267. 586. 608. 762. 1071. 1413. 1035. 365. 744. 1230. 991.14 355 242. 337. 317. 407. 499. 546. 579. 1483. 293. 468. 741. 631.15 356 296. 282. 324. 438. 565. 553. 410. 0. 302. 496. 410. 420.
I6 361 209. 246. 339. 685. BS5. 260. 146. 267. 236. 526. 244. 333.17 362 241. 60. 380. 370. 539. 203. 904. 2237. 266. 423. 1325. 1100.1S 363 278. 311. 354. 346. 417. 654. 423. 2178. 307. 371. 1693. 662.19 364 231. 216. 209. 256. 318. 202. 320. 0. 225. 268. 320. 239.20 369 259. 234. 316. 342. 762. 0. 622. 0. 270. 506. 622. 436.
21 381 311. 323. 318. 432. 530. 1024. 740. 1061. 315. 551. 838. 585.22 382 356. 361. 477. 486. 722. 2127. 1215. 514. 383. 726. 923. 786.23 383 391. 286. 367. 972. 890. 1109. 983. 1390. 348. 995. l185. 1122.24 384 397. 411 395. 612. 575. 877. 1448. 2031. 400. 682. 1733. 1274.25 385 322. 266. 366. 449. 521. 0. 280. 0. 313. 469. 280. 399.
26 390 310. 292. 269. 338. 242. 415. 343. 739. 298. 342. 545 393.
27 TOTAL 273. 284. 319. 348. 416. 468. 596. 692. 285. 387. 652. 499.---- ----- -------- ----------- --------------- ---------- ------------ --_ _ --------_ _ ---------- ----------- --------- ---------- ---------- --

-119-
DATE 04/13/79 TIME 6~39PMTable 13A. INGONISIA SURVEY OF SML*MEO*LOI ESTABLISHMENTS, 1974
WAORES AND SALARIES AS % OF VALUE A£0010 BY SIZE CLASS
SIZE CLASS;S BY NUMB3ER OF PERSONS ENGAGED PER ESTABLISHMENT
CODES 5- 9 10- 14 Is- 19 20- 49 50- 74 75- 99 100-499 500 & UP 5- 19 20- 99 100 & UP ALL
I 311+312 23. 25. 26. 19. 25. S. 13. la. 24. 14. 1l; 17.2 313 31. 38. 34. 32. 49. 10. 12. 13. 34. 22. 13. 14.3 314 22. 20. 21. 23. 25. 18. 12. 7. 21. 22. 6. 9.4 321 41. 38. 41. 12. 37. -82. 30. 32. 40. 19. 31. 28.5 322 36. 32. 38. 41. 64. 0. 68. 0. 36. 45. 68. 42.
6 323 36. 33. 1s. 26. 27. Is. 23. 0. 30. 25. 23. 25.7 324 40. 30. 43. -10. 24. 23. 48. 48. 39. -12. 48. 103.8 331 34. 31. 40. 39. 35. 43. 24. 35. 34. 39. 25. 31.9 332 45. 48. 48. 48. 64. 61. 37. 0. 46. 92. 37. 45.
to 341 30. 37. 38. 24. 37. 63. 43. 33. 35. 28. 35. 34.
II 342 43. 38. 37. 51. 26. 29. 35. 20. 39. 35. 32. 35.12 351 13. 1a. 10. 25. 20. 22. 16. 30. 14. 22. 25. 25.13 352 23. I6. 67. -30. 26. 24. 33. 39. 30. g8. 35. 40.14 355 22. 16. 1a. is. 13. Is. 18. 25. la. la. 20. 19.Is 356 26. 29. 40. 36. 50. 29. 30. 0. 32. 37. 30. 33.
t6 361 46. 42. 31. 31. 73. 54. 69. -262. 41. 33. -680. 44.17 362 24. 20. 38. 22. 53. St. 37. 28. 29. 32. 30. 30.1a 363 35. 34. 36. -19. 31. 26. 32. 21. 35. -33. 21. 33.19 364 47. 93. 53. 41. 22. 58. 49. 0. 49. 33. 49. 4A.20 369 44. s0. 27. 44. 20. 0. 69. 0. 36. 26. 69. 39.
21 381 40. 44. 34. 36. 30. 39. s0. 21. 40. 35. 33. 35.22 382 41. 36. 57. 28. 31. 9. -84. 5. 42. 17. 26. 24.23 363 31. Is. 7. 34. 33. 51. 13. 28. 14. 36. 18. 20.24 384 36. 40. 26. 36. Is. 21. 16. 24. 35. 25. 20. 21.25 385 45. 54. 40. 29. 89. 0. 33. 0. 45. 36. 33. 38.
26 390 49. 37. 43. 33. 38. 42. 21. 46. 44. 35. 34. 37.
27 TOTAL 29. 31. 33. 25. 26. la. 21. la. 31. 23. 19. 21.

-120-DATE 04/13/79 TIME 6:39PM
Table 14A. INDONESIA .SURVEY OF SML*MED+LGE ESTABLISHMENTS. 1974NUMBER OF ESTABLISHMENTS AND THEIR PERCENT OISTRIBUTION BY SIZE CLASS
SIZE CLASS * BY NUM8ER OF PERSONS ENGAGED PER ESTABLISHMENT
CODES 5- 9 10- 14 15- 19 20- 49 50- 74 75- 99 100-499 500 & UP 5- 19 20- 99 100 & UP ALL
1 311312 80.86 8.30 3.54 5.19 0.71 0.36 0.74 0.31 92.70 6.26 1 04 2212i.2 313 57.92 18.66 9 76 9.76 1 52 0.65 1.30 0 43 86.33 11.93 1.74. 461.3 314 18.64 9.10 5.25 32.55 10.59 4.72 14.70 4.46 32.98 47.86 19.16 1143.4 321 37.27 18.34 12.67 21.22 3.92 1.95 3.67 0.97 68.28 27.09 4.64 6424.5 322 70.50 12.24 6.34 8.70 1.47 0.00 0.74 0.00 89.09 10.18 0.74 678.
6 323 68.75 11.36 4.55 9.09 2.84 0.57 2.84 0.00 84.66 1.2.50 2.84 176.7 324 78.13 7.81 5.73 6.25 0.52 0.52 0.26 0.78 91.67 7.29 1.04 384.8 331 67.38 14.61 7.11 8.09 1.08 0.51 1.14 0.09 89.10 9.68 1.22 3348.9 332 79.13 11.90 4 84 3.33 0.36 0.09 0.36 0.00 95.87 3.77 0.36 2252.
10 341 24.37 14.29 10.92 30.25 6.72 0.84 6.72 5.88 49.58 37.82 t2.61 119.
II 342 47.51 18.43 10.46 15.94 3.49 1.10 2.89 0.20 76.39 20.52 3.09 1004.12 351 35.20 17.32 7.82 19.55 5.59 5.03 7.82 1.68 60.34 30.17 9.50 179.13 352 42.24 14.66 9.43 17.27 5.66 2.61 6.97 1.16 66.33 25.54 8.13 689.14 355 29.60 9.98 7.17 23.99 9.53 4.15 14.69 0.90 46.75 37.67 15.58 892.Is 356 36.47 18.82 11.76 19.76 4 94 2.35 5.88 0.00 67.06 27.06 5.88 425.
16 361 76.61 10.09 3.67 7.34 0.92 0.46 0.46 0.46 90.37 8.72 0.92 218.17 362 19.18 4.11 5.48 28.77 13.70 1.37 24.66 2.74 28.77 43.84 27.40 73.18 363 63.23 17.64 8.15 9.30 0.86 0.19 0.43 0.19 89.03 10.35 0.62 2097.19 364 78.85 11.66 5.04 3.60 0.57 0.13 0.15 0.00 95.55 4.30 0.15 3886.20 369 55.65 22.61 10.43 7.83 2.61 0.00 0.87 0.00 88.70 10.43 0.87 115.
21 381 74.52 9.51 5.33 6.08 1.45 0.62 2.23 0.25 89.37 8.15 2.48 2418.22 382 46.46 16.81 6.19 17.70 4.87 0.88 6.19 0.88 69.47 23.45 7.08 226.23 383 29.92 12.60 4.72 16.84 7.87 6.30 18.11 3.94 47.24 30.71 22.05 12724 384 55.23 13.61 7.50 13.02 1.78 2.37 5.13 1.38 76.33 17.16 6.S1 507.25 385 39.62 22.64 9.43 22.64 3.77 0.00 1.89 0.00 71.70 26.42 1.89 53.
26 390 68.97 15.86 6.48 6.21 0.41 0.69 0.97 0.41 . 9i.31 7.31 1.38 725.
27 TOTAL 67.69 11.73 6.04 9.33 1.81 0.84 2.08 0.49 85.45 11.99 2.56 50767.
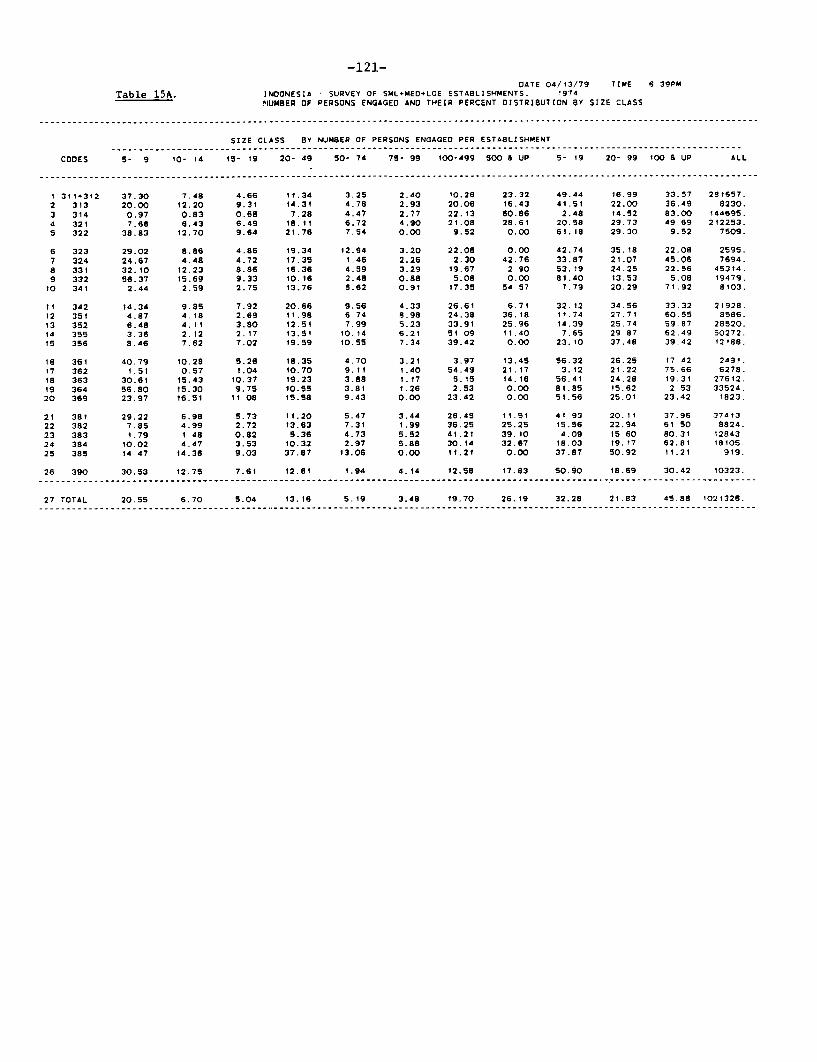
-121-DATE 04/13/79 TIME 6 39PM
Table 15A. INDONESIA SURVEY OF SML+MED+LGE ESTABLISHMENTS. 1974NUMBER OF PERSONS ENGAGED AND THEIR PERCENT DISTRIBUTION BY SIZE CLASS
SIZE CLASS BY NUMBER OF PERSDNS ENGAGED PER ESTASLISHMENT
CODES 5- 9 10- 14 15- 19 20- 49 50- 74 75- 99 100-499 500 & UP S- 19 20- 99 100 & UP ALL
I 31i+312 37.30 7.48 4.66 11.34 3.25 2.40 10.26 23.32 49.44 16.99 33.57 281657.
2 313 20.00 12.20 9.31 14.31 4.76 2.93 20.06 16.43 41.51 22.00 36.49 8230.
3 314 0.97 0.83 0.68 7.28 4.47 2.77 22.13 60.86 2.48 14.52 83.00 144695.
4 321 7.66 6.43 6.49 18.11 6.72 4.90 21.08 28.61 20.58 29.73 49 69 212253.5 322 38.83 12.70 9.64 21.76 7.54 0.00 9.52 0.00 61.18 29.30 9.52 7509.
6 323 29.02 8.86 4.86 19.34 12.64 3.20 22.08 0.00 42.74 35.18 22.08 2595.
7 324 24.67 4.48 4.72 17.35 1.46 2.26 2.30 42.76 33.87 21.07 45.06 7694.8 331 32.10 12.23 8.86 16.36 4.59 3.29 19.67 2 90 53.19 24.25 22.56 45314.
9 332 56.37 15.69 9.33 10.16 2.48 0.88 5.08 0.00 81.40 13.53 5.08 19479.10 341 2.44 2.59 2.75 13.76 5.62 0.91 17.35 54 57 7.79 20.29 71.92 8103.
1I 342 14.34 9.85 7.92 20.66 9.56 4.33 26.61 6.71 32.12 34.56 33.32 21928.12 351 4.87 4.18 2.69 11.98 6 74 8.98 24.38 36.18 11.74 27.71 60.55 8586.13 352 6.48 4.11 3.80 12.51 7.99 5.23 33.91 25.96 14.39 25.74 59.87 28520.14 355 3.36 2.12 2.17 13.51 10.14 6.21 51 09 11.40 7.65 29 87 62.49 50272.15 356 8.46 7.62 7.02 19.59 10.55 7.34 39.42 0.00 23.10 37.48 39.42 12188.
16 361 40.79 10.28 5.26 18.35 4.70 3.21 3.97 13.45 56.32 26.25 17 42 2491.17 362 1.51 0.57 t.04 10.70 9.11 1.40 54.49 21.17 3.12 21.22 75.66 6278.
18 363 30.61 15.43 10.37 19.23 3.88 1.17 5.15 14.16 56.41 24.28 19.31 27612.
19 364 56.80 15.30 9.75 10.55 3.81 1.26 2.53 0.00 8t.85 15.62 2 53 33524.20 369 23.97 16.51 11 08 15.58 9.43 0.00 23.42 0.00 51.56 25.01 23.42 1823.
21 381 29.22 6.98 5.73 11.20 5.47 3.44 26.45 11.51 41 93 20.11 37.96 37413
22 382 7.85 4.99 2.72 13.63 7.31 1.99 36.25 25.25 15.56 22.94 61 50 8824.
23 383 1.79 1.48 0.82 5.36 4.73 5.52 41.21 39.10 4.09 i5 60 80.31 12843.24 384 10.02 4.47 3.53 10.32 2.97 5.88 30.14 32.67 18.03 ¶9.17 62.81 18105.
25 385 14 47 14.36 9.03 37.87 13.06 0.00 11.21 0.00 37.87 50.92 11.21 919.
26 390 30.53 12.75 7.6t 12.61 1.94 4.14 12.58 17.83 50.90 ¶8.69 30.42 10323.
27 TOTAL 20.55 6.70 5.04 13.16 5.19 3.48 19.70 26.19 32.28 21.83 45.88 1021326.-- - - - - - -- - - - - - - -- - - - - - - I________ __ __ __ ____ -----------------------------------------------------------------------------------------

-122-
DATE 04/13/79 TIME 8:39PMTable 16A. INDONESIA : SURVEY OF SML+MED+LOE ESTABLISHMENTS. 1974
GROSS OUTPUT (HtL.RUPIAHS) ANO THEIR PERCENT DISTRIBUTION BY SIZE CLASS
SIZE CLASS BY NUMBER OF PERSONS ENGAGED PER ESTABLISHMENT
CODES 5- 9 10- 14 15- 19 20- 49 50- 74 75- 99 100-499 500 & UP 5- 19 20- 99 100 8 UP ALL
1 311+312 12.69 4.57 3.96 l1.10 4.66 6 76 23.71 32.55 21.22 22.52 56.26 374298.2 313 2.65 1.54 1.85 3.60 0.84 4.08 36.90 48.55 6.04 8.51 85.45 22240.3 314 0.15 0.17 0.17 1.62 1.22 0.77 15.25 80.65 0.49 3.61 95.90 236476.4 321 1.82 2.13 2.49 14.19 10.54 3.03 21.89 44.11 6.43 27.77 85.80 237334.5 322 33.87 16.12 9.87 25.84 7.52 0.00 6.78 0.00 59.86 33.36 6.78 3609.
6 323 8.79 6.95 3.66 27.61 11.23 2.11 39.65 0.00 19.41 40.95 39.65 3816.7 324 8.22 2.68 2.46 lt.47 1.51 1.67 2.34 69.66 13.35 14.65 72.00 8699.8 331 IS.87 7.77 8.44 13.37 5.86 3.84 43.77 4.48 28.88 22.86 48.25 37630.9 332 38.66 15.05 13.10 12.44 3.46 3.11 t4.17 0.00 66.82 19.01 14.17 7591.10 341 0.34 0.27 0.38 4.12 2.48 0.02 14.64 77.74 0.99 6.62 92.38 18217.
1t 342 7.49 6.37 7.62 19.61 11.71 8.25 32.82 6.12 21.48 39.57 38.95 15605.12 351 1.41 1.54 1.17 4.94 3.09 9.54 26.37 51.93 4.13 17.57 78.30 23081.13 352 1.94 2.07 1.67 9.51 6.63 6.56 38.39 33.24 5.67 22.70 71.63 51350.14 355 0.64 0.83 0.84 7.03 9.00 4.58 56.65 20.43 2.31 20.61 77.08 147415.1s 356 4.58 S.50 5.15 23.81 10.21 10.68 40.08 0.00 15.23 44.70 40.08 13476.
16 361 13.43 9.71 5.47 56.51 1.56 2.59 0.73 10.00 28.60 60.66 10.73 794.17 362 0.46 0.05 0.24 5.55 2.10 0.18 33.76 57.67 0.75 7.82 91.43 9993.18 363 7.93 6.61 5.97 10.32 2.23 2.58 3.33 81.05 20.S0 15.12 64.38 30030.19 364 40.70 12.08 8.63 18.76 12.98 1.67 5.17 0.00 61.41 33.41 5.17 4552.20 369 10.48 5.96 17.25 14.81 29.23 0.00 22.28 0.00 33.69 44.03 22.28 715.
21 38t 7.09 2.46 2.71 8.24 7.22 8.14 38.46 25.69 12.26 23.60 64.14 45916.22 382 1.58 1.39 0.58 6.98 7.52 8.14 26.39 47.42 3.55 22.65 73.80 15898.23 383 0.45 0.45 0.72 3.28 2.13 2.85 51.89 38.23 1.62 8.26 90.12 39821.24 384 0.92 0.46 0.51 3.06 2.63 2.31 28.93 61.18 1.89 8.00 90.11 80478.25 385 8.65 6.88 8.71 57.19 15.39 0.00 3.t8 0.00 24.24 72.58 3.18 582.
26 390 14.82 8.64 4.91 15.99 2.20 7.26 24.89 21.30 28.37 25.44 46.19 4752.
27 TOTAL 5.34 2.58 2.36 8.75 5.46 4.46 29.45 42.60 10.28 18.67 71.05 1453225.
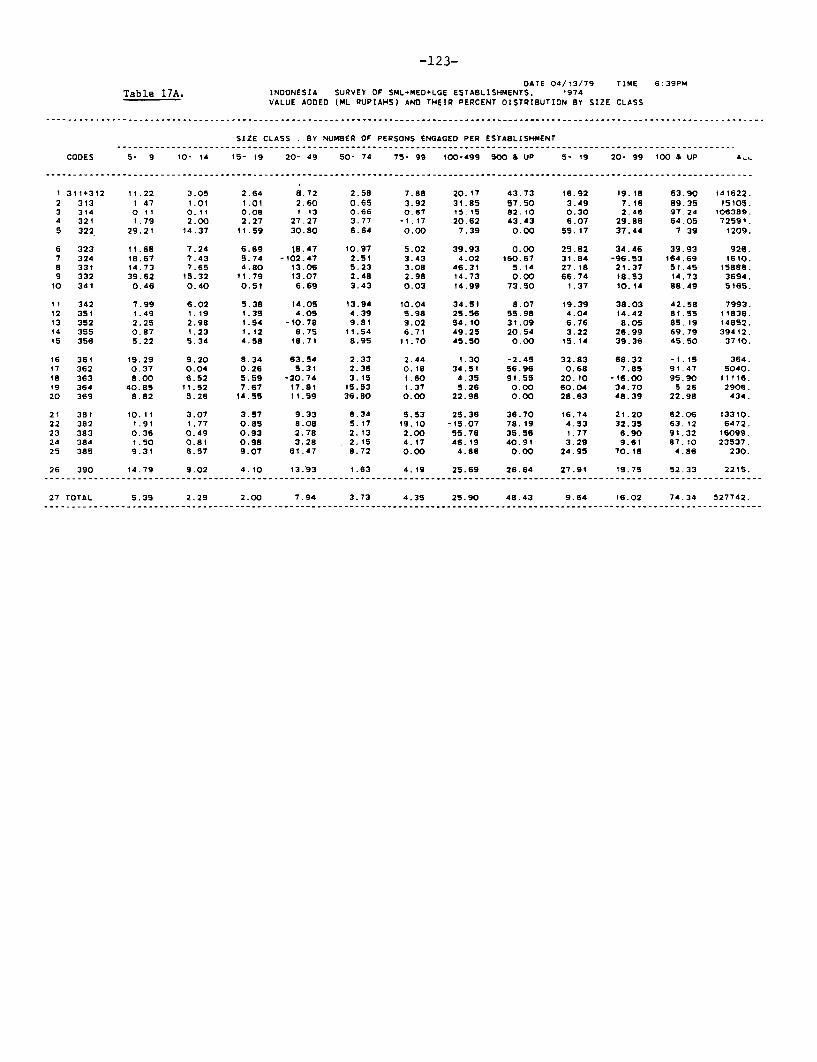
-123-
DATE 04/13/79 TIME 6:39PMTable 17A. INDONESIA SURVEY OF SML.MED+LGE ESTABLISHMENTS. 1974
VALUE AODED (ML RUPIAHS) AND THEIR PERCENT DISTRIBUTION BY SIZE CLASS
SIZE CLASS . BY NUMBER OF PERSONS ENGAGED PER ESTASLISHMENT
CODES 5- 9 10- 14 15- 19 20- 49 50- 74 75- 99 100-499 5W0 & UP 5- 19 20- 99 1OO & UP A-
I 311+312 11.22 3.05 2.64 8.72 2.58 7.88 20.17 43.73 16.92 19.18 63.90 i41622.2 313 I 47 1.01 1.01 2.60 0.65 3.92 31.85 57.50 3.49 7.16 89.35 15105.3 314 0 11 0.11 0.08 I 13 0.66 0.67 15.15 82.10 0.30 2.46 97.24 106389.4 321 1.79 2.00 2.27 27.27 3.77 -1.17 20.62 43.43 6.07 29.88 64.05 72591.5 322 29.21 14.37 11.59 30.80 6.64 0.00 7.39 0.00 55.17 37.44 7 39 1209.
6 323 11.68 7.24 6.69 18.47 10.97 5.02 39.93 0.00 25.62 34.46 39.93 926.7 324 18.67 7.43 5.74 -102.47 2.51 3.43 4.02 t60.67 31.84 -96.53 164.69 1610.8 331 14.73 7.65 4.80 13.06 5.23 3.08 46.31 5.14 27.18 21.37 51.45 IS886.9 332 39.62 15.32 11.79 13.07 2.48 2.98 14.73 0.00 66.74 18.53 14.73 3694.
10 341 0.46 0.40 0.51 6.69 3.43 0.03 14.99 73.50 1.37 10.14 88.49 5165.
11 342 7.99 6.02 5.38 14.05 13.94 10.04 34.51 8.07 i9.39 38.03 42.58 7993.12 351 1.49 1.19 1.35 4.05 4.39 5.98 25.56 55.98 4.04 14.42 81.55 11836.13 352 2.25 2.98 1.54 -10.78 9.81 9.02 54.10 31.09 6.76 8.05 85.19 14852.14 355 0.87 1.23 1.12 8.75 11.54 6.71 49.25 20.54 3.22 26.99 69.79 39412.15 356 5.22 5.34 4.58 18.71 8.95 11.70 45.50 0.00 15.14 39.36 45.50 3710.
16 361 15.29 9.20 8.34 63.54 2.33 2.44 1.30 -2.45 32.83 68.32 -1.15 364.17 362 0.37 0.04 0.26 5.31 2.36 0.18 34.51 56.96 0.68 7.85 91.47 5040.18 363 8.00 6.52 5.59 -20.74 3.15 1.60 4.35 91.55 20.10 -16.00 95.90 11116.19 364 40.85 11.52 7.67 17.8t 15.53 1.37 5.26 0.00 80.04 34.70 5 26 2906.20 369 8.82 5.26 14.55 11.59 36.80 0.00 22.98 0.00 28.63 48.39 22.98 434.
21 381 10.11 3.07 3.57 9.33 6.34 5.53 25.36 36.70 16.74 21.20 62.06 13310.22 382 1.91 1.77 0.85 8.08 5.17 19.10 -15.07 78.19 4.53 32.35 63.12 6472.23 383 0.36 0.49 0.93 2.78 2.13 2.00 55.76 35.56 1.77 6.90 91.32 16099.24 384 1.50 0.81 0.98 3.28 . 2.15 4.17 46.19 40.91 3.29 9.61 87.10 23537.25 385 9.31 6.57 9.07 61.47 8.72 0.00 4.86 0.00 24.95 70.18 4.86 230.
26 390 14.79 9.02 4.10 13.93 1.63 4.19 25.69 26.64 27.91 19.75 52.33 2215.
27 TOTAL 5.35 2.29 2.00 7.94 3.73 4.35 25.90 48.43 9.64 16.02 74.34 527742.--- ------ --------- ---------- ------------ -- - -------- -----------_ _ -- ----------_ _ --- ---_ --------- ---------- -------- --------- -------- --

-124-
DATE 04/13/79 TIME 6 38PMTable 18A. INDONESIA SURVEY OF SML+MED+LGE ESTABLISHMENTS. 1974
NUMBER OF ESTABLISHMENTS AS PERCENT OF TOTAL BY SIZE CLASS
SIZE CLASS BY NUMBER OF PERSONS ENGAGED PER ESTABLISHMENT
CODES 5- 9 10- 14 15- 19 2b- 49 50- 74 75- 99 100-499 500 A UP 5- 19 20- 99 100 & UP ALL
I 311+312 52.05 30.84 25.58 24.23 16.94 18.74 15.46 27.53 47.27 22.74 17.76 43 572 313 0.78 1.44 1.47 0.95 0.76 0.70 0.57 0.81 0.92 0.90 0.61 0.913 314 0.62 1.75 1.96 7.85 13.14 12.65 15.94 20.65 0.87 8.99 16.83 2.254 321 6.97 19.79 26.56 28.77 27.36 29.27 22.39 25.10 10.11 28.59 22.91 12.655 322 t 39 1.39 1.40 1 25 1.09 0.00 0.47 0.00 1.39 1.13 0.38 1.34
6 323 0 35 0.34 0.26 0.34 0.54 0.23 0.47 0.00 0 34 0.36 0 38 0.357 324 0.87 0.50 0.72 .0.51 0.22 0.47 0.09 1.21 0.81 0.46 0.31 0.768 331 6 57 8.21 7.77 5.72 3.91 3.98 3.61 1 21 6.88 5.32 3.15 6.599 332 5.19 4 50 3.56 1.58 0.87 0.47 0.76 0.00 4.98 1 40 0.61 4.4410 341 0.08 0.29 0.42 0.76 0.87 0.23 0.76 2.83 0.14 0.74 1 15 0.23
i1 342 1.39 3.11 3.43 3.38 3.80 2.58 2.75 0.81 1.77 3.39 2.38 1 9812 351 0 18 0 52 0.46 0.74 1.09 2.11 1.33 1.21 0.25 0.89 1 31 0 3513 352 0.85 1.70 2.12 2.51 4.23 4.22 4.55 3 24 1.05 2.89 4.30 1 3614 355 0.77 1.50 2.09 4.52 9.23 8.67 12.43 3.24 0.96 5.52 10.68 1.76is 356 0.45 1.34 1.63 1.77 2.28 2.34 2.37 0.00 0.66 1.89 1.92 0 84
16 361 0.49 0.37 0.26 0.34 0.22 0.23 0.09 0.40 0.45 0 31 0.15 0.4317 362 0.04 0.05 0.13 0.44 1.09 0.23 1.71 0.81 0.05 0.53 1.54 0.1418 363 3.86 6.22 5.58 4.12 1.95 0.94 0.85 1.62 4.30 3.57 1.00 4.1319 364 8.92 7.61 6.39 2.96 2.39 1.17 0.57 0.00 8.56 2.74 0.46 7.6520 369 0.19 0.44 0.39 0.19 0.33 0.00 0.09 0.00 0.24 0.20 0.08 0.23
21 381 5.24 3.86 4.21 3.10 3.80 3.51 5.12 2.43 4.98 3.24 4.61 4.7622 382 0.31 0.64 0.46 0.84 1.19 0.47 1.33 0.81 0.36 0.87 1.23 0 4S23 383 0.11 0.27 0.20 0.44 1.09 1.87 2.18 2.02 0.14 0.64 2.15 0.2524 384 0.81 1.16 1.24 1.39 0.98 2.81 2.47 2.83 0.89 1 43 2.54 1.0025 38S 0.06 0.20 0.16 0.25 0 22 0.00 0.09 0.00 0.09 0.23 0.08 0 10
26 390 1.46 1.93 1.53 0.95 0.33 1.17 0.66 1.21 1.53 0.87 0 77 1.43
27 TOTAL 34363. 5953. 3065. 4737. 921. 427. 1054. 247. 43381. 6085. 1301. 50767.
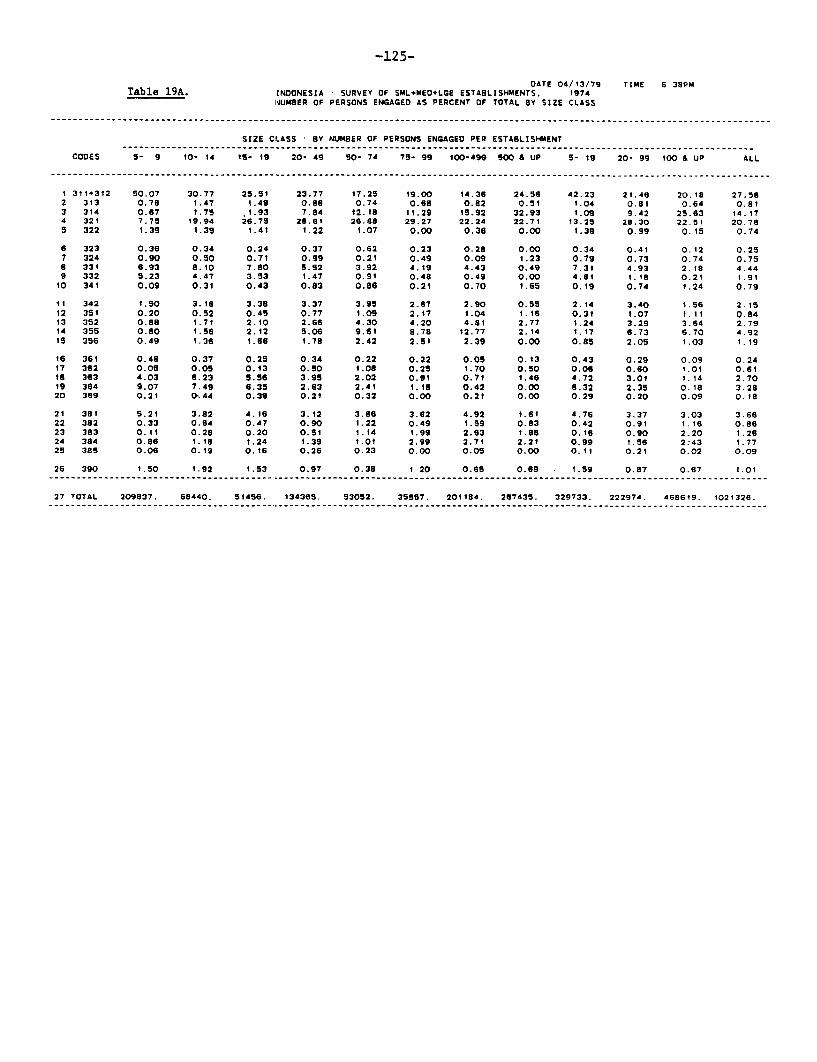
-125-
DATE 04/13/79 TIME 6 38PMTable 19A. INDONESIA * SURVEY OF SML+MED+LGE ESTABLISHMENTS. 1974
NUMBER OF PERSONS ENGAGED AS PERCENT OF TOTAL BY SIZE CLASS
SIZE CLASS BY NUMBER OF PERSONS ENGAGED PER ESTASLISHMENT
CODES 5- 9 1O- 14 t5- 19 20- 49 50- 74 75- 99 100-499 SOO UP 5- 19 20- 99 100 & UP ALL
1 311+312 50.07 30.77 25.51 23.77 17.25 19.00 14.36 24.56 42.23 21.46 20.18 27.582 313 0.78 1.47 1.49 0.88 0.74 0.68 0.82 0.51 1.04 0.81 0.64 0.813 314 0.67 1.75 1.93 7.84 12.18 11.29 15.92 32.93 1.09 9.42 25.63 14.174 321 7.75 19.94 26.75 28.61 26.88 29.27 22.24 22.71 13.25 28.30 22.51 20.785 322 1.39 1.39 1.41 1.22 1.07 0.00 0.36 0.00 1.39 0.99 0.15 0.74
6 323 0.36 0.34 0.24 0.37 0.62 0.23 0.28 0.00 0.34 0.41 0.12 0.257 324 0.90 0.50 0.71 0.99 0.21 0.49 0.09 1.23 0.79 0.73 0.74 0.758 331 6.93 8.10 7.80 5.52 3.92 4.19 4.43 0.49 7.31 4.93 2.18 4.449 332 5.23 4.47 3.53 1.47 0.91 0.48 0.49 0.00 4.81 1.18 0.21 1.9110 341 0.09 0.31 0.43 0.83 0.86 0.21 0.70 1.65 0.19 0.74 1.24 0.79
II 342 1.50 3.16 3.38 3.37 3.95 2.67 2.90 0.55 2.14 3.40 1.56 2.1512 351 0.20 0.52 0.45 0.77 1.09 2.17 1.04 1.16 0.31 1.07 1.11 0.8413 352 0.88 1.71 2.10 2.66 4.30 4.20 4.81 2.77 1.24 3.29 3.64 2.7914 355 0.80 1.56 2.12 5.06 9.61 8.78 12.77 2.14 1.17 6.73 6.70 4.921S 356 0.49 1.36 1.66 1.78 2.42 2.51 2.39 0.00 0.85 2.05 1.03 1.19
Is 361 0.48 0.37 0.25 0.34 0.22 0.22 0.05 0.13 0.43 0.29 0.09 0.2417 362 0.05 0.05 0.13 0.50 1.08 0.25 1.70 0.50 0.06 0.60 1.01 0.61to 363 4.03 6.23 5.56 3.95 2.02 0.91 0.71 1.46 4.72 3.01 1.14 2.7019 364 9.07 7.49 6.35 2.63 2.41 1.18 0.42 0.00 8.32 2.35 0.18 3.2820 369 0.21 0.44 0.39 0.21 0.32 0.00 0.21 0.00 0.29 0.20 0.09 0.18
21 381 5.21 3.82 4.16 3.12 3.86 3.62 4.92 1.61 4.76 3.37 3.03 3.6622 382 0.33 0.64 0.47 0.90 1.22 0.49 1.59 0.83 0.42 0.91 1.16 0.8623 383 0.11 0.28 0.20 0.51 1.14 1.99 2.63 1.88 0.16 0.90 2.20 1.2624 384 0.86 1.18 1.24 1.39 1.01 2.99 2.71 2.21 0.99 1.56 2:43 1.7725 385 0.06 0.19 0.16 0.26 0.23 0.00 O.O0 0.00 0.11 0.21 0.02 0.09
26 390 1.50 1.92 1.53 0.97 0.38 1 20 0.65 0.69 * 1.59 0.87 0.67 1.0127---TOTAL_--2098---7----8-4--0---51456--.___3436__.__53052.___35557.___2011__4.__267435.___329733.___222974.___4___6_19____0213__6.
27 TOTAL 209837. 684A0. Si456. 134365. 53052. 35557. 201184. 287435. 329733. 222974. 468619. 1021326.------ ------- -- ------ ------------ -- ------I- -- ------------ ----------- ------------- --------------- ------_______________________________________________- --- --------- -------- ------- -- -............................ ____________
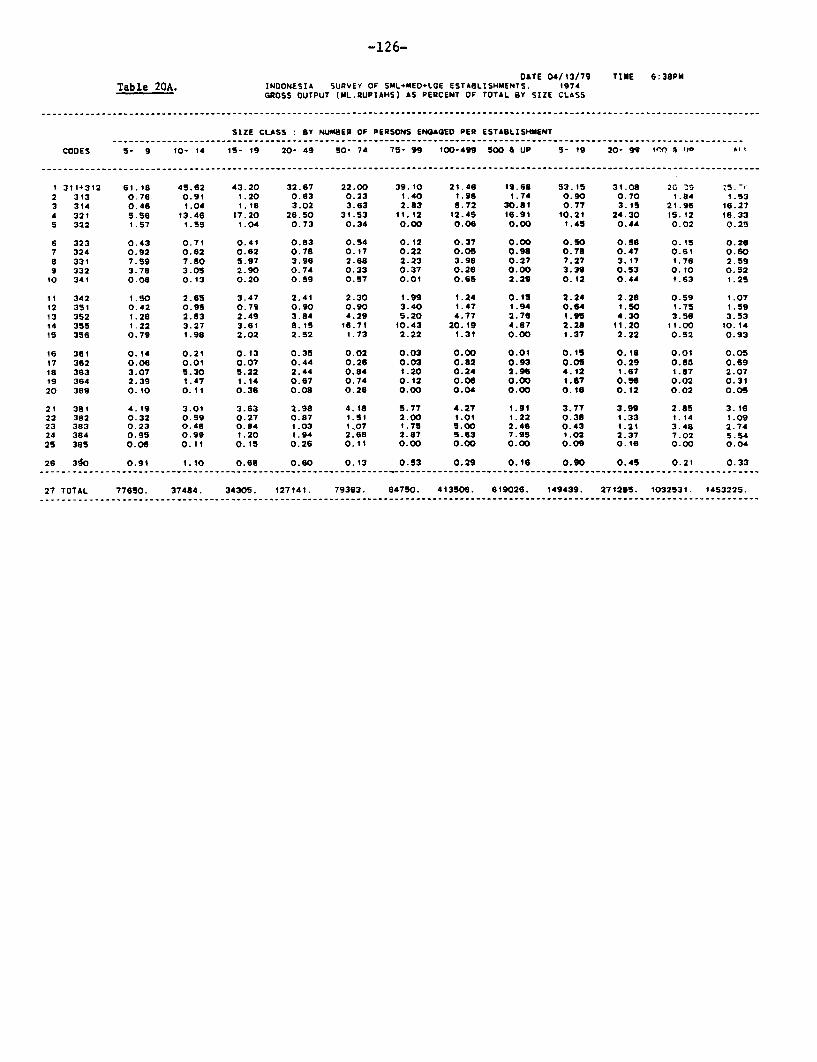
-126-
DATE 04/13/79 TIME 6:38PMTable 20A. INDONESIA SURVEY OF SML+MED+LGE ESTA8LISHMENTS. 1974
GROSS OUTPUT (MIL.RUPIAHS) AS PERCENT OF TOTAL BY SIZE CLASS
SIZE CLASS: BY NUMBER OF PERSONS ENGAGED PER ESTABLISHMENT
CODES S- 9 1O- 14 15- 19 20- 49 50- 74 75- 99 100-499 500 & UP 5- 19 20- 99 I, S A
I 3114312 61.18 45.62 43.20 32.67 22.00 39.10 21.46 19.68 53.15 31.08 20 0 .57-2 313 0.76 0.91 1.20 0.63 0.23 1.40 1.98 1.74 0.90 0.70 1.84 1.533 314 0.46 t.04 i.18 3.02 3.63 2.83 8.72 30.81 0.77 3.15 21.96 18.274 321 5.56 13.46 17.20 26.50 31.53 11.12 12.45 16.91 10.21 24.30 15.12 16.335 322 1.57 1.55 1.04 0.73 0.34 0.00 0.06 0.00 i.45 0.44 0.02 0.25
6 323 0.43 0.71 0.41 0.83 0.54 0.12 0.37 0.00 0.50 0.58 0.15 0.267 324 0.92 0.62 0.62 0.78 0.17 0.22 0.05 0.98 0.78 0.47 0.61 0.608 331 7.59 7.80 5.97 3.96 2.68 2.23 3.98 0.27 7.27 3.17 1.76 2.599 332 3.78 3.05 2.90 0.74 0.33 0.37 0.26 0.00 3.39 0.53 O.t0 0.52
10 341 0.08 0.13 0.20 0.59 0.57 0.01 0.65 2.29 0.12 0.44 1.63 1.25
11 342 1.S0 2.65 3.47 2.41 2.30 1.99 1.24 0.15 2.24 2.28 0.59 t.0712 351 0.42 0.95 0.79 0.90 0.90 3.40 1.47 1.94 0.64 1.50 1.75 1.5913 352 t.28 2.83 2.49 3.84 4.29 5.20 4.77 2.78 1.95 4.30 3.56 3.5314 355 1.22 3.27 3.61 8.t5 16.71 10.43 20.19 4.87 2.28 11.20 11.00 10.1415 356 0.79 1.98 2.02 2.52 1.73 2.22 1.31 0.00 1.37 2.22 0.52 0.93
16 361 0.14 0.21 O.13 0.35 0.02 0.03 0.00 0.01 0.15 0.18 0.01 0.0517 362 0.06 0.01 0.07 0.44 0.26 0.02 0.82 0.93 0.05 0.29 0.88 0.69Is 363 3.07 5.30 5.22 2.44 0.84 t.20 0.24 2.96 4.12 1.67 1.87 2.0719 364 2.39 1.47 1.14 0.67 0.74 0.12 0.06 0.00 1.87 0.56 0.02 0.3120 369 0.10 0.11 0.36 0.08 0.26 0.00 0.04 0.00 0.16 0.12 0.02 0.05
21 381 4.19 3.01 3.63 2.98 4.18 5.77 4.27 1.91 3.77 3.99 2.85 3.1622 382 0.32 0.59 0.27 0.87 1.51 2.00 1.01 1.22 0.38 1.33 t.14 1.0923 383 0.23 0.48 0.84 1.03 107 1.75 5.00 2.46 0.43 1.21 3.48 2.7424 384 0.95 0.99 1.20 1.94 2.66 2.87 5.63 7.95 1.02 2.37 7.02 5.5425 385 0.06 0.t1 O.15 0.26 0.11 0.00 0.00 0.00 0.09 0.16 0.00 0.04
26 390 0.91 1.10 0.68 0.60 0.13 0.53 0.29 0.16 0.90 0.45 0.21 0.3327--TOTA----77650.---37484.----34-05.---127141.---79363.---64750---_4--350---__619026.-----4-43-----2712--5.--10--2531.---145322_--.
27 TOTAL 77650. 37484. 34305. 127t41. 79363. 64750. 413!506. 619026. 149439. 271295. 1032531. 1453225.-- --- ---- --- - ------- -_ -- ---- --- -- -------- -_ - -- ---- -- --- --- -_ _ --- --- -- --- --- --_ _ ---- --- -------_ --- ---- ------ ---- -- -- --_ -- ---- ------- -

-127-
DATE 04/13/79 TIME 6 38PMTable 21A. INDONESIA .SURVEY OF SML+MED+LGE ESTABLISHMENTS. 1974
VALUE ADDED (ML.RUPIAHS) AS PERCENT OF TOTAL BY SIZE CLASS
SIZE CLASS : BY NUMBER OF PERSONS ENGAGED PER ESTABLISHMENT
CODES 5- 9 10- 14 1s- 19 20- 49 50- 74 75- 99 1OO-499 500 a UP 5- 19 20- 99 100 & UP ALL
1 311+312 56.30 35.77 35.47 29.49 18.58 48.54 20.90 24.23 47.10 32.13 23.07 26.842 313 0.79 1.26 1.45 0.94 0.50 2.57 3.52 3.40 1.04 1.28 3.44 2.863 314 0.40 0.93 0.85 2.87 3.56 3.11 11.79 34.17 0.62 3.10 26.37 20.164 321 4.61 12.05 15.63 47.26 13.91 -3.70 10.95 12.33 8.66 25.65 11.65 13.765 322 1.25 1.44 1.33 0.89 0.41 0.00 0.07 0.00 1.31 0.54 0.02 0.23
6 323 0.38 0.85 0.59 0.41 0.52 0.20 0.27 0.00 0.47 0.38 0.09 0.187 324 1.06 0.99 0.87 -3.94 0.21 0.24 0.05 1.01 1.01 -1.84 0.68 0.31a 331 8.29 10.06 7.22 4.95 4.22 2.13 5.38 0.32 8.49 4.02 2.08 3.019 332 5,18 4.69 4.13 1.15 0.47 0.48 0.40 0.00 4.85 0.81 0.14 0.7010 341 0.08 0.17 0.25 0.82 0.90 0.01 0.57 1.49 0.14 0.62 1.17 0.98
11 342 2.26 3.99 4.07 2.68 5.66 3.49 2.02 0.25 3.05 3.59 0.87 1.5112 351 0.62 1.17 1.52 1.14 2.64 3.08 2.21 2.59 0.94 2.02 2.46 2.2413 352 1.18 3.66 2.16 -3.82 7.40 5.83 5.88 1.81 1.97 1.41 3.23 2.8114 355 1.22 4.00 4.18 8.23 23.10 11.50 14.20 3.17 2.49 12.58 7.01 7.4715 356 0.69 1.64 1.61 1.66 1.89 1.89 1.23 0.00 1.10 1.73 0.43 0.70
16 361 0.20 0.28 0.29 0.55 0.04 0.04 0.00 -0.00 0.24 0.29 -0.00 0.0717 362 0.07 0.02 0.12 0.64 0.60 0.04 1.27 1.12 0.07 0.47 1.18 0.9618 363 3.15 6.00 5.88 -5.50 1.78 0.77 0.35 3.98 4.39 -2.10 2.72 2.1119 364 4.20 2.77 2.11 1.24 2.29 0.17 0.11 0.00 3.43 1.19 0.04 0.5520 369 0.14 0.19 0.60 0.12 0.81 0.00 0.07 0.00 0.24 0.25 0.03 0.08
21 381 4.77 3.38 4.49 2.96 4.28 3.20 2.47 1.91 4.38 3.34 2.11 2.5222 382 0.44 0.95 0.52 1.25 1.70 5.38 -0.71 1.98 0.58 2.48 1.04 1.2323 383 0.20 0.65 1.41 1.07 .1.74 1.40 6.57 2.24 0.56 1.31 3.75 3.0524 384 1.25 1.57 2.18 1.84 2.57 4.27 7.95 3.77 1.52 2.67 5.23 4.4625 385 0.08 0.12 0.20 0.34 0.10 0.00 0.01 0.00 0.11 0.19 0.00 0.04
26 390 1.16 1.65 0.86 0.74 0.18 0.40 0.42 0.23 1.i2 0.52 0.30 0.42
27 TOTAL 28235. 12080. 10560. 41892. 19686. 22983. 136711. 255595. 50875. 84561. 392306. 527742.----------- --- -- - -- --- -- - -- --- - - --- --- -- - -- --- -- --- -- -- - -- --- -- - -- - -- -- --- --- -- - -- --- - - --- --- --

-12 8-
DATE 04/13/79 TIME 6 39PmTable 1B. INDONESIA: SURVEY OF SML+MEO+LOE ESTABLISHMENTS. 1974
NuMBER OF ESTABLISHMENTS BY SIZE CLASS
SIZE CLASS: BY MJUSEA OF PERSONS ENGAGEO PER ESTABLISH4MENT
PAOVNC S- '9 10- 14 15- 19 20- 49 50- 74 75- 99 100-499 500 & UP 5- 19 20- 99 100 & UP ALL
1 it 971. 64. 27. 24. 3. 3. 4. I. 662. 30. 5. 697.
2 12 lsUl. 300. 126. 179. 41. 20. 53. 6. 1937. 240. 59. 2236.3 13 974. 96. 35. 36. 5. 2. S. 1. 1105. 43. 9. 1157.4 14 506. 76. 45. 28. S. 4. II. 0. 627. 40. 11. 678.5 is 333. 29. 14. 20. S. 1. 5. 3. 386. 26. S. 420.
6 16 60. 102. 51. 40. 10. 3. 26. 4. 1833. 53. 30. 1916.7 17 92. 12. 6. 4. O. 0. 0. 0. 110. 4. 0. 114.
I 1 3S. Sl. 41. 39. 14. 5. 12. 1. 447. 55. 13. 518.9 31 1226. 417. 330. 496. Ill. 60. 189. 29. 1973. 667. 219. 2958.
to 32 7662. 1009. 571. 1120. 201. 91. 226. 31. 9462. 1412. 257. 11131.
It 33 6170. 1536. 835. 1166. 209. 8a. t66. al. 8541. t475. 227. 10243.13 34 762. 231. 94. 113. 1s. 9. 19. S. 1107. 137. 24. 1268.13 39 7131. 1301. 565. 1089. 237. 124. 263. 94. 9005. t450. 357. 10812.14 Si 472. 109. 66. 43. S. 4. 12. 2. 649. 55. 14. 718.
Is 52 362. 73. 16. 50. 10. 3. 6. 1. 451. 63. 7. 521.
16 53 167. S0. 20. 9. 2. 1. 2. 0. 237. 12. 2. 251.17 el 430. 26. Is. 25. 9. 3. 21. 2. 473. 37. 23. 533.to 62 t". 26. 6. 18. 2. 1. 4. 0. 173. 21. 4. 198.49 63 396. 36. 26. go. 8. 0. 7. 3. 458. 63. 10. 531.20 64 97. 29. 16. 16. 6. 1. 1. 0. 142. 23. 1. 166.
24 71 250. se. 24. 12. 0. 3. 3. 0. 432. 15. 3. 450.22 72 244. 19. 7. 7. 1. 1. 0. 0. 270. 9. 0. 279.23 73 2067. 191. s6. 89. ii. 4. 10. 3. 2334. 104. 13. 2451.24 74 381. St. 19. 25. S. 0. 1. 0. 351. 30. 1. 382.
25 al 65. 25. 9. 4. 1. 2. 3. 0. 99. 7. 3. t09.
26 82 66. 20. ti. 1o. 0. 1. 2. 0. 117. I1. 2. 130.
27 TOTAL 34363. 5953. 3065. 4737. 921. 427. 1054. 247. 43381. 6085. 1301. 50767.…__ _ _ _ _ _ _ _ _ _ _ _ _ _ _ _ _ _ _ _ _ _ _ _ _ _ _ _ _ _ _ _ _ _ _ _ _ _ _ _ _ _ _ --_ _ _ _ _ _ _ _ _ _ _ _ _ _ _ _ _ _ _ _ _ _ _ _ _ _ _ _ _ _ _ _ _ _ _ _ _ _ _ _ _ _ _ _ ---- _ _ _ _ _ _ _ _ _ _ _ _ _ _ _ -- _ _ _ _ _ _ _ _ -- _- --- _ _ _

-129-
DATE 04/13/79 TIME 6 39PMTable 2B. INDONESIA SURVEY OF SML-MED-LGE ESTABLISHMENTS. 1974
NUMBER OF PERSONS ENGAGED BY SIZE CLASS
SIZE CLASS : BY NUMBER OF PERSONS ENGAGED PER ESTABLISHMENT
PROVNC 5- 9 10- 14 15- 19 20- 49 50- 74 75- 99 100-499 500 A UP 5- t9 20- 99 100 & UP ALL
I il 3462. 721. 453. 747. 159. 254. 789. 1252. 4636. 1160. 2041 7837.
2 12 9510. 3431. 2127. 5084. 2620. 1771. 11705. 4975. 15068. 9475. 16680. 41223.
3 13 5519. 1101. 608. 1081. 301. 166. 1404. 1456. 7228. 1548. 2860. 11636.
4 14 3102. 876. 756. 870. 484. 360. 1704. 0. 4734. 1684, 1704. 8122.
5 15 1980. 448. 231. 534. 302. 89. 1334. 1651. 2659. 925. 2985. 6569.
6 16 9847. 1145. 847. IOBI. 587. 266. 5538. 4041. 11839. 1934. 9579. 23352.
7 17 582. 136. 97. 101. 0. 0. O. 0. 815. 101. 0. 916.
B 18 2204. 589. 695. 1155. 806. 414. 2272. 500. 3488. 2375. 2772. 8635.
9 31 7969. 4791. 5590. 15038. 6600. 5172. 37189. 24734. 18350. 26810. 61923. 107083.
10 32 47483. 11588. 9592. 32167. 11847. 7577. 41640. 27362. 68663. 51591. 69002. 189256.
11 33 38678. 17831. 13982. 32937. 11560. 6631. 31234. 72725. 70491. 51128. 103959. 225578
12 34 4931. 2630. 1583. 3113. 867. 742. 3564. 5744. 9144. 4722. 9308. 23174.
13 35 43670. 14968. 9439. 30265. 13336. 9998. 47877. 116292. 68077. 53599. 164169. 285845.
14 51 3016. 1250. 1141. 1179. 452. 359. 2445. 1591. 5407. 1990. 4036. 11433.
15 52 2133. 848. 268. 1368. 591. 267. 981. 578. 3249. 2226. 1559. 7034.
16 53 1127. 566. 336. 255. 129. 93. 373. 0. 2029. 477. 373. 2879.
17 61 2453. 312. 255. 753. 495. 264. 5534. 1116. 3020. 1512. 6650. 11182.
la 62 879. 295. 129. 592. 110. 97. 775. 0. 1303. 799. 775. 2877.
19 63 2354. 412. 438. 1679. 461. 0. 1583. 1356. 3204. 2140. 2939. 8283.
20 64 628. 340. 275. 451. 363. 81. 123. 0. 1243. 895. 123. 2261.
21 71 2147. 659. 407. 430. 0. 265. 360. 0. 3213. 695. 360. 4268.
22 72 1402. 216. 114. 172. 54. Ss. 0. 0. 1732. 314. 0. 2046.
23 73 11999. 2199. 1441. 2269. 627. 320. 1492. 2062. 15639. 3216. 3554. 22409.24 74 l758. 568. 320. 673. 272. 0. 130. 0. 2646. 945. 130. 3721.
25 81 424. 283. 148. 113. 59. 198. 665. 0. 855. 370. 665. 1890.
26 82 580. 237. 184. 258. 0. 85. 473. 0. 1oot: 343. 473. 1817.
27 TOTAL 209837. 68440. 51456. 134365. 53052. 35557. 201184. 267435. 329733. 222974. 468619. 1021326.------ ----- --------- ----------- ----------- -_ ---------- -- ----_ _ ---- -----------_ _ - ---------- ----- -- ---------- -------- -------- --------
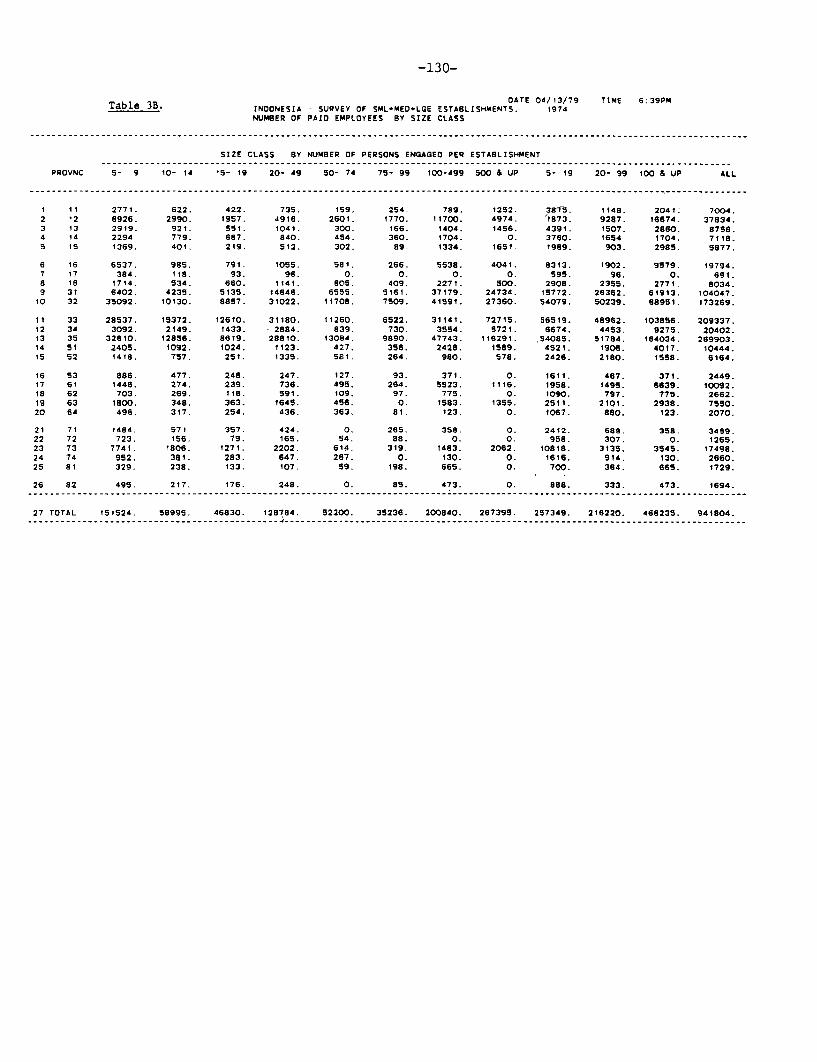
-130-
DATE 04/13/79 TIME 6:39PMTable 3B. INDONESIA SURVEY OF SML+MED+LGE ESTABLISHMENTS. 1974
NUMBER OF PAID EMPLOYEES BY SIZE CLASS
SIZE CLASS BY NUMBER OF PERSONS ENGAGED PER ESTABLISHMENT
PROVNC 5- 9 10- 14 15- 19 20- 49 50- 74 75- 99 100-499 500 & UP 5- 19 20- 99 100 & UP ALL
1 II 2771. 622. 422. 735. 159. 254- 789. 1252. $"S. 1149. 2041: 7004.2 2 6926. 2990. 1957. 4916. 2601. 1770. 11700. 4974. 1873. 9287. 16674. 37834.3 13 2919. 92t. 551. 1041. 300. 166. 1404. 1456. 4391. 1507. 2860. 8758.4 14 2294 779. 687. 840. 454. 360. 1704. 0. 3760. 1654. 1704. 7118.S 15 1369. 401. 219. 512. 302. 89. 1334. 1651. 1989. 903. 2985. 5877.
6 16 6537. 985. 791. 1055. 581. 266. 5538. 4041. 8313. 1902. 9579. 19794.7 17 384. 118. 93. 96. 0. 0. 0. O. 595. 96. 0. 691.8 18 1714. 534. 660. 1141. 805. 409. 2271. 500. 2908. 2355. 2771. 8034.9 31 6402. 4235. 5135. 14646. 6555. 5161. 37179. 24734. 15772. 26362. 61913. 104047.
10 32 35092. 10130. 8857. 31022. 11708. 7509. 41591. 27360. 54079. 50239. 68951. 173269.
II 33 28537. 15372. 12610. 31180. 11260. 6522. 31141. 72715. 56519. 48962. 103856. 209337.12 34 3092. 2149. 1433. 2884. 839. 730. 3554. 5721. 6674. 4453. 9275. 20402.13 35 32610. 12856. 8619. 28810. 13084. 9890. 47743. 116291. 54085. 51784. 164034. 269903.14 51 2405. 1092. 1024. 1123. 427. 356. 2428. 1589. 4521. 1906. 4017. 10444.tS 52 1418. 757. 251. 1335. 51a. 264. 980. 578. 2426. 218O. 1558. 6164.
16 53 886. 477. 248. 247. 127. 93. 371. 0. 1611. 467. 371. 2449.17 61 1445. 274. 239. 736. 495. 264. 5523. 1116. 1958. 1495. 6639. 10092.18 62 703. 269. 18. 591. 109. 97. 775. 0. 1090. 797. 775. 2662.19 63 1800. 348. 363. 1645. 456. 0. t583. 1355. 2511. 2101. 2938. 7550.20 64 496. 317. 254. 436. 363. 81. 123. 0. 1067. 880. 123. 2070.
21 71 1484. 571 357. 424. 0. 265. 358. 0. 2412. 689. 358. 3459.22 72 723. 156. 79. 165. 54. 88. 0. 0. 958. 307. 0. 1265.23 73 7741. 1806. 1271. 2202. 614. 319. 1483. 2062. 10818. 3135. 3545. 17498.24 74 952. 381. 283. 647. 267. 0. 130. 0. 1616. 914. 130. 2660.25 81 329. 238. 133. 107. 59. 198. 665. 0. 700. 364. 665. 1729.
26 82 495. 217. 176. 248. 0. 85. 473. 0. 888. 333. 473. 1694.---------------------------------------------------------.----------- __------__----------------.------------------------------------
27 TOTAL 151524. 58995. 46830. 128784. 52200. 35236. 200840. 267395. 257349. 216220. 468235. 941804.-- ----------------------------------------- _--i_--------_. _ . -_______________._________________-____________________________________

-131-
DATE 04/13/79 TIME 6.39PMTable 4B. INDONESIA .SURVEY OF SML.MED.LGE ESTABLISHMENTS. 1974
MAI4-DAYS WORKED PER YEAR BY SIZE CLASS
SIZE CLASS * BY NUMBER OF PERSONS ENGAGED PER ESTABLISHMENT
PROVNC 5- 9 10- 14 15- 19 20- 49 50- 74 75- 99 100-499 500 & UP 5- 19 20- 99 100 & UP ALL
I II 446109. 98663. 71967 ;55247. 30355. 531tO. 185701. 204490. 616739. 238712. 390191. 1245642.2 12 1540530. 702246 490820. 1;33961. 596476. 420928. 2848101. 1435344. 2733596. 2151365. 4283445. 9168406.3 13 585822. 227582. 155291. 259705. 67929. 43709. 376090. 428537. 968695. 371343. 804627. 2144665.4 14 448692. 164293. 143480. :70881. 100098. 70747. 358575. 0. 756465. 341726. 358575. 1456766.5 15 226940. 71987. 45769. 98687. 60142. 22386. 335068. 475082. 344696. 181215. 810150. 1336061.
6 16 1045620. 195332. 171156. 38277. 116271. 54384. 1410638. 923382. 1412108. 408932. 2334020. 4i55060.7 17 85024. 29964. 18360. 18971. 0. 0. 0. O. 133348. 18971. 0. 152319.8 18 324702. 104841. 141801. 190678. 162594. 95823. 422420. 24480. 571344. 449095. 446900. 1467339.9 31 1415123. 1033341. 1278852. 3E.18006. 1502516. 1174379. 8126357. 5529447. 3727316. 6294901. 13655804. 23678021.
10 32 6495107. 2188854. 2043296. 7496880. 2958352. 1900164. 10069163. 7033882. 10727257. 12355396. 17103045. 40185698.
II 33 6424722. 3423983. 2902261. 7E61682. 2613613. 1586079. 7538708. 18958884. 12750966. 11861374. 26497592. 51109932.12 34 788871. 560705. 415555. 839737. 238153. 175215. 794389. 1430675. 1765131. 1253105. 222S064. 5243300.13 35 6663374. 2906666. 2143044. 6393129. 2846826. 2155293. 11415104 28545774. 11713084. 11395248. 39960878. 6306921014 51 566149. 270476. 261827. 293404. 118695. 101293. 628025. 358495. 1098452. 513392. 986520 2598364.15 52 285843. 175010. 52548. 232039. 156141. 35438. 182413. 132231. 513401. 423618. 314644 1251663.
16 53 139784. 85679. 46436. 43987. 36136. 28496. 104939. 0. 271899. 108619. 104939. 485457.17 61 268239. 59533. 54169. 149617. 93498. 53411. 1393375. 247683. 381941. 296526. 1641058. 2319525.18 62 115927. 53695. 27476. 96779. 13905. 23735. 178969. 0. 197098. 134419. 178969. 510486.19 63 349595. 77505. 84507. 361771. 116805. 0. 245374. 205143. 511607. 478576. 450517. 1440700.20 64 103289. 78816. 59304. 92246. 88620. 12725. 33974. 0. 241409. 193591. 33974 468974.
21 71 223049. 105862. 71986. 84854. 0. 59603. 93877. 0. 400897. 144457. 93877 639231.22 72 126951. 24914. 20294. 36354. 8816. 17442. 0. 0 172159. 62612. 0. 234771.23 73 1433631. 343139. 255282 443849. 148898. 87213. 316553. 429440. 2032052. 679460. 745993. 3457505.24 74 144200. 70760. 46780. 142857. 57911. 0. 35760. 0. 261740. 200768. 35760. 498268.25 81 68055. 56427. 27126. 25052. 10890. 56811. 168588. 0. 151608. 92753. 168588. 412949.
26 82 108397. 50883. 41844. 55762. 0. 22411. 33872. 0. 201124. 78173. 33872. 313169.
27 TOTAL 30423745. 13161156. 11071231. 30334412. 12143140. 8250795. 47296033. 66362969. 54656132. 50728347.113659002.219043481.

-132-
DATE 04/13/79 TIME 8 39PM
Table 5B. INDONESIA SURVEY OF SML+MEO+LGE ESTABLISHMENTS. 1974
GROSS OUTPUT (ML.RUPIAHS) BY SIZE CLASS
S12E CLASS : BY NUMBER OF PERSONS ENGAGED PER ESTABLISHMENT
PROVNC 5- 9 10- 14 15- 19 20- 49 50- 74 75- 99 100-499 500 & UP 5- 19 20- 99 100 & UP ALL
I II 2577. 310. 303. 823. 218. 642. 1235. 1033. 3190. 1683. 2268. 7141.2 12 6823. 3171. 2570. 5s1i. 5921. 14168. 35342. 5964. 12564. 25900. 41306. 79771.3 13 2041. 686. 449. 1486. 666. 1473. 5669. 7631. 3176. 3625. 13300. 20101.4 14 1365. 580. 1137. 1765. 1544. 649. 6342. 0. 3082. 3958. 6342. 13383.5 15 589. 186. 364. 343. 190. 190. 8292. 9352. 1139. 722. 17644. 19505.
6 16 5363. 881. 821. 1206. 1934. 482. 26393. 11622. 7064. 3622. 38014. 48700.7 17 251. 123. 153. 35. 0. 0. 0. 0. 527. 35. 0. 562.8 18 1065. 446. 1147. 3895. 4960. 1280. 6050. 17. 2658. 10136. 6067. 18861.9 31 4868. 3948. 4233. 16945. 9972. 12778. 114347. 133985. 13049. 39693. 248332. 301074t0 32 i4262. 6793. 5813. 39293. 12688. 6930. 67039. 80469. 26868. 58911. 147508. 233286.
It 33 13134. 7737. 6611. 22521. 21540. 4799. 43824. 137559. 27481. 48860. 181384 257725.12 34 1777 944. 943. 1525. 713. 340. 9194. 8429. 3664. 2578. 17624. 23866.13 35 14778. 7557. 6666. .21217. 11086. 13042. 45476. 214251 29000. 45344. 259727. 334072.14 51 1559. 934. 1085. 975. 1272. 839. 3431. 1224. 3578. 3085 4654. 11318.15 52 562. 357. 158. 875. 1179. 591. 720. 15. 1077. 2645. 735. 4457.
16 53 421. 243. 53. 277. 61. 12. 55. 0. 717. 350. 55. 1121.17 61 1128. 441. 277. 2156. 1627. 1750. 20043. 1396. 1846. 5532. 21439 28817.18 62 426. 297. 65. 692. 14. 312. 1879. 0. 788. 1018. 1879. 3684.19 63 655. 267. 381. 2257. 1124. 0. 2270. 626. 1302. 3382. 2897. 7580.20 64 469. 348. 256. 449. 848. 209. 399. 0. 1073. 1506. 399. 2978.
21 71 514. 213. 157. 841. 0. 2388. 326. 0. 884. 3229. 326. 4440.22 72 182. 69. 67. 14. 340. 1158. 0. 0. 318. 1511. 0 182923 73 2103. 603. 413. 1389. 1394. 93. 11684. 5452. 3119. 2876. i7136. 23131.24 74 210. 130. 40. 110. 36. 0. 12. 0. 379. 146. 12. 537.25 81 168. 109. 71. 142. 37. 594. 3159. 0. 348. 773. 3159. 4280.
26 - 82 364. 112. 73. 99. 0. 36. 324. 0. . 549. 135. 324 1008.
27 TOTAL 77650. 37484. 34305. 127141. 79363. 64750. 413506. 619026. 149439. 271255. 1032531. 1453225.----- ---- -- -- ----- ---- - --- ---- ----- ---- ---- -----_ _- - -- -- ---- ---_ _- --- ---- ----- ---- -- -- ---- ----_- -- - ---- - ---

-133-
DATE 04/13/79 TIME 6:39PMTable 6B. INDONESIA : SURVEY OF SML+MED+LGE ESTABLISHMENTS. 1974
VALUE'ADDED (ML.RUPIAHS) BY SIZE CLASS
SIZE CLASS : BY NUMBiER OF PERSONS ENGAGED PER ESTABLISHMENT
PROVNC 5- 9 10- 14 15- 19 20- 49 50- 74 75- 99 100-499 500 & UP 5- 19 20- 99 100 & UP ALL
I 1i 611. 106. i17. 369. 82. 185. 368. 571. 834. 636. 939. 2409.2 12 1848. 759. 682. 2096. 1608. 9769. 11035. 1685. 3289. 13473. 12720. 29482.3 13 620. 236. 145. 484. 60. 107. 1420. 4361. 1001. 651. 5781. 7433.4 14 538. 212. 398. 606. 357. 222. 1403. 0. 1148. 1t86. 1403. 3736.5 15 235. 87. 120. 139. 67. 65. 1362. 920. 442. 271. 2282. 2995.
6 16 2147. 363. 277. 429. 700. 204. 6664. 4194. 2787. t333. 10858. 14979.7 17 135. 29. 50. 26. 0. 0. 0. 0. 214. 26. 0. 240.8 Is 280. 99. 278. 1153. 958. 1011. 1807. 4. 657. 3123. 1810. 5590.9 31 1874. 1543. 1460. 820. 3466. 4598. 41628. 41724. 4877. 8883. 83352. 97112.1o 32 S506. 2314. 1760. 17579. 4757. -1058. 28349. 35455. 9179. 21278. 63803. 94260.
11 33 4879. 2280. 2044. 9032. 2062. 2065. 11947. 54023. 9204. 13159. 65970. 88333.12 34 679. 279. 248. 457. 186. 127. 2423. 3172. 1206. 769. 5595. 7571.13 35 5502. 2236. 1991. 5748. 3218. 3913. 13520. 05380. 9728. 12878. 118900 141507.14 SI 656. 272. 222. 262. 137. 43. 597. 435. 1150. 442. 1032. 2624.1s 52 311. 112. 42. 211. 189. 55. 186. 8. 465. 454. 194. 1114.
16 53 154. 80. 23. 98. 35. 10. 32. 0. 257. 143. 32. 431.17 61 325. 139. 85. 415. 545. 607. 7443. 738. 549. 1567. 8180. 10297.la 62 206. 107. 34. 238. 9. 53. 589. 0. 346. 300. 589. 1235.19 63 291. 172. 110. 613. 430. 0. 811. 29. 573. 1043. 840. 2456.20 64 210. 147. 101. 239. 247. 81. 108. 0. 458. 568. 108. 1134.
21 71 237. 67. 74. 335. 0. 449. 200. 0. 378. 784. 200. 1362.22 72 102. 24. 44: 10. 82. 355. 0. 0. 170. 448. 0. 618.23 73 905. 213. 147. 349. 447. 33. 3932. 2896. 1266. 830. 6828. 8923.24 74 149. 83. 28. 77. 28. 0. 5. 0. 260. lOS. S. 370.25 SI 76. 56. 36. 38. 18. 64. 735. 0. 168. 120. 735 1023.
26 82 157. 66. 44. 67. 0. 23. 149. 0. 267, 91. 149 507.
27 TOTAL 28235. 12080. 10560. 41892. 19686. 22983. 136711. 255595. 50875. 84561. 392306. 527742.- ----- ------ ------. - ---------- --- ---------- ----------- -------_ _ --- -----------_ _ ---------- --- ---------- -------- -------- ------ ------ --

-134-
OATE 04/13/71 'Tip$ 6 39PmTable 7B. INDONESIA: SURVEY OF SML+MEDOLGE ESTABLISHMENTS. 1974
WAGES & SALARIES(ML.RUPIAHS) BY SIZE CLASS
SIZE CLASS BY NUMBER OF PERSONS ENGAGED PER ESTABLISHMENT
PROVNC S- 9 10- 14 15- 19 20- 49 50- 74 75- 99 100-499 SOO & UP 5- I9 20- 99 100 a UP ALL
I 11 167. 40. 31. 79. 14. 33. 82. 194. 238. 127. 276. 641.2 12 527. 232. 179. 589. 297. 350. 1416. 599. 938. 1236. 2015. 4188.3 13 306. 98. 48. 153. 26. 39. 279. 756. 452. 218. 1036. 1706.4 14 S8O. 77. 62. 124. 72. 81. 242. 0. 327. 277. 242. 846.S 15 76. 28. 23. 46. 39. 31. 198. 350. 127. I16. 548. 791.
6 ¶6 370. 78. 56. 137. 77. 45. 1000. 1966. 504. 260. 2966. 3730.7 17 34. 10. 6. 13. O. 0. 0. O. SO. 13. 0. 63.a 18 95. 32. 67. 127. 124. 57. 356. 7. 193. 308. 363. 864.9 31 624. 444. 533. 1972. 1075. 1184. 8708. 9130. 1600. 4231. 1783S. 23669.
10 32 1719. 654. 603. 2568. 1228. 774. 5737. 6345. 2976. 4569. 12081. 19627.
II 33 1485. 819. 831. 1922. 657. 447. 2883. 9034. 3135. 3027. 11917. 18079.12 34 174. 121. 97. 195. 57. 40. 558. 1062. 391. 292. 1617. 2301.13 35 1504. 659. 513. 1751. 939. 736. 4204. 15326. 2675. 3426. 19530. 25631.14 51 120. 75. 51. 72. 38. 11. 228. 129. 247. 121. 356. 724.15 52 56. 33. 16. 55. 30. 9. 51. 3. 105. 94. 54. 254.
16 53 33. 21. 11. 18. IS. 4. 24. 0. 65. 37. 24. 127.17 61 96. 28. 26. 93. 68. 42. 1353. 210. 151. 202. 1563. 1916.18 62 48. 2S. 13. 79. 9. 23. 104. 0. 8S. 112. 104. 301919 63 98. 32. 33. 203. 79. 0. 261. 128. 163. 282. 389. 834.20 64 56. 43. 35. 61. 91. 14. 24. 0. 134. 186. 24. 344.
21 7t 65. 40. 183. 43. O. 27. 22. 0. 289. 70. 22. 381.22 72 33. 7. 9. S. 9. 11. O. 0. 49. 25. 0. 75.23 73 302. 67. 52. 127. 82. 18. 303. 689. 421. 226. 992. 1639.24 74 5t. 2S. 16. 42. 14. 0. 4. 0. 96. 55. 4. 155.25 81 27. 22. 16. 13. 14. tI. 67. 0. 66. 46. 67. 178.
26 82 44. 22. 16. 37. O. 28. 63. 0. 83. 65. 63. 211.27___TOTAL___._6299._____3735__.__3527._____0__44____5056.____4024.____26166.____45926.____¶____6__.__19624.____74092.____109277.__
27 TOTAL 8299. 3735. 3527. tO544. 5056. 4024. 2816e. 45926. 15581. 19624. 74092. 109277.

-135-
DATE 04/13/79 TIME 6.39PMTable 8B. :INOONESIA: SURVEY OF SML+MEO+LGE ESTABLISHMENTS, 1974
IlUbMER OF PERSONS ENGAGED PER ESTABLISHMENT BY SIZE CLASS
SIZE Ct.ASS: fY NUMBER OF PERSONS ENGAGED PER ESTABLISHMENT
PROVNC 5- 9 10- 14 15- 19 20- 49 50- 74 75- 99 100-499 500 & UP 5- 19 20- 99 100 & UP ALL
1 11 6. 11. 17. 31. 53. 85. 197. 1252. 7. 39. 408. 11.2 12 6. 11. 17. 28. 64. 89. 221. 829. 8. 39. 283.- la.3 13 6. II. 17. 30. 60. 83. 176. 1456. 7. 36. 318. 10.4 14 6. 12. 17. 31. 57. 90. 155. 0. 8. 42. 155. 12.5 15 6. 11. 17. 27. 60. a6. 267. 550. 7. 36. 373. 16.
6 16 6. It. 17. 27. 59. 89. 213. 1O0O. 6. 36. 319. 12.7 17 6. 11. 16. 25. O. 0. 0. O. 7. 25. 0. 8.B la 6. 12. t7. 30. 58. 83. 189. 500. 8. 41. 213. 17.9 31 7. 11. 17. 30. 59. 86. 197. 853. 9. 40. 284. 37.
10 32 6. i1. 17. 29. 59. 63. 184. 883. 7. 37. 268. 17.
II 33 6. 12. 17. 28. 56. 82. 188. 1192. 6. 35. 458. 22.12 34 6. II. 17. 28. 58. 82. 188. i149. 8. 34. 388 18.13 39 6. 1I. 17. 28. 56. 81. t82. 1237. S. 37. 460. 26.14 51 6. II. i7. 27. 57. 90. 204. 796. 8. 36. 288. 16.15 52 6. 12. 17. 27. 59. 89. 164. 578. 7. 35. 223. 14.
16 53 7. II. 17. 28. 65. 93. 187. 0. 9. 40. 187. 1i.17 61 6. Ii. 17. 30. 55. 88. 264. 558. 6. 41. 289. 21.18 62 6. II. 16. 33. 55. 97. 194. O. 8. 38. 194. 15.19 63 6. 11. 17. 31. 58. 0. 226. 452. 7. 34. 294 *6.20 64 6. 12. 17. 28. 61. 81. 123. 0. 9. 39. 123. 14.
21 71 6. 11. 17. 36. 0. 88. 120. 0. 7. 46. 120. 9.22 72 6. 11. 16. 25. 54. 88. 0. 0. 6. 35. 0 7.23 73 6. 12. 17. 25. 57. 80. 149. 687. 7. 31. 273. 9.24 74 6. 11. 17. 27. 54. O. 130. O. 8. 32. 130. 10.25 81 7. 11. 16. 28. 59. 99. 222. 0. 9. 53. 222. 17.
26 82 7. 12. 17. 26. 0. 85. 237. 0. 9. 31. 237 *4.
27 TOTAL 6. II. 17. 28. 58. 83. 191. 1083. 8. 37. 360. 20.___- -----_______- ---- -------- ------- -_________- - -------- --------- ----____________.__- ------- ---------- -- ----------- -------_____- ------- ---____________________.- ------- ------- --- ------ ----- -................____ _ ___

-136-
OATE 04/13/79 TIME 6:39PMTable 9B. INDONESIA : SURVEY OF SML+MED+LGE ESTABLISHMENTS. 1974
Table 9B. MAN-DAYS WORKED PER PAID EMPLOYEE BY SIZE CLASS
---------------------.-.-----------.-.-.------------------------- ___---------_---- ------------------------------------------------
SIZE CLASS : BY NUMBER OF PERSONS ENGAGEO PER ESTABLISHMENT
PROVNC 5- 9 10- 14 15- 19 20- 49 50- 74 75- 99 100-499 SOO & UP 5- 19 20- 99 100 S UP ALL
1 II 161. 159. 171. 211. 191. 209. 235. 163. 162. 20S. 191. 179.2 12 222. 235. 251. 231. 229. 238. 243. 289. 230. 232. 257: 242.3 13 201. 247. 282. 249. 226. 263. 268. 294. 221. 246. 281. 24S.4 14 196. 211. 209. 203. 220. 197. 210. O. 201. 207. 210. 205.5 15 166. 180. 209. 193. 199. 252. 251. 288. 173. 201. 271. 227.
6 Is 160. 198. 216. 226. 200. 204. 295. 229. t70. 215. 244. 210.7 17 221. 254. 197. 198. 0. O. O. O. 224. 198. O. 220.8 18 189. 196. 215. 167. 202. 234. 186. 49. 196. 191. 161. 183.9 31 221. 244. 249. 247. 229. 228. 219. 224. 236. 239. 221. 228.10 32 185. 216. 231. 242. 253. 253. 242. 257. 196. 246. 248. 232.
11 33 225. 223. 230. 246. 232. 243. 242. 261. 226. 242. 255. 244.12 34 255. 261. 290. 291. 284. 240. 224. 250. 264. 281. 240. 257.13 35 204. 226. 249. 222. 218. 218. 239. 245. 217. 220. 244. 234.14 5I 235. 248. 256. 261. 278. 285. 259. 226. 243. 269. 246. 249.15 52 202. 231. 209. 174. 269. 134. ¶86. 229. 212. 194. 202. 203.
16 53 158. 180. 187. 178. 285. 306. 283. 0. 169. 233. 283. 199.17 61 186. 217. 227. 203. 189. 202. 252. 222. 195. 198. 247. 230.is 62 165. 200. 233. 164. 12S. 245. 231. 0. 181. 169. 231. 192.19 63 194. 223. 233. 220. 256. 0. 155. 151. 204. 228. 153. 191.20 64 208. 249. 233. 212. 244. 157. 276. 0. 226. 220. 276. 227.
21 71 150. 185. 202. 200. 0. 225. 262. 0. 166. 210. 262. 185.22 72 176. 160. 257. 220. 163. 198. 0. 0. 180. 204. 0. 186.23 73 185. 190. 201. 202. 242. 273. 213. 208. l88. 217. 210. 198.24 74 151. 186. 165. 221. 217. 0. 275. 0. 162. 220. 275. 187.25 81 207. 237. 204. 234. 85. 287. 254. 0. 217. 255. 254. 239.
26 82 219. 234. 238. 225. 0. 264. 72. 0. 226. 235. 72. 185.
27 TOTAL 201. 223. 236. 236. 233. 234. 23S. 248. 212. 235. 243. 233._ _ _ _- _ _ _ _- __ _ _ _ _ _ _ _ _ _ _ _ _ _ _ _ _ _- _ _ _ _ _ _ _ _._- _ _ _- _ _ _ _ _ _ _ _ _ _ _ _ _ _ _ _ _ _ _ _ _ _ _ _ _ _ _ _ _ _ _ _ _ _ _ _ _ _ _ _ _ _ _ _ _ _ _ _ _- _ _ _ _ _ _ _ _ _ _ _- _ _ _ _ _ _ _ _ _ _ _ _ _ _ _- _ _ _ _ _ _ _.
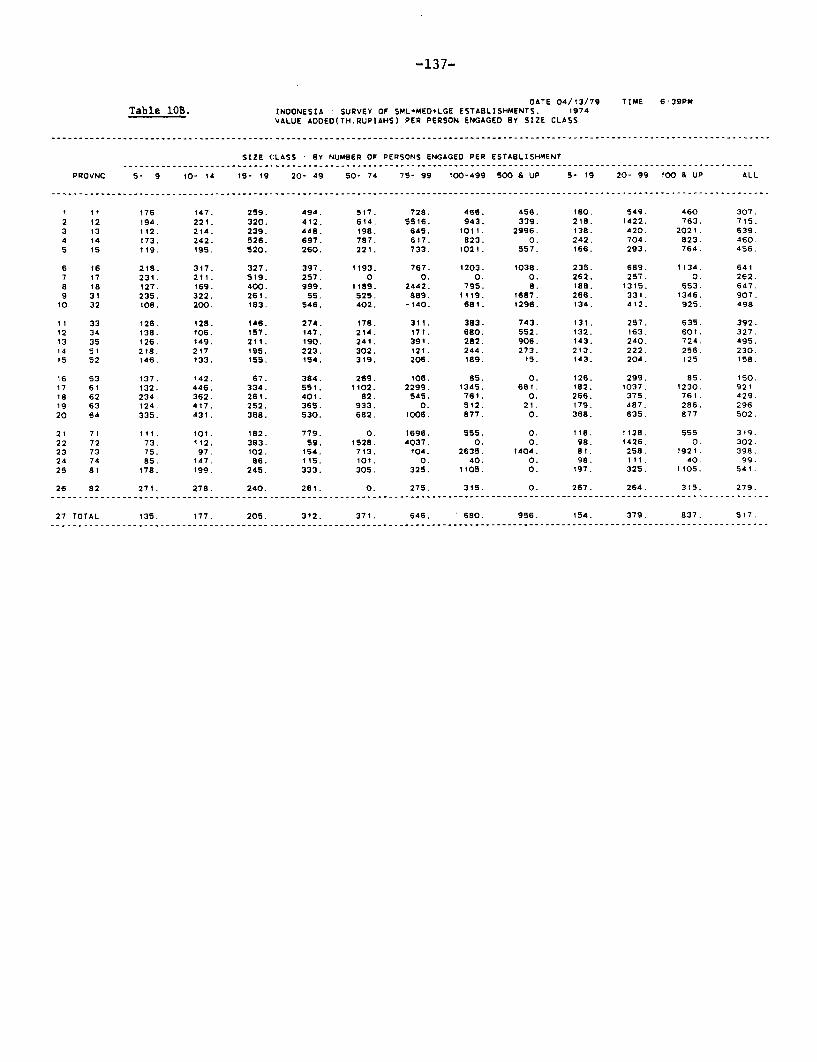
-137-
OATE 04/13/79 TIME 6539PMTable 10B. INOONESIA : SURVEY OF SML+MED+LGE ESTABLISHMENTS. 1974
VALUE ADDED(TH.RUPIAHS) PER PERSON ENGAGEO BY SIZE CLASS
SIZE CLASS BY NUMBER OF PERSONS ENGAGED PER ESTABLISHMENT
PROVNC 5- 9 10- 14 1S- 19 20- 49 50- 74 75- 99 100-499 500 & UP 5- 19 20- 99 100 & UP ALL
I 11 176 147. 259. 494. 5t7. 728. 466. 456. 180. 549. 460 307.
2 12 194. 221. 320. 412. 614. 5516. 943. 339. 218. 1422. 763. 715.3 13 112. 214. 239. 448. 198. 645. 1011. 2996. 138. 420. 2021. 639.4 14 173. 242. 526. 697. 787. 617. 823. 0. 242. 704. 823. 460.5 I5 119. 195. 520. 260. 221. 733. 1021. 557. 166. 293. 764. 456.
6 16 218. 317. 327. 397. 1193. 767. 1203. 1038. 235. 689. 1134. 6417 17 231. 211. 519. 257. 0 O. 0. 0. 262. 257. O. 262.a 18 127. 169. 400. 999. 1189. 2442. 795. 8. 188. 1315. 653. 647.9 31 235. 322. 261. 55. 525. 689. 1119. 1687. 266. 331. 1346. 907.10 32 108. 200. 183. 546. 402. -140. 681. 1296. 134. 412. 925. 498
11 33 126. 128. 146. 274. 178. 311. 383. 743. 131. 257. 635. 392.12 34 138. 106. 157. 147. 214. 171. 680. 552. 132. 163. 601. 327.13 35 126. 149. 211. 190. 241. 391. 282. 906. 143. 240. 724. 495.14 Si 218. 217 195. 223. 302. 121. 244. 273. 213. 222. 256. 230.15 52 146. 133. 155. 154. 319. 206. 189. is. 143. 204. 125 158.
16 53 137. 142. 67. 384. 269. 106. 85. 0. 126. 299. 85. 150.17 61 132. 446. 334. 551. 1102. 2299. 1345. 661. 182. 1037. 1230. 92118 62 234. 362. 261. 401. 82. 545. 761. 0. 266. 375. 761. 429.19 63 124. 417. 252. 365. 933. 0. 512. 21. i79. 487. 286. 29620 64 335. 431. 368. 530. 682. 1006. 877. 0. 368. 635. 877 502.
21 71 III. 101. 182. 779. 0. 1696. 555. O. 118. 1128. 555 319.22 72 73. 112. 383. 59. 1528. 4037. 0. 0. 98. 1426. 0. 302.23 73 75. 97. 102. 154. 713. 104. 2635. 1404. 81. 258. 1921. 398.24 74 85. 147. 86. 115. 101. O. 40. 0. 98. III. 40. 99.25 81 178. 199. 245. 333. 305. 325. 1105. 0. 197. 325. 1105. 541.
26 82 271. 278. 240. 261. 0. 275. 315. 0. 267. 264. 315. 279.
27 TOTAL 135. 177. 205. 312. 371. 646. 680. 956. 154. 379. 837. 517.----- ------ --------_ ------------- -------. -_ -- -------- --------------_ _ - -- -----_ _ ----- --------------- ---------- -------- -------- -- ----

-138-
DATE 04/13/79 TIME 6 39PMTable llB. INDONESIA SURVEY OF SML+MED+LGE ESTABLISHMENTS. 1974
WAGES AND SALARIES PER PAID EMPLOYEE (TH.RUPIAHS) BY SIZE CLASS
SIZE CLASS BY NUMBER OF PERSONS ENGAGED PER ESTABLISHMENT
PROVNC 5- 9 10- 14 15- 19 20- 49 50- 74 75- 99 100-499 500 S UP 5- 19 20- 99 100 & UP ALL
I II 60. 64. 72. 108. 90. 131. 104. 155. 62. Ill 135. 92.2 12 76. 78. 92 120. 114. 198. 121. 120. 79. 133. 121 111.3 13 105 106. 87. 147. 87. 236. 199. 520. 103. 145. 362. 195.4 14 82 99. 90 148. 160. 224. 142. 0. 87. 168. 142 119.5 15 56. 71 104. 91. 128. 345. 148. 212. 64. 128. 184. 135.
6 16 57 79. 70. 130. 133. 171. 181. 487. 61. 137. 310. 158.7 17 89 83. 62 140. 0. 0. 0. 0. 83. 140. 0. 91.8 18 55. 60. 101. Ill. 154. 140. 157. 13. 67. 131. 131 1O0.9 31 97. 105 104 135. 164. 229. 234. 369. 10. 161. 288 22710 32 49 65. 68. 83 lOS. 103. 138. 232. 55. 91. 175. 113.
11 33 52 53 66. 62. 58. 69. 93. 124 55. 62. ¶15 86.12 34 56 56. 67. 67. 68. 55. 156. 186. 59. 66. 174. 113.13 35 46 51. 59. 61. 72. 74. 88. 132. 49. 66. 119. 95.14 51 50. 69. SO 64. 89 32. 94. 81. 55. 63. 89. 69.15 52 39. 43. 65. 41. 52. 34. 52. 5. 43. 43. 35. 41.
16 53 38. 44. 44. 73 119. 42. 66. 0. 40. 80. 66. 52.17 61 66. 104. 110. 126. 138. 158. 245. I88. 77. 135 235. 190.18 62 68. 93. 113. 134. 83. 235. 134. 0. 79. 140. 134. 113.19 63 54. 91. 91. 124. 173. 0. 165. 94. 65. 134 132 110.20 64 112. 137. 139. 185. 250. 176. 193. 0. 126 211. 193. 166.
21 71 44. 70. 513. 101. 0. 103. 63. 0. 120. 102. 63. 110.22 72 45 48. 119. 32. 176. 121. 0 0. 52. 83. 0 59.23 73 39. 37 41 58. 133. 56. 204. 334 39. 72. 280. 9424 74 54 74. 58. 64. 51. 0. 28. 0. 59. 60. 28 58.25 81 83. 93 122. 123. 243. 92. 101. 0. 94. 125. 101 103.
26 82 90 102. 93. 149. 0. 331. 133. 0. 93. 195. 133. 124
27 TOTAL 55. 63. 75. 82. 97 114. 140. 172. 60. 91 158. 116.
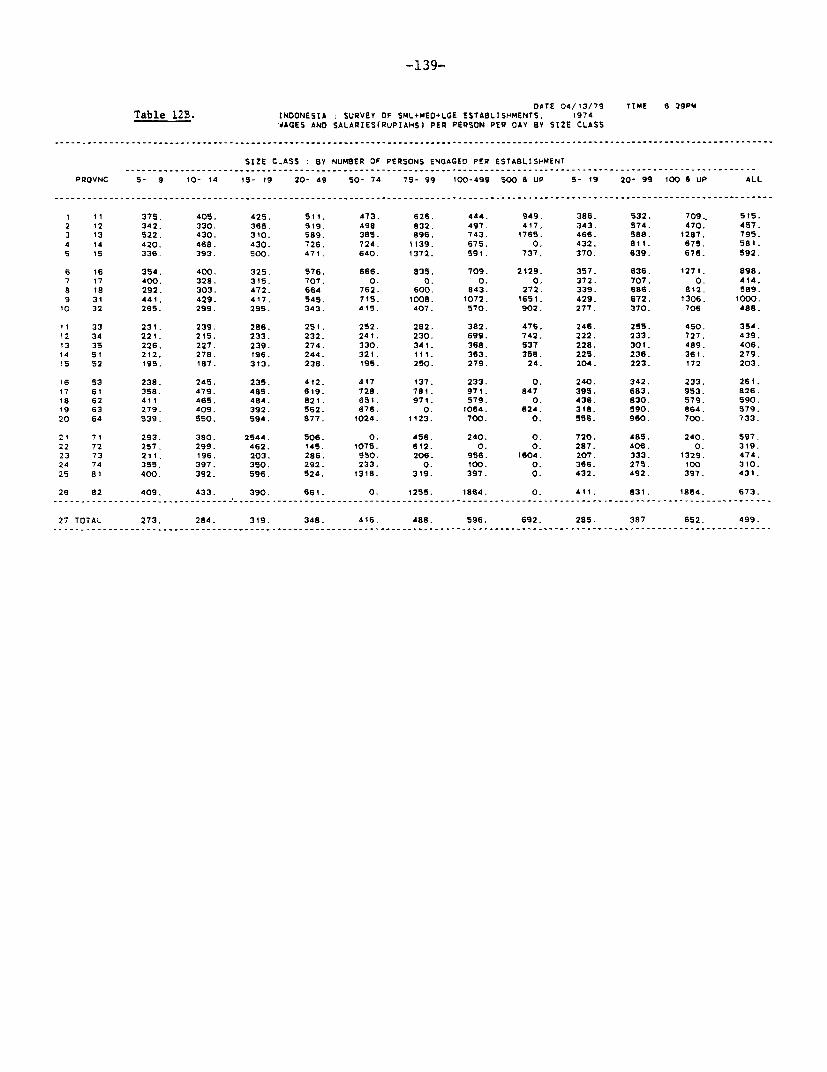
-139-
DATE 04/13/79 TIME 6 39PMTable 12B. INDONESIA : SURVEY OF SML+MED+LGE ESTABLISHMENTS 1974dAGES AND SALARIES(RUPIAHS) PER PERSON PER DAY BY S12E CLASS
SIZE CLASS : BY NUMBER OF PERSONS ENGAGED PER ESTABLISHMENT
PROVNC 5- 9 10- 14 15- 19 20- 49 50- 74 75- 99 100-499 500 & UP 5- 19 20- 99 100 & UP ALL
I 11 375. 405. 425. 511. 473. 626. 444. 949. 386. 532. 709.. 515.2 12 342. 330. 365. 519. 498 832. 497. 417. 343. 574. 470. 457.3 13 522. 430. 310. 589. 385. 896. 743. 1765. 466. 588. 1287. 795.4 14 420. 468. 430. 726. 724. 1139. 675. 0. 432. 811. 675. 581.5 15 336. 393. 500. 471. 640. 1372. 591. 737. 370. 639. 676. 592.
6 16 354. 400. 325. 576. 666. 835. 709. 2129. 357. 636. 1271. 898.7 17 400. 328. 315. 707. 0. 0. 0. O. 372. 707. 0. 414.8 18 292. 303. 472. 664 762. 600. 843. 272. 339. 686. 812. 589.9 31 441. 429. 417. 545. 715. 1008. 1072. 1651. 429. 672. 1306. 1000.10 32 265. 299. 295. 343. 415. 407. 570. 902. 277. 370. 706 488.
II 33 231. 239. 286. 251. 252. 282. 382. 476. 246. 255. 450. 354.12 34 221. 215. 233. 232. 241. 230. 699. 742. 222. 233. 727. 439.13 35 226. 227. 239. 274. 330. 341. 368. 537 228. 301. 489. 406.14 51 212. 278. 196. 244. 321. 111. 363. 358. 225. 236. 361. 279.Is 52 195. 187. 313. 238. 195. 250. 279. 24. 204. 223. 172 203.
16 53 238. 245. 235. 412. 417 137. 233. 0. 240. 342. 233. 261.17 61 358. 479. 485. 619. 728. 781. 971. 847 395. 683. 953. 826.18 62 411 465. 484. 821. 651. 971. 579. 0. 436. 830. 579. 590.19 63 279. 409. 392. 562. 676. 0. 1064. 624. 316. 590. 864. 579.20 64 539. 550. 594. 877. 1024. 1123. 700. 0. 556. 960. 700. 733.
21 71 293. 380. 2544. 506. 0. 456. 240. 0. 720. 485. 240. 597.22 72 257. 299. 462. 145. 1075. 612. 0. 0. 287. 406. 0. 319.23 73 211. 196. 203. 286. 550. 206. 956. 1604. 207. 333. 1329. 474.24 74 355. 397. 350. 292. 233. 0. 100. 0. 366. 275. 100 310.25 81 400. 392. 596. 524. 1318. 319. 397. 0. 432. 492. 397. 431.
26 82 409. 433. 390. 661. 0. 1255. 1864. 0. 411. 831. 1864. 673.
27 TOTAL 273. 284. 319. 348. 416. 488. 596. 692. 285. 387 652. 499.------- ----- ---------- ------------ ------ --- - ---------- ----_ ------_ _ - ---_ _ --_ _ -- --------- - -_ --_ ---_ _ ---_ --------- --------- ------ -
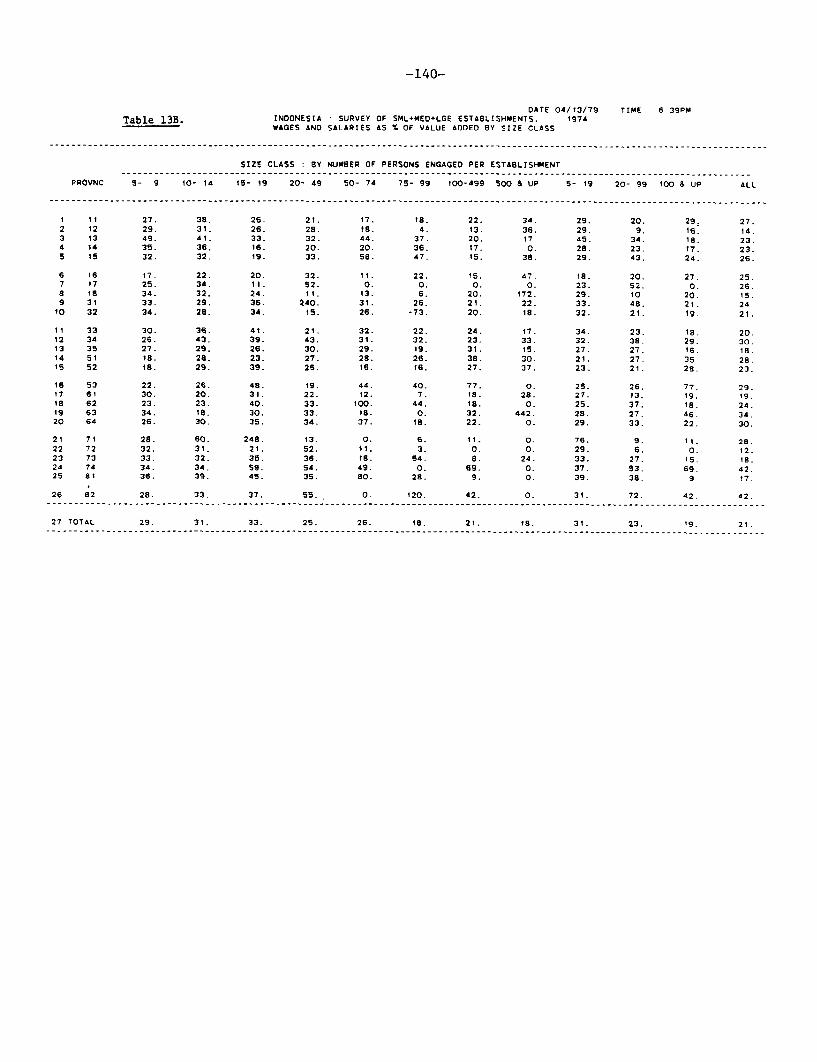
-140-
DATE 04/13/79 TIME 6 39PMTable 13B. INDONESIA * SURVEY OF SML-MED+LGE ESTABLISHMENTS. 1974
WAGES AND SALARIES AS % OF VALUE ADDED BY SIZE CLASS
SIZE CLASS : BY NUMBER OF PERSONS ENGAGED PER ESTABLISHMENT
PROVNC 5- 9 10- 14 15- 19 20- 49 50- 74 75- 99 100-499 500 S UP 5- 19 20- 99 100 & UP ALL
1 11 27. 38. 26. 21. 17. la. 22. 34. 29. 20. 29. 27.2 12 29. 31. 26. 28. 18. 4. 13. 36. 29. 9. 16. 14.3 13 49. 41. 33. 32. 44. 37. 20. 17 45. 34. 18. 23.4 14 35. 36. 16. 20. 20. 36. 17. 0. 28. 23. 17. 23.5 15 32. 32. 19. 33. 58. 47. 15. 38. 29. 43. 24. 26.
6 16 17. 22. 20. 32. 11. 22. i5. 47. 18. 20. 27. 25.7 t7 25. 34. 11. 52. 0. 0. 0. 0. 23. 52. 0. 26.8 18 34. 32. 24. II. 13. 6. 20. 172. 29. 10 20. 15.9 31 33. 29. 36. 240. 31. 26. 21. 22. 33. 48. 21. 2410 32 34. 28. 34. 15. 26. -73. 20. 18. 32. 21. 19. 21.
II 33 30. 36. 41. 21. 32. 22. 24. 17. 34. 23. 18. 20.12 34 26. 43. 39. 43. 31. 32. 23. 33. 32. 38. 29. 30.13 35 27. 29. 26. 30. 29. 19. 31. 15. 27. 27. 16. 18.14 51 18. 28. 23. 27. 28. 26. 38. 30. 21. 27. 35 28.i5 52 la. 29. 39. 26. 16. 16. 27. 37. 23_ 21. 28. 23.
16 53 22. 26. 48. 19. 44. 40. 77. 0. 25. 26. 77. 29.17 61 30. 20. 31. 22. 12. 7. 18. 28. 27. 13. 19. 19.18 62 23. 23. 40. 33. 100. 44. 18. 0. 25. 37. 18. 24.19 63 34. 18. 30. 33. la. 0. 32. 442. 28. 27. 46. 34.20 64 26. 30. 35. 34. 37. 18. 22. 0. 29. 33. 22. 30.
21 71 28. 60. 248. 13. 0. 6. II. 0. 76. 9. 1I. 28.22 72 32. 31. 21. 52. 11. 3. 0. 0. 29. 6. 0. 12.23 73 33. 32. 35. 36. 18. 54. 8. 24. 33. 27. tS. 18.24 74 34. 34. 59. 54. 49. 0. 69. 0. 37. 53. 69. 42.25 81 36. 39. 45. 35. 80. 28. 9. 0. 39. 38. 9 17.
26 82 28. 33. 37. 55. 0. 120. 42. 0. 31. 72. 42. 42.
27 TOTAL 29. 31. 33. 25. 26. 18. 21. 18. 31. 23. 19. 21.------- -------- ------ -- ------------ ----------- - -------- --------- ---- ------------ -------------- ----------- ---------- ------- ------ -

-141-
DATE 04/13/79 TIME 5839PMTable 14B. INDONESIA : SURVEY OF SML+MED+LGE ESTABLISHMENTS. 1974
NUMBER OF ESTABLISHMENTS AND THEIR PERCENT OtSTRIBUTION BY SIZE CLASS
SIZE CLASS : BY NUMBER OF PERSONS ENGAGED PER ESTABLISHMENT
PROVNC 5- 9 10- 14 tS- 19 20- 49 50- 74 75- 99 100-499 500 a UP 5- 19 20- 99 100 & UP ALL
I 11 8t.92 9.18 3.87 3.44 0.43 0.43 0.57 0.14 94.98 4.30 0.72 697.2 12 67.58 13.42 5.64 8.01 1.83 0.89 2.37 0.27 86.63 10.73 2.64 2236.3 13 84.18 8.30 3.03 3.11 0.43 0.17 0.69 0.09 95.51 3.72 0 78 1157.4 14 74.63 11.21 6.64 4.13 1.18 0.59 1.62 0.00 92.48 5.90 1.62 678.5 15 79.29 9.29 3.33 4.76 1.19 0.24 1.19 0.71 91.90 6.19 1.90 420.
6 16 87.68 5.32 2.66 2.09 0.52 0.16 1.36 0.21 95.67 2.77 1.57 1916.7 17 80.70 10.53 5.26 3.51 0.00 0.00 0.00 0.00 96.49 3.51 0 00 114.8 18 68.53 9.85 7.92 7.53 2.70 0.97 2.32 0.19 86.29 11.20 2.51 SI8.9 31 42.90 14.59 11.55 17.35 3.88 2.10 6.61 1.01 69.03 23.34 7 63 2858.10 32 70.81 9.06 5.13 10.06 1.81 0.82 2.03 0.28 85.01 12.69 2.31 11131.
11 33 60.24 15.00 8.15 11.58 2.03 0.79 1.62 0.60 83.38 14.40 2.22 10243.12 34 61.67 18.22 7.41 8.91 1.18 0.71 1.50 0.39 87.30 10.80 1.89 1268.13 35 65.99 12.07 5.23 10.07 2.19 1.15 2.43 0.87 83.29 13.41 3.30 10812.14 51 65.74 15.18 9.47 5.99 1.11 0.56 1.67 0.28 90.39 7.66 1.95 718.15 52 69.48 t4.01 3.07 9.60 1.92 0.58 1.1S 0.19 86.56 12.09 1 34 521.
16 53 66.53 19.92 7.97 3.59 0.80 0.40 0.80 0.00 94.42 4,78 0.80 251.17 61 80.68 5.25 2.81 4.69 1.69 0.56 3.94 0.38 88.74 6.94 4.32 533.l8 62 70.20 13.13 4.04 9.09 1.01 0.51 2.02 0.00 87.37 10.61 2.02 198.19 63 74.58 6.78 4.90 10.36 1.51 0.00 1.32 0.56 86.25 11.86 1.88 531.20 64 58.43 17.47 9.64 9.64 3.61 0.60 0.60 0.00 85.54 13.86 0.60 166.
21 71 77.78 12.89 5.33 2.67 0.00 0.67 0.67 0.00 96.00 3.33 0.67 450.22 72 87.46 6.81 2.51 2.51 0.36 0.36 0.00 0 00 96.77 3.23 0 00 279.23 73 83.92 7.79 3.51 3.63 0.45 O.16 0.41 0.12 95.23 4 24 0.53 2451.24 74 73.56 13.35 4.97 6.54 1.31 0.00 0.26 0.00 91.88 7.85 0.26 382.25 81 59.63 22.94 8.26 3.67 0.92 1.83 2.75 0.00 90.83 6.42 2.75 109.
26 82 66.15 15.38 8.46 7.69 0.00 0.77 1.54 0.00 90.00 8.46 1.54 130.
27 TOTAL 67.69 11.73 6.04 9.33 1.81 0.84 2.08 0.49 85.45 11.99 2.56 50767._________- -_ _ _ _ _ ________________- -. _ _ _ _ _ __ __ __ __ __ _______________________________- -- ----.....- ------- --.......- ------- ------------- --...........-..I ----- -------- --_._____-__-____- _ -__-_
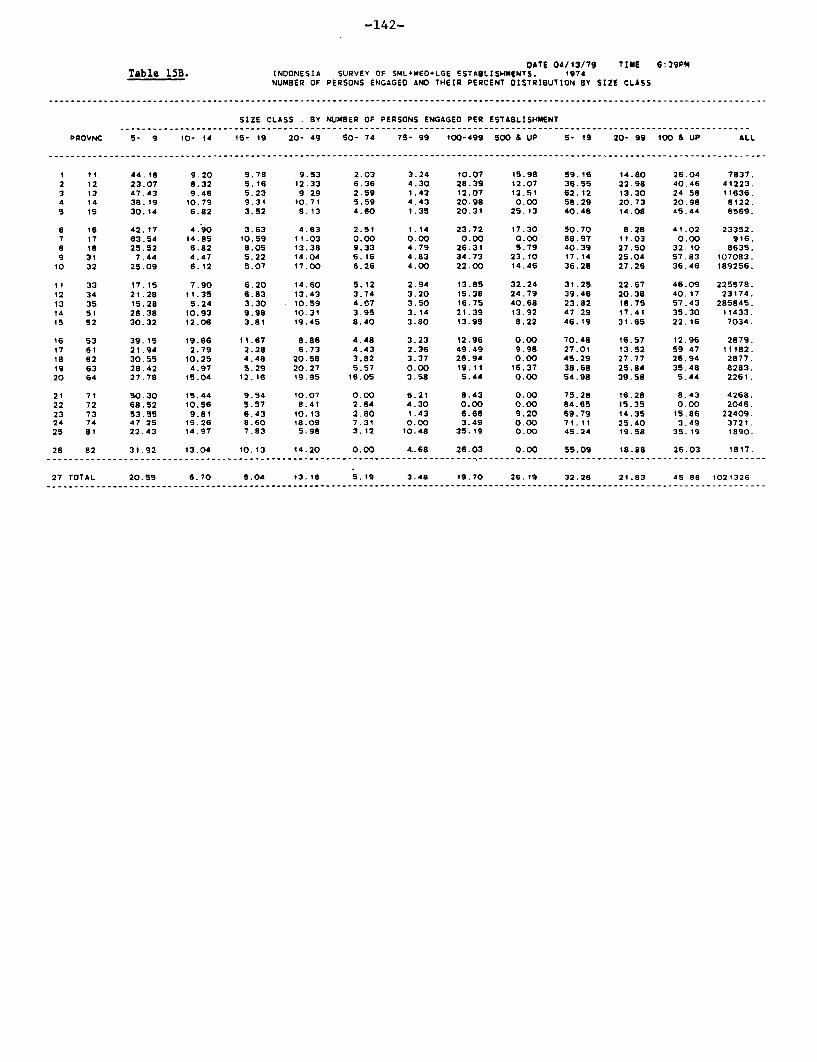
-142-
OATS 04/13/79 TIME 6:39PMTable 15B. INOONESIA SURVEY OF SML-MED-LGE ESTASLISHMgNTS. 1974
NUMBER OF PERSONS ENGAGED AND THEIR PERCENT DISTRIBUTION BY SIZ CLASS
---- _------------------------_------------------------_-----------__---------__--------------- -------------------------------------
SIZE CLASS .BY NUMBER OF PERSONS ENGAGED PER ESTABLISHMENT
PROVNC 5- 9 10- 14 15- 19 20- 49 SO- 74 75- 99 100-499 500 B UP 5- 19 20- 99 100 & UP ALL
1 11 44.18 9.20 5.78 9.53 2.03 3.24 t0.07 *5.98 59.16 14.80 26.04 7837.2 12 23.07 8.32 5.16 12.33 6.36 4.30 28.39 12.07 36.55 22.98 40.46 41223.3 13 47.43 9.46 5.23 9 29 2.59 1.43 12.07 12.51 62.12 13.30 24 58 1i636.4 14 38.19 10.79 9.31 10.71 5.59 4.43 20.98 0.00 58.29 20.73 20.98 8122.S 15 30.14 6.82 3.52 8.13 4.60 1.35 20.31 25.13 40.48 14.08 45.44 6569.
6 16 42.17 4.90 3.63 4.63 2.51 1.14 23.72 17.30 50.70 8.28 41.02 23352.7 17 63.54 14.85 10.59 11.03 0.00 0.00 0.00 0.00 88.97 11.03 0.00 916.8 l8 25.52 6.82 8.05 13.38 9.33 4.79 26.31 5.79 40.39 27.50 32.10 8635.9 31 7.44 4.47 5.22 14.04 6.16 4.83 34.73 23.10 17.14 25.04 57.83 ¶07083.
¶0 32 25.09 6.12 5.07 17.00 6.26 4.00 22.00 14.46 36.28 27.26 36.46 189256.
II 33 17.15 7.90 6.20 14.60 5.12 2.94 13.85 32.24 31.25 22.67 46.09 225578.12 34 21.28 11.35 6.83 13.43 3.74 3.20 15.38 24.79 39.46 20.38 40.17 23174.13 35 15.28 5.24 3.30 -10.59 4.07 3.50 16.75 40.68 23.82 18.75 57.43 285845.14 51 26.38 10.93 9.98 10.31 3.95 3.14 21.39 13.92 47 29 17.41 35.30 11433.15 52 30.32 12.06 3.81 19.45 8.40 3.80 13.95 8.22 46.19 31.65 22.16 7034.
16 53 39.15 19.66 11.67 8.86 4.48 3.23 12.96 0.00 70.48 16.57 12.96 2879.17 61 21.94 2.79 2.28 6.73 4.43 2.36 49.49 9.98 27.01 13.52 59 47 11182.18 62 30.55 10.25 4.48 20.58 3.82 3.37 26.94 0.00 45.29 27.77 26.94 2877.19 63 28.42 4.97 5.29 20.27 5.57 0.00 19.11 16.37 38.68 25.84 35.48 8283.20 64 27.78 15.04 12.16 19.95 16.05 3.58 5.44 0.00 54.98 39.58 5.44 2261.
21 71 50.30 15.44 9.54 10.07 0.00 6.21 8.43 0.00 75.28 16.28 8.43 4268.22 72 68.52 10.56 5.57 8.41 2.64 4.30 0.00 0.00 84.65 15.35 0.00 2046.23 73 53.55 9.81 6.43 10.13 2.80 1.43 6.66 9.20 69.79 14.35 15.86 22409.24 74 47 25 18.26 8.60 18.09 7.31 0.00 3.49 0.00 71.11 25.40 3.49 3721.25 81 22.43 14.97 7.83 5.98 3.12 10.48 35.19 0.00 45.24 *9.58 35.19 1890.
26 82 31.92 13.04 10.13 14.20 0.00 4.68 26.03 0.00 55.09 18.88 26.03 1817.
27 TOTAL 20.55 6.70 5.04 13.16 S.19 3.48 19.70 26.19 32.28 21.83 4S 88 1021326----- ----_ --------- ------- -- --------- -- --------- ---------- --------_ _ - -- ------_ _ -- --------------- ------------ -------- ------ --_ - -_ -- --

-143-
OATE 04/13/79 TIME 6:39PMTable 16B. INDONESIA * SURVEY OF SML+MED+LGE ESTABLISHMENTS. 1974
GROSS OUTPUT (ML.RUPIAHS) AND THEIR PERCENT DISTRIBUTION BY SIZE CLASS
SIZE CLASS : BY NUMBER OF PERSONS ENGAGED PER ESTABLISHMENT
PROVNC 5- 9 10- 149 20- 49 50- 74 75- 99 100-499 500 L UP 5- 19 20- 99 100 & UP ALL
1 11 36.09 4.34 4.24 11.53 3.05 8.98 17.29 14.47 44.67 23.56 31.76 7141.2 12 8.55 3.98 3.22 7.28 7.42 17.76 44.30 7.48 15.75 32.47 51.78 79771.3 13 10.15 3.41 2.24 7.39 3.32 7.33 28.20 37.96 15.80 18.04 66.16 20101.4 14 10.20 4.34 a.50 13.19 11.54 4.85 47.39 0.00 23.03 29.58 47.39 13383.5 15 3.02 0.95 1.87 1.76 0.97 0.97 42.51 47.95 5.84 3.70 90 46 19505.
6 16 11.01 1.81 1.68 2.48 3.97 0.99 54.19 23.86 14.51 7.44 78.06 48700.7 17 44.59 21.92 27.31 6.17 0.00 0.00 0.00 0.00 93.83 6.17 0.00 562.a 18 5.65 2.37 6.08 20.66 26.30 6.79 32.08 0.09 14.09 53.74 32 17 18861.9 31 1.62 1.31 1.41 5.63 3.31 4.24 37.98 44.50 4.33 13.18 82.48 301074.10 32 6.11 2.91 2.49 16.84 5.44 2.97 28,74 34.49 11.52 25.25 63.23 233286.
II 33 5.10 3.00 2.57 8.74 8.36 1.86 17.00 53.37 10.66 18.96 70.38 257725.12 34 7.44 3.96 3.95 6.39 2.99 1.42 38.52 35.32 15.35 10.80 73.85 2386613 35 4.42 2.26 2.00 6.35 3.32 3.90 13.61 64.13 8.68 13.57 77 75 334072.14 St 13.78 8.25 9.59 8.61 11.24 7.41 30.31 10.81 31.62 27.26 41.12 11318.16 52 12.60 8.01 3.55 19.63 26.46 13.26 16.16 0.34 24.16 59.34 16.50 4457.
16 53 37.58 21.65 4.70 24.74 5.41 1.04 4 88 0.00 63.93 31.19 4 88 1121.17 61 3.91 1.53 0.96 7.48 5.65 6.07 69.55 4.85 6.40 19.20 74.40 28817.Is 62 11.55 8.07 1.76 18.78 0.37 8.48 50.99 0.00 21.38 27.63 50.99 3684.19 63 8.64 3.52 5.02 29.78 14.83 0.00 29.95 8.26 17.17 44.61 38.22 7580.20 64 15.74 11.70 8.88 16.08 28.49 7.01 13.41 0.00 36.02 50.57 13.41 2978.
21 71 11.56 4.80 3.53 18.95 0.00 53.79 7.35 0.00 19.91 72.74 7.35 4440.22 72 9.94 3.78 3.65 0.79 18.56 63.28 0.00 0.00 17.37 82.63 0 00 1829.23 73 9.09 2.61 1.79 6.00 6.03 0.40 50.51 23.57 13.48 12.43 74 08 2313124 74 39.07 24.20 7.40 20.49 6.65 0.00 2.18 0.00 70.67 27.14 2.18 537.25 81 3.92 2.54 1.66 3.32 0.85 13.88 73.82 0.00 8.12 18.06 73.a2 4280.
26 82 36.14 11.11 7.25 9.80 0.00 3.57 32.13 0.00 54:49 13.37 32.13 1008.
27 TOTAL 5.34 2.58 2.36 8.75 5.46 4.46 28.45 42.60 10.28 18.67 71.05 1453225.-- ------ --------- -------- ------------ -- -_. ------ -----------_ - -_ _ - ---------- -- ---------- ------------ ---- ------- ---------- -------- ---

-144-
DATE 04/13/79 TIME 6.39PM
Table 17B. INDONESIA : SURVEY OF SML+MED+LGE ESTABLISHMENTS. I974VALUE ADDED (ML.RUPIAHS) AND THEIR PERCENT DISTRIBUTION mY SIZE CLASS
SIZE CLASS *SY NUMBER OF PERSONS ENGAGED PER ESTABLISHMENT
PROVNC S- 9 10- 14 15- 19 20- 49 50- 74 75- 99 100-499 500 & UP 5- 19 20- 99 100 5 UP ALL
1 11 25.34 4.39 4.88 15.33 3.41 7.67 15.27 23.70 34.61 26.42 38.97 2409.
2 12 6.27 2.57 2.31 7.11 5.45 33.14 37.43 5.72 11.15 45.70 43.15 29482.
3 13 8.34 3.17 1.95 6.51 0.80 1.44 19.10 58.67 13.47 8.76 77.78 7433.
4 14 14.40 5.67 10.65 16.23 9.56 5.94 37.55 0.00 30.72 31.73 37.55 3738.
5 15 7.84 2.91 4.01 4.64 2.23 2.18 45.46 30.72 14.76 9.05 76.18 2995.
6 16 14.33 2.42 1.85 2.86 4.67 1.36 44.49 28.00 18.61 8.90 72.49 14979.
7 17 56.16 12.00 21.01 10.83 0.00 0.00 0.00 0.00 89.17 10.83 0.00 240.
a 18 5.01 1.78 4.97 20.63 17.14 18.09 32.32 0.07 11.76 55.86 32.39 5590.9 31 1.93 1.59 1.50 0.84 3.57 4.73 42.87 42.96 5.02 9.15 85.83 97112.
10 32 5.42 2.45 1.87 18.65 5.05 -1.12 30.08 37.61 9.74 22.57 67.69 94260.
II 33 5.52 2.58 2.31 10.22 2.33 2.34 13.53 61.16 10.42 14.90 74.68 88333.
12 34 8.97 3.68 3.28 6.04 2.45 1.67 32.01 41.89 15.94 10.16 73.90 7571.
13 35 3.89 1.58 1.41 4.06 2.27 2.77 9.55 74.47 6.87 9.10 84.02 141507.
14 51 25.00 10.36 8.46 10.00 5.21 1.65 22.76 16.57 43.82 16.86 39.33 2624.15 52 27.94 10.09 3.74 18.92 16.94 4.94 16.67 0.76 41.77 40.80 17.43 1114.
16 53 35.75 18.59 5.23 22.75 8.04 2.29 7.34 0.00 59.58 33.08 7.34 431.17 61 3.15 1.35 0.83 4.03 5.30 5.89 72.28 7.16 5.33 15.22 79.45 10297.18 62 16.66 8.64 2.72 19.24 0.73 4.28 47.72 0.00 28.03 24.25 47.72 1235.
19 63 11.84 7.00 4.49 24.97 17.51 0.00 33.01 1.18 23.33 42.48 34.19 2456.
20 64 18.56 12.92 8.91 21.09 21.82 7.19 9.51 0.00 40.39 50.09 9.51 1134.
21 71 17.43 4.90 5.43 24.58 0.00 32.99 14.67 0.00 27.76 57.57 14.67 1362.22 72 16.54 3.91 7.07 1.63 13.35 57.49 0.00 0.00 27.52 72.48 0.00 618.23 73 10.15 2.39 1.65 3.92 5.01 0.37 44.06 32.45 14.19 9.30 76.51 8923.
24 74 40.35 22.53 7.45 20.83 7.44 0.00 1.41 0.00 70.33 28.27 1 41 370.
25 S1 7 38 5.52 3.54 3.68 1.76 6.30 71.83 0.00 16.44 11.74 71.83 1023.
26 82 31 07 12.98 8.70 13 27 0.00 4.61 29.37 0.00 52.7S 17.88 29.37 507
27 TOTAL 5.35 2 29 2.00 7.94 3.73 4.35 25.90 48.43 9.64 16.02 74.34 527742.…-- - ------- --------- --------- ------------ ----------- -----------__ ------------__ - -------- ----- ----- _ _ _ _ _ . _ _ _ _ _ _ _ _ _ _ _ _ _ _ _ __________-__
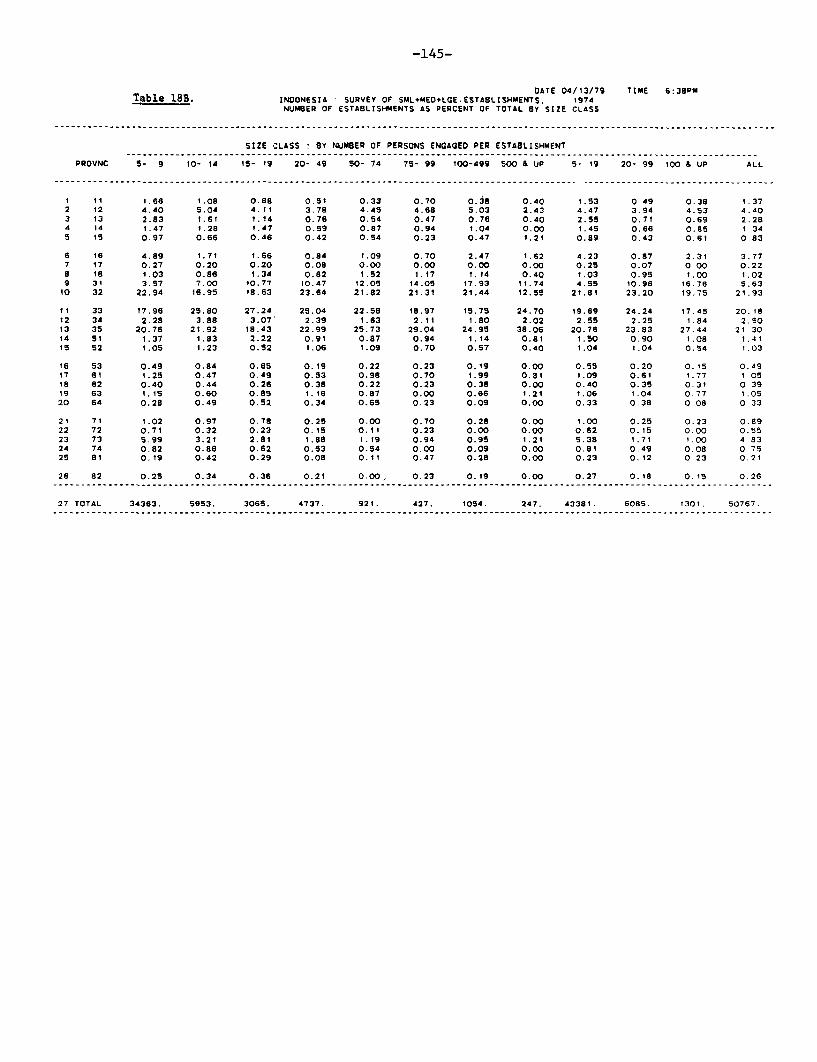
-145-
DATE 04/13/79 TIME 6:38PMTable 18B. INDONESIA * SURVEY OF SML+MED+LGE.ESTABLISHMENTS. 1974
NUMBER OF ESTABLISHMENTS AS PERCENT OF TOTAL 8Y SIZE CLASS
SIZE CLASS : BY NUMBER OF PERSONS ENGAGED PER ESTABLISHMENT
PROVNC S- 9 10- 14 15- 19 20- 49 50- 74 75- 99 100-499 500 & UP 5- 19 20- 99 100 & UP ALL
I 11 1.66 1.08 0.88 0.51 0.33 0.70 OAS 0.40 1.53 0 49 0.38 1.372 12 4.40 5.04 4.11 3.78 4.45 4.68 5.03 2.43 4.47 3.94 4.53 4.A03 13 2.83 1.61 1.14 0.76 0.54 0.47 0.76 0.40 2.55 0.71 0.69 2.284 14 1.47 1.28 1.47 0.59 0.87 0.94 1.04 0.00 1.45 0.66 0.85 1 345 15 0.97 0.66 0.46 0.42 0.54 0.23 0.47 1.21 0.89 0.43 0.61 0 83
6 16 4.89 1.71 1.66 0.84 1.09 0.70 2.47 1.62 4.23 0.87 2.31 3.777 17 0.27 0.20 0.20 0.08 0.00 0.00 0.00 0.00 0.25 0.07 0 00 0.228 Is 1.03 0.86 1.34 0.82 1.52 1.17 1.14 0.40 1.03 0.95 1.00 1.029 31 3.57 7.00 10.77 10.47 12.05 14.05 17.93 11.74 4.55 10.96 16.76 5.6310 32 22.94 16.95 18.63 23.64 21.82 21.31 21.44 12.55 21.81 23.20 19.75 21.93
11 33 17.96 25.80 27.24 25.04 22.58 18.97 t5.75 24.70 19.69 24.24 17.45 20.1812 34 2.28 3.88 3.07 2.39 1.63 2.11 1.80 2.02 2.55 2.25 1.84 2.5013 35 20.76 21.92 18.43 22.99 25.73 29.04 24.95 38.06 20.76 23.83 27.44 21 3014 SI 1.37 1.83 2.22 0.91 0.87 0.94 1.14 0.81 1.50 0.90 1.08 1.4115 52 1.05 1.23 0.52 1.06 1.09 0.70 0.57 0.40 1.04 1.04 0.54 1.03
16 53 0.49 0.84 0.65 0.19 0.22 0.23 0.19 0.00 0.55 0.20 0.15 0.4917 61 1.25 0.47 0.49 0.53 0.98 0.70 1.99 0.81 1.09 0.61 1.77 i 0518 62 0.40 0.44 0.26 0.38 0.22 0.23 0.38 0.00 0.40 0.35 0.31 0 3919 63 1.1S 0.60 0.85 1.16 0.87 0.00 0.66 1.21 1.06 1.04 0.77 1.0520 64 0.28 0.49 0.52 0.34 0.65 0.23 0.09 0.00 0.33 0.38 0.08 0.33
21 71 1.02 0.97 0.78 0.2S 0.00 0.70 0.28 0.00 1.00 0.25 0.23 0.8922 72 0.71 0.32 0.23 0.15 0.11 0.23 0.00 0.00 0.62 0.15 0.00 0.5523 73 5.99 3.21 2.81 1.88 1.19 0.94 0.95 1.21 5.38 1.71 1.00 4 8324 74 0.82 0.86 0.62 O.S3 0.54 0.00 0.09 0.00 0.81 0.49 0.08 0 7525 81 0.19 0.42 0.29 0.08 0.11 0.47 0.28 0.00 0.23 0.12 0 23 0.21
26 82 0.25 0.34 0.36 0.21 0.00. 0.23 0.19 0.00 0.27 0.18 0.15 0.26
27 TOTAL 34363. 5953. 3065. 4737. 921. 427. 1054. 247. 43381. 6085. 1301. 50767.______- -- -- ----- ------------ -------- -- -------- ------------- ------------- -- -------- --------------- ---------- ------- ------- ------__________________ ______ ____
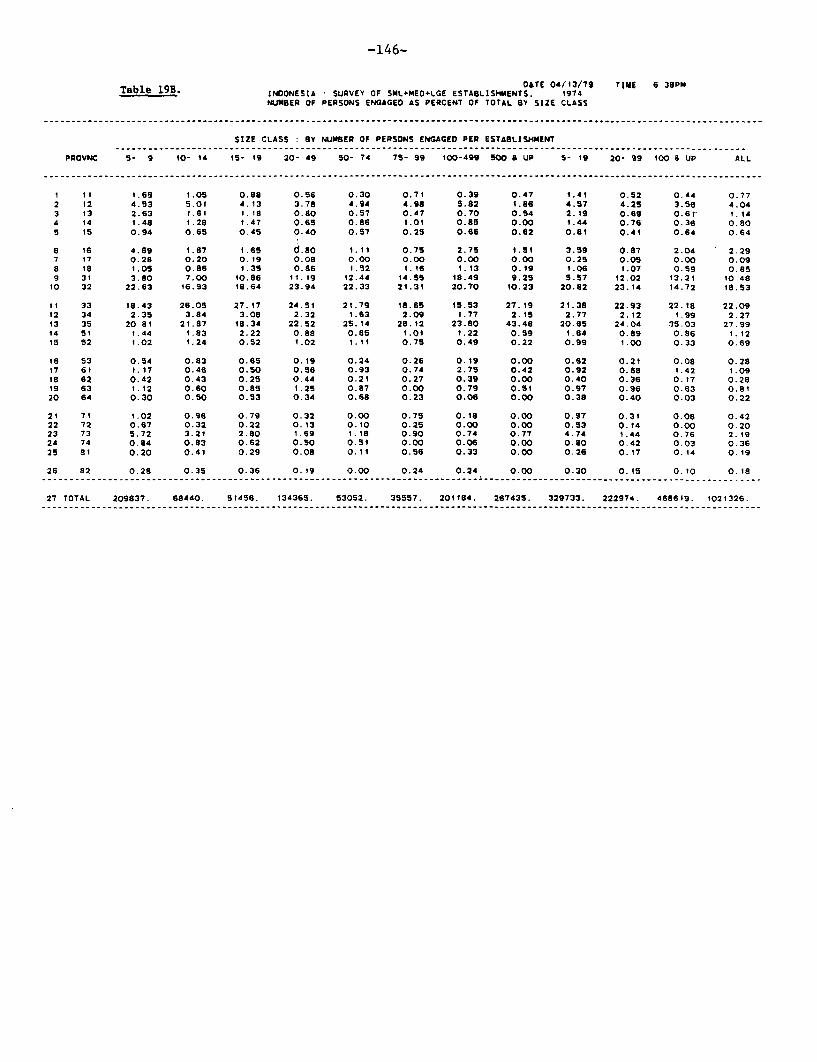
-146-
OATE 04/13/79 TIME 6 36PmTable 19B. INDONEStA SURVEY OF SML+MEO+LGE ESTABLISH4MENTS, 1974NUMBER OF PERSONS ENGAGED AS PERCENT OF TOTAL BY SIZE CLASS
SIZE CLASS: BY NUMBER OF PERSONS ENGAGED PER ESTABLISHMENT_________________________________--_________________________________--________-________________---_____--_____--_____
PROVNC Y- 9 10- 14 15- 19 20- 49 50- 74 75- 99 100-499 500 & UP 5- 19 20- 99 100 i UP ALL
I II 1.69 1.05 0.88 0.56 0.30 0.71 0.39 0.47 1.41 0.52 0.44 0.772 12 4.53 5.01 4.13 3.78 4.94 4.98 5.82 1.86 4.57 4.25 3.56 4.043 13 2.63 1.61 1.18 0.80 0.57 0.47 0.70 0.54 2.19 0.69 0.61- 1.144 14 1.48 1.28 1.47 0.65 0.86 1.01 0.85 0.00 1.44 0.76 0.36 0.805 Is 0.94 0.65 0.45 0.40 0.57 0.25 0.66 0.62 0.81 0.41 0.64 0.64
6 16 4.69 1.67 1.65 d.0o 1.11 0.75 2.75 1.51 3.59 0.87 2.04 ' 2.297 17 0.28 0.20 0.19 0.08 0.00 0.00 0.00 0.00 0.25 0.05 0.00 0.098 la 1.05 0.86 1.35 0.86 1.52 1.16 1.13 0.19 1.06 1.07 0.59 0.859 31 3.80 7.00 10.86 11.19 12.44 14.55 18.49 9.25 5.57 12.02 13.21 10 48
10 32 22.63 16.93 18.64 23.94 22.33 21.31 20.70 10.23 20.82 23.14 14.72 18.53
Ii 33 i8.43 26.05 27.17 24.51 2t.79 18.65 15.53 27.19 21.38 22.93 22.18 22.09t2 34 2.35 3.84 3.08 2.32 1.63 2.09 t.77 2.15 2.77 2.12 1.99 2.2713 35 20 81 21.87 18.34 22.52 25.14 28.12 23.80 43.48 20.65 24.04 35.03 27.9914 51 1.44 1.83 2.22 0.88 0.85 1.01 1.22 O.S9 1.64 0.89 0.86 1.1215 52 1.02 1.24 0.52 1.02 1.11 0.75 0.49 0.22 0.99 1.00 0.33 0.69
16 53 0.54 0.83 0.65 0.19 0.24 0.26 0.19 0.00 0.62 0.21 0.08 0.2817 6t t.17 0.46 0.50 0.56 0.93 0.74 2.75 0.42 0.92 0.68 1.42 1.0918 62 0.42 0.43 0.25 0.44 0.21 0.27 0.39 0.00 0.40 0.36 0.17 0.2819 63 1.12 0.60 0.85 1.25 0.87 0.00 0.79 0.51 0.97 0.96 0.63 0.8120 64 0.30 0.50 0.53 0.34 0.68 0.23 0.06 0.00 0.38 0.40 0.03 0.22
21 71 1.02 0.96 0.79 0.32 0.00 0.75 0.18 0.00 0.97 0.31 0.08 0.4222 72 0.67 0.32 0.22 0.13 0.10 0.25 0.00 0.00 0.53 0.14 0.00 0.2023 73 5.72 3.21 2.80 1.69 1.18 0.90 0.74 0.77 4.74 1.44 0.76 2.1924 74 0.84 0.83 0.62 0.50 0.51 0.00 0.06 0.00 0.80 0.42 0.03 0.3625 SI 0.20 0.41 0.29 0.08 0.11 0.56 0.33 0.00 0.26 0.17 0.14 0.19
26 82 0.28 0.35 0.36 0.19 0.00 0.24 0.24 0.00 0.30 O.15 0.10 0.18
27 TOTAL 209837. 68440. 51456. 134365. 53052. 35557. 201184. 267435. 329733. 222974. 468619. 1021326.--- ----- -------- -- ---- _ -- --------- -- ---------- -----------_ ----------- ------------ --------- -- ------------ -- -------- ------- -------- --
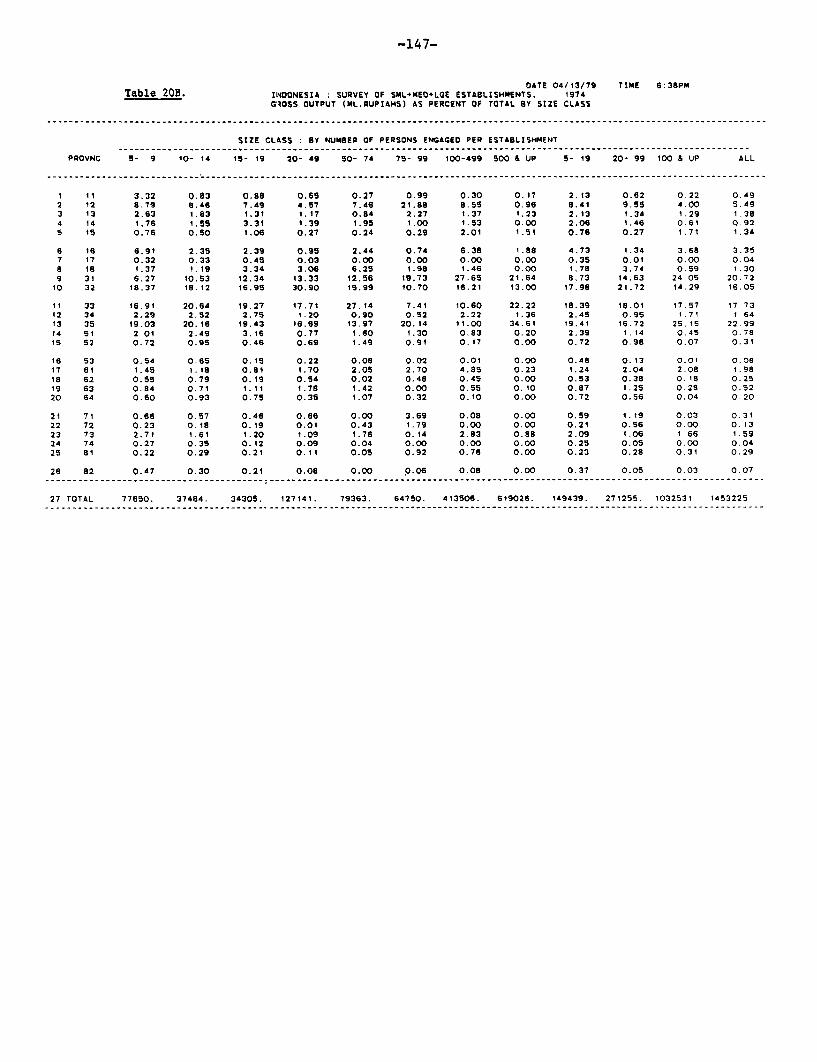
-147-
DATE 04/t3/79 TIME 6:38PMTable 20B. 1IOONESIA : SURVEY OF SML+MEO+LGE ESTABLISHMENTS. 1974
GROSS OUTPUT (ML.RUPIAHS) AS PERCENT OF TOTAL BY SIZE CLASS
SIZE CLASS : BY NUMBER OF PERSONS ENGAGED PER ESTA4LISHMENT
PROVNC 5- 9 10- 14 15- 19 20- 49 50- 74 75- 99 100-499 SOO & UP 5- 19 20- 99 100 B UP ALL
I tt 3.32 0.83 0.88 0.68 0.27 0.99 0.30 0.17 2.13 0.62 0.22 0.492 12 8.79 8.46 7.49 4.57 7.46 21.88 8.55 0.96 8.41 9.55 4.00 5.493 13 2.63 1.83 1.31 1.17 0.84 2.27 t.37 1.23 2.13 1.34 1.29 1.384 14 1.76 1.55 3.31 1.39 1.95 1.00 1.53 0.00 2.06 1.46 0.61 0.925 I5 0.76 0.50 1.06 0.27 0.24 0.29 2.01 1.51 0.76 0.27 1.71 1.34
a I6 6.91 2.35 2.39 0.95 2.44 0.74 6.38 1.88 4.73 1.34 3.68 3.357 17 0.32 0.33 0.45 0.03 0.00 0.00 0.00 0.00 0.35 0.01 0.00 0.048 18 1.37 1.19 3.34 3.06 6.25 1.98 1.46 0.00 1.78 3.74 0.59 1.309 31 6.27 10.53 12.34 13.33 12.56 19.73 27.65 21.64 8,73 14.63 24 05 20.721O 32 18.37 18.12 16.95 30.90 ¶s.99 10.70 16.21 13.00 17.98 21.72 14.29 16.05
11 33 16.9t 20.64 19.27 17.71 27.14 7.41 10.60 22.22 18.39 18.01 17.57 17 7312 34 2.29 2.52 2.75 1.20 0.90 0.52 2.22 1.36 2.4S 0.95 1.71 1 6413 35 19.03 20.16 19.43 16.69 13.97 20.14 11.00 34.61 19.41 16.72 25.1S 22.9914 51 2 01 2.49 3.16 0.77 1.60 1.30 0.83 0.20 2.39 1.14 0.45 0.7815 52 0.72 0.95 0.46 0.69 1.49 0.91 0.17 0.00 0.72 0.98 0.07 0.31
16 53 0.54 0.65 0.15 0.22 0.08 0.02 0.01 0.00 0.48 0.13 0.01 0.0817 61 1.45 1.18 0.81 1.70 2.05 2.70 4.85 0.23 1.24 2.04 2.08 1.98is 62 0.55 0.79 0.19 0.54 0.02 0.48 0.45 0.00 0.53 0.38 0.18 0.2519 63 0.84 0.71 1.11 1.78 1.42 0.00 0.55 0.10 0.87 1.25 0.28 0.5220 64 0.60 0.93 0.75 0.35 1.07 0.32 0.10 0.00 0.72 0.56 0.04 0.20
21 71 0.66 0.57 0.46 0.66 0.00 3.69 0.08 0.00 0.59 1.19 0.03 0.3122 72 0.23 0.18 0.19 0.01 0.43 1.79 0.00 0.00 0.21 0.56 0.00 0.1323 73 2.71 1.61 1.20 1.09 t.76 0.14 2.83 0.88 2.09 1.06 1 66 1.5924 74 0.27 0.35 0.12 0.09 0.04 0.00 0.00 0.00 0.25 0.OS 0.00 0.0425 81 0.22 0.29 0.21 0.11 0.05 0.92 0.76 0.00 0.23 0.28 0.31 0.29
26 82 0.47 0.30 0.21 0.08 0.00 0.06 0.08 0.00 0.37 0.05 0.03 0.07
27 TOTAL 77650. 37484. 34305. 127141. 79363. 64750. 413506. 619026. 149439. 271255. 1032531 1453225

-148-
OArE 04/13/79 TIME 6:38PM
Table 21B. INOONESIA SURVEY OF SML.MEO+LGE EST4ALISMMENTS. 1974
VALUE AOOED (ML.RUPIAHS) AS PERCENT OF TOTAL BY SIZE CLASS
SIZE CLASS : BY NUMSER OF PERSONS ENGAGED PER ESTA8LISHMENT
PROVNC 5- 9 0- t4 15- 19 20- *9 50- 74 7- 99 100-499 5005 UP 5- 19 20- 99 100 & UP ALL
I 11 2.16 0.68 III 0.88 0 42 0.80 0.27 0.22 1.64 0.75 0.24 0.46
2 12 6.35 6.28 6.46 S.00 8.17 42.5t 8.07 0.66 6.46 15.93 3.24 5.59
3 13 2.20 1.95 1.37 1.16 0.30 0.'7 1.04 1.71 t.97 0.77 i.47 1.41
4 14 1.91 1.75 3.77 1.45 1.81 0.97 1.03 0.00 2.26 1.40 0.36 0.71
5 15 0.83 0.72 1.14 0.33 0.34 0.28 1.00 0.36 0.87 0.32 0.58 0.57
6 I6 7.60 3.01 2.63 1.02 3.56 0.89 4.87 1.64 S.48 1.58 2.77 2.84
7 17 0.48 0.24 0.48 0.06 0.00 0.00 0.00 0.00 0.42 0.03 0.00 0.058 18 0.99 0.82 2.63 2.75 4.87 4.40 1.32 0.00 1.29 3.69 0.46 1.06
9 31 6.64 12.77 13.83 1.96 17.S1 20.00 30.45 16.32 9.59 1O.51 21.25 18.4010 32 18.08 19.1- 16.66 41.96 24.16 -4.60 20.74 13.87 18.04 25.16 16.26 17.86
11 33 17.28 ¶8.88 19.36 21.58 10.47 8.99 8.74 21.14 t1.09 1s.56 16.82 16.74
12 34 2.41 2.31 2.39 '.09 0.94 0.55 1.77 1.24 2.37 0.91 1 43 1.4313 35 19 49 18.51 18.85 13.72 16.35 17.03 9.89 41.23 19.12 15.23 30.31 26.81i4 S1i 2.32 2.25 2.10 0.63 0.69 0.19 0.44 0.17 2.26 0.52 0.26 0.50
ts 52 1.10 0.93 0.39 0.50 0.96 0.24 0.14 0.00 0.91 0.54 0.05 0 21
16 53 0.55 0.66 0.21 0.23 0.18 0.04 0.02 0.00 0.50 0.17 0.01 0.0817 61 1.15 1.15 0.81 0.99 2.77 2.64 5.44 0.29 1.08 1.8s 2.09 1.95la 62 0.73 0.8a 0.32 0.57 0.05 0.23 0.43 0.00 0.68 0.35 0 .1 0 2319 83 1.03 1.42 1.04 1.46 2.18 0.00 0.59 O.Ot 1.13 1.23 0.21 0 47
20 6- 0.75 1.21 0.96 O.S7 1726 0.35 0.08 0.00 0.90 0.67 0.03 0.21
21 71 0 84 0.55 0.70 0.80 0.00 1.96 0.15 0.00 0.74 0.93 0.05 0.2622 72 0.36 0.20 0.41 0.02 0.42 1.55 0.00 0.00 0.33 0.53 0.00 0.1223 73 3.21 1.77 1.40 0.83 2.27 0.15 2.88 1.13 2.49 0.98 1.74 1 69
24 74 0.53 0.69 0.26 0.18 0.14 0.00 0.00 0.00 0.51 0.12 0.00 0.07
25 81 0.27 0.47 0.34 0.09 0.09 0.28 0.54 0.00 0.33 0.14 0.19 0.19
26 82 0.56 0.54 0.42 0.16 0.00 0.t0 0.11 0.00 0.53 0.11 0.04 0.10
27 TOTAL 28235. .080. 10s60. 41892. 19686. 22983. 136711. 255595. 50875. 84561. 392306. 527742.