Report No. 2. Government Accession No. 3. … · The strut-and-tie method is suggested for design...
118
Technical Report Documentation Page 1. Report No. 2. Government Accession No. FHWA/TX-97IJ302-J 4. ntle and Subtitle BEHAVIOR OF REINFORCED CONCRETE PIER CAPS UNDER CONCENTRATED BEARING LOADS 7. Author(sl R. 1. Denio, 1. A. Yura, and M. E. Kreger 9. Performing Organization Nome and Address Center for Transportation Research The University of Texas at Austin 3. Recipient's Catalog No. 5. Report Dote February 1995 6. Performing Organization Code S. Performing Organization Report No. Research Report 1302-1 10. Work Unit No. (TRAIS) 11 . Contract or Grant No. Research Study 0-1302 3208 Red River, Suite 200 Austin, Texas 78705-2650 13. Type of Report and Period Covered 12. Sponsoring Agency Nome and Address Texas Department of Transportation Research and Technology Transfer Office p. O. Box 5080 Austin, Texas 78763-5080 15. Supplementary Noles Interim 14. Sponsoring Agency Code Study conducted in cooperation with the U.S. Department of Transportation, Federal Highway Administration Research Study Title: "Connections Between Steel Bent Caps and Concrete Piers" 16. Abstract At congested highway interchanges, the Texas Department of Transportation (TxDOT) uses narrow concrete piers and shallow depth steel cap girders. Research Project ()"1302 is concerned with the connection detail between these two elements. This report deals with the shear strength and reinforcement details at the top of the concrete pier in the vicinity of the bearings. Since no formal design procedure currently exists for determining the required amount and distribution of reinforcing steel in a pier cap, this research also had the purpose of providing design guidelines for the pier cap. To in'vestigate the behavior of the pier caps, six test specimens were constructed at a 30% scale. Five different reinforcing steel patterns were used in the six specimens to examine the contributions of different reinforcing types to the pier cap strength. Eleven static load tests were conducted to failure on the six pier caps. For all specimens, load on the pier cap was carried primarily by the action of a tied arch which transferred load from the base plates into the column. Overall, specimens that had a greater quantity of horizontal reinforcing steel and adequate development of horizontal reinforcing had a greater capacity. Three design methods were used to analyze the strength of the pier caps tested: (1) AASHTO (1992) Corbel Provisions; (2)ACI 318-89 Deep Beam Provisions; and (3) Strut-and-TIeMethod. The corbel and deep beam provisions were very conservative in predicting the capacity of the pier cap because they consider only concrete capacity in shear. On average, these two methods underestimated the pier strength by a factor of 3 to 4. Testing showed that the pier cap resisted loads through a tied arch, which is a much stronger load-carrying mechanism than concrete in shear. The strut-and-tie models used were much more accurate than conventional design methods in predicting the capacity of the pier caps because they model the compression arch action observed during testing. The strut-and-tie method is suggested for design because strut-and-tie analyses gave the best correlation with test results, modeled true behavior, and were still conservative. To detail the use of the strut-and-tie method, a design example using a proposed strut-and-tie model is presented. Also, recommendations are given for evaluating existing pier caps through field inspection. 17. Key Words 1 8. Distribution Statement concrete piers, steel cap girders, shear strength, strut-and-tie method, connection detail, reinforcement details, bearings, design procedure, reinforcing steel, behavior, capacity, conservative, corbel provisions, deep beam provisions, tied arch, base plates, column No restrictions. This document is available to the public through the National Technica1lnformation Service, 19. Security Classif. (of this report) Unclassified Form DOT F 1700.7 [8-721 Springfield, Virginia 22161. 20. Security Classif. (of this page) Unclassified Reproduction of completed page authorized 21. No. of Pages 118 \ 22. Price
Transcript of Report No. 2. Government Accession No. 3. … · The strut-and-tie method is suggested for design...

Technical Report Documentation Page 1. Report No. 2. Government Accession No.
FHWA/TX-97IJ302-J
4. ntle and Subtitle
BEHAVIOR OF REINFORCED CONCRETE PIER CAPS UNDER CONCENTRATED BEARING LOADS
7. Author(sl
R. 1. Denio, 1. A. Yura, and M. E. Kreger
9. Performing Organization Nome and Address
Center for Transportation Research The University of Texas at Austin
3. Recipient's Catalog No.
5. Report Dote February 1995 6. Performing Organization Code
S. Performing Organization Report No.
Research Report 1302-1
10. Work Unit No. (TRAIS)
11 . Contract or Grant No. Research Study 0-1302 3208 Red River, Suite 200
Austin, Texas 78705-2650 I-----------~-----------------I 13. Type of Report and Period Covered
12. Sponsoring Agency Nome and Address Texas Department of Transportation Research and Technology Transfer Office p. O. Box 5080 Austin, Texas 78763-5080 15. Supplementary Noles
Interim
14. Sponsoring Agency Code
Study conducted in cooperation with the U.S. Department of Transportation, Federal Highway Administration Research Study Title: "Connections Between Steel Bent Caps and Concrete Piers"
16. Abstract
At congested highway interchanges, the Texas Department of Transportation (TxDOT) uses narrow concrete piers and shallow depth steel cap girders. Research Project ()"1302 is concerned with the connection detail between these two elements. This report deals with the shear strength and reinforcement details at the top of the concrete pier in the vicinity of the bearings. Since no formal design procedure currently exists for determining the required amount and distribution of reinforcing steel in a pier cap, this research also had the purpose of providing design guidelines for the pier cap. To in'vestigate the behavior of the pier caps, six test specimens were constructed at a 30% scale. Five different reinforcing steel patterns were used in the six specimens to examine the contributions of different reinforcing types to the pier cap strength.
Eleven static load tests were conducted to failure on the six pier caps. For all specimens, load on the pier cap was carried primarily by the action of a tied arch which transferred load from the base plates into the column. Overall, specimens that had a greater quantity of horizontal reinforcing steel and adequate development of horizontal reinforcing had a greater capacity.
Three design methods were used to analyze the strength of the pier caps tested: (1) AASHTO (1992) Corbel Provisions; (2)ACI 318-89 Deep Beam Provisions; and (3) Strut-and-TIeMethod. The corbel and deep beam provisions were very conservative in predicting the capacity of the pier cap because they consider only concrete capacity in shear. On average, these two methods underestimated the pier strength by a factor of 3 to 4. Testing showed that the pier cap resisted loads through a tied arch, which is a much stronger load-carrying mechanism than concrete in shear. The strut-and-tie models used were much more accurate than conventional design methods in predicting the capacity of the pier caps because they model the compression arch action observed during testing. The strut-and-tie method is suggested for design because strut-and-tie analyses gave the best correlation with test results, modeled true behavior, and were still conservative.
To detail the use of the strut-and-tie method, a design example using a proposed strut-and-tie model is presented. Also, recommendations are given for evaluating existing pier caps through field inspection.
17. Key Words 1 8. Distribution Statement concrete piers, steel cap girders, shear strength, strut-and-tie method, connection detail, reinforcement details, bearings, design procedure, reinforcing steel, behavior, capacity, conservative, corbel provisions, deep beam provisions, tied arch, base plates, column
No restrictions. This document is available to the public through the National Technica1lnformation Service,
19. Security Classif. (of this report)
Unclassified
Form DOT F 1700.7 [8-721
Springfield, Virginia 22161.
20. Security Classif. (of this page)
Unclassified
Reproduction of completed page authorized
21. No. of Pages
118
\
22. Price

BEHAVIOR OF REINFORCED CONCRETE PIER CAPS UNDER CONCENTRATED BEARING LOADS
by
R.J. DENIO, J.A. YURA AND M.E. KREGER
Research Report 1302~1
Research Project 0·1302 Connections Between Steel Bent Caps and Concrete Piers
conducted for the
TEXAS DEPARTMENT OF TRANSPORTATION
in cooperation with the
U.S. DEPARTMENT OF TRANSPORTATION FEDERAL HIGHWAY ADMINISTRATION
by the
CENTER FOR TRANSPORTATION RESEARCH Bureau of Engineering Research
THE UNIVERSITY OF TEXAS AT AUSTIN
February 1995

IMPLEMENTATION
A design method is developed to determine the shear strength of the concrete pier. While the strut-and-tie method proposed is still conservative compared to the test results, the calculations at present are lengthy. The approach should probably be simplified before implementation. The current methods in AASHTO do not model the actual behavior and grossly underestimate the strength. It is recommended that the standard design and detailing practice follow the procedures given in the report since the AASHTO provisions are not really applicable to the concrete pier problem.
Prepared in cooperation with the Texas Department of Transportation and the U.S. Department of Transportation, Federal Highway Administration.
The contents of this report reflect the views of the authors, who are responsible for the facts and the accuracy of the data presented herein. The contents do not necessarily reflect the view of the Federal Highway Administration or the Texas Department of Transportation. This report does not constitute a standard, specification, or regulation.
NOT INTENDED FOR CONSTRUCTION,
PERMIT, OR BIDDING PURPOSES
Joseph A. Yura, Texas P.E. #29859
Michael E. Kreger, Texas P.E. #65541
Research Supervisors
iii

ACKNOWLEDGEMENTS
Research Project 0-1302 was funded by the Texas Department of Transportation (TxDOT). The authors thank Mike Lynch and David McDonald of TxDOT for their valuable suggestions and guidance.
Thanks are extended to the other students working on this project: Joe Ales, Jason Olson, and Ahmed Uddin Emad.
The experimental work was conducted at the Ferguson Structural Engineering Laboratory at the University of Texas. The entire staff of the laboratory contributed to the success of this project: P. Ball, S. Cunningham, W. Fontenot, L. Golding, R. Green, A. Jenkins, W. Little, R. Madonna, and B. Stasney,
iv
TABLE OF CONTENTS
Page
CHAPTERl IN"TRODUCTION ............................................................................................................................. 1
1.1. BACKGROUNDIPROBLEM STATEMENT ....................................................................... 1 1.2. OBJECTIVES AND SCOPE ................................................................................................ 2
CHAPTER 2 RESEARCH PROGRAM .................................................................................................................. 5
2.1. TYPICAL TxOOT PIER CAP DESIGN .............................................................................. 5 2.2. DESCRIPTION OF TEST SPECIMENS ............................................................................. 7
2.2.1. Dimensions and Rebar Sizes for the Scale Specimens ................................................... 7 2.2.2. Tested Reinforcing Patterns ......................................................................................... 8
2.3. DIFFERENCES BETWEEN THE TEST SPECIMENS AND FULL SIZE PIERS ............. 11 2.4. MATERIALS ..................................................................................................................... 12 2.5. FABRICATION OF SPECIMENS ..................................................................................... 13 2.6. IN"STRUMENTATION ...................................................................................................... 14 2.7. TEST SET-UP ................................................................................................................... 15 2.8. LOADIN"G PROCEDURE ................................................................................................. 17
CHAPTER 3 TEST RESULTS ............................................................................................................................. 19
3.1. NOMENCLATURE FOR SPECIMEN TESTS .................................................................. 19 3.2. TERMIN"OLOGY FOR DISCUSSIN"G TEST RESULTS .................................................. 19 3.3. SPECIMEN CAPACTIY ................................................................................................... 20 3.4. LOAD-DEFLECTION BEHA VIOR ................................................................................... 22 3.5. CRACKIN'G LOADS ......................................................................................................... 28 3.6. FAILURE MODES ............................................................................................................ 29 3.7. STRAIN" GAGES ............................................................................................................... 34
CHAPTER 4 ANALYSIS OF RESULTS ............................................................................................................. 39
4.1. IN"TRODUCTION .............................................................................................................. 39 4.2. DISCUSSION OF TEST RESULTS .................................................................................. 39 4.3. CORBEL ANALySIS ........................................................................................................ 41 4.4. DEEP BEAM ANALYSIS ................................................................................................. 42 4.5. THE STRUT AND TIE DESIGN METHOD .................................................................... .42
4.5.1. hrtroduction ............................................................................................................... 42 4.5.2. Major Assumptions of the Strut and Tie Method ........................................................ 43 4.5.3. Creation of a Strut and Tie ModeL. ............................................................................ 44 4.5.4. Individual Elements of the Strut and Tie ModeL ....................................................... .46
4.5.4.1. Ties .................................................................................................................. 46 4.5.4.2. Struts ............................................................................................................... 46 4.5.4.3. Nodes ............................................................................................................... 48
4.6. STRUT AND TIE MODEL 1. ............................................................................................ 50 4.6.1. Geometry and Assumptions of Modell ...................................................................... 50
v
4.6.2. Analysis Results from Strut and Tie Modell ............................................................. 56 4.7. STRm AND TIE MODEL 2 ............................................................................................. 58 4.8. SUMMARY OF STRm AND TIE RESULTS .................................................................. 59 4.9. DESIGN EXAMPLE USING STRm AND TIE MODEL 1 .............................................. 62 4.10. COMPARISON OF EXAMPLE PROBLEM REINFORCING STEEL TO A TYPICAL TxDOT DETAIL ...................................................................................................................... 70
CHAPTERS SUMMARY AND CONCLUSIONS ............................................................................................... 73
5.1. OBJECTIVES AND SCOPE .............................................................................................. 73 5.2. OBSERVED BEHAVIOR .................................................................................................. 73 5.3. COMPARISON OF DESIGN METIIODS ......................................................................... 74 5.4. AREAS FOR ADDITIONAL RESEARCH ........................................................................ 74
APPENDIX A TENSILE TESTS OF REBAR ........................................................................................................ 75
APPENDIXB LOAD - DISPLACEMENT GRAPHS ............................................................................................. 76
APPENDIXC PHOTOS OF THE FAILED SPECIMENS ..................................................................................... 85
APPENDIXD LOAD - STRAIN GRAPHS ........................................................................................................... 97
BIBLIOGRAPHY ..................................................................................................................... 105
vi
Figure 1.1 Figure 1.2 Figure 1.3 Figure 1.4 Figure 2.1 Figure 2.2 Figure 2.3 Figure 2.4 Figure 2.5 Figure 2.6 Figure 2.7 Figure 2.8 Figure 2.9 Figure 2.10 Figure 2.11 Figure 2.12 Figure 2.13 Figure 2.14 Figure 2.15 Figure 2.16 Figure 2.17 Figure 2.18 Figure 3.1 Figure 3.2 Figure 3.3 Figure 3.4 Figure 3.5 Figure 3.6 Figure 3.7 Figure 3.8 Figure 3.9 Figure 3.10 Figure 3.11 Figure 3.12 Figure 3.13 Figure 3.14 Figure 3.15 Figure 3.16 Figure 3.17 Figure 3.18 Figure 3.19 Figure 3.20 Figure 3.21
LIST OF FIGURES
Page
A Typical TxDOT Bridge Support ............................................................................ 1 Application of Bridge Loads to the Pier Cap ............................................................. I Arch Action When the Span/Depth Ratio <1 ............................................................. 2 Test Set-Up for Scale Specimens ............................................................................... 3 Pier Cap Geometry and Terminology ......................................................................... 5 Typical Pier Geometty .............................................................................................. 5 Typical Pier Steel Reinforcing Pattern ....................................................................... 6 Geometry of the Scale Test Specimens ...................................................................... 7 Steel Reinforcing Detail for the Standard Scale Specimen (pier A2) ........................... 9 Improper Placement of Bars U in Specimen Al and A2 ........................................... 10 Top Layer Pier Cap Reinforcing in Specimen B. ...................................................... 10 Lap Weld of Bar T ................................................................................................. 10 Specimen D Reinforcing ......................................................................................... II Relocation of Bars ZI in the Test Specimens ........................................................... 12 Relocation of Bars B in the Test Specimens ............................................................. 12 Steel Reinforcing Cage for Specimen A2 ................................................................. 13 Placement of Reinforcing Cages in fonns ................................................................ 14 Strain Gage Locations in Specimens C and D .......................................................... 14 Reduction in Rebar Cross Section Due to Strain Gage P1acement.. ........................... 15 Location of Linear Pots ........................................................................................... 15 Test Set-Up Geometry ............................................................................................ 16 Placement of Test Specimens in the Test Machine ................................................... 16 Load Paths for the Pier Cap .................................................................................... 19 Patterns of Concrete Distress .................................................................................. 20 Load-Deflection Behavior for Pier AI-I .................................................................. 22 Crack Distribution on the Face of Pier AI-I After Failure ....................................... 23 Crack Distribution at the Top of Pier AI-l After Failure ......................................... 23 Crushing of Pier AI-I After Failure ........................................................................ 24 Comparison of Resultant Load vs. Deflection at Linear Pot #1 ................................ 25 Comparison of Resultant Load vs. Deflection at Linear Pot #2 ................................ 26 Comparison of Resultant Load vs. Deflection at Linear Pot #3 ................................ 27 Specimens AI-I and C-I at Failure ......................................................................... 29 Redistribution of Internal Forces in the Pier Cap ...................................................... 30 Development Lengths for Top Layer Reinforcing in Specimen B .............................. 30 Splitting Cracks Due to Bond Distress in Specimen B. ............................................. 31 Opening of Flexure/Shear for Pier B-2 - Spalled Cover Removed ............................. 31 Punching of the Base Plate into Pier B2-2 ................................................................ 32 Crack Distribution on the Face of Pier D-I After Failure ......................................... 32 Force Distribution in Specimen D After Opening of the Flexural Crack ................... 33 Cracking and Punching Under the Base Plate for Pier C-2 ....................................... 33 Strain Gage Locations in Specimens C and D .......................................................... 34 Resultant Load vs. Strain on Gages I - 4 for Pier C-l.. ............................................ 35 Resultant Load vs. Strain on Gages 9 - 12 for Pier D-I ........................................... 36
vii

Figure 3.22 Figure 3.23 Figure 4.1 Figure 4.2 Figure 4.3 Figure 4.4 Figure 4.5
Figure 4.6 Figure 4.7 Figure 4.8 Figure 4.9 Figure 4.10 Figure 4.11 Figure 4.12 Figure 4.13 Figure 4.14 Figure 4.15 Figure 4.16 Figure 4.17 Figure 4.18 Figure 4.19 Figure 4.20 Figure 4.21 Figure 4.22 Figure 4.23 Figure 4.24 Figure 4.25 Figure 4.26 Figure 4.27 Figure 4.28 Figure 4.29 Figure A.l FigureB.I Figure B.2 Figure B.3 Figure B.4 Figure B.5 Figure B.6 Figure B.7 Figure B.8 FigureB.9 Figure B.IO Figure B.ll Figure B.12 Figure C.l Figure C.2 Figure C.3 FigureC.4
Resultant Load vs. Strain in Gages 5 - 8 for Pier C-2 .............................................. 36 Resultant Load vs. Strain in Gages 5 - 8 for Pier D-2 .............................................. 37 Force Distribution Assumed in Corbel Code Provisions (Salmon 1985) ................... .41 Examples of Strut and Tie Models (from Schlaich 1987) ........................................ .43 B and D Regions (Shaded) of a Structure (from Schlaich 1987) .............................. .44 Use of the Load Path Method to form a Strut and Tie Model (from Schlaich 1987) .. 45 The Good Strut and Tie Model has Shorter Ties Than the Bad Model (from Schlaich 1987) ...................................................................................................................... 45 The Three Compression Struts (a) The Fan (b) The Bottle (c) The Prism ................. 46 Strut and Tie Model Considering Transverse Tensile Stresses .................................. 48 CCC Node with Unequal Pressure (from Barton 1988) ........................................... .48 CCC Node Under Hydrostatic Stress (adapted from Anderson 1988) ....................... 49 CCT Node With Multiple Layers of Reinforcing (from Bergmeister 1990) .............. .49 Mesh Used for the Finite Element Analysis .............................................................. 50 Loading Applied to the Finite Element Model .......................................................... 50 Contour of Principal Tensile Stresses ...................................................................... 51 Contour of Principal Compressive Stresses .............................................................. 51 Failure Pattern for a Typical Specimen .................................................................... 52 Shear Span Modelled in the Finite Element Analysis ................................................ 52 Configuration of Strut and Tie Modell ................................................................... 53 Determination of the Compression Field Width ........................................................ 53 Centroid Location for the Column Compression Strut .............................................. 54 Layout of Compression Steel at the Edge of the Column .......................................... 55 Configuration of Strut and Tie Model 2 .................................................................. 58
Pier Cap Geometry for the Example Problem .......................................................... 62 Strut and Tie Model for the Example Problem ......................................................... 63 Cross Section of Strut C5 ....................................................................................... 64 Location of Node 2 in the Strut and Tie Model ........................................................ 65 Geometry of the CCC Node (Node 2 in the Strut and Tie Model) ............................. 66 Steel Reinforcing Pattern from the Example Problem ............................................... 67 Geometry of the CCT Node (Node I in the Strut and Tie Model) ............................. 68 Typical Steel Reinforcing Pattern Used by TxDot.. .................................................. 70 Typical Stress - Strain Curve for a Tensile Test of Rebar ........................................ 75 Location of Linear Pots ........................................................................................... 76 Resultant Load vs. Deflection at Linear Pots 1 through 4 for Pier AI-l.. .................. 78 Resultant Load vs. Deflection at Linear Pots 1 through 4 for Pier A2-2 .................... 78 Resultant Load vs. Deflection at Linear Pots 1 through 4 for Pier A2-3 .................... 79 Resultant Load vs. Deflection at Linear Pots 1 through 4 for Pier B-1 ...................... 79 Resultant Load vs. Deflection at Linear Pots 1 through 4 for Pier B-2 ...................... 80 Resultant Load vs. Deflection at Linear Pots I through 4 for Pier C-l.. .................... 80 Resultant Load vs. Deflection at Linear Pots 1 through 4 for Pier C-2 ...................... 81 Resultant Load vs. Deflection at Linear Pots 1 through 4 for Pier D-l ..................... 81 Resultant Load vs. Deflection at Linear Pots 1 through 4 for Pier D-2 ..................... 82 Resultant Load vs. Deflection at Linear Pots 1 through 4 for Pier E-l ...................... 82 Resultant Load vs. Deflection at Linear Pots 1 through 4 for Pier B-2 ...................... 83 Damage to Pier Al-l After Failure .......................................................................... 89 Damage to Pier A2-2 After Failure .......................................................................... 90 Damage to Pier A2-3 After Failure ........................................................................... 91 Damage to Pier B-1 After Failure ............................................................................ 92
viii

Figure C.5 Figure C.6 FigureC.7 Figure C.S Figure C.9 Figure C.10 Figure C11 Figure OJ Figure 0.2 Figure 0.3 Figure 0.4 Figure 0.5 Figure 0.6 Figure 0.7 Figure 0.8 Figure 0.9 Figure 0.10 Figure 0.11 Figure 0.12 Figure 0.13
03Il1age to Pier B-2 After Failure ....................... ~.................................................... 90 03Il1age to Pier C-1 After Failure ...................... '.. ........... ............ ............................ 91 03Il1age to Pier C-2 After Failure............................. ........................... ........... ........ 92 0aIna.ge to Pier 0-1 After Failure ........... ........................ .............. ....... .................. 93 03Il1agC to Pier 0-2 After Failure .......................................................................... 94 Oamage to Pier E-l After Failure ........................................................................... 95 03Il1age to Pier E-2 After Failure ........................................................................... 96 Location of Strain Gages........................ ............. ............. ......................... ............ 97 Resultant Load vs. Strain in Gages 1 through 4 for Pier C-1 .... ............. ....... .......... 98 Resultant Load vs. Strain in Gages 5 through 8 for Pier C-l.................................. 98 Resultant Load vs. Strain in Gages 9 through 12 for Pier C-l................................ 99 Resultant Load vs. Strain in Gages 2 and 4 for Pier C-2 ................................... ..... 99 Resultant Load vs. Strain in Gages 5 through 8 for Pier C-2 .................................. 100 Resultant Load vs. Strain in Gages 9 through 12 for Pier C-2 ................................ 100 Resultant Load vs. Strain in Gages 1 through 4 for Pier 0-1 .................................. 101 Resultant Load vs. Strain in Gages 5 through 8 for Pier 0-1 .................................. 101 Resultant Load vs. Strain in Gages 9 through 12 for Pier 0-1 ................................ 102 Resultant Load vs. Strain in Gages 1 through 4 for Pier 0-2 .................................. 102 Resultant Load vs. Strain in Gages 5 through 8 for Pier 0-2 .................................. 103 Resultant Load vs. Strain in Gages 9 through 12 for Pier 0-2 ................................ 103
ix

Table 2.1 Table 2.2 Table 2.3 Table 3.1 Table 3.2 Table 3.3 Table 3.4 Table 4.1 Table 4.2
Table 4.3 Table 4.4 Table 4.5 Table 4.6 Table 4.7
Table 4.8
Table 4.9
LIST OF TABLES
Page
Rebar Sizes for Full Size and Standard Scale Piers (see Figure 2.3 for bar layout) ..... 7 Static Yield Strengths of Rebar ............................................................................... 12 Concrete Cylinder Compressive Strengths ............................................................... 13 Summary of Specimen Reinforcement Patterns ........................................................ 21 Specimen Capacities and Concrete Strengths ........................................................... 21 Specimen Cracking Loads ....................................................................................... 28 Comparison of Strain for the First and Second Tests on a Specimen ........................ 37 Test Specimen Strengths ......................................................................................... 39 Test Specimen Capacity Compared to the Strength Predicted by Conventional Design Methods ................................................................................................................. 42 Specimen Capacity and Member Forces for Strut and Tie Modell .......................... 57 Tested Capacities for Pier A and Pier C .................................................................. 57 Limitations on the Components ofT2 Based on Reinforcing in the Test Specimens .. 57 Specimen Capacity and Member Forces for Strut and Tie Model 2 .......................... 59 Predicted Specimen Capacities when a Vc Term is Added to Strengths from Strut and Tie Modell ............................................................................................................ 60 Comparison of Average Ratio of Theoryrrest Capacity for Different Design Methods ............................................................................................................................... 61 Strut and Tie Capacity and Member Forces for a Typical TxDOT Steel Detail (Figure 4.29) ....................................................................................................................... 71

SUMMARY
At congested highway interchanges, TxDOT uses narrow concrete piers and shallow depth steel cap girders. Research Project 1302 is concerned with the connection detail between these two elements. This report deals with the shear strength and reinforcement details at the top of the concrete pier in the vicinity of the bearings. Since no formal design procedure currently exists for determining the required amount and distribution of reinforcing steel in a pier cap, this research also had the purpose of providing design guidelines for the pier cap. To investigate the behavior of the pier caps, six test specimens were constructed at a 30% scale. Five different reinforcing steel patterns wee used in the six specimens to examine the contributions of different reinforcing types to the pier cap strength.
Eleven static load tests were conducted to failure on the six pier caps. For all specimens, load on the pier cap was primarily carried by the action of a tied arch which transferred load from the base plates into the column. Overall, specimens that had a greater quantity of horizontal reinforcing steel and adequate development of horizontal reinforcing had a greater capacity. To investigate the necessity of the continuous steel loop around the perimeter of the pier cap, a specimen was constructed with only straight bars in the top layer of the pier cap. When the continuous loop was not included in the top layer of the pier cap reinforcement, shear cracks on the face of the pier opened extremely wide because there was no reinforcement at the top of the pier to limit their growth. Bond distress was also seen for the straight bars in the top layer of the pier cap because removal of the continuous loop left only straight bars with short development lengths. Without the continuous loop, concrete at the end of the pier cap was not confined and additional punching occurred. Bearing capacity of the pier cap was increased by the confinement provided by the continuous loop around the end of the pier cap so such a detail is highly recommended.
Three design methods were used to analyze the strength of the pier caps tested:
1. AASHTO (1992) Corbel Provisions
2. AC1318-89 Deep Beam Provisions
3. Strut-and-Tie Method
The corbel and deep beam provisions were very conservative in predicting the capacity of the pier cap because they only consider concrete capacity in shear. On average these two methods underestimated the pier strength by a factor of 3 to 4. Testing showed that the pier cap resisted loads through a tied arch, which is a much stronger load-carrying mechanism than concrete in shear. The strut-and-tie models used were much more accurate than conventional design methods in predicting the capacity of the pier caps because they model the compression arch action observed during testing. The strut-and-
xi
tie method is suggested for design because strut-and-tie analyses gave the best correlation with test results, modeled true behavior, and were still conservative.
To detail the use of the strut-and-tie method, a design example using a proposed strut~and-tie model is presented. Also, recommendations for evaluating existing pier caps through field inspection are given.
xii
CHAPTER 1
INTRODUCTION
1.1. BACKGROUNDIPROBLEM STATEMENT
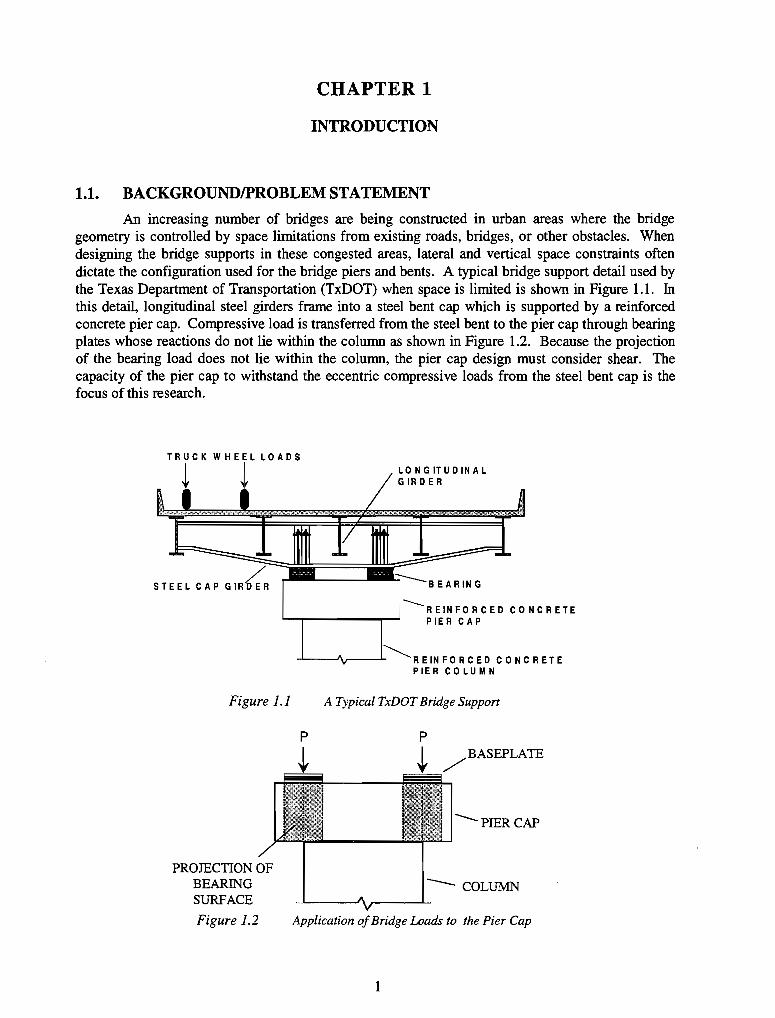
An increasing number of bridges are being constructed in urban areas where the bridge geometry is controlled by space limitations from existing roads, bridges, or other obstacles. When designing the bridge supports in these congested areas, lateral and vertical space constraints often dictate the configuration used for the bridge piers and bents. A typical bridge support detail used by the Texas Department of Transportation (TxDOT) when space is limited is shown in Figure 1.1. In this detail, longitudinal steel girders frame into a steel bent cap which is supported by a reinforced concrete pier cap. Compressive load is transferred from the steel hent to the pier cap through bearing plates whose reactions do not lie within the column as shown in Figure 1.2. Because the projection of the bearing load does not lie within the column, the pier cap design must consider shear. The capacity of the pier cap to withstand the eccentric compressive loads from the steel bent cap is the focus of this research.
TRUCK WHEEL LOADS
~ L
STEEL CAP GIRteR
LONGITUDINAL G IR D E R
'---REINFORCED CONCRETE '--~---...,....- PIER CAP
-'----'\r---'-~REINFORCED CONCRETE PIER COLUMN
Figure 1.1 A Typical TxDOT Bridge Support
p p
PROJECTION OF
BEARING -- COLUMN SURFACE
Figure 1.2 Application of Bridge Loads to the Pier Cap
1

When examining the compressive load carrying capacity of the pier cap, the nature of the transfer of load from the steel bent cap to the concrete pier cap is critical. The steel bent cap typically is supported on disc bearings, pot bearings, or bearing plates which are subject to factored loads on the order of 2,000 kips. All of these supports are relatively small compared to the area on top of the pier cap, and place highly concentrated compressive loads on the top of the pier cap. There are two basic problems to solve with respect to these concentrated loads. First, the concrete under the bearing plate must not crush. Second, the concentrated loads on the pier cap must be transferred to the column. The design for bearing capacity is clearly outlined in the AASHTO Bridge Specifications (AASHTO 1992). The design of the pier cap region to allow transfer of load to the column is much more difficult for the engineer, since it is an atypical section whose design is not explicitly covered in design codes. With the bearings placed outside of the interior of the column, the load is slightly eccentric to the column as shown in Figure 1.2. For the piers studied, the shear span is very small, with a span to depth ratio below 0.1. For reinforced concrete cantilevers with such small span to depth ratios, loads will be transferred primarily by the action of a tied arch as shown in Figure 1.3 (Salmon 1985). However, existing code provisions aimed at beams with span to depth ratios less than 1 do not consider arching action as a primary load carrying mechanism. Instead, existing code provisions for beams with span/depth ratios less than one focus on the capacity of concrete in shear. Thus, a design based on existing code provisions will be overly conservative because concrete can carry much less load in shear than in direct compression. Figure 1.3
1.2. OBJECTIVES AND SCOPE
LOAD
t
ARCH
Arch Action When the Span/Depth Ratio <1
The behavior of the entire connection shown in Figure 1.1 is being studied under a project for the Texas Department of Transportation (TxDOT). The research considers the distribution of forces within the bridge system, the behavior of the anchor bolt system, and the behavior of the concrete pier cap. This report focuses on the behavior and design of the reinforced concrete pier cap used by TxDOT subject to compressive loads. The objectives of this research are a determination of the strength and behavior of the reinforced concrete pier cap under compression loads, and the formulation of design recommendations for the pier cap.
To assess the capacity of the pier cap to sustain extreme compression loads, six pier caps at a 30 percent scale were tested in compression as shown in Figure 1.4. Steel reinforcement designs in the pier cap were altered to examine extremes in capacity, and to examine the contributions of different types and quantities of reinforcing steel to the strength of the pier cap. Three techniques that could be used to analyze the pier cap are compared. The two conventional design solutions that are applicable are a corbel analysis and deep beam analysis. As an alternative design method, a strut and tie model will be presented for comparison. Also, bearing stresses from testing will be compared with stresses allowed in the 1992 AASHTO provisions.
2
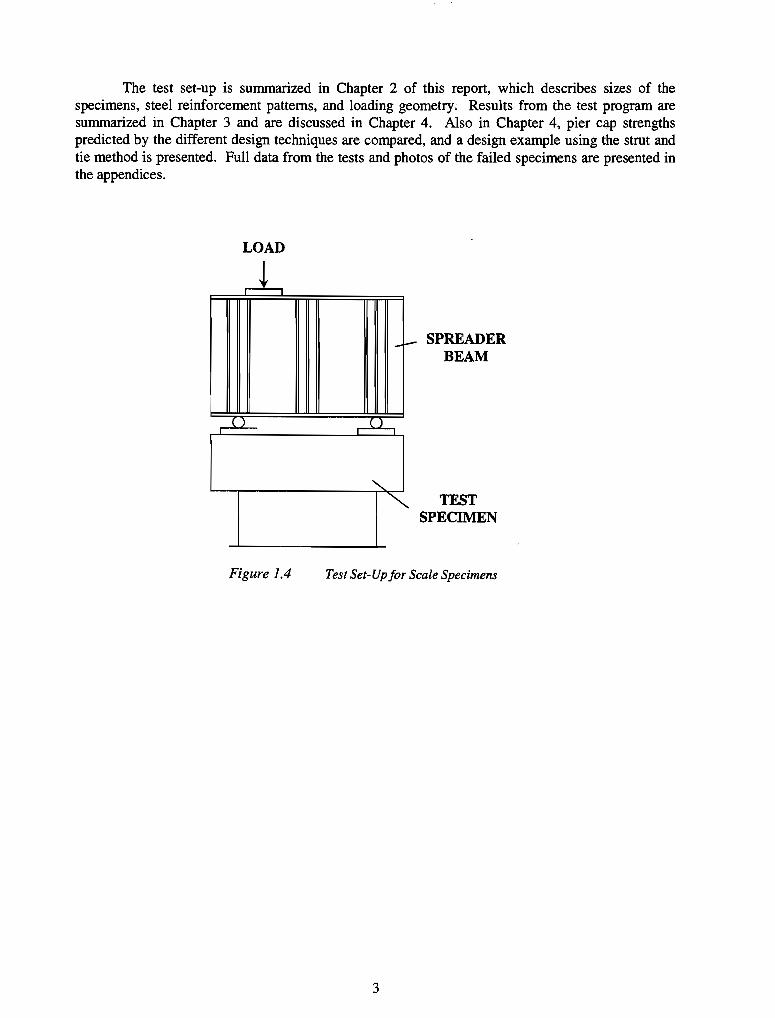
The test set-up is summarized in Chapter 2 of this report, which describes sizes of the specimens, steel reinforcement patterns, and loading geometry; Results from the test program are summarized in Chapter 3 and are discussed in Chapter 4. Also in Chapter 4, pier cap strengths predicted by the different design techniques are compared, and a design example using the strut and tie method is presented. Full data from the tests and photos of the failed specimens are presented in the appendices.
LOAD
J.
= ~
Figure 1.4
-~
,.u-,
"-
""
SPREADER BEAM
TEST SPECIMEN
Test Set-Up for Scale Specimens
3

4
CHAPTER 2
RESEARCH PROGRAM
2.1. TYPICAL TxDOT PIER CAP DESIGN
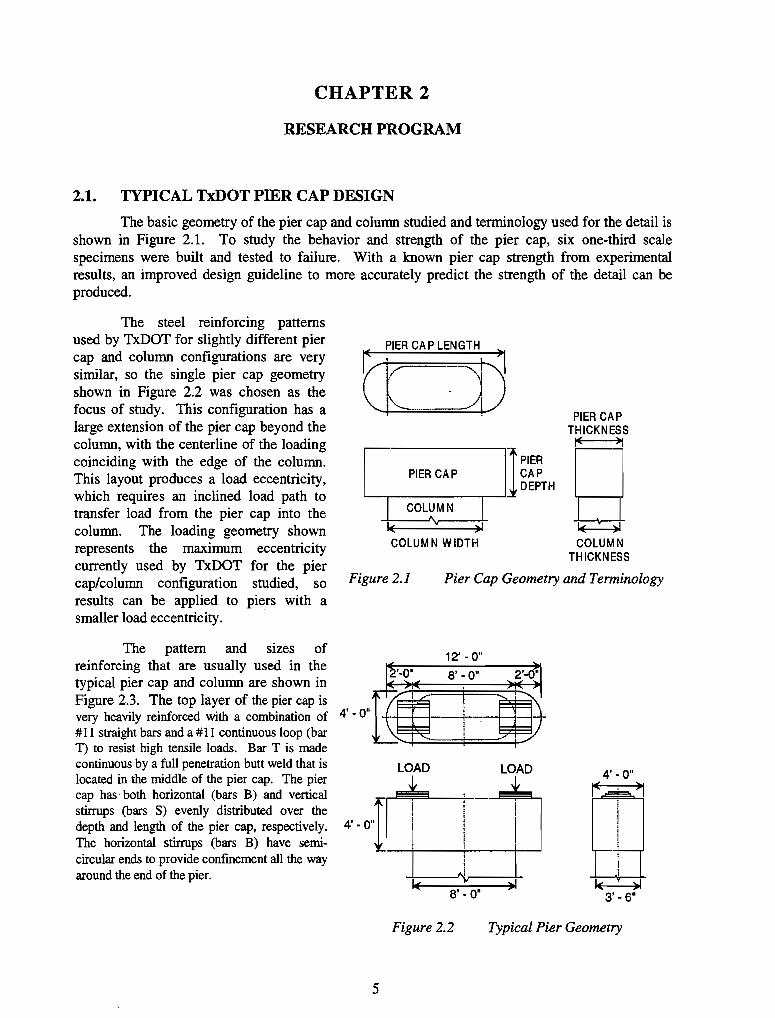
The basic geometry of the pier cap and colunm studied and terminology used for the detail is shown in Figure 2.1. To study the behavior and strength of the pier cap, six one-third scale specimens were built and tested to failure. With a known pier cap strength from experimental results, an improved design guideline to more accurately predict the strength of the detail can be produced.
The steel reinforcing patterns used by TxDOT for slightly different pier cap and column configurations are very similar, so the single pier cap geometry shown in Figure 2.2 was chosen as the focus of study. This configuration has a large extension of the pier cap beyond the column, with the centerline of the loading coinciding with the edge of the column. This layout produces a load eccentricity, which requires an inclined load path to transfer load from the pier cap into the colunm. The loading geometry shown represents the maximum eccentricity currently used by TxDOT for the pier cap/Column configuration studied, so results can be applied to piers with a smaller load eccentricity.
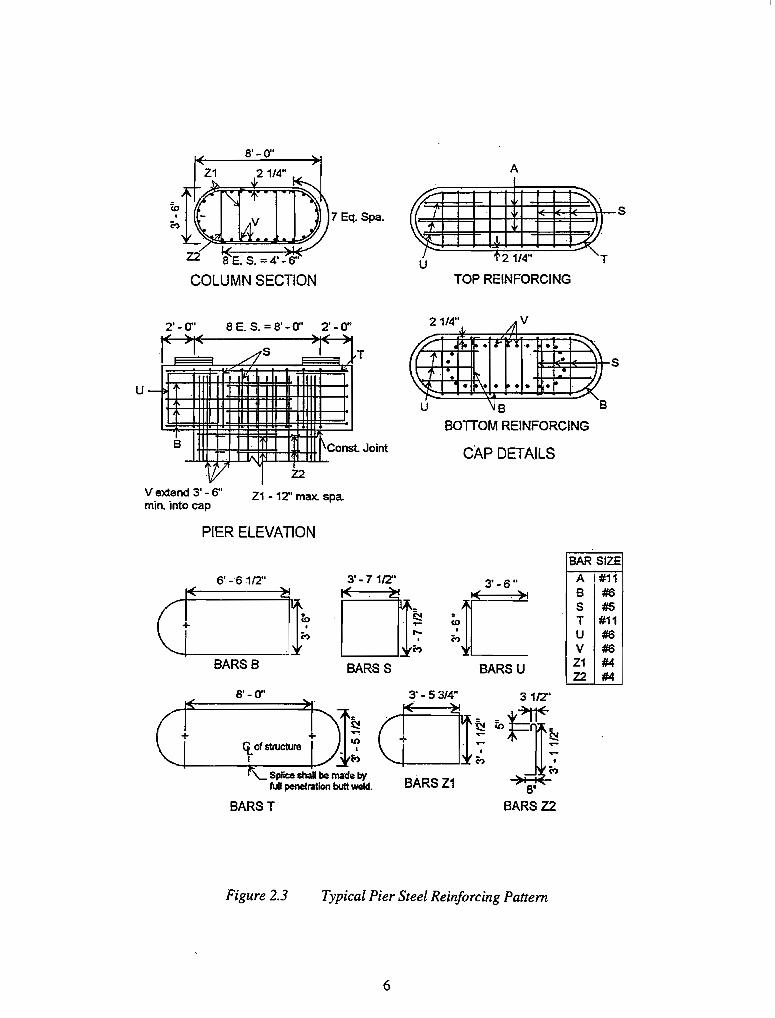
The pattern and sizes of reinforcing that are usually used in the typical pier cap and column are shown in Figure 2.3. The top layer of the pier cap is very heavily reinforced with a combination of #11 straight bars and a #11 continuous loop (bar T) to resist high tensile loads. Bar T is made continuous by a full penetration butt weld that is located in the middle of the pier cap. The pier cap has both horizontal (bars B) and vertical stirrups (bars S) evenly distributed over the depth and length of the pier cap, respectively. The horizontal stirrups (bars B) have semicircular ends to provide confinement all the way around the end of the pier.
1 PIER PIER CAP CAP
DEPTH '---.-____ ...,---J
I COLUMN I l( )1 COLUM N WIDTH
PIER CAP THICKNESS
g COLUMN
THICKNESS
Figure 2.1 Pier Cap Geometry and Terminology
12' - O·
4' - 0"
LOAD LOAD
Figure 2.2 Typical Pier Geometry
5
u
S'-O" A
7 Eq. Spa.
Z2 8 E. S. =4'.S" u 2114"
COLUMN SECTION TOP REINFORCING
2'-0" 8 E. S. = S' - a' 2' - 0" 2114" v .1. /Jl
// 1100 .. I.t I,. • ",,'
(( r • • ,\ • a ~
~ .".(y \..~ .. -\- . .' . •
S
U ~ 8 '8
BOTTOM REINFORCING
V extend 3' - 6" min. into cap
Z1 - 12" max. spa.
cAp DETAILS
PIER ELEVATION
6' -S1fZ'
BARSB BARSS BARSU
[" 03' -5 314" _ ~'
+ ~~ ih]~ <i of structure • ~ + . '7 .:: ""-I ___ -'I.,..-__ ....r- (\I) C? f
Splice shall be made by BARS Z1 C? fuD penetration butt weld. S"
s'·a'
BARST BARS Z2
Figure 2.3 Typical Pier Steel Reinforcing Pattern
6
BARiSIZE
A #11 8 #6 S #5 T #11 U #6 V #6 Z1 #4 Z2 #4

2.2. DESCRIPTION OF TEST SPECIMENS
2.2.1. Dimensions and Rebar Sizes for the Scale Specimens
The geometry of the detail shown in Figure 2.2 was used as the reference for creation of test specimens. Since the estimated loads needed to fail a full size specimen exceeded the capacity of testing machines available in the laboratory, model specimens were constructed at a 30% scale. The thickness and depth of the pier cap, the column thickness, and base plate size for the test specimens were obtained by direct proportioning from the standard detail presented in section 2.1. The width of the column was set at 36 inches (which also sets the length of the pier cap) for convenience in application of the load. The final pier size used for all the scale specimens is shown in Figure 2.4. Note that the test specimens have a column width equal to the pier cap width. This larger column size will slightly increase the strength of the specimens by providing a greater area over which to transfer load from the pier cap to the column.
Rebar sizes for the scale specimens were obtained by choosing the size rebar with an area closest to 30% of the full size of the rebar. Table 2.1 shows the sizes of the rebar used in the standard scale specimens, and the actual scale (based on area) of the rebar used. The hooped stirrups in the column (bars Z) are not at an appropriate scale because a minimum number of rebar sizes was desired. This discrepancy in scale was accepted since the column stirrups will have a negligible effect on the strength of the pier cap.
14·1/2
14·1/2'
29"
14 ·1/2
Figure 2.4
36"
BASE PLATES 8·3/4 B x 8·
Geometry o/the Scale Test Specimens
Table 2.1 Rebar Sizes jar Full Size and Standard Scale Piers (see Figure 2.3 jar bar layout
Bar Full Size Scale Size Actual Scale
=t=t #11 Ab=1.56 in" #6 h=O.44 in' 28.2 % #6 Ab=0.44 in" #3 Ab=0.11 in" 25.0 % #5 Ab=O.31 in" #3 Ab=O.11 in" 35.4 %
T #11 Ab=1.56 in" #6 Ab=O.44 in" 28.2% U #6 Ab=O.44 in" #3 Ab=O.11 in" 25.0 % V #11 Ab=1.56 in" #6 Ab=O.44 in" 28.2 % Z #4 Ab=0.20 in" #3 Ab=O.11 in" 55.0 %
7
2.2.2. Tested Reinforcing Patterns
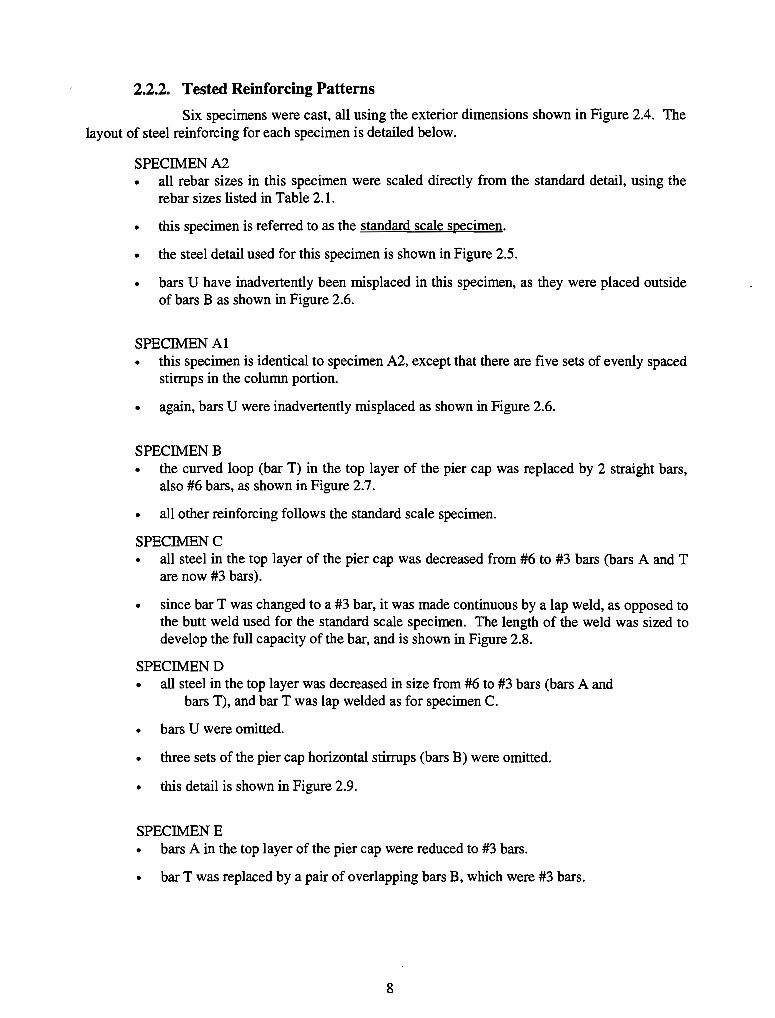
Six specimens were cast, all using the exterior dimensions shown in Figure 2.4. The layout of steel reinforcing for each specimen is detailed below.
SPECWENA2 • all rebar sizes in this specimen were scaled directly from the standard detail, using the
rebar sizes listed in Table 2.1.
• this specimen is referred to as the standard scale specimen.
• the steel detail used for this specimen is shown in FigUre 2.5.
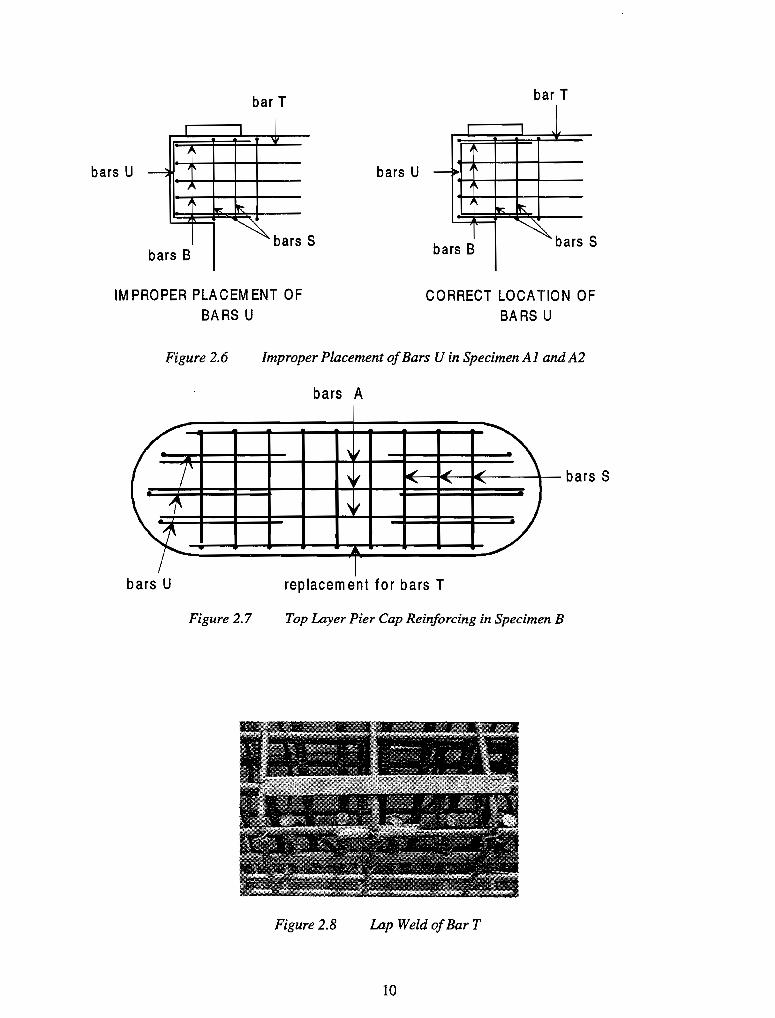
• bars U have inadvertently been misplaced in this specimen, as they were placed outside of bars B as shown in Figure 2.6.
SPECWEN Al • this specimen is identical to specimen A2, except that there are five sets of evenly spaced
stirrups in the column portion.
• again, bars U were inadvertently misplaced as shown in Figure 2.6.
SPECWENB • the curved loop (bar T) in the top layer of the pier cap was replaced by 2 straight bars,
also #6 bars, as shown in Figure 2.7.
• all other reinforcing follows the standard scale specimen.
SPECWENC • all steel in the top layer of the pier cap was decreased from #6 to #3 bars (bars A and T
are now #3 bars).
• since bar T was changed to a #3 bar, it was made continuous by a lap weld, as opposed to the butt weld used for the standard scale specimen. The length of the weld was sized to develop the full capacity of the bar, and is shown in Figure 2.8.
SPECWEND • all steel in the top layer was decreased in size from #6 to #3 bars (bars A and
bars T), and bar T was lap welded as for specimen C.
• bars U were omitted.
• three sets of the pier cap horizontal stirrups (bars B) were omitted.
• this detail is shown in Figure 2.9.
SPECWENE • bars A in the top layer of the pier cap were reduced to #3 bars.
• bar T was replaced by a pair of overlapping bars B, which were #3 bars.
8
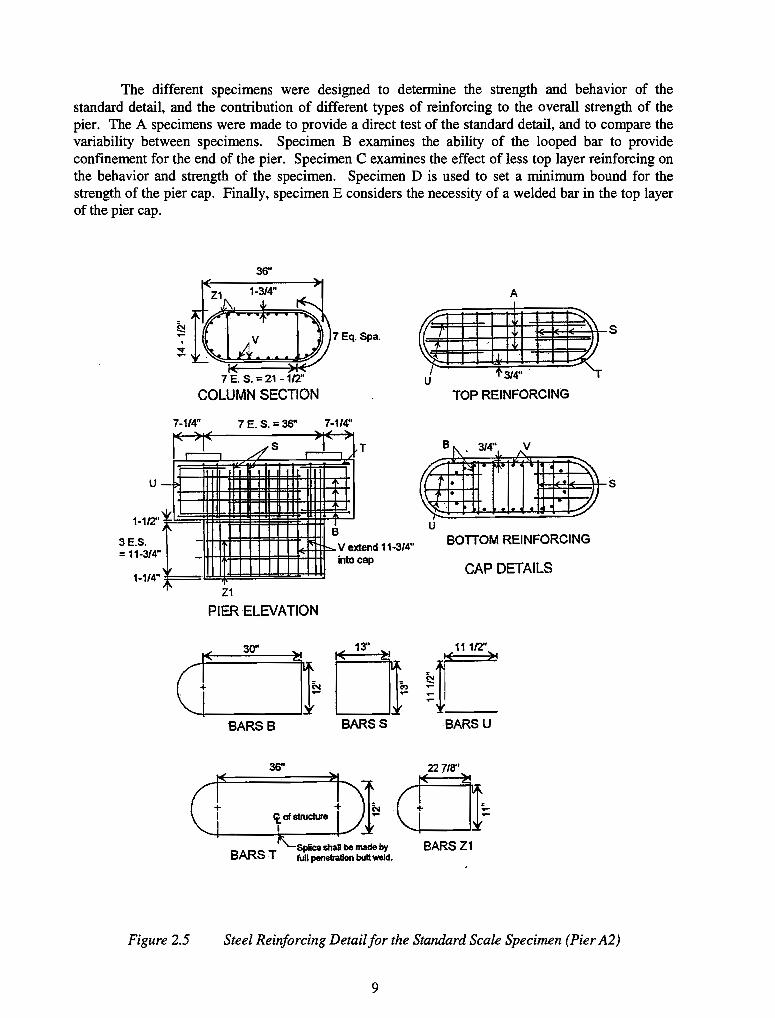
The different specimens were designed to determine the strength and behavior of the standard detail, and the contribution of different types of reinforcing to the overall strength of the pier. The A specimens were made to provide a direct test of the standard detail, and to compare the variability between specimens. Specimen B examines the ability of the looped bar to provide confinement for the end of the pier. Specimen C examines the effect of less top layer reinforcing on the behavior and strength of the specimen. Specimen D is used to set a minimum bound for the strength of the pier cap. Finally, specimen E considers the necessity of a welded bar in the top layer of the pier cap.
u
36"
7 E. S. :: 21 -112"
COLUMN SECTION
7 E. S. = 36"
7Eq. Spa.
7-1/4"
T
A
6.lIlijlil [I; I~ s '¥:. 3/4" T U
TOP REINFORCING
1-112" W~Itm~ 3E.S. BOTTOM REINFORCING == 11·3/4"
1-1/4" CAP DETAILS
Z1
PIER ELEVATION
c-I------'f ~ } [)
~C:11112" I
BARSB BARSS BARSU
c[ :m_l)} ctJr~ BARS T
'Z:SPIiCUhaU be made by BARS Z1 full penetraUon bull weld.
Figure 2.5 Steel Reinforcing Detailfor the Standard Scale Specimen (Pier A2)
9
bar T
I '" ,~
bars U ---l , J .... ~
~bars bars B
1M PROPER PLACEM ENT OF BARS U
bars U
S
bar T
J '"
-" ~
Ito:: ~
bars B ~bars S
CORRECT LOCATION OF BARS U
Figure 2.6 Improper Placement of Bars U in Specimen Al and A2
bars A
~~ v j' .... , ..; ..;
I ...... ...... ...... bars S
"" V
A-
I bars U replacem ent for bars T
Figure 2.7 Top Layer Pier Cap Reinforcing in Specimen B
Figure 2.8 Lap Weld of Bar T
10

bars A
Ctt!::t:m=E*~trbars s
TOP REINFORCING IN PIER CAP
d bars S
bars Z1 PIER ELEVATION
bars T
/ bars T
I
bars B bar s V extend
3/4" into 11 -
Figure 2.9 Specimen D Reinforcing
2.3. DIFFERENCES BETWEEN THE TEST SPECIMENS AND FULL SIZE PIERS
There were some differences between the construction of the scale specimens and actual piers. For the test specimens, cover was only 3/4" for the pier cap, as opposed to 2 114" for the full size pier cap, a 33% scale. A smaller cover was used for the test specimens to maintain a constant proportion of concrete subject to spalling. For the column section, cover was 1 3/4" for the test specimens. This larger cover was a result of the formwork used for the scale specimens. The column steel must be inset relative to the sides of the pier cap to avoid intersecting the reinforcing in the pier cap. Since the column for the scale specimens was the same thickness as the pier cap, extra cover in the column region was produced.
In the scale specimens, the amount of column steel in the rectangular portion of the column was reduced to relieve congestion of the reinforcing. The number of column bars (bars V) in the center portion of the column was decreased from nine on a side in the actual piers to eight on a side in the scale specimens. Thus, there were 28 total bars V in the test specimens as opposed to 30 total for the full scale piers. Such a change should have no noticeable effect on the specimens performance.
Additionally, location of reinforcement in the scale specimens was slightly modified from that of the field placement. For the scale specimens, bars Z2 were omitted to ease fabrication. As shown in Figure 2.10, bars Z2 had been anchored at bar 1 near the column edge. To maintain the same confining effect at the end of the column for the test specimens, bars Zl were made longer and
11
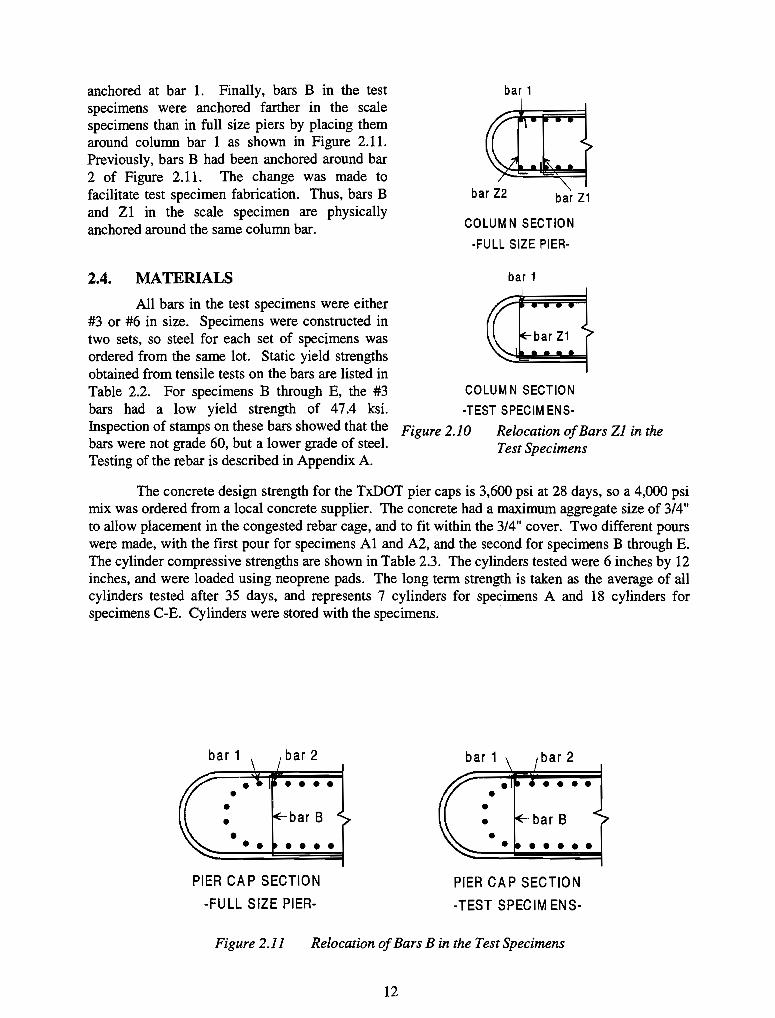
anchored at bar 1. Finally, bars B in the test specimens were anchored farther in the scale specimens than in full size piers by placing them around column bar 1 as shown in Figure 2.11. Previously, bars B had been anchored around bar 2 of Figure 2.11. The change was made to facilitate test specimen fabrication. Thus, bars B and ZI in the scale specimen are physically anchored around the same column bar.
2.4. MATERIALS
All bars in the test specimens were either #3 or #6 in size. Specimens were constructed in two sets, so steel for each set of specimens was ordered from the same lot. Static yield strengths obtained from tensile tests on the bars are listed in Table 2.2. For specimens B through E, the #3 bars had a low yield strength of 47.4 ksi. Inspection of stamps on these bars showed that the bars were not grade 60, but a lower grade of steel. Testing of the rebar is described in Appendix A.
bar 1
COLUM N SECTION
-FULL SIZE PIER·
bar 1
COLUM N SECTION
-rEST SPECIM ENS-
Figure 2.10 Relocation of Bars Zl in the Test Specimens
The concrete design strength for the TxDOT pier caps is 3,600 psi at 28 days, so a 4,000 psi mix was ordered from a local concrete supplier. The concrete had a maximum aggregate size of 3/4" to allow placement in the congested rebar cage, and to fit within the 3/4" cover. Two different pours were made, with the first pour for specimens Al and A2, and the second for specimens B through E. The cylinder compressive strengths are shown in Table 2.3. The cylinders tested were 6 inches by 12 inches, and were loaded using neoprene pads. The long term strength is taken as the average of all cylinders tested after 35 days, and represents 7 cylinders for specimens A and 18 cylinders for specimens C-E. Cylinders were stored with the specimens. .
bar B
PIER CA P SECTION
·FULL SIZE PIER-PIER CAP SECTION
-TEST SPECIM ENS-
Figure 2.11 Relocation of Bars B in the Test Specimens
12

Table 2.2 Static Yield Strengths of Rebar
fy for #3 bars fy for
Al andA2 60.8 60.0
B throughE 47.4 60.0
Table 2.3 Concrete Cylinder Compressive Strengths
Specimens 7 day strength 28 day sire long term strength
Ai andA2 2939 psi 3905 psi 4050 psi
B throughE 2820 psi 3554 psi 4016 psi
2.5. FABRICATION OF SPECIMENS
All specimens were constructed at the Ferguson Lab. The reinforcing cage for specimen A2 is shown in Figure 2.12. All of the bent bars were ordered from a local fabricator, and met a reasonable tolerance - -3/8" - for the out to out dimensions. Spacers were placed on rebar parallel to the straight edges of the specimen to ensure equal cover on opposite sides of the specimen. Forms were made right side up, so the effect of bleeding and segregation would be the same as for actual piers. The circular end of the column was formed using sheet metal placed within a wood frame. The placement of the reinforcing in the forms is shown in Figure 2.13.
The specimens were poured monolithically, with no construction joint as used in the field. Concrete was placed using an overhead crane and bucket, and thoroughly consolidated using internal vibration. After pouring, the exposed concrete on the top of the forms was covered with plastic. After one week, the forms and cylinders were stripped and left to cure in air. Removal of the forms showed that there were no defects such as honeycombing in the concrete.
2.6. INSTRUMENTATION
Strain gages were placed on reinforcing in the top layer of the pier cap of specimens C and D. The gage locations are shown in Figure 2.14. The strain gages were not located under the bearing plates, so strain gage readings represent a basically uniaxial state of stress. The strain gages had a 6 mm gage length, with a 12 mm by 4 mm backing. The size of the gage backing mandated significant grinding of the #3 bars to produce a flat surface for the strain gages. Since the gages were placed on the top and bottom of a bar, the area of the bar at the gage location was reduced as shown in Figure 2.15. To protect the gages from moisture and the casting process, the gages were covered by a waterproofing sealer and mastic. All gages were still active after concrete was placed. The initial strain gage accuracy was approximately ± 10 microstrains.
13

Figure 2.12 Steel Reinforcing Cage for Specimen A2
Figure 2.13 Placement of Reinforcing Cages in forms
14

• • I
I I <t of soeci men,
I )1
7·1/4" 18 " 15-1/2" 2"
even # llalleS • on bottom of rebar odd # aaaes - on too of rebar
Figure 2.14 Strain Gage Locations in Specimens C and D
Figure 2.15 Reduction in Rebar Cross Section Due to Strain Gage Placement
15
, ~ of load
;
9 i ! 9 1\3and4 I I I
i I
i I I
0 0 2 6
Figure 2.16 Location of Linear Pots
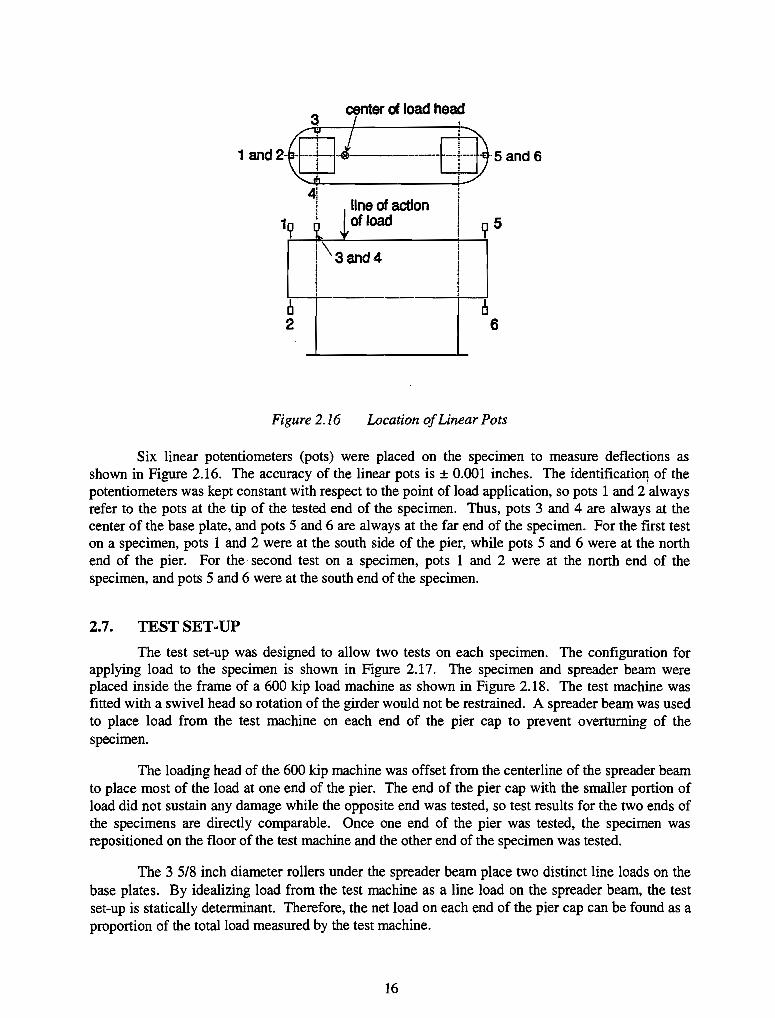
Six linear potentiometers (pots) were placed on the specimen to measure deflections as shown in Figure 2.16. The accuracy of the linear pots is ± 0.001 inches. The identificatio~ of the potentiometers was kept constant with respect to the point of load application, so pots 1 and 2always refer to the pots at the tip of the tested end of the specimen. Thus, pots 3 and 4 are always at the center of the base plate, and pots 5 and 6 are always at the far end of the specimen. For the first test on a specimen, pots 1 and 2 were at the south side of the pier, while pots 5 and 6 were at the north end of the pier. For the· second test on a specimen, pots 1 and 2 were at the north end of the specimen, and pots 5 and 6 were at the south end of the specimen.
2.7. TEST SET-UP
The test set-up was designed to allow two tests on each specimen. The configuration for applying load to the specimen is shown in Figure 2.17. The specimen and spreader beam were placed inside the frame of a 600 kip load machine as shown in Figure 2.18. The test machine was fitted with a swivel head so rotation of the girder would not be restrained. A spreader beam was used to place load from the test machine on each end of the pier cap to prevent overturning of the specimen.
The loading head of the 600 kip machine was offset from the centerline of the spreader beam to place most of the load at one end of the pier. The end of the pier cap with the smaller portion of load did not sustain any damage while the opposite end was tested, so test results for the two ends of the specimens are directly comparable. Once one end of the pier was tested, the specimen was repositioned on the floor of the test machine and the other end of the specimen was tested.
The 3 5/8 inch diameter rollers under the spreader beam place two distinct line loads on the base plates. By idealizing load from the test machine as a line load on the spreader beam, the test set-up is statically determinant. Therefore, the net load on each end of the pier cap can be found as a proportion of the total load measured by the test machine.
16

30 .
29
P . I 10" diam. spherical
~Ioadhead 01/2" 'de Its 1 - WI pae
I ,
, I
.r::::: ':::::::tI 1."
p.8Stp 30"
<--.
3S' Figure 2.17
-I--' SPREADER BEAM
3-5/8" dlam. roller V; 1/
J::S?' 8-314" x 8-314" x 2" base plates
,j' l"-hydrostone O.17F
"-
i"T S
EST PECIMEN
Test Set-Up Geometry
Figure 2.18 Placement oiTest Specimens in the Test Machine
17
To level the spreader beam and provide full contact between the top of the pier cap and the base plates, a 5/16 inch layer of hydrostone was poured under the base plates. Also, for some of the piers a thin film of hydrostone was poured under the semi-circular end of the column, at the end of the specimen being tested. This layer of hydrostone produced full contact between the floor and specimen, preventing any rigid body rotations of the specimen due to a non planar surface on the bottom of the specimen.
2.8. LOADING PROCEDURE
Loading was applied in discrete increments, typically 20 to 30 kips on the linear portion of the load-deflection curve. After an increment in load was applied, about five minutes passed while cracks were marked and inspected. At the end of this delay, load and deflection readings were taken electronically, giving the static capacity. The next load step was then applied.
Loading was controlled while examining a plot of the total load versus deflection at linear pot #1. For the linear portion of the load-deflection plot, load control was used to determine the size of load increments before changing to deflection control near the peak capacity. The first test on a specimen was stopped shortly after the peak load had been reached to avoid excessive damage to the specimen which could affect the second test. For specimens B through E, the second test on the specimen was run to large deflections to examine the specimen ductility.
18
CHAPTER 3
TEST RESULTS
3.1. NOMENCLATURE FOR SPECIMEN TESTS
Eleven tests were conducted to failure on the six specimens, with the most significant results presented in this chapter and detailed results for each test in Appendices B, C, and D. As discussed in Chapter 2, each end of a specimen was tested separately, allowing two possible tests to failure on each pier. Specimens were named with a letter as presented in Chapter 2. A specific test on a specimen is denoted by placing a number after the name of the specimen, with the number indicating the time of that test. For instance, Pier B-1 refers to the first test on specimen B, while Pier B-2 refers to the second test on specimen B, at the opposite end of the specimen.
The only specimen tested three times was specimen A2. This pier was first tested with the load head centered on the spreader beam, placing nearly equal loads on each end of the pier (test Pier A2-1). This first loading was large enough to originate cracking, but did not cause failure. Thus, Pier A2-2 was the first loading to failure on specimen A2, and Pier A2-3 was the second loading to failure on specimen A2.
3.2. TERMINOLOGY FOR DISCUSSING TEST RESULTS
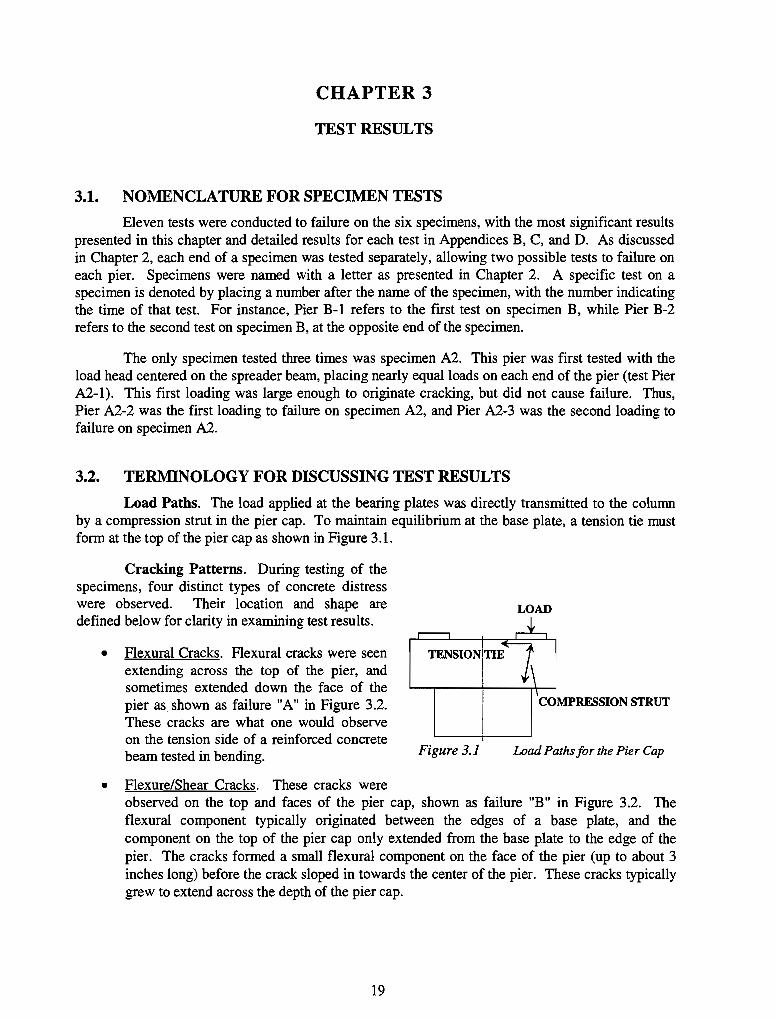
Load Paths. The load applied at the bearing plates was directly transmitted to the colunm by a compression strut in the pier cap. To maintain equilibrium at the base plate, a tension tie must form at the top of the pier cap as shown in Figure 3.1.
Cracking Patterns. During testing of the specimens, four distinct types of concrete distress were observed. Their location and shape are defined below for clarity in examining test results.
• Flexural Cracks. Flexural cracks were seen extending across the top of the pier, and sometimes extended down the face of the pier as shown as failure "A" in Figure 3.2. These cracks are what one would observe on the tension side of a reinforced concrete beam tested in bending.
• Flexure/Shear Cracks. These cracks were
Figure 3.1
LOAD
COMPRESSION STRUT
Load Paths for the Pier Cap
observed on the top and faces of the pier cap, shown as failure "B" in Figure 3.2. The flexural component typically originated between the edges of a base plate, and the component on the top of the pier cap only extended from the base plate to the edge of the pier. The cracks formed a small flexural component on the face of the pier (up to about 3 inches long) before the crack sloped in towards the center of the pier. These cracks typically grew to extend across the depth of the pier cap.
19

A
B PLAN VIEW
C
ELEVATION VIEW
Figure 3.2
TYPES OF CONCRETE DISTRESS:
A • FLEXURAL CRACKS B - FLEXURE/SHEAR CRACKS C • SHEAR CRACK D • CRUSHING
Patterns of Concrete Distress
• Shear Cracks. These inclined cracks fonned on the faces of the pier cap as shown as failure "Cnin Figure 3.2. The shear cracks were distinguished from flexure/shear cracks as they had no flexural component when they initially fonned. A crack that began as a pure shear crack would often extend across the depth of the pier cap so that it eventually resembled a flexure/shear crack.
• Crushing. Crushing of concrete was located at the interface between the pier cap and colunm, and is shown as failure "0" in Figure 3.2. The crushing was easily observed, with flaking of the concrete the first indication of failure followed by further spalling of the concrete with additional loading.
3.3. SPECIMEN CAPACITY
A summary of steel reinforcing patterns used in the specimens is given in Table 3.1. The specimens static ultimate strengths and concrete cylinder strengths on the day of testing are listed in Table 3.2. The specimen strength refers to the resultant load on the end of the pier being tested, not the total load applied to the spreader beam. Cylinder compressive strengths are the average of three cylinders unless noted. Also shown in Table 3.2 are the average capacities for the specimens, and the "effective concrete strength" for the specimens (effective fe'). To calculate art average strength for the A series specimens, test results for specimens Al and A2 are combined since pier cap reinforcing was identical for the two specimens. The effective concrete strength presented in Table 3.2 represents an average strength for a concrete pour, and is presented to remove the small variability in concrete strength after prolonged curing. For tests run on specimens more than 35 days old, the effective fe' is the average compressive strength of all cylinders tested after 35 days (the long tenn average strength from Chapter 2). Only specimen E was tested at less than 35 days, so the effective fc' for specimen E was taken as the average of Pier E-I and Pier E-2 cylinders. All specimens except for specimen E had essentially the same concrete strength, so only results for specimen E need to be nonnalized.
20
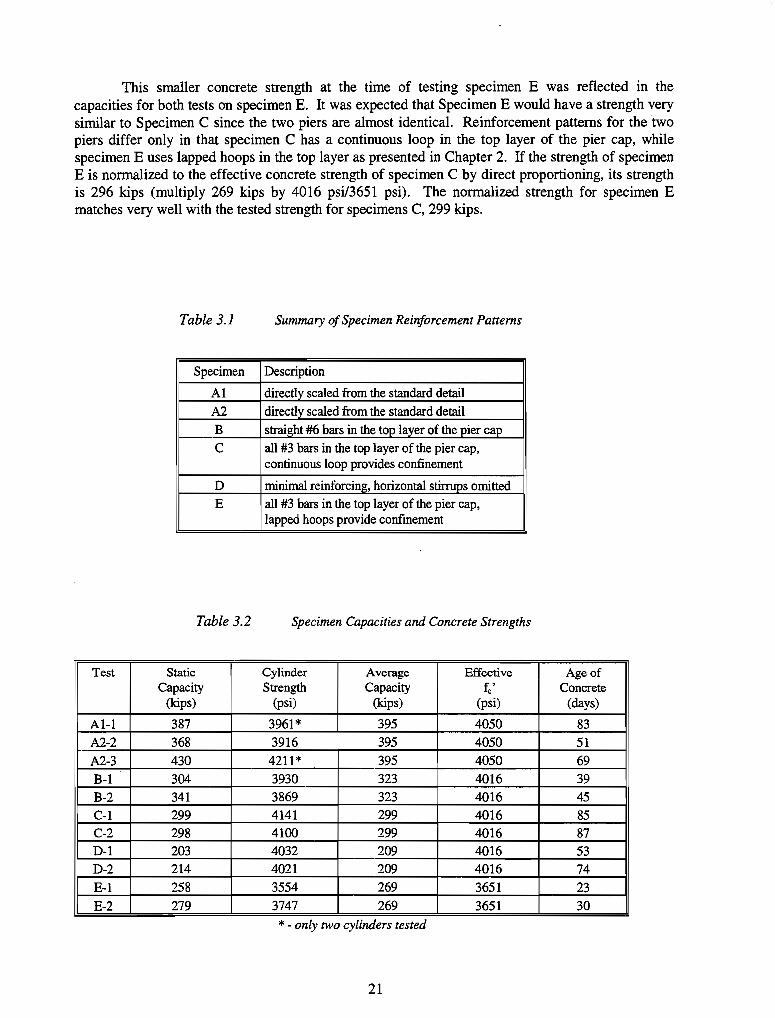
This smaller concrete strength at the time of testing specimen E was reflected in the capacities for both tests on specimen E. It was expected that Specimen E would have a strength very similar to Specimen C since the two piers are almost identical. Reinforcement patterns for the "two piers differ only in that specimen C has a continuous loop in the top layer of the pier cap, while specimen E uses lapped hoops in the top layer as presented in Chapter 2. If the strength of specimen E is normalized to the effective concrete strength of specimen C by direct proportioning, its strength is 296 kips (multiply 269 kips by 4016 psil3651 psi). The normalized strength for specimen E matches very well with the tested strength for specimens C, 299 kips.
Table 3.1 Summary at Specimen Reinforcement Patterns
Specimen Description
Al directly scaled from the standard detail A2 directly scaled from the standard detail B straight #6 bars in the top layer of the pier cap C all #3 bars in the top layer of the pier cap,
continuous loop provides confinement
D minimal reinforcing, horizontal stirrups omitted E all #3 bars in the top layer of the pier cap,
lapped hoops provide confinement
Table 3.2 Specimen Capacities and Concrete Strengths
Test Static Cylinder Average Effective Age of Capacity Strength Capacity ~' Concrete
(kips) (psi) (kips) (psi) (days)
AI-l 387 3961* 395 4050 83 A2-2 368 3916 395 4050 51 A2-3 430 4211* 395 4050 69 B-1 304 3930 323 4016 39 B-2 341 3869 323 4016 45 C-l 299 4141 299 4016 85 C-2 298 4100 299 4016 87 D-l 203 4032 209 4016 53
1r---D=2 214 4021 209 4016 74
~ 258 3554 269 3651 23 279 3747 269 3651 30
* -only two cylinders tested
21

3.4. LOAD-DEFLECTION BEHAVIOR
The loading curve in Figure 3.3 was initially linear until cracking occurred, then gradual nonlinear behavior began with plastic behavior seen near the peak load. Cracking loads are shown on the graph, as well as sketches of cracking patterns on the east side of the pier with increasing loads. At point "B", cracking had just begun and consisted of small flexural, flexure/shear, and shear cracks. With cracking initiated, existing cracks continued to widen and lengthen, additional cracks formed, and crushing began as shown at point "C". At point "C", the compression strut was defined by the two inclined cracks, but crack widths were still less than 1/32 inch. Additional loads mainly opened the inclined cracks defining the compression strut further, and caused additional crushing at the pier cap/column interface. The failed specimen is shown in Figures 3.4 and 3.5 which show a well defined compression strut and evenly distributed flexural cracking on the top of the pier, respectively. At the peak load, the largest inclined crack was 3116 inches wide, while flexural cracks between the two base plates remained minute. There was also extensive crushing at the cap/column interface as shown in Figure 3.6. Loads marked on the specimen are the total load on the specimen, not the resultant load on the tested end of the pier.
460
400
~350 2 --300 5l 9250 ~ 200 ~ /.
,4-,/ ;.-B. FI
~
V I- C, CRt ISHINGB fQlNS
~ SEEN
/"'f-.... A. FIRST ''''''",,:,, lWIAt.p :5 150 fa a:: 100
50
o
I -- ~.~ ,~.
o 0.05 0.1 0.15 0.2 0.25 0.3 0.35 0.4
DEFLECTION AT LINEAR POT #1 (INCHES)
CRACK OIAGRAMS ARe ORAWN TO SCALE
!.PI, 9
CRACKING ON THE EAST FACE OF SPECIMEN A1-1 •
POINT'B' RESULTANT LOAD = 186 kips
(OJ
CRACKING ON THE EAST FACE OF SPECIMEN 1..1-1
POINT "C. RESULTANT LOAD '" 269 kips
Figure 3.3 Load-deflection behavior for Pier A]-]
22

Figure 3.4 Crack Distribution on the Face of Pier Al-l After Failure
Figure 3.5 Crack Distribution at the Top o/Pier Al-l After Failure
23
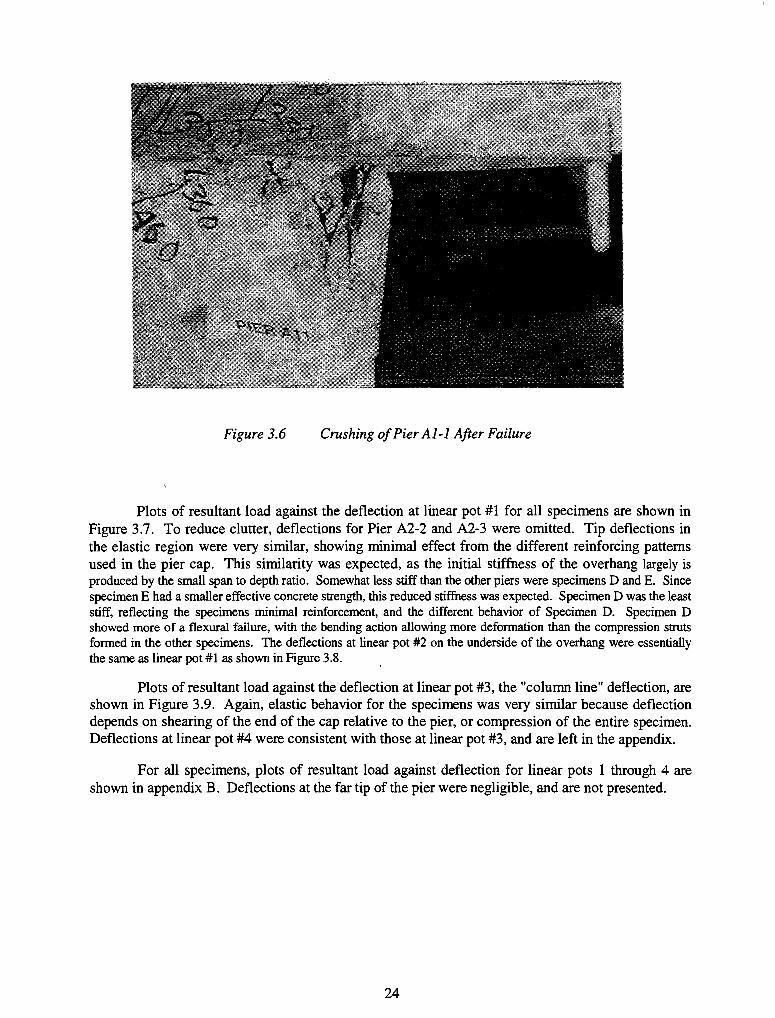
Figure 3.6 Crushing of Pier Al-l After Failure
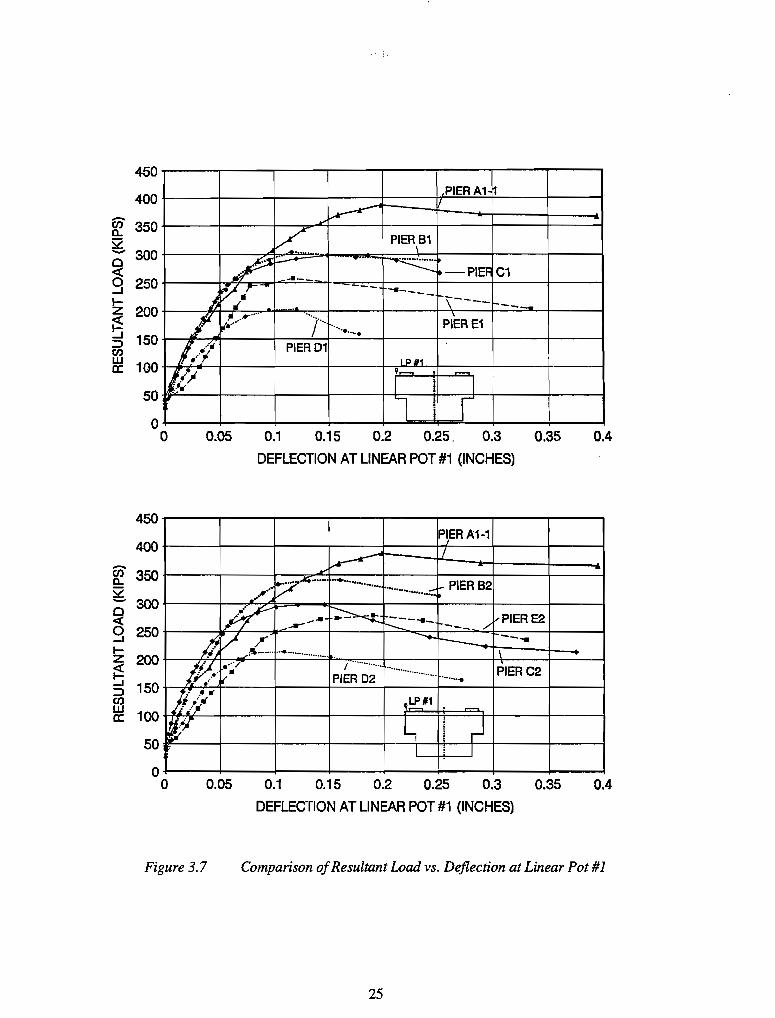
Plots of resultant load against the deflection at linear pot #1 for all specimens are shown in Figure 3.7. To reduce clutter, deflections for Pier A2-2 and A2-3 were omitted. Tip deflections in the elastic region were very similar, showing minimal effect from the different reinforcing patterns used in the pier cap. This similarity was expected, as the initial stiffness of the overhang largely is produced by the small span to depth ratio. Somewhat less stiff than the other piers were specimens D and E. Since specimen E had a smaller effective concrete strength, this reduced stiffness was expected. Specimen D was the least stiff, reflecting the specimens minimal reinforcement, and the different behavior of Specimen D. Specimen D showed more of a flexural failure, with the bending action allowing more deformation than the compression struts formed in the other specimens. The deflections at linear pot #2 on the underside of the overhang were essentially the same as linear pot #1 as shown in Figure 3.8.
Plots of resultant load against the deflection at linear pot #3, the "column line" deflection, are shown in Figure 3.9. Again, elastic behavior for the specimens was very similar because deflection depends on shearing of the end of the cap relative to the pier, or compression of the entire specimen. Deflections at linear pot #4 were consistent with those at linear pot #3, and are left in the appendix.
For all specimens, plots of resultant load against deflection for linear pots 1 through 4 are shown in appendix B. Deflections at the far tip of the pier were negligible, and are not presented.
24
fii a.. 52 -0
~ ...J I-Z
~ ...J ::> CI) w a:
~ 52 -0
~ ...J I-Z
~ ...J ::::> ffi a:
450
400 PIERA11
350
300
250
200
150
100
50
~ y
V PIER\B1 - .. ~
c-- ~ It-P1EM,C1 ... --
~ .. r- - - .... ----J l .......
t--\ ____ ---
1'. ,: .. "' ..... ) .... PIERE1 .....
~.~ ...........
l. ~/ii PlEA 01 ..... j.( LPII1
!/l~ q . -.... I I I
I l I r o o 0.05 0.1 0.15 0.2 0.25. 0.3 0.35
DEFLECTION AT LINEAR POT #1 (INCHES)
450 PIERA1-1
400
350
300
250
200
150
100
50
~ I
¥
/~ ~-... ........................
.... -......... ~.::: PIER B2
R' ~ ,. l--PIERE2 _.a r:::--"- /' ....- ---
IZ V J"L.-........
----- --.. .......... -~ .. - .. ~ .. \
Ih •... / 1·····-···· ..
• ......... ~4 •• __ .¥ ••. __ PIER C2 I •• ".'
it- PIER 02 ............ Ii .f!.
. '. ,LP'1 ,/.l. U;" L, i
~ i I ! I
o o 0.05 0.1 0.15 0.2 0.25 0.3 0.35
DEFLECTION AT LINEAR POT #1 (INCHES)
0.4
0.4
Figure 3.7 Comparison of Resultant Load vs. Deflection at Linear Pot #1
25

-en a.. S2 -0 <C 9 l-z ~ :..J :::J en w a:
450
400
350
300
250
200
150
100
50
IPIER A-1
~ .1.
./
.It V PIER 81
.. JIo:J!!-US&III111 .. , FIER~ • P .' -. _ .. _-
{r//"c --~\-- ... -Ii '""-----.. ~ .. ,. .. PIER E1 -----.
1/ II ......... I ....... t·····
PIER 01 ..... ~ .... ~ .........
/l.:.f~ ...-. . -I !'
1/11 h I ~ LP#21 j I
o o 0.05 0.1 0.15 0.2 0.25 0.3 0.35
DEFLECTION AT LINEAR POT #2 (INCHES)
Figure 3.8 Comparison of Resultant Load vs. Deflection at Linear Pot #2
26
0.4

-fe 52 -0
Ci ..J I-Z
~ :..J ::l rJ) w a:
fiJ D.. 52 -0 « 0 ..J I-Z « ~ ::l rJ) w a:
450 PIERA1-1
400
350
300
250
200
150
100
50
r fl. PIER 81 ) " .. /PIER C .' V ~ tl .a_
If!: ---.......... _d~!ER E1 --. n" '. ". LP'3 j ........
.I-
tit PIER 01 U .J 1/ I I
!
o o 0.05 0.1 0.15 0.2 0.25 0.3 0.35 0.4
DEFLECTION AT LINEAR POT '3 (INCHES)
450
400
350
300
250
200
150
100
50
PIERB2 r-~IERA11
",fIf ! .. : ... -f?! rr .... ~_ ... --- ......... PIER E2 -'1l ... ~ ....... \:: PIERC2 --l' _____
~----- !It
/If ".~.
~"~ .. ~ ..... "" .... -~ .... ...... _-....
; \PIER 02 .. --.... -~ .. -......... ... ~ -I i !i I
l I r I . 0
0 0.05 0.1 0.15 0.2 0.25 0.3 0.35 0.4 DEFLECTION AT LINEAR POT'3 (INCHES)
Figure 3.9 Comparison of Resultant Load vs. Deflection at Linear Pot #3
27

3.5. CRACKING LOADS
In general, cracking loads are subjective due to the variability in concrete tensile strength, and because cracks may not immediately be seen when they originate due to their minute size. Also, the load listed as the cracking load represents the range of load covered in the previous load step - 20 to 30 kips. Since load steps were not uniform for all specimens, there i& additional variability.
The loads at which different crack types were first observed are listed in Table 3.3. The table has been split into two groups to reflect the loading process. The first group in the table lists cracking loads from the virgin test on the pier, while the second group gives cracking loads for the second tests on specimens. For the virgin test on the pier, the true cracking loads are obtained. For the second test on the opposite end of the specimen, the flexural cracking loads could have been affected by previously formed cracks. During( the first test on a specimen, flexural cracks sometimes propagated to the opposite end of the pier. Thus, for the second test of the specimen, the existing flexural cracks could absorb deformations, delaying the onset of additional flexural cracking. Although the rate of formation of flexural cracks may have been effected, specimen failure modes were not altered. Cracking loads for Pier A2-2 and Pier A2-3 are grouped with the virgin test results since their cracking loads were obtained by examining results from Pier A2-1, which equally loaded the two ends of the pier cap.
Typically, flexural and flexure/shear cracks formed at about the same time, followed by the formation of shear cracks before crushing began. Specimens Al and A2 with #6 bars in the top layer had the highest flexural cracking loads, indicating the larger bars could absorb tensile force with less strain than the #3 bars, reducing strain in the concrete. Specimen D allowed the earliest formation of flexural cracks, and also had the smallest stiffness as shown by the loading curves. Specimens C and D were identical except that Specimen D had no intermediate layers of horizontal stirrups. Thus, the layers of horizontal stirrups (bars B) in Specimen C help to reduce deflections, limiting the formation of flexural cracks. For specimens other than specimen D, flexure shear cracks formed at almost the same load, about 150 kips. This was expected, as all these specimens had the same distribution of horizontal stirrups (bars B). Crushing loads for specimens other than specimen D were reasonably close, indicating that the distribution of forces within the specimens was similar up until that point. After crushing began, specimens that could redistribute internal forces and put more tension in the top layer of steel could add load, while those that could not redistribute loads failed with the onset of crushing.
Table 3.3 Specimen Cracking Loads
Crackina Loads (kiDS) Test Capacity Flexure Flexure Shear Crushing
Shear A1-1 387 186 154 154 269 A2-2 368 167 145 205 I 297 A2-3 430 174 150 112 205 B-1 [ 304 166 166 276 291 C-l 299 99 153 168 257
I 0-1 203 67 none 152 203 E-l 258 118 152 224 258 B-2 341 127 166 147 341 0.2 298 124 124 105 283 0-2 214 87 212 214 :± 214 E-2 279 159 140 125 261
28

There was considerable variability in cracking loads for a given specimen, but the largest variability came in the comparison of shear cracking loads for a given specimen. For specimen B-1, the first shear crack was seen at 276 kips, while for specimen B-2 the first shear crack was seen at 147 kips, a difference of 129 kips. This scatter in shear cracking loads is related to the definitions used for classifying cracks. Since flexure/shear cracks often developed first and then added shear components, it sometimes took much more load to develop an independent shear crack.
3.6. FAILURE MODES
The test specimens showed three basic failure modes. The most common failure, seen in specimens A, C, and E, was caused by cmshing of concrete in the compression stmt and at the cap/column interface. Photos of Piers Al-l and C-l after failure are shown in Figure 3.10. Photos of all the failed specimens are shown in Appendix C. For specimens A, C, and E, flexure/spear and shear cracks propagated across the depth of the pier cap and began to open with increasing load, limiting the size of the compression strut. Eventually, the force in the strut caused crushing at the interface. With additional load, inclined cracks opened further and there was additional cmshing at the interface and in the strut. Eventually, cmshing in the strut and at the cap/column interface resulted in failure. For specimens Al and A2, there was considerable strength gain between the onset of cmshing at the interface and the ultimate load. This indicates that the stmt rotated in towards the pier cap once cmshing began. This new geometry requires a larger force in the tension steel in the top layer of the pier to maintain equilibrium as shown in Figure 3.11. For specimens C and E, formation of cracks was very similar to the A specimens. However, there was a much smaller lag between first cmshing at the interface and the ultimate load. Since specimens C and E had much less reinforcing in the top layer than specimens A, redistribution of the stmt after cmshing began was limited.
Figure 3.10
29
Specimens A1-1 and C-1 at Failure
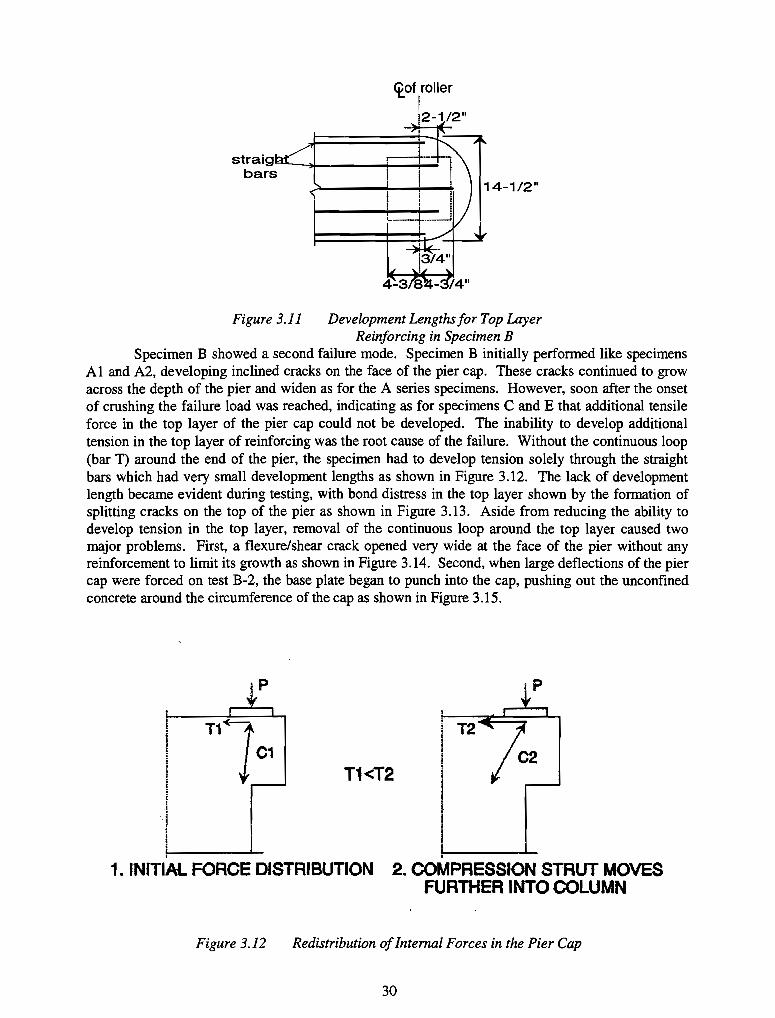
straig ........... ---;+-___ +----'r--: bars
Figure 3.11 Development Lengthsfor Top Layer Reinforcing in Specimen B
Specimen B showed a second failure mode. Specimen B initially perfonned like specimens Al and A2, developing inclined cracks on the face of the pier cap. These cracks continued to grow across the depth of the pier and widen as for the A series specimens. However, soon after the onset of crushing the failure load was reached, indicating as for specimens C and E that additional tensile force in the top layer of the pier cap could not be developed. The inability to develop additional tension in the top layer of reinforcing was the root cause of the failure. Without the continuous loop (bar T) around the end of the pier, the specimen had to develop tension solely through the straight bars which had very small development lengths as shown in Figure 3.12. The lack of development length became evident during testing, with bond distress in the top layer shown by the formation of splitting cracks on the top of the pier as shown in Figure 3.13. Aside from reducing the ability to develop tension in the top layer, removal of the continuous loop around the top layer caused two major problems. First, a flexure/shear crack opened very wide at the face of the pier without any reinforcement to limit its growth as shown in Figure 3.14. Second, when large deflections of the pier cap were forced on test B-2, the base plate began to punch into the cap, pushing out the unconfined concrete around the circumference of the cap as shown in Figure 3.15.
i
I I I
p
T1~1 C1
1-; -----'--
p
T2
T1<T2
1. INITIAL FORCE DISTRIBUTION 2. COMPRESSION STRUT MOVES FURTHER INTO COLUMN
Figure 3.12 Redistribution of Internal Forces in the Pier Cap
30

Figure 3.13 Splitting Cracks Due to Bond Distress in Specimen B
Figure 3.14 Opening of Flexure/Shear for Pier B-2 - Spalled Cover Removed
31

Figure 3.15 Punching of the Base Plate into Pier B2-2
Specimen D, with its minimal reinforcing behaved quite differently than the other specimens with a cracking pattern shown in Figure 3.16. Flexural cracks formed initially, with long components on the faces of the pier. In particular, a flexural crack formed at the interior edge of the base plate. For other specimens, inclined cracks formed near the point of load application, forming a defined compression strut. For specimen D, however, the cracks in this region were almost vertical indicating minimal compression strut formation. With increasing loads, the flexural crack at the interior edge of the base plate grew across the depth of the pier. This eliminated the area available for direct transfer of shear, but left a bearing surface at the top of the column to handle strut forces as shown in Figure 3.17. Therefore, in both tests on specimen D failure corresponded to the beginning of crushing at the cap/column interface since there was no possible redistribution of loads. Essentially, the specimen failed because flexural cracks opened so much that shear could not be directly transferred to the interior of the pier.
Figure 3.16 Crack Distribution on the Face of Pier D-1 After Failure
32

FLEXURAL CRAC
Inspection of specimens after testing showed two significant behavior patterns of concrete directly under the base plates. First, there was only extremely minor cracking under the base plates due to the confinement provided by the base plate. Flexural cracks that formed on the edge of the pier did not continue under the base plate, but stopped at the edge of the base plate as shown in Figure 3.18. Second, punching of the base plates into the top of the pier cap was seen to some extent for all specimens, Figure 3.17 with punching on Pier C-2 shown in Figure 3.18. The punching was magnified
COMPRESSION STRUT
SECTION A-A
Force Distribution in Specimen DAfter Opening of the Flexural Crack
on the second tests on specimens, which were run to large deformations. Punching was greatest for specimen B, followed by specimens E, C, A, and D. While specimens Al and A2 reached much greater loads than specimens B, E, and C, excellent confinement in the top layer for A series specimens was provided by the #6 continuous loop (bar T) which minimized punching. The punching seen in specimens B, E, and C was certainly enlarged due to the presence of a large flexural crack at the interior edge of the base plate. Formation of this crack eliminated the confmement available from the underlying concrete along this edge. While the beginning of punching was seen, punching did not contribute to the failure of specimens and became most notable only when damage to the specimens was forced.
Figure 3.18 Cracking and Punching Under the Base Plate for Pier C-2
33
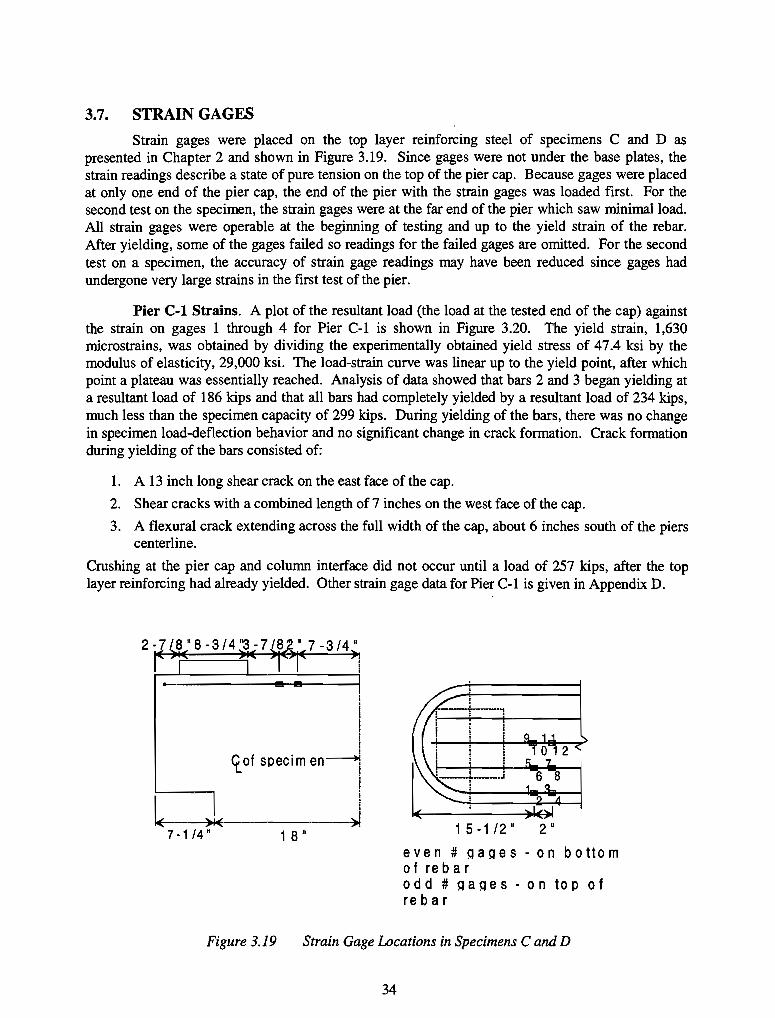
3.7. STRAIN GAGES
Strain gages were placed on the top layer reinforcing steel of specimens C and D as presented in Chapter 2 and shown in Figure 3.19. Since gages were not under the base plates, the strain readings describe a state of pure tension on the top of the pier cap. Because gages were placed at only one end of the pier cap, the end of the pier with the strain gages was loaded fIrst. For the second test on the specimen, the strain gages were at the far end of the pier which saw minimal load. All strain gages were operable at the beginning of testing and up to the yield strain of the rebar. After yielding, some of the gages failed so readings for the failed gages are omitted. For the second test on a specimen, the accuracy of strain gage readings may have been reduced since gages had undergone very large strains in the fIrst test of the pier.
Pier C-l Strains. A plot of the resultant load (the load at the tested end of the cap) against the strain on gages 1 through 4 for Pier C-l is shown in Figure 3.20. The yield strain, 1,630 microstrains, was obtained by dividing the experimentally obtained yield stress of 47.4 ksi by the modulus of elasticity, 29,000 ksi. The load-strain curve was linear up to the yield point, after which point a plateau was essentially reached. Analysis of data showed that bars 2 and 3 began yielding at a resultant load of 186 kips and that all bars had completely yielded by a resultant load of 234 kips, much less than the specimen capacity of 299 kips. During yielding of the bars, there was no change in specimen load-deflection behavior and no signifIcant change in crack formation. Crack formation during yielding of the bars consisted of:
1. A 13 inch long shear crack on the east face of the cap.
2. Shear cracks with a combined length of 7 inches on the west face of the cap.
3. A flexural crack extending across the full width of the cap, about 6 inches south of the piers centerline.
Crushing at the pier cap and column interface did not occur until a load of 257 kips, after the top layer reinforcing had already yielded. Other strain gage data for Pier C-l is given in Appendix D.
L )I( 7·1/4"
i
I <t of speci m en----'1
! I
)/ 1 8 II 15·1/2" 2 •
eve n # Q a Q e s - 0 n b 0 tto m of re bar odd # Q a Q e s • 0 n to p 0 f re bar
Figure 3.19 Strain Gage Locations in Specimens C and D
34

300r-~:----~.~····~····~··~···~1~ y~~~~~~~:~,------~~--~-=-~-~ j ........ .. .tI~' ~,~ r .:::::.a _---i .. ·· .. ····· ~ ____ --.-:::~~~+ .. ------*""'\" ,'"
250 ~ -:: .. :::.*.:= ;.:;.....................: ' uAuE 1
'[ V;V~ f J
~200 tr i ~;H. f GAGE 3-/ '.i o f#i GAGE 4-,.,1 .: 150 i.J. i f
~ 100 I! ! I t-GAGE2
~ if l-VIELD ~ I,.! i STRAit f : ~~GAGES1-4
50 f I! • I
O~~----~----~--~----~--~------~--------~------~ o 5000 10000 15000 20000 25000 30000
MICROSTRAINS (in/in)
Figure 3.20 Resultant Load vs. Strain on Gages 1·4 for Pier C-l
Pier D-l Strains. A plot of resultant load versus the strain in gages 9 through 12 for Pier D· 1 is shown in Figure 3.21. Strain gages for Pier D-l had a behavior similar to Pier C-l, with the load-strain curve linear up to yielding before reaching a plateau. There was a jump in strain between loads of 48 and 67 kips, corresponding to the formation of the first flexural crack across the top of the cap which ran between the sets of gages. Bar 1 yielded at a load of 129 kips, bar 3 yielded at 152 kips, and bar 2 yielded between 152 and 173 kips. Again, yield loads were significantly lower than the pier capacity of 203 kips. For Pier D-l, there was a good correlation between yield in the bars and crack formation. Cracking forming during yield of the bars is described below.
1. The flexural crack at the interior edge of the base plate grew to extend across the depth of the pier cap on both faces of the specimen. Prior to yielding, the flexural component on the west face of the pier was 1 and 1/4 inches long, and there was no flexural component on the east face of the pier.
2. A flexural crack extending across the width of the pier formed at the center of the pier cap.
3. The first shear crack formed and extended across the full depth of the west face of the pier cap.
While significant cracking occurred during yielding of the bars, there was no change in loaddeflection behavior as bars yielded. Crushing occurred after the bars had yielded, and corresponded to the specimen capacity of 203 kips. Other strain gage data for Pier D-l is given in appendix D.
Pier C-2 and Pier D-2 Strains. Plots of resultant load versus strain on gages 5 through 8 for Pier C-2 and Pier D-2 are shown in Figure 3.22 and Figure 3.23, respectively. Strain gage readings for both tests were comparatively low, reaching a maximum of about one half the yield strain. Low strains were expected on the second test of a specimen since the resultant load nearest the strain gages was low, about 50 kips. However, at these small loads strains in the rebar were significantly
35

300 I I I I I
I GAG ::10 I I
/GAGE 11 I \ I --=- ! I
. '" .. .-I .".r- ~.:. ... ~-... ;;: ...... ; .. .. .::;-~ .. - .. - .... ..-! : .... ··1 • ; 611.;::;· .. ·-.. , i ! I '[t:? ..... t ~ # .. , I! ,. !
250
I ._. I.' ~ Lf II I -E-GAGES 9-12 GAGE 9 J.. !II
'0 a. JZ -0 « 9 I-Z
~ :..J :::> CD UJ a::
50
/!_ YIELD ! STRAI~
a o
100
90
80
70
60
50
40
i I I I I
5000
Figure 3.21
uJ:\GE6 / GtGE5
J 1- - '" , 1 If __ fI-
iii .: I. iii ~ J ... -" ~ ".
.. I Ii
/ ! 11- GAGE A ! / 12 I !
:
;. , ~ t I i J ,
; II •
10000 15000 20000 25000 MICROSTRAINS (in/in)
Resultant Load vs. Strain on Gages 9 Q 12 for Pier D-1
I .-'""'
I
I ! I I
I I
l..- I I I I
GAGE 7 I I
( +- GAGES 5-8 I -- _. Jt .. I
.i" I
" I
....•..•.. ........... -I l/L .. STRAIN .. ~ ....... I
~ .•.. / ... I I
..-:::GAGE 8 I
30
20
iI. -I. ~ .. , /V
I
!iii .- I ./.! .•... .. ' .' I .'
:tf /. . .' /. .... ........ ~,~ tjl' .......
...... ~~. .... 10
o o 200 400
I I I
I I 1
600 800 1000 1200 1400 1600 MICROSTRAINS {in/in}
Figure 3.22 Resultant Load vs. Strain in Gages 5 - 8 for Pier C-2
36
30000
1800

-(I) Co :.s2 -Cl ..:(
9 ~ j5 ;..J ::J
III a:
100 1 ! I
90
80 I I J
I , i I I
70 I I
60 iE-GAGES5-
I ... ~ I I I
50
40
30
20
10
,GAr:. E5 , /,::, lnt::~ I
,IJ .~-/ -1
I
GAGE 8, l* YIELD- 'i
\ .. ~; ~ 7,/ STRAIN .•. -$":1;" i .... .;;<-~ ~.~ ':. ........ ~ ~ . ..:., .;., ",,*" ".
i
~ .:~ ~ .. ~ ".- "';"'~ ~~~~.
,,~/ ....... [\ . ... '""'"
/C'tI< ~ ;;- \GAGE7 ............ -o o 200 400 600 800 1000 1200 1400 1600
MICROSTRAINS Onlin)
Figure 3.23 Resultant Load vs. Strain in Gages 5 - 8 for Pier D-2
1800
higher than in the first test on a specimen as shown in Table 3.4 which compares the average strain on all gages at a given load for the two tests on a specimen. For the first test on a specimen, the uncracked concrete carried tension at these small loads. However, for the second test on a specimen the concrete at the strain gage location was already cracked so the steel had to absorb all the tension, resulting in the larger strains at a given load. Again, complete strain gage data for Pier C-2 and Pier D-2 is given in appendix D.
Table 3.4 Comparison of Strain for the First and Second Tests on a Specimen
Specimen Load Average (kips) Microstrain
C-l 58.8 155
C-2 58.0 408
D-l 47.5 81
D-2 43.1 801
37
38

CHAPTER 4
ANALYSIS OF RESULTS
4.1. INTRODUCTION
In this chapter. test results are summarized and the specimen capacities predicted by different design methods are compared with test results. First, conventional design methods from the 1992 AASmO provisions and ACI 318-89 (ACI 1989) code are examined. The two design methods most suited to the problem geometry are the corbel and deep beam provisions from AASmO Section 8.16.6.8 and ACI 318-89 Chapter 11, respectively. Next, the strut and tie method is used to predict the pier cap strength using two strut and tie models. To demonstrate the use of the strut and tie method, a sample design of a :full size pier cap using this method is presented. The strut and tie method is also used to predict the strength of a typical pier cap design .. Finally. criteria for judging constructed pier caps through field inspection are given. It should be noted that the above approaches for sizing a pier cap and its reinforcing are all design methods. Thus, the use of these methods as analysis tools requires making some judgements to predict the specimen strength based on the actual reinforcement used. The analyses focused on specimens A and C because those two specimens are most representative of reinforcing that has been and would be used in the pier cap.
4.2. DISCUSSION OF TEST RESULTS
The ultimate strengths of the test specimens are shown in Table 4.1. Specimen capacity is directly related to the amount of horizontal reinforcing, which is needed to develop the action of a tied arch. The effect of the amount of steel in the top layer of the pier cap is shown by a comparison of specimens A and C. Specimen A, with #6 bars in the top layer had a capacity Pu = 395 kips, while specimen C with #3 bars in the top layer had a capacity of Pu = 299 kips. The only difference in reinforcing for specimens A and C is the size of the bars in the top layer. Tabl 41 Ti S. Sty, ths e . est .,peCllnen eng
The ability to develop the strength of the bars in the top layer of the cap is also critical. Specimen B is identical to specimens A, except that in the top layer of the pier cap only straight #6 bars are used, resulting in very small anchorage lengths. The small anchorage lengths provided for the top bars of Pier B are inadequate to develop the required bar force, as bond distress was observed during testing. The capacity of specimen B was 323 kips, much less than specimen A capacity.
The quantity and anchorage of steel in the top
Specimen
A B C D E
Average Static Capacity (kips)
395 323 299 209 269
layer of the pier has a large influence on specimen strength, and the importance of the steel can be explained considering specimen failure modes. As load was increased on a specimen, crushing at the pier cap/column interface eventually occurred. To carry more load, the compression strut has to move further into the column, requiring a larger tie force to maintain equilibrium. In specimens B, C, D, and E, the capacity of the bars in the top layer of the pier cap was limited, so failure was reached soon after crushing at the pier cap/column interface began.
39

The placement of the intermediate hoops (bars B) also has a considerable effect on specimen strength as shown by a comparison of piers C and D. Piers C and D are identical except that bars B (and bars U) are removed from specimen D. Without the intermediate hoops, specimen D capacity was only 209 kips, as compared to 299 kips for specimen C. The mechanism by which bars B contribute to the specimen capacity is not as clear as for the bars in the top layer of the pier cap. The intermediate hoops closest to the top of the pier see the largest force, so those bars act mainly as tension ties. The intermediate hoops also can resist loads by dowel action.
Examination of the specimens shows that bearing failure did not limit the capacity of any of the specimens, although punching of the base plates was seen on all specimens. The conclusion that bearing strength did not limit pier cap strength comes from a comparison of the concrete damage seen in the first and second tests on a specimen. For the first test on a specimen very limited punching occurred, while for the second test of a specimen in which large deformations were forced, more significant punching occurred. Thus, most of the punching occurs after a specimens capacity has already been reached. For specimens A, which had the greatest capacity, the average bearing stress sustained was 5.16 ksi, or 1.27 t' (t' = 4,050 psi). The bearing strength on top of the pier cap is helped by the continuou~ rebar (bar n around the perimeter of the cap, which provides confinement. The bearing stress, fb, sustained can be compared to the load factor design provisions for bearing of AASHTO section 8.16 with the <l> factor removed.
From AASHTO (1992):
where
0.85 t,. ~ A, ~ ultimote bearing stress Ai
f e• = 4,050 psi
Ai = base plate area 76.56 in' A, = surrounding concrete area 187.7 as a maximum
so
(4.1)
When the <l> factor is not applied to code provisions, the code specified ultimate bearing stress and largest tested bearing stress agree, 1.33 t' and 1.27 t', respectively. Since the applied bearing stress was slightly less than the code value, and bearing failure did not occur, no conclusions can be reached regarding the maximum permissible bearing stress. Further testing needs to be conducted to determine the bearing strength at the top of the pier caps.
40

4.3. CORBEL ANALYSIS
The pier cap geometry studied looks quite similar to a corbel, so the corbel provisions were the first application of conventional analysis to predict specimen capacity. The action of a corbel as used in the 1992 AASIITO code is shown in Figure 4.1. The corbel design technique is intended for span to depth ratios less than one, where ordinary flexural theory is not applicable (Salmon 1985, ACI 1989). In the AASIITO (1992) corbel code provisions, the shear strength comes entirely from shear friction.
d
The AASIITO (1992) code procedure Figure 4.1 gives an area of steel in the top layer of the corbel based on two checks. The first check considers shear, while the second check
Forces contributed by horizontal stirrups or ties are neglected.
Force Distribution Assumed in Corbel Code Provisions (Salmon 1985)
considers moment. The intermediate stirrups are sized based on the amount of steel in the top layer of the corbel. For the pier cap geometry chosen., the check based on shear controls because the moment is extremely small. Using the AASIITO (1992) code as an analysis method gives:
(4.2) Vn = 1.5 Av f y u, the nominal shear strength ~ 0.2 f c'bd and [800 psi]bd
where
Av = the area of steel in the top layer of the corbel
[bars A and T in the specimen]
Jl = coeffiCient of friction for normal weight concrete cast monolitically = 1.4
b = the corbel width
d = depth oj reinforcing shown in Figure 4.1
The multiplier of 1.5 reflects the benefit of the additional layers of stirrups. A comparison of corbel design strengths and the test. results for specimens A and C is shown in Table 4.2. For specimen A, the limiting shear strength controlled the corbel design strength. As the results show, the corbel provisions are inadequate to predict pier cap strength because they only consider shear friction to resist applied loads and ignore the inclination of the compression block.
41

Table 4.2 Test Specimen Capacity Compared to the Strength Predicted by Conventional Design Methods
Corbel Specimen Average Test Corbel Design Deep Beam Parameters
Capacity Strength Strength (kips) (kips) (kips) Av t;,
(in2) (ksi)
A 395 151 95 2.2 60
C 299 55 95 0.55
4.4. DEEP BEAM ANALYSIS
The deep beam provisions in the ACI 318-89 code also appear applicable to the pier cap design. These provisions reflect the different behavior and capacity of beams with span to depth ratios less than five (Salmon 1985, ACI 1989). The deep beam provisions follow the same basic approach used to find the shear strength of a regular beam, with the concrete and stirrups both contributing to the shear resistance as shown in Equation 4.3.
Vn = Va + Vs =:;; 8~fa.bwd where
Va shear strength from concrete V s = shear strength from steel stirrups
(4.3)
For the deep beam provisions, the Vc tenn includes the effect of the ratio MjVu at the critical section. Also, the Vs tenn considers the contribution of horizontal stirrups to the shear resistance. Using the deep beam provisions for specimens A and C, the upper limit on shear strength controlled. The design capacity for both specimens was 95 kips, much less than the test capacity given in Table 4.2. Thus, the deep beam provisions are also inadequate for the design of the pier cap region.
4.5. THE STRUT AND TIE DESIGN METHOD
4.5.1. Introduction
Obviously, traditional design procedures for shear in the 1992 AASHTO and ACI 318-89 codes are inadequate to realistically predict the strength of the pier caps tested. The load carrying capacity of the pier cap comes from direct compression of an inclined strut, and this action is not explicitly covered in the 1992 AASHTO provisions or the ACI 318-89 code. The inadequacy of normal design codes is not limited to the pier cap studied, but also to other abnormal regions of structures where plane strain conditions do not exist (Bergmeister et. al. 1990, Schlaich et. al. 1987). In contrast, the strut and tie method is well suited to the design of abnormal geometries because the method simplifies the behavior of an indetenninate region into discrete load carrying members (Schlaich 1987). Essentially, the strut and tie method is a more general application of the classical truss analogy used for beams. The method is also similar to the tension field concept for the shear
42

strength of steel plate girders. The strut and tie method is used to break a structure into a static force system composed of three elements (Bergmeister 1990):
1. compression struts
2. tension ties
3. nodes
Some examples of strut and tie model~ are shown in Figure 4.2. The strut and tie model essentially forms a truss to resist loads applied to the structure. As in a truss, forces are uniaxial and change direction only at the nodes. One of the benefits of using a strut and tie model is a better understanding of the distribution of forces within the structure, allowing the engineer to more successfully detail reinforcing.
a MOMENT OPENING CORNER Co CORBEL
~
- TIES b. MOMENT ClOSING CORNER - STRUTS
[?)~ \..J \..J
d. OEEPBEAM
Figure 4.2 Examples of Strut and Tie Models (from Schlaich 1987)
A detailed discussion of the theory behind the strut and tie method is beyond the scope of this research. However, the most important concepts relevant to the pier cap design are covered. An excellent sunnnary of the strut and tie method in general is given by Anderson (1988), and a thorough background of the design Concept is given by Schlaich (1987). Finally, a sunnnary of the state of the art of the strut and tie method and tests on strut and tie elements is given by Bergmeister et. al. (1990) from which stress limits for the concrete are chosen.
4.5.2. Major Assumptions of the Strut and Tie Method
Perhaps the most important consideration in examining the use of a strut and tie model for design is its adherence to the lower bound theorem. The lower bound theorem states that a load carrying system based on a statically allowable stress field which does not go beyond the yielded state is a lower bound to the limit load (Bergmeister 1990, Yura 1992). As a condition of this theorem, the
43

statically allowable stress field must satisfy equilibriwn and boundary conditions (Bergmeister 1990, Yura 1992). The use of a lower bound method is well suited to concrete, as concrete has little ability to undergo plastic deformations. Thus, the strut and tie model should be chosen so that the deformation capacity of the concrete is not exceeded before the structure reaches its asswned state (Schlaich 1987). To meet this condition, Schlaich (1987) suggests the strut and tie model should be oriented based on elastic stress fields. Therefore, a strut and tie model based on elastic stress fields represents a lower bound solution, and will give conservative results so long as sudden failures due to instability or localized crushing are prevented (Bergmeister 1990).
In applying the strut and tie model, five major asswnptions are made (Bergmeister 1990, Anderson 1988):
L Failure coincides with the formation of a mechanism caused by yielding of one or more of the ties.
2. Concrete does not crush prior to yielding of the ties. The crushing is prevented by limiting stress in the concrete.
3. Forces in the struts and ties are uniaxial.
4. All external loads are applied to nodes of the strut and tie model. When distributed loads exist, the model must realistically fit the applied loading.
S. Reinforcement is detailed so bond and anchorage failures are prevented.
4.5.3. Creation of a Strut and Tie Mode)
To apply the strut and tie model to a structure, Schlaich (1987) proposed breaking a structure I
up into "BII and liD" regions as shown in Figure 4.3. The B regions adhere to Bernoulli's asswnption of plane strain, so internal forces for these regions are known. The D regions consider discontinuities in the structure where the distribution of strain is extremely non-linear (Schlaich 1987) such as the pier cap studied. The design of B regions is very well docwnentecL so the use of the strut and tie model is typically applied to D region design.
&. GEOMETRIC DISCONTINUITIES
b. STATIC AND/OR GEOMETRIC DISCONTINUITIES
Figure 4.3 B and D Regions (Shaded) of a Structure (from Schlaich 1987)
44

Once the B and D regions are identified, the strut and tie models for the D regions can be fonnulated. Schlaich (1987) gives two main techniques for finding the layout of struts and ties in a model. In the first method, a finite element analysis of the D region can be made to detennine the distribution and orientation of principal stresses in the region. The struts and ties can then be aligned with the axes of the corresponding principal stress fields (Schlaich 1987). The second method, the "load path method", can be used to detennine the strut and tie model if an elastic analysis is not possible, or if the internal distribution of forces is evident. For the load path method, all sectional forces, loads, and reactions acting on the boundaries of the D region are found. Using the stresses on the cross section as boundary conditions, stress distributions on one side of the D region are connected with their corresponding boundary conditions on the other side of the D region as shown in Figure 4.4. The struts and ties should be oriented at the centroids of the respective stress diagrams. With the main load paths arranged, additional struts and ties are added to allow equilibrium at the nodes (Schlaich 1987).
I I
! I i I
I
LOAD - I J PATH I I I
/ / \, I
/ t t t
Figure 4.4 Use of the Load Path Method to form a Stnlt and Tie Model (from Schlaich 1987)
Finally, the quality of the strut and tie model can be judged realizing that loads in a structure follow the path of least resistance. As Schlaich notes (1987), the ties are much more deformable than the struts, so the model with the least ties is best by an energy cntenon. An example of this concept is shown in Figure 4.5.
Figure 4.5
45
L GOOD MODEL b. BAD MODEL
\,
\\
The Good Stnlt and Tie Model has Shorter Ties Than the Bad Model (from Schlaich 1987)

4.5.4. Individual Elements of the Strut and Tie Model
4.5.4.1. Ties. Ties are tension carrying elements and in the pier cap can consist of reinforcing steel or
concrete carrying tension. In this research, only reinforcing steel was considered. The strength available to a tie is taken as the yield capacity of the bars:
T As/y
where
As = the area 0/ steel in the tension tie
/ y = the yield stress 0/ the steel
(4.4)
The strength check for the tension ties is very straightforward, but there are several other concerns. First, following the major assumptions of the strut and tie method, the main reinforcement should yield at the ultimate load. To allow a ductile failure, the bars must be able to undergo plastic defonnations before crushing of the concrete begins (Bergmeister 1990). Second, the bars must be able to develop the required strength at the node location. This condition means that the bars must have adequate anchorage behind the node. Also, tension steel should be evenly distributed over the full width of the tension tie. Finally. consideration should be given to crack control under service loads.
4.5.4.2. Struts. Struts are compression carrying elements and consist of concrete and compression steel that
does not buckle. Three basic concrete compression struts are available as shown in Figure 4.6 (Schlaich 1987). The models proposed for the pier cap use only the prismatic compression strut (Figure 4.6.c).
Figure 4.6
Co PRISM ~~~~~
ttttt O'~ fod
The Three Compression Struts (a) The Fan (b) The Bottle (c) The Prism (from Schlaich 1987)
46

The allowable load in the strut is the sum of the contributions from the steel and concrete:
C = Cs + Ce
where
Ce = Aef cd = compression in the concrete
Cs Asf s = compression in the steel
where
Ac = area of the strut
f cd = design stress in concrete = v f c'
v = concrete effiCiency factor
f iii = stress in steel
(4.5)
The concrete efficiency factor accounts for the different strength of concrete in the structure as compared to the strength measured by cylinder compression tests. As presented by Bergmeister (1990), the efficiency factor accounts for conditions in the structure such as:
• a multiaxial state of stress
• cracking
• disturbances caused by reinforcing steel
• aggregate interlock
The efficiency factors are different for different types of struts. For undisturbed struts a larger efficiency factor is used, while if cracks interrupt the strut, a smaller efficiency factor is used (Scblaich 1987). Essentially, all struts in the proposed model are not interrupted by skew cracking. Thus, for the prismatic compression fields used, Bergmeister (1990) suggests using the following concrete efficiency factors:
v = 0.8for fe' :s;; 4,000 psi (4.6)
V = 0.9 - 0.25 f c' for 4,000 < fe' < 10,000 psi 10,000
V = 0.65 for f e' ~ 10,000 psi Since concrete strength was 4,000 psi for specimens A and C, \) is taken as 0.8 for the strut and tie models considered.
It is important to consider compatibility when examining concrete struts. Large compressive stresses in concrete struts give rise to transverse tensile stresses which can cause cracking and loss of capacity. Thus, it may be necessary to refine a model so transverse tensile forces are considered as shown in Figure 4.7 (Schlaich 1987).
47

4.5.4.3. Nodes. Nodes are the points in a strut and tie
model where truss forces change direction. Nodes combine three truss elements, so they are classified as either CCC, CCT, crr, or TIT nodes based on the forces in the truss members they connect (Schlaich 1987). For example, a CCT node is the intersection of two compression struts and a tension tie. Nodes can be further classified as singular or smeared (Sch1aich 1987). The models presented consider singular nodes, where the intersection of forces occurs in a small area around the theoretical node location (Sch1aich 1987). Bergmeister (1990) gives two considerations for dimensioning the nodes:
smess FIELDS STRUT AND TIE MODEL
Figure 4.7
1. The lines of action at the centroid of the ties, struts, and extemalloads must coincide.
.H ! \e . \ , "
i I i T Ie i I i I \ ;.
\ / H
Strut and Tie Model Considering Transverse Tensile Stresses (from Schlaich 1987)
2. The widths and relative angles of the struts and ties limit the dimensions of the sides of the nodes.
Obviously, the dimensions chosen for the nodes will affect the strength check for the nodes. Since the strength checks for nodes are not well defined, adherence to the above two recommendations to dimension nodes is probably adequate. The two node types used in the proposed strut and tie models are CCC and CCT nodes.
CCC Nodes. An example of a CCC node is shown in Figure 4.8. The ideal condition for a CCC node is a "hydrostatic" state of stress (Sch1aich 1987). In a CCC node, a hydrostatic stress state is achieved when all stresses on the faces of the node are equal, and when node faces are peIpendicular to their corresponding stress fields (Bergmeister 1990). An example of a CCC node in a hydrostatic state of stress is shown in Figure 4!9. In a hydrostatic stress state, both principal stresses in the node are equal to the boundary stress (Bergmeister 1990). Thus, since all boundary stresses must be within allowable limits, the stresses in the node are also within allowed limits. If a hydrostatic stress state at the node does not exist, Sch1aich (1987) suggests two conditions that should be met for the node strength to be considered satisfactory. First, nodes that have a ratio of stress on adjacent sides not less than 0.5 are probably satisfactory. Second, boundary stresses on the faces of a node should all ~e within their respective limits. Figure 4.8
48
CCC Node with Unequal Pressure (from Barton 1988)
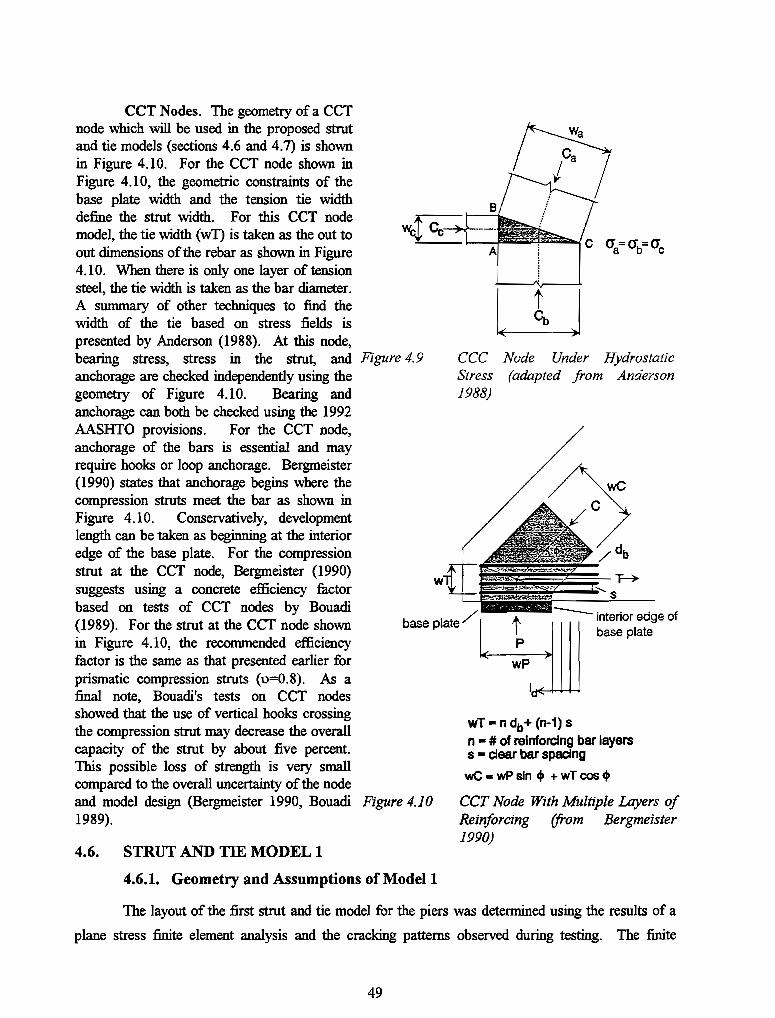
CCT Nodes. The geometry ofa CCT node which will be used in the proposed strut and tie models (sections 4.6 and 4.7) is shown in Figure 4.10. For the CCT node shown in Figure 4.10, the geometric constraints of the base plate width and the tension tie width define the strut width. For this CCT node model, the tie width (wT) is taken as the out to out dimensions of the rebar as shown in Figure 4.10. When there is only one layer of tension steel, the tie width is taken as the bar diameter. A summary of other techniques to find the width of the tie based on stress fields is presented by Anderson (1988). At this node, bearing stress, stress in the strut, and anchorage are checked independently using the geometry of Figure 4.10. Bearing and anchorage can both be checked using the 1992 AASHTO provisions. For the CCT node, anchorage of the bars is essential and may require hooks or loop anchorage. Bergmeister (1990) states that anchorage begins where the compression struts meet the bar as shown in Figure 4.10. Conservatively, development length can be taken as beginning at the interior edge of the base plate. For the compression strut at the CCT node, Bergmeister (1990) suggests using a concrete efficiency factor based on tests of CCT nodes by Bouadi (1989). For the strut at the CCT node shown in Figure 4.10, the recommended efficiency factor is the same as that presented earlier for prismatic compression struts (0=0.8). As a final note, Bouadi's tests on CCT nodes showed that the use of vertical hooks crossing the compression strut may decrease the overall capacity of the strut by about five percent. This possible loss of strength is very small compared to the overall uncertainty of the node and model design (Bergmeister 1990, Bouadi 1989).
4.6. STRUT AND TIE MODEL I
Figure 4.9 CCC Node Under Hydrostatic Stress (adapted from Anderson 1988)
base plate / I t ~--~
wP
--intatior edge of base plate
li~t-HH <.I
wT - n db+ (n-1) s n - # of reinforcing bar layers s - clear bar spacing we .. wP sin .; + wT cos';
Figure 4.10 CCT Node With Multiple Layers of Reinforcing (from Bergmeister 1990)
4.6.1. Geometry and Assumptions of Modell
The layout of the first strut and tie model for the piers was determined using the results of a
plane stress finite element analysis and the cracking patterns observed during testing. The finite
49

element program used was ANSYS. The finite element mesh is shown in Figure 4.11. Eight node
elements were used for the pier cap and column, while four node elements were used for the base plate.
To simulate loads from the roller, a pressure loading of 10 ksi was applied on two of the base plate
elements (total width = 1.46") as shown in Figure 4.12. Contour plots of principal tensile and
compressive stresses in the pier from the finite element analysis are shown in Figures 4.13 and 4.14,
respectively. The contour plots show that load is carried by a compression field that is nearly vertical,
with a tension field concentrated at the top of the pier to maintain equilibrium at the loading point. The
stress fields of the finite element analysis agreed with the general patterns of concrete distress observed
on the piers as shown in Figure 4.15.
4 NODE I:lI:UJ:UT.R BASEPLATE /1
-PIER CAP
=m:t -
Figure 4.11
-8NODE
-COLUM N
Mesh Used for the Finite Element Analysis
50
PRESSURE LOADING
mn
Figure 4.12 Loading Applied to the Finite Element Model

Figure 4.13 Contour oj Principal Tensile Stresses
Figure 4.14 Contour ojPrincipal Compressive Stresses
51

Figure 4.15 Failure Pattern for a Typical Specimen
Inspection of the contour plots shows that the load on the finite element model was applied at a small eccentricity relative to the edge of the column. This eccentricity of the load is not apparent when examining a profile view of the pier cap. However, by taking a slice through the piers longitudinal axis the shear span can be observed as shown in Figure 4.16. Slice "A" represents the largest shear span for the applied loading, so this shear span was used for the finite element analysis to examine the greatest inclination of the load path.
Figure 4.16
7-1W
ct OF ROLLER +-+--+--1-+1
4
PLAN VIEW OF TOP OF PIER CAP
load applied at the middle at the base plate
shear span a-1.4~
1.4
PROFILE AT SECTION A-A
Shear Span Modelled in the Finite Element Analysis
52
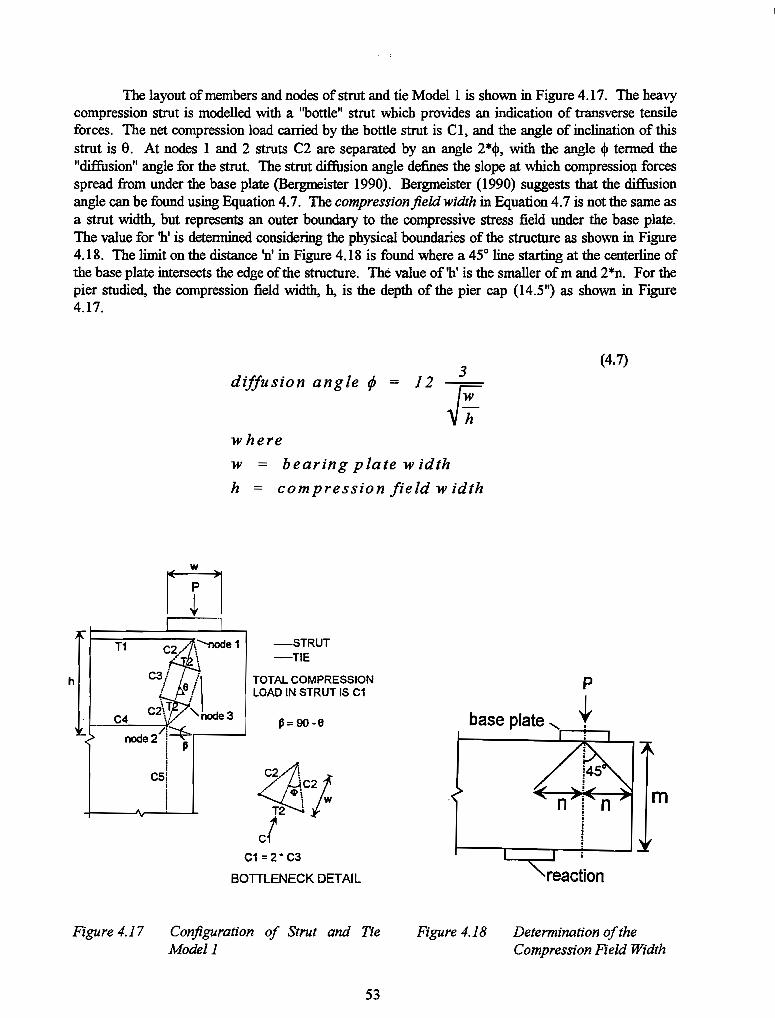
The layout of members and nodes of strut and tie Model 1 is shown in Figure 4.17. The heavy compression strut is modelled with a "bottle" strut which provides an indication of transverse tensile forces. The net compression load carried by the bottle strut is Cl, and the angle of inclination of this strut is 9. At nodes 1 and 2 struts C2 are separated by an angle 2*<p. with the angle <p termed the "diffusion" angle for the strut. The strut diffusion angle defines the slope at which compression forces spread from under the base plate (Bergmeister 1990). Bergmeister (l990) suggests that the diffusion angle can be found using Equation 4.7. The compressionjieldwidth in Equation 4.7 is not the same as a strut width, but represents an outer boundary to the compressive stress field under the base plate. The value for 'h' is determined considering the physical boundaries of the structure as shown in Figure 4.18. The limit on the distance 'fl' in Figure 4.18 is found where a 450 line starting at the centerline of the base plate intersects the edge of the structure. The value of 'h' is the smaller of m and 2*n. For the pier studied, the compression field width, h, is the depth of the pier cap (l4.5") as shown in Figure 4.17.
diffusion angle ¢ = 12 3
t; (4.7)
where
w = bearing plate width
h = compression field width
h
-STRUT -TIE
TOTAL COMPRESSION LOAD IN STRUT 15 C1
C1=2-C3
BOTILENECK DEI AIL
Figure 4.17 Conjiguration of Strut and Tte Modell
53
p
base plate" t '.----.....
reaction
m
Figure 4.18 Determination of the Compression Field Width

Several analyses of Specimens A and e were made using Model 1 (reinforcing is described in section 2.2.2). The steps for conducting the analyses are given below.
1. Beginning at node 1, the force in the main tension tie (T I) was asswned.
2. The angle of inclination, e, of the main compression strut (e1) was asswned.
3. Using the force T1 and angle of inclination from steps 1 and 2, all forces in the strut and tie The centroid of compression strut e5 was then found, considering that the maximwn concrete strain is located at the edge of the column. The centroid location is shown in Figure 4.19.
4. The centroid location computed in step 4 was then compared to the centroid location predicted by the angle of inclination asswned in step 2. If the two locations agreed, the system was in equilibriwn. If the centroids did not match, the procedure returned to step 2, and further iterations were made as needed.
When choosing the force in T 1 in step 1 above, the tie forces were always asswned less than or equal to the yield capacity of the existing steel. For Tl, the corresponding rebar in the specimen is bars A and T. For Piers A the tie capacity was 132 kips, while for Pier e the tie capacity was only 26.1. Both tie capacities are based on using the full yield strength of the bar as determined by tensile tests.
To find the centroid of compression strut e5 in step 4 above, compression carried by the column steel was considered. The inclusion of compression steel to the force in e5 meant that a transformed area approach had to be used to find the centroid of strut e5. Since column steel compression strains were not measured during tests, three compression forces from the steel, e s,
were considered:
1. es = O.
P
t
A STRUTC{ A )1 _I( x
PROFILE OF PIER CAP
LOCATION
_r\r,cr.. OF COMPRESSION STRUT
SECTION A-A
Figure 4.19 Centroid Location for the Column Compression Strut
2. e s = 58 kips. This force was determined using compatibility between the steel and concrete. The concrete deforms under load, so the compression steel is subjected to the same strains as the concrete. Knowing the maximwn stress allowed in the concrete, the steel stress was computed as shown below:
54
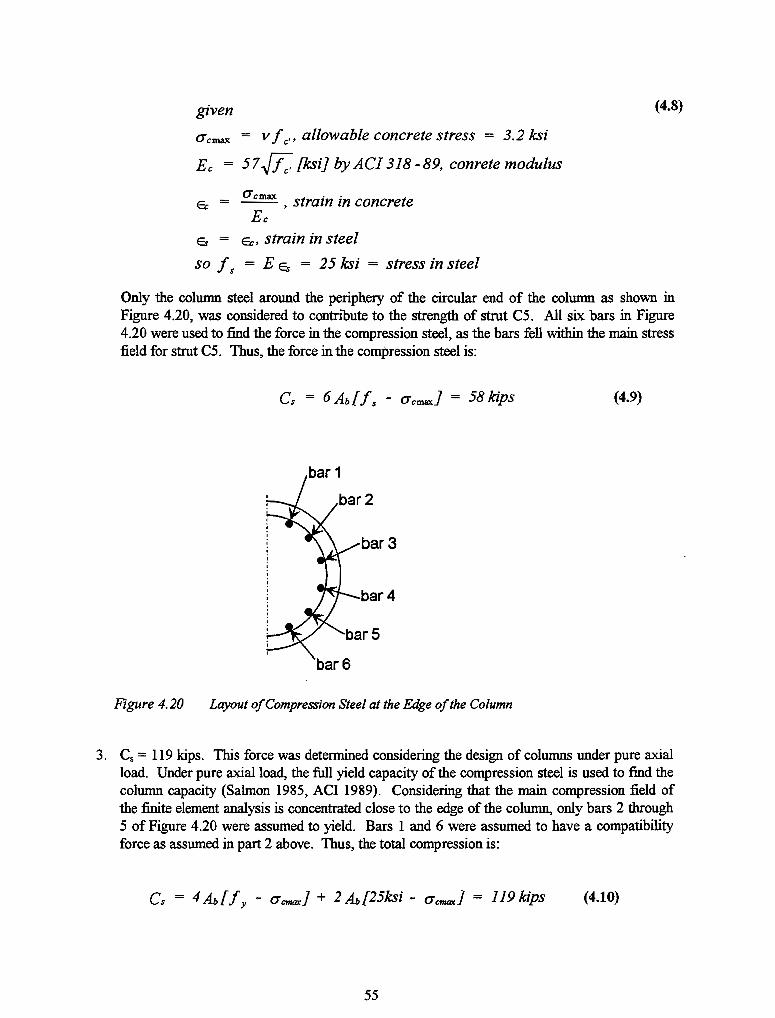
given
O"emax = V Ie" allowable concrete stress = 3.2 ksi
E e = 57.J Ie' [ksi) by A CI 318 -89, conrete modulus
Ec = 0" emax , strain in concrete Ee
G 6:, strain in steel
so Is = E G = 25 ksi = stress in steel
(4.8)
Only the colwnn steel around the periphery of the circular end of the column as shown in Figure 4.20, was considered to contribute to the strength of strut CS. All six bars in Figure 4.20 were used to find the force in the compression steel, as the bars fell within the main stress field for strut CS. Thus, the force in the compression steel is:
Cs = 6 Ab! Is - 0" cr:naxl = 58 kips (4.9)
barS
bar 4
Figure 4.20 Layout of Compression Steel at the Edge of the Column
3. Cs = 119 kips. This force was determined considering the design of columns under pure axial load. Under pure axial load, the full yield capacity of the compression steel is used to find the colwnn capacity (Salmon 1985, ACI 1989). Considering that the main compression field of the finite element analysis is concentrated close to the edge of the column, only bars 2 through S of Figure 4.20 were assumed to yield. Bars 1 and 6 were assumed to have a compatibility force as assumed in part 2 above. Thus, the total compression is:
Cs = 4 Ab! Iy - O"cmaxl + 2 Ao!25ksi - O"cmaxl = 119 kips (4.10)
55

Both of the compression forces used above are arbitrary, but allow a reasonable approach to account for the column compression steel.
When examining results from the strut and tie analyses, the force in strut C 1 was checked to insure the validity of the model. The force allowed in C 1 was calculated in accordance with the CCT node geometry of Figure 4.10, with the concrete efficiency factor as presented earlier. Thus, the limit on C1 is shown in Equation 4.11. Since concrete strength was very close for specimens A and C, a value of 4,000 psi was used for fe'.
C = AcFc
where
f c = allowable stress = 0.8 f c'
Ae = bw b = thickness of pier cap, 14.5"
w = strut width based on Figure 4.10
4.6.2. Analysis Results from Strut and Tie Modell
(4.11)
The analysis results using Modell with several different combinations of T1 and Cs are shown in Table 4.3. Only the analyses satisfying allowable stresses for C1 and T1 are presented. For specimen C, the model with Cs=1l9 kips is not listed as the column bars that were assumed to have yielded did not fit within the calculated compression field. The results from tests on Specimens A and C are summarized in Table 4.4. Physically, the analysis models agree with the test results as the angles of strut C 1 inclination for the strut and tie models are close to the observed cracking patterns. For Pier A, the loads predicted by the strut and tie analyses agreed very well with test results. For Pier C, however, the strut and tie model was extremely conservative, predicting less than half the tested capacity. The strut and tie results for Pier C showed better correlation to the load at which reinforcing in the top layer yielded during testing, about 200 to 217 kips. It is reasonable that the strut and tie model is more accurate in predicting the specimen yield load, because the strut and tie method assumes failure occurs with yielding in the ties as discussed in section 4.5.2. The discrepancy between Modell strength predictions and the tested specimen capacities can be accounted for by load carrying components other than the tie/arch action accounted for in the strut and tie model. Additional strength may come from dowel action, aggregate interlock,. and shear transfer in the uncracked concrete (Salmon 1985).
The compression steel force assumed in strut C5 had a significant impact on results of the strut and tie analyses. There was a direct correlation between Cs and the predicted pier capacity, with the pier capacity rising with larger Cs values. This trend can be explained by looking at the inclination of strut C 1. As the force in the compression steel rises, the centroid of C5 moves closer to the edge of the column, increasing the angle of inclination of strut C 1. For a larger angle of inclination, the vertical component of the main strut increases, enlarging the predicted specimen capacity. The extent of this increase in capacity is limited by the allowable compression stress in the main compression strut, and the capacity of the tension tie Tl.
56

able 4.3 Specimen Capaci y and Member Forces I!!.r Strut and Tie Modell
Pier A Pier C
Analysis 1-1 1-2 1-3 1-4 1-5
Capacity, P 311 344 373 132 159
ratio of theory/test 0.79 0.87 0.94 0.44 0.53
Inclination, a 1 67.0 69.0 70.5 78.8 80.7
Compression in Steel 0 58 119 0 58 i Tl 132 132 132 26.1 26.1
T2, horizontal 44.3 49.0 53.1 18.8 22.7 I i
n, vertical 18.8 18.8 18.8 3.7 3.7 I[
Forces Cl 338 368 395 134 162
(kips) C2 176 191 206 69.9 84.0 i i
C3 169 184 198 67.2 80.8 i
C4 132 132 132 26.1 26.1
C5 311 344 373 132 159
Centroid 4.68 4.35 4.09 2.52 2.11
Tab Ie 4.4Tested Capacities for Pier A and Pier C
Pier A Pier C
Average Capacity 395 299
: Average Inclination of Main Strut Cracks 66° 75°
Test 1 Capacity (kips) 368 298
Test 2 Capacity (kips) 387 299
Test 3 Capacity (kips) 430 -
The difficulty of using a strut and tie model as an analysis tool can be seen by considering tie n. The horizontal and vertical components of T2 are listed in Table 4.3 because those components match the orientation of stirrups (bars B and S) in the pier cap. Considering the layout of reinforcing in the test specimens, the limits for the components ofT2 are given in Table 4.5. For both Piers A and C, the strut and tie analysis predicts larger forces than the stirrups can handle. However, the Table 4.5 magnitude of T2 depends greatly on the diffusion angle, which is only generally known. Also, tension in the concrete has not been considered. Because of the uncertainty of the magnitude of transverse tensile forces, the inadequacy of stirrups as predicted by the strut and tie model was ignored because all the analysis results were conservative. When examining member forces from an assumed model, the allowed stresses on Tl and Cl were
57
MaximumT2 Horizontal
MaximumT2 Vertical
Limitations on the Components ofT2 Based on Reinforcing in
e es >peClmens thTitS'
Pier A PierC
19.8 kips 15.6 kips
6.6 kips 5.2 kips

used to judge the validity of the analysis as T 1 and Clare the most critical load carrying components of the model.
4.7. STRUT AND TIE MODEL 2
The second strut and tie model was created to increase the predicted capacity for Pier C, and is shown in Figure 4.21. Model 2 follows the main stress fields of the finite element analysis, but considers the restraint of the horizontal stirrups individually. For Pier C, the forces in the intermediate stirrups (TI-T4) were chosen as the yield capacity of the bars to give the maximum benefit of each tie. While this assumption gave the best results for the model, it is not certain that all of the ties across the pier cap depth yielded. The assumption that all the intermediate stirrups yielded is consistent with a linear distribution of strain across the depth of the pier cap. At the ultimate load for specimen C, the maximum crack size at the top of the pier was approximately 1/16", and the average strain in the top layer reinforcing steel was about 12,000 microstrains. Since cracking extended across the full depth of the pier at the peak load and strain at the top layer was very large, it is probable that at least two layers of the intermediate stirrups yielded in specimen C. For Pier A, the force was found by assuming a linear distribution of strain across the pier cap height, with the maximum strain found in the top layer of reinforcing.
I I node 1
T1 C11~61 T2 .-node2
c2i 1 node 3
T3 C3!
---·STRUT -TIE
:_node4 T4 " C4,,664
-C5-7r~ node 5 I Ii
~= 90-64
C61 : : i !
A. : V'
Figure 4.21 Configuration o/Strut and Tie Model 2
The capacities and member forces for Specimens A and C as predicted by Model 2 are given in Table 4.6. The second model did predict a greater capacity for Pier C, but the analysis results were still much less than the tested capacity. Model 2 predicts a greater load than Model 1 for an assumed Tl and Cs• This increased strength occurs because the second model has a larger angle of inclination at node 1, increasing the vertical component of strut C1. In Model 2, the centroid of the compression strut was located further in the column than for Model 1 because the compression strut changes inclination at each horizontal stirrup.
58
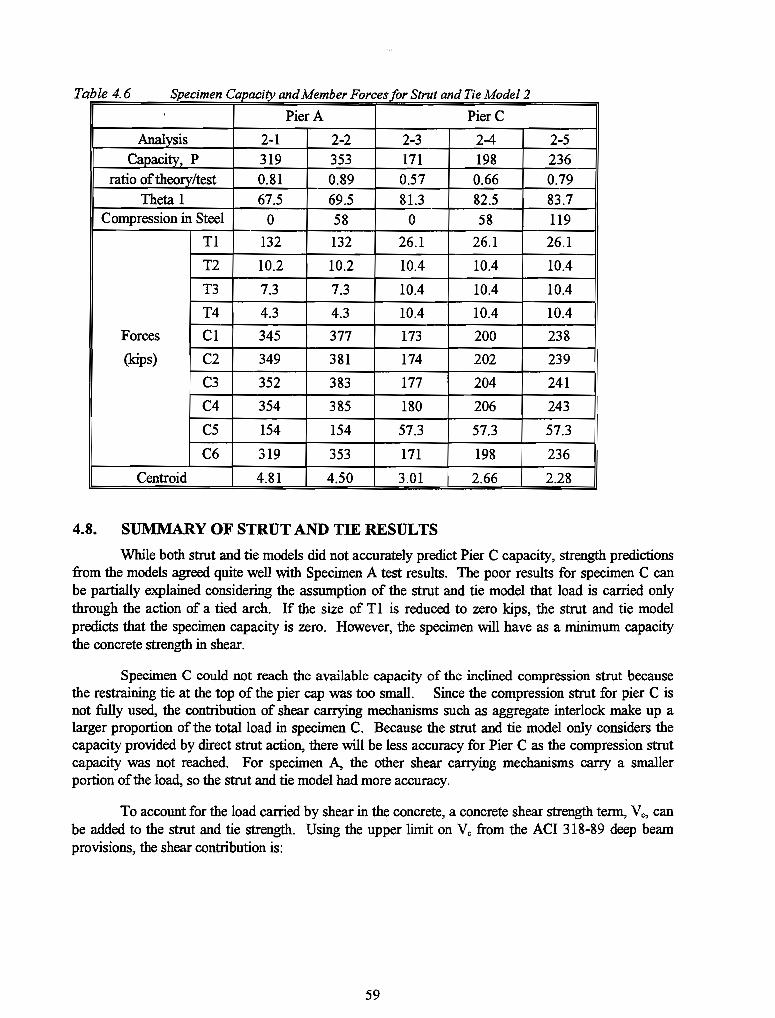
Tabl e 4.6 Specimen Capacity and Member Forces for Strut and Tie Model 2
Pier A PierC
Analysis 2-1 2-2 2-3 2-4 2-5 Capacity, P 319 353 171 198 236
I ratio of theory/test 0.81 0.89 0.57 0.66 0.79 Theta 1 67.5 69.5 81.3 82.5 83.7
Compression in Steel 0 58 0 58 119
Tl 132 132 26.1 26.1 26.1
T2 10.2 10.2 10.4 10.4 10.4
T3 7.3 7.3 10.4 10.4 10.4
T4 4.3 4.3 10.4 10.4 10.4
Forces Cl 345 377 173 200 238
II (kips) C2 349 381 174 202 239
C3 352 383 177 204 241 i
C4 354 385 180 206 243 I
C5 154 154 57.3 57.3 57.3
i C6 319 353 171 198 236
Centroid 4.81 4.50 3.01 2.66 2.28
4.8. SUMMARY OF STRUT AND TIE RESULTS
While both strut and tie models did not accurately predict Pier C capacity, strength predictions from the models agreed quite well with Specimen A test results. The poor results for specimen C can be partially explained considering the assumption of the strut and tie model that load is carried only through the action of a tied arch. If the size of Tl is reduced to zero kips, the strut and tie model predicts that the specimen capacity is zero. However, the specimen will have as a minimum capacity the concrete strength in shear.
Specimen C could not reach the available capacity of the inclined compression strut because the restraining tie at the top of the pier cap was too small. Since the compression strut for pier C is not fully used, the contribution of shear carrying mechanisms such as aggregate interlock make up a larger proportion of the total load in specimen C. Because the strut and tie model only considers the capacity provided by direct strut action, there will be less accuracy for Pier C as the compression strut capacity was not reached. For specimen A, the other shear carrying mechanisms carry a smaller portion of the load, so the strut and tie model had more accuracy.
To account for the load carried by shear in the concrete, a concrete shear strength tenn, V c, can be added to the strut and tie strength. Using the upper limit on Vc from the ACI 318-89 deep beam provisions, the shear contribution is:
59

Vc = 6 Jj; bw d = 72 kips
where
f c' = 4,000 psi bw = 14.5 inches
d = 13.0 inches
(4.12)
The specimen capacities resulting when the concrete shear strength term is added to the strength of strut and tie Model I are shown in Table 4.7. The addition of the Vo term to the strength from strut and tie Modell greatly improves results for specimen C. For Piers A, the addition of the Vo term gives results that are slightly unconservative when the effect of compression steel is considered. However, compression steel is not typically used in strut and tie designs, so the inclusion of the V c term for Piers A would be acceptable. Further consideration of a concrete shear strength term, V c, in addition to the strut and tie strength should be developed in·future reports.
Table 4.7 Predicted Specimen Capacities when a Vo Term is Added to Strengths from Strut and Tie Model 1
Pier A Pier C
Analysis 1-1 1-2 1-3 1-4 1-5
Capacity from Strut and Tie 311 344 373 132 159 Model 1 (kips)
Old Ratio of Theory {fest 0.79 0.87 0.94 0.44 0.53 Vi; Term (kips) 72 72 72 72 72
Strength from Model 1 and 383 416 445 204 231 Vo Term (kips)
New Ratio of Theoryrrest I 0.97 1.05 1.13 0.68 0.77
For the strut and tie analyses, the force in TI was assumed. This assumption is critical, because the tie capacity used in the strut and tie analysis limits the specimen capacity by equilibrium at node 1. For specimen C, strain gages on the bars showed that all bars in the top layer of the pier had yielded before the peak load was reached, so the yield capacity of the bars was used for the strut and tie model. Since bars in the top layer of specimen A did not have strain gages, the force in the bars had to be assumed. For specimen A, the force for Tl was assumed as the full yield capacity of the bars in the top layer, 132 kips. This assumption gave strut and tie strength predictions that agreed well with tested results. However, it is very unlikely that the full yield strength of all bars in the top layer of pier A was reached. For specimen C, the #3 bars in the top layer of the pier yielded at a load of around 200 kips. Since the area of a #3 bar is 114 that of a #6 bar, the force in the #6 top layer bars of specimen A was probably 114 the yield capacity of the #6 bars at a load of 200 kips. Extrapolating to the capacity of specimen A, the #6 bars would probably see a load of about 1/2 their yield capacity at a load of 400 kips.
The anchorage of the bars can also be considered in predicting the actual force in tie Tl. For specimen A, inspection of the failed specimen showed no signs of bond distress. However, for the
60

straight bars in specimen A, the available development length for the bars was very small and inadequate to develop the yield strength of the bar. If the straight bars in specimen A had to develop a large portion of their capacity, bond distress would have been observed as for specimen B. 1bis discrepancy between the assumed force and observed behavior can partially be explained by considering tension in the concrete. Also, the strut and tie model only considers the action of the tied arch to carry loads. However, other shear carrying mechanisms carry load., so the strut and tie model will overestimate the required steel in the top layer.
For strut and tie Models 1 and 2, the analyses considered the effect of compression in the column steeL The inclusion of the steel increased the angle of strut inclination, enlarging the predicted capacity of the pier. Since no strain gages were located on the column steel, the magnitude of Cs
assumed was very arbitrary. Still, the inclusion of compression steel in the strut and tie model reflects the behavior of the specimen and increased the strut and tie model accuracy. However, the effect of compression steel has not been considered in the general strut and tie theory at this point. One of the problems of using compression steel is an inability to check the stress at a CCC node. Because the strut and tie theory has not yet developed procedures for considering compression steel, the effect of compression steel was ignored in the design example.
While the strut and tie model results give conservative estimates of the specimen strength, either model predicted strength much more accurately than a conventional analysis. To increase the strength predicted by a strut and tie model, a concrete shear strength term may be added to the strut and tie capacity. The average ratios of the theoretical load to tested specimen capacity for all design methods are summarized in Table 4.8. Additionally, all strengths predicted by the strut and tie models that met limit stresses in the main strut and tie were conservative. The author feels that Model 1 is a better model for design than Model 2. Model 2 ends up assuming forces in the horizontal stirrups that were not verified by strain gages. Additionally, Model 2 does not consider transverse tensile strains in the main compression struts. Thus, Model 1 is used in the design example.
Table 4.8 ignMethods Comparison of Average Ratio ofTheorylTest Capacity for Different Des
Average Ratio of Theoretical Capacity Pier A PierC
to Tested Strength
I Strut and Tie Modell Plus a Vc Term 1.05 0.73
Strut and Tie Model 1 0.87 0.49
Strut and Tie Model 2 0.85 0.67
Corbel Analysis 0.38 0.18
Deep Beam Analysis 0.24 0.32
61
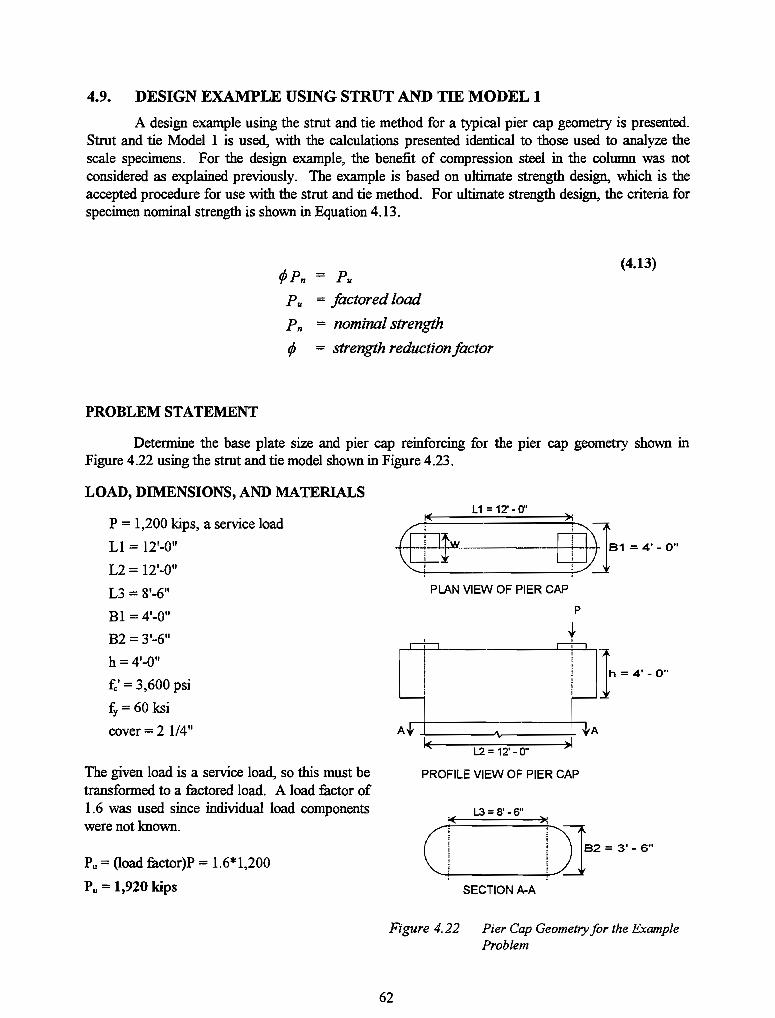
4.9. DESIGN EXAMPLE USING STRUT AND TIE MODEL 1
A design example using the strut and tie method for a typical pier cap geometry is presented. Strut and tie Model 1 is used, with the calculations presented identical to those used to analyze the scale specimens. For the design example, the benefit of compression steel in the column was not considered as explained previously. The example is based on ultimate strength design, which is the accepted procedure for use with the strut and tie method. For ultimate strength design, the criteria for specimen nominal strength is shown in Equation 4.13.
rfJPn = Pu (4.13)
P u = factored load
P n = nominal strength
rfJ = strength reduction factor
PROBLEM STATEMENT
Determine the base plate size and pier cap reinforcing for the pier cap geometry shown in Figure 4.22 using the strut and tie model shown in Figure 4.23.
LOAD, DIMENSIONS, AND MATERIALS
P = 1,200 kips, a service load
LI = 12'-0"
L2 = 12'-0"
L3 = 8'-6"
Bl =4'-0"
B2 = 3'-6"
h=4'-0"
£:' = 3,600 psi
fy = 60 ksi
cover = 2 1/4"
The given load is a service load, so this must be transformed to a factored load. A load factor of 1.6 was used since individual load components were not known.
Pu = (load factor)P = 1.6*1,200
A
PLAN VIEW OF PIER CAP
p
t ,
L2 = 12' -0"
PROFILE VIEW OF PIER CAP
L3=8'-S" i( )1
}=4'-O,"
I I 92 = 3' - 6" t i TI
Ii i
P II = 1,920 kips SECTION A-A
Figure 4.22 Pier Cap Geometry for the Example Problem
62

m T1
h
--STRUT -TIE
TOTAL COMPRESSION LOAD IN STRUT IS C1
b= 90G(
C1 = 2*C3
BOTTLENECK DETAIL
Figure 4.23 Strut and Tie Model for the Example Problem
SIZE THE BASE PLATES
Base plates are sized using the 1992 AASHTO provisions, section 8.16.7.
Pu = 1,920 kips
<Il = 0_7 for bearing
P n = nominal bearing strength
Pn required = PJ<Il = 2,743 kips
Pn = 0.85 fe' A1(A.jA1)0.5
where
AI = base plate area
A2 = surrounding area of concrete, taken as the area of a circle with a 4'-0" diameter = 1,810 in2
Try a base plate with w = 25"
so Pn = 0.85*3.6*625*(1810/625)°.5 = Pn = 3,250 kips> Pn required
Obviously, a smaller base plate could be used. However, too small a plate will not adequately distribute load across the full pier cap width. For tested specimens, the ratio of base plate size to strut width (wlB) was 0.6 (8.75"/14.5"). Using a 25 inch base plate gives a ratio of plate width to strut width wlB = 0.6 (25"/42") to confonn with the tested specimens. The strut width is chosen as the column width, 42", which is smaller than the pier cap width, 48". The column width is used for the wlB ratio as the smaller width will control strut widths.
63

SIZE C5 AND FIND THE LOCATION OF ITS RESULTANT
To find forces in the struts and ties, the angle of inclination, e, is needed. Since C5 = Pn, the centroid of C5 can be found knowing the applied load. The inclination angle, e, can then be detennined based on the location of the centroid of C5. To find the required Pn for the pier cap, a <l> factor is needed. One <l> factor is used for the entire pier cap design, instead of different <l> factors for the different elements of the strut and tie model. Since the strut and tie method is conservative, and its strength predictions for the tested piers were conservative, <l> was chosen as 0.9.
Pu = 1,920 kips
<l> = 0.9
Po = PQ/ev = 2,130 kips = required pier cap strength
Knowing Pn. the centroid ofC5 can be found because C5 = Pn•
~ = concrete design strength = o£:' for all struts in the model
where 0 = 0.8 from section 4.4.4.2
~ = of::' = 2.88 ksi
ACS = area of strut CS = CS/~ = 740 in2
Consider the total area of strut CS as two pieces, Al and A2, as shown in Figure 4.24
ACS =AI + A2
Al = 693 in2 so strut CS must extend into the rectangular section of the column
A2=ACS -ACI =47in2
z = A21B2 = 1.1 in
WCS = z + B2/2 = 22.1" = the width of strut CS.
The centroid of ACS is then found,
Xes = 12.7"
B2 = 3' - 6"
COLUMN CROSS SECTION
Figure 4.24 Cross Section of Strut C5
64

FIND THE INCLINATION ANGLE OF THE BOTTLE STRUT, e
The location of node 2 is the intersection of struts C 1, C4, and C5, and is defined by Xeg and e, the angle of inclination, as shown in Figure 4.25. The inclination angle, e, can be found knowing the centroid of strut C5, Xcg, and the depth of reinforcing, d.
d=h-cover-dt/2
Assuming a #11 bar in the top layer, db = 1.41"
so d = 48 - 2.25 - 1.4112 = 45.0"
e = 0.5 asin [2Xq/d] = 72.80
T1
node2~
e~---","I--__ ---'
Xcg
d
Figure 4.25 Location of Node 2 in the Strut and Tie Model
KNOWING e, CHECK Tl AND ASSUMED d
Tl = PJtan e = 2,BO/tan 72.8 = 659 kips
ATI = area of steel for TI = Tl/fy = 11.0 in2
use 8 #11 bars, with As = 12.48 in2
=> this implies that 2 layers of steel will be needed
RECALCULATE e USING TWO LAYERS OF STEEL FOR Tl
for 2 layers of steel, use clear spacing of 2db = 2.82" for a # II bar
d = h - cover - tit, - clear spacing/2 = 42.9"
so newe = 0.5 asin [2Xq/d] = 71.8
Check TI using the new e
Tl = P'/tan e = 2,130/tan 71.8 = 700 kips
ATI = Tl/fy = 11.7 in2 < 12.48 in2 provided, OK
65

FIND ALL MEMBER FORCES
Compute the diffusion angle:
<l> = 12 + 3/[(wlh)o'1 = 16.20
Pn = 2,130 kips
T1 = 700 kips
8 = 71.80
C1 = PJsin8 = 2,242 kips
C2 = 0.5 Cl/cos <l> = 1,167 kips
C3 = C1I2 = 1,121 kips
C4 = T1 = 700 kips
C5 = Pn = 2,130 kips
TI = 0.5 C1 tan <l> = 326 kips
T2hori.z = TI sin e = 310 kips = horizontal component of TI
T2vert = T2 cos e = 101 kips = vertical component ofTI
CHECK STRESS AT THE CCC NODE, NODE 2
The layout of the CCC node is shown in Figure 4.26. AC1 is the area of compression strut Cl at this node. Since AC5 is a combination of a circular and a rectangular section, AC 1 is found by projecting from AC5.
ACI = AC51sine = 740/sin 71.8 = 779 in2
wC4 = the width of strut C4
0.5 wC4 = c/tan e = 3.09"
wC4 =6.18"
The column width is used to find AC4 as the column width limits the strut width.
AC4 = B2 wC4 = 260 in2
crC5 = the stress on strut C5 = C5/AC5
aC5 = 2.88 ksi = fed OK
aCl = CI/ACI = 2.88 ksi = fed OK
crC4 = C4/AC4 = 2.67 ksi < fed OK
All strut stresses at the node are less than or equal to the limiting concrete design stress, but a hydrostatic state of stress does not exist as all three stresses are not equal. Since the stress at the node is not hydrostatic, the checks suggested by Schlaich (1987) are used:
wC4 t C4 --.'<f----
AC
wC5
Figure 4.26 Geometry of the CCC Node (Node 2 in the Strut and Tie Model)
66

1. All strut stresses at the node are within design limits. 2. The smallest stress ratio between faces of the node is greater than 0.5.
Check: 2.67/2.88 = 0.93 >0.5 OK. Since both checks are met, this node is satisfactory.
DESIGN STEEL FOR Tl AND THE COMPONENTS OF T2
Tl = 700 kips
AT! = TlIfy = 11.67 in2 = area of steel required for Tl
For Tl, use 5 #11 bars and 4 #10 bars, As = 12.88 in2
The layout ofTl steel at the top of the cap is shown in Figure 4.27.
BASEPLATES
1,'25' X 25" CLEAR SPACING = 2.8" LAYER 1 r-L, ,---, I
LAYER2~~~II~~~~~~~iI~~~ t EQUAL SPACES
~ I ~~rsE #9 j #7
.A
k r
L2 = 12' - 0"
PROFILE View OF PIER CAP
2·1/4" COVER
~lIt J * BARSE
BARS A1 AND A2 MADE CONTINUOUS BY A weLDeD SPLICE
LAYER 1 - BARS A1, A2 AND B #11
48ARSC1 ANDC2 ~ *2.1/4
0
COVER
~_~~, _:~~]~.!~~~I~GIDENllCAL BARS C1 AND C2 MADE CONTINUOUS BY A WELDED SPUCE
LAYER 2 - BARS C1 AND C2 #10
Figure 4.27 Steel Reinforcing Pattern from the Example Problem
67

For the components of 1'2, horizontal and vertical stirrups are used. Since there are two ties 1'2 in the bottle strut, steel must be provided to resist 2*1'2. Since steel will be distributed on each face of the pier, the steel required for 1'2 is provided on each face of the pier cap.
1'1horiz = 310 kips
A 1'1horiz. = T2horizlfy = 5.17 in2 on one face of the cap
for T2horiz. use 6 #9 bars, As = 6.0 in2
The horizontal stirrups for 1'2 are evenly spaced across the depth of the pier cap as shown in Figure 4.27.
T2vcrt = 101 kips
A T2vert = T2vcrt/fy = 1.68 in! on one face of the cap
for T2vert use 3 #7 bars, As = 1.8 in2
The vertical stirrups for 1'2 are spaced across the width of the compression strut as shown in Figure 4.27.
CHECK STRESSES AT THE CCT NODE
The geometry of the CCT node, node 1, is shown in Figure 4.28. Since the bearing stress is within its limit and Tl can be provided, only the stress in Cl needs to be checked.
To compute the area of Cl at this node the column width, B2, is used as the strut width instead of the pier cap width, B 1. The smaller width is used because loads from the base plate can only be distributed over a limited concrete area.
wTI = dblill + dt,illO + S = 1.41 + 1.27 + 2.82 = 5.5"
wCI = w sin e + wTI cos e = 25.5"
C 1 = 2,242 kips
ACl = B2 wCl = 1,071 in2
crCI = ClfACl = 2.09 ksi < fxt OK w=25" I(" )1
P = 2130k
#10
~WT1
e = 70.S·
Figure 4.28 Geometry of the CCT Node (Node 1 in the Strut and Tie Model)
68

CHECK STRESSES IN C2, C3, AND NODE 3
Since the stress in C 1 has been checked at both nodes 1 and 2 and is satisfactory there, both crC2 and crC3 will meet allowable stresses. The stresses at the nodes are most critical, because the area at the nodes is smallest. For struts C2 and C3 the load can distribute over a larger area, reducing stress. Using a similar argument, nodes 3 do not need to be checked. Also, node 3 does not need to be checked as T2 is spread over several stirrups.
CHECK ANCHORAGE REQUIREMENTS FOR Tl TIE
At the CCT node, the strut and tie method requires the full tensile strength of the bars to be
provided. The development length is calculated using the 1992 AASHTO provisions, section 8.25. ld = {A B ... } I.., = the development length of a bar
A, B are multipliers based on rebar placement
1& = 0.04 ~ f.J(fcl)o.s = 62.4"
A = 1.4 = multiplier for top bars'
B = 0.8 = multiplier for large lateral spacing
ld = A B 1& = 70"
Since the development length is extremely large, straight bars can not be used to provide the full strength of Tl. Therefore, continuous loops are used to provide anchorage as shown in Figure 4.27. The AASHTO provisions do not specify a development length for a full U, so the 1992 AASHTO provisions for a standard 1800 hook, section 8.28, are examined.
~ = {A B ... } lhb = development length of the hook
Ihb = 1,200 dt/(fc't.5 = 28.2"
A = 0.7 = multiplier for cover
~ = A lhb = 20.0"
This length can be provided under the base plate, so the development of the U hoops is considered adequate.
The area of steel that can be developed at the CCT node is thus the full strength of the U shaped hoops, and the developed strength of the straight bar. As suggested by Bergmeister (1990), the development length begins at the edge of the base plate. .
AT 1 = 4 A# 11 + 4 A# lO + A# 11 (ld provideild available)
idprovided = 20" based on the bar layout shown in Figure 4.27.
ATI = 4(1.56) + 4(1.27) + 1.56(20170) = 11.77 in2 > 11.67 in2 reqd.
Thus, tie T 1 can provide the full capacity needed at the CCT node.
SUMMARY OF THE EXAMPLE PROBLEM
The reinforcing design for the example problem pier cap is shown in Figure 4.27. Using the strut and tie method, steel reinforcing for the pier cap can readily be designed. The main considerations
69
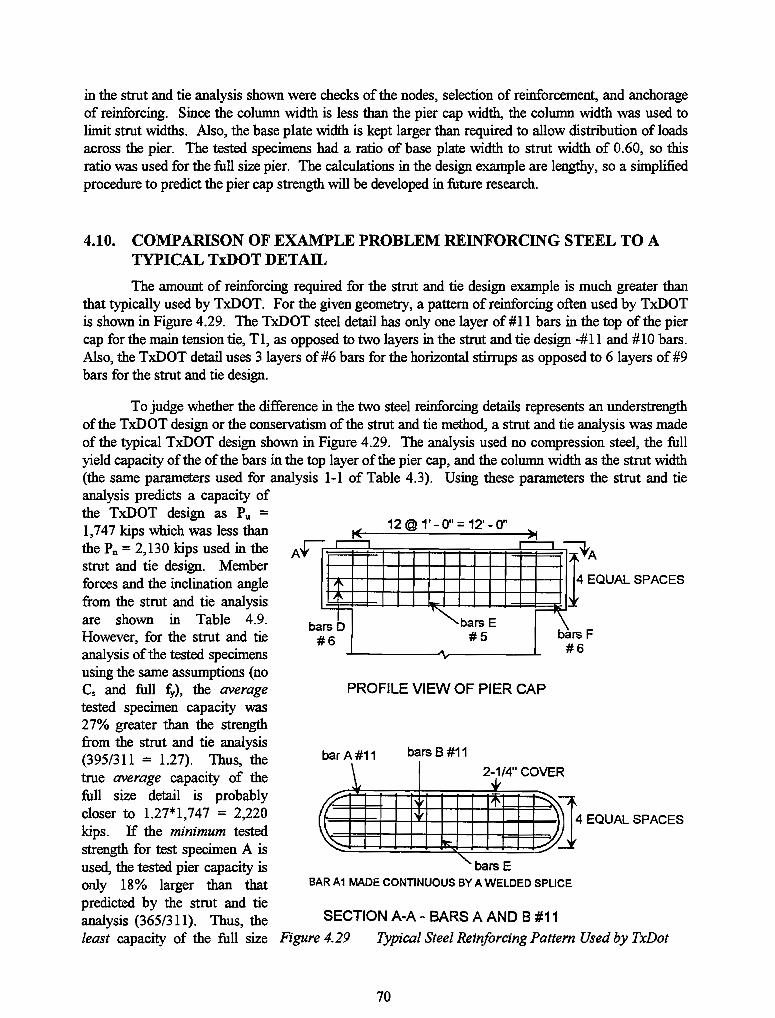
in the strut and tie analysis shown were checks of the nodes, selection of reinforcement, and anchorage of reinforcing. Since the column width is less than the pier cap wid~ the column width was used to limit strut widths. Also, the base plate width is kept larger than required to allow distribution of loads across the pier. The tested specimens had a ratio of base plate width to strut width of 0.60, so this ratio was used for the full size pier. The calculations in the design example are lengthy, so a simplified procedure to predict the pier cap strength will be developed in future research.
4.10. COMPARISON OF EXAMPLE PROBLEM REINFORCING STEEL TO A TYPICAL TxDOT DETAIL
The amount of reinforcing required for the strut and tie design example is much greater than that typically used by TxDOT. For the given geometry, a pattern of reinforcing often used by TxDOT is shown in Figure 4.29. The TxDOT steel detail has only one layer of # 11 bars in the top of the pier cap for the main tension tie, Tl, as opposed to two layers in the strut and tie design -#11 and #10 bars. Also, the TxDOT detail uses 3 layers of #6 bars for the horizontal stirrups as opposed to 6 layers of #9 bars for the strut and tie design.
To judge whether the difference in the two steel reinforcing details represents an understrength of the TxDOT design or the conservatism of the strut and tie method, a strut and tie analysis was made of the typical TxDOT design shown in Figure 4.29. The analysis used no compression steel, the full yield capacity of the of the bars in the top layer of the pier cap, and the column width as the strut width (the same parameters used for analysis 1-1 of Table 4.3). Using these parameters the strut and tie analysis predicts a capacity of the TxDOT design as Pu = 1,747 kips which was less than 12 @ l' - 0" = 12' - 0"
the Pn = 2,130 kips used in the Afr .- u:: ~IA strut and tie design. Member forces and the inclination angle from the strut and tie analysis are shown in Table 4.9. However, for the strut and tie analysis of the tested specimens using the same assumptions (no Cs and full fy), the average tested specimen capacity was 27% greater than the strength from the strut and tie analysis (395/311 = 1.27). Thus, the true average capacity of the full size detail is probably closer to 1.27*1,747 = 2,220 kips. If the minimum tested strength for test specimen A is used, the tested pier capacity is only 18% larger than that predicted by the strut and tie analysis (365/311). Thus, the least capacity of the :full size
Ji'
~ ,.-
rsO ba # 6
'~barsE #5
A
4 EQUAL SPACES
r--t"i
barsF #6
PROFILE VIEW OF PIER CAP
bar A#11 bars B #11
BAR A1 MADE CONTINUOUS BY A WELDED SPUCE
SECTION A-A - BARS A AND B #11
Figure 4.29 Typical Steel Reinforcing Pattern Used by TxDot
70

pier is likely 1.18*1,747 = 2,070 kips which is slightly less than the required design strength Pn = 2,130 kips. This indicates that existing piers may have a factor of safety less than expected for bearing loads.
Table 4. 9 Strut and Tie Capacity and Member Forces [or a Typical TxDO T Steel Detail (Figure 4.29)
Strut and tie analysis of existing TxDOT detail
Capacity, P 1,747
91 75.0 I Compression in Steel 0
T1 468
T2 horizontal 249
T2 vertical 66.7
Forces C1 1,808
(kips) C2 940
C3 904
C4 468
C5 1,747
Centroid 11.111
The above strut and tie analysis of a full size pier, and extrapolation of analysis results based on tested scale specimen capacity may be slightly inaccurate because there are several differences between the test specimens and full size piers. For the tested specimens, £:' = 4,000 psi as compared to 3,600 psi for the full size piers. The different concrete strength will change the concrete tensile strength, which may result in a different strut inclination. A different strut inclination will change the contribution to the pier cap strength of other shear carrying mechanisms such as aggregate interlock. The different concrete strength will also affect the development length of the reinforcing. For a larger concrete strength, the required anchorage length is smaller. Finally, for the scale specimens, the column width was the same as the pier cap width. For the full size pier caps, the column width is less than the pier cap width. This reduced column size will increase the concentration of stress on the end of the column, resulting in earlier spalling.
A determination of the adequacy of existing full size pier caps is difficult, and can only be made on a case by case basis considering both the load and geometry. As a further consideration of the adequacy of current designs, the performance of existing piers can be considered. To the authors knowledge, details as shown in Figure 4.28 have performed adequately. However, it is difficult to quantify the loads that existing piers have actually sustained. The calculated bearing loads are typically conservative, so the smaller magnitude of true bearing loads must be considered if the performance of existing pier caps is to be projected to new designs. Improved analysis techniques to more accurately calculate bearing loads are currently being developed in a related study concerning the behavior of the steel bent to pier cap connection.
To give criteria for evaluating the adequacy of pier caps from field inspections, cracking patterns on test specimens A at a service level are considered. For the A series specimens, the average service load is 395 kips/1.6 = 245 kips. At this service load, flexure/shear cracks extended about half way across the depth of the pier cap. Under a service load, cracks on full size piers should have a
71

maximum size of 0.016" based on crack sizes observed on the scale specimens. Signs of concrete distress on the pier cap that would indicate overloads on the bridge or pier cap inadequacy are:
1. Significant crushing at the pier/cap column interface. If spalling of the concrete occurs, the pier cap has seen severe loadings.
2. Splitting cracks on the top of the pier indicating bond failure for the straight bars in the top layer of the pier cap.
3. Maximum crack openings on the pier significantly larger than 1/16". 4. Cracks extending across the full depth of the pier cap that have a significant width for the
full length. If any of the patterns of concrete distress listed above are observed, rehabilitation of the pier cap may be desirable.
Because there is some uncertainty as to the adequacy of the current steel reinforcing pattern, the strut and tie method is suggested for future designs. The strut and tie method is superior to conventional design techniques that could be used for the pier cap. The strut and tie method allows a logical design of reinforcing, and is a conservative design technique. To improve the efficiency of the strut and tie method, further research should be conducted into the addition of a concrete shear strength term to the strut and tie capacity.
72

CHAPTER 5
SUMMARY AND CONCLUSIONS
5.1. OBJECTIVES AND SCOPE
The objective of this research was to detennine the strength and behavior of typical TxDOT bridge pier caps under compression loads. The pier caps typically used by TxDOT have a geometry whose design and behavior is not explicitly covered in current code procedures. Since no formal design procedure currently exists for detennining the required amount and distribution of reinforcing steel in a pier cap, this research also had the purpose of providing design guidelines for the pier cap. To investigate the behavior of the pier caps, six test specimens were constructed at a 30% scale. Five different reinforcing steel patterns were used in the six specimens to examine the contributions of different reinforcing types to the pier cap strength.
5.2. OBSERVED BEHAVIOR
Eleven static load tests were conducted to failure on the six pier caps. For all specimens, load on the pier cap was primarily carried by the action of a tied arch which transferred load from the base plates into the column. Concrete distress associated with the arch action included flexural/shear and shear cracks on the faces of the pier cap which limited the size of the compression arch. Additionally, flexural cracks were seen on the top of the pier cap indicating a state of pure tension there. As load was applied to a specimen, flexure, flexure/shear, and shear cracks fonned. As loading continued, crushing was eventually observed at the pier cap/column interface. The crushing at the interface limited the area at the base of the arch, so the compression arch had to rotate further into the interior of the pier for the specimen to carry additional load. The new orientation of the arch required additional tension in the reinforcement at the top layer of the pier cap to maintain equilibrium. Thus, if a specimen had sufficient reinforcement in the top layer of the pier cap, additional load could be carried. However, if the development of tension force was limited, failure of the pier cap coincided with the initiation of crushing at the cap/column juncture. Overall, specimens that had a greater quantity of horizontal reinforcing steel and adequate development of horizontal reinforcing had a greater capacity.
To investigate the necessity of the continuous steel loop around the perimeter of the pier cap (bar T) a specimen was constructed with only straight bars in the top layer of the pier cap. Three problems arose when the continuous loop was not included in the top layer the pier cap reinforcement:
1. Shear cracks on the face of the pier opened extremely wide because there was no reinforcement at the top of the pier to limit their growth.
2. Bond distress was seen for the straight bars in the top layer of the pier cap. The removal of the continuous loop left only straight bar anchorage as a means of developing the required force in the steel. Since development lengths for the straight bars were extremely short, the tension force at the top of the pier was limited, reducing the pier cap strength.
3. The base plate punched further into the top of the pier. Without the continuous loop, concrete at the end of the pier cap was not confined and additional punching could occur.
Punching of the base plates into the top of the pier cap was seen to some extent for all specimens. However, punching of the base plates was not the cause of failure because most of the punching occurred after the failure load had been reached. The bearing capacity of the pier cap was
73

reduced by the formation of a flexural crack at the interior edge of the base plate. The fonnation of the flexural crack removed the confinement provided by the concrete in the interior of the pier. Bearing capacity of the pier cap was increased by the confinement provided by the continuous loop around the end of the pier cap.
5.3. COMPARISON OF DESIGN METHODS
Three design methods were used to analyze the strength of the pier caps tested:
1. AASHfO (1992) Corbel Provisions. 2. ACI 318-89 Deep Beam Provisions. 3. Strut and Tie Method.
The corbel and deep beam provisions were entirely inadequate to predict the capacity of the pier cap because they only consider concrete capacity in shear. Testing showed that the pier cap resisted loads through a tied arch, which is a much stronger load carrying mechanism than concrete in shear. The strut and tie models used were much more accurate than conventional design methods in predicting the capacity of the pier caps because they model the compression arch action observed during testing. The strut and tie method is suggested for design because strut and tie analyses gave the best correlation with test results, modelled true behavior, and were conservative. The strut and tie method allows a logical design of reinforcing steel for a given load ~d specimen geometry, and is a conservative design method. To detail the use of the strut and tie method, a design example using a proposed strut and tie model was presented. Since the design calculations are lengthy, a simplified procedure to predict the pier cap strength should be developed. Also, recommendations for evaluating existing pier caps through field inspection are given.
5.4. AREAS FOR ADDmONAL RESEARCH
Several possible areas of further research were identified during this study. The strut and tie models presented predicted strengths that were 20 to 50 percent less than the tested specimen capacities. Closer correlation to the tested pier cap strength was achieved by adding a concrete shear strength term to the strength predicted by the strut and tie model. Additional research should be conducted to refine the strut and tie model by adding a concrete shear strength term. Second, development of the strut and tie theory to allow consideration of compression steel is desirable. Consideration of compression steel would more accurately model specimen behavior, and would improve the accuracy and efficiency of strut and tie designs. Third, the development length required for U shaped, continuous stirrups is not detailed in any code provisions. The U shape allows much shorter anchorage lengths than straight bars. The continuous U stirrup will behave differently than a standard 1800 hook as both ends of the continuous stirrup are being loaded. Finally, the bearing capacity of the concrete has been identified as another area where research is needed because bearing capacity is limiting the design of the connection between the pier cap and steel bent. Because there is substantial reinforcement in the top layer of the pier cap, increased bearing capacity of the concrete is expected.
74

APPENDIX A
TENSILE TESTS OF REBAR
The tensile tests on the bars were performed using a loading controlled test machine. Load was controlled using a plot of load against strain, with the strain measured using a Satec Systems Model T -6M Extensometer with an eight inch gage leDgth. An example graph of the rebar loading process is shown in Figure A.I. Bars were loaded at a constant rate up to the yield point of the bars. The initial rate of load application was approximately 2,000 pounds per minute for the #3 bars, and about 10,000 pounds per minute for the #6 bars. After the bars yielded, a plastic deformation of approximately twice the yield strain was applied. The test machine was then turned off, allowing the rebar to unload. After five minutes, the stress in the bar was recorded as the static yield stress, ;1. The bars were loaded two more times, applying a plastic strain of approximately twice the yield strain with each load step. The average static yield strain for the bar was the average of the three static yield points, ;1, fy2, and fy3• For each lot of bars, two different tensile tests were run.
1< fy2
fy3
Strain
Figure A.i Typical Stress - Strain Curve for a Tensile Test oj Rebar
75


APPENDIX B
LOAD-DffiPLACEMENTGRAPHS
This appendix contains plots of load versus displacement on linear pots 1 through 4 for all tests. The layout of the linear pots is shown in Figure B.1. Load is the resultant load at the tested end of the pier cap, and is a static load reading. Deflections have been shifted as explained in Chapter 3 to remove the scatter in deflections under small loads (loads less than 50 kips). The unloading curve for the specimens is not included.
center of load head
1 and 2 Sand 6
41 1
1 of load 9 rt v 9
line of action
1 5
I \3 and 4 ! ~ ! ;
n n 2 6
Figure B.] Location of Linear Pots
77

4S0
400 • ........... h ........ _ f" ~ ......... - --.............. -"------ .......... __ .. "' ... ...... _.-.......
• <iO--tJ)
c. :i2 -Cl « 0 ...J I-Z
~ ::::> CI) w a:::
3S0
300
2S0
200
1S0
100
SO
1/ .;' , ..A'i .~
IY~ .~Y'- LP 112 1:'" .. '/
LP#3'J.t .. ~)i, I '! J.'
'/ 'LP#1
il-l ... /~'/
1/ , o o 0.05 0.1 0.15 0.2 0.25 0.3
DEFLECTION AT LINEAR POTS #1-4 (inches)
0.35
FigureB.2 Resultant Load vs. Deflection at Linear Pots 1 through 4 for Pier Al-l
-tJ)
c. :i2 -0 « 0 ...J I-Z
~ ...J ::::> CI) w a:::
4S0 I
400
3S0
300
2S0
200
1S0
100
, k LPII3 /--~ •..... -.... /LP 112
LP#4- -y ~-... -.-.::: ~ ..... " -;-~ . . LP#1/ ...... - .. / ~ , " ---.:.: .... -.. -..
.f v.~
# I I
II /.1
! .' " or .. ' SO
o o O.OS 0.1 0.15 0.2 0.2S 0.3 0.35
DEFLECTION AT LINEAR POTS #1-4 (inches)
Figure B.3 Resultant Load vs. Deflection at Linear Pots 1 through 4 for Pier A2-2
78
0.4
0.4

450
400
- 350 ((J Co ~ - 300
~ 250 I-z 200 ~ ..oJ 150 ;:) en w
... ~ ...d:"'*7 .- .. ... , ..
LP#3 ~I I
V LP#2 "
LPII4 ...... ~ V;r-Y , /~ j
./
'II I-LPII1 f:' ftl t ;' I
!
1/ 100 a:
50 r o o
Figure B.4
450
400
- 350 ((J Co :i2 - 300 ~ 9 250 I-z 200 ~ ..oJ 150 ~ w
0.05 0.1 0.15 0.2 0.25 0.3 0.35
DEFLECTION AT LINEAR POTS #1-4 (inches)
Resultant Load vs. Deflection at Linear Pots 1 through 4 for Pier A2-3
LPII3\. /LP1I4 i
(/ ly~ J »U~ ..... __ •
LPII1
1/ J ,po
lIi/- LP#2
II 100 a:
50 If p
o o
FigureB.5
I 0.05 0.1 0.15 0.2 0.25 0.3 0.35
DEFLECTION AT LINEAR POTS #1-4 (inches)
Resultant Load vs. Deflection at Linear Pots 1 through 4 for Pier B-1
79
0.4
0.4

-en Co :i2 -0
9 I-z ~ ...J :l en w ~
450
400
350
300
250
200
150
100
50
/l¥/ 1---""""-" ... ~ ~
/LP#2 LP#4 JJ. ................ -......... \. ,
1· ~ LP 111
1/ l.1
/,l" 11 f
o o 0.05 0.1 0.15 0.2 0.25 0.3
DEFLECTION AT LINEAR POTS #1-4 (inches)
0.35
FigureB.6 Resultant Load vs. Deflection at Linear Pots 1 through 4 for Pier B-2
450
400
- 350 en ~ - 300 0 « 0 250 ...J I-Z 200 ~ ...J 150 :l en w
/LP#3 LP#4-~~ i;~ ~
,.....,LP#2 .7 III ~-.. /~
~ ... , !
!J'~ Ij~ /'
100 ~
50 l! .f i
o o
FigureB.7
•
0.05 0.1 0.15 0.2 025 0.3 0.35
DEFLECTION AT LINEAR POTS #1-4 (inches)
Resultant Load vs. Deflection at Linear Pots 1 through 4 for Pier C-l
80
I i
0.4
0.4

450r-----~----~----~----~----~----~----~--~
400r-----r---~----~----_+----~----~----~----~
l[ 350r-----~----~----~----~----~----~----~--~ g /LP#2
300r---~~~~~~~~--4_~~+_----r_--~----_i
O....l~ 250+--'ffhtfl~/t''-'"'~:;F--'''~'-\r-'''''-l'''=-''' ""-:" _-+-~_"_"'~_""_~"+"~'-"'::s~"~~~~~'" ~d:.-_---+---~---I ~, .... _- -.. -", ..
I-Z
i ··_····-··_··T······- .. -.• -.. _.-.-.. --::-:: ... -... .., .. t---.....I--_ .. _ 200r-~~~--~----~--+--+-----+-----r-----r----~
~ 1 .. / LP #3/ • LP #4 5 150r~4~r---+-----+-----r-----r-----r-----r-----+---~ ffi t ~ 100~----+-----r-----+-----~----~----~----+---~
50rf--~----~--4----+---4----+---~---4 o~----+-----+-----+-----+-----+-----+-----+---~ o 0.05 0.1 0.15 0.2 0.25 0.3 0.35
DEFLECTION AT LINEAR POTS #1-4 Onches}
Figure B.B Resultant Load vs. Deflection at Linear Pots 1 through 4 for Pier C-2
450
400
- 350 fJ) Q.
:;2 - 300 c C5 250 ....I I-Z 200 ~ ....I 150 ::J en w
/LP#4 ILP#2 .....
L" f~: ~ I/. ~. . "~-. ...
fL' LP/#3 LP#1 100 ~
50 1/ !"
o o
Figure B.9
0.05 0.1 0.15 0.2 0.25 0.3 0.35
DEFLECTION AT LINEAR POTS #1-4 (inches)
Resultant Load vs. Deflection at Linear Pots 1 through 4 for Pier D-l
81
0.4
0.4

-tJ) Q.
::.;: -Cl <C 0 ....J t-Z
~ :,) rn w 0::
450
400
350
300
250
200
150
.... I+.::-
1/ 1«"
II 100
50 f'
o o 0.05
..JI-"--- . "- ~ .... * . .. ~ ". -.
L--. ~ LLP#2 ..•....•. ./ ................ ~-r-- lLP#1 ~ ...
·7····~ '--'- ~ ... LP'4 LP#3
0.1 0.15 0.2 0.25 0.3 0.35
DEFLECTION AT LINEAR POTS #1-4 (inches)
Figure B.10 Resultant Loadvs. Deflection at Linear Pots 1 through 4 for Pier D-2
-tJ) Q.
::.;: -Cl
C3 ....J t-Z
~ ....J :,) rn w 0::::
450
400
350
300
250
200
150
100
50
o o
LPH3, ......,... .--..- LP#2
LP'4J-1/- --....... ......... .c. ..
~ ---...... - ~ .... 11 / LP#1
II' j/
0.05 0.1 0.15 0.2 0.25 0.3 0.35
DEFLECTION AT LINEAR POTS #1-4 (inches)
Figure B.ll Resultant Load vs. Deflection at Linear Pots 1 through 4 for Pier E-l
82
0.4
0.4

'fiJ Q..
::i2 -0
~ ....I I-Z « ~ :::> C/) w 0:::
450
400
350
300
250
200
150
100
50
~ -"'" .. ~.--*"
LP#3-~~ .. "".~ r.",... ~ ~~.""~~ J.-LPN2 0"
J ,t' ~JIC'"'
..... ~ "',,'U;';- ~_ ••• M_""" •• __ ~"""". ~.":? ...
I / ... 60 LP'1
Ii V fl'
1<7 IV
o o 0.05 0.1 0.15 0.2 0.25 0.3 0.35
DEFLECTION AT LINEAR POTS #1-4 (inches)
Figure B.12 Resultant Load vs. Deflection at Linear Pots 1 through 4 for Pier E-2
83
,
0.4


APPENDIX C
PHOTOS OF THE FAILED SPECIMENS
This appendix contains photos of the specimens after failure. Photos show the distribution of cracking on both faces of a specimen, crushing at the cap/column interface, and punching of the base plates. Numbers marked on the specimen are the total load in kips applied to the spreader beam, and not the resultant load at the tested end of the pier cap. The load marked on the specimen is placed at the point where a crack had propagated at that point. Loads marked on the specimens are slightly larger than the static load, as the static load was not reached until crack mapping had been completed. Thus, the loads marked on the specimen are approximately 5 to 10 kips larger than the total static load applied to the spreader beam.
85
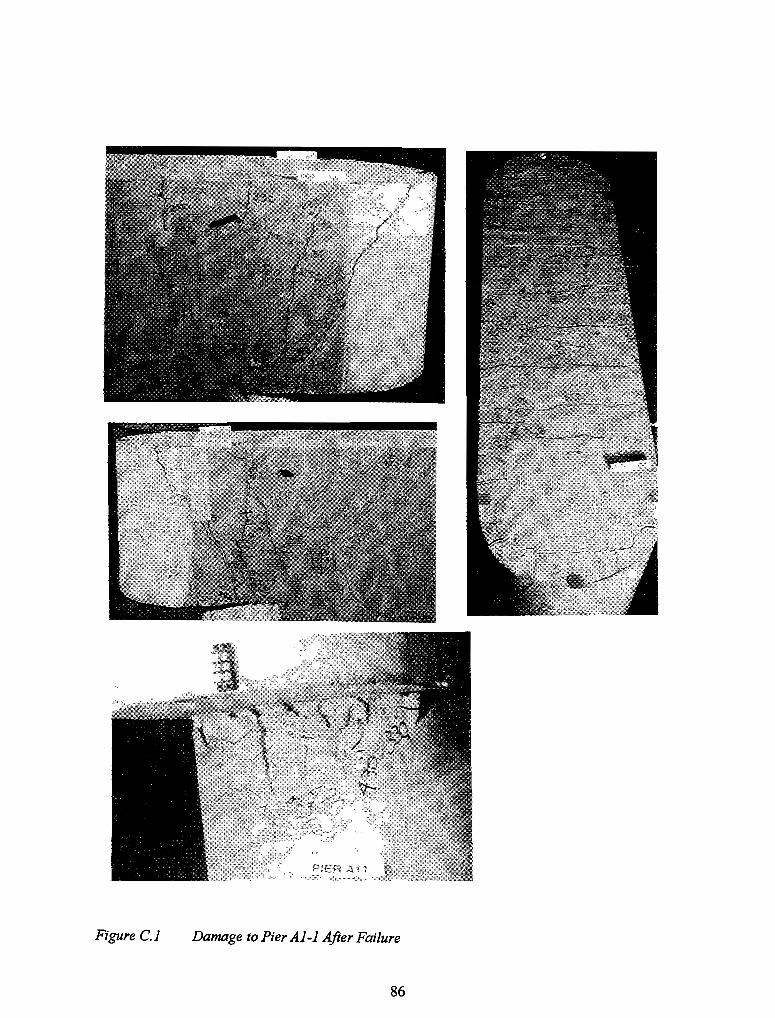
Figure C.l Damage to Pier Al-l After Failure
86

Figure Co2 Damage to Pier A2-2 After Failure
87

Figure G.3 Damage to Pier A2-3 After Failure
88
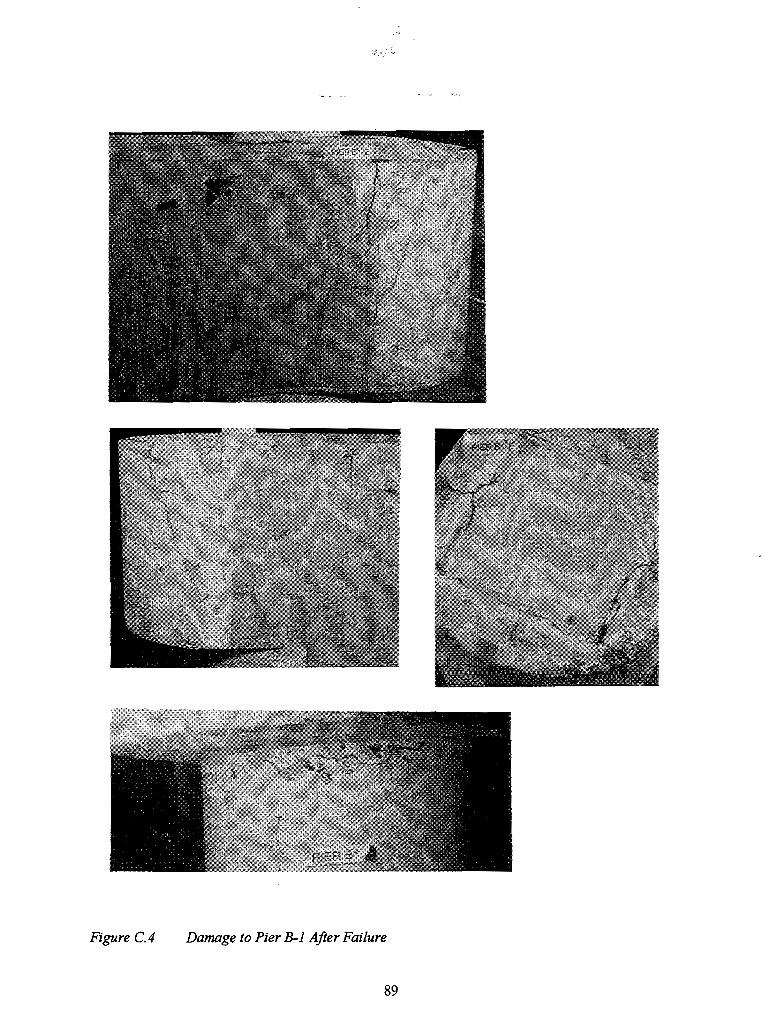
Figure C.4 Damage to Pier B-1 After Failure
89
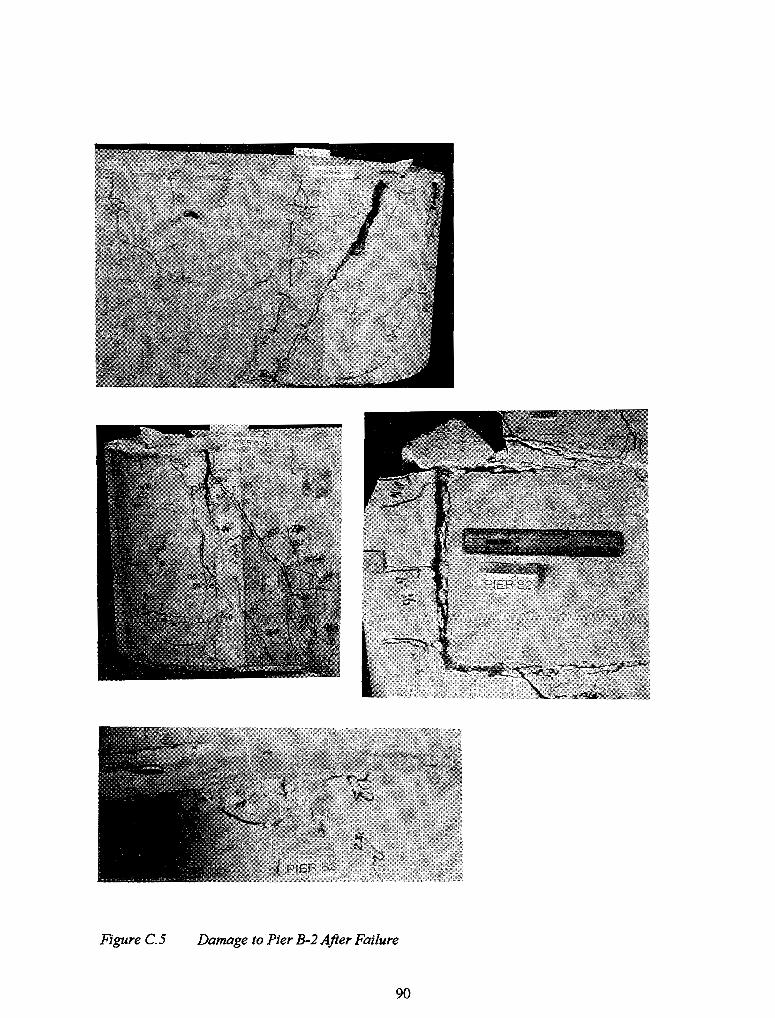
Figure C.S Damage to Pier B-2 After Failure
90
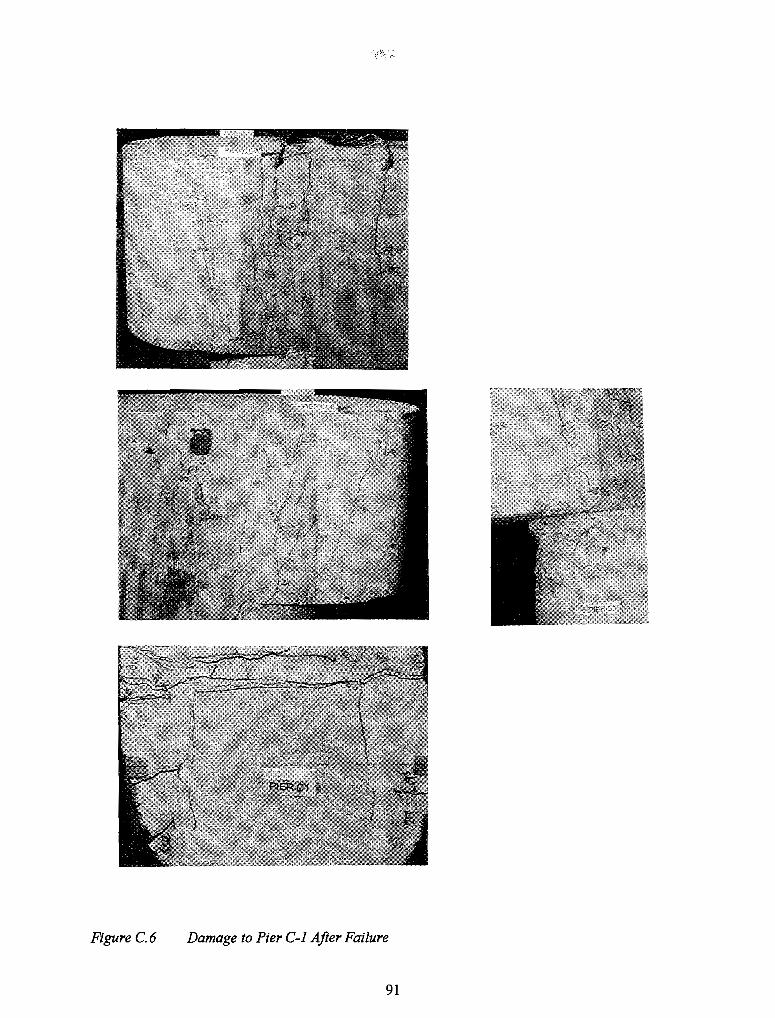
Figure C.6 Damage to Pier C-l After Failure
91
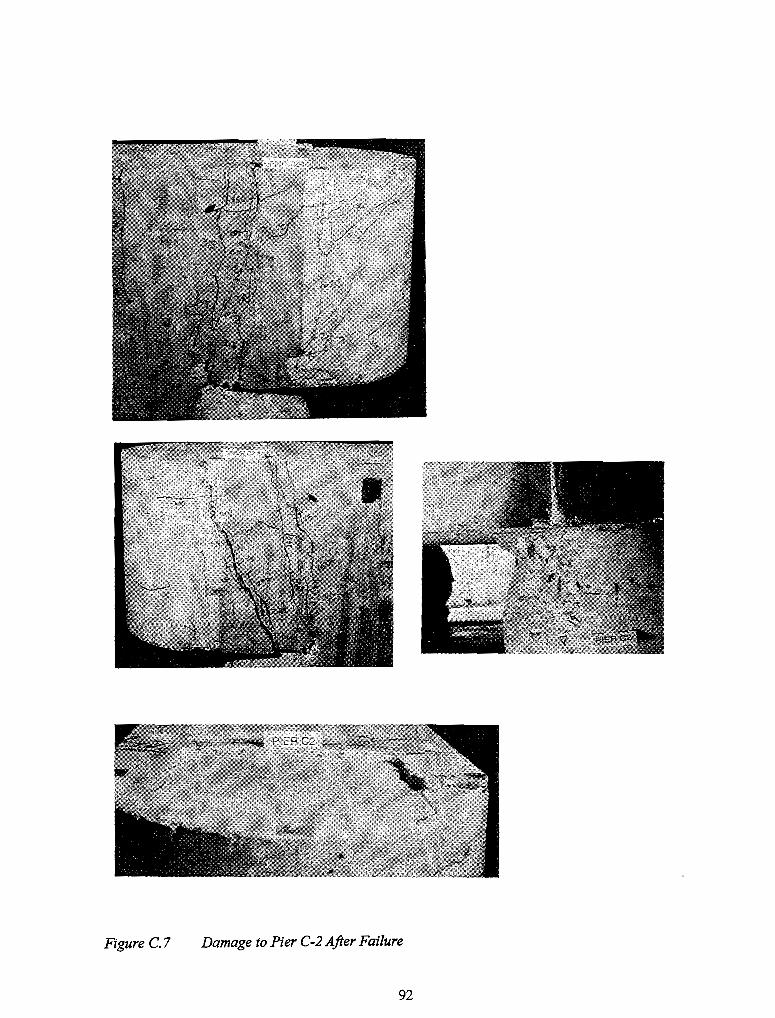
Figure C.7 Damage to Pier C-2 After Failure
92
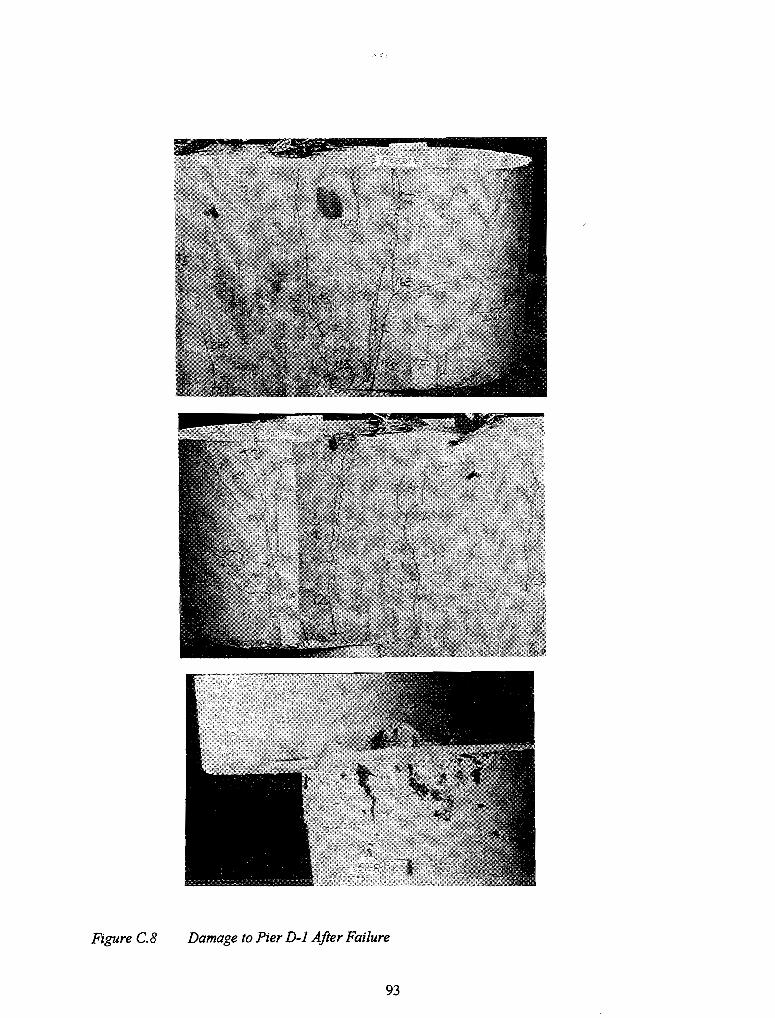
Figure G.8 Damage to Pier D-l After Failure
93
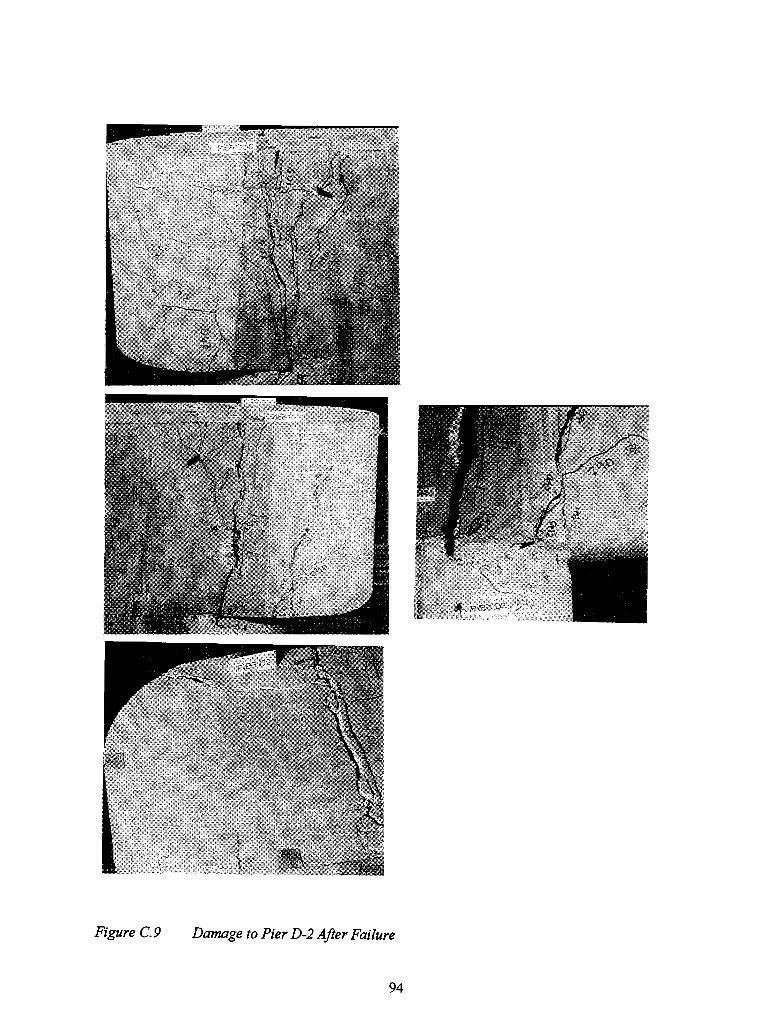
Figure C.9 Damage to Pier D-2 After Failure
94

Figure C.lO Damage to Pier E-l After Failure
95
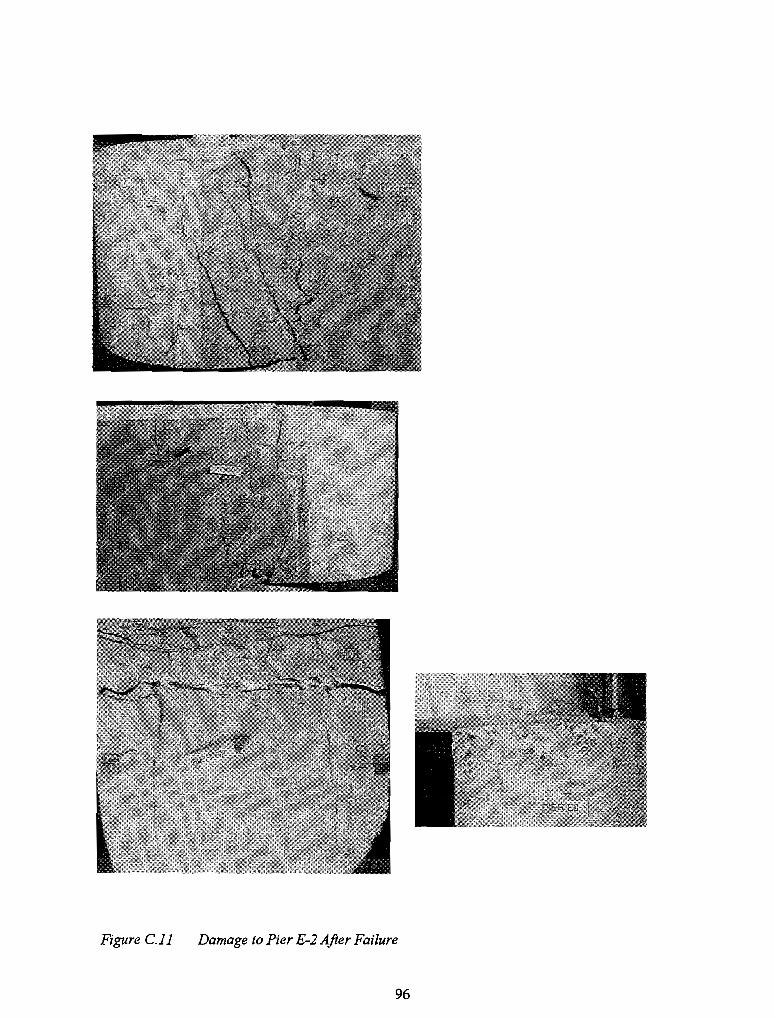
Figure C.ll Damage to Pier E-2 After Failure
96

APPENDIXD
LOAD - STRAIN GRAPHS
This appendix contains plots of resultant load versus strain for tests on Specimens C and D. The strain gages are located in the top layer of the pier cap on #3 bars as shown in Figure Dl. For tests Pier C 1 and D 1, the strain gages are at the tested end of the specimen, while for tests Pier C2 and D2 the gages are on the end of the specimen subject the smaller load. The unloading curve for the strain gages is included to show the final strain in the bars. For both specimens, the yield strain, 1630 microstrains, is calculated as the experimentally obtained yield stress divided by the modulus of elasticity (47.4 ksil29,000 ksi).
2-7/8" 8-3/4" 3-7/8" 2" 7-3/4" r :.'< ~l( >r:.r 1 iii! iii!
I I
<t of specimen--1
~ 7-1/40 >1< 18"
Figure D.l Location of Strain Gages
, ! ~ i :.:
97
even # gages - on bottom of rebar odd # gages - on top of rebar

350
300 !: ;g. 250
~ 200
~ 150 ~ ::> fa 100 0:::
50
I I I I
I I • __ .... ---.--~/
I r--
;iiI
~i .II • I • I
: I , I-YIELD I STRAIN I I
I I I I
__ 4~
I +
GAGE4-1
~
I j
J !
!
f
I ~ ~ ~ .. --~
c..--;:,--"",.;:;-:.=:.;;-:;;-;-:;;;.-::: ~ .. -~<--- --'GAGE 1 :
I J 1
! I GAGE 3 1 ;-GAGE2
1
I j :
f I o o 5000 10000 15000 20000 25000
MICROSTRAINS Onlin)
FigureD.2 Resultant Load vs. Strain in Gages 1 through 4 for Pier C-l
...
30000
3~r--r----~-------r------~--------~------~--------I I GAGES
300r--t::Tr'~~"~'-~/~=:=ll===~=z/='G+A=G=E=7==1===~~,~~r~~-~~~_=-==--t--------i 'i' I •. .1 -- \. -r "_ .. _"_ >-.. ./ 1. ",..::::.::. '1l .... I. • ; r r----·-·-·--__ . 6_ ~--~-----i ::t----+/
I
, .... • .,..,..--+-ij'---r- - - -----7 I !z fJ, VIELD I .·.!-GAGE 6 GAGE 5 r--ri / <~ 150 11/,-. ::> j# i STRAIN 1 r:: f I (IJ 100 t I !
~ if I t II 50'--r--~-r--~---+------~+-~----+-------~------~
l !! I ( I " t, I j
o~~--~~-+----~----~~------~------~----~ o 5000 10000' 15000 20000 25000 30000
MICROSTRAlNS Onlin)
FigureD.3 Resultant Load vs. Strain in Gages 5 through 8 for Pier C-l
98

~ ;g. 250 o « 9 200
~ ~ 150 ;:)
350 ; I I I
I I .. f [r .' .It· •• .. '.lL!:::. 1:::.. ... ) " ~r')l ".~~
_____ -ji,z ~ .. ;:'ft~ ... ----PPf·!
W ! ~ / GJ I .. AGE9-1 il
1 111 .+. ! l!l- GAGE 10 I Ii i
i I . ~
/-GAGE1 I_YIELD I STRAIN j i I
300
UJ 100 UJ 0::
50 f I I I I I
II ! ! it"! !
o o
Figure DA
100
90
- 80 (/) a. :¥ 70 -~ 60 9 .... 50 z ~ ...J
40 ;:)
30 UJ UJ 0:: 20
10
I GA 3E 12 -J I ~ ( I I ... , I ill
5000 10000 15000 20000 25000 MICROSTRAINS (inlin)
Resultant Loadvs. Strain in Gages 9 through 12for Pier C-1
I-GAGE 2 .;::,.
:~ .••••• '1. ••
..... ::.:: GAGE4 .. . il ~ .. ~ ... ~ __ ~., .... ,J/; • .,"' .... ' ....
.' ~i ..... . ~ ... ..
! I I
YIELD _ I STRAIN I
I I
I
I I J I
I I I
30000
k?~-········ O~----~----~----~----~----~------------~----~----~ o 200 400 600 800 1000 1200 1400 1600 1800
MICROSTRAINS (inlin)
FigureD.5 Resultant Load vs. Strain in Gages 2 and 4 for Pier C-2
99

-II) Co ::iO: -0
~ -' l-Z ~ -' ::;) en w 0:::
100
90
80
70
60
SO
40
30
20
10
~GE6 GAGES I,GAGE7 /
/ J / ., ",. *-- ta t ~
~ ......... , ,,' " ...........
~ // // ~. ., .. / " .'
If: ..-"
til W·" v ....•. :.::: GAGES , ~r /. / ...
~~~ .. ~".,
~/~ N' ." ........ "
I ....... i o o 200 400 600 800 1000 1200
MICROSTRAINS Onlin)
I ! I I I
I I
! YII:LU - I
I STRAIN I
I I I
-r I
I I ! I I
I I I
I , I
1400 1600
FigureD.6 Resultant Load vs. Strain in Gages 5 through 8 for Pier C-2
-II) Co ::iO: -0
~ -' l-Z ~ -' ::;) en w 0:::
100
90
80
70 GAGES ~and 10
60
SO
40
30
20
10
/
I V j t-GAGE1
~ ... · .. ·1 ~~ " ,.' 1.. k l-
ii' .•.. // V / • 'i I-GAGE 11 ,1
1/1f l' Y V .If l .. " ... " ./
~lti'/~ V ~.,. V ...• -o
o 200 400 600 800 1000 1200 MICROSTRAINS Onlin)
I I
I I I
I I I
I I I
Ylt;LU - I I
STRAIN I
I I I
I I I
I I I
I I 1 I I !
1400 1600
FigureD.7 Resultant Load vs. Strain in Gages 9 through 12 for Pier C-2
100
1800
1800
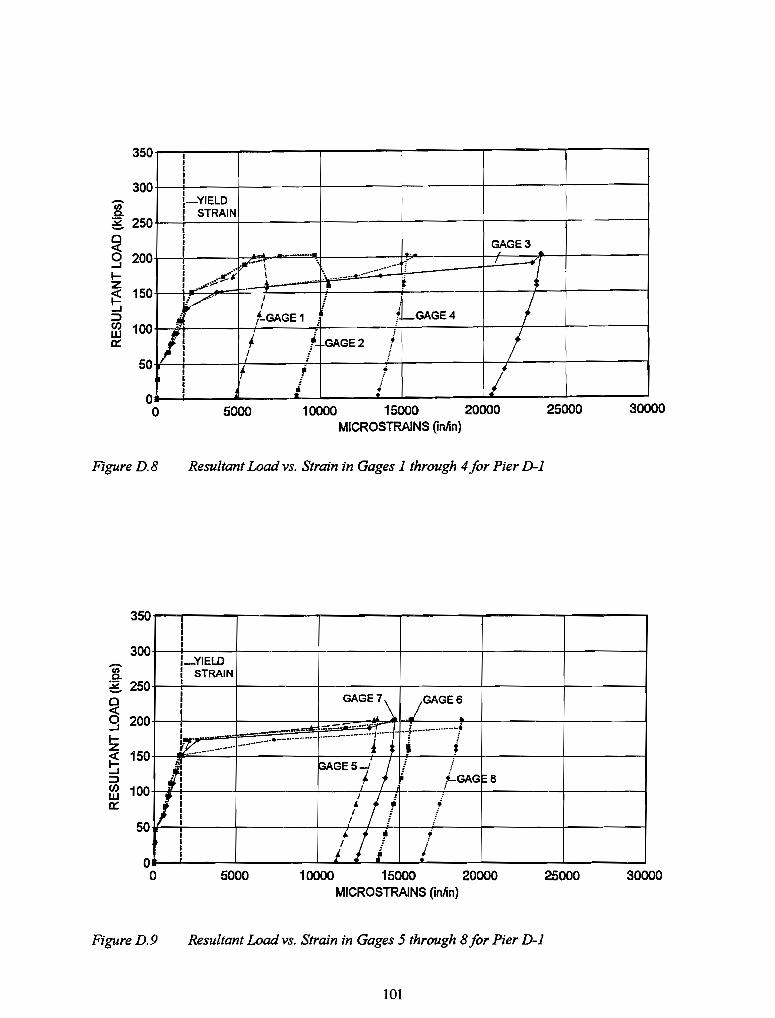
350
300
8: & 250
~ 200
!z i5 150 -l ::l
I I I I
I I-YIELD I STRAIN. I I I
I ~\ '. I ...... "" 1 I ........ .;::'$-~ .'
I~' I I
f-GAGE 1 :
I i
I •• GAGE3 ...
._~_-~~,. .. ,.- 1"" 4',
... -.-.. ~- ... ~ J !l I I : ,
fr-GAGE4 :
(JJ 100 w 0::
50 I/i I /
! j j 1- GAGE 2 i : / i
o o
Figure D.8
-(/) Q.
350
300
& 250 o ~ 200 -l .... z i5 150 -l ::l
I f ; l I I ! I i I
5000 10000 15000 20000 MICROSTRAINS OnJin)
Resultant Load VS. Strain in Gages 1 through 4 for Pier D-l
I I I I
I_YIELD I STRAIN I 1
1 GAGE 7\ jGAGE6 1
! I _~ ....... ft'I'Io~ :.::::. ....... ::/Pf' I· -1· .... ·· .... · .. ···t I.- "' ...... -.... __ ................... -.... -.. - .... ············1··· .. · ~ ............. l ~ • i
~GE51 / !
II ! /-GAG 1:;8
1 ; ffi 100 0::
50 1/ I 1 I ' I !
I f
i , ! :
o o
FigureD.9
I I I I
~ J ~ f l I l
i 5000 10000 15000 20000
MICROSTRAINS (inJin)
Resultant Load vs. Strain in Gages 5 through 8 for Pier D-l
101
25000 30000
25000 30000
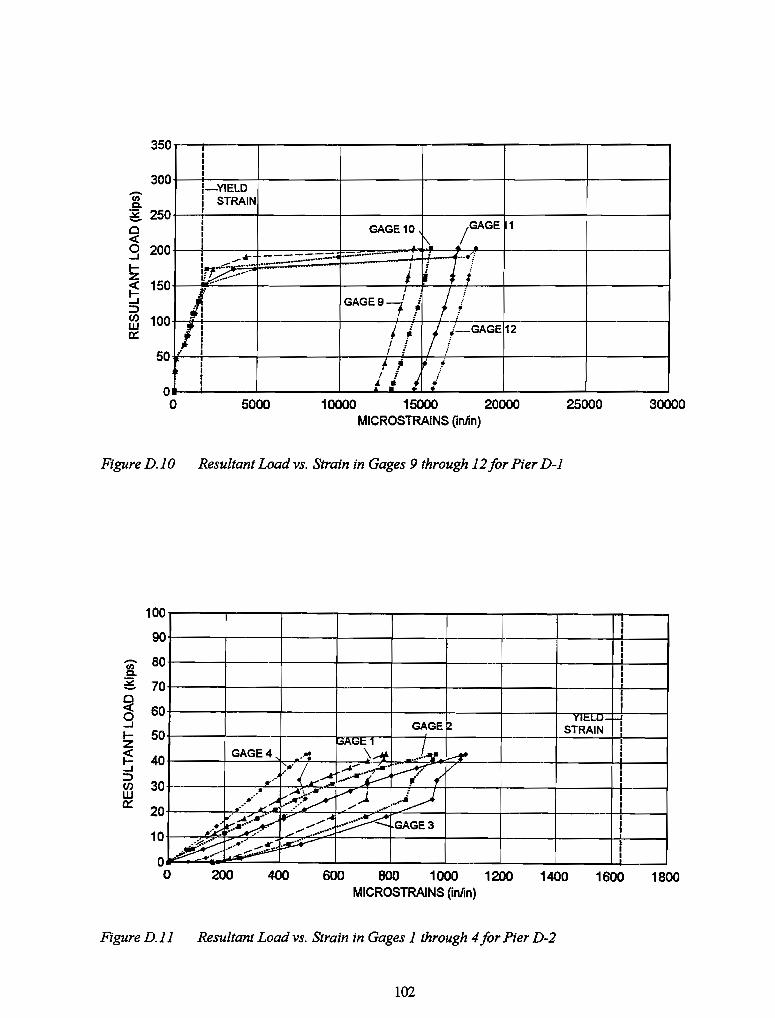
350 l I I I
I-YIELD I STRAIN I I
I GAGE 10 /GAGE 1 I
I I \. I .:.
300
i ;g. 250
~ 200 ~
; _Jr 1 .. ,,..;:::
__ -----=-4 =._-_.-17 I I z
~ 150 ...J ::>
~.~~-~ ............
I ffi 100 IX:
50 Ifl o o
I I 1 1
5000
j
GAGE9-i f /1 J
: ! I-GAGE 12 ! , f I
.f ; ~ f I : i
A i j I 10000 15000 20000
MICROSTRAINS Onlin)
Figure D.10 Resultant Loadvs. Strain in Gages 9 through 12for Pier D-1
100
90
- 80 a g 70 Cl <C 60 0 ...J ~ 50 z ~ 40 ...J ::>
30 en w IX: 20
10
GAGE~
~A~\~ J:v. GAGE 4 ~ .-": It'" l .-A- ....
~f v .' /.i"'~ ........... y .... , .. .. ~~~y f.-A".J ~ •... •... ..,.--;: ,.. ....
~~;r. P ... ...to
~ GAGE 3 )t'::' --::..-::--: .........
A:::- .'/ It" ~ ~~:~ .. ~ .....
25000
! I I I
I I ! I I I
y ........... I
STRAIN I
I I I
I I
I I I
I I
I I I o
o 200 400 600 800 1000 1200 1400 1600 MICROSTRAINS Onlin)
Figure D.11 Resultant Load vs. Strain in Gages 1 through 4 for Pier D-2
102
30000
1800

-U> Q.
g 0
9 I-z ;5 -J ::> CJ) UJ a:
100
90
80
70
60
50
40
30
20
10
GAGES IGAGE~
GAGE 8 \ I) 1.,,~.-1 I
~ .iI': ~ ~~'~ •. .-::<;1.;- ,.
~.:' "ll ~ .A ...... .. " .... /" .... / ,.,,~ .... ;:.:~ ~ \GAGE7
.~ P ~ ...... ~#~....,. .... ~
L..-.. ~ r-..........
o o 200 400 600 600 1000 1~
MICROSTRAINS (inlin)
I I
i
i Ylt:LU-H
STRAIN
l
I I I
I I I I I I
I ; I
1400 1600
Figure D.12 Resultant Load vs. Strain in Gages 5 through 8 for Pier D-2
-U> Q.
g 0 c:( 0 -J I-
~ -J ::> CJ) w a:
100 I 90
80
70
60
50
40
30
20
10
COAGE12 LGAGE 0
~ .. ~ ~
~~ ~ {( GAGE 9 .~.
7.1('.· .•.. . :. " /"~ ~~ . .-.. ::. ~~ l "'-GAGE 11
/"
V /". :-:.~ ~ &0 L~' ~ ...... ; -~ .. ".~
I o o 200 400 600 800 1000 1~
MICROSTRAINS (inlin)
!
YIt:LU-1-1 STRAIN I
I I I I I I
I I I
I I I
I I I
1400 1600
Figure D.13 Resultant Load VS. Strain in Gages 9 through 12 for Pier D-2
103
1800
1800

BIBLIOGRAPHY
American Association of State Highway and Transportation Officials, Standard Specifications for Highway Bridges, Fifteenth Edition, Washington D.C., 1992.
American Concrete Institute, Building Code Requirements for Reinforced Concrete (ACI 318-89) and Commentary - 318R-89, Detroit, 1989.
Anderson, R. B., "Behavior of CCT-Nodes in Reinforced Concrete Strut-and-Tie Models", Master's Thesis, University of Texas at Austin, December 1988.
Barton, D. L., "Detailing of Structural Concrete Dapped End Beams", Master's Thesis, University of Texas at Austin, December 1988.
Barton, D. L., Anderson, R. R, Bouadi, A., Jirsa, J. 0., and Breen, J. E., "An Investigation of Strut-and-Tie Models for Dapped Beam Details", Research Report 1127-1, Center for Transportation Research, The University of Texas at Austin, May 1991.
Bergmeister, K, Breen, 1. E., Jirsa, 1. 0., and Kreger, M. E., "Detailing for Structural Concrete -Draft Report", Research Report 1127-3F, Center for Transportation Research, The University of Texas at Austin, October 1990.
Bouadi, A., "Behavior ofCCT Nodes in Structural Concrete Strut-and-Tie Models", Master's Thesis, The University of Texas at Austin, December 1989.
Park:, R., and Paulay, T., Reinforced Concrete Structures, John Wiley & Sons, New York:, 1975.
Powers, A. C., "Shear Strength of Pretensioned Concrete Girders in Negative Moment Regions", Master's Thesis, The University of Texas at Austin, May 1989.
Salmon, C. G., and Wang, C. K, Reinforced Concrete Design, Fourth Edition, Harper & Row, New York:, 1985.
Schlaich, J., Schafer, K, and Jennewein, M., "Towards a Consistent Design of Structural Concrete", PCI Journal, May-June 1987, pp. 75-150.
Yura, 1. A., Plastic Design in Metals Class Notes, The University of Texas at Austin, Spring 1992.
105