Report No. 15905-BD Bangladesh Public Expenditure Review
110
ReportNo. 15905-BD Bangladesh Public Expenditure Review July 31, 1996 Country Operations Division/Resident Mission, Dhaka Country Department I South Asia Region Document of the World Bank Public Disclosure Authorized Public Disclosure Authorized Public Disclosure Authorized Public Disclosure Authorized Public Disclosure Authorized Public Disclosure Authorized Public Disclosure Authorized Public Disclosure Authorized
Transcript of Report No. 15905-BD Bangladesh Public Expenditure Review

Report No. 15905-BD
BangladeshPublic Expenditure Review
July 31, 1996
Country Operations Division/Resident Mission, DhakaCountry Department ISouth Asia Region
Document of the World Bank
Pub
lic D
iscl
osur
e A
utho
rized
Pub
lic D
iscl
osur
e A
utho
rized
Pub
lic D
iscl
osur
e A
utho
rized
Pub
lic D
iscl
osur
e A
utho
rized
Pub
lic D
iscl
osur
e A
utho
rized
Pub
lic D
iscl
osur
e A
utho
rized
Pub
lic D
iscl
osur
e A
utho
rized
Pub
lic D
iscl
osur
e A
utho
rized
CURRENCY EQUIVALENTS
The external value of the Bangladesh Taka (Tk) is fixed in relation to a basket of referencecurrencies, withi the US dollar serving as the intervention currency. The official exchange rate onJuly 31, 1996 was Tk 42.13 per US dollar.
US$1 Tk42.13Tk I = US$0.024
Following local convention, expenditures and revenues are sometimes denominated in units ofcrore (abbreviated CR), which is equal to Tk 10 million.
In this report, US$ is sometimes abbreviated as $.
FISCAL YEAR (FY)
July I - June 30

ABBREVIATIONS AND ACRONYMS
ADB - Asian Development BankADP - Aninual Development ProgramBCIC - Bangladesil Chemical Industrial CorporationBIDS - Bangladeshi Development InstituteBIWTA - Bangladeshi Inland Water Transport AuthorityBIWTC - Bangladesih Inland Water Transport CorporationBMRC - Budget Mon itorinig and Resource CominitteeBMRE - Balancinig Modernizationi Replacement ExpansionBPDB - Bangladeshi Power Development BoardBR - Bangladesih RailwayBSCIC - Bangladesh Small and Cottage Industries CorporationBWDP - Bangladesh Water Development BoardCAG - Comptroller & Auditor GeneralDESA - Dhaka Electricity Supply AuthorityDPEC - Departmental Project Evaluation CommitteeDWASA - Dhaka Water Supply and Sewerage AuthorityECNEC - Executive Committee of National Economic CouncilEPI - Expanded Program of ImmunizationERD - Economic Relations DivisionFDI - Foreign Direct InvestmentFFE - Food-for-EducationFFW - Food-for-WorkFP - Faminily PlaninigFY - Fiscal Year (July I - Junle 30)GDP - Gross Domestic ProductGFS - Government Fiianicial StatisticsGNP - Gross National ProductGR - Gratuitous ReliefHSD - Housinig and Settlements DirectorateIDA - Internationlal Development AssistanceIFPRI - International Food Policy Research InstituteIMED - Implementationi, Monitorinig and Evaluation DivisionIMF - Internationlal Monetary FulidIOC - International Oil CompaniesIRD - Internal Resources DivisionLGED - Local Government Enginieerinig DepartmentMSTQ - Metrology, Standards, Testing, and Quality ControlMT - Metric TonNBR - National Bureau of RevenueNCB - Nationalized Commercial BanksNCTI - Net Cash Taka ImpactNGO - Non-Goverinmental OrganizationsNPV - Net Present ValueNRFA - Net resource from the food accounlt

O & M - Operations and MaintenianceOC - Operating CompaniesOCF - Operating Cash FlowODA - Overseas Development AuthorityOMS - Open Market SalesPBS - Palli Bidyut SamlityPCP - Project Concept PaperPDU - Policy and Development UnitPER - Public ExpenditLire ReviewPHC - Primary Health CarePMED - Primary and Mass Education DivisionPP - Project ProgramPRMAC - Public Resource Management Adjustment CreditPSBR - Public Sector Borrowing RequirementPSC - Production Sharing ContractsPSD - Private Sector DevelopmentRADP - Revised Aniual Development ProgramRC - Resource CommitteeREB - Rural Electrification BoardRIBEC - Reforn in Budgeting and Expenditure ControlSHSE - Secondary and Higher Secondary EducationSOE - State-Owned EnterpriseSTOL - Short-Take-Off LandinigTCBMRC - Technical Committee Budget Monitoring and Resource CommitteeTFR - Total Financinig RequirementTI'HC - Thania Health ComplexesTk - TakaTR - Test ReliefTYRIP - Tlhree-Year Rolling Investmenlt ProgramUNDP - United Nations Development ProgramUNICEF - United Nations Childreni's FulidVAT - Value Added TaxVGD - Vulnerable Group Development

BANGLADESH
PUBLIC EXPENDITURE REVIEW
Table of ContentsPage No.
BANGLADESH AT A GLANCE
EXECUTIVE SUMMARY ........................ i-iv
CHAPTERS
I. BUDGETARY REVENUES, EXPENDITURES & FISCAL SUSTAINABILITY .... IReceiit Macroeconomic Performance .IIssues In Budgetary Revenues, Expenditures and Fianace .2Fiscal and External Debt Sustainability .4Chaniginig Role of the State .6
-1. EVALUATION OF SECTORAL EXPENDITURE PROGRAMS . 9Trends and Issues .9Agriculture, Water Resources and Rural Developnent1 0Manufacturing .13Phvsical Ilfrastructure. .14EInergy .................... ,. 19Educationi .................... . . . ... . 21Health and Family Planiniiig ................... 24
-11. INSTITUTIONAL FRAMEWORK FOR EXPENDITURE MANAGEMENT .26Managemiienit of the Aggregate Resource Envelope .27Towards a Strengthenied Integrated Fraework .29Institutions, Management. Techilology and Skills .31Managemenit of ADP .32
This Public Expenditure Review was co-task managed by Nadaraja Ramachandraii and TercanBavsan. Contributinig to the report were Jianihai Lini (IMF); Johni McIntire, Chrisanithia Ratnayake,Jonatlani Kamkwalala, Regina Bendokat, Charles Draper, Syed Nizamuddin, Zahiid Hussain,Nuimuddin Chowdhlury (Bank); Raja Mitra, Binayak Sen and Mizamur Shelley (Consultanits).This PER was a collaborative exercise with GOB and valuable contributionis were received from anumber of GOB agencies includinig IMED; NBR; Planniniig Commission's Programminig Division,Ener-gy & Industries Division and Agriculture Division: Ministry of Food; Ministry of Agricultureand Bangladesh Railway. The report was processed by Joan Mongal. Ms. Lorene Yap and Mr.Pierre Landell-Mills provided helpful guidanice durinlg the preparation of the report. The peerreviewers were Messrs. Slhanta Devarajan and Richiard Westin.

Page No.APPENDIXES
APPENDIX I lssues in the Recurrenit Budget ................................................... 33-38APPENDIX 2 Sample of ADP projects with questionable merit or rationale/priority
for public sector investment ................................................... 39-42APPENDIX 3 Performiaice of SOEs and their contributioni to public sector deficits ...... 43-47APPENDIX 4 Public Expenditure lImpact oni Rural Income and Poverty ........................ 48-52APPENDIX 5 State Role in lndustry: Promoting Not Playing ........................................ 53-57APPENDIX 6 The lnstitttionial Framework: Selected Issues .......................................... 58-70
STASTICAL ANNEXES
Table I Macroeconomic Indicators, FY80-FY95 .. 71Table 2 Actual lncome and Expenditure of the Central Government .. 72T'able 3 Revised Budget Summary .. 73Table 4 Currenit Budget - Revised Estimates .. 74Table 5 Annual Development Programme .. 75Table 6 Bangladesh: Consolidated Accounts of Non-Finanicial Enterprises
1990/91 - 1995/96 .. 76Table 7 Financial Profit Performance of Non-finianicial State-Owned Enterpries .. 77Table 8 Medium-Term Scenarios, 1994/95-2002/03 .. 78Table 9 lndicators of Fiscal Sustainability (Reform Scenario) .. 79Table 10: Bangladeshi: Fiscal and External Debt Sustainability 1996-97 - 2002/03 .. 80-8 1Table I I Bangladesh: lndicators of Fiscal Sustainability
(assisting SOEs and restructuring banks through issue of bonds) .. 82CHARTS
Cliart I Selected Economic Indicators, 1989/89-1995/96 .. 83Cliart 2 Central Government Operations. 1983/84-1994/95 .. 84Chart 3 Indicators of Fiscal Sustainability .. 85Chart 4 Indicators of External Debt Sustainability ............................. 86

... .......... ............ .. .... ....... . . .... ....... ............ ... ........... ... ........... ..... .......
.. .. ..... ......'E'
..... .............. ....
0
..........eL .... a
.41.7 CLC 13 ...... .......... ..... .... ............... ........ .. ............. .... . .... ...... ..........
............ ...... .... . ... . ........
.. ..... . .......... .... to M X e...... ... m 0
... . ........ W :r
C13 .......... ..... .... ................ .. .. .................... ............. ...... ... .. ........... ............. .. ... . .. .. ........ .......m04 ... .... .. .. ... .... pl� Flt OR q qq Ci C,! C! IR CR cp C! t,: at PtC13 ::�::: -. 1 :�� ......... .. .. ... ... ........ ow a N 0 r- 0 O w
..... .... . ............................. ..... . ... . .. ... . ..... ............X ..... . . ............ ...... ...... .................. ...... . ........... a
W. W 1�, CC! q at Ci 4q Ci (i ri Cl W� "t cq C4C4 co in 4n M C-4 Ir.......... .. .. ...... ... . ........ .... .... . I . ... a.
.. ............. ... ...... ............. ... . . . ...........
..... . . . ... .. .. ......... ............... ........ .... .......... ... . ..... ...........-
.. ......... ... ... ......V-4 q q q C4 W� ": r tq z :W)Oco............ . ..... ...::: ............. -r, C4 a M do (n It M VD P.:........... .... .. . .. . ......... ... . . . . ..... ..... ... ... q ... moz W C4......... .. ....
.......... .... .............. .............. ....... ..... . ........ ..... ........ ... ..:d .. . . . ...... . ..... ..r M . .. . .............. .........C 13 .. .......... .. ................ ......... .......... ..... . . ............. .......... . ............ ....I. .......................... .. ........ :: ... ... ............ ..................... . .. . .. .... . .. .. .... sm ......... .. .................. .... . ............. . .. ...... .......................... . .. ::::: -- - :-.r.. a.... .... .... ........ a. . .. ... .....%. . ....... . ..... .......... ...... F.F:... ................ .... . . ....... C... .... ............ . ..... ..... :..r.: ................... .. . ... ......... ......... :: .. ...... rw . > '... ...... .... ... .. .... .. ............ .: ... ... . ....
.........
.
............
... ..... . ................... 0 0....... .... ..... - .... ::: ..........
... ........ .. .................. 0 E................... . ........... . ....... ..... ... ... .... ........ .. .-b . . ... .... :3.. ...... . ..... ....
... ....... . .. ...... ................ . CLa ... . . ... .. ...... . . .............. :.: .......... .. ... ......... ...
........ =41 '20 'C' C:17 . ..... ...... S E -E' C-L....... ... ... ... ....... 16 Er: 4�0 E.OW. .... . . ........... .....
gr 0 0 to 'a 0
2L 0.0q= ix E 'C ul
Z) .- .. 0.0 F. 0 LU . 40) it k r- . - E Le

Bangladesh
PRICES and GOVERNMENT FINANCE1975 1985 1994 1995 |InfIatlon
Domestic prices(% change) 12
Consumer prices 21.9 10.7 1.8 5.2ImplicitGDPdetlator 11.1 4.3 9.7
Govemment finance 3
(% of GDP)Current revenue 8.5 12.2 12.1 90 91 92 93 94 95Current budget balance 1.3 6.1 6.4Overall surplus/deficit -9.1 -6.0 -6.8 -GOP de. ^ CPI
TRADE
(millions US$) 1975 1985 1994 1995 Exportand Importlevels(mill. US$)
Total exports (fob) 940 2,534 3,473 0,D000Other agriculture '151 57Shrimp, fish and froglegs 70 211 306Manufactures 506 1,737 2,356 4000
Total imports (cif) 2,647 4.191 5,834Food .. 601 131 500 2.000Fuel and energy .. 359 323 407Capital goods 691 1,300 1,303
Import price index (1987=100) 104 101Terms of trade (1987=100) 71 99 ofExports limports
BALANCE of PAYMENTS
(millions US$) 1975 1985 1994 1995 CurrentaccountbalancetoGOPratio(%)
Exports of goods and non-factor services 427 1,162 3,057 4,130 0 9 1Imports of goods and non-factor services 1,459 2,864 4,693 6,545 l 90 91 92 93 94 95
Resource balance -1,033 -1,702 -1,636 -2,415 -2
Net factor income -6 -90 -30 -41Net current transfers 35 477 1,247 1,426 -A
Current account balance,before official transfers -1.003 -1,314 -420 -1,030 | |
Financing items (net) 1.048 1,237 1,045 1,304Changes in net reserves -45 77 -625 -274 |
Memo: I_I
Reserves including gold (mill. USS) 148 356 2,852 3,070Conversion rate (locaV/US$) 8.9 26.0 40.0 40.2
EXTERNAL DEBT and RESOURCE FLOWS
(millions US$) 1976 1985 1994 1995 Composition oftotal debt.1994 (mill. US$1
Total debt outstanding and disbursed 1,841 7,278 16,569 | F G AIBRD 55 55 58 | 250 186 58IDA 295 2,021 5,378 B
Total debt service 104 360 653 |. 5378IBRD 0 3 7IDA 2 22 71
Composition of net resource flows 6202Official grants 315 472 759 \\Official creditors 576 603 730Private creditors -3 -3 -11Foreign direct investment 0 0 11 . _Portfolio equity 0 0 47 . 669
DWorld Bank program 3826
Commitments 205 398 597 A - IBRD E - Bilatera[Disbursements 91 288 412 | B - IDA D - Other multilateral F - PrivatePrincipal repayments 0 6 36 C - IMF G - Short-termNet flows 91 282 376Interest payments 1 20 42Net transfers 90 262 333
International Economics Department 8/1/96

EXECUTIVE SUMMARY
Introduction
I1. In Bangladeshi, one of the world's poorest countries (1994 GNP per capita $230) publicexpenditures have had a pivotal role in building up infrastructure and services. Bangladesh's investmentto GDP ratio is near 14%, divided almost equally between public and private investment. In targeting aninvestment ratio of nearer 20%, private investment will need to take the lead role. But public investmenltswill also need to be kept up both in view of the lagged response of the private sector and to provide theinfrastrticture needed for the private sector to grow. And periodic assessments and revision of the publicexpenditure programs are essential to ensure the most efficient use of public resources and maximizingtheir development impact. The last Public Expenditure Review (PER) in Bangladesh was completed in1989.
The Resource Envelope and Fiscal Sustainability
2. With highly concessional foreign financing, increased revenue collections and restraint in currentexpenditures, Bangladesh has maintained, and to some extent improved fiscal sustainability in recentyears. An overall fiscal deficit up to 6% of GDP (of which 4.5% is foreign financed and not more than1.5% is financed domestically) has been consistent withi a stable macroeconomic environment. However,with foreign aid expected to decline, the overall fiscal deficit will need to decline correspondingly -- weexpect to below 5% of GDP by 2003. The declining foreign assistance underscores the need for sustainedincrease in the revenue collection efforts, containing expenditure growth and for rigorous prioritization ofthe ADP. Given Bangladeshi's low revenue/GDP ratio, revenue collections need to grow, raising therevenue/GDP ratio by 0.5% annually. With refonns supporting a higher growth scenario in place, fiscalsustainiability could be maintained, and the resource envelope for public expenditure could grow modestlyfrom 16.2% of GDP in FY97 to 17.1% of GDP in FY2002. If, however, the economy continued in a lowgrowth mode, drastic cuts would be required in both current expenditures and in ADP if fiscalsustainability is to be attained, further dampening the prospects for economic growth. -
3. The consolidated public sector deficit needs to take into account the central government'sfinianicial obligations in restructuring the banks and state-owned enterprises, provisionally estimated atsome Tk63 billion. The indications are that fiscal sustainability could be maintained under the reformscenario provided the banks and SOEs are restructured or privatized, so that they do not contilnue to be aburdeni oni central government finances. As regards debt sustainiability, our analysis suggests thatBangladeshi will be able to service its external debt obligations over the medium-term. The decline inexternal assistance that is projected is expected to contribute to a decline in Bangladeshi's debt/GDP ratio.
4. ADP implementationi has improved in recent years. Renewed attentioni to project evaluation ishowever needed, particularly in view of the rapid increase in locally finaniced projects whicil are subjectto less rigorous evaluation than aided projects. The report presents a list of 47 ADP projects ilvolvinig atotal investment of some Tk61 billion withi questionable merit or priority for public investinenit. Alsocalliig for early remedial action throughi fiscal and monetary measures are the macroeconomicimbalanices that emerged in FY96 withi inadequate revenue collections, overrIl of recurrenit expendituresand rise in the central government deficit.

- ii -
Evaluation of Sectoral Expenditure Programs
5. Progress has been made by GOB in shiftilng towards a greater focus on social sectors (educationand healtli) and infrastrLIcture investimienits on roads, water and sanitationi while thei-e has been anappreciable decline in spendinig oii industry. This is In line with the GOB stated policy objectives tofocus on areas with large public good component, with major social benefits, and in raising income andreducing poverty. However, despite progress, the pattern of public expenditure remains weak in terms ofstrategic prioritization between and withln sectors and among projects, and In the technical efficiency inuse of budget resources, i.e. achievinig outputs at the lowest possible cost. On the broad composition ofexpenditures, our recommendationi is a furthier reductionl in manufacturinig, finanicial enterprises andagricultural outlays on markets, while focusinig on areas with higher public goods content such asintiastrticttire, research anld the social sectors.
6. Agriculture. The GOB stated policy objectives In agriculture are to stimulate growthi enoughi toraise income, to reduce poverty and to improve food security. The intermediate objectives are to developrural institItiolns and to improve techniology and skills. The strategy is implemenited throughi a broadliberalization and deregulation, targeted intervenltionl for poverty alleviation, and technilcal chanige thiroutgresearch and extension. Despite progress, the agricultural sector displays a lack of efficiency and cost-effectiveniess of public spending programs. Tile pattern of spendinig appears to be inefficienit in providingdirect benefits to the poor amid landless, whichi suggests a need for better targeting. A significant part ofGOB's expenditure programs in agriculture is characterized by low public goods content and lack ofimplemenitationi capacity. MucIh of the market spendinig should be eliminiated as these inputs could besupplied instead by the private sector
7. Manufacturing. Manufacturinig has been a highi priority sector for public spendinig over the past25 years, despite little evidence of finanicial or social return. In recent years, however, public spendinig onindustry has been cut significanitly, creating more space for productive private enterprise. At a broadpolicy level pronouncements have been made favoring private sector led development. However, slowprogress on implementationi is illustrated by the failure so far to redirect the State's role In industry frominvestimienit to support. The snail's pace of the privatization process is paralleled by COnItiluilig capitalexpeiiditures to upgrade some existing Ullits and, more astonishiniig by a few new investment proposals.Support services are ad hoc. There are three major conlcerns whichi needs be addressed before approviigthe FY97 and subsequenit ADPs: i) the privatization program should be accelerated in bothialnufacturinig and finianice, ii) meanwhile SOEs should take no new investmenit iitiatives; and iii) therange of industrial support services should be rationalized. In addition, more attentioni should be focusedon cost effective, industry friendly public expenditures in the areas of basic and vocational educationi,physical infrastructure especially for export, judicial services for businiess, and maintaininig civil order.
8. Infrastructure. While the Governmeit and donors have made concerted efforts to inprove thequality of infrastructure, rapid population growthi in cities and other areas has led to massive demalid forwater supply, tranisport and other services. Allocations to the infrastructure sector clained about 28percent of the ADP In FY96. While some programs have been poorly planined and implemented there isevidence that investmenlts In this sector have significanit net social benefits. The infrastructLire sectorfaces massive constrainits resultiig from inadequate service provision anid ftiding, inefficient institutiolnalstructures, and weak pricing mechaniisilis. Most investinenit programils will contillue to require largeamoLIuIts of public fundinig for capital expenditures. However. giveni the maginitude of the resouicesrequired and lack of capacity for effective implementationi. it is essential to encourage private sectorfinanlcinig in urban water supply and sanitationi and ports, tourisin and hotel projects and houIsilngdevelopmenit projects. Moreover, the sector suffers fromii inadequate fuLidinig for recurrenit expendituires Insome critical sub-sectors, particulal ly roads and inlanid water sector. UIntil more resources can become

- III -
available fotr infrastructure, the sector strategy needs to selectively focus on investmenits that can providethe higlhest social returns, includinig rehabilitatioil and maintenianlce of roads and maintenianlce anddredging of inlanid water ways. The strategy should also take into account the potential for increasedfundinig from the private sector.
9. Energy. As is the case with the infrastructure sector, Bangladeshi needs major upgrading inenergy. Deficiencies ii the energy sector manifestly impede economic growth. Unlike social sectors,energy investimienits have the potential of makinig a significanit positive contribution both to the capital andreveniue budgets. However, the scope for a positive impact is obstructed by inefficient operations and bylow tariffs. In the power sector, reduction of losses and improved collections can provide additionalrevenues of about Tk 8 billion per year. The energy sector is also characterized by investments with lo011lead times. and are substantially interdepenident. Accordiingly, there is a need for a clear andcomprelhenisive investmenlt policy rather thanl ad hoc initiatives for individual projects. Moreover, whileinvestimienit requLiremilenits in the energy sector will continiue to increase, the efficiency can be guaranteedonly by allocating some of them to the private sector and recasting others oni the basis of an overall sectorreform program. Projects in new gas exploration and productioni should be left to the private sector, asshould some of the proposed power projects. Investmenits in both the gas and power sector should becoordinated in the context of a comprelhenisive energy sector reform strategy with a long tern planninighorizoni.
10. Education. In recent years, the GOB has demonstrated a strong commitment to education. In theprimar-y sub sector, it launchied a universal primary and mass education program In 1980 and since thenGOB has taken several measures to increase access and improve the efficiency of the education system.Ther-e is a strong public good provision argumenit for giving continued high priority to the sector. TheGovernmeit's efforts in education are nevertheless beset by problems such as low attendance andcompletion rates. relevance and quality of programs. An analysis of public expenditure incidenice in ruraleducationi points to a highly skewed distributioni of benefits whicil implies a need to re-orient spendinig toensure better targeting on the needs of the rural poor. There is need to shift the composition of spendinigtowards less emphasis on tertiary levels such as ulliversities and subsidy schemes in primary and secondaryeducationi while giving the highiest priority' to primary educationi and effective literacy programs.
I 1. Health. The GOB has acknowledged the need for giving higher priority to the health and familyplanninig sector. Despite recent increases in allocations, the overall level of expenditure on health andfamily planinig remains low on a per capita basis and in terms of their share of GDP. Notwithstanidingsome degree of progressivity in the distributioll of benefits from public healthi expenditure there is an urgentneed for actions to improve the coverage and quality of public healthi interventioni. There is a clear need forincreased efforts to improve access to public healthi care services, includinig special programs for rural areas.The Goverinmenit should not aim at providing comprehensive free healtlh care to all individuals at alllevels. Ensurinig equitable access to an essential package of primary level, preventive and low costcurative healthi care services for all should be the chief concerin. In addition, communities, local self-government bodies, NGOs and the private sector should be encouraged and supported in organiizinig andmanaging their owni healthi services. To achieve higih cost-effectiveness and better targeting of the poorthe allocation of public expenditure within the health sector iieeds to gradually shift from the tertiary leveland specialized healthi care services to more emphasis on preventive care and the primary level, leavingmost of the furthier expansion of highier level curative services to be financed by private resources.Priority should be given to maternal and child care includinig emergency obstetric care.
12. In sum theni, despite progress, the public expenditure program displays a lack of efficiency andcost-effectiveness in all sectors. The past record shows limited social benefits from puiblic investmenits inareas sucih as manufacturinig while there is some evidence that investments in physical infrastructure such

- iv -
as roads, water and sanitationi, research, education and healthi have significanit positive net social benefitsif maniaged properly. There is significanit scope for improving the pattern of spending in agriculture andsocial sectors so that it becomes more efficient in providing direct benefits to the poor, implying a needfor better targeting. Spendinig programs also need to be more effective in raising incomes levels whicisuggests a need for chanige in the overall pattern of public expeniditure. All of this implies a need for awide ranige of measures to chanige the pattern of expenditure if it is to better serve the Governiment'sstated policy objectives of growth aiid poverty alleviation. Specific measures to be considered iiicludesthe need for:
* Formulating compreheensive medium-term policy frameworks for each major sector includingstrategic plans for current and capital expenditure allocations and financing; assessment of net socialbenefits anid effects on the poor; and measures needed for cost-effective delivery and improvedqualitv.
* Comprelhenisive re-thiniking and re-defininig of the role of the public sector and the private sectorand/or NGOs and to ensure that their efforts complement each other. While there is a need forenilliacinig the role of the private sector and NGOs there is also a clear need for continued, and insome case iiicreased, public investmenit in selected areas of education, research, healthi and familyplaniniig, and infrastructure sub-sectors such as rural roads, and water and sanitation.
* Reprioritization between and within sectors, including further reduction of spending onmaniufacturinig, financial enterprises and agricultural outlays on markets, while focusing oii areas withhighier public goods content SUchi as infrastructure, research and social sectors.
* Measures to ensure appropriate balance of ADP capital expenditure and current budget allocations,includinig measures to ensure that sufficient resources are available for 0 & M and rehabilitationpurposes with high rates of return; and to achieve more cost-savings and better cost recovery acrossall sectors.
- Wide ranginig measures to improve the institutionial framework.
The Institutional Framework
13. The dichotomy in terms of ADP and the revenue budget is an important detrimental factor inefforts to improve PEM. One major issue is that recurrent budget implications of the ADP are not beingproper-ly assessed; others include structural weakness in the institutional system such as diffusionl ofpower with tall hierarcihies and duplication of functions or responsibilities and thereby related proceduralcomplexities and delays. There are general problems Suchi as waste and abuse, deficiencies in skills,personinel managemenlt and office techniology -- all of which contribute to weaknesses in audit,evaluation, planniniig and expenditure control. While the budget system so far has functionied reasonablywell in terms of aggregate fiscal constraint, the Government acknowledges major weaknesses in terms ofstrategic prioritization and techinical efficiency. Line ministries and other agencies involved lack strongincenitives for consistenit use of objective criteria for prioritization and evaluation of expenditures. Also, atthe micro-level incenitives are weak to ensure efficiency, cost-effectiveness and quality in the actualdelivery of services to the public. The weakness of the current PEM system points to need for reformincluding the following measures.
* Strengthening the capacity to assess totll resource. This needs to include better monitoriig,estimationl and planninilg capacity of aggregate capital and recurrent expenditure, tax and noni-taxreveniue, the fiscal deficit and public debt. The problem of instilling aggregate fiscal discipline can he

mitigated b\ the effective use of a iledium-term macroeconlomiic framework in the budget processand bv establishing foorilial constr-ainits on spending anld borrowing,. ilncluding a strong system ofparliamentary conltrols.
* S.II('hrCI7iIIi, 0,1 int/egratiing Ilie overall hubu4tdMg7t i-ngaework. This iiiay inlclude programlibudgeting. a mLIlti-year framework for bothi the ADP anid revenue budget and more comprellenlsiveancd conlsistenit integrated systemils of accoLInting and audit. Tlis needs to be supported bycoimprelihensive medliLlill-tel-rll policy framew orks for eacih ma'jor sector incluIdinig strategic planls ftorcurrent and capital expenditure allocations and financing; assessmenit of net social beniefits anid effectsonl the poor. anid measures needed for cost-effective delivery.
* Stengtluiing I/I' .sstI vems o(f accounting, auldit, eviclilition,. indi expeflitureL control. Tl is ileeds toinclICle impr-oved accountiglii practices, strengthening of the capacity to evaluate prioritization anid theouItpuIt ofexpenditiilres. improved quality and coverage of audit practices including performiaice auclit.and ilimproved disseminiilatioil anid expenidituire coitrol imlecihallismlTs.
* Stlrengthellning o instilution.s, mclnagement, technolo0gV Intid skills. Tlle inistitutional structures,
personnel management. staff skills anid tecihnology stanidards need to be strengthienied andcstreamlines. This implies an uirgenit nieed for more traininig and manipower developmenit. Problemsresultinlg fromi0 institLItionial complexities withi multi-layered procedures and diffusioni ofrespon'sibilities call for strealiningio of funlctionis and rationalizationi. Greater finanicial andoperational autonIoylIV sliould be enicoulaged selectively along with effective controls to minimiizer isks of Im isuse of funlds.
* .SIIc'n7h,,r/in7g 117th InanaI(gemewt oA'ADP. This wouIld include: a funldamenital review of tie existingcadminlistrative arrani2ements which dichotomize developmenit and revenue expenditure programs: the
dispersioni of responisibility amonig and withilil organizationis; responsibilities and correspondinigauthlor-ity ftor implemlienitationi of projects. anid the scope of audit of development projects.
1 4. InI suImI thien, thlere is a paramoulit need to improve the qtiality. efficiency and cost-effectivenessof pLiblic expeniditul-e anid to re-examinie priorities between and withiin sectors and among projects. Majorefforts are iieeded to improve budgetary systems anid process; to accelerate reforns in the puiblicenterprise sector; to foster private anld NGO initiatives and; to develop the capacity of tecihnical agenciesaLid local zovernmenit and munLicipalities to genierate revelLIe and deliver expenditure programs. Also,special initiatives are nieeded to rationalize anid imake the central government more effective. Clianigillnincenitives. ilIcluditni efforts to build a more decentralized PEM fiamework is essential and will requiremajor loig-term efforts of capacity building. At the same time the central goverinenit ability to plan,monitor and conitrol spending programs needs to improve so that specific action can be taken to couliteimimlediate concerns regardinlg of waste and poor maniagemlienit.
15. P'riority items to be considered for actioni or implemilenitationi in the very near future sIoii Id ilIcludemeasures: (i) to firmil implement decisionls needed to establishi a consistent anid effective integratedbudgetary framework incllILdidig all revenue and expenditures and a medium-term macroeconomilicframework: (ii) to implemiienit specific actions needed to strengthen the system of tax administrationi ancd toimprove cost-recovery: (iii) to strenigthieni the Finanice Division and sectoral Ministries capacity to plananicd contiol expenditLire programss; (iv) to reformil and to redLIce thle size ofthie state-owned eniterprisesector anidl rationlalize government staffing; and finially (v) to ulidertake rigorous scrutilly of existing andplanned ADP projects.


CHAPTER 1: BUDGETARY REVENUES, EXPENDITUREAND FISCAL SUSTAINABILITY
I. Objectives and Scope of the Study: In Bangladesi, one of the world's poorest countries (1994GNP per capita $230, population 117.8 million) public expenditures have had a pivotal role in building upthe counitry's public infrastructure and services to promote the growth of the economy. Bangladesh'scurrent investment to GDP ratio is near 14%, divided almost equally between public and privateinvestmenit. In targeting an investment ratio of nearer 20%, private investment will need to take the leadrole. But public investmenits will also need to be kept up both in view of the lagged response of theprivate sector and to provide the infrastructure needed for the private sector to grow. And periodicassessments and revisioni of the country's public expenditure programs are essential in ensuring the mostefficient use of public resources and maximizing their development impact.
2. The last Public Expenditure Review (PER) in Bangladesh was completed in 1989. The presentPER is essentially forward-looking, and focused on the programs for FY96 and FY97, and is acollaborative exercise withi GOB. In part, it is to be seen as a sequel to the PER of 1989, reinforcingmaniy of its messages and aimed at consolidatinig the gains under IDA's Public Resource ManagementAdjustmelnt Credit (PRMAC) of 1992 whicih embodies many of the key recommendations of the last PER.Prominenit among these gains is a doubling over the last 4 years of the domestic contribution to the annualdevelopmenit program (ADP) to almost 50%. In part this PER is focused on new and emerging issuessuch as a strategic vision of a medium-term framework, through a re-examination of Bangladeshi'ssustainiable fiscal deficit in the context of the declining prospect for concessional foreign aid. Linked tothis is a re-thilikinig and re-defining of the roles of the public and private and/or NGO sector in thedevelopment of the country's economic as well as social infrastructure. Public spending will also need tobe better directed towards services witih higlher social returns and which are used by the poor. Theinstitutional framework for expenditure management needs to be re-visited to deal withi emerging issuessuchi as integrationi of recurrent and capital budgets and institutionalizing the effective application ofproject selection criteria. More recently macroeconomic imbalances have emerged, underscorinig theneed for reviewing the priorities and programming of public expenditures.
3. Recent Macroeconomic Performance: Building oni the structural reforn initiatives of the1980s, GOB launchied a fairly comprehensive economic reform program in the early 1990s to openi upand establish a liberalized, market-based, and private sector-driven economy. At the same time, GOBpLirsued prudent macroeconomic policies and achieved a high degree of macroeconomic stability,successfully introduced VAT and initiated steps to improve the quality/prioritization of publicexpenditures.
4. Macroeconomic stability was not, however, matched by a strong pick-up in economilic growth.whiichi remained in the 4.0-4.5 percent range. This is well below what is needed to effectively addressBangladeshi's acute poverty problem. Strong export performance, particularly that of ready-madegarments, contributed to a relatively strong growth in large scale manufacturing. This was, however,insufficient--given that the latter still accounts for less thani 10 percent of GDP--to offset poorperformance in foodgrain productioll two years in a row. Agricultural GDP, whicih accounits for morethani 30 percent of GDP, showed negligible growth in FY94 and 1.2 percent contractioni in FY95 due todroughits/floods, thus adversely affecting the overall growthi performance.
5. Economic performance has consequenltly been mixed in the 1990s (see Annex Table I ) DurinigFY92-FY95, while GDP growth was modest, inflation was contained in the 2-5.5 percent range, the

- 2 -
budget deficit hield below 6 percent of GDP, tile external currenit accounlt deficit averaged 2.5 percent ofGDP, and nationial savings rose fromi tile 6-7 percent of GDP in the late 1980s to 12-13 perceiit.
6. More recenitly, illacroecollomic performanice has tended to weaken. The central governimienitbudget deficit rose from 6 percent of GDP in FY94 to 6.7 percent in FY95 due to unbudgeted wageincreases. rice marketilig in the aftermathi of the drougiht, aind a sizable increase in development spendinig.A 24 percenit incr-ease in private sector credit intenisified demanid pressures. The FY96 budget added totile expansioniary pressures. Despite recent downward adjustments in budgetary developmentexpenditures, the adverse budgetary developmenits of the second lialf of FY96 mighit still lead to a largedeficit and to ulidesirable expansioni in domestic borrowing. Contributinlg to this hias been the prololngedpolitical impasse lintil the formation of a Caretaker Governimienit in April 1996 and associated disrLIptiolisin econoilic activity which is likely to weaken tax collections, reduce aid disbursemenits, increase currentspending. Also, a growing merchiandise trade deficit hias remainied a worrying developmenit since July1995. as gross official reserves fell sharply from $3.1 billion to $2.4 billion withiln six montils. This hlasdemonistrated the economiiy's highi degree of vulnerability to sliocks and slippages in macro-manageillelt.
7. Issues In Budgetary Revenues, Expenditures, And Financing: Revenues. The public finanicestructure in Bangladeshi is a reflection of the country's highily centralized goverinment. The centralcover-inimenit collects some 97% of the total revenues of the country, and is responsible for 93% of totalpublic spending. The revenue structure of tile ceiltral governmeit was traditionally very weak illBangladeshi. chiaracterized by hiigh and uneveni import tariffs, various excise taxes, and narrowly-basedcorporate and personal income taxes. Total revenies averaged less thian 9 percent of GDP durinig the1980s. with one half of tax revenies being accounted for by customs duties, while sales and incomile taxescontr-ibuited less thian one tllird to total tax collections. The tax base was furthier weakened by nuIlmieroLIspr-eferenices and exemptions, applying in particular to agriculture and cottage industries.
8. Thle reform efforts since the late 1980s hiave been aimed at diversifying the tax base thiroughiincreases in domestic taxes. Measures were initially focused oii increasinig revenues from excise taxes.and were later shilfted to raising revenues from more broad-based taxes, whiicil were considered superiorto excise taxes as they were less distortionlary. Tile major structural improvement to tile tax system wasiliade in 1991 whien a VAT was introduced. The VAT was fixed at a rate of 15 percent, iinitially applyingonly to the nmanufacturing and import stages. Starting 1994/95, whiolesalers and retailers wereencourlaged to register voluntarily for the VAT, altilougIl few have actually done so. Several sectors hiavebeen exempt fiom the VAT, including power, textiles, and certain food and pharmaceutical products. Asa result. collections from the VAT are concentrated oni imports, constrtictioni, gas and tobacco. VAT nox%conitr-ibutes almost one lialf of tax revenues.
9. Withi tile reforn efforts, revenue growthi hias been impressive, tile revenue/GDP ratio rising(, fiom9.3% of GDP in FY90 to almost 12% in FY95. This is still considerably less thian the revenue effort ofother Southi Asia countries whiere the revenue/GDP ratios are: 19.7% in Sri Lanka, 18.4% Pakistan. and19.1% India. For Bangladesh it is essential that an annual revenue growth of 0.5% of GDP bemaintained. This las become all the more compelling witll tile expected decline in aid financing. VAThias proved to lave considerable potential. If exemptions are removed and if VAT is extended towholesale/retail stage, VAT collections could even double. In import duties there shlould be greatercompression of thle rates, witli some of the 7.5% rates (removed in the 1995/96 Budget) being restored.Non-tax revenues accouLit for a significanit silare (23%) of the revenues. But their shiare could r ise further.and the noni-tax cell set up in the Ministry of Finanice should be made fully operationial. And to progress

- 3 -
towards a more equitable tax system, contributioln of direct taxes (nlow onily 15%) should rise, and hereimproved tax administration is key.
10. Central governmeit currenit expenditures have in recent years averaged 50% of total budgetaryexpenditures. Current expenditures consist of wages and allowances (38%); purchase of goods and otherservices (26%); interest payments (12%); transfer to local governments, non-government organizations,the post office, railways; and subsidies (24%). Current expenditures averaged 7 percent of GDP duringthe 1980s and have under GOB's reforn program remained stable at about 8 percent in recent years(Aninex Chart 2), while real increases were effected for priority programs in primary education, primaryhealthi and family planninig and for non-wage expenditures for operations and maintenianice. Themedium-term objective should be to ensure an increase in real terms for priority program inprimary education, primary health and family planning and for non-wage expenditures foroperations and maintenance. At the same time, given the constraints on public expenditure growth, thewage and salaries budget should be containied. GOB recently announced its intention to set up a PayCommission to review the compensationi structure of government employees. More appropriate,hiowever, may be a Pay and Public Service Commission which will have a broad mandate to review theefficienicy, equity and incentive structure of compensationi in the context of an assessment of theappropriate size, structure and skill mix of the public service, and its evolving role, and a budgetarilysustainable wage bill. A review of key issues in the largest component of current expenditures--wagesand salaries--and of the food account, is presented in Appendix 1.
11. The major vehicle for public investment in Bangladesh is the ADP. Under a program ofrationalizationi begun in 1990, the aninual ADP is set in the context of a three-year rolling investment planthat designates core projects to receive priority access to funds and establishes a ranking for otherprojects. The ADP also incorporates capital investmenit projects of public enterprises financed through(tovernment contributions, foreign aid, and their own resources. These self-financed projects have beenrelatively small and are not included in the measure of central government capital expenditure. Self-financing also includes the direct foreign financing of enterprises for project execution.
12. ADP expenditure declined steadily during the 1980s--from about 10 percent of GDP at thebeginning of the decade to near 6 percent by 1990/91, owing in part to local resource and implementationconstraints. Since 1992/93, however, ADP expenditure relative to GDP increased significantly, reaching8 percent of GDP by 1994/95 (compare with India 6.6% and Pakistan 4.6%). The sectoral composition ofADP has also chaniged significantly over time, with increases in the share of expenditures in the socialsectors, especially education and healthi, and a reduction in industry. Foreign grants and concessionalloans have played a dominant role in financinig ADP, although domestic resources have also becomeimportant in recent years and now contribute almost 50% of the ADP. The rise in ADP budgets in theface of more constrained project aid inflows emphasizes the need for a rigorous prioritization ofADP projects. A sample of ADP projects with questionable merit or rationale/priority for publicsector investments is given in Appendix 2.
13. Finailcing. The central government budgetary deficits have been finalnced mostly by foreigngrants (mainly food and commodity aid) and higily concessional foreign borrowing in the form of projectaid. Foreign financing hias accounted for an average of 85 percent of total financing during the pastdecade. Domestic borrowing has been from both the banking system and nonbank public. Between1988/89-1993/94, the Governmeit made a net repayment to the bankinig system, while nonbanik publicborrowing increased steadily (Annex Chart 2). In 1994/95, however, there was a net recourse to thebanking system equivalent to about one half percentage poinlt of GDP. Borrowing from the baiikingsystem includes advances from Bangladeshi Bank, short-term treasury bills, and a variety of long-term

- 4 -
treasury bonds. Borrowing from nonibanik sources is througih different savings instruments, typicallyissued at above-mar-ket rates justified as a meahs to encourage hiouselhold saving. As of June 1995, totalsaving instruments outstanidinig amouinited to Tk 63 billion, 5 1/2 percent of GDP.
14. Fiscal and External Debt Sustainability: One of the tasks for this review is to form a medium-term view of the resource envelope for public expenditures, thirougih estimating what may be thesustainiable fiscal deficit over the medium term. The assessment needs to take into account the need formacroeconiomilc stability, aid estimates and the potential for raising revenues and for increased domesticborrowing.
15. Tlle results of our analysis are presented in Aninex Tables 8-1 1, Cliarts 3-4 and in the summaryTable I. The major medium-term economic objectives are to achiieve faster growth, maintaini lowinflationi, and keep the external current accouLit deficit at a manageable level. Towards these goals, fiscalpolicy would hiave a crucial role to play in raising domestic savings and providing necessary investmentin infrastructtire to support private sector growth. Under the medium-term reform scenario, it isenvisagyed that government revenues relative to GDP would increase steadily by 0.5% per year to 14% byFY2002. Tlis would facilitate a modest growtih in the resource envelope for public expendituires.Governmeit expenditures (current plus ADP) could rise from 16.2% of GDP in FY97 to 17. 1% byFY2002. The improved revenue performance, together withi the elimination of the food account deficit,would contribute to a steady decline in the overall fiscal deficit. It is expected that the bulk of the fiscaldeficit would continiue to be financed thiroughi concessional external financing. Taking into account theprojected external finanlcinig, domestic financinig of the deficit would need to be kept small to ensuire thlatthere would be an adequate supply of credit to the private sector.
1 6. Our analysis shows that Bangladesh has maintained, and to some extent improved, its fiscalsustainability in recent years. This hias been due primarily to a very hiigih grant element in externalfinancing and to improved primary fiscal deficits (overall fiscal deficit minus the interest componenit).Althougih GDP growthl rates averaged only 41/2% per annum between 1988/89 - 1994/95, the averageinterest rate on foreign financing remained very low at 1.5%. Though domestic debt carries highierinterest rates, it accoulited for only a fraction of total debt. As a result, the weighited effective interest rateon the foreign and domestic debt combined was negative in real terms and was well below the averagereal GDP growthi rate. Also there lias been a reduction in the primary fiscal deficit, owing largely toincreases in tax resources.
17. Experience in recent years hias demonstrated that an overall fiscal deficit of 6% of GDP (of whiici4.5% is foreign finaniced and not more tian i 1.5% in domestically financed) is consistent withi a stablemacroeconomilic environimenit in Bangladeshi. However, foreign aid is expected to decline (we project adecline to near 3.5% of GDP by FY2000 ulider the reform scenario and a sharper decline in the lowgrowth scenario, Annex Table 8) and the overall fiscal deficit will need to decline correspondingly. Thelimited resource envelope uliderscores the importance of the troika of a good public expenditure policyfor Bangladesil: sustained increase in the revenue collection effort; restraint oni expendituire growti-, andrigorous prioritization of the ADP. In the reforn (hiighier growth) scenario fiscal sustainability could bemainitainied withi these reforms and so long as Bangladeshi is able to keep domestic finanicinig low andobtain external financing on concessionial terms. In the low growthi scenario, hiowever, deep cuts wouldbe required bothi in currenit expenditLires anid ADP, if fiscal sListainability is to be attained, and these cutswould furthier dampen growth of the economy.

-5 -
18. Fiscal reforn has an important role in play in ilfluenicing investmenit and GDP growth over themediumii term. A reduced need for fiscal deficit finanicinig will lower the potential crowding out of privateinvestinenit both throughi the direct influenlces on interest rates and by improving private sector assessmentof the longer-term sustainability of the public sector debt position. Moreover, restructuring of the tax andexpenditures system will yield better signals for resource allocation, improve incenitives for savings andinvestment, and help chaniniel resources into the most productive uses.
Table 1: Bangladesh: Key Fiscal and Debt Indicators, 1988/89 - 1995/96(in the percent of GDP)1988/89 198q/90 199 ]; 19 1/92. -;1992/93- :1993/94 - 199.495 1995196
- ~~~~~~~~~~~~~. . . . . . .. . . . . . .. . . ........ ... ..- ......- ........... -...-.,,,,-.Est.
Primarv fiscal delficit ofthe Central Government 5.9 6.6 5.7 4.5 4.4 4.6 5.3 4.5
Overall tiscal deficit 6.9 7.5 6.8 5.6 5.4 5.5 6.3 5.6Net foreign finianicing 6.8 6.3 5.9 4.6 5.2 4.5 4.5 4.1Net dLomllestic financing 0.1 1.2 0.9 1.0 0.2 1.0 1.8 1.5
IForeign debt 46.2 44.6 47.0 48.5 47.9 55.9 50.9 48.5Domestic debt -- 5.8 6.8 8.7 10.1 13.4 13.0 13.3
Total debt 46.2 50.4 53.8 57.2 58.0 69.3 63.9 6i.8
Real foreign interest rate (%) -6.9 -2.0 -6.9 -3.1 -1.3 -2.7 -7.8 -4.7Real domestic interest rate (%) -1.8 2.9 2.9 3.7 3.2 0.4 -4.1 -1.6Weighited real interest rate (%) -6.9 -1.4 -5.6 -2.1 -0.5 -2.1 -7.0 -4.0
Source: Ministry qf Finance and staff estimnates
19. External debt sustainiability. External debt sustainability could be defined in terms of a coulitry'sability to meet its external obligations in full without recourse to debt rescheduling or relief of theaccuLImLllationi of arrears, over the medium or long terms. Reducing the burden of current and futureobligations to sustainable levels could also eliminate a possible disincentive effect on investment and newcapital inflows. The key indicators for assessing this sustainability include: (i) the ratio of debt service toexports goods and services; (ii) the ratio of the net present value (NPV) of the debt to exports; and (iii)any external financinig gap, after allowing for projected inflows in the forms of grant receipts, loandisbul-semenits, any commercial capital flows. The NPV approach is considered a useful indicator as ittakes into account the concessioniality of the debt stock. A country's external debt position may beconsidered sustainiable over the projection period if: (i) the debt service ratio is projected to decline below20-25 percent of exports and goods and services; (ii) the ratio of the NPV of debt/exports fall to below200-250 percent; and (iii) finanicinig gap is eliminated.
20. For Bangladesh, under both reform and low-growth scenarios, it is assumed that all future foreignfinanicinig will be provided by official creditors, with a highi degree of concessionality; and the principalterms of the borrowing will remain broadly unchianlged as in recent years. The favorable terms wouldinclude a long maturity (38 years), a long grace period (10 years), and a low interest rate (1.5 percent).Based on these assumptionis, the grant element (in percent) is estinated to be very higih (47 percent).Using this calculated grant element to discount the stock of debt in the projection period, the NPVdebt/exports ratio under the reform scenario is projected to fall gradually from 197 percent in 1994/95 toabout 92 percent by the end of the decade, and that ulider the low-growth scenario to 100 percent, all wellbelow the suggested level of 200-250 percent. Moreover, the debt service ratio is to remaini very lowLlider both scenarios. The analysis would indicate that, under either scenario, Bangladesh will beable to service its external debt obligation over the medium term (Chart 4). The decline in externalfinancing that is projected over the medium-term is expected to contribute to a decline in Bangladesh s

6 -
debt/GDP ratio. Debt sustainability can, however, be throwil in doubt shiould there be hardeninig in thetermis of external finanicinig. Equally, any debtTevaluiationi could add to the burden of repaymenit.
21. Impact on Fiscal Sustainiability of Finanicial Sector and Public Enterprise Reforms. The analysishias so far been confinied to examininig fiscal and external debt sustainability of the central governmenitand should be extended to the consolidated public sector, includinig the central government, costsassociated with recapitalizationi of nationialized commercial banks (NCBs) and private banks, and publicenterprise r eform. In this context, the rising share of domestic debt in recent years should receiveparticular attentionl. In addition to the relatively small amount of domestic financing of the centralgovernment deficit, domestic debt has beeii rising fast on account of the NCBs and the assumption ofpublic enterprise debts. While the amounts assumed so far have not chaniged the assessment of thesustainiability of the central governmenlts fiscal positioin, this issue will clearly need to be closely lookedat as the full magniitude of the central governmeit's finanicial obligations in restructuring the banks andpublic enterpr-ises becomes clearer. Reforms must be implemented early to stem the losses of the banksand public enterprises have so far that fallen on the central government, adding to its debt and debt-service burdeni.
22. Given the lack of necessary data, calculations contained in this section are preliminary and shouldbe interpreted with caution. Based oni available data, the capital and provisional shortfalls of NCBs andprivate banks as of end-1994 were estimated to be some Tk 25 billion (2 1/2 percent of GDP) and Tk 23billion (2 percent of GDP), respectively. Assuming that 80% of the shiortfalls of private banks were alsoto be covered by the central governiment, the total cost of recapitalization that would need to be borne bythe central governmelt could amount to Tk 43 billion. On public enterprises the data provided by theGovermiienit indicate that the overall cash deficit in 1994/95 was about Tk 20 billion, finaniced by ADPallocations, credit from NCBs and throughi accumulation of arrears to both the Government and banks.The data also show that the cashi deficit of public enterprises has declined somewhat in recent years,owing, mainily to the retrenchimenit in several important sectors. Total arrears outstanding to the bankinigsystem were estimated to have reached Tk 20 billion by 1994/95, and those to the central governmienitcould be mucIh larger, although specific figures are not available. To facilitate analysis in this section, itis assumed that finanicial assistance of some Tk 20 billion from the central government would be requiredto make public enterprises finanicially viable (i.e.. with zero cash deficits). Clearly, this assuInptioll isvery arbitr-ary and subject to revision wheni more complete data become available. Furthermore, othermeasures, including tihose focusing on restructuring and privatization, are critical to raising the efficiencyand profitability of public enterprises. Based on the available data, our analysis suggests that the impacton the central goverinmenit fiscal position of recapitalization and public enterprise reforn could be keptwithini maniageable limits (Aniex Table I I ). While interest costs would rise and the stock of domesticdebt of the central goverinmenit would also increase. But fiscal sustainiability could still be maintainied,provided the key assumptions (includinig concessionial external finanicilng) uLiderlyinig the medium-termreform scenario hiold..
23. Changing Role of the State: Redefininig the state's role and making the public sector moreefficient and effective in discharging its core funictionis have been an important objective of manyreforminig countries. Consistent withi the pursuit of establishing a liberalized economy that is driven bythe private sector, the GOB too has long recognized the need for reducing the size of the public sector andstrenigtieniiii-ig its governiaice capacity. Accordingly, reforms were initiated ini many areas of public sectormanlagemiienit (PSM). Some of these efforts were intenlsified in the early 1990s. However, in most areasof PSM, reforimi progress to date hias been very little, and basically stalled durinig the last two years due tothe prolonged political impasse.

- 7 -
4. A characteristic ol' BangladesWi's governiment is its highily cenitralized nature, witil thle centralooveninient assUming responsibility for collecting almost all the couLntry's revenuies and for some 93% ot'total pLiblic spending. GOB hias niot made any serious effort to strengthienl local elected bodies and initiatedecenitializationi; a local goverinmenit refor-im bill lias been awaiting the parliamenitary approval since 1992.Pro-ress in thils area coUld iiiprove efficiency in the provision of public services by enhancing finanlcialaccountability. enabling the direct participation of the people in the whiat/lhow/for whiom decisions. andalso pawe thle way for increased involvemilenlt of NGOs and private sector operators in thle supply anddelivery of services.
25 In proilmoting tile priivate sector, thle Goverinimlenit hias made progress thiroughi reforims in trade,exclhanoe rate, and industrial policies, and by removilng most foreign exchiange and price controls. Butthiere is a lot to be done for improving tile busilness enviroiinenit in the areas of: infrastructure; legallramIexork--laws and the judicial systemii--dealing withi property rigits, companies, contracts bankruptcyand comiipetitioni policvy and making thle bUreaucracy and promotional public ageincies more responsiveand eftficient in facilitating business activities.
26. Reforming or privatizing Bangladlesh's inefricient and loss making SOEs would be vitallvimpl)ortant for eliminating their significant burden on the budget. SOE inefficienicy and resultingwastaue of scarce resources hiave remainied a barrier to highier economic growth. SOE domiiianice incer-taini sectors hias imipeded ftill scale market liberalization and private sector participation, and poorq uality o thleir services/iproducts also constitutes a drag on private sector development. Aind thle loansuti\ell to SOEs hiave weakened NCBs by saddling thiem withi sizable noni-performinig loans, wlichi areoften assuimied bv the Goverinmeit.
27. In FY94. thle-e were about 2 10 non-filaicial public enterprises operated by 39 autonlomllousp1 blic corlporations. Thleir total investmenit amounted to 2.2 percent of GDP, whiile gross losses reachiedto $243 mlillioni (almost I percent of GDP). These losses were more thian lhalf of the ADP spending on allsocial sectors in tihat vear. Simiilar losses were recorded in FY95. SOEs hiave thius failed dismally incenerating adequate economilc returnis for thle sizable resources chianineled to them.
28. The det'icits of noni-finianicial SOEs hlave contr-ibuted significanitly to the public sector borl-owilngreqLiliremiet (PSBR). In FY94. the deficit of the 19 big corporations amounted to $350 millionl ( 1.4pelcenlt ot'GDP on an accrual basis). However, on a cush-/lOMi basis the latter deficit was even larger--S438 millionl ( 1 .7 percent of GDP) (see Appendix on SOE finanlces). After nettinlg out thle paymenlts ofcir-ect taxes and clividenids to the central government, the net contribution to the overall PSBR of thleseSOEs am10oulnted to 0.8 percent of GDP. Deficits of thiis magilitude hiave contillued into FY95 and FY96.Financing these sizable deficits by borrowing and/or buildilng up arrears lead to additional direct/indirectblirclen onl the ceilt-al governmlllenlt budget.
29. A related dimenision of the noni-fiiancial SOE operations is the size of SOE debt, whiichiamioulited to 39.3 percent of GDP in FY94, consisting of loans borrowed from NCBs--3.3 percent of GDI'at end-June--and the rest. whiicih includes goverinmenit loans and government gLuaraniteed foreign loans.non-baklk/nlonl-uoverniimenit domestic debt, adding up to 36 percent of GDP. Faced withi persistently' weakfinancial positions. most of these SOEs are hlaving difficulties in servicing their debt to the NCBs and the2ejitral gloverilnment. postponinC paymenits of taxes and Provident Fund contributioIs, thierebv also\%eakening the tfinanlcial SOEs as well as the Govermiienit's fiscal position. Consequenitly. the central11overnileilt budget remainis unlder constanlt pressure becaLuse of thle resultilg iieed to assuine SOE debt tothle NC'Bs anld to recapitalize the latter.

- 8 -
30. Reforming and reducing the size of the SOE sector through commercialization, restructuring,competition, and privatization are key elements of GOB's structural reforn program towards greaterreliance on markets and promoting the private sector. So far the progress has been very limited in allthese areas. Since October 1991, when the Government announced a list of 47 SOEs for the first stage ofprivatization in the 1 990s, only 18 SOE privatizations in the manufacturing sector have been finalized,covering just 6 percent of the total non-financial SOE assets and 18 percent of operational losses.Similarly, there has been limited progress in reforming the financial SOEs. The impact of sectorinefficienicies coupled with the inability of GOB to secure financing of the high capital investmentrequiremenits are particularly significant in the power, gas and telecommunication sectors. While somepreliminary steps have been taken towards reform related activities in these sectors, progress is slow andinsufficient to bring about the required turn around of performance in the near future. GOB's strategyshould focus on a clear commitment towards sector reform based on the unbundling, commercializationand corporatization of the sector institutions coupled with the introduction of private sector services. Inorder to encourage the participation of strategic investors and international capital resources, the reformpolicies should be appropriately articulated, mechanisms for their entry simplified and regulatoryinstitutions established to provide a stable transparent environment.

9-
CHAPTER 2: EVALUATION OF SECTORAL EXPENDITURE PROGRAMS
31. Trends and Issues: Progress has been made in recent years shiftinig towards a greater focus onsocial sectors (education and healthi) and infrastructure investments on roads and water & sanitationi whilethere has been an appreciable decline in industry. However, despite progress, the pattern of publicexpendituire remains weak in terms of strategic prioritization between and withinl sectors and amonigpirojects, and the technical efficiency ill use of budget resources, i.e. achievinig outputs at the lowestpossible cost. The Government lacks comprelhenisive and clear policy frameworks for its expenditureprograms in different sectors. There is a lack of clear criteria for evaluation of proposed expenditureprograms and implementationi is weak. Also, some public spendinig programs appear to limit rather thanfacilitate the scope for the private sector and NGOs. Appendix 2 presents a list of 47 questionableprojects now in the ADP. Planned investment in tihese projects total some Tk61 billion, withdisbursemenlts spread over several years.
32. The analysis of sectors, as presented below, suggests that there is a need for a reassessmentof the inter- an(d intra sectoral composition of spending. This includes a functional reprioritizationvith further reduction in manufacturing, financial enterprises and agricultural outlays on markets,
while focusing on areas with higher public goods content such as infrastructure, research andi socialsectors.1 The latter should be given higih priority but there is a need for shift of emphasis from tertiaryand curative healthi care to primary and preventive healthi and family planinig, and from tertiary to primaryeducation. The emphasis on infrastructure investments needs to be re-oriented towards projects withhigher returns. In addition, there is a need to ensure appropriate balance of ADP capital expenditure andcurrent budget allocations, includinig measures to ensure that sufficient resources are available for 0 & Mand rehabilitationi purposes with higih rates of returm; and to achieve more cost-savings and better costrecovery across all sectors. A greater role for the private sector in new investmenit and the provision ofservices in manufacturing, telecommullication and energy and a reduction of public spendilig on foodsuibsidy programs, and the provision of inputs for agriculture, for example, would help free publicresources, henice enablinig increase in the share of ADP and reveniue budget outlays for social sectors(especially primary education, basic healthi care services and family planniniig), rural infrastructure sub-sectors such as roads and water & sanitationi, and for irrigation, extension and research in agriculture, i.e.areas with a higih degree of public good content, and in whichi the private sector is unlikely take a leadingrole or be the primary catalyst for new projects.
33. Trends in the Sectoral Composition of ADP (FY90-95) Infrastructure and energy together havecontilnued to be the largest claimants of ADP resources, with their share rising from 39% in FY90 to 45%in FY95 (Table 2). Transport has accounted for 49% of this increase, and power 36%. ADP spenidilg hiasexpanided most appreciably in the social sectors, with their combined spendinlg rising aniually by 34% innominiial termis since FY90. Consequently, their share has risen sharply, from 10% in FY90 to 24% inFY95. Educationi alone has accounted for 66% of the overall increase for social sectors.
34. The share of the production sectors -- agriculture, rural developmenit, water resources, andindustry -- has declined noticeably, from 33% in FY90 to 20% in FY95 (Table 2). This has been largelydue to an appreciable decline in spendinig by industry and, to some extent, the water resources sector,despite an appreciable growth for rural development spendinlg, and modest growth for agriculture. The
Public goods are those which once created, are available to all consumers and cannot be withheld from oneindividual without withholding it from all, i.e., goods whicih are non-exclusive and non-rival in consumption.

- 10-
shar-e of block allocations/spenidinig by tile local goverinenit and "other sectors" hias come down since theearlv niiieties.
Table 2 Annual Development Program (Taka bilion)tl:FY9D 00 iFY.93:. ..... .. FY94 FY95 F96 FY97
Production Sector 19.07 14.28 17.24 20.10 21.30 29.30
AgricIlture 3.26 3.72 5.21 5.41 5.28 7.49Rural Development 1.78 3.66 4.80 6.84 7.27 9.75Water Resources 9.77 6.18 5.66 6.52 7.48 10.21liduistry 4.27 .73 1.57 1.32 1.27 1.85
InfrastructUre/Energy 22.08 28.33 39.36 46.52 45.91 53.78
Power 6.46 10.07 12.14 15.26 12.20 13.08Oil, Gas & NR 3.52 4.76 3.25 2.42 4.06 4.80Transport 7.59 9.68 15.44 19.49 20.71 24.40Comilimunicationis 1.65 1.45 5.36 4.52 3.51 3.93Phvsical Planning 2.87 2.37 3.17 4.83 5.43 7.58
Social Sector 5.69 10.48 16.51 24.05 22.63 29.58
Education 2.26 5.28 9.20 14.65 13.89 17.69Healthi .98 2.06 2.81 3.70 3.15 6.12Familn Planining 2.20 2.83 4.08 4.70 4.50 3.92Social Welfare .26 .3 1 .42 1.00 1.09 1.85
Local Government"' 3.30 5.38 6.82 4.10 4.95 5.36Others 7.02 7.03 9.91 8.26 9.68 6.98
Total 57.17 65.50 89.84 103.03 104.47 125.00Solirce I.-1 El) uncd Pulnning Commission
L ocal (iovernmcint includes Block allocation for District Councils. District and Thana infrastructure,Dcx clopmcnt assistance to Thana and Union Parishad, Development assistance to MunicipalCorporations and Pourasliavas. and Local government bodies in Ctg. Hill-Tracts.
35. The FY96 and FY97 ADP. The FY96 ADP budgettarget(Tk 121 billion) implied asizable 18%nomiiinal increase over the realized FY95 ADP size. In the event, the FY96 ADP was scaled back toTk 104 billion. Disruptions to project implementationi due to the difficult political situation are likely tohiave affected the level of ADP realization. The FY97 ADP target is set at Tkl25 billion. Of this,infrastr-ucture accoLlIts for 28%, energy 14%, education 14%, hiealth 5%, family planninig 3%, agriculture5%, rLural developmenit 7%, water resources 9%, and industry 1%.
AGRICULTURE, WATER RESOURCES & RURAL DEVELOPMENT
36. Economic growth sufficient to relieve poverty requires highier agricultural productivity or amassive slitft of labor from the rural into other sectors. Agriculture has made only limited progress towardSuChI growthl. It grew at 3.2% aninually in the 1960s, at 2.5% from 1973-1987, at 2.1% from FY83-FY84,and contracted 1.2% in FY95 following the drought/flood in that year. Reasons for slow growthi in

agriculture include: the narrow resource base, diminlisliling marginial returins to fertilizer and the littleimpact of researcih, extension, producer educationl and markets in promoting rapid growthi.Notwithistandinig the lack of a definitive strategy for tihe sector, GOB hias stated that its maini objectivesare to stimulate growthi enoughi to raise rural incomiles, to cut poverty, and to improve food security.Interimiediate objectives are to develop rural institutions, techinology and skills. The strategy isimpleimenited, first, thirougih a broad liberalization and deregulationi. The second effort is targetedintei-venitioni for poverty alleviation, suchi as food subsidies and directed credit. The thiird is investimenit inhumlilani capital, phiysical infrastrLIcture and techiical chiange thiroughi researchi and extensioll.
37. Since the nuid-1980s, the GOB has progressed toward a more rational expenditure program.Many regulationis on domestic food trade hiave been eliminated: important input subsidies hiave been cut;inteivenitionis in the water sector hiave been chiecked; staff in extensioni hiave been reduced, and tiletargeting of the food distribution system has improved. Today there are few restrictions on trade in farngoods and thle domestic prices of most goods are closely aligned to world market prices. Tlle GOBinvestimienit program on rural infrastructLire, irrigation, researchi and extensioni does contribute importanitlyas a souice of economic growth. An analysis of the redistributive effects of the aggregate rural spendinigpattern shiows some degree of progressiveness in the incidenice of expenditure as a percentage of theincomile of a given class. But the spendinig pattern is regressive in terms of the distributioll of spendilig byclass (thiese effects vary among different programs). The distribution of spendinig by class was: tihelandless. 12.3 %: small farmers, 25.1 %; large farmers, 27.6 %; urban poor, 19.7 %; and urbani rici, 15.4%. A note on Public Expenditure Impact on Rural Income and Poverty is given in Appendix 4.
38. Despite progress, the sector displays deficiencies in the efficiency and cost-effectiveness of1public spending. The present pattern of spending could be improved to better target the needs ofthe poor and landless. Moreover, the spendinig program suffers from weaknesses in planniniig andimplemenltationi capacity. All of this implies a need for a wide range of measures to chiange the pattern ofexpenditul-e if it is to better serve stated policy objectives of growth and poverty alleviation. These couldinclCude better targeting, chiange in expenditure composition: strengtheninig of the institutionial frameworkincludinig tile need to strengthieni the capacity of local governments; and measures enabling the privatesector and NGOs to play a greater role.
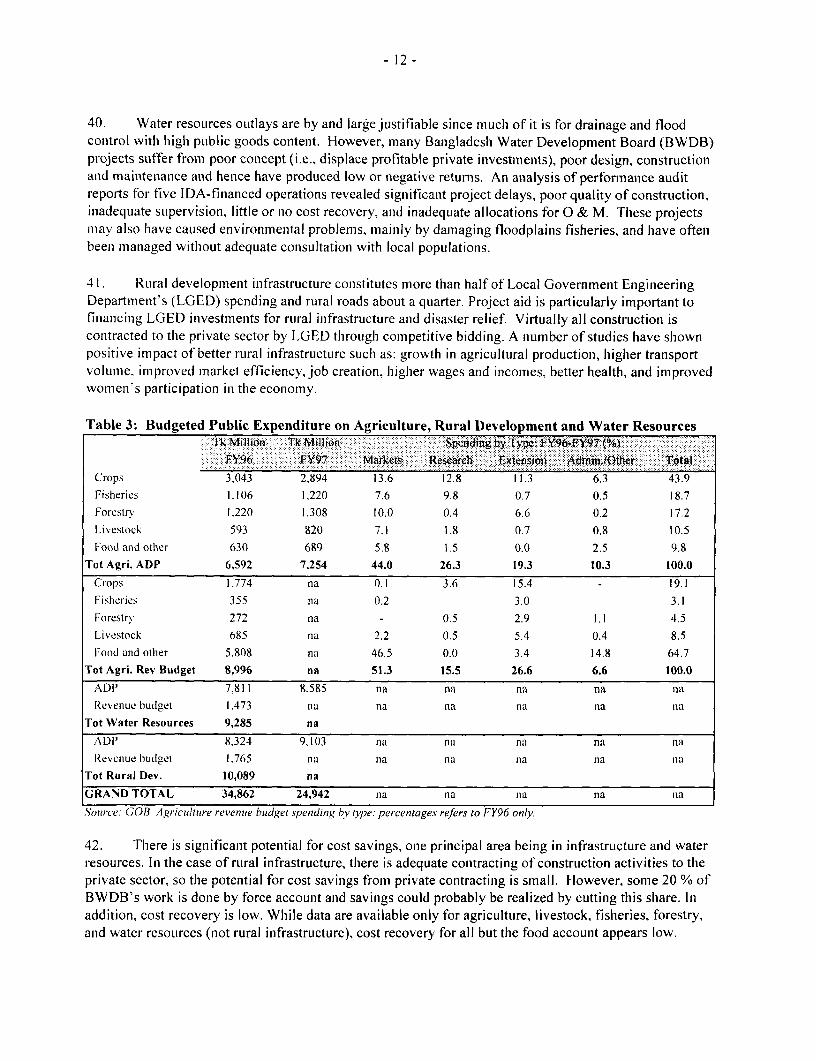
39. Public expenditure for the agricultural sector as a whole in FYs95-97 are about 21 % of the ADP.7 % of thle revenue buidget, or 14 % of the total expenditure resource envelope. Total expendituire for tileagricultural sector were budgeted at Tk34,862 millioni for FY96 out of whichi agricultural programs(crops, fishieries, forestry, livestock, food and othier) constitute 45 %, water resources 26 % and ruraldevelopmenit 29 % (Table 3). Expenditure on agricultural programs (crops, fishieries, forestry, livestock,food and othier) can be classified by type: extensioni, research, markets, relief, administrationi, irrigation,and educationi. Markets is thle major spendinig type2. Higih public goods contenit expenditure items sucIas ireseaicih. extension, and education, constitute less thian hialf of agricultural outlays. Studies hiaveshiown that research is higihly profitable; ex-post rates of return have been estimated at 149 % for rice. I I(% for potato, and 131 % for the crop sector.
2 Expenditures are classified as "markets" if they are assigned to: input supply: the Bangladesh AgricultureDevelopment Corporation (BADC): area development proiects not explicitly labeled as research or extension:the Directorate of Food: reforestation; and fisheries, forestry, or livestock production. Markets constitLites 44percent of ADP agricultural programs or nearly as much as research and extension combined in FYs96-97.Moreover, markets accounts for 51 percent of the revenue budget (mostly food programs).
- 12 -
40. Water resources outlays are by and large justifiable since much of it is for drainage and floodcontrol witlh high public goods conteit. However, many Bangladeshi Water Development Board (BWDB)projects suffer from poor concept (i.e., displace profitable private investments), poor design, constructionand maintenanice and henice have produced low or negative returnis. An analysis of performance auditreports for five IDA-financed operations revealed significanit project delays, poor quality of construction,inadequate supervisioni, little or no cost recovery, and inadequate allocations for 0 & M. These projectsmiay also have caused environimenital problems, mainily by damaging floodplaiis fisheries, and have oftenbeen maniaged without adequate consultationi with local populations.
41. Rural development infrastructure constitutes more than half of Local Government EngineeringDepartment's (LGED) spendinig and rural roads about a quarter. Project aid is particularly important tofinanicinig LGED investmenits for rural infrastructure and disaster relief Virtually all construction iscontracted to the private sector by LGED throughi competitive bidding. A number of studies have shiownpositive impact of better rural iiifrastructure such as: growth in agricultural production, highier transportvolume, improved market efficiency, job creation, higiler wages and incomes, better healthi, and improvedwomen *s participation in the economy.
Table 3: Budgeted Public Expenditure on Agriculture, Rural Development and Water ResourcesTh Million UN Mllio Sp ing b T.p ........ ...)
FY96... . ... . ..... .... .. . . . ydosr .Adnid9 ter. Tt.. . ... .. . ..-1 .....;- .... ..' ..0g"'-;;-0'-'y$ - ..'i .. ':it . . .... ... .. ' T .' 6 ... .. .. ... . ....
Crops 3,043 2,894 13.6 12.8 11.3 6.3 43.9Fisheries 1.106 1,220 7.6 9.8 0.7 0.5 18.7Foresitr 1.220 1.308 10.0 0.4 6.6 0.2 17.2Livestock 593 820 7.1 1.8 0.7 0.8 10.5Food and other 630 689 5.8 1.5 0.0 2.5 9.8
Tot Agri. ADP 6,592 7,254 44.0 26.3 19.3 10.3 100.0Crops 1.774 na 0.1 3.6 15.4 - 19.1F'isheries 355 na 0.2 3.0 3.1Forestrv 272 na - 0.5 2.9 1.1 4.5ILivestock 685 na 2.2 0.5 5.4 0.4 8.5IFood and other 5.808 na 46.5 0.0 3.4 14.8 64.7
Tot Agri. Rev Budget 8,996 na 51.3 15.5 26.6 6.6 100.0ADP 7.811 8.585 na na na na na
R[eveniue budget 1.473 na na na na na naTot Water Resources 9,285 na
ADl' 8,324 9.103 na na na na na
Reveniue bludIget 1.765 na na na na na na
Tot Rural Dev. 10,089 na
GRAND TOTAL 34,862 24,942 na na na na na
Source. GOB. Agriculture revenue budget spendinig by type. percentages refers to FY96 onlyv.
42. There is significanit potential for cost savings, one principal area being in infrastructure and waterresources. In the case of rural infrastructure, there is adequate contracting of construiction activities to theprivate sector, so the potential for cost savings from private contractinig is small. However, some 20 % ofBWDB's work is done by force account and savings could probably be realized by cuttinig this share. Inaddition, cost recovery is low. While data are available only for agriculture, livestock, fisheries, forestry,and water resources (not rural infrastructure), cost recovery for all but the food account appears low.

- 13-
Pro jected cost recovery for FY96 is Tk8 12 millioni or about 18 % of the revenue budget. Recovery ofcapital costs is practically zero. Most of governimienit's spendinig for public goods is for research aiidextension for very poor farmers from whom it is unlrealistic to expect significant cost recovery. Somecost recovery could be obtained for research on commercial crops (tea, cotton, sugarcane and jute)througih earmiarked levies or othier meais. More can be done in cost recovery for rural infrastructure andin the water sector, but the emphasis has to be on better project selection.
43. In SUIl, measures to cliange the composition of expenditure needs to include: a reprioritizationi byreductioni of spendinig on markets while focusing on outlays withi h1ighier public goods contenit and positiveeffect on growth and income, such as rural infrastructure, irrigation, research and extensioni; measuires toenIsure appropriate balance of ADP capital expenditure and current budget allocations, includinig 0 & M.Also, GOB needs to consider options to achieve more cost savings and better cost recovery. Moreoverthiere is a need for wide ranginig measures to improve the institutional framework to strengthieni thecapacity to design, implement and evaluate projects; to reduce ineffective institutionial fragmentationi; andto move away from excessive centralization and to encourage more autonomy and local participation.
44. GOB has long recognized the scope for a greater role for the private sector and NGOs, theIgeneral argumenit being that government shiould concenitrate on areas with a strong public goods contenitand where it can act as a facilitator to private and NGO efforts. Accordingly government should moveaway from having a direct role in supply of commercial inputs and large commercial farmingpr-ojects. Instead it should concentrate on the supply of public goods such as extension, research,education and information, and to facilitate infrastructure development. The structure of incenitivesand the reg(ulatory framework should not hamper private and NGO participation in investmenit inproductioni and marketling of commodities aiid inpLits, as well as in researcih on cashi crops, notably sugar-canle anid cottonI; or in extension in some high-value commodities. In many instances an increased role forthle private sector and NGOs may prove to be cost-effective and also to invigorate new ideas and localparticipation.
45. A significanit part of GOB's FY96 and FY97 expeniditure programs is cilaracterized by weakimplemenitation. Muchi of the market spending shiould be eliminated as these inputs could be supplied bythle private sector. Example of market interventionis whlich clearly are inappropriate incLide: a dairy and apoultry farim, livestock rearing and hatchiery services; a flour mill and possibly maniy cooperativeactivities. Other examples where there are grouLids for considering policy chanige include: seed and fiter ice projects; the project for BMR (if the flour/seed mill at Postogola should be dropped); projects inrIubber cultivation, jute and textile products, goat rearing, milk and cattle farming -- all of whichi mayinihibit a more active role for the private sector. Also, the projects for building more food graini storagecapacity sIhould be re-examined in the context of government's diminishlilig role in food operations.
MANUFACTURING
46. At a broad policy level, Bangladesh is set on an appropriate road for achieving its goal ofrapid industrialization. Pronouncemenits hlave been made -- and in several cases initiatives taken --favoring private sector led development, and there is a genieral uliderstanidinig of the reforms needed tocreate the necessary enablinig enviroiinenit. However, slow progress on implementation is illustratedby the current year's public expenditure program which, though modest (1'S, of ADP, Appen(dix 5,Box 1), reflects the failure so far to redirect the State's role in industry from investment to support.The sluggishI privatization process hias allowed contintLilng expenditures to upgrade existing units and,more astonislinig, a few new investment proposals. Support services are diverse (Box 2) but uid hoc.

- 14 -
Before approving future ADPs, the new Governmeit shiould reorient support for industry under aprivatization-sLupport-security-utilities program (Box 3).
47. The privatization program is stalled and some Corporations are still investiig. The slowdivestitilne of State-owned imanufacturinlg enterprises leaves thle Governmenlt withi past investimienits thatare low or nonl-perforiniig, the already crippled bankinig system withi a large backlog of ullrecoverableloans, public corporation managemiienit teams contiluilig to plan new investimienits wilichi are unllikely tooccur, tariff reforimi impeded by conflicted public interests, and tile private busiLess community confusedabout the Governmelt's commitment to private sector led industrial developmeit. Moreover, the ADPcontainis investilmenits to upgradinig public cement, TSP fertilizer, glass, sugar and spininiig facilities,rathier thian leaving suchi decisions to futur-e private owners. Privatization sIhould hiave precededcoiimmercial decisions on reliabilitation or moderinization. As a secoiid best, they shiould be put on thlemiarket as soon as the present efforts are complete, and no furthier BMRE projects initiated witih eitlierGovernimienit or Corporation funds. Additionally, considerable furthier strengtilenilig of the PrivatizationBoard's manidate and resources is essential to manage the necessary acceleratioii of the divestitureplrocess. More striking examples of giving wrong signals to the private sector are the Clhemical IndustriesCorporationi's proposal to build a new $274 millioni fertilizer plant (Shalhjalal) and a CIB Unlit at itsClhittagong complex, its studies ofjtite-based paper and bagasse-based newsprinit, aiid the Steel andEnginieerinig Corporation's proposal for a cable and conductor plant. These plans shIould be reconsidered,and no fuLthier suchi initiatives shiould be taken under public ownership.
48. Tle range of industrial support services is neithier strategic nor demand-driven. Thle ADPconltainis a wide range of activities in this area, but they shiould be reconsidered in the lighit of poor pastperformance and othier countries' good experience withi private entities or private manageimenit of publicfunlds. In particular. provision of industrial estate facilities, includinig export zones, shiould concenitrate onfacilitating private initiatives rather thian expanding the State's own involvemeit. BSCIC especiallysh1ould promote small and cottage industry by identifyinig and alleviating policy and regulatory problemsrathier tihan operating commercial infrastructure. The current investments of the Sericulture andI-landloomil Boards shiould be operated on commercial lines and no furthier projects planined. Similarly,several facilities to support the othier textiles industries shiould have far greater private involvemenit andshlould be coordinated withlini an agreed development strategy for this critical subsector. Future support inthe areas of investmenit and export promotion may be better directed to professionally maniaged matchliliggrant facilities to assist new private investors. This leaves initiatives to private businiess. Similarly, aninitiative to build a $100 million World Trade Center in Dliaka sIhould be left to the private sector. On tlleother hiand, little attention is evideiit in tihe ADP to manifacturers' need for hiighier quality support in tileareas of metrology, standards, testing, and quality control (MSTQ). More public expenditure may beneeded in these areas, but only ulider overall sectoral strategy for assisting tecnilology diffusioni anddcevelopinig inter-inationally recognized accreditation processes.
PHYSICAL INFRASTRUCTURE49. Sector problems. The infrastructure sector in Bangladesil consists of roads, railways, ports.water supply and saiiitation, and urban inifrastructure subsectors and is pivotal for the country's economicgrowth. Tlle sector faces massive constrainits resulting from inadequate service provision and funding andweak institutionial structures and pricing mechianiisms. While the Government and donors have madeconcertetd efforts to improve the quality of infrastructure - infrastructure claimed 29% of the FY96ADP allocations -- rapid population growth has led to massive demand for water supply, transportancl other services.

- 15 -
50. The transport sub-sector suffers from major constrainits resultling from a combiniationl ot phiysical(geographical), developmental (low level of investments) and institutional factors. Thlese include: (a)inter-miniiiisterial coordination of the sector, wilichi hias four separate ministries (Slhipping, Civil Aviation.CommunLI.1ication and Local Government) makling integrated sector planninilg aiid policy developmenit, inparticular, investmenit prioritization very difficult; (b) the acute scarcity of qualified and trained tecniicalgoverilment staff and, (c) the extremely poor performiaice of most transport sector parastatals. most ofwhiici ge-nerate considerable losses, withi Bangladeshi Railway (BR) being the leading deficit incuirrinigparastatal. These constrainits lead to lower efficiency, highier transport costs and transport unlreliability.resulting in quality deterioration, and increased market risks for sectors that depend on the transportsystemi.
51. As for the urban sector, Bangladesih has one of the fastest growing urban population,. estimated tobe around 4% per aninumii. Withi suchi rapid growthi, the deficiencies in urbani services like water supply.sanitationi and solid waste management are severe. It is estimated that in urban areas, only about 42% ofthe population hias access to reasonably safe water, wilile the urbanl sanitation coverage is about 42%(only Dhiaka hias waterborme sewerage). Tlle Govermilenlt recognizes the urgenit need for improvemilenlt inbasic services; hlowever, its efforts are constrainied by several factors: (a) lack of funds to supportinvestimienits in the urban sector; past investimienits hiave only been possible witih bilateral and donorfinanicinig, and little improvements in service provision hiave been acihieved; (b) inadequate local resouIrcemobilizationi and cost recovery and poor finanicial perforimanice of public sector agencies responsible lorservice provision; (c) weak public sector institutionis withi limited capacity to manage, operate andmainitaini services; and (d) inadequate sector planniniig and policy formulation, resulting in misplacedpriorities and unlcoordiniated development.
52. Government Strategy. The infrastrLIcture sector does not have a coordiiated strategy linking itsvarious sub-sectors. However, sub-sector strategies exist that largely guide the goverinenit investimienitprograms. Goverminent's transport strategy is intenided to support economic developmenit byencomiipassling an optimal transport network strategy withi multi-modal linkages that include a localtranisport network withi external links, an interinal tranisport development to support local iiarketintegrationi. and an effective regulatory and policy framework to enilanice the efficiency' of the sector. ForrLulal roads, the strategy is based on focusing developmelital resources on selected growthi centers, basedon socio-economic priority, withi emphiasis on road improvement and maintenianice, rathier thian new roads.
53. A strategy for the ports sector is not yet available. However, a study to prepare suchi a strategyhias been agreed by the Government. taking into accouLIt the potential at eachi port, includinig measures toaddress siltation problems at Mongla, and the potential for containier traffic growthl at Dhaka/Narayan-anj.For urbani transport, a strategy for Dhlaka prepared recently by GOB focuses on an immediate action planon the most urgenit infrastructure and institutionial and policy issues and a longer terim strategy. GOB andIDA are developing an urban transport project for Dhiaka, whiose focus would be on institutiolnalimprovements, and addressing key infrastructure bottlenecks.
54. Governmenit's strategy for the urban water and sanitation sector takes into accoulit resouIceconstrainits and involves development of services that are affordable and sustainiable to as many' people aspossible, wiliie improving the efficiency of sector institutions, emphiasizing on reliabilitatioii of existimtassets, anid selective expansioni of water systems. accompailled by institutionial strengthen in1g, and policyreforms. For the urban mnUllicipal sector, currenltly, the Governmeit does niot hiave a clear strategy to dealwitil identified issues and comistrainits. With IDA's assistance, a sector study is being ulidertakeni todevelop a policy framework and strategy for fiscal reform and decenitralizationi in the sector, includiLngii iproved institUtional performance.
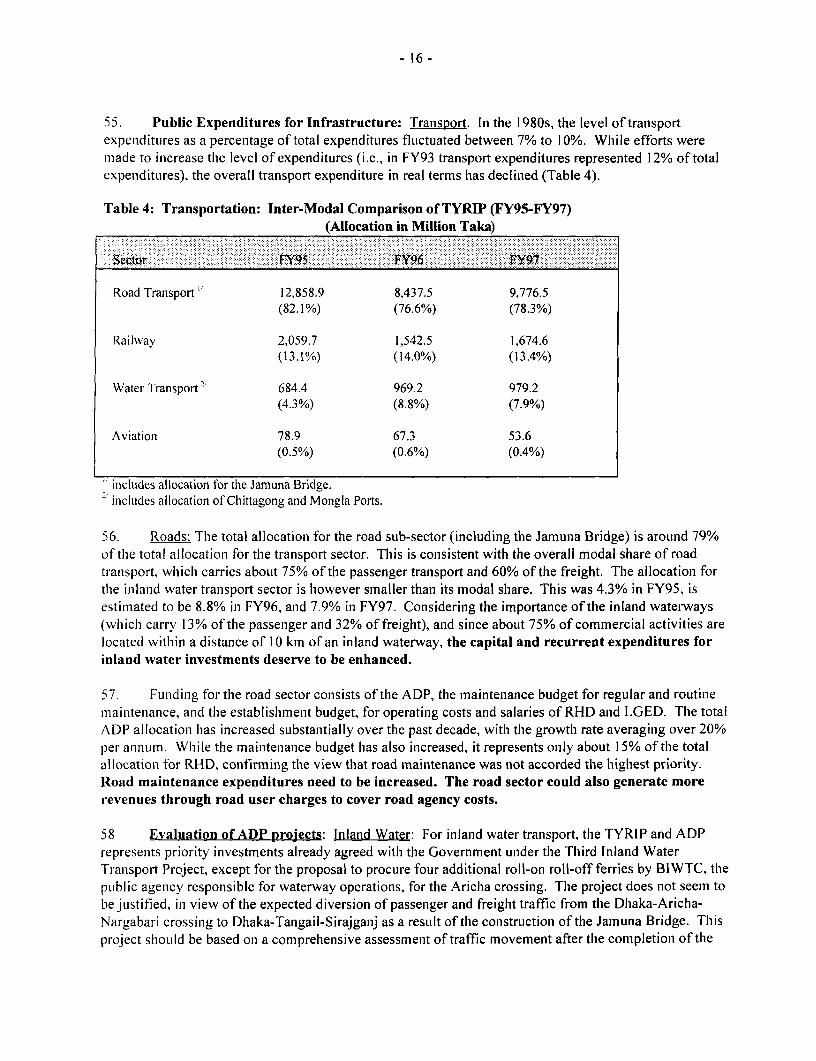
- 16 -
55. Public Expenditures for Infrastructure: Transport. In the 1980s, the level of transportexpendittires as a percentage of total expenditures fluctuated between 7% to 10%. While efforts weremade to increase the level of expenditures (i.e., in FY93 transport expenditures represented 12% of totalexpenditures). the overall transport expenditure in real terms has declined (Table 4).
Table 4: Transportation: Inter-Modal Comparison of TYRIP (FY95-FY97)(Allocation in Million Taka)
. S e.... .... ..r .. .. ........ . ... . . .. . .
Road Transport 1 .12,858.9 8,437.5 9,776.5(82.1%) (76.6%) (78.3%)
Railwvay . 2,059.7 1,542.5 1,674.6(13.1%) (14.0%) (13.4%)
Water Transport 2 '. 684.4 969.2 979.2(4.3%) (8.8%) (7.9%)
Aviation . 78.9 67.3 53.6(0.5%) (0.6%) (0.4%)
includes allocation for the Jamuna Bridge.-includes allocation of Chittag,ong and Mongla Ports.
56. Roads: The total allocation for the road sub-sector (including the Jarnuna Bridge) is around 79%of the total allocation for the transport sector. This is consistent with the overall modal share of roadtransport, wh1ich carries about 75% of the passenger transport and 60% of the freight. The allocation forthe inlanid water transport sector is however smaller than its modal share. This was 4.3% in FY95, isestimated to be 8.8% in FY96, and 7.9% in FY97. Considering the importance of the inland waterways(which1 carry 13% of the passenger and 32% of freight), and since about 75% of commercial activities arelocated with1in a distance of 10 km of an inland waterway, the capital and recurrent expenditures forinland water investments deserve to be enhanced.
57. Funidinig for the road sector con1sists of the ADP, the maintenance budget for regular and routinemain1teniance, and the establishmenit budget, for operating costs and salaries of RHD and LGED. The totalADP allocation has increased substantially over the past decade, with the growth rate averaging over 20%per annum. Whlile the maintenanlce budget has also increased, it represents only about 15% of the totalallocation for RH-D, confirming the view that road maintenance was not accorded the highest priority.Road maintenance expenditures need to be increased. The road sector could also generate morerevenues through road user charges to cover road agency costs.
58 Evaluation of ADP p)rojects: Inland Water: For inland water transport, the TYRIP and ADPrepresenits priority investments already agreed with the Government under the Third Inland WaterTranisport Project, except for the proposal to procure four additional roll-on roll-off ferries by BIWTC, thepublic agenicy responsible for waterway operations, for the Aricha crossing. The project does not seem tobe justified, in view of the expected diversion of passenger and freight traffic from the Dhaka-Arichla-Nargabari crossing to Dhaka-Tangail-Sirajganj; as a result of the constructionl of the Jamuna Bridge. Thispro ject should be based on a comprehensive assessment of traffic movement after the completion of the

- 17 -
Jamuna Bridge Project. For the ports sector, the TYRIP includes the development of an inland containerr iver port ai Dhaka, to be donor financed. Given the need to coordinate investments under the portdevelopment strategy, this investment should be deferred until the Port Systems Study has beencompleted. Assuming the proposal is consistent with the port development strategy, the Government mayseek private sector financing, rather than use public resources. Also the remaining Government shippingcompanies could be privatized.
59. Urban Transport: Physical investments in urban transport infrastructure should be consistent withthe long-term strategy, as well as the investments under the proposed project. The TYRIP for FY95-FY97 includes construction of fly-overs at various locations in the city of Dhaka to alleviate pedestriancongestion. While these investments may prove to be justified, they should be evaluated in the context ofthe proposed Dhaka Urban Transport Project, to ensure that they are consistent with the long term urbantransport strategy.
60. Air Transport: The FY95 ADP and the TYRIP includes several projects that would need carefulassessment of the demand, economic and financial viability and priority before going ahead. Theseinclude the construction of STOL airports at Mongla and Bogra. In addition, the ADP includes theconstruction of a three star hotel at Zia International Airport, which is clearly a private sector activity.Thiis project should be dropped from the ADP, and private sector financing be sought for the hoteldevelopmenit. GOB may also explore the benefits of privatizing operations of Bangladesh Biman.
61. Water. Sanitation and Urban Sector: Although the Government has declared its intention toimprove service provision in the sector, investments have remained low due to funding constraints. Thetotal outlay for the sector in the TYRIP is Taka 19.1 billion, representing 4.8%, 5.2% and 6.1% of thetotal expenditure in FY95, FY96, and FY97 respectively (Table 5 ). This is a marked improvement fromthe trend in the early 1990s (when the outlays for the sector declined sharply to about 2% of expenditures)and reflects the commitment to improve service provision for water and sanitation, particularly in ruralareas. Expenditures however, are still not adequate to meet service improvement targets.
Table 5: Urban, Water, Sanitation and Housing Sector (Tk Million
Urban 1,972 2,815 3,258 8,045Water 2,131 2,842 3,112 8,085Housing 877 1,074 1,030 2,981
Total 4,980 6,731 7,400 19,111
62. WatrSp.pIy. In the ADP for FY96, the allocation of Taka 2.8 billion for this sector representsabout 2.6% of the total development expenditure (and 40% of the total expenditure for the water supply.urban and housing sector), a marginal improvement from FY94 and FY95. In rural areas, UNICEF hasbeen involved in financing most water and sanitation programs. UNICEF's assistance, whlichl has beenvery instrumental in increasing the coverage of water supply in rural areas, is ending in FY96, and thereare no provisions in the FY97 investment program. Given the high net social return and povertyalleviation impact of rural water supply investments, the Government should enhance public sectorinvestmlenit in this area, and increase its efforts in mobilizing other sources of financing, either

- 18 -
multilateral, bilateral or local sources to contillue witih the programs. In the urbani areas. the TYRIP isconlsistenit with the Government's strategy of reliabilitation of existing water supply systemlis and selectivedevelopmenit of new systeims. The program also includes the constructioll of a 100 mgd well-field nearSingair to provide water to Dhaka City. This investimienit sh1ould be evaluated in the context of DWASA'scurr-enit activities under the Fourth DWASA Project, the proposed water resources maiagemenlt programto ensure that the investmenit represents the most optimal solution and is economically viable, and takesinto accoulit DWASA's finanicial and institutionial capability. In additioil, the Governimienit should activelyseek private sector participation for its ftunidinig.
63. Urbanl Development: The public expenditure outlays for urban development have incr-eased inrecenlt years, but remain ulider 2% of total expenditures. These allocations are inadequate to sustaillservices in the ul-bani areas. The outlays do not include block grants thlat munuicipalities receive anniuallyfiom GOB to finanice recurrent expenditures and other investimenlt programils. The programs included inthle TYRIP aiid FY96 ADP appear to be consistenit with the overall development ob jective of improvingser-vice provisioIn in urban areas and represent hiighi priority projects withi highi social returins and a highpoverty impact. However, the sustainiability of the programs is questionlable given the weak institutionalcapability of thle municipalities and other support institutionis.
64. Housing aid Other InfrastrLictLire: The housinig infrastructure investimienit programs in the TYRIPand the FY96 ADP involve the implementationi of various sites and services programs in urbanl areas ofBangladesh, throughi the Housing and Settlements Directorate (I ISD). Thlese programs are justifiablefrom a poverty standpoiit, since they are targeted at low income areas. However, it is not clear whetherthiey are based on some prioritization and whethier there has been any economic evaluationi of theinvestimlenlts to determine whethier they represent an effective use of resources. The Goveri-inenit shouldelIcourage the participation of NGOs in the planniniig, implementation and managemiienit of these sites andservices program to ensure siistainiability and effective use of resources. The ADP also iniclides variollsprogramiis to build a total of 3,000 residential flats in the Dhaka area for govermenit employees, andconlstrLIctioll of circuit houses in 44 new district headquarters. Such housinig development by the publicsector caninot be justified from a resource use poinlt of view or on equity grounds. and shoLIld be left to theprivate sector. It is therefore recommended that these programs be dropped from the ADP and theTYRIP.
65. Regarding thle tourism infrastrLIcture, the ADP and TYRIP programs include the procuremiient ottwo water- tranisport vehicles and constructionl of watchtowers to promote tourisimi in the SuLndarbans:construLIctioll of holiday homiies anid hotels in various parts of Bangladesil; and othier facilities, whiclh arenot public sector priorities. The Governmenlt shiould seek private sector finanicinig for these investimients.
66. Recurrent Cost Implicationis of the TYRIP Projects: Among the sub-sectors. the roads sub-sector(Tenerates more revenues thani expenditLires from user charges. The ports generate profits. and thiereforedo niot need goverinmelit subsidies to finanice operating expenditLires. Only BR. BIWTA and BIWTC'incLir deficits, requiring govermiienit subsidies. Currently. BR is implemenitinig a Railway RecoveryProgrami, aimed at restoring its financial viability and creating a corporate environimiienit wlicih will enablethe rail to reduce its losses considerably. BIWTA and BIWTC are also implementing financialrestrUctUring programs under the Third Inlanid Water Transport Project. The imnpact of these programswill be to reduIce the need for budgetary allocations, thus freeinyg up thle Governimienlt's budgetaryresouices ftor recurrenlt expenditures in the transport sector.
67. In the water supply, sanitationi and urball sub-sectors, the area with possible signilficanit recuirrentcost implicationis for the Governmeit is the urban sector, in particular, block granits to ftinanice operating

- 19 -
expendittires. However, it is difficult to determine the extent of the impact of sucih granits on the natiolnalbudget because they are not based on a predictable, transparenit and sustainable system. The deficits ofurban based water supply systems, while a matter of concerin, are not large enougil to liave any significanitimpact oni the Government's recurrent budget.
ENERGY
68. Sector problems: Relatively low cost indigenious natural gas and its applications throuigih power.fertilizer and industry has been the enginie that has fueled higih economic growth in recent years. Duringthe last five years, however, supply shortages particularly in power generation has slowed dowin thegrowth rate with adverse economic impacts3. If expected GDP growth rates of 6% to 8% are to beachieved the pattern of higih growth in gas and power will need to be restored. This however, willnecessitate large investment requirements. In the power sector, capital expenditure requiremenits willincrease substantially in the future: from Tk. 13 billion p.a. at present to approximately 20 billion p.a.during 1997-2000 and 30 billion p.a. after 2000. The public sector, however, is not in a position to carryout suchi an ambitious development program and a substantial proportion of the new investment should bechanileled to the private sector.
69. The production, transport and delivery of most of the commercial energy in Bangladeshi is carriedout by five publicly owned companies4. All operating companies (OCs) require approval fromgovernilmenit agencies for major investmienit, operating budgets, salary scales, staff recruitment andinterinal procedures. Consequently management accountability is undermined and performance is farfrom the applicable commercial norms; tariffs are set far below economic costs, system losses in bothpower and gas distribution have reached alarming proportions, and large amounts-of receivables areaccumulated. Since the OCs do not operate in a competitive environment there is no incenitive to improveperformance. In the gas sector, GOB's excessive levy of excise duty has resulted in operating marginisthat neithier meet finanicial requirements nor reflect cost structures. High losses and poor collections arethe main causes of BPDB's and DESA's weak financial performance. While the REB system of ruralcooperatives (PBSs) have met with considerable success in resolving the institutionial weaknesses presentin BPDB and DESA, the unviable consumer mix and irrational supply boundaries result in substantialsubsidies being drawn from GOB.
70. Sector Strategy Gas sector The new petroleum policy (introduced in July 1993) significalitlyliberalized contractual terms for gas exploration resulting in significant interest shiown by InternationalOil Companies (lOCs). To date, four production sharing contracts (PSCs) have been signed andnegotiations for other exploration blocks are proceeding in earnest. This new private sector participationis already bearing results with new finds reported and considerable investor entilusiasm for private powerproposals. These initiatives need to be followed up withi the commercialization/privatizationi of thePetrobangla group. Current plans include the flotation of a portion of GOB sharelholdinigs in two OCs.letting the OCs operate under private company law with adequate managerial autonomy, reforming gastariffs, developing competition in the sector, and establishiing a regulatory framework (includingarrangeinenits to monitor performance, prevent abuses of market power and promote competition).
3 GD[l clasticity ibr power is of the order of 2 to 2.54
I'etrobangla (a holding company with eight subsidiaries). Bangladesh Petroleum Corporation (131'C). Bangladesh PowerlDevelopment Board (BPDB). Dhaka Electricity Supply Authority (I)ESA). and Rural Electrification Boaid (REB): all of' hichoperate under the direction and control ol'the Ministry ol,Energy and Mineral Resources (MEMR).

- 20 -
71. Power sector In order to carry out the ambitioLIs power sector developmenit program theexisting loss making sector institutionis need to be restructured under a major reform program whichi willbe based on:
* substitutilig private genleration for most of the niew plant additions;
* ulibunlindiig and restructurinig the existing utilities to establish suitable generationi companies, a singletransmissioni company and a nUmber of distributionL utilities all acting in aii indepenidenitcomimercialized environmenit;
* rationializing operating boundaries of distribution UllitS wilile utilizing the positive qualities of theREB/PBS arrangement to redress distribution system weaknesses; and
* establishinig a regulatory structure to oversee sector operations.
72. In the context of the existing situationi in Bangladeshi, however, it is recogn ized that the process ofdevelopment into a fully commercialized environimenit will necessarily take some time. Wlhile GOB hascomilmeniced a number of preparatory actions the implemenitation process should be expedited and theinvestmenlt program should reflect contemiiplated institutionial chaniges. In particular, there should besubstantial transfer of investment to the private sector in generationi, and the distribution investmentssIhould be coordinated with the restructuring/rationializinig exercise. A number of upfront actions such asthe tranisfer of lines to the REB system should also be carried out with immediate effect.
73. Evaluation of ADP projects: Energy sector investments The power and gas sector absorbs asizeable share of GOB's total ADP expenditures -- averaging about 17% over the past three years. AsPSC arrangemenits has already been successfully negotiated for exploration/productioni we do not see anynecessity for a new drilinig project costing Tk 2.6 billion to commence in FY97. In addition, a carefulreview of two ongoinig projects is needed; the Barapukuria Coal Development and Madhapara Hard Rock.Investimienit plans in the power sector have also retained the secoiid east-west interconinlector althoughI ithas now been established that a gas pipe Iine over the Jamuna bridge is the preferred altermiative.
74. Power investments -generation. Althoughi the most economical and environimenitally beniginoption is gas based combined cycle plant a number of gas fired steam turbine plants and a two stage coalplanit are included in the ADP. While no reversal of projects under construction is possible (GhorashalNo.6 anid Rauzani No.2, under constructioni with Russian and Chinese supplier's credit) action should betaken if possible to replace Siddhirganij5 and the oil fired steam turbine plant at Khulna with private sectorbased combinied cycle plant. With respect to the coal plant, a review of the currenit state of the projectshou0ld be carried out and decisions taken oni the optimum capacity of associated power plant. The powerplanlt should however be carried out oni a BOO basis. If a vigoroLIs program of private participatiomi ingeneration projects is followed it would be possible to remove about 750 MW of plant totaling to aninvestimienit of US$ 666 millioni (to be incurred between 1997 to 2001) from GOB finanicinig. It is alsoniow clear that nuclear generationi is uLneconiomic for Bangladesih in the foreseeable future and this projectshould be dropped from the investmenit program.
75. Power investments- transmission and disiribulion. The proposed east-west interconlinector. stillretainied in the program, should be dropped sinice it has niow beeii confirimied that the gas line over the new
Suppl1ie:s crediL terms have bcen negotiated for Siddhirganj hut construction contracts have not been linalized

- 21 -
Jamuna bridge is more economical. Additional investmenlt (particularly in distribution) is not meaningfulin the context of continiuing higih losses and poor collections as the benefits are both distorted andsiphonied off. We do however, recognize the need for substailtial investmenlt in the distribution sub-sectorto meet the needs of both increasing demand and network expansion. The planned developments shouldbe reformulated and optimized in the context of two basic strategies: (i) rationalization of the distributionnetworks betweeii the operating utilities (with the PBSs taking over the networks withini tileir overallbouLidaries), and (ii) coordinating the developments with the unbundling and restructuring of BPDB andDESA.
EDUCATION
76. The GOB commitment to education is evident by the increase in this sector's share of ADPallocations from 8 to 14 percent between FY92 to FY95. While the GOB lacks a comprehenisive sectorstrategy its general objectives are to improve quality and efficiency and to promote equity and alleviatepoverty, whicih implies special efforts in primary education and targeted programs for rural poor andwomen. More recently GOB hias announiced a target of eradication of illiteracy in 10 years; literacy is nowestimated at 37%. In the primary sub sector, the GOB launched a universal primary and mass educationprogram in 1980 and since then it has taken several measures to increase access and improve quality ofthe education system. Primary education was made compulsory in 1990 and a Primary and MassEducation Division (PMED) was created. Despite the GOB's efforts, education is beset with a niumber ofproblems. Althoughi general enrollment rate reported at the Primary level is 92%, attendance andcompletioni rates remain low at about 66% and 61% respectively. Average teacher pupil contact time atthe primary level is 2-4 hours, one of the lowest in the world. In addition, teachers are insufficientlytrained. poorly motivated and inadequately supervised. Over the past ten years there has been aproliferationi of Islamic and NGO/private corporation schools to supplement the govermilenit's efforts.Government has provided salary subventionis to nongovernment/private corporation schools and someebtadyee; as well as block grants for school renovations and facilities, inservice teacher training and freetextbooks for students. In addition, NGOs have increasinigly conducted nonformal primary educationprograms although their impact in terms of numbers being educated is limited. Most of the NGOsproviding the first three years of primary education receive financial support from donor agencies.
77. An analysis of expenditure incidence by income group in rural education (i.e. public spendinlg onall levels of rural education) points to a higlhly skewed distribution of benefits. (see Appendix 4). But thedistribution of benefits from primary education alone appears to be fairly progressive. The expansioii ofprimary educationi in rural areas is thus seen to have a pro-poor orientationi. A further shift withinpublic education expenditures towards rural primary education should further strengthen thistrend. At the same time, more attention needs to given to increasinig access of the rural poor to secondaryeducation. Rapid expansioni in the primary enrollnent will entail highi demand for secondary education inthe next five years which cannot be met by the existing supply of secondary schools.
78. There is thus a good public good provision argument for giving continued high priority toeducation. Even so, there is an urgent need to improve the cost effectiveness and quality of existingpublic expenditures while, at the same time ensurinig that sufficient funding is available to this highipriority activity. The spending pattern at all levels of education needs to be re-oriented to ensure bettertargetinig for the poor. The institutionial framework needs to be strengthienied to improve the capacity toevaluate and implement projects. While the evaluationl of the educationi sector in this report concenitrateson ADP projects, there is need for a comprehensive sector strategic framework including all ADP andrecurrent public expenditures as well as efforts by the private sector and NGOs.

- 22 -
Table.6: Intra-Sectoral ADP Allocations in Education (Billion Tk)
Primary. Food for Education 1.6 2.9Other Primary 7.0 5.4
Total Primary 8.6 8.3Non-formal 0.3 0.7Secondary/Higher Secondary 5.3 5.6Technical 0.2 0.2University 0.3 0.4Others -0.8 0.8
Total Education 15.5 16.0
79. Primary education constitutes 52% of the education sector's ADP allocation for FY96 (Table 6).However, if the Food for Education is excluded, the allocation to primary education is lower than lastyear and less than the budget for Secondary and Higher Secondary Education (SHSE). Overall, theplanned investment in the primary sector do not exactly support the objective of improving qualityand efficiency. First, the subsidy component, i.e. the Food for Education program, which represents 32%of the ADP allocation to primary education, needs to be reviewed to examine its educational impact,economic sustainability and cost effectiveness delivery as a subsidy mechanism. Second, the GOB'srationiale that more schools are needed to accommodate the currently enrolled students and to increaseenrollment to 100% within five years is not fully substantiated. There is, as yet, no dependable schoolmapping and cost effective criteria to ensure economic deployment of existing physical infrastructure anddeterminling real needs. Also, merely concentrating resources on construction and maintenance withoutaddressing quality and efficiency issues will lead to continued high drop out and repetition rates. A majorquality/equity issue is the status of teachers in the nongovernment/private corporation and ebatadyeesch1ools which about 40% of primary school children attend: these schools are subsidized by governmentbut teachers are untrained, poorly educated and have few opportunities for career development. Schoolsreceiving government subsidies are in areas not served by government schools and most likely to beserving the poorer communities in rural areas. Tmhird, a large number of the 13 ongoing ADP projects inprimary education for FY96 are in their completion phase, while the remaining mainly constitutes outlaysfor construction of schools and disaster shelters to be used as school buildings, the emphasis being onphysical infrastructure rather than quality. Many of the projects funded by Saudi Arabia, IslamicDevelopment Bank and EEC, are emergency or relief aid and the inclusion of these projects in the ADPcreates a somewhat erroneous impression of adequate resource allocation for the sector. Moreimportantly, these projects tend to exert an added pressure on PMED's already limited planning andimplementation capacity.
80. Non formal Education accounts for 4% of the total ADP allocations for education. While this isinadequate, given the large target numbers outside the forrnal system (about 15 million by the year 2000),the "cautious approach" may be the right route to follow given the universal experience with high1 failurerates in adult literacy. The majority of nonformal education programs are provided by NGOs and anargument can be made that they should be the main providers in this subsector e.g. the IDA/ADBNonformal Education Project in which 90 percent of the Credit is channeled through governmen1t toNGOs for service delivery. There is a case to be made for government's role in this subsector to belim1ited to managers and NGOs, the main service delivery. GOB has, h1owever, initiated some innovative

- 23 -
approaches like the Total Literacy Movement - where adult literacy has taken the form of a masscampaign with active participation of the beneficiaries and stakeholders. A further expansion of thisprogram may be considered awaiting the results of the impact analysis being commissioned by PMED.
81. In secondary education all junior and 97% of the secondary schools are private or nongoverinmenit. The government exercises a major control, however, through the provision of subventionsfor salaries, block grants for constructioni and maintenance and training provided at Teacher TrainingInstitutes. The subventioni constitutes about 75% of the recurrent budget of the Directorate of Secondaryand Higher Education. The secondary sub sector suffers from low internal and external efficiency:the percentage of examinees and students passing is 49% and 27% respectively and the attendance rate isaround 62%. The main areas of weakness are: centralized management leading to an inefficientsubvention system which is not linked to teacher performance and prescribed quality standards forstudents; weak supervision owing primarily to an absence of accountability; and limited institutionalcapacity. There are 23 ongoing and 4 new projects listed in this sub sector's ADP. A large share of thecurrent secondary budget is allocated to construction and maintenance of schools. Apart from thenationial female stipend program, which addresses equity and gender objectives and the ADB fundedHigher Secondary Education Project, there is very little allocation to projects and programs aimed atimprovement of quality and efficiency. Furthermore, many of the projects for SHSE are in areas whereprivate initiatives could take the lead such as in construction and maintenance of schools and theestablishiment of Computer Science and Business Management courses and English language institutes.Also development of degree colleges may not be the best use of resources (17% of the total secondarybudget) since the quality of education in these colleges and their linkage to the Masters Degree coursesoffered in the University are still open to question. Further, a major ADP supported initiative is theintroduction of a nationwide stipend program for girls, the Female Secondary Stipend Program. GivenGOB's limited resources there is a need to monitor this program to ensure effective targeting based onpoverty and academic criteria.
82. Tehnical and university education have traditionally been government funded. There is a needto better link this types of education to the private sector so that skills and courses provided match labormarket demands and reflect users preferences. The government has decided to make substantialinvestment for the establishment of 13 new vocational training institutes and renovation of existing ones.indicatinig an emphasis on construction components rather than re-structuring of the existing vocationaltraining programs. The bulk of ADP allocation for the university level went to the Open Universityprogram. The need is to improve the quality of tertiary education rather than rapid expansion of thecapacity of public institutions. Recently the government has adopted a policy of encouraginig privateunliversities. Given the high cost of university education relative to primary and secondary, this trendshould continue. More importantly, there is a need to revise the current fee structure at the universities sothat partial costs are recovered and the subsidy component is reduced.
HEALTH AND FAMILY PLANNING
83. A sharp fall in fertility rates and in infant mortality are among Bangladesh's notableachievemenits over the past two decades. The healthi sector, nevertheless, is characterized by majorshortcominigs. An analysis of the utilization of public health facilities in rural areas (elaborated inAppendix 4) shows that the highest benefit is received by the middle income decile. Households locatedat the top income decile receive slightly higher amount of benefits compared with the poorest incomiiedecile. Second, a comparison of the relative proportion of public and private healthi expendituresindicates that benefits through public health still cover only a small part of the health care demand.Extreme rural poor households currently allocate 7-10 % of their income to cover private healthi expenses.

- 24 -
Third, the share of rural public health access is still limited to only 12-13 % with little variation acrosssocio-economnic groups. Access to maternal care is dismally low.
84. The GOB has acknowledged the need to give highi priority to the healthi sector to alleviatepoverty, develop human resources and enhanice labor productivity. "Health for all by year 2000" hasbeen the broad GOB objective. Family planninig is also seen as a national priority in order to reduce thepopulation growth rate and to improve the quality of life for mothers and their children. The share ofhealthi and family planning (FP) in total public spending has gone up from 4.7 % in FY86 to 6.9% inFY95 (provision for FY97 is 8.0%) reflecting increases both in the revenue budget and ADP. The privatesector outlays for health per houselhold is 2.6 times more thani public outlays. The combined public andprivate expenditure oni healthi and FP in 1990 was only US$ 7 per capita, and this was only 3.2% of GDP.This compares poorly with other South Asian countries. For example, per capita expenditure for health inIndia, Sri Lanka and Pakistan in 1990 was US$21, 18 and 12 respectively.
85. The healthi sector's share of ADP is 4.9% under the FY97 ADP while that of FP is 3. 1%. Abouthalf of the outlays in health have been donor financed while the share for FP was 65 % in FY96. Much ofthe expanded development resources have been allocated to Primary Health Care (PHC ) in rural areas.The Expanded Program of Immunizationi (EPI) and the FP program have made progress in establishinigessenitial primary services. Despite some notable success stories such as EPI, and consequenit reduction ininfant and child mortality rates, progress towards some critical PHC objectives has been slow. Forexample, poverty related diseases are rampant, and maternal mortality and morbidity still remain mostlyunabated. An extensive network of health and FP infrastructure has been built up in the rural areas,mainly in the forn of fixed care facilities such as Thana Health Complexes (THCs) and Uinioin Health andFamily Welfare Centers, but the utilization of these facilities remain poor due to inadequate quality ofservices and shortage of supplies. Fixed healthi facilities services are provided virtually free and the bedutilizationl rates at THC has never been much above 50%. Only about 15% of the rural patients ever seektreatment in the governmeit facilities. On the other hand, hospitals at the secondary and tertiary levels inlarger towns and cites are crowded. An effective referral system between the different levels of healthi orhospital care facilities is yet to be developed. PHC in the urban areas need to be improved on a prioritybasis and focus on the needs of the poor. Secondary level district hospitals also need to be strengthieniedto provide essential referral services to PHC facilities both in urban and rural areas. Finally, somedevelopment projects are of low priority. One example is the establishmenlt of five new medical collegesand upgrading of their attached hospitals wheni medical graduates remain unemployed and much effortsstill is needed to improve the existing eight colleges. Similarly, some of the city based tertiary levelspecialized facilities should not be considered a higii priority area for public spendinig. PLublic investmenitin providing costly hospital based tertiary level care is not cost-effective. This is an area where theprivate sector could play a more effective role.
86. Revenue budget recurrent allocations for healthi have increase but as a proportion of the totalrevenue budget they have remained around 5 1/2 % over the last years. Unlike the FP side where mostexpenditure is incurred under the ADP a large portion of health spending is covered by the revenuebudget. Expenditure for pay and allowances of personilel has gone up from 51% of the healtil revenuebudget in FY82 to nearly 80%. while the share for drugs and other medical requisites has gonle down fiom28% to about 15%. The shortfall in allocations for drugs and supplies is of serious concerin, because inthe absence of any effective cost sharing mechanism with beiieficiaries, the revenue budget remains theonly source of funds for all essential supplies for diagnosis and treatment of patients in hospitals andhealthi centers, and also for repair and mainteniance of equipment's and buildinigs. In ftiture it is essentialto undertake systematic analysis of recurrent expenditure implications well before the completioni of new

- 25 -
projects, and the additioiial amouLnt needed should be included in the revenue budget as sooIn as projectsare completed.
87. InI SumII, public expenditures in health and FP need to be augmented to move Bangladeshnearer its health goals. Notwithstanidinig some degree of progressivity in the distribution of benefitsfrom public healthi expenditure there is an urgent need for actions to improve the coverage and quality ofpLiblic healthi intervenitioni. There is a clear need for increased efforts to improve the access to publichealthi care services, including special programs for rural areas. The Governmenit should not aim atproviding comprelhenisive free healthi care to all individuals at all levels. Ensuring equitable access to anessential package of primary level, preventive and low cost curative healthi care services for all should bethe chief concerin. In addition, communities, local self-governmeit bodies, NGOs and the commercialprivate sector should be encouraged and supported in organizinig and managing their owIn health services.To achieve high cost-effectiveness and better targeting of the poor the allocation of publicexpenditure within the health sector needs to gradually shift from tertiary level and specializedhealth care services to more emphasis on preventive care and the primary level, leaving most offurther expansioni of highier level curative services to be financed by private resources. High priorityshould be given to maternal and child care including emergency obstetric care.


- 26 -
CHAPTER 3: THE INSTITUTIONAL FRAMEWORK FOR EXPENDITURE MANAGEMENT
INTRODUCTION
88. A sound Public Expenditure Management (PEM) system for Bangladesh needs to: (i) instillaggregate fiscal discipline including well-functioning planing and control instruments (ii) facilitate soundstrategic prioritization of expenditures between and within sectors and among project's, and (iii) ensurehigh levels of technical efficiency in the use of budget resources, i.e. achieve outputs at the lowestpossible cost. Given aggregate fiscal discipline, the second key challenge is how to prioritize competiigclaims on scarce resources, the underlying problem being tension among competing claims fromindividuals and groups.
89. Key institutional arrangements and their associated transparency and accountability mechanisms,which are needed to facilitate prioritization- include: (i) an expenditure planning process linked to theachievement of affordable outcomes, including a process to identify and discuss competing priorities atthe Cabinet level; (ii) flexibility for line agencies to make intrasectoral allocations; (iii) comprehensives ofthe budget; (iv) a process that allows feedback from claimants that inform priority setting, and (v) the useof objective criteria.
90. Assuming a prioritization of expenditures emerges from the above arrangements, there stillremains the principal agent problem within the government hierarchy. The technical efficiency in the useof budgeted resources will depend upon the relative autonomy of line agencies and the extent to whicithey can be held accountable for performance, the predictability of resource flows into ministerialbudgets, the competence of line agency bureaucrats, and the extent to which recruitment and promotion isbased on merit.
91. Changing incentives, including changes in the compensation system and efforts to build a moredecentralized framework for PEM, are essential and will require major long-term efforts of institutionialcapacity building. Concerted efforts are needed to develop local government and municipalities capacityto administer, initiate and implement public expenditure programs. Such efforts will require majorinstitutional capacity building and may gradually reduce or modify the role for central govermenit inplanninig and controlling expenditure programs. Devolving expenditure authority to line ministries ortechinical agencies operating separate from the central government, e.g. holding them accountable foroutputs, would reduce the need to evaluate public expenditure programs within the Ministry of Finance,the Planninig Commission and IMED. Building a stronger decentralized institutional framework willhowever require a long time in view of the generally weak institutional capacity and shortage of skilledprofessionals in Bangladesh. Hence it is also necessary for the GOB to strengthen the centralgovernmenit's ability to analyze, plan, monitor and control public spending programs including specificactions to counter immediate concerns regarding obvious examples of waste and poor management.
92. Important measures have been initiated in recent years to improve PEM in Bangladeshi.Supported by IDA's Public Resource Management Adjustment Credit (PRMAC) the Finance Divisionhas started the Reform in Budgeting and Expenditure Control (RIBEC) program with ODA assistance.This program aims at upgrading the structure of budgeting and accounting systems, including thleintroduction of modern data processing methods. The program also incLides a proposal to set tip a single"Budget Committee" in each Ministry/Division which could help to integrate recurrent and capitalbudgets. The Asian Development Bank supports technical assistance programs including efforts tostrengthien the Finance Division's capacity to do policy analysis by means for economic modeliigincluding estimates of major fiscal indicators such as the deficit, to improve the system for collection and

- 27 -
moniitoring of nationial accounts, and programs to improve project implementation and ex-post projectevaluationi by IMED.
MANAGEMENT OF THE AGGREGATE RESOURCE ENVELOPE
The Capacity to Estimate and Monitor Total Resources
93. Although progress has been made there is a need to further strengtheni the capacity to assess thetotal resource envelope, including estimates of all capital and recurrent expenditure, tax and non-taxrevenue, the fiscal deficit and public debt. Thie Resource Committee (RC) headed by Finance Secretaryand assisted by a Technical Committee (TCRC) was responsible for estimating the total resources for theaniual budget, i.e. the Revenue Budget (including the Food and Capital Budget) and the ADP, plusdevelopment aid. In 1990 the Government redesignated RC as "Budget Monitoring and ResourceCommittee" (BMRC) and enlarged the Committee. The Finance Minister is Chairman of BMRC andrepresentationi at the level of Secretary or Chairmani from the following institutions is included in theCommittee: Fiianice Division, Foreign Aid and Accounts Branch (ERD), Internal Resources Division(IRD), Ministry of Agriculture, Ministry of Commerce, Ministry of Industry, Ministry of Food, Governorof Bangladeshi Bank, Member (Programming) of Planning Commission, Tariff Commission, andAdditional Secretary of Finance Division in charge of budget who is Secretary to BMRC. The TechnicalCommittee (TCBMRC) is headed by the Additional Secretary in charge of budget and Finance Divisionhas also beeni enlarged with representation from the same agencies. Tlhough the terms of reference ofBMRC have been expanded, in practice it has remained restricted to the narrow budget managementissues and continues to act on an ad hoc basis. During FY93-96 it met only once. TCBMRC met moreoften but it still lacks any formal methodology and an institutional focus, its personnel being drawn fromseveral institutionis. The initial estimates of revenue by TCBMRC and BMRC have often been tooambitious. Strengthening the capacity for estimating and monitoring of the total resource envelopewill demand concerted efforts to train and recruit professional and experienced staff and torationalize the institutional set-up.
94. There is a basic need for improved assessment and managemenit of the fiscal deficit and publicdebt. The Government should adopt the most comprehensive definition of deficit and debt and install aunit in the Finance Division, preferably combined with TCBMRC, to collect data and monitor debt. Thefinancing plan of the budget should clearly state the amount of deficit and the various methods forfinanicinig. There is fundamental need to develop a solid framework for management of public debt,including strengthieniing of audit, accounting and planning mechanisms. The Comptroller & AuditorGeneral (CAG) should cover public debt in annual audit which should receive specific attention from thePublic AccouLits Committee and the Parliament.
95. The TYRIP has provided a much needed instrument for three year rolling planling for ADPoutlays. However, it needs to be strengthened and broadened in its coverage. Ideally it should cover notonly ADP but also the revenue budget in full. In addition it is essential for the GOB to have a medium-term macroeconomic framework to be able to assess how alternative expenditure, revenue, deficit andpublic debt policies will impact o01 overall macroeconomic balances and vice versa. Moreover, a realisticmedium-term macroeconomic framework for fiscal policies can serve as an important instrumenit whicithe Governmenlt can use to discipline actors with disparate claims on the budget.
96. The problem of instilling aggregate fiscal discipline in Bangladesh can be mitigated by theeffective use of a medium-term macroeconomic framework in budget processes, and by establishingformal constraints on spending and borrowing, including a strong system for parliamentary

- 28 -
controls. Mechaniisms whicih could help to enforce better accountability and transparency and thusimpose political costs oni politicians and bureaucrats for violating the rules of fiscal discipline. Thesemechaniisms could include: reconciliationi between ex-ante and ex-post aggregate spending and deficits;sanctionis against overspending, publication and dissemination of the results to the public; and integrationof all expenditures and finanicing componenits withini the budget, including off-budget outlays such asstate enterprises borrowing from private banks.
Revenue and Development Budget Dichotomv
97. The division of public expenditure into two budgets, the revenue and the development budget,raises several generic PEM issues impacting on1 the quality, efficiency and cost-effectiveness -- and theirassociated accountability and transparency mechaniisins in outlays and outputs. Revenue expenditure anddevelopmenit expenditure are prepared respectively by the Finance Division and Planning Commission.Withinl a ministry also the responsibility is divided: the general administrative section prepares therevenue budget and Planning Cells prepares the development budget. This division exists within thetechnical agencies also. Moreover, the revenue and the development budget do not use the sameaccounting framework which makes it difficult to aggregate the allocations of the two budgets by sectorsor agencies and examine the economic character of outlays. For instance, family welfare program has alarge component of wage paid from development project; salary for school teachers is paid from reyenuebudget. Both expenditures fall withini the same category in accounting and economic senses (wage andhuman resource development) but draw different judgments: the former is development while the latter iscurrenit expenditure. This dichotomy weakens proper assessment and monitoring of expenditures.
98. The revenue budget includes all recurrent outlays, though there is a small element of capitalexpenditure. Items included are: pay of officers and establishment (i.e. clerical grades and support staff),allowances, contingencies, works and grants-inl-aid. 0 & M appears as an item in case of someorganiizations but is still to be recognized as a distinct item. Allocation for 0 & M is done in an ad hiocmanner. There is a particular need for satisfactory mechanisms to establishing the linkages betweendevelopment projects and their implications for revenue budget, so that essential currentexpenditures can be anticipated and budgeted for.
TOWARDS A STRENGTHENED INTEGRATED FRAMEWORK
99. The weakness of the current PEM system points to need for reform in several specific areas. (i)measures to strengthen the capacity to assess and plan the aggregate resource envelope as mentionedabove; (ii) measures to develop a stronger and more integrated PEM framework; (iii) measures tostrengthenl the systems of accounting, audit, evaluation, dissemination and expenditure control; (iv)measures to strengthen institutions, management, technology and skills; (v) measures to improve themanagement of the ADP; and (vi) specific measures to improve the management of public enterprisesand financial institutions. (This chapter sums up key issues and recommendations; a presentation ofselected issues is given in the Appendix. The Inslitutional Framework: Selected Issues.)
Integrated PEM framework with program and multi-year budgetinig
100. An integrated program budgeting framework covering both the revenue and developmenit budgetsis much needed. The government ought to move towards a fully integrated program approach inplanning its activities and budget within a given time frame. Pending full implementation of aprogram budget system, it may develop a notional program approach: each department and ministry coulddefine its set of major programs and divide them into sub-programs to be finaniced from the revenule and

- 29 -
development budgets respectively. Secondly, in the departments as well as ministries bifurcation ofplanning developmenit projects and revenue supported activities should discontinue; the same set ofpersons should be giveni responsibility for planning total activities and expenditure programs whileimplemenltationi may be remain divided between planning cells and the general administrative staff. Also,bunciniig of expenditure towards the end of the year from both development and revenue budgets shouldbe avoided by better programming of expenditures. This requires simplification of procedures as well asdecentralizationi of finanlcial and administrative powers.
101. A strong multi-year budgeting framework is needed for planning and control. This wouldimply multi-year budget procedures integrating all revenue and development expenditure. Correspondingwith acceptance of projects, each techinical agency and ministry should include in its budget forecast moreprecise estimate of incremental revenue expenditure and hiow the additional resource will be generated ormade available -- ulilike the rather cursory mention now in practice. The budget forecast should berevised every year correspondilig with projects completed and the new projects accepted. Second, whilethe Parliament should approve the budget for one fiscal year, as is the practice now, the Governmentshould place every year a forecast for the next period, say, three years corresponding with TYRIP. Eachyear while subimiittilig the estimates to the Parliament, the Government will indicate the deviations fromthe forecast and update the forecast for the next period showinlg estimates for each year separately.
Improving the accountillg system
102. Systems for accountinlg, audit, evaluation, dissemination and control of outlays suffers from basicweakness in coverage and quality. Concerted efforts are needed to improve systems for accountingand audit to enable better monitoring and assessing of budgetary progress resulting in improvedaccountability and transparency.
103. Deficiencies in the systems for fiscal and national accounts needs to be tackled as soon aspossible. Concerted efforts are needed to improve the systems for collection and monitoring of fiscalaccouLIts includinig public expenditure, tax and non-tax revenue and estimates of deficits and public debtand the finanices of SOEs. Significanit improvements in accounting systems is a fundamentalpreconditioni in order to improve budgetary planning processes and the standards of audit and evaluationof expenditure programs. Introduction of automated systems for collection and monitoring of fiscalindicators can fiee staff from manual data work and result in significant improvements in terms of thetimeliness and quality of fiscal indicators. A common system of economic and functional classification ofpublic expenditures primarily based on IMF's GFS-based accounting system should be adopted as earlyas possible thiereby making it possible to establish a consistenit integrated budgetary framework coveringboth the development and revenue budget. 0 & M should be recognized as a distinct category ofexpenditure. The Goverminent should establish a clear principle to ensure adequate allocation for 0 & Mand define a methodology for estimating amounts needed for 0 & M. The GFS-based system needs to besupplemilenited with a consistenit SNA-based national account system for monitoring and analysis of themacroeconiomic context of fiscal policies.
Improvinig the systems for audit and evaluationi
104. The system of audit and evaluation of expenditure suffers from major weakness both in terms ofthe revenue budget and ADP. No explicit objective criteria based oni economic rationale is applied toexpenditure from revenue budget. Over the years, however, certain conventionis or rules of thumb haveemerged whicih guide preparation of the revenue budget in Bangladesh. First, a small revenue budget andlarge developmenit budget have been considered good, regardless of inadequacy of certain categories of

- 30 -
expenditLire fiom revenue budget and the quality of projects included in development programs. Second,new services, expansioni of existing services, virtually all capital expenditures regardless of the purposeand size are inclUded in development budget. Third, revenue budget includes only the repetitive andmostly obligatory types of expenditure, e.g. wage, office contingency, pension and retirement benefits.Fourthi, decisions in revenue budget are based on the incremental principle applicable to obligatoryexpenditures mainily. Fifth, the budget specifies the cost of input; the output or benefit from the outlay isnever specified.
105. The system of evaluatinig expenditure is weak. For example, there is no consistent use ofobjective criteria based on economic rationale for determining prioritization of expenditure allocationsbetween and withinl sectors and among projects. Moreover, in the present budget systems the expenditure(input) considerationi is the major principle for guiding, managing and evaluating expenditures, whilethere is hardly any capacity to evaluate the policy objective (outcomes) and the specific services (outputs)that agencies or projects can deliver. Efforts to shift towards a more outcome and output oriented PEMsystem in the long rull could offer several advantages such as improved accountability, more concretepolicy deliberationis and better scope for evaluating whether specific outputs or services should beprovided by private or public institutionis.
106. The system of auditing of revenue expenditure has traditionally been of the regularity type. Thishias implied that it cannot be used properly to examine efficiency, economy and effectiveness ofexpenditure because these are not specified in budget nor is the audit organization explicitly mandatedand equipped to carry out comprehensive audit. The Public Accounts Committee and the Parliament, theinain institutionis for accountability, also have been relatively ineffective in enforcing standards ofresponisibility and efficiency in public spending.
107. Tlle need for improvements in audit standards requires concerted efforts to strengthen bothintenial and audit funictionis. Also, it is essential that GOB's decision to separate audit and accountiigfuLictionis is fully implemenited as early as possible. The system of audit or evaluation and outlays andoutcomes may be furthier improved by considering specific measures such as: (i) a move towards more ofperformalnce oriented (value-for-money) audit methods; (ii) a gradual introduction of a program budgetiigsystem whIicIh would indicate not only expenditure but also output or benefit to be generated from thatexpenditure; and (iii) a gradual adoption of resource accounting method, beginning with the quasi-enterprises and noni-coinmercial autonomous bodies. For the development program, it may be worthwhileto make a statemenit specifying the standard criteria including the minimum benefit-cost ratio foracceptance of projects, average benefit-cost ratio for various sectors, projects which fall below the criteriabut were still accepted, along with the reasons for departures from standard criteria, and projects inrespect of which the criteria were suspended. Moreover, budget policies need to be placed in medium-term program perspectives: each budget statement should make projections for the future and compareactual outcome withi the projections. Consistency between policies and expenditures and achievements ofgoals (self- and pre-determined) should be an indicator of efficiency and performance.
Imiproved expenditure control and dissemination mechanisms
108. One important componenit of improved expenditure control would be to strive for betterdisseminiationi and public participation in PEM processes. A specific measure would be to enhance ther ole of the parliament. The goverinment may place before the parliament a budget statement setting outeconomic and budgetary data along with techinical analysis as distinguishied from Inere opinlioIn anidsubjectiveU udgments.

- 31 -
Strengthening Institutions. Management. Techiiology and Skills
109. Strengthening of institutions, personnel management, incentives, technology and skills ismuch needed throughout. For example, the Finance Division needs to develop a stronger capacity inestimating and monitoring key fiscal indicators. Further efforts are needed for effective operation of keyaspects of the PEM in addition to ODA, ADB and UNDP techniical assistance efforts to improvebudgeting, plainiiiig and accountinig practices. This includes improving the ability of the Finanice Divisionto evaluate demands and proposals from other Ministries. Also, the Development Wing of the FinanceDivision needs to be strengthienled for it to perforn its task of releasing funds for the ADP. The capacityand quality of skills in the Autonomous Bodies Wing needs to be improved if it is to become moreeffective in providing information on the performance and current financial position of state-owedenterprises. The up-dating of the debt registers of the state enterprises accomplished under the PRMACmust now be made fully functionial so that the Finance Division could effectively monitor the repaymentof external debt service obligations by state enterprises on a regular basis. Other needs for improved PEMwould include reforms not only among the various Ministries/Divisions but also the ProgrammingDivision of the Planning Commission, the Programming Committee responsible for reviewing ADPproposals and the role of the TYRIP. Issues involved include: better integration of recurrent and capitalbudgets and institutionlalizing the effective application of project selection criteria.
110. The funictionis and staffing requirements of the Planninig Commission versus the Finance Divisionand Sectoral Ministries needs to be re-examined. Establishing a stronger and more integrated multi-yearbudgetary framework including both the ADP and the revenue budget implies a urgent need to strengtienthe Finance Division; one specific need being to establish a permanent unit for resource estimation in theFinance Division. There is also an apparent need to strengthen the governments cash management ashiandled by the Ways & Means Sectioii in the Ministry of Finance to rationalize and improve the weaksystem of public debt management; and to strengthen tax administration. Moreover, the sectoralminiistries capacity to plan and control sectoral programs and projects needs to be strengthiened.
IIl. The GOB may consider to re-constitute the Planning Commission and re-formulate its duties sothat its primary function becomes that of a thinik tank for development problems and policies and relatedissues of strategic prioritization between and within sectors and among projects. This may imply transfersof some of the Planning Commission's expertise to the Finance Division and the sectoral Ministrieswhicih at present suffer from serious deficiencies in their capacity to carry out budgetary monitorinig,policy analysis and planning. A greater role for the planing cells in the sectoral Ministries implies a needto strengtlhen their capacity to provide inputs for the ADP and to carry out expanded project analysisactivities.
112. In addition to structural and procedural complexities, such as time-consuminig and multi-layereddecision processes, there are also major general deficiencies in personnel managemenit, skills levels anduse of modern computer aided techniques hindering the PEM system to function effectively. In short, theinstitutionial framework, includinig personnel management and training needs be rationalized andstrengthened along with the efforts to build an integrated budgeting framework with effective deliverymeclhanisms. There is critical shortage of certain skills and the personnel system does not seem toaddress adequately the need for professionalisimi required for effective PEM. This implies an urgent needfor specific training programs and manpower development.

- 32 -
Improving the Managemenit of the ADP
113. At present the process of preparation, approval and implementation of development projectssuffer from deficiencies in methodology and technical expertise. Also, most projects experience costover-runs and require extensive revision. The responsibility for scrutiny and appraisal of projects isdiffused among several agenicies suclh as IMED, Sector Divisions of the Planning Commission, ECNEC,and Departmental Project Evaluationi Committee (DPEC). Technical criteria for appraisal of projects arenot applied with much rigor except for aided projects. The responsibility and power to implement projectstoo are diffuse: contracts are approved at different levels of the administrative hierarchy, the highiest beingthe ministerial committee on purchases and procurement for the largest amounts; fund release orexpenditure is subject to control of administrative ministries, the Planning Commission and FinanceDivisioni under a variety of circumstances. These controls are not in the interest of expeditious executionof projects nor do they effectively eliminate misjudgmenit or corruption for which they are installed. Moreeffective audit and appropriate sanctionis against mala fide abuse of power can address most of theseconcerins. The Governmenit may consider implementationi of projects in a 'managerial context': the projectagenicy is given the responsibility and power to implement a project subject to well establishedaccountability procedures and sanctionls and incen1tives.
1 14. The mandate of the Planninig Commission should be examined and professional needs shotild beredefined as per chaniges in funictionis. The Programming Division of the Planninig Commissioni has to begivenl appropriate support in its task of formulating strategy priorities for major sectors, preparinggLuidelines for inclusioni of projects in the ADP and up-dating the TYRIP on a timely and regular basis.The guidelines adopted by the Programming Committee, which is responsible for the reviewing of themerits of proposals for ADP funding, need to be improved, making them as transparent as possible andinstitutionializinig their effective application. While TYRIP has contributed to improved investmentprogramming, their operational usefulnless has been somewhat limited as they are not firmly linked withthe ADP.
I1 5. The Government may consider to gradually transfer responsibilities for project preparation andapproval and project approval up to certain limits (subject to some central oversight) to the line ministries.A greater role for the planninig cells in sectoral Ministries implies a need for strengtheninig their capacityso that the will be able to provide timely inputs for investment programming and to carry out expandedproject analysis activities.
1 16. IMED is officially mandated to carry out monitoring and evaluation of projects but the capacity tocarry out its functionis have been limited. The mandate of IMED needs be reviewed in order to determinewhethier it sh1ould continue to emphasize monitorinig or shiift its attention more to evaluatiomi. TheGovernmenit may consider benefits of enihanicing IMED's capacity to monitor the implementationi projectsconcenitratinig on a few large projects of nationial importance.


- 33 -
APPENDIXIPage I of 6
ISSUES IN THE RECURRENT BUDGET
I. The recurrent budget has in recent years averaged 50% of total budgetary expenditures, and alsoexpanded rapidly, by more thani nominal GDP growth. Selected here for review are: a) the largestcomponenit of the recurrent budget -- wages and salaries (38%), and b) the food account, which has notbeen scrutinized for some time.
Wages and Salaries
2. Trends in the Level of Government Manpower. Total manpower in the ministries,departments and autonomous/semi-autonomous bodies--but excluding employees working under theADP, nationialized financial sector, defense and temporary employees, based on "approved" positions, iscurrently esiimated at 1.04 million --- of which 8 thousand are in various ministries, 745 thousand ingovernmelt departments, and 289 thousanid in autonomous and semi-autonomous bodies. However, theactual manpower is less, in FY92 estimated at about 658 thousand. Overmanning clearly exists inmany GOB institutions, particularly in Class III and IV, where the skill mismatch is also greater.At the same time, understaffing handicaps selected activities such as the judicial system and incometax. Educationi is the single largest employer, accounting for 28% of total employment, with primaryteachers accounting for the bulk of employment. Wlhile more primary teachers will be needed in thefuture, there is the policy question of whether it would not be desirable for the expansion to come frommore privately managed primary schools.
3. Rationalization of Manpower Skill-Mix. The current structure of Government staffingneeds to be rationalized to help contain current expenditures, and to meet the changing skillrequirements to match the new and streamlined government functions, in line with the changing role ofthe State, and the need for a more efficient, streamlined and cost effective public service delivery system.In many cases, this would require, among other measures, a reduction of redundant manpower throughiVSS or retrenchmenit, and the recruitment of personiel with required skills. It would mean a selective orgeneral downsizing of the manpower of many agencies. In some cases, merger of ministries/divisions ordepartments is warranted, following whicih separation of redundant manpower would be necessary. Also,there are agencies whose continuation is no longer justified and would therefore need to be abolished.And such rationalizationi would have to be reinforced by systemic, procedural and technological/logisticimprovements within the context of a broader public administration reform. These are not referred to inthe PER, since these are spelled out in some detail in the Bank's public administration reform study.
4. Addressing the Need for Adequacy of Compensation The wage bill has increased appreciably-- 14% annually in nominal terms -- since FY90. In addition, its share il the revenue budget has grownfrom 3 1 % in FY90 to 42% in FY96. There are also indications that non-wage inputs in the recurrentbudget are inadequate in a number of areas, notably operations and maintenance. Hence the expansioni ofthe wage bill should be controlled so that vital noni-wage inputs which are necessary for maintainigpublic assets and the provision of public services are not unduly squeezed. As a ratio of GDP, too, thewage bill has been increasing noticeably. However, there are indications that the "absolute" levels ofcompensation have been generally inadequate to meet the needs of the employees, which is likely tohave affected their morale and motivation. Given the higih share of compensation cost in the budget, theover-manainiig and skill-mismatch in many goverinmenit institutions,

- 34-
APPENDIX 1Page 2 of 6
and the chaniginig role of the State, this issue can be addressed only in the context of a broader and basicreforn of the public administrationi, whicil could lead to a leaner but more efficient government. Withsuch a restructuring and downsizing of manpower, and consequenit productivity gains, a higher level ofcompenisationi could be warranted and sustainable. Also in line with the avowed policy of a more focusedState intervenitioni in areas where governmenit involvemenit is warranted, many activities could beprivatized. Such rationalizationi would lead greater cost effectiveness and while ensurinig better quality ofservice delivery. An example of such an activity is "stationery and printing (Head 131"), where thegoveriniimelit has an establishmeit, but the scope for greater cost effectiveness through privatization isconsiderable. Government recently decided to set up a Pay Commission to review the compensationistructure of government employees and propose a new pay structure. What may be more appropriate,however is a Pay and Public Service Commission, which will have a broad mandate to review theefficiency, equity and incenitive structure of compensationi in the context of an assessment of theappropriate size, structure and skill-mix of the public service, and its evolving role, and a budgetarilysustainable wage bill.
5. Addressing Compression of Compensation Structure. While average compensation forgoverinmenit employees has risen in real terms since FY90, there has been significant compression of' cash" compenisationi between the lower and higiler grades, with adverse implications for incenitives andmotivation for highier skill categories. Anothier feature is that basic pay accounts for a small percentageof total compenisationi, with noni-pay benefits accountinig for 43% of total compensation.
6. The compression in the "cash" compensation structure needs to be reduced as much as possible,so that wage differentials reflect the differentials in skills and qualifications required for various jobs.While the political economy of such a reform is perceived to be difficult in Bangladesh, as elsewhere inthe sub-conitinenit, this is nonetheless necessary for the credibility, efficiency and equity of thecompenisationi system. Improvements in the efficiency, accountability and quality of the public servicescannot be considered without addressing this basic issue.
7. Monetization of In-Kind Benefits. All in-kinid benefits should be monetized as much aspossible over a period of tine. This is vital for budgetary efficiency and cost effectiveness, as well as foroptimizilig the benefits to employees. For some types of in-kind benefits, it might even be possible toenihanice benefits to employees while achieving a budgetary saving. This will also help to reduce thecompression in cash compensation with no additional budgetary cost. In addition, in the case of certainbenefits such as government housinig whicih are provided to a small proportion of employees,monetizationi of housing is justified on grounds of equity, for ensuring equal compensation for the samework. Governmeit housinig should be provided only selectively, based on special criteria, sucih ashousing for distant or local level positions where alternative housinig facilities are not easily available orfor vital functionlaries or essential services.
8. Consolidation of Compensation. Consolidation of basic salary and the various allowancesshould be adopted. The existing system of compensation whicil includes many allowances paid inaddition to basic pay, is a sub-continienital heritage, whose continiuationi seems unnecessary.Consolidationl of pay is expected to lead to efficiency gains in terms of ease of benefits administration.and miniimizinig the paperwork involved, and will also contribute to greater transparenicy. While pensionisare currently linked to basic pay, consolidationi of pay, if adopted, would merely mean that pensioni wouldhave to be fixed at a lower percentage of total compensation.

- 35-
APPENDIX 1Page 3 of 6
The Food Account
9. Recent Trends in PFDS Operations. The level of public foodgraii distribution has declinedsince the early nineties, with a chanige in its composition in favor of targeted distribution (Table I ).Monetized distributioni declined appreciably from FY93 onwards, following the abolition and phasing outof some sales chaninels. Targeted distribution, on the other hand, has increased somewhat in recent years,largely due to the introduction of the food-for-education (FFE) program in FY94 and its subsequentexpansion as well as expansioni of some GOB-supported non-monetized channels (GR, TR, canal digging,cluster village, etc). The volume of foodgrains distributed under the main safety net programs, the VGDand FFW, have hiowever been lower than in the early nineties.
Table 1: PFDS Operations (Million M.T)F-9 2 fY9 Y - ,-, F-::
Opening Stock 0.96 1.15 1.04 1.22 1.07 0.54 0.77
I,nporls 1.53 1.58 1.56 0.83 0.65 1.56 1.82Aid 0.95 1.54 1.41 0.74 0.65 0.94 0.83Commercial 0.58 0.04 0.15 0.09 0.00 0.62 0.98Procurement 0.96 0.78 1.04 0.23 0.17 0.28 0.20Availability 3.45 3.51 3.64 2.28 1.89 2.38 2.79
Distribution 2.17 2.37 2.35 1.07 1.38 1.57 1.90Monetized 1.37 1.57 1.42 0.46 0.53 0.51 0.76Targeted 0.79 0.80 0.93 0.62 0.85 1.07 1.14
Losses 0.09 0.10 0.07 0.08 0.02 0.03 0.04
Source: Food Ministry!WFP
10. While aid-financed foodgrain imports have been declininig, total imports have increased onaccount of sizable commercial imports by GOB in FY95 and FY96 (Table I). GOB imports have beenused to support higher levels of relief distribution and market sales, and some stock build-up, followingsuccessive crop shortfalls. The declining trend in food aid reflects an apparent crunch in globalavailability of food aid but also a response to some progress in domestic foodgrain production,notwithstanidinig the recent crop shortfalls. Domestic procurement has been declining from the high levelsof the early nineties but there has been a revival recently, with sizable procurement of the boro crop.
II. Budgetary Implications of PFDS Operations. The earmarking of counterpart funds as salesproceeds from food aid in the food budget seems to suggest that the PFDS should be a source ofbudgetary savings to finance the ADP or at least that these operations should be self-financing. Inpractice, however, PFDS operations have been a major drain on the budget, contributing significantly tothe domestic deficit financing requirements. This is not readily apparent from the food account which ispresented in a complicated manner in GOB's budget, which makes its true budgetary implicationsdifficult to evaluate. The problems and inefficiencies underlying a large deficit have been reviewed butmany of the required improvements have not been implemented. Under the present
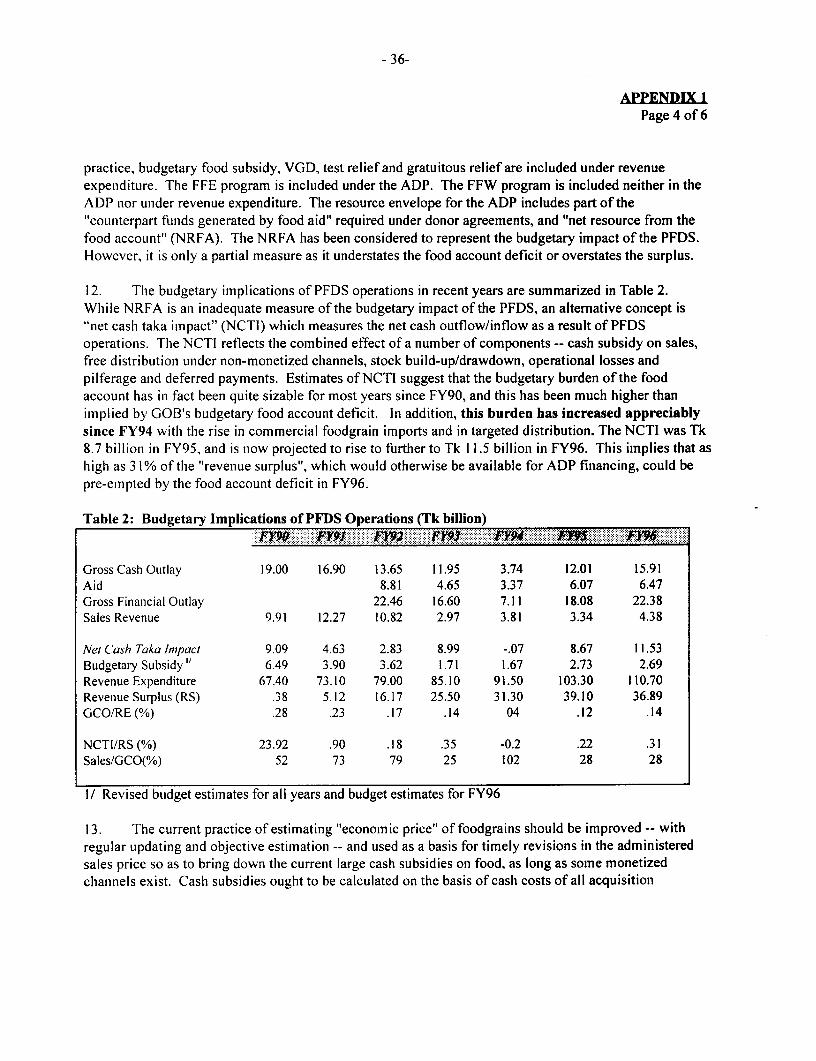
- 36-
APPENDIXLPage 4 of 6
practice, budgetary food subsidy, VGD, test relief and gratuitous relief are included under revenueexpenditure. The FFE program is included under the ADP. The FFW program is included neither in theADP nor ulider revenue expenditure. The resource envelope for the ADP includes part of the"couliterpart funids generated by food aid" required under donor agreements, and "net resource from thefood account" (NRFA). The NRFA has been considered to represent the budgetary impact of the PFDS.However, it is only a partial measure as it understates the food account deficit or overstates the surplus.
12. The budgetary implications of PFDS operations in recent years are summarized in Table 2.While NRFA is an inadequate measure of the budgetary impact of the PFDS, an alternative concept is'net cash taka impact" (NCTI) which measures the net cash outflow/inflow as a result of PFDSoperations. The NCTI reflects the combined effect of a number of components -- cash subsidy on sales,free distributioll under non-monetized channels, stock build-up/drawdown, operational losses andpilferage and deferred payments. Estimates of NCTI suggest that the budgetary burden of the foodaccount has in fact been quite sizable for most years since FY90, and this has been much higher thanimplied by GOB's budgetary food account deficit. In addition, this burden has increased appreciablysince FY94 with the rise in commercial foodgrain imports and in targeted distribution. The NCTI was Tk8.7 billion in FY95, and is ilow projected to rise to further to Tk 11.5 billion in FY96. This implies that ashighi as 31% of the "revenue surplus", which would otherwise be available for ADP financing, could bepre-empted by the food account deficit in FY96.
Table 2: Budgetary Implications of PFDS Operations (Tk billion)
Gross Cash Outlay 19.00 16.90 13.65 11.95 3.74 12.01 15.91Aid 8.81 4.65 3.37 6.07 6.47Gross Financial Outlay 22.46 16.60 7.11 18.08 22.38Sales Revenue 9.91 12.27 10.82 2.97 3.81 3.34 4.38
Net Cash Taka Inpact 9.09 4.63 2.83 8.99 -.07 8.67 11.53Budgetary Subsidy 6.49 3.90 3.62 1.71 1.67 2.73 2.69Revenue Expenditure 67.40 73.10 79.00 85.10 91.50 103.30 110.70Revenue Surplus (RS) .38 5.12 16.17 25.50 31.30 39.10 36.89GCO/RE (%) .28 .23 .17 .14 04 .12 .14
NCTI/RS (%) 23.92 .90 .18 .35 -0.2 .22 .31Sales/GCO(%) 52 73 79 25 102 28 28
l/ Revised budget estimates for all years and budget estimates for FY96
13. The current practice of estimating "economic price" of foodgrains should be improved -- withregular updating and objective estimation -- and used as a basis for timely revisions in the administeredsales price so as to bring down the current large cash subsidies on food, as long as some monetizedchaniniels exist. Cash subsidies ought to be calculated on the basis of cash costs of all acquisition

- 37-
APPENDIX-1Page 5 of 6
involvinig budgetary resources--domestic procurement and commercial purchase -- and cash receipts fromsales. Given the large cash subsidies in FY95 and levels projected for FY96, the administered off takeprice for the monetized channels should be revised soon, particularly in view of the recent increases ininterilationial foodgrain prices, in order to contain these subsidies.
Rationalization of PFDS Distribution
14. Phasing out of Monetized Distribution. In line with the appropriate role of the government andthe need for relying on the private sector for foodgrain trading and marketing, both domestic and external,a policy should be adopted for phasing away the monetized channels of the PFDS, and involving thegovernment only for targeted distribution. OMS of wheat/rice, sales of wheat to flour mills/chakkis orsales of flour. and foodgrain sales to large employers may be phased out since the private sector couldcarry out this marketing function. In line with the new policy, the Government flour and feed mill oughtto be privatized since public sector involvement in such business activities is hardly justified. Theresponisibility for procuring the food requirements of the essential priority groups (together with theassociated budgetary accountinig) could be transferred from the Food Ministry to the relevantMin istry/agencies.
15. Monetization of Food Aid. As long as Bangladesh receives food aid which is required to bemonietized as part of the donor agreement, such as the Canadian food aid which is monetized to financethe RMP it would seem desirable to sell such food through market-oriented methods, such as auctioning,to private dealers rather than at administered prices. It would be prudent and economical to conduct suchsales arouLid the port area, leaving it up to the private dealers rather than at administered/subsidizedprices.
16. Maximizing poverty and development impact of Non-Monetized Distribution. A carefulassessmenit should be made to evaluate the poverty and development impact and rationale/efficiency of allnoni-monietized programs/channels whiich are competing for the limited food resources. Based on thisassessmenit, the food allocations to the various channels need to be prioritized in order to maximize theirpoverty and development impact.
17. Based on evaluations carried out so far, primarily by the IFPRI, it would seem desirable toexpand the coverage of the VGD and cash wage based RMP-type programs considerably in order totarget the most vulnerable sections of the rural poor. As long as food aid is tied to FFW-type programs,ani effort should continiue to diversify the coverage of the FFW program across sub-sectors and forinilovative projects with high development and poverty impact but reasonable transfer cost, in line withtie SIFAD guidelinies. But given the somewhat higher transfer cost of any commodity-based programlike the FFW program, it would also be desirable to switch to more easily supervised but "worthwhile"activities whicih reduce the associated leakages and transfer costs and enhances their net benefits. Relatedto the earlier recommendation about disposal of "monetizable" food aid, as long as such food aid isavailable. their sales proceeds could be used for cash income-based programs which are the most efficientin terms of their transfer cost.

- 38-
APPENDIX IPage 6 of 6
18. The new Food for Education (FFE) program accounts for some 20% of food distributioin undernoni-monietized channels. The FFE program needs to be judged in the context of the constraintsplaced on other safety net programs such as VGD and FFW which are considered more efficient asincome transfer mechanisms. Another important factor is the declining trend in food aid, with prospectsfor Title IlI support for the program looking uncertaini. Besides, the FFE program accounts for 35% ofthe ADP resources allocated for primary education, while its coverage of children is only 5%. The issueis whether there are not more efficient and cost effective ways of using these resources forpromoting enrollment and attendance, while improving the quality of primary education. An earlyassessment of the FFE program by IFPRI found that there was a noticeable improvement in enrollment,school attendance and in prevention of drop-outs in FY94 in the schools covered by the FFE program,whichl was reportedly found to be greater than the decline in these indicators in the non-FFE schools.However, there are still questions about how significant the "net" improvement was in FY94, and to whatextent these have been sustained since FY94.
19. GOB supports sizable food distribution under a number of channels--gratuitous relief, test relief,canial digging, cluster village, as well as distribution under the Prime Minister's commitment -- whichaccount for 21% of non-monetized distribution. The poverty and development impact and the relativepriority of these programs need to be assessed in the context of the competing claims from other targetedprograms oni available resources.

- 39-
APPENDIX 2Page I of 4
Sample of ADP Projects with Questionable Merit or Rationale/Priority forPublic Sector Investment'
Name of Proiect Project Cost. Status of Approval Commentsl and Executing Agency l
Agriculture and Water Resources1. Seed Development Project Taka 2175 million, unapproved, The private sector already
BADC accounts for a very large share ofthe market and could contributeto greater production of improvedseeds with proper policies
2. Production of Fine Rice in Taka 17 million, PP approved, This is a business activity whichBarind Area Barind Multipurpose should be left to the private sector
Development Project3. BMRE of Flour and Animal Taka 388 million, unpproved, This is a business activity whichFeed Mill at Postogola Food Directorate should be left to the private
sector.4. Construction of New Food Taka 1 10 million, unapproved This should be reexamined inGodowns in Strategic Locations Food Directorate view of the large excess publicfor Strenghening Food Security storage capacity and declining
GOB role in foodgrainoperations. The private sectorshould invest if there is a capacitygap.
5. Construction of Concrete Silo Taka 1053 million, unapproved, Same as abovewith Ancillary Facilities at Food DirectorateMongla Port6. Establishment of Goat Rearing Taka 94 million, revised This is a business activity whichUnit in each Division unapproved, Livestock should be left to the private sector
Directorate7. Modernization and Conversion Taka 100 million, approved, Same as aboveof Dairy Farms in Sylhet, Livestock DirectorateRajshahi and Faridpur intoBreeding Farms8. Teesta Barrage Project Taka 9850 million, revised In view of the potential for minor
unapproved, BWDB irrigation based on ground waterin the command area, the projectshould be discontinued so that noadditional expenditures can beincurred.
lIdustry
9. Shahjalal Fertilizer Company Taka 10627 million, approved, In line with GOB's policy ofLimited BCIC privatization, the public sector
should not undertake newinvestment in manufacturing. Ifthere is a need for greatercapacity, the investment could beundertaken by the private sector
Most of the projects in this list were included in the FY96 ADP and have been carried over to the FY97 ADP.

- 40 -
APPENDIX 2Page 2 of 4
10. BMRE of Chilatak Cement Taka 1433 million, unapproved, Much of the work has alreadyFactory BCIC been done, and additional
expenditure should be limited towhat is necessary to privatize thisenterprise.
I1. Pabna Sugar Mills (1500 Taka 844 million, approved, Same as aboveTCD) BSFIC12. Construction of a World Taka 4000 million., unapproved, This investment project wasTrade Centre Building in Dhaka Export Promotion Bureau included in the FY95-97 Three-
Year Rolling InvestmentProgram. The FY97 ADPincludes a feasibility study forthis project. If such aninvestment is actually justified, itcould be undertaken by theprivate sector, as in the case of asimilar project in Chittagong.
13. District Based Industrial Taka 911 million, revised Given that much of the capacityEstates unapproved, BSCIC created by BSCIC has remained
seriously underutilized, theprivate sector should beencouraged to build such estates.
14. Maizdi Industrial Estate Taka 49 million, unapproved, Same as aboveBSCIC
15. Establishment of New Taka 164 million, approved, Some of the work has alreadySpindles in 10 Mills under BTMC BTMC been done and
incremental.expenditures shouldbe minimized and theseenterprises privatized.
16. Benarashi Palli Taka 198 million, approved, The NGOs could provide theBangladesh Handloom Board necessary support.
17. BMRE of Gulfra Habib Jute Taka 38 million, unapproved, The enterprises should beMill BJMC privatized and the BMRE could
be undertaken by the new owners.18. High Voltage Cable and Taka 269 million, revised In line with its privatizationConductor Manufacturing Plant unapproved, BSEC policy the public sector should not
undertake new investment inmanufacturing.
Tourism19. Construction of an Taka 100 million, unapproved, This is a business activity whichInternational Three-Star Hotel at Civil Aviation authority of should be left to the private sectorZIA International Airport Bangladesh (CAAB)20. Hotel and Fast Food Taka 10 million, unapproved, Same as aboveRestaurant at Maijdee Bangladesh Parjatan Corporation2 1. Low Cost Hotel in Cox's Taka 22 million, unapproved, Same as aboveBazar Bangladesh Parjatan Corporation

- 41 -
APPENDIX 2Page 3 of 4
Power22. Power Distribution Project Taka 2130 million, unapproved, The project should be reappraised(East Zone) BPDB carefully.23. Power Distribution (West Taka 2842 million, unapproved, Same as above.Zone) BPDB24. 210 MW Khulna Thermal Taka 6550 million, unapproved, The investment should be openedPower Plant BPDB to private independent power
producers (IPPs).Tranisport25. Flyovers at Mahakhali, Taka 1878 million, PCP approved, A decision on this project shouldMaghbazar and Jatrabari- Roads and Highways Department be deferred and taken in theSayedabad context of a comprehensive
assessment, possibly with IDAassistance
26. Rehabilitation of Selected Taka 457 million, approved, These vessels should beBIWTC Vessels BIWTC privatized, leaving the
rehabilitation to new owners27. Modification of 3 Passenger Taka 127 million, approved, Same as aboveVessels of BIWTC BIWTC28. Procurement of 2 New Taka 659 million, unapproved, This project should be droppedPassenger Vessels for BIWTC since the public sector should notChittagong-Barisal Route be involved in this business
activity29. Procurement of 3 Passenger Taka 217 million, unapproved, Same as aboveVessels BIWTC30. Housing Complex for Taka 100 million, unapproved, Provision of public housing inEmployees of Bangladesh Bangladesh Railways this case is neither cost effectiveRailways nor justified on equity grounds
Pllysical Planning, Housing andWeter Supply31. Construction of 1000 Taka 843 million, PCP approved, Provision of public housing inResidential Flats for Government Public Works Department this case is neither cost effectiveEmployees in Dhaka City inor justified on equity grounds32. Construction of 2000 Taka 1517 million, PCP approved, Same as aboveResidential Flats for Government Public Works DepartmentEmployees in Dhaka City33. Construction of 100 Flats Taka 200 million, unapproved, Same as above(1 800 sq. feet) for Government Public Works DepartmentEm-ployees in Dhaka City34. Construction of Residential Taka 50 million, approved, Same as aboveQuarters at Banani for PetrobanglaEmployees of Petrobangla35. Expansion of TCB Head Taka 76 million, unapproved, Given that the public sectorOffice Building in Dhaka TCB should not be involved in trading
activities, this expansion seemsunnecessary
36. Expansion of TCB Building Taka 6 million, unapproved, TCB Same as abovein Khulna

- 42 -
- A~~~~~~~~~~~PPENDIX 2Page 4 of 4
37. Construction of Chancery Taka 350 million, unapproved This project should beBuilding in Washington and reconsidered and other costDelhi effective options such as leasing
should be explored.Education38.. Food for Education Taka 3600 million, unapproved, It is not at all clear that this is the
Directorate of Primary Education most efficient means of promotingenrolment and quality of primaryeducation.
39. Renovation and Development Taka 2895 million, revised The concern is that publicof Selected Registered Non- unapproved, Directorate of assistance may be substituting forGovernment Secondary High Secondary and Higher Secondary community contribution thatSchools Education would otherwise be available, and
may not be linked to anyperformance criteria
40. Development of 350 Private Taka 1128 million, revised Same as aboveColleges unapproved41. Establishment of 13 New Taka 733 million, unapproved The effectiveness of VTI-basedVTls and Renovation and technical training should beDevelopment of I VTI evaluated vis-a-vis private
schemes before investing more.42. Establishment of English Taka 255 million, unapproved, The private sector is alreadyLanguage Training Institute Ministry of Education providing such services43. Establishment of a Home Taka 81 million, approved, This appears to be a low priorityEconomics College in Chittagong Directorate of Secondary and for public sector involvement and
Higher Secondary Education could be set up by the privatesector if demand exists
44. Establishmnent of Business Taka 296 m-nillion, unapproved, Same as aboveManagement Course at HSC Ministry of EducationLevel in Private Institutions45. Establishment of a Girls's Taka 368 million, unapproved, This appears to be an expensiveCadet Colege in Feni Bangladesh Army Headquarters proposition and also cannot be
justified on equity groundsHeallth_
46. Construction of 200 Bed Taka 287 million, unapproved The unit cost of such invesmentGeneral Hospital in Mirpur _ (per bed) is high and in addition
these services can be provided bythe private sector
47. Construction of Bangladesh- Taka 970 million, unapproved Same as aboveChina Friendship GeneralHospital (250 Bed)

- 43 -
APPENDIXIPage I of 5
PERFORMANCE OF SOEs AND THEIR CONTRIBUTION TO PUBLIC SECTOR DEFICITSIN BANGLADESH
I. Most state owned enterprises (SOE) in Bangladesh came into existence soon after independelicepartly by design, as the post-liberation Government implemented its socialist agenda, and partly bydefault, as the Government had to takeover many enterprises abandoned by their Pakistani owners. Atpresent, SOE presence is important in shipping, banking and insurance services and in variousmanufacturing activities such as textiles, newsprint, power, cement, steel and fertilizer.
Performance of SOEs'
2. SOEs continue to use a significant amount of the economy's scarce resources, butfail togenerate commensurate returns.
* SOE gross investment in operating fixed assets averaged 2.4 percent of GDP in FY95.
* SOEs now employ some 261,000 persons.
* SOE contribution to GDP in FY95 was 2.9 percent, declining from 4 percent in FY94, and isexpected to be around 3 percent in FY96. The largest contribution to value added, as shownin Annex-B Table- I, comes from the manufacturing sector enterprises followed by electricity,gas and water sectors. However, SOEs are dominant in the electricity, gas and water sector .
* The financial return on total assets was a meager 1.9 percent in FY94, 0.8 percent in FY95and is expected to be only 1.3 percent in FY96.
3. The SOEs have been performing poorly with persistent losses and increasing burden on thebudget and the economy.
* Operating income of SOEs has been consistently low.
* The gross losses of SOEs in FY94 amounted to Tk. 9.7 billion, representing a little over IIpercent of that year's ADP, 9.4 percent of current spending and 32 percent of the educationbudget. This money could have alternatively been used to build nearly 3,500 new primaryschools or about 100 new health centers at the than a level. In FY95, the gross lossesamounted to Tk 8.5 billion.
* SOE deficits declined from FY91, but rose again from Tkl4 billion in FY94 to Tk22 billionin FY95, and are expected to reach Tk23 billion in FY96.
The SOEs covered in this analysis include the 210 non-financial public enterprises operated under the 39 autonomous sectorcorporations/authorities. It does not include Bangladesh Railways, Post Office and T&T. which are GovernmentDepartments financed directly through the central Government budget, the four NCBs, the two insurance companies and thesix DFIs.
Value added by SOEs in the electricity, gas and water sectors constituted about 55 percent of the total value added in thesesectors in FY94.

- 44 -
APPENDIX 3Page 2 of 5
* The net finanicing requiremenit of the nonl-finanicial SOEs3 in FY96 is expected to remainvery high at Tk 18.6 billion (constitutinig 1.5 percent of projected GDP).
* The total SOE debt are expected to be Tk 459 billion at the end of the current fiscal year,amounting to 37.9 percent of the projected GDP. Almost half of the total debt is short-term.
SOE Deficits on a Cash Basis
4. The deficits above are based on the interinationial practice of using accrual based accountingprocedures. An alternative estimate of deficits of SOEs could be done on a cashi basis. Severaladjustments hiave to be made to accrual-based accounts to estimate the finanicing need during a year oni acashi basis. Making these adjustments, the operating cash flow (OCF) and Total Financing Requiremenit(TFR) levels were computed for eleveni sector corporations, two Boards (WDB and REB) and sevenAutIlorities (BCAA, DESA, BEPZA Dliaka WASA, Chittagong WASA, Clhittagong Port Autilority andMongla Port Autilority), covering the period FY94-96, based on financial data provided in tileAutonomous Bodies Budget Volume publishied by tile Monitorinlg Cell of the Ministry of Finanice. These20 noni-finanicial entities togethier accounted for more thian 88 percent of the value added, 87 percent ofemploymenlt and 73 percent of fixed assets (at their book value) in the noni-finiancial public enterprisesector in FY944. The casih flow summary by SOEs (Table-2 in Annex-B) presents the TFRs and thesources of financinig.
5. C.'lash based analysis confirm that the level of SOE contribution to public sector deficit has beenery large. In FY94, excluding the jtite sector enterprises5, the combined overall deficit6 of the remaininig
19 amounted to Tk 17.5 billion (Table-2). The contribution of these SOEs to public sector borrowingrequirement was Tk 8.2 billion (or 0.8 percent of GDP). If thie jute sector enterprises are included, theSOE contributioll of 21 SOEs to PSBR rises to Tk 12.3 billion (1.2 percent of GDP) in FY94.
The accrual based net additional financing burden generated by the SOEs covered by the Monitoring Cell. T'here are others
such as the DFIs and the NCBs not included in our analysis here.
'FThe choice of these 20 SOEs were based mainly on availability of cash tlow data.
As part of the restructuring and reform program that was initiated in FY94. a sizable financial restructuring -- involvilig
about Tk 17.5 billion -- in the two large jute corporations took place. In August. 1993 BJC was liquidated and the NCBs
wrote off Tk 13.974 billion BJC's debt. This was shown in B.lC's FY94 Profit & Loss account as 'adjustment from previous
year'. NCBs themselves absorbed 30 percent of'this debt write-off as bad debt and charged the loss to their Profit & Loss
Account . GOB issued bonds to compensate the NCBs for the remaining 70 percent. In order to avoid the distorting impact
ol' this operation on the tinancial picturc of the SOE sector, these two corporations were cxcluded from FY94 calculation. At
the same time. because of its importance. the accrual based delicit ot' PDB was included in deriving this tigure.
Since the TFR includes changes in receivables and other current assets which consists of, among others. intercorporation
transactions. this simple summation could he over-estimating the deficit of the non-financial SOE scctor. The inter-
corporation financial transactions should cancel cach other in the process ot aggregation. In other words. changes in
receivabics between corporations must exactly otiset the changcs in payables between corporations. The Autonomous Bodies
13udget Volumes do not provide enough data on receivables and payables between corporations. As a result. the ol'fisctting
does not occur in the aggregation of the 'FR. Since changes in receivables are included in the ITFR calculition. while
changcs in payables are treated as a linancing item, the total TFR oi'the 21 SOEs is likely to be over or understated
depending on whether total receivables between these SOEs increascd (thus overstating total TFR) or decreased
(understating total TFR). This bias is likely to be important, particularly in figures incltiding PDB. The latter is liklely tohalve sizable receivables from the other 20) SOEs.

- 45 -
APPENDIX3Page 3 of 5
Table-1: Operating and Financial Position of Non-financial SOEs (Tk in billion)
Value Added 40.67 33.95 39.2(4.0) (2.9) (3.2)
Operating Revenues 143.5 158.4 173.8(14.0) (13.5) (14.3)
Operating Expenses 5/ 132.3 153.5 165.1(12.8) (13.1) (13.6)
Net Income Before Tax 4.42 -2.07 1.5(0.43) (-0.18) (0.12)
Net Income After Tax 6t -1.1 -4.1 -0.48(-0.1) (-0.4) (-0.04)
Gross Losses 7 9.7 8.4 5.3(0.9) (0.7) (0.4)
Financiail Rate of Return on Assets (in percent) 3 1.86 0.77 1.30
Gross Savings 8.8 7.8 11.9((0.9) (0.7) (1.0)
SOE Deficit "" . 14.0 22.2 23.1(1.4) (1.9) (1.9)
Net Long-Term Borrowing 1 1 4.9 1.13 5.2(0.5) (0.1) (0.4)
Equity Injection 12/ 9.1 12.5 10.2((0.9) (1.1) (0.8)
Net contribution of nonfinancial SOEs to PSBR I'' 3.6 18 18.6(0.4) (1.5) (1.5)
Investment 14/ 22.86 29.95 35.0(2.2) (2.6) (2.9)
Total Assets 603 634 670(58.5) (54.2) (55.3)
Long Term Debt 249 250 255(24.0) (21.4) (21.1)
Short Term Debt 156 180 204(15.1) (15.4) (16.8)
Equity 198 203 211(19.4) (17.4) (17.4)
Net 1Fixed Assets 255.6 250.8 248.5(24.8) (21.4) (20.5)
Perso:ir. (ud0 persons) 259.4 269.1 260.9Soi.r-: Pased on data obtainedfrom the Monitoring Cell, Finance Division.Note: F-igures in parenthesis are percentages of GDP at current market prices.I/ Provisional actuals; 2/ Revised budget estimates;/ Budget estimates: Equals employee compensation plusdepreciation plus operating surplus: Equals the sum of purchase of goods and services, employeecompensation. and depreciation: W Before dividends: 7 Sum of the losses of the loss making entities: operatingsurplus divided by total assets; 9/ Retained income plus depreciation: ' " Total investment in operating rixed andother long term assets minus gross saving; IIl ong term borrowing minus loan repayments: -2 Fresh capitalreceived from the central Government; I3/ Equals total tinancing needs minus taxes minus dividends:141 Investment in operating fixed and other long term assets.

- 46 -
APPENDIX 3Page 4 of 5
6. Short-ternm borrowing (including postponedpaymnents) has been a major source offinancing SOEdeficits. As show iiin Table-2, short-tern borrowing constitutes the largest source of financing in all of thethree years. Of the total financing needed, it accounted for 83 percent in FY94, 44 percent in FY95 and isexpected to account for 37 percent of the financing needed in the current fiscal yrar. Equity injectionishave also been significantly large while the net long- term borrowing have been relatively small.
Table-2: Cash Based Deficit & its financing by Non-financial SOEs (Taka in billion).- T',~~.'.,--.:- ," . ' ..... -.'."' ' . -. : .. . ........ .Ei0
Deficit 1 ]7.5* 15.4 22.9
Less: Taxes & Dividends 9.35 3.90 3.97Net Contributioni to public sector 8.15 11.5 18.93deficitFinanicinigNet Long Tern Borrowing 5' 4.61 0.25 4.61Short Term Borrowing 14.43 6.74 8.56Equity Inflow 3.06 5.06 6.48Others "' 1.09 0.24 0.16
Clhages in caslh (5.67) 3.13 3.07Excluding jute sector enterprises.
Provisional actuals; 2 Revised budget estimates3 3 Budget estimates; 4/ Total financinp requirementfrom outside sources. 5/ Equals new long term debt minus debt amortization payments; No clearexplanation about the components of this category of financing could be obtained. It is possible thatpostponements of due payments -- i.e. debt servicing, taxes, social security contributions. accounts payable--are lumped here. Also note that the accounts of PDB are included in this table on an accrual basis.
Parenthesis indicates increase in cash and bank balance.
7. It appears that postponement of loan repayments is a major item in "short-term borrowing". Thisis evident from the fact that total increase in debt service liability of all the non-finanicial SOEs in FY95was Tk 32.9 billion (2.8 percent of GDP). Of this only Tk 9 billion was actually paid. The rest were addedto arrears and are most likely lumped under short term borrowing. Another major item appears to bepostponement of income tax payments.

- 47 -
APPENDIX,3Page 5 of 5
ANNEX-B
Table-1: The Sectoral Composition of Value Added by SOEs(Percentage of total value added by SOEs)
Sectors FY94 FY95 L FY96 3'
29.5 39.4 38.2ManufacturingElectricity, gas and water 27;8 31.4 36.3Transport and communication 11.4 13.2 12.2Service 6.2 6.4 6.15Others* 25.1 9.6 7.15
Source. Based on data provided by the Monitoring Cell, Finance Division.* Include construction, agriculture and fisheries and commercial sectors." Provisional actuals;2/ Revised budget estimates
Budget estimates.


- 48 -
APPENDIX 4Page I of 5
PUBLIC EXPENDITURE IMPACT ON RURAL INCOME AND POVERTY
I. Public expenditure can influence poverty indirectly through promoting more rapid economic growth.It can also influence directly via social sector allocations (education, health) having bearing on the poor'searning capability, or in mitigating the severity of poverty via social safety net schemes. An analysis we hlavedone of the effect of rural public expenditure within a partial equilibrium framework indicate the followingbroad conclusions . The results are not surprising but their implications are worth re-emphasizing.
2. First, public expenditures can positively impact on rural poor's income, and hence, poverty, throughfostering economic growth. According to the 1989/90 BIDS household survey, the proportion of ruralpopulation in Bangladesh living in poverty is estimated at 56 percent in villages without electricity, comparedto 45 percent in villages with access to it. Data for villages without and with good transport show a similarpattern. Not all of these differences are, however, attributable to the independent effect of the presence ofinfrastructure. There may be considerable differences among households located in two groups of villages interms of initial resource endowment at the household level as well as other unobserved village levelcharacteristics. Controlling for the variation in initial resource endowment of the household (such as land,non-land capital, and labor) and after making some allowance for the potential factors that affect productivityas well as the choice of economic activities, one can still discern a significant positive income effect of publicspending on infrastructures such as all weather roads and electrification. The results of a multivariableregression model show that poor households residing in infrastructurally developed (defined as havingelectricity and good transport access) villages have, on balance, 9 percent higher income than theircounterparts in underdeveloped villages. The independent impact of infrastructures on rural poor'sconsumption is still higher: poor households living in developed villages enjoy, on average, 16 percent highlerconsumption than those residing in underdeveloped villages.
3. Second, the model results also point to another potentially important link between public spendinigand poverty i.e. impact of education. Development of human capital of the poor via public education exertspositive influence on rural poor's income and hence helps to alleviate poverty. At the average houselholdlevel, households with education up to primary level earn about 13 percent higher income than those withotitexposure to formal education. For the poor households, the matched difference is 1 0 percent, whichi issignificant statistically. The impact of education is higher for secondary and hiigher attainment levels. Theimpact of different levels of education on poor and nonpoor remains sensitive to the choice of income/consumption data. For the poor, income data suggests an important role of primary and highier education,while consumption data tend to favor the high school certificate level. According to the both sources, highier
The objective of the analysis was to evaluate the extent to which public expenditures on education, health and socialsafety nets benefit poorer groups in rural areas. The assessment is based on a public expenditure incidence analysison a per capita basis primarlily based on household survey data for 1993/94. The exclusion of urban areas is due tothe lack of representative survey data capturing the household "use" of public education and health facilities inurban areas. A comprehensive review of the benefit incidence requires an analysis that consider the simultaneousdetermination of the entire tax and expenditure system, employing the goverment aggregate subsidy to health andeducation as one of the parameters of the system. However, data is not readily available to support such an analysis.Hence, the following analysis is limited to the redistribute impact of government expenditures in a partialequilibrium framework.

- 49 -
APPENDIX 4Page 2 of 5
educatioii is positive and significant in case of the nonpoor, though income data also points to the relevance ofsecondary education. The impact of education would be higher if combined with access to capital which is alimiting factor in realizing full range of poverty alleviating potentials associated withi public expenditures onphysical infrastructures and human capital development.
4. Third, the presence of physical infrastructure and intervenitions aimed at developing human capital isimportant for economic growth. The effectiveness of these intervenitions, however, seems to rest on the pooi'sability to tap the full advantage of the chaniging infrastructural environment. A major lacuna in this area is tilelimited coverage (ranging from a quarter to 30 percent) of the poor households by the exciting creditprograms operated under the auspices of the government or NGOs. Access to credit, along with traininig andtechnology, will facilitate the poor's entry to nonfarm self-employment and raise their productivity in theseoccupations. The model results indicate that poor liouselholds wlho manage to participate in non-farm sectorshave, oni average, 34 percent higher income (and 15 percent higher consumption) than those engaged in farmoccupations. Not all poor houselholds can operate at that level, but the result shiows the rich potential forpoverty alleviation associated with the effective combination of infrastructure, humani capital, and micro noll-farm credit.
5. In short, the partial equilibrium analysis show a positive correlation between spendinig on rural roads.electrification and education and the rise of the rural poor's income and hence reduction in poverty. It ishowever essential to also analyze aspects of distribution. Inequality in the access to human capital mayemerge as a constraint to future economic growth. To evaluate hiow effective the public expenditure programis in helping to achieve the GOB's stated policy objectives of higher growth and reduce poverty, it is essentialto analyze the allocation of public expenditure by income group or class in different sectors.
Education: Expenditure Incidence by Income Group
6. An analysis of public expenditure ilcidenice in rural education, based on this partial equilibriumanalysis shiows a significant redistributive effect on rural income. It also points to disturbing features in ternisof the highily skewed distribution of benefits, which implies a iieed to re-orient spendinlg to ensure bettertargeting on the needs of the rural poor.
7. First, the analysis of how much of the total public expenditure is received by each income decileshows that the distribution of benefits from public spendinig at all levels of rural education is rather regressive.The bottom 20 percent of houselholds have only 13.8 percent of public spending on rural education. Incontrast, the top 20 percent have 28.8 percent of such expenditures. The poor households (about 52 percent otthe total in 1994) claim only 40 percent public spending oni rural education; the share of nonipoor hoLselholdsin SUIch expel1ditures is as higih as 60 percent. The pattern of regressivity in respect of total rural educationspending is mainly the result of the inequity in the allocation of expenditures at secondary and highier levels.The pattern of distribution of benefits from higiler education remains highly skewed: poor houselholds receiveonly 15 percent of public spending on higiler education, the rest 85 percent being allocated to the nonipoorhouselholds. The share of the bottom 20 percent (corresponding to the extreme rural poor) is very limited.accountinig for less than I percent of higher education spendinig and 6 percent of secondary educationl.

- 50-
APPENDIXAPage 3 of 5
8. However, the distribution of benefits from primary education alone displays a progressive pattern.The share of benefits accruing to households at different income levels roughly correspond to their share inoverall household distribution. For instance, the bottom 20 percent receive 19.4 percent of benefits fromprimary education expenditure compared, with only 6 percent recorded for secondary education expenditure.On the other end of the spectrum, the top 20 percent receive about 21 percent of benefits from primaryeducation, compared with 35 percent observed for secondary education expenditure. The expansion ofprimary education in rural areas is thus seen to have pro-poor orientation. A further shift within publiceducation expenditures towards rural primary education will further strengthen this healthy trend.
9. Second, the analysis of what proportion of each decile's income which is derived from publicspending oni education suggests a progressive pattern. The share of benefits as proportion of per capita incomein the poorer income deciles is monotonically higher than the corresponding figures obtained for the richerincome deciles.
10. Finally, an analysis of longer term developments reveals significant changes in the redistributiveeffect of public expenditure on education. Historical data reveals a very high degree of regressiveness in thedistribution of benefits as proportion of household income in the 1980s. The trend towards a gradually moreprogressive pattern has become apparent in the 1990s. This is in line with the GOB efforts to restructurepublic expenditure, with increased focus on social sector allocations since the mid 1980s.
Health: Expenditure Incidence by Income Group
IL. The observations of expenditure incidence analysis in education broadly characterize the distributionof benefits from public health expenditures as well, but the analysis as applied to rural public health revealsit's own special issues. Notwithstanding some degree of progressivity in the distribution of benefits frompublic health expenditure there is an urgent need for actions to improve the coverage and quality of publichealth intervention. There is a clear need for increased efforts to improve the access to public health careservices, including special programs for rural areas.
12. First, as per the current pattern of utilization of public health facility in rural areas, the highest benefitis received by the middle income decile. Households located at the top income decile receive slightly higheramount of benefits compared with the poorest income decile. However, the emerging pattern is generally pro-poor. The share of rural poor in the total stream of benefits from public health spending is about 57 percentwhich is much higher than the matched figure observed for public education spending (i.e., 40 percent).Second, the importance of public health access is particularly revealing for the poorest income decile. Thisgroup accounts for onily 2 percent of rural (private) income, but has 13 percent of total health benefits.
13. Third, a comparison of the relative proportion of public and private health expenditures indicates thatbenefits through public health still cover only a small part of the health care demand. This is true even forthose who are virtually cut off from the qualified private health care facility such as those provided by thetrained doctors and private health clinics. The public component varies from 8 percent to 36 percent of privatehealth expenses for different groups of the rural poor. This also shows the potential benefits associated witheffective expansion of public health programs in rural areas. The extreme poor households currently allocate

- 51 -
APPENDIX 4Page 4 of 5
7-10 %of their income to cover private health expenses which is a sizable burden by any reckoning. If thisburden can be relieved through greater targeting and provision of public health care, this would havesubstantial poverty alleviating effects.
14. Fourth, as with the incidence of rural public education spending, certain progressivity is revealed inthe distribution of rural public health care. Benefit from this source, as proportion of per capita income, ishighest for the poorest.
15. These findings should not detract, however, from observing the most disturbing aspect of the publichealth intervention in rural areas. The share of public healthi access is still limited to only 12-13 percent withlittle variation across socio-economic groups. The proportion has remained remarkably stable over the years,at least during the period since mid eighties. Access to maternal care is dismally low. Indeed, if any thing, theshare of core rural health expenditures on curative care has possibly declined over time. This is partlyexpressed in the declining share of upazilla hospital expenditures in total current health spending--from 47percent in FY87 to 38 percent in FY94.
Public safety net programs: Expenditure Incidence by Income Group.
16. Public safety net programs such as Food-for-Work (FFW) and Vulnerable Group Development(VGD) are largely self-targeted: only people with genuine need and distress will want to come under theseprograms. While these programs are more successful in reaching the extreme poor population, two aspects oftargeting remain inadequately addressed. The first relates to the issue whether public safety net programsreach the poorest during the leanest season. The second focuses on whether such programs reach the poorestin the poor area. The results of the study suggest that programs such as FFW do not target the poor during thetime of acute distress. The most intensified season of distress, September-October (widely known as MaraKartik, a term associated with acute distress and famine syndrome), claimed only 5 percent of FFW resourcesin 1994/95. It is clear that the current pattern of distribution of FFW favoring the January-March period failsto address the problems of slack season unemployment. Besides, the findings indicate that theimplementation period of FFW projects are in potential conflict with crop production activities. With thespread of new technology in agriculture during the winter season, the importance of the January-May periodas slack season has greatly diminshed over time and can no longer be considered the principal target periodfor the operation of FFW type programs. Already there is some evidence that FFW is increasingly competingwith agricultural activities, aggravating peak season labor shortages and exerting upward pressure on thewage rate.
17. If poverty alleviation is the policy objective of safety net measures, the poor areas should be target ona priority basis. The evidence does not support that this is what happened in practice. The poor in theeconomically poor areas still do not get preferential access to these programs compared to areas located inmore favorable settings. Thus, the share of poor area is limited to only a quarter of total flow of resourcesallocated through FFW and VGD programs. A significant variation can be noted in respect of areas coveredby different types of FFW programs. For some programs, such as FFW for fishery schemes, the coverage islimited to only 14-30 percent of the poor areas. It is well-known that the FFW activities for road schemesconnecting growth centres are very effective means of infrastructure development. The disadvantagedposition of the poor areas becomes more revealing when FFW-LGED schemes are considered: only 22%

- 52 -
APPENDIX 4Page 5 of 5
of the regionally poor areas have been covered by the LGED-executed FFW programs. Only afforestationschiemes seem to better target to the poor areas, but these are schemes which have little linkgage effects interms of employment and income compared to others such as the fishery or all weather road schemes.
18. Nevertheless, the overall impact of target safety net programs on the poor is favorable. The incideniceand depth of poverty is considerably lower for the beneficiaries than for nonbeneficiaries. The proportion ofextreme poor, for instance, is assessed at 63 percent for FFW beneficaries compared with 72 percent for theiion-beneficiaries. Similar observations apply to the VGD program. The participants also display higher assetaccess vis-a-vis the nonparticipants.
Agriculture: Expenditure Incidence by Class
19. A partial equilibrium analysis of aggregate rural spending (ADP and revenue budget outlays for theagricultural sector as a whole) shows that the present pattern of spending appears to be iiiefficienit in providingdirect benefits to the poor and landless and not very effective in raising rural incomes levels, whicil suggests aneed for better targeting and for chaniges in the overall spending strategy.
20. Thle distribution of aggregate public rural spending shows that a rather small share is received bylandless while a large shiare is allocated to small and large farmers; urbani classes also hiave significant shiares.Thle distributioll of spendinlg by class was: the landless, 12.3 percent; small farmers, 25.1 percent: largefarmners. 27.6 percenlt: urban poor, 19.7 percent; and urbani rich, 15.4 percent. Wlhen we consider tilepercentage slhares of hlouselhold incomiie derived fiom GOB's rural expenditures. we see that these are largerfoi tile landless and urbani poor and rich tilan for small and large farmiers. The large shiares for thle ulbanlclasses result fiom spendinig on water resources and rural developmenit. Thle analysis thus shows soime (legoceof progressiv eness in terms of the incidence of rlulal expenditule as a percentage of the incomiie of a giveniclass. utit re-ressiveness in termiis of the distributioln of spending by class (these effects are likely to varN.lmlonsa clrllncict progranis in the agr icUltural sector). i-hiis pattern of r edistributive effects is also r etlectedl iII(ie()[3 x cX)Cnlditure oni health and cduication as earlicr described.

A

- 53 -
APPENDLXY5Page l of5
STATE'S ROLE IN INDUSTRY: PROMOTING, NOT PLAYING
1. Bangladesh governments have poured huge public resources into industry over the past 25 years,usually with little financial or social return. Fortunately, the faucet has been turned down in recent years,creating space for more productive private enterprise. The share of public investment allocated tomanufacturing in FY96 has been one of the smallest (see 1% Box 1). That is appropriate, since all newinvestment within this sector should be private and most public expenditure to assist industry falls withinother sectors covering infrastructure and commerce. Manufacturing growth needs policy reform ratherthani public expenditure within the sector.
2. More attention needs to be focussed on: (a) cost effective and industry friendly publicexpenditures in the areas of basic and vocational education, physical infrastructure especially for export,judicial services for business, and maintaining civil order; as improvements are needed in each of theseareas to better serve their general economic and social objectives as well as industry specific purposes,public capital now tied up in manufacturing and financial enterprise should be redirected to thesepurposes; (b) on the revenue side of the Budget, import tariff and corporate tax reforms that are neededto provide a neutral incentive structure; (c) complementary non-expenditure policy measures that shouldbe taken to ensure a market friendly framework of procedures (especially in Customs), regulations, law,and institutions affecting investment, production, and trade; and (d) accelerating the slow progress that isbeing made in financial sector reform.
3. Within the industry portfolio itself, there are two major concerns which the new Governmentshould address before approving the FY97 and subsequent ADPs:
A. The Privatization Program Is Barely Moving In Manufacturing.
4. The divestiture of State-owned manufacturing enterprises in jute, textiles, steel, chemical,fertilizer, paper, sugar, etc. -- a program whose good intentions have never been reflected in rapidimplementation -- has slowed to a snail's pace. This leaves the Government with past investments that'are low or non-performing, the already crippled banking system with a large backlog of unrecoverableloans, public corporation management teams continuing to plan new investments which are unlikely tooccur, tariff reform impeded by conflicted public interests, and the private business community confusedabout the Government's commitment to private sector led industrial development. The PrivatizationBoard requires considerable further strengthening of both mandate and resources to manage thenecessary acceleration of the divestiture process.
5. Moreover, some of the SOEs are continuing to invest in upgrading their facilities rather thanleaving such decisions to future private owners. In particular, BCIC is moving toward completion of a$36 million BMRE program at Chhatak cement, it is also undertaking BMRE at Usmania Glass and theTSP Complex; the Sugar and Food Industries Corporation is continuing work on an $18 million programat the Pabna Sugar mills; and the Textile Manufacturing Corporation is replacing spindles in 10 mills. Inall of these and other cases, privatization should have preceded commercial decisions about where andhow to rehabilitate or modernize the facilities. As a second best, they should be put on the market assoon as the present efforts are complete, and no further BMRE projects initiated with either theGovernment's or the various corporations' own funds.

- 54 -
APPENDIX 5Page 2 of 5
Box 1: FY96 ADP industry portfolio - Summary statistics of 65 listed projects
Total value of Sources of public investmentslisted projects Reimbursable Government "Self-financed"
project aid investment by corporation*• BC/C Shahjalal Fertilizer $274 million $191 million $ 83 million• BSEC Cable/conductor $ 7 million $ 5 million $ 2 million. Four jute and four other
self-financedprojects S 15 million $ 15 million• Two other BCIC, Pabna Sugar,
and 16 BSCIC investments $151 million $ 59 million $ 92 million* Other 15 investment projects $ 70 million 5 70 million* 21 technical asstce projects $ 30 million $ 29 million $ I million
Total 65 pREci S547 million $284 million S163 million 5100 million
Shares bv expenditure periodTo FY95 In FY96 Futur
. B(7lC Shahjalal Fertilizer $274 million $ 0.3 million $ 2.5 million S271 million* Other 64 projects $273 million $140.1 million $ 39.0 million $ 94 million
6. Doubts about commitment to PSD led industrialization may be exacerbated also by plans forpublic investment in new production capacity. Though modest in number by historic standards, these runcounter to declared policy and hence imply unfocussed governance. The striking example of givingwrong signals to the private sector is BCIC's proposal to build a new $274 million fertilizer plant(Shahjalal). Financing is unidentified, but is expected to consist largely of suppliers' credit rather thanfollowing the KAFCO model of organized FDI or, preferably, leaving any investment decision entirely toprivate foreign and domestic interests. This would require rationalization of gas supply and pricing, toenable purely commercial decisions to be made about its utilization. BCIC is also continuing toimplement a Japan-financed CIB unit at its Chittagong complex. No further initiatives along such linesshould be taken under public ownership, and if BCIC's current studies of jute-based paper and bagasse-based newsprint indicate feasibility for such ventures, they should be left for private follow up. Smaller,unjustified projects include the BSEC's proposed $7 million HV cable and conductor plant.
B. The range of industrial support services is neither strategic nor demand-driven
7. The second concern is the ADP's rather weak provisions in one area of capital expenditure whereGovernments can play an effective role in supplant efficient private industrial investments and operations.Though perhaps less significant than indirect support (i.e., deregulation policy, neutral incentives, andpublic expenditures on education, infrastructure and securityindustrial development -- i.e. commonfacilities that support rather than), interventions in the form of promotional, technological, training, andexport marketing support can be both cheap and highly effective. The ADP contains a wide range ofactivities in this area (Box 2), but past performance raises important doubts about both their design andthe likelihood of effective implementation. Moreover, several of them involve functions that othercountries have found to be better undertaken by private entities or at least with largely privatemanagement of public funds. In particular:

- 55 -
APPENDIX 5Page 3 of 5
Estates.- Continuing large investments by the Small and Cottage Industries Corporation -- and eventhose by the more efficient Export Processing Zone Authority -- are to be questioned in view of thesorry record of BSCIC and of faster growing countries' good experience with private investment inindustrial areas including export zones. Interest is already evident among potential Bangladeshi andforeign investors, and Government efforts should be concentrated on facilitating private initiativesrather than expanding its own involvement. BSCIC should promote small industry by identifyingand alleviating policy and regulatory problems rather than operating commercial infrastructure.
* Promotion.- The assistance from bilateral donors and UNDP for promotion efforts by the ZoneAuthority, the Export Promotion Bureau, and the Board of Investment have served useful purposes,but future support in this area may be better directed to professionally managed matching grantfacilities that leave initiatives to private business. Similarly, a Ministry of Commerce/ExportPromotion Board initiative to build a $100 million World Trade Center in Dhaka should be left formainly private investment, like the parallel private initiative that is occurring in Chittagong.
* Silk and textites.- The investment projects of the Sericulture and Handloom Boards also bear closescrutiny since some of these entities' past efforts have hampered rather helped the development ofindustries which should prosper in Bangladesh with an appropriate mix of competition and commonfacilities. The current initiatives, which are almost complete, should be operated on commerciallines and no further investments planned. Similarly, the various forms of public support for theother textiles industries, including three almost complete training and technology projects, shouldhave far greater private involvement and be coordinated within an agreed development strategyfor this critical subsector.
* Technology.- Little attention is evident in the ADP to the manufacturing sector's need for higherquality support in the areas of metrology, standards, testing, and quality control (MSTQ) services.Before further expenditure is committed to overhauling the Standards and Testing Institute and othercertifying, technology information, and advisory agencies, however, the Government should developan overall and sectoral strategies for assisting technology diffusion and developing internationailyrecognized accreditation processes.

- 56-
APPENDIX-SPage 4 of 5
Box 2: Industrial support activities in the FY96 ADP
. The Export Processing Zone Authority's $27 million investment program ($2.6 million in FY96).* Smaller BEPZA projects: Dhaka workshop $2.5 million and Mongla feasibility (self-financed), andforeign
investment promotion (UNDP).. BCIC-sponsored studies on jute based paper (JICA) and bagasse based newsprint.* Almost completed Department of Textiles training/technology projects ($1.3 million in FY96) and Textile
Training, Research and Design Center ($2 million in FY96).* Continuation of the Textile Ministry's strategic management unit (Ford).. Two ongoing investment projects of the Sericulture Board totalling $15 million (almost complete, with capital
revenue ratios of 1:2); andfour such projects of the Handloom Board totalling $11 million.* Jute worker training/retraining projects (IDA) totalling $5.6 million ($1 million in FY96).* Sixteen investment projects of the Small and Cottage Industries Corporation totalling $77 million with a 2:1 KZR
ration and about 40 percent spent prior to FY96 ($8 million in FY96).* Two ongoing TA projects of BSCIC totalling $6 million, including the largest TA item in the ADP: the destitute
women project (Netherlands).* Commencement of a $1S.5 million Industrial Technical Assistance Center at Khulna. Th,r,ee investment promotion projects under the BOI, totalling $3.5 million, comprising an infrastructure unit
(ADB), a promotion fund (Belgium) and a Chittagong study (JICA).* The EDB 's almost completed export promotion project totalling over $3 million (UNDP).* A $2.6 million small scale enterprise credit program with Agrani Bank (NORAD).. TA for agencies: $2. 5 million for the Privatization Board (IDA) with 40 percent spent earlier and another third
scheduledfor FY96; about $1.8 million each for the Tariff Commission (IDA) and the Ministry of Industries'policy implementation advisory group (USAID), both well advanced; and about half that levelfor each of theNational Productivity Organization (unidentified) and the Dhaka Chamber of Commerce (GTZ).

- 57 -
APPENDIX 5Page 5 of 5
Box 3: Proposed public supportfor industrial takeoff
CoMIpIete te -privatization program
* strengthen the Privatization Board's professional resources and revise itsformal mandate to accelerate thedivestment process, schedule specific outcomes, and complete the process in no more than three annual phases;
* make legal andfinancial provisionsfor overcoming obstacles and providing social safety net support; and
* instruct corporations to preparefor rapid privatization of their units without significant pre-sale investment inBMRE, to abandon all plansfor new investment projects, especially Shahjalal, and to make publiclyfunded pre-feasibility andfeasibility studies available to any potential investors.
Reorient industrial support services
* commission, debate, and endorse a national -- i.e. public/private consensus on -- technology development andvocational training (TD VT) program, consistent with a private sector led, jobsfocussed, and export orientedindustrialization strategy;
. restructure all existing and any proposed industrial support programs and institutions to conform with the TD Vstrategy, and place much greater emphasis ofcertification and accreditation in the areas of metrology,standards, testing and quality control (MSTQ) services;
* reduce the resources and revise the mandates of BSCIC, BEPZA, EPB, of the Industries, Textiles, Jute, Labor,and Commerce Ministries, and of their associated Boards to emphasize their own and donors 'supportforprivate commercial and NGO initiatives in industrial infrastructure, promotion, and assistance programs --including through matching grant schemes -- rather than investment in and operation ofpublicfacilities; and
* increase the resources, professional status, apolitical authority, and private participation in management ofagencies intended to promote private investment, to develop and manage competition policy, and to coordinateand implement TD VT/MSTQ services -- potentially the BOIfor promotion, the BTCfor efficiency, and arevamped Technology Ministry or a new industrial technology agencyfor technical support and certification.
Ensure securiy and other public functions
* enhance and sharpen the mandate and increase resources of the key public services required by privateproducers and traders in a competitive environment, notably the courtsfor enforcing contracts and the policefoensuring law and order; and
* give agencies such as the port authorities, shipping corporation, BIMAN, railways, inland water transport, PDBetc. -- and their workforces --just one year to demonstrate their understanding that their public status dependswholly on their discharging their primary social responsibility of delivering efficient, public-good services thatfacilitate private production and commerce.


- 58 -
APPENDIX 6Page I of 13
THE INSTITUTIONAL FRAMEWORK: SELECTED ISSUES
1. Three issues related to the institutional framework are selected here for review: (i) deficiencies inthe accounting system; (ii) weakness in institutions, human capital and technology; and (iii) themanagement of the ADP.
I. Deficiencies In The Accounting System
Weakness in accounting. monitoring, audit and evaluation
2. The system of accounting and thereby related monitoring, audit and evaluating systems andbudgetary processes suffers from a number of deficiencies. The accounting system has improved but isstill characterized by inconsistencies, weak coverage and variation in general quality. There is noconsistent use of objective criteria based in economic rationale for determining prioritization , fexpenditure allocations between and within sectors and among projects. Moreover, there is no system forproper evaluation of the outputs or outcomes of specific services that agencies or projects can deliver.
3. The Government has already started addressing issues related to improvement of budgeting,accounting and expenditure control. A process was initiated by a Government appointed committee(CORBEC), followed by the technical assistance project RIBEC I supported by ODA-UK. A follow-uptechnical assistance project supported by the British ODA, RIBEC 2 is currently being implemented. Theproject has been re-phased so that it is better focused on more immediate implementation priorities. TheGovernment may resume discussion with ODA for expansion and acceleration of the project foraddressing the wider issues of budgeting, accounting, expenditure control and audit. The ADB issupporting technical assistance programs to improve the system of collection, monitoring and analyses ofnational accounts and the development of general equilibrium model for policy simulation andforecasting. The success of technical assistance programs will require a continued firm commitment fromthe GOB to tackle the problem of institutional internalization of the skills and knowledge generated; theexisting personnel policy does not provide opportunity for the level of specialization required by theseprojects.
4. The Government may consider a number of concrete measures to improve the system ofaccounting, audit and evaluation practices, dissemination of results and expenditure control to: (i) instillaggregate fiscal discipline including well-functioning planning and control instruments (ii) facilitatesound strategic prioritization of expenditures between and within sectors and among projects, and (iii)ensure high levels of technical efficiency in the use of budget resources, i.e. achieve outputs at the lowestpossible cost.
The fiscal accounting system
5. Monitoring expenditure. At present there are major deficiencies in the terms of consistency,coverage and overall quality in the accounting systems used in the public sector. There are significantdifferences in the accounting system typically used in the revenue budget and ADP. Adopting a common

- 59 -
APPENDIX 6Page 2 of 13
and consistent GFS-based accounting system for fiscal indicators, including all expenditures, all tax andnot-tax revenues, the fiscal deficit and public debt could help significantly to improve transparency andaccountability.
6. The classification scheme used in public sector accounting and budgeting in Bangladesh differsin economic classification -- and quite often the economic content of expenditure is not clear from theirbudgetary description. The budget summary statements include one statement ( Statement IIIA) whichlrecasts budget classification into economic categories -- a difficult task depending on the competence andingenuity of the officials engaged in the task, especially the budget examiners. For instance, the detailedbudget does not include 0 & M as a distinct category uniformly, but the summary statement shows totalbudgetary allocation for 0 & M, which information is extracted from other items of expenditure.
7. Though allocation for 0 & M has increased over the years, it is difficult to say that it is adequate.Prolonged neglect of maintenance and proper operation show up as 'rehabilitation' projects in thedevelopment program; the number of such projects along with allocation appears to have increased overthe years, though in combination with upgradation and modernization. The government should establishsome explicit criteria linking development expenditure -- especially creation of fixed assets and expansionof capacity for rendering services -- with 0 & M expenditure.
8. Pressures remain strong for expenditure on wage to go up further, given the large size ofgovernment bureaucracy and periodical upward adjustment of compensation and retirement benefits. Theprogram of redundancy adjustment may contain future wage expenditure to some extent. However, itincreases the expenditure currently being incurred on account of separation benefits. The Government isalso financing the cost of redundancy elimination of the public sector corporations. All these expendituresare shown as capital expenditure under the head of account 'extra-ordinary charges'. If theseexpenditures are included in wages, the share of the particular item will be higher than shown in thebudget.
9. When using the GFS-based system, 0 & M should be recognized as a distinct category ofexpenditure and included in the list of major and minor heads of account; the terms should be definedclearly. Expenditure on capital formation in revenue should be shown separately from othercontingencies which should include only consumables for running an office. Moreover the governmentshould strive to establish a clear principle for ensuring adequate allocation for 0 & M and define amethodology for estimating the optimum amount of 0 & M allocation. A set of minimal criteria shouldinclude the value of fixed assets and the type of service performed by the agency.
10. Monitoring deficit and debt. It is widely acknowledged that there is a need for improvement inthe assessment and management of the fiscal deficit and public debt. According to the current practice,government computes budgetary surplus or deficit in relation to revenue expenditure only. Ideally.surplus or deficit should be computed on total public expenditure, and methods for financing deficitshould be clearly identified since each method of financing has different implications for money supply,distribution of credit between the private and public sector, changes in domestic and external debt. Themethod used by the government tends to under-estimate the deficit and changes in public debt, partly dueto treating domestic borrowing as a resource rather than a financing item. Moreover, debt seems to be

- 60 -
APPENDLXY6Page 3 of 13
managed without a plan or deliberate method. While presenting the budget, the government does notspecify the amount of debt to be raised and the types of instruments to be used. Audit and accountabilityprocedures of public debt also seem less rigorous.
IL. Conventionally, surplus is measured by adding to the revenue surplus the net amount on capitalaccount, outcome of food outlay, surplus of the Public Account of the Republic, etc. This method isdeficient in several ways. Foreign aid is shown as a receipt for financing the development program but theloan component in aid is not included in public debt. Foreign public debt will be smaller than the amountof foreign-financed deficit because of the grant component in it. The surplus of the Public Account of theRepublic itself includes non-bank borrowing such as sale proceeds of saving instruments, provident fund,deposits with government, etc. Accounting treatment of bonds for investment in telecommunications,bonds issued for recapitalization of nationalized banks, bonds issued to replace non-performing loans ofthe sector corporations, is ambiguous. Telecommunication bonds are borrowing from the financialinstitutions and form part of public debt. Bonds issued to banks for non-performing or bad loans replaceold short term debts by longer term debt instruments. Recapitalization bonds are 'contingent' in nature inthat the government will have to make payment in cash if ever necessary. Promissory notes to multilateralfinancial institutions included in the capital account are different from other capital account items:Government cannot convert them to real resource when canceled; when there is a call, government paysmoney but the outlay is offset by increase in the value of shares; since they do not enter the stream ofexpenditure immediately, they do not have the expansionary fiscal or economic impact associated withpublic expenditure.
12. Quasi-fiscal deficit of the central bank is not yet recognized as part of public deficit; it isimportant that note be taken of such deficits --for they have implications for monetary policy stances. Thenationalized commercial banks (NCBs) and the development finance institutions owned by thegovernment are still obliged to implement credit programs or targets as advised by government policy.They do not recover enough of the outstanding loans or receive deposits which enable them to expandtheir loan portfolio. The Bangladesh Bank, under advice or 'moral pressure' of the government,reschedule the loans given earlier by the central bank and make new advances so that they can lend more.The Bangladesh Bank provides counter-guarantee for foreign loans taken by the government for publicsector corporations and has often assumed responsibility for payment when the corporation or thegovernment failed to meet the obligation. These are among the reasons for quasi-fiscal deficit of thecentral bank.
13. Public debt seems to be managed without a plan or deliberate method. While overall budgetdeficit remained at 6-7 percent of GDP, the Government used less foreign financing (declining from 6percent in FY91 to 4 percent projected for FY96 and increased domestic financing (rising from 1 percentor less in FY 91-93 to 1.8 percent of GDP in FY96). Besides, non-bank borrowing rose (from 0.7 percentin FY91 to 1.3 percent in FY94-95). Such a strategy of borrowing substitutes high cost funds for low costfunds and diverts financial assets from the private sector and capital market to the public sector. Theamount of foreign aid including concessional loan is determined in consultation with donors; but thegovernment has greater freedom in raising domestic debt. While presenting the budget, the governmentdoes not specify the amount of debt to be raised and the types of instruments to be used; audit andaccountability procedures of public debt also seem less rigorous than the usual regularity audit and otherannual financial reports by the supreme audit institutions.

- 61 -
APPENDIX 6Page 4 of 13
14. Measures needed to improve the assessment and management of the deficit and public debtinclude the following: The government should adopt the most comprehensive definition of deficit andpublic debt and install a unit in the Finance Division, preferably combined with TCBMRC, to collect dataand monitor public debt. The financing plan of the budget should clearly state the amount of deficit andthe various methods for financing. The budget statement should spell out the reasons for the deficit andthe implications of the various methods for financing. There is fundamental need to develop a solidframework for management of public debt, including strengthening of audit, accounting and planningmechanisms. The Comptroller & Auditor General (CAG) should cover public debt in the annual auditwhicih should receive specific attention from the Public Accounts Committee and the Parliament.
15. Institutional implications. Improving the capacity for estimating and monitoring outlays bymeans of an improved and consistent accounting system will have several institutional implications. It isnecessary to strengthen the capacity for resource estimation and monitoring of the total resourceenvelope. The government should consider to install a unit for resource estimation in the FinanceDivision which should be staffed fully by professionally trained and experienced persons. The unit shouldreport directly to the Finance Secretary and it should be small and avoid the genetal tendency of havingtall hierarchy. The External Finance Wing of Finance Division has lost much of its relevance sincepreparation of a foreign exchange budget has been dispensed with. Again, the Expenditure Control Wingexamines admissibility of demand for additional or new expenditures which can be better done by theBudget Wing itself.
II. Weakness In Institutions, Human Capital And Technology
Institutional weakness
16. The key institutions involved in public expenditure management are the Ministry of Finance andthe Ministry of Planning, both of which have quite a few Divisions (each under one Secretary) and over-lapping jurisdiction and functional linkages, entailing a complex task of co-ordination within the Division,among Divisions within one Ministry and with other ministries and technical agencies. Structural,procedural and personnel factors stand in the way of achieving all these without some extra efforts.
17. Programming Division of the Planning Commission effects some degree of co-ordination withinthe context of allocation resource for sectors as well as projects. But this tends to be contextually toospecific and narrow: it does not address broader issues of policy and overall resource management. TheGeneral Economics Division is involved in policy formulation and analysis; but its association issomewhat academic in the sense that the ministries -- which are the principal agencies for policyformulation and implementation -- need not and generally do not follow its policy advice. The FinanceDivision perhaps has the widest and deepest influence on government policies. It is involved virtually inall decisions entailing public expenditure and have to conduct co-ordination with the line ministries aswell as the Planning Commission and other Divisions of the Ministry of Finance almost on a day-to-daybasis. For instance, it interacts with the Bangladesh Bank in respect of deficit financing, exchange rates,money supply, etc.; with IRD/NBR in respect of revenues; with ERD in respect of aid; and the PlanningCommission in respect of development program. ERD is in the fore-front in dealing with the donors and

- 62 -
APPENDIX 6Page 5 of 13
thus gets involved in all conditionalities of policy-based lending. ERD, however, cannot take decisions onany of these matters; if it can influence any decision, it is because of the intellectual persuasiveness of theofficers concerned and the feeling that aid will not be available.
18. The decision-making process is complex, time-consuming and multi-layered. Within eachministry elaborate notes are written and passed up the tall hierarchy from Assistant Secretary (throughfour stages roughly) to Secretary and Minister. Within the Ministry, the tendency to refer matters tohigher levels for decision has been getting stronger. At senior levels also collegial decisions are preferredto decisions by individuals; the large number of inter-ministerial meetings is an evidence of this tendency.Multi-layered notes within a ministry and inter-ministerial meetings derive from the same set ofpsychological conditions: the officials tend to avoid individual responsibility and so diffuse theresponsibility as widely as possible. Decisions at the level of ministers also have increased -- partly due tothis 'feel-safe' attitude of officials and partly due to insistence by ministers to control decision-making ona wider spectrum. There is generally a tendency to overlook distinction between technical decisions,regulatory/administrative decisions and policy decisions. If these distinctions were observed, manydecisions could be taken at relatively junior officers level and more expeditiously.
19. The capacity of the Ministry of Finance to carry out and coordinate fiscal policy formulation andannual budgetary processes needs to be strenghtened. Establishing a stronger and more integrated multi-year budgetary framework including both the ADP and the revenue budget implies a need to strengthenthe Finance Division. The Finance Division needs to augment its capacity for resource estimation,evaluation and control of budgets and macroeconomic analysis. At present some of this work is done onan ad hoc basis and/or is deficient in its coverage, scope and quality. This points to the need for apermanent strong resource estimation and/or policy analysis unit within the Ministry of Finance staffed byfully professionally trained and experienced persons. Moreover, there is a need to examine options torationalize and improve efficiency within the Finance Division. For example, the Government mayconsider the merits of not having a separate Banking Division but to merge it with the Finance Division.NBR, however, should continue to administer the major taxation system. Should the decision be in favorof retaining four separate divisions in Finance Ministry, the Government may consider enhancingcoordination capacity at the civil service level by creating a post of Principal Finance Secretary who willdeal with policies and shall not be engrossed with routine administration as the Secretaries are now. Thereis a need to establish a policy analysis and planning unit at NBR. Also, there is an urgent need tostrenghten the capacity of the Ways & Means Section in the Ministry of Finance in the managinggovernment cash and to rationalize and improve weak systems of public debt management.
Personnel policy. technology. skills and training
20. Significant progress has been made in terms of the management and skills capacity of the centralgovernment. Also, there is a clear awareness of the need for further improvements. There is a need foradditional training efforts and personnel policy can be enhanced to improve the utilization of existingprofessional and technical skills at decision making and senior levels in the civil service. The positions inthe secretariat -- which is the center for decision making -- are held mostly by officers of 'generalist'cadres (i.e. those who join service on the basis of competitive examination without any particularprofessional or technical preparation). When technical cadre officers are brought into secretariat, theirassignment needs to correspond better with their technical qualification or experience.

- 63 -
APPENDIX 6Page 6 of 13
21. The Planning Commission and the Planning Cells are different in that these positions are filled upby the planning cadre officers most of whom have specialization in economics and a few in otherbranches of social science. There are some with technical or liberal science background also. However,they spend most of their time on project scrutiny which focus on cost control or minimization rather thanmore professional appraisal usinig economic techniques. The planning cadre officers are also inadequatelyprepared or motivated for the task of medium- or long-term economic policy planning.
22. The government may consider the following measures relating to the Planning Commission: (i) alateral recruitment of professionals into Planning Commission (as into other departments) for specifiedperiods. Planning Commission may alternatively use consultants while containing the size of the cadre.(ii) As project related responsibilities are shifted more to the sector ministries, Planning Commissionofficials conversant with project processing may be transferred to the ministries and technical agencies.(iii) Co-ordination within Planning Commission and with the ministries may be strengthened by creatinga position of Deputy Chairman, which position may be offered to well qualified economists with someexposure to administration; members from civil service shall be qualified only if they are professionallytrained and have had adequate experience in economic policy analysis and management. Moreover, theplanning system should be organized so that it is consistant with budgetary systems used by the Ministryof Finance.
23. The need to strenghten and rationalize the Ministry of Finance implies a need for a review of itsrequirements of professional skills in financial administration and setting up a specialized pool of officersfor all the divisions of Ministry. A substantial proportion of posts in these ministries/divisions will bereserved for the pool officers; but some posts at mid-level (Deputy & Joint Secretary) may be open toother officers also who have prescribed academic training (e.g. economics, statistics, accounting,management, business administration) and some related experience.
Bias Towards Hardware Versus Software
24. The relative bias towards hardware vis-A-vis software derives from the nature of developmentprograms. The following are the reasons for the high weight of hardware: investment in infrastructure forprovision of public goods and merit goods not provided or adequately provided by market; financing ofthe bulk of development expenditure by aid for import of capital goods; technical efficiency of agenciesand convenience of implementation of import and capital intensive projects relative to projects requiringinterface with human beings and social groups; and finally, the intensity of demand by better organizedsocial groups relative to less organized and vocal groups. This requires that the government gives moreattentioni to enhancement of institutional capacity.
25. The weaknesses of training programs are due to structural as well as procedural bottlenecks. Thecivil service is still dominated by 'generalist' tradition; professional skills are less in demand. Even aftertraining, it is common practice that officers are not assigned to jobs which require the skills acquired. Theprocedures for distribution of training facilities and selection of candidates are excessively complex andround-about: communication with donors is done through ERD; distribution of the facilities is donethrough the Ministry of Establishment; committees in departments and ministries select candidates which

- 64 -
APPENDIX 6Page 7 of 13
is approved by ministers; National Training Counicil has to issue no-objection to the training. The longprocess leads to low utilization of the facilities available. Finally, these facilities are limited only togovernmeit officials.
26. Management information system needs to be used more extensively as an important tool forimproving efficiency. Performance of government officials is not measured by the results they produce;the soft budget line exempts the public corporations from seeking efficiency. Besides, the decision-making chain is so long that the managers cannot respond in timely fashion to signals given by theinformation system. For similar reasons, there is little effort to improve delivery of services provided bygovernment and the public sector.
27. In sum then, (i) the observed hardware bias is embedded in supply of infrastructure service bygovernment and policy inertia in respect of continuing government monopoly or operation in certainsectors (e.g. telecommunication, energy, shipping) which can be transferred to the private sector.Fundamental policy change can reduce the hardware bias to some extent but not entirely. (ii) Proceduresfor nomination for training should be simplified and the responsibility transferred to the ministriesadministering particular civil service cadres. Clearance from NTC should be dispensed with. Further,NTC, set up to draw up plans for human resource development, has failed in performing this task andshould be abolished. (iii) Training facilities should be opened to institutions outside the government andpublic sector while retaining the necessary resources for the government officials. (iv) Introduction ofprogram oriented budget coupled with specification of expected output, hard budget line, linkage ofperformance with reward will encourage use of management information system and delivery system. (v)Adequate computer literacy should be made part of civil service training; given the enlarged domain ofgovernment/public sector operation, management control without aid of computers seems possible nolonger.
MANAGEMENT OF THE ADPAppraisal of ADP projects
28. Preparation and approval of projects go throughi a fairly long process under control of a tallhierarchy of diffused authority. The technical agencies of government (i.e. department, directorate,statutory corporation, statutory authority, etc.) -- which have the necessary technical expertise -- aremainly responsible for preparation and implementation of projects. The Planning Cells in the ministriesexamine the projects. IMED's responsibilities include implementation, monitoring and evaluation ofprojects. The sector divisions of the Planning Commission examine the projects in terms of theircompatibility with the Five Year Plan or the TYRIP, cost, technical quality, economic viability, etc. Theviews of the sector divisions of the Planning Commission are formulated in an inter-ministerial meeting --Pre-ECNEC -- which form the basis of its recommendation to ECNEC. The projects are oftenreformulated by the technical agencies on the basis of cost as rationalized by IMED or as advised at Pre-ECNEC meetings. By and large, ECNEC accepts projects in the light of recommendations of Pre-ECNEC meetings, though at times ECNEC also suggests changes.

- 65 -
APPENDIX 6Page 8 of 13
29. A distinction is now maintained between Project Concept Paper (PCP) and Project Program (PP):the former lays out the basic concept and viability of a project and the later gives details; IMED, Pre-ECNEC and ECNEC deal with PCP while the PP is approved by Departmental Project EvaluationCommittee (DPEC) chaired by the Secretary of the Ministry concerned and having representation of thePlanning Commission, IMED, Finance Division, etc. PCP is prepared at an early stage and forms basisfor negotiation with donors. PCP was intended to establish simpler procedures for more expeditiousapproval of projects; the large number of unapproved projects in ADP, the long time taken in processingprojects, the several stages of scrutiny (e.g. IMED, Pre-ECNEC) and the details required at each stagesuggest that the objective has not been fully achieved.
30. Projects are prepared on the basis of information and assessment of needs by the technicalagencies which accumulate data and judgment as part of their operations in the sector concerned. Thedata and judgments are often generated in the process of operation and at other times through specificpreparatory and feasibility studies. By and large, projects aided by donors -- which account for the bulk ofdevelopment program -- are appraised with greater rigor and on the basis of formal methodologies. On theother hand, projects which are financed exclusively by the government are often prepared and appraisedwith less technical rigor. It is not uncommon that the selection of such projects is influenced by non-economic criteria.
31. The technical agencies and line ministries generally do not have assessment of sectoral needs andsectoral strategies. There are some exceptions, such as the energy sector and water resources sector whichhave prepared sectoral assessment and strategies. Where such sectoral strategies exist, they provide aframework for choice of projects; in their absence, choice of projects is driven to a large extent by adhocism and political preferences. An impediment to preparation of sectoral strategies is the pre-occupation of the Planning Commission with project scrutiny; the Commission should give moreattention to sectoral strategies in cooperation with the ministries and technical agencies.
32. The instructions issued by the Planning Commission prescribe procedures, hierarchy of authority,and time limit for taking specific steps; they have hardly anything to say about application of projectappraisal methodology. Projects which earn returns on investment are subjected to benefit-cost analysis;infrastructure and social sector projects which are justified on the basis of positive externalities usuallyare not subject to the same appraisal methodology nor is there any clear indication of how to assess thevalue of the externalities. Technical criteria are hardly applied to the new concerns such as sustainability,gender issues, environment, etc.; most projects do with qualitative statements. Aided projects, however,apply specific criteria. As public investment in directly productive activities reduce, and emphasis shiftsto infrastructure and social sectors, the appraisal methodology gets more complex. Governments need topay serious attention to this aspect in order to reduce the pressure to chose projects on predominantlysubjective (personal) or political judgments.
33. The Government introduced the practice of cost rationalization by IMED on the ground that theproject agencies inflate cost and include components which are not essential. IMED has been carrying outits task without clearly defining the meaning and practical implications of cost rationalization. It followsfour methods, all of which are subject to criticism. First, it reduces unit price or cost but does not holdquality constant; besides, it does not have adequate information about price for which it depends mostlyon the technical agen.cies. Rationalization on the basis of unit price adjustment can work mainly for

- 66 -
APPENDIX 6Page 9 of 13
commonly used items and projects of repetitive nature -- e.g. construction, purchase of vehicles.Secondly, it reformulates projects by eliminating some components altogether or reducing their quantityin the project. Thirdly, IMED disallows or keeps at too low levels physical and price contingencies whichrequire more frequent and extensive revision of projects. Finally, it includes in cost only thosecomponents for which actual payments are made; this understates cost in the sense that the full cost of allthe real resources is not included. For instance, if a project uses land already owned by government, theprice of land may not be included even if the cost of land is a substantial portion of the total cost of theproject. Such method of cost estimation does not reflect fully use of real resource and impairs properappraisal of viability of projects.
34. Most projects experience cost over-runs and require extensive revision. In a few cases revisionaffects the design of projects substantially; in most other cases, the changes in cost are due to someessential work which could not be fully anticipated when the project was designed and changes in price,especially of imported items subject to changes in cross-exchange rates. The second category of changesmay not need re-writing the projects: sufficient allowances for physical and price contingencies and filingof variance analysis may be substituted for revision.
35. In sum, the Government may consider a number of measures to improve the appraisal of projects.
* First, the mandate of the Planning Commission should be examined and professional needs redefinedconisistent with changed organizational mission. Its involvement in project processing shouldgradually be phased out, and involvement in development policy planning, development ofmethodologies for project appraisal, and monitoring of the economy should progressively increase. Itsrelationship with projects should be mainly in assessing compatibility with sectoral goals andstrategies as well as methodology for project selection and appraisal.
* Second, with increased responsibility for the ministries with respect to projects, sectoral strategy andpolices require that their capacity be enhanced. The Planning Cells of the ministries may be upgradedinto units for policy and strategic planning and redesignated as Policy and Development Unit (PDU).The PDU's shall be manned by professional staff representing the required skill mix -- such as thetechnical skills in the substantive fields, economic and financial analysis, policy analysis, socialscience analysis skills, etc. The ministries with large development portfolio may have their unitsunder the supervision of an officer of the level of Additional Secretary or Divisional Chief. Thelikely candidates for upgraded PDU's are Ministry of Agriculture (preferably with Ministry ofFisheries & Livestock merged), Ministry of Energy and Mineral Resources, Ministry of WaterResources, Ministry of Communication (preferably with Shipping merged in the same ministry) andMinistry of Education (with Primary Education Division merged with it).
* Third, IMED may concentrate more of its resources on monitoring the implementation of selectedlarge projects of national importance. Also, IMED needs to strenghten its focus on developingeffective methodologies for monitoring and audit of projects. More importantly, it should concentrateon high quality evaluation of projects; the lessons learnt from projects already implemented helpimprove design and quality of new projects. The application of the concept of cost rationalization --which is a vague notion, lacks any reliable methodology and the minimum information required --needs to be developed. The alternative of building up adequate price information and analytical

- 67 -
APPENDIX 6Page 10 of 13
capacity is too costly to be economically justified. Finally, there is a need for measures to improve skillsto ensure that IMED is in a better position to retain much needed qualified staff members.
* Fourth, ECNEC should focus on sectoral assessment, strategy and periodic review of implementationof development programs and sectoral policy strategies. It should exercise its power through veto --i.e. instead of approving every project, it should reject projects which fail to meet sectoral policiesand goals with specific instructions to remove the deficiencies.
* Fifth, the authority to implement projects should be decentralized to the agencies includingprocurement and appointment of consultants. Control over process of project implementation shouldgradually be replaced by more effective audit and evaluation supplemented by strong sanction againstmala fide failures.
Implementation issues
36. Release of fund to autonomous bodies and authorization of expenditure by governmentdepartments or ministries are among the causes of slow utilization of resources allocated in developmentexpenditure. The Finance Division issues every year a new circular describing the procedure. The circularis not available until a few months into the fiscal year. There is no major change from year to year, yetstandard procedures have not been established. The line ministries can release funds to autonomousbodies for approved projects for the first three quarters, one quarter at a time; release of two or morequarters at a time and any release during the last quarter need approval of the Planning Commission andthe Finance Division. For unapproved projects approval of both Finance Division and PlanningCommission is required for each quarter. The Finance Division insists on recovery (or forced recovery) ofdebts from the state owned corporations by short release, even if the corporations are financially too weakto meet the debt obligations. This delays release and quite often results in actual expenditure on projectsbeing shorter than the amount nominally released.
37. The circular of the Finance Division uses the term 'release' also in case of projects implementedby government departments, including approved projects. Release in this context is interpreted as themaximum amount that can be spent during a quarter and subject to further authorization by theadministrative ministry in case of approved projects and by both the Planning Commission and theFinance Division in case of unapproved projects. The departments submit bills on the basis of actualexpenditure to Accounts Office which makes payments if the bills are acceptable. Thus, governmentdepartments are subject to two constraints on incurring expenditure from the development budget. Incase of revenue budget, government departments can spend up to the budget level without any periodicalceiling. Apparently, a distinction is made between procedure for development expenditure and revenueexpenditure to the disadvantage of the former.
38. Approval from both Planning Commission and Finance Division for unapproved projects for eachquarter seems unnecessary. The development budget is approved by the Parliament for the whole year;however, as the details of the project are not yet known or approved, Planning Commission may have tosatisfy itself on these details. But approval of Finance Division seems unnecessary. Further, break-up ofexpenditure may be submitted for the whole year instead of on quarterly basis except when the projectentity cannot do it for the whole year.

- 68 -
APPENDIX 6Page 11 of 13
39. The Financial Rules seem to have granted wider financial powers and responsibility to heads ofdepartments. The administrative orders have reduced those powers and arrogated them to ministries. Thefollowing are the provisions in the Financial Rules: "Controlling Officer means a head of department orother departmental officer who is entrusted with the responsibility of controlling recurrent expenditureand/or the responsibility of controlling collection of revenue by the authority subordinate to thedepartment". "Secretaries to Government (are heads of departments) in respect of officers who are notsubordinate to any of the other Heads of Departments"
40. The heads of departments exercise above powers with regard to the revenue budget but notdevelopment expenditure. The distinction between development expenditure and revenue expenditure inrespect of financial powers of the heads of departments does not appear to have a warrant in law orfinancial rules. Its removal will help decentralization and more efficient expenditure from developmentbudget.
41. Measures which the Government may consider in terms of implementation of projects include: (i)government should issue permanent rules/procedures for release of funds for development projectsexecuted by corporate entities and government agencies including ministries, departments anddirectorates. Confusion between quarterly release to corporate entities and expenditure by governmentdepartments up to the amount of budgetary appropriation may be removed. (ii) Application of financialrules regarding powers of heads of departments/directorates declared as controlling authority be examinedand, if there is no legal and constitutional bar, the same powers be granted for development projects. (iii)Release of funds to corporate entities and expenditures by government departments/directorates forunapproved and revised unapproved projects may be made with approval of the Planning Commissiononly; approval of Finance Division may be dispensed with except in cases of supplementary and excessgranits. (iv) Break-up of expenditures be approved only once for the whole year except where thespending agency is unable to do this; in all such cases the spending agencies should be encouraged todetermine break-up for the whole year. (v) Release of ADP funds may not be adjusted with debt serviceobligations of corporate entities except where the Finance Division is satisfied that the corporate entitiesare willful defaulters. The debt obligations of the corporate entities be treated separately and theirunderlying real weaknesses be addressed.
Monitoring and evaluation
42. IMED is responsible for monitoring and evaluation. It carries out monitoring through a system ofelaborate reports submitted periodically by the project implementing agencies, supplemented to someextent by inspection of projects. IMED's monitoring tracks reasonably well expenditure and to a lesserextent execution of 'physical implementation' in comparison with the time path laid for the projects;however, it has too limited a role in improving implementation by removing bottlenecks or suggestingrevision of design of projects if necessary. IMED has not paid much attention to evaluation of projectswhich could help improve design and implementation of subsequent projects. Virtually, only aidedprojects are evaluated at the initiative of donors. It might be better to consider monitoring as part ofproject management task and give responsibility to the project entities while IMED concentrates onevaluation and audit of monitoring done by the project entities themselves.

- 69 -
APPENDIX 6Page 12 of 13
43. Lookiig ahead, the mandate and professional skills of IMED needs be reviewed in order todetennine whether it should continue to emphasize monitoring or shift its attention more to evaluation. Itmay be more effective in improving project implementation if monitoring is integrated with managementfunction within project agencies. IMED may concentrate mainly on evaluation of projects so that qualityof next generation of projects can improve. Consistent with the revised mandate of IMED, a program forappropriate staffing and training for skill development needs to be undertaken.
ADP and RADP
44. The Planning Commission sends out instructions every year for submission of projects forinclusion in ADP for the coming fiscal year and similar instructions are issued for inclusion of projects inRADP (Revised Annual Development Program) or revised allocation for on-going projects. New projectsare included in ADP on the condition that they are also included in TYRIP; the two processes may -- andgenerally do -- move simultaneously. No new projects are generally included in RADP. However,exceptions are made for inclusion in ADP or RADP projects which have high national importance, relateto high priority sectors, and for which aid has been arranged. Further, high national priority is too often aeuphemism for politically mandated projects which are included in development programs without propertechnical preparation and appraisal. The size of ADP as well as RADP is driven primarily by availabilityof resource and the political dynamics of public resource allocation, especially for projects which are fullyfinanced from local currency resource including government revenue and domestic public debt. Largeproject portfolio proposed by technical agencies and line ministries are frequently used for bargaining forlarger allocation -- especially in the of absence of even a reasonably strict application of appraisalmethodology and test of financial and technical performance.
45. The Government may consider: (i) GOB/Planning Commission should adopt practice of notifyingin advance the resources available for particular sectors, sub-sectors and/or institutions. (ii) The resourceenvelope and the project portfolio shall correspond with the period of planning/programming whichGOB/Planning Commission adopts (e.g. five year corresponding with five year plan, three yearcorresponding with TYRIP).
Three-Year Rolling Investment Program
46. The TYRIP has been in force since FY91-93. So far, the Government has prepared four TYRIPs,each covering three year period and the terminal year coinciding with the first year of a new TYRIP. Itwas expected that the shorter period would enable better estimation of the resource available and thusestablish closer correspondence between resource envelope and the size of ADP, which would eliminatethe need for 'pruning' (i.e. retrenching projects or components of projects in ADP) from time to time andthe large number of projects which 'spill-over' from one plan period to another. In practice, TYRIP hasacted only as a 'soft tool' of planning: it has not been able to prevent inclusion of projects beyondfinanicial capacity of the government nor 'spill-over' to new planning periods. The reasons for weaknessare absence of well defined sectoral strategy, absence of multi-year resource forecast and inclusion ofnew projects including 'politically mandated' ones without considering their impact on resourceallocation.

- 70 -
APPENDIX 6Page 13 of 13
47. Looking ahead the government may consider: (i) to develop sectoral need assessment, sectoralstrategies and sectoral programs matching with planning/programming period; for this purpose two ormore overlapping programming periods may also be used. (ii) Methodology for appraisal of projectsshould be improved and applied with greater rigor and consistency, especially to projects justified ongrounds of social benefits and positive externalities. (iii) Choice of the so-called 'politically mandatedprojects' or 'nationally important projects' should be subjected to the same appraisal discipline as allother projects. (iv) Finally the scope of TYRIP needs to be broadened to include not only ADP but alsothe related revenue budget.
Methodology and database for choice of projects
48. Most projects originate from perceived needs of the agencies which operate in a particular sector.The technical agencies carry out analysis and work out details of projects; in case of aided projects, thedonors actively participate in preparation of projects. Usually, the following stages are involved:collection of bench-mark data and description of initial conditions; specification of technical details andimplementation methods; specification of objectives of projects and benefits expected; appraisal usingcost-benefits analysis techniques. Projects which are fully financed by the government do not follow thisprocess closely: project appraisal methodology is either applied too loosely or not at all; generally,benefit-cost analysis is not applied to infrastructure projects. Some projects are identified by politicalleaders also on the basis of their felt needs and local importance -- the so-called high priority or politicallymandated projects. The technical preparation and appraisal of these projects are too weak.
49. Looking ahead the government may consider the following measures: (i) to develop appropriatemethodology for appraisal of infrastructure and social sector projects and establish the rule that noprojects be taken up without a proper appraisal using those methodologies. (ii) Bench mark data andevaluation of projects be carried out to determine the outcome of projects compared with expectedbenefits. Full-fledged evaluation may be carried out on a selective basis for projects which are large andwhich would lead to better design of future projects. (iii) The terms infrastructure, social sectors, humanresource, etc. are used rather loosely; it is necessary that for the purpose of public expenditure thegovernment adopts some clear definition consistent with the meaning of these terms in the technical andeconomic literature. (iv) To develop and implement training programs for imparting the appraisal skills tothe concerned officials in the technical agencies, ministries and the Planning Commission.


STATISTICAL ANNEXES
Table I Macroeconomic Indicators, FY80-FY965
Table 2 Actual Income and Expenditure of the Central Government66
Table 3 Revised Budget Summary
Table 4 Current Budget - Revised Estimates
Table 5 Annual Development Programme
Table 6 Bangladesh: Consolidated Accounts of Non-Financial Enterprises1990/91 - 1995/96
Table 7 Financial Profit Performance of Non-financial State-Owned Enterpries
Table 8 Medium-Term Scenarios, 1994/95-2002/03
Table 9 Indicators of Fiscal Sustainability (Reform Scenario)
Table 10: Bangladesh: Fiscal and External Debt Sustainability 1996-97 - 2002/03
Table I Bangladesh: Indicators of Fiscal Sustainability(assisting SOEs and restructuring banks through issue of bonds)
Chart I Selected Economic Indicators, 1989/89-1995/96
Chart 2 Central Government Operations, 1983/84-1994/
Chart 3 Indicators of Fiscal Sustainability
Chart 4 Indicators of External Debt Sustainability

- 71 -
Table 1: MACROECONOMIC INDICATORS, FY8O-FY9S
FY80-84 FY85-89 FY90 FY91 FY92 FY93 FY94 FY95(P)(Average) (Average)
(In Percentages)
GDP growth rate: 3.1 3.4 6.6 3.4 4.2 4.5 4.2 4.4GNP Per Capita (inS) a/ 145 174 208 213 213 214 230 253
(Percent of GDP)Savings:Domestic Saving 1.6 2.9 2.7 4.2 6.0 7.6 9.1 8.3National Saving 4.4 5.8 5.8 7.4 9.7 11.7 13.8 13.1
Investment:Gross Investment 14.3 12.4 12.8 11.5 12.1 14.3 15.4 16.6
Public 6.2 6.2 6.4 5.7 5.5 6.4 7.6 7.2Private 8.1 6.2 6.4 5.8 6.6 7.9 7.8 9.4
Budget;Total Revenue 8.9 9.0 9.3 9.6 10.9 12.0 12.2 12.1Tax Revenue 7.2 7.2 7.8 7.8 8.8 9.6 9.3 9.6
Total Expenditure 18.4 16.6 17.2 16.8 16.8 17.8 18.1 18.9Current Expenditure b/ 6.4 7.7 8.8 8.7 8.3 8.9 8.9 8.8
Overall Budget Deficit c/ -9.3 -7.5 -7.9 -7.2 -5.9 -5.9 -6.0 -6.8
Balance of Payments:Exports d/ 5.4 6.0 6.8 7.3 8.4 9.8 9.8 11.9Imports e/ 18.3 15.8 16.9 15.0 14.8 16.8 16.3 20.0
Current Account Balance -9.9 -6.7 -7.0 -4.2 -2.4 -2.6 -1.6 -3.5(In Precentages)
Debt Service Ratio f/ 9.7 14.1 13.7 12.5 11.5 10.2 11.5 10.0
External Defb g/(million US S) - - 12289.0 12867.0 13203.0 14106.0 15713.0 na
Rate of Inflatlon h/ 13.4 10.1 9.3 8.9 5.1 1.3 1.8 5.2
Memorandum Items:
BB Gross Reserves:(million US $) - - 585.0 966.0 1709.0 2227.0 2852.0 3070.0(in months of imports) - - 1.9 3.3 5.8 6.6 8.2 6.3
Exchange Rate (TK/US $) 20.1 30.0 32.9 35.7 38.2 39.2 40.0 40.2a/ In calculating GNP workers' remittances are included in net factor income. Per capita
GNP is calculated using the same year's period average exchange rate.b/ Excludes food subsidies.cl Defined as the difference between expenditure/GDP and revenue/GDP ratios, further adjusted for a
residual amount to reflect the difference between the fiscal accounts and estimates of total financingof the Govemment.
d/ Exports imply merchandise exports only.e/ Imports imply merchandise imports only.f/ Represents the ratio of debt service to total foreign exchange eamings from export of goods and non-
factor services, plus workers remittances. Debt service includes interest on public M< debt, amortizationof public M< debt, total IMF transactions (net) and IMF service charges.
g/ End December in each fiscal year.hi Based on Dhaka Middle Class Consumers Price Index (CPI).
P: ProvisionalSources: Bangladesh Bureau of Statistics (BBS) ; Twenty Years of National Accounting of Bangladesh
1971-1992;Export Promotion Bureau (EPB), Bangladesh;Bangladesh Bank (BB);

- 72 -
Table 2: ACTUAL INCOME AND EXPENDITURE OF THE CENTRAL GOVERNMENT(Taka in Billion)
FY87 FY88 FY89 FY90 FY91 FY92 FY93 FY94 FY 95
TotalRevenue 4800 5329 0eo.00 68,90 80.00 98.90 11359 125.33 141.82Tax 38.77 42.63 48.90 57.30 65.20 79.50 91.20 96.29 111.90Non-tax 9.23 10.66 11.10 11.60 14.80 19.40 22.39 29.04 29.92
Totlal exienditun -93.03 -9590 -107.33 -127 00 -139.90 152.35 -169,16 -186.82 -221.52
Current expenditure /a -41.59 -48.19 -56.70 -64.70 -72.30 -75.60 -84.56 -91.23 -103.13Food account surplus -0.13 -5.64 -3.93 -8.80 -7.40 -5.75 -6.47 4.47 -7.00Annual Development Program (ADP) -46.30 -37.98 -42.20 -47.20 -52.00 -57.00 -67.49 -87.05 -100.86Other capital expenditure and
netlending bl -5.01 -4.09 -5.20 -5.20 -5.30 -5.40 -8.49 -12.53 -11.96Residual d/ 0.7 -1.10 -2.90 -8.60 -2.15 -0.48 1.43
Overall budoet defit -45.03 -42.61 -47.33 -58.10 -59.9 -53.45 -55.57 -61.49 -79.70
Net foreian financing C 40.36 41.43 46.68 48.60 51.90 4412 5288 50.43 57.53
Project aid 29.63 25.01 27.20 35.50 35.20 36.37 39.60 38.87 49.65Commodityaid 11.13 14.07 15.50 13.50 16.30 6.35 17.20 18.20 13.40Food aid 6.94 7.64 7.30 6.20 9.70 8.81 4.65 4.80 5.51Commercial food borrowing -2.94 0.10 1.28 -0.80 -0.50 -0.75 -0.73 -0.44 0.00Debt amortization -4.40 -5.39 -4.60 -5.80 -8.80 -6.66 -7.84 -11.00 -11.03
Net domestic financing 4.67 1.18 0.65 950 8200 93 2 11.06 22.17
Banking system 3.37 -0.68 -2.50 6.50 1.70 -2.90 -10.3 -5.36 5.18Otherdomestc 1.31 1.87 3.10 1.90 3.50 9.20 13.0 16.42 16.99
(Annual percentage change)
Total Revenue 13.5 11.0 12.6 14.8 16.1 23.6 14.9 10.3 13.2Total expenditure 20.1 3.1 11.9 18.3 10.2 8.9 11.0 10.4 18.6* Currentexpenditure a/ 18.9 15.9 17.7 14.1 11.7 4.6 11.9 5.6 16.2
ADP 28.8 -18.0 11.1 11.8 10.2 9.6 18.4 29.0 15.9
(As percent of GDP)
Total revenue 8.9 8.9 9.1 9.3 9.6 10.9 12.0 12.2 12.1Tax revenue 7.2 7.1 7.4 7.8 7.8 8.8 9.6 9.3 9.6Non-tax revenue 1.7 1.8 1.7 1.6 1.8 2.1 2.4 2.8 2.6
Total expenditure 17.3 16.1 16.3 17.2 16.8 18.8 17.8 18.1 18.9Current expenditure a/ 7.7 8.1 8.6 8.8 8.7 8.3 8.9 8.9 8.8ADP 8.6 6.4 6.4 6.4 8.2 6.3 7.1 8.4 8.6
Overall budgetdeficit 8.4 7.1 7.2 7.9 7.2 5.9 5.9 6.0 6.8Net foreign financing 7.5 6.9 7.1 8.8 6.2 4.9 5.6 4.9 4.9Net domestic financing 0.9 0.2 0.1 1.3 1.0 1.0 0.3 1.1 1 9
Banking system 0.6 -0.1 -0.4 0.9 0.2 -0.3 -1.1 -0.5 0.4Other domestic 0.2 0.3 0.5 0.3 0.4 1.0 1.4 1.6 1.5
GDP Mkt. Prices 539.2 597.1 659.6 737.6 834.4 906.5 948.1 1030.4 1170.3
a/ Excludes food subsidies, which are included under the food account deficit.b/ Comprises non-ADP project expenditure, the Food for Work program, miscellaneous investment (non-development) and net loan and advances.
A major part of gross lending by Govemment is Included within the ADP.c/ Including foreign grants.d/ Represents the difference between the balance of revenue and expenditure from the fiscal accounts and total financing estimates of
the central Govemment.
Source: Ministry of Finance and IMF and BBS.

- 73 -
Table 3: Revised Budget Summary(Taka in Crore)
1984/85 1985/86 1986/87 1987/88 1988/89 1969/90 1990/91 1991/92 1992/93 1993/94 1994/95
A. REVENUE SURPLUS 547 652 760 418 -348 38 513 1617 2550 3130 3910Receipts 3477 4073 4716 5146 5822 6778 7823 9517 11060 12280 14210Expenditues -2930 -3421 -3958 -4730 -6170 -8740 -7310 -7900 -8510 -9150 -10300
B. FOREIGN FLOWS 3307 4018 4372 5086 4885 5545 8103 6039 6365 6487 6994
C NET DOMESTIC CAPITALDomestic Loans & Advances -248 -252 -173 -400 -521 -499 -557 -539 -815 -1530 -1225NetPublicAccounts 148 160 160 183 223 260 549 677 830 1608 1627
Total Net Domestic Capital -100 -92 -13 -217 -298 -239 -8 138 15 78 402
D. EXTRA-BUDGETARY RESOURCES &DEFICIT FINANCING 479 5 -166 355 955 882 383 362 260 196 887 /a
TOTAL RESOURCES AVAILABLE 4233 4583 4953 5640 5194 6228 6991 8156 9190 9891 12193
E-USE OF RESOURCESADP 3508 4096 4513 4651 4595 5103 6121 7150 8121 9600 11150Non-ADP Projects 207 144 92 70 98 106 125 138 117 119 89Food Account 518 344 349 919 501 1018 744 868 924 141 954
Food-for-Work 216 348 326 400 526 471 510 584 418 547 690Net Food Outiay 302 -4 23 519 -25 547 234 304 506 -406 264
Others 0 0 0 0 0 0 0 0 28 31 0
la Includes the T&Ts bond issue of Tk. 235 crores and a bank borrowing of Tk. 470 crores.
Source: Ministry of Finance.

- 74 -
Table 4: Current Budget - Revised Estimates(Taka in Crore)
1984/85 1985188 1988/87 1987/88 1988/89 1989/90 1990/91 1991/92 1992/93 1993/94 1994/95Revised Revised Revised Revised Revised Revised Revised Revised Revised Revised RevisedBudget Budget Budget Budget Budget Budget Budget Budget Budget Budget Budget
REVENUETax Revenue 2852 3242 3790 4307 4833 5712 6313 7661 8934 9780 10955
Production, consumptionand distrbution taxes 2400 2710 3156 3505 3950 4610 5086 6166 6962 7725 9080
(Custom duties) 1120 1338 1550 1618 1820 2167 2328 2820 2835 3070 3870(Sales taxes) 410 461 550 525 540 531 823 0 0 0 0(Excisedubes) 750 772 900 1172 1400 1700 1713 1360 320 175 180(Value Added tax) 0 0 0 0 0 0 0 1675 2500 2775 3275(Stamp taxes) 110 125 140 170 170 177 187 251 312 355 420(Motorvehicle taxes) 10 14 16 20 20 35 35 40 50 60 85(Supplementary tax) 0 0 0 0 0 0 0 20 945 1290 1450
Taxes on income 390 460 550 664 750 875 1071 1300 1720 1735 1560Land revenuetax /a 40 51 56 89 85 114 60 85 100 120 150Other taxes and duties /b 22 21 28 49 48 113 98 110 152 180 165
Non-tax revenue 670 831 929 839 989 527 905 1239 1470 2520 3255
Nationalized sector 283 362 349 215 255 178 439 701 789 833 881(Industries) 60 85 92 80 70 50 276 381 360 415 227(Banks) 223 277 257 135 185 128 163 320 429 418 654(Otherpublicsector /c) 0 0 0 0 0 0 0 0 0 0 0
Interest receipts 140 233 200 225 220 345 300 300 350 350 475Registrabon fees 40 43 65 60 63 70 70 80 96 120 130Forest 36 50 51 50 60 20 25 30 40 43Railways -30 -53 -104 -149 -150 -139 -149 -126 -100 -95 -90Post Office & T&T (net) 8 0 9 37 78 53 220 254 295 431 607Other /d 193 196 359 401 463 - - - - 838 1252
Total Curent Revenue 3522 4073 4719 5146 5822 8239 7218 8900 10404 12280 14210
EXPENDITURESGeneral Services 1108 1367 1722 2003 2241 2592 2583 2935 3546 3844 4342- General administration 382 404 567 892 694 828 914 1081 1263 1379 1780- Justice and police 220 348 302 348 378 451 451 509 740 777 814-Defense 493 596 829 934 1139 1279 1180 1301 1494 1634 1887- Scentific departments 13 19 24 29 30 38 38 44 49 54 62
Social Services 904 923 1414 1705 2079 2084 2241 2390 2830 3036 3436-Education 493 600 747 820 949 1094 1182 1382 1674 1758 2008- Health & population planning 180 113 275 305 321 367 387 431 516 807 885- Social welfare 251 210 392 580 809 623 672 577 640 673 743
Economic Services 199 247 304 357 411 460 493 570 674 768 843-Agriculture 109 95 174 198 234 258 283 300 346 393 451- Manufacturing & construction 8 64 20 22 23 28 26 29 33 36 43-Transport & communication 51 55 64 86 98 113 118 187 209 242 245-Others 31 33 46 53 56 63 66 74 86 97 104
Debt Service 318 428 445 590 733 882 854 1107 1025 1068 1206- Domestic 417 634 550 519 606- External 437 473 475 549 600
Food Subsidy /e 250 141 50 0 627 831 373 344 153 149 273
Other Subsidy /e 15 0 19 65 79 310 397 245 134 93 182
Contingency 136 315 2 10 0 1 370 308 148 192 18
Total Current Expendituresf/ 2930 3421 3958 4730 8170 6740 7311 7899 8508 9150 10300
a/ Tax levied on land holdings. It was virtually abolished in FY74 together with the imposition of the Agrculture income tax but reinstated in 1976/77.b/ Includes electricity duties, estate duty on agricultural land, taxes on immovable property, gift taxes, capital gains tax, tool taxes, betterment tax on
commercial establishments and other levies.c/ Includes receipts from nationalized insurance, other industrlal operabons and disinvestment of industrial units.d/ Receipts of various govemment departments, especlally under general administration, social economic agriculture and other services etc.e/ There has been a change in the definition of subsidy, especially during FY93. FY93 figures therefore, are not fully comparable to the previous
years figures.f/ Governments budgetary definition. This is diferent from the definition used in Annex Table 5.3, which is based on a definitlon used by IMF.Source: Ministry of Finance.

Table 5: Annual Development Program(Tabs in crme)
FY34 FY35 FYII FYBT FY14 FY FY01 FY62 FY63 FY64 FY65 FY96 FY97 12s Revised Actua l Rised Revised Revised Actua Revisedy Adu Revised Actuat Revised Act IRevised Adu Revised Actu Revised Ac Revised Revised Budget
Budget Budget Buidget IBudge Bet tBudqet Budget Budget Budget Budget BugQet ~ t Agnatasa 476 471 314 287 193 204 252 191 333 262 384 326 425 307 469 423 489 372 591 521 607 541 251 350Rural Deveopment 106 74 110 92 114 99 144 108 138 91 257 178 286 222 392 319 518 366 525 480 768 684 410 415
Oit,Gas&NR 217 160 256 289 211 238 191 195 221 207 229 352 495 380 516 325 560 476 308 325 202 242 212 240Trapart 286 245 227 269 266 256 435 441 469 486 540 759 630 630 857 837 1146 968 1583 1544 2295 1949 1012 1100Cmnaians 55 50 61 71 49 44 44 37 96 97 165 165 92 114 183 164 168 145 542 536 501 452 323 400Ptysicalt Pningt 147 164 108 114 103 114 158 139 198 167 190 287 251 231 361 315 340 237 385 317 538 483 377 460
Edabtion 133 128 129 125 182 128 215 198 251 213 304 226 307 173 492 299 592 528 955 920 1520 1465 932 1170Health 80 71 99 93 73 66 80 73 87 83 128 98 165 141 178 137 262 206 304 281 395 370 141 280Famity Ptaning 107 86 111 102 128 68 142 105 170 141 296 220 295 310 339 271 346 283 446 408 512 470 162 200SocdlatWfse 16 14 18 16 15 13 22 20 20 16 28 26 38 31 37 29 53 31 72 42 130 100 83 155
LoaslGovemment/1 343 320 432 405 437 173 355 342 400 410 241 330 159 147 332 311 510 538 684 682 410 410 495 536Others 239 80 305 207 533 352 516 482 488 350 777 702 1531 1442 1284 1200 1001 703 1261 991 1140 826 4923 58a4
Total 3584.75 3006 3496 3168 4096 3429 4513 4439 4651 4150 5103 5717 6126 5270 7150 6024 8121 6550 9600 8984 11150 10303 10447 12500
/1 Local Govnmet indudes Black allocation tbr District Councis. Distric nd Thana inf6astructure, Development assistance to Thana and Union Parishad,Deveonmet assiace to Mucipa Corporabons and Pourashavas. and Local govenment bodies in Ctg. Hill-Tnrcs.
12 FY97 tigures me trm The Independent. June 17.1996
Note: FY89 figues we not availate yet.
Souae: IMED and Paning Canvssion
-0
Ll
02.46 PMs at 7n/2916

- 76 -
Table-6: Bangladesh: Consolidated Accounts of Non-financial PublicEnterprises, 1990/91 - 1995/96
(In billions of taka)
1990/91 1991/92 1992/93 1993/94 1994/95 R 1995/96 BOperating revenue 1/ 105.2 123.5 144.6 143.5 158.5 173.8
Of which: Subsidies 0.2
Operating expenditure 97.0 117.0 138.9 132.4 153.5 165.1Wages and salaries 11.8 12.9 15.2 14.6 15.0 15.9Purchase of good and services 74.4 92.5 111.4 102.9 124.5 134.6Depreciation 10.8 11.6 12.3 14.9 14.0 14.6
Operating Surplus 8.2 6.5 5.7 11.1 5.0 8.7
Nonoperating income 1.0 -2.3 -2.3 1.0 1.9 1.9
Interest 10.8 11.0 12.1 7.7 8.9 9.0Income before taxes -1.6 -6.8 -8.7 4.4 -2.0 1.6Profit distributions 2.6 3.6 4.1 4.9 2.2 2.2
Dividends 2.5 3.5 4.0 4.9 2.2 2.2Profit sharing 0.1 0.1 0.1
Income tax 3.9 5.3 4.9 5.5 2.0 2.0After tax retained income -8.1 -15.7 -17.7 -6.0 -6.2 -2.6Gross savings 2/ 2.7 -4.1 -5.4 8.9 7.8 12.0Fixed capital formation (gross) 41.3 31.8 27.6 22.9 30.0 34.8
Financing 38.6 35.9 33.0 14.0 22.2 22.8Netcashborrowing 11.1 18.3 7.1 4.9 1.1 5.1
Drawings 17.8 27.4 18.7 15.9 13.6 17.8Repayments -6.7 -9.1 -11.6 -11.0 -12.5 -12.7
Equity 4.6 4.1 6.3 9.1 12.5 10.2Assumed short term credit 3/ 22.9 13.5 19.6 0.0 8.6 7.5
Memorandum items:Total Assets 418.3 497.7 528.3 602.8 633.9 670.1
Equity 98.5 128.5 117.6 197.8 203.5 210.9Debt 319.8 369.2 410.7 405.0 430.4 459.2
Employment (thousands) 321.9 313.3 292.5 269.0 259.4 260.9Profitability (in percent)Operating surplus/optg. revenue 7.8 5.3 3.9 7.7 3.2 5.0
Operating surplus/assets 2.0 1.3 1.1 1.8 0.8 1.3Interest due to central Govt. 4/ 10.8
Interest arrears to central Govt. 5/ 8.3R = Revised budget estimates; B = Budget estimates
1/ Does not include changes in inventories.2/ Defined as after-tax retained income plus depreciation.3/ Includes arrears to Government and changes in domestic bank debt (including arrears)4/ Based on budgetary documents of the Ministry of Finance under budgetary heading 24 which is
the interest component of Debt Service Laibilities owed by the non-financial SOEs to the Govt.5/ Estimated as interest obligations of autonomous bodies under budgetary heading 24 minus
the estimated realized interest receipts reflected in Ministry of Finance budget documents.Sources: Ministry of Finance, Autonomous Bodies Wing and Finance Division
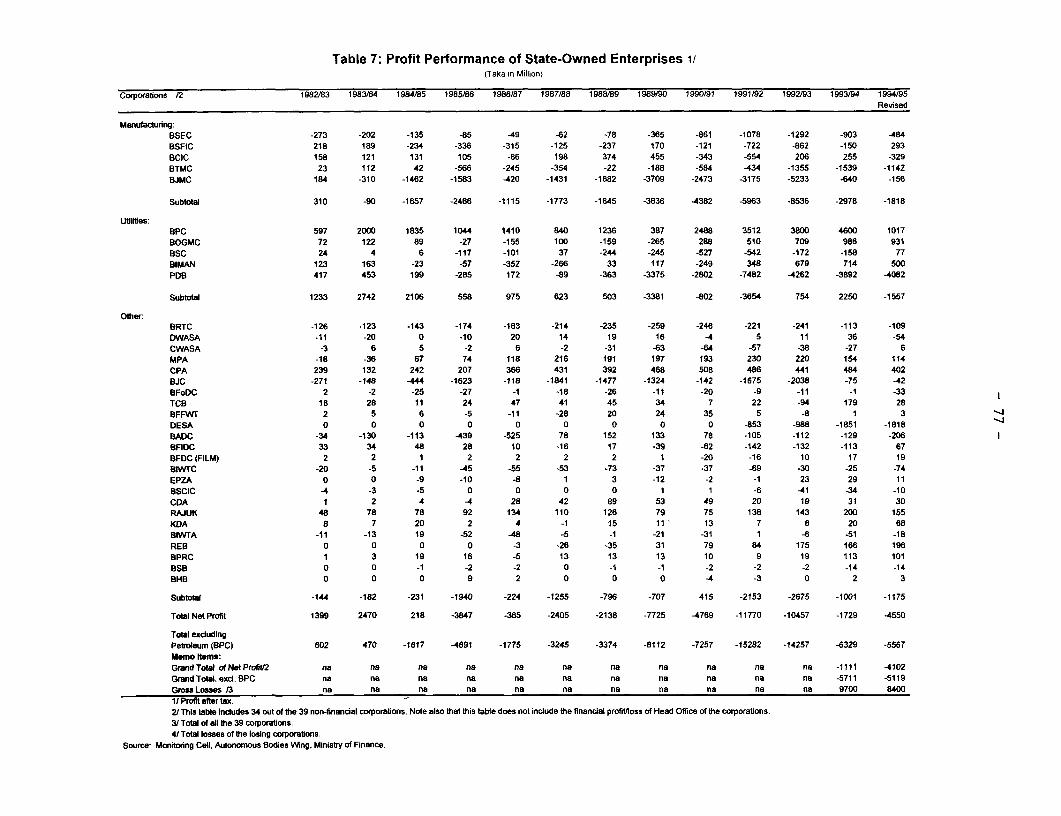
Table 7: Profit Performance of State-Owned Enterprises 1/(Taka in Million)
Corporations /2 1982/83 1983/84 1984/85 1985/86 1986/87 1987/88 1988/89 1989/90 1990/91 1991/92 1992/93 1993/94 1994/95Revised
Manufacturing:BSEC -273 -202 -135 -85 -49 -62 -78 -365 -861 -1078 -1292 -903 -484BSFIC 218 189 -234 -336 -315 -125 -237 170 -121 -722 -862 -150 293BCIC 158 121 131 105 -86 198 374 455 -343 -554 206 255 -329BTMC 23 112 42 -566 -245 -354 -22 -188 -584 -434 -1355 -1539 -1142BJMC 184 -310 -1462 -1583 -420 -1431 -1882 -3709 -2473 -3175 -5233 -640 -156
Subtotal 310 -90 -1657 -2466 -1115 -1773 -1845 -3636 -4382 -5963 -8536 -2978 -1818
Utilities:BPC 597 2000 1835 1044 1410 840 1236 387 2488 3512 3800 4600 1017BOGMC 72 122 89 -27 -155 100 -159 -265 288 510 709 986 931BSC 24 4 6 -117 -101 37 -244 -245 -527 -542 -172 -158 77BIMAN 123 163 -23 -57 -352 -266 33 117 -249 348 679 714 500PDB 417 453 199 -285 172 -89 -363 -3375 -2802 -7482 -4262 -3892 -4082
Subtotal 1233 2742 2106 558 975 623 503 -3381 -802 -3654 754 2250 -1557
OtherBRTC -126 -123 -143 -174 -183 -214 -235 -259 -246 -221 -241 -113 -109DWASA -Al -20 0 -10 20 14 19 16 -4 5 11 36 -54CWASA -3 6 5 -2 6 -2 -31 -63 -84 -57 -38 -27 6MPA -18 -36 67 74 118 216 191 197 193 230 220 154 114CPA 239 132 242 207 366 431 392 468 508 486 441 484 402BiC -271 -148 -444 -1623 -118 -1841 -1477 -1324 -142 -1675 -2038 -75 -42BFoDC 2 -2 -25 -27 -1 -18 -26 -11 -20 -9 -11 -1 -33TCB 18 28 11 24 47 41 45 34 7 22 -94 179 28BFFWT 2 5 6 -5 -11 -28 20 24 35 5 -8 1 3DESA 0 0 0 0 0 0 0 0 0 -853 -988 -1851 -1818BADC -34 -130 -113 -439 -525 78 152 133 78 -105 -112 -129 -206BFIDC 33 34 48 28 10 -16 17 -39 -62 -142 -132 -113 67BFDC (FILM) 2 2 1 2 2 2 2 1 -20 -16 10 17 19BIWTC -20 -5 -11 -45 -55 -53 -73 -37 -37 -69 -30 -25 -74EPZA 0 0 -9 -10 -8 1 3 -12 -2 -1 23 29 11BSCIC -4 -3 -5 0 0 0 0 1 1 -6 -41 -34 -10CDA 1 2 4 -4 28 42 89 53 49 20 19 31 30RAJUK 48 78 78 92 134 110 126 79 75 138 143 200 155KDA 8 7 20 2 4 -1 15 11 13 7 6 20 68BIWTA -11 -13 19 -52 -48 -5 -1 -21 -31 1 -6 -51 -18REB 0 0 0 0 -3 -26 -35 31 79 84 175 166 196BPRC 1 3 19 16 -5 13 13 13 10 9 19 113 101BSB 0 0 -1 -2 -2 0 -1 -1 -2 -2 -2 -14 -14BHB 0 0 0 9 2 0 0 0 -4 -3 0 2 3
Subtotal -144 -182 -231 -1940 -224 -1255 -796 -707 415 -2153 -2675 -1001 -1175
Total NetProfit 1399 2470 218 -3847 -365 -2405 -2138 -7725 -4769 -11770 -10457 -1729 -4550
Total exdudingPetroleum (BPC) 802 470 -1617 -4891 -1775 -3245 -3374 -8112 -7257 -15282 -14257 -6329 -5567Memo Items:GrandTotal ofNetProflt2 na na na na na na na na na na na -1111 -4102GrandTotal.exd.BPC na na na na na na na na na na na -5711 -5119GrossLosses /3 na na na na na na na na na na na 9700 84001/ Profit afer tax.2/ This table indudes 34 out of the 39 non-financial corporations. Note also that this table does not include the financial profitAoss of Head Office of the corporabons.3/ Total of atl the 39 corporations.4/ Total losses of the losing corporatons.
Source: Monitoring Cell, Autonomous Bodies W ng, Ministry of Finance.

- 70 -
Table 8: Bangladesh Medium-Term Scenarios, 1994/95-2002/2003
Est. Proj. Proj. Proj. Proj. Proj. Proj. Proj. Proj1994195 1995/96 1996/97 1997/98 1998/99 1999.'O000 2000/2001 2001.12002 200212003
(In pcrccnt orGDP; unicss othv,rwis speciried)
a. Low-grow-s scoiario
Real sectorRct; (3D)l', n-ia; prc-ntagc clu:,g;) 4.: '.2 5.0 5' r 5 0 5.0 ' ' I5GD!' Ic capit (tn U.S. dollarsj 26j.tU 29;.0 307.0 324.0 342.0 360.0 380.0 40U.0 422.0CPI (amnual perc-anLage changc) 8.9 9.0 9.0 9.0 9.0 9.0 9.0 9.0 9 0
Gross investment 4.6 14.9 15.0 15.2 15.3 15.4 15.5 15.6 15.7Private 7.6 7.7 7.8 8.0 S I 8.2 8.3 8.4 8.5Public 7.0 7.2 7.2 7.2 7.2 7.2 7.2 7.2 7.2
National saving 11.3 9.8 10.6 11.0 11.4 11.9 12.3 12.7 13.0Private ad public enterprises 11.6 9.6 10.1 10.4 10.6 11.0 11.3 11.6 11.8General governient -0.3 0.1 0.5 0.7 0.8 0.9 1.0 1.1 .1.2
Central governmncrt operationsTotal rcvcnue 11.2 10.9 11.2 11.3 11.4 11.5 11.7 11.S 12.0CGurrcnt cxpTenditurc 8.2 7.7 8.2 8.3 8.3 8.4 8.5 8.5 8.GFood account balance (+ dceicit) 0.6 0.6 0.2 0.2 0.2 0.2 0.2 0.2 0.1Annual Ievelopment Prograun 8.0 8.3 8.3 8.3 8.3 8.3 8.3 8.3 S.3Overall balancc -6.3 -6.5 -6.3 -6.3 -6.2 -6.2 -6. 1 -6.0 -5 9l:.\x.nal financing (tici) 4.5 3.9 3.9 3. 7 3.5 3.2 3.1 2.S 2.6I)ortiesic financiig (rie[) 1.8 2.5 2.4 2.6 2 7 3.0 3.0 3.2 3.2
IeXicrnal sectorCurrcent account balance -3.3 .5.1 -4.4 -4.2 3.93 .3.5 -3.2 -2.9 -2.7Gross oErncial reserves (niondis of iniports) 5.6 3.0 2.4 1.8 1.4 1.2 1.1 1.0 0.9
b. Rceform scenanrio
Reail sectorRcal CUP (annual percentage chtnge) 4 i 5.2 5.7 6.0 5.3 6.6 7.0 7.3 7 6GDI' per capita (in U.S. dollars) 265.0 283.0 301.0 321.0 343.0 367.0 394.0 425.0 459.0CPI (annual rerc=itagc change) 8.9 6 0 4.0 4.0 4.0 4.0 4 0 4.0
Gross investment 14.6 15 0 15.3 15.7 16.3 17.0 17.8 18.3 19.5P'rivate 7.6 S.5 8.5 8.7 9.2 9.8 10.5 10.9 12.1Public 7.0 6.5 6.8 7.0 7.1 7.2 7.3 7.4 7.4
National saving 11.3 10.2 11.9 12.5 13 3 14 1 14.9 15.5 16 8Privte awnd public cnwre.euis !1.6 10.0 10.9 11.0 11.1 i ;.3 11.6 11.5 12.3General governmcnt -0.3 0.2 1.0 1.5 2.1 2.7 3.4 4.0 4.6
CcnrraI governmnt operatio(1sTotal revenue. 11.2 11.2 11.6 12.0 12.5 13.0 13.5 140 14 5Currenlt cxpcnditurc 8.2 7.9 8.4 8.5 S.5 8.6 8.6 8.7 8.7Food account balance (+ dceicit) 0.6 0.6 0.0 0.0 0.0 0.0 0.0 0 0 0 0Annual Developmcnt PlrogramU 8.0 7.4 7.8 8.0 8.2 1 8 3 8.3 8 4 a 5OvCNrall balance -6.3 -5.6 .5.4 .5.3 S5.0 -4.7 -4.3 -3.9 -3.6External financing (nct) 4.5 4.1 4.1 3.9 3.7 3.4 3.2 3 1 2.9B)oniestic financing (net) 1.8 1.5 1.3 1.4 1.3 1 3 1.1 0.8 0 7
i x1enial sectorCurrntnl account balanc -3.3 -4.8 -3.4 -3.2 -3.0 -2.9 -2.9 -2.S -2.7Gross onficial rexsrves (moniths of imports) 5.6 4.0 3.9 3.8 3.8 3.7 3.7 3.7 3 6
Sources: Data provided by dtc Bangladesh authoritics: and staff estimtacs and projections.

Tablc 9 Bangladesih: Indicators of Fiscal Sustainability (Reform Scenario)
1988/89 1989/90 1990/91 1991/92 1992/93 1993/94 1994/95 1995/96 1996/97 1997/98 1998/99 1999/00 2000/01 2001/02 2002/03Est. Proj. Proj. Proj. Proj. Proj. Proj. Proj.
Foreign debt (% of GDP) 46.2 44.6 47.0 48.5 47.9 55.9 50.9 48.5
Domestic debt (% ofGDP) ... 5.8 6.8 8.7 10.1 13.4 13.0 13.3
Total debt (% of GDP) (b) 46.2 50.4 53.8 57.2 58.0 69.3 63.9 61.8
Real foreign interest rate (6.9) (2.0) (6.9) (3.1) (1.3) (2.7) (7.8) (4.7) (3.6) (2.6) (2.6) (2.5) (2.5) (2.5) (2.5)
Real domestic interest rate (1.8) 2.9 2.9 3.7 3.2 0.4 (4.1) (1.6) 1.2 2.8 2.9 3.0 3.0 3.0 3.0
Weighted real interest rate(r) (6.9) (1.4) (5.7) (2.1) (0.5) (2.1) (7.0) (4.0) (2.5) (1.3) (1.2) (1.1) (1.1) (1.0) (1.0)
Real GDP growth (g) 3.3 6.7 3.6 4.6 5.0 4.6 4.1 5.2 5.7 6.0 6.3 6.6 7.0 7.3 7.6
Weighted average "growth factor" (r-g) (10.2) (8. 1) (9.3) (6.7) (5.5) (6.7) (I1. ) (9.2) (8.2) (7.3) (7.5) (7.7) (8.1) (8.3) (8.6)
Seigniorage(%ofGDP)(s) 1.3 1.1 1.3 1.2 1.1 1.1 1.3 1.2 1.2 1.2 1.2 1.2 1.2 1.2 1.2
Primary fiscal deficit (% ofGDP) (p) 5.9 6.6 5.7 4.5 4.4 4.6 5.3 4.5 3.9 3.7 3.5 3.1 2.8 2.4 2.0
Sustainable primary deficit 6.0 5.2 6.3 5.0 4.3 5.7 8.4 6.9 6.1 5.4 5.3 5.2 5.2 5.2 5.1
Overall fiscal deficit (% ofGDP) 6.9 7.5 6.8 5.6 5.4 5.5 6.3 5.6 5.4 5.3 5.1 4.9 4.8 4.7 4.7
Net foreign financing (% ofGDP) 6.8 6.3 5.9 4.6 5.2 4.5 4.5 4.1 3.9 3.8 3.6 3.4 3.3 3.2 3.2
Net domestic financing (% ofGDP) 0.1 1.2 0.9 1.0 0.2 1.0 1.8 1.5 1.5 1.5 1.5 1.5 1.5 1.5 1.5

- 80 -
Table 10: Bangladesh: Fiscal and External Debt Sustainability, 1996/97 - 2002/03(in percent of GDP)
1996/97 1997/98 1998/99 1999/2000 2000/01 2001/02 2002/03Proj. Proj. Proj. Proj. Proj. Proj. Proj
Fiscal SustainabilityPrimary fiscal deficit(reform scenario) -3.9 -3.7 -3.5 -3.1 -2.8 -2.4 -2.0
SPD I -6.1 -5.4 -5.3 -5.2 -5.2 -5.2 -5.1SPD2/ -5.4 -4.5 -4.4 -4.1 -4.0 -3.8 -3.7SPD 3/ -4.9 -3.8 -3.5 -3.2 -2.9 -2.6 -2.4Primary fiscal deficit V -7.8 -3.6 -3.4 -3.3 -3.2 -3.2 -3.1SPD 5 -5.9 -5.2 -5.2 -5.2 -5.2 -5.3 -5.2
External Debt SustainabiltyReforn scenario (in percent) 6/
Debt/exports ratio 299.0 262.0 229.0 199.0 173.0 151.0 132.0Debt service ratio 11.1 10.0 9.0 8.1 7.2 6.1 6.0NPV of debt/exports ratio 158.0 139.0 121.0 106.0 92.0 80.0 70.0
Low-growth scenario (in percent) 7/
Debt/exports ratio 318.0 287.0 260.0 233.0 208.0 186.0 166.0Debt service ratio 11.3 10.4 9.6 8.9 8.1 7.0 6.3NPV of debt/exports ratio 168.0 152.0 138.0 123.0 110.0 99.0 88.0
1/ Sustainable primary deficit under the reform scenario.2/ Sustainable primary deficit with lowerGDP growth rate of 4 1/2 percent during the projection period.3/ Sustainable primary deficit with a lower GDP growth rate and higher interest rate during the projection period.4/ Prinary fiscal deficit with recapitalization of banks and financial assistance to public enterprises.5/ Sustainable primary deficit with recapitalization of banks and financial assistance to public enterprises.6/ Consistent with assumptions in the medium-term reform scenario.7/ Consistent with assumptions in the medium-term low growth scenario.
1. One way to determine the potential impact of fiscal reforn is to assess fiscalsustainability through analyzing the dynamics of public debt and the burden of future debtservicing. Fiscal sustainability can be assessed by relating the sources of deficit financinig andtheir costs to real GDPgrowth, using the equation:
Ab = (r - g)b + (p-s)Where Ab is the change in the ratio of government debt to GDP; r is the effective real interest rateon the debt; g is the is the real GDP growth rate; b is the ratio of public debt to GDP;p is thecentral government primary fiscal deficit; and s is the seigniorage revenue as a share to GDP.
2. The key factor is whethier the effective real interest paid on government debt is highier orlower than real GDP growth rate--the so called "growth factor" (r-g). If it is higher, the debt ratiowill tend to grow by feeding on itself as the government borrows to service the debt. In thissituation, even a modest primary fiscal deficit could result in an ever-growing debt to GDP ratio,which eventually would bring the long-term solvency of the public sector into question. If theeffective real interest rate is less than growth rate of GDP, there would be no long-term solvencyconstraint--at least in the sense that the debt would not grow forever. This is because the receiptfrom issuing new debt would always be more thani sufficient to service existing debt at the currentinterest rate without increasing the debt to GDP ratio.

- .,1 -
3. The analysis can also be extended to the examiniationi of fiscal sustainability over themedium term. It suggest that medium-term fiscal sustainability could be achieved under thereforn scenario. The critical assumptions here are (i) that the real GDP growth rate wouldincrease steadily to about 7 percent by thle end of the decade; and (ii) that interest rates on foreignfinanlcinig would remain low, implying that the share of foreign grants in total foreign finaniciligshould remaini. Any chaniges to either (i), (ii), or (i) and (ii) combined could significanitly affectthe level of sustaiiability. For instanice, assuming that the average real GDP growth rate were toremaini at 4 1/2 percent per annum--well below the projected path--over the medium term. thecalculated sustainiable primary-fiscal deficits woIild move close to projected primary deficits(Chart 3). There would be a similar outcomle if interest rates on foreign financinig were toincrease steadily to, say, 5 1/2 percent in nominiial terms by year 2002/2003 (still lower thaniprojected LIBOR). Withi both lower GDP growth and higher foreign interest rates, hiowever,fiscal policy would appear to become barely sustainiable starting year 1997/1998, implying thatfurther fiscal measures would be required thereafter to keep primary deficits within thesustainable range, or the debt/GDP ratio would increase.

Table I1: Bangladesh: Indicators of Fiscal Sustainability
(Assisting public enterprises and restructturing banks through issue of bonds) I/
1988/89 1989/90 1990/91 1991/92 1992/93 1993/94 1994/95 1995/96 1996/97 1997/98 1998/99 1999/00 2000/01 2001/02 2002/03
Foreign debt (% of GDP) 46.2 44.6 47.0 48.5 47.9 55.9 50.9 48.5 46.0 43.7 41.4 39.1 36.9 34.8 32.8Domestic debt (% of GDP) 0.0 5.8 6.8 8.7 10.1 13.4 13.0 13.3 17.6 17.7 17.6 17.5 17.1 16.5 15.7
Domestic debt (baseliine) ... 5.8 6.8 8.7 10.1 13.4 13.0 13.3 13.3 13.5 13.5 13.5 13.2 12.7 12.0Bank recapitalization 2/ ... ... ... ... ... ... ... ... 4.3 4.2 4.1 4.0 3.9 3.8 3.7Total debt (% ofGDP) (b) 46.2 50.4 53.8 57.2 58.0 69.3 63.9 61.8 63.6 61.4 59.0 56.6 54.0 51.3 48.5
Real foreign interest rate (6.9) (2.0) (6.9) (3.1) (1.3) (2.7) (7.8) (4.7) (3.6) (2.6) (2.6) (2.5) (2.5) (2.5) (2.5)Real domestic interest rate (1.8) 2.9 2.9 3.7 3.2 0.4 (4.1) (1.6) 1.2 2.8 2.9 3.0 3.0 3.0 3.0
Weighted real iiterest rate (r) (6.1) (1.4) (5.6) (2.1) (0.5) (2.1) (7.0) (4.1) (2.3) (1.1) (1.0) (0.8) (0.7) (0.7) (0.6)
Real GDP groNvwd (g) 3.3 6.7 3.6 4.6 5.0 4.6 4.1 5.2 5.7 6.0 6.3 6.6 7.0 7.3 7.6
Weighted average "growth [actor" (r-g) (9.4) (8.1) (9.2) (6.7) (5.5) (6.7) (11. 1) (9.3) (8.0) (7.1) (7.3) (7.4) (7.7) (8.0) (8.2)
Seigniorage (% of GDP) (s) 1.3 1.1 1.3 1.2 1.1 1.1 1.3 1.2 1.2 1.2 1.2 1.2 1.2 1.2 1.2
Primary fiscal deficit (% of GDP) (p) 5.9 6.6 5.7 4.5 4.4 4.6 5.3 4.5 3.9 3.7 3.5 3.1 2.8 2.4 2.0
Sustainable primary deficit 5.6 5.2 6.2 5.0 4.3 5.7 8.4 6.9 6.3 5.6 5.5 5.4 5.4 5.3 5.2
Overall fiscal deficit (% ofGDP) 3/ 6.9 7.5 6.8 5.6 5.4 5.5 6.3 5.6 5.7 5.6 5.4 5.2 5.0 4.9 4.9Net foreign financing (% of GDP) 6.8 6.3 5.9 4.6 5.2 4.5 4.5 4.1 3.9 3.8 3.6 3.4 3.3 3.2 3.2Net domestic financing (% ofGDP) 0.1 1.2 0.9 1.0 0.2 1.0 1.8 1.5 1.8 1.8 1.8 1.8 1.7 1.7 1.7
1/ Assiuning that the cential govenmnent will provide lk 43 billion of bonds to banks and Tk 20 billion to public enterprises.As a result, bQth the stock of domestic debt and interest paymenits will rise. However, the primary fiscal deficitof the central govemment will remain unchanged.
2/ Includes financial assistance to public enterprises.3/ From 1996/97, overall fiscal deficit includes projected interest paymenits oil goveminent bonds to recapitalize banks and public enterprises
(assuminig an average interest rate of 7 percent, 3 percentage points higiler than projected inflation rates)


CHAT I
BANGLADESH
SELECTED ECONOMIC INDICATORS, 1988/89-1995/96 1/(In percent, unlels otherwise specified)
GDP GROWTH 7 1 CONSUMER PRICE INTLUTIONoJ . _ .5^ 1( Aknnual rates of change) li
|. C11RLGV.R IAC 0 259OE N RDT2ltur s.o ud 0.2
56. .5.5 a7 .7
5.0 5.0 6 a
4.5 -i 4.5 45 5
4.0 II 4.0 4 33.58 35 2 2
3.0 F1LL L I _ _ _ _0_ ._ _ _ _ _ _
58/8 89/90 90/9 91/92 92/93 13/9 94/96 95/ 1.0 C 88/89 89/90 90/91 91/92 92/93 93/94 94/95 95/968.20 25 25
CEVNTRAND GOVESN I 16 BANE PUBLIC SAVND CRED l VE
la-Clapplt et of GDP) la4 (Anual rate of growth)
t (In percent 20 20
itdituread not knding 20 20
15. - 16bat-t~~~~~b h L ~~~~~~~~~~~~~~15 Broad money 15
14 14
10 ~~~~~~~~~~~~~~~~~10
la ~~~~~~~~~~~~~~~~12
10 i~~~~~~~~~~~~~~~~~~~~~~mus~ ~ ~ ~ ~ ~~ ~1
/~~~~~~ ~ Ii 1.5 6F~~~~~~~~~~~~~~~~~~~~~"49a/ o ° O49,5_o8/89 80/00 90/01 01/02 92/93 OS/9494O OS/06 4 88 00 0 0/29/39/4U9 95/
ITurNAL pror AID DISBURSEMENT 4/fiil ner"/ 2/ . s.c (In pInJuet of GDP) 8.0
4 (Inmo.thai 4 ~~~~~~~~~~~~~~7.5. 7.5
S/ xeudr oltlsons
7.0 - 7.00
-2 H IJ"H --2ii 6.5. 5.5
4 H ~~~~tacount 64 .0 6.0
4/ a(n pumnt of GDP) 5.5e 5.5
58/ 9/95 g5/96 68/89 89/90 90/91 91/92 92/93 93/94 94/95 95/96
16 ~~~~~~~~~16 8SAVING AND INVESTMEN PUBLIC SAVING AND INVSTMEENT
14. (In Pwoet Of GD?) 14 6o(n pwoet of GDP)6.~~~~~~~~~~~~~~~~
12. 12~~~~~~~~~I Investment
10 10
I SavIng 6/0 .
468/89-89/90 90/91, 91/92 92/9039 3/9494/959 5/06 -21 68/89- 89/90090/91, 91/92,92/93- 93/94 94/95, 9-5/796j
Sourcer. Data provided by the Bangladesh authorities; and staff wstimates.1/ 1995/96 data are staff estimates with policy masaursa.
2/Icudes goods and ervices.E/ xcludes official grants.
4/Includes official grantL.5/ efems to general governmnent saving.

CHART 2
BANGLADESH
CENTRAL GOVERNMENT OPERATIONS, 1988/89-1994/95(In percent of GDP)
5 5Tax revenue =Value added
_ _Customs4 m Other 4
3 3
2 2
1 1
0 988 819 8989 90 1990 91 1991 92 1992 93 1993 94 1994 95
9 ~~~~~~~~~~~~~~~~~~~~~~~9Epnditure c urn
8 ADP 8
7 7
8 ~~~~~~~~~~~~~~~~~~~~~~6
5 ~~~~~~~~~~~~~~~~~~~~~~~5
4 4
3 3
2 2
1 1
1988 89 1989 90 1990 91 1991 92 1992 93 1993 94 1994 95
Sour Data prowlded by tAe Bengladesh autherltles; and dan eetimats8
7Fi n'S Domestic 7o Foreign
6 ~~~~~~~~~~~~~~~~~~~~~~6
5 ~~~~~~~~~~~~~~~~~~~~~~~5
4 4
3 3
2 -2
C-1988/89-1989/g 91 0919121992/93 1993/94199 9
Sourcer Data provided by the Bangladesh authorities, and staff estmates.

CHAT 3
BANGLADESH
INDrCATORS OF FISCAL SUSTAINABILITY, 1988/89-2002/03
(In percent of GDP)
-2 Primary fiscal deficit -2
-3 -3
-4 --------------------------- -4
-5 -
-7 -7\ 'Primary fiscal deficit 4/
-9 -9
1988/89 1990/9 1 1992/93 1994/95 1996/97 1998/99 2000/01 2002/03Souroee Data provided by the Bangladesh authrities; and sttff estimates.1/ Sustainable primary defteit under reform scenario.2/ Sustainable primary deficit with lower GDP growth rate of 4 1/2 percent.3/ Sustainable primary deficit with a lower GDP growth rate and higher interest rate.4/ Primary fiecal deficit with recapitalization of banks and financial assistanceto public enterprises.5/ Sustainable primary deficit with recapitalization of banks and financial assistanceto public enterprises.

CHART 4
BANGIADESB
INDICATORS OF EXTERNAL DEBT SIJSTAINABILITY, 1988/89-2002/03
800 -- - - ----.- 22
i.eforin Scenario (in percent) 1/
500 _ c3 Debt/export ratio (left scale)1 [7 r -Debt service ratio(right scale) 18
I | \ ¢ ' uNPV of debt/export ratio(left scale)
400 r |
1 1 i' l g , -I j 13
300
1988/89 1990/9: 1992/93 1994/95 199o/97 1998/99 2000/01 2002/03
200 -- ______ --- ~ ~ 22r ~~~~Low-growth Scenario (in percent) 2/ z
0~~~~~~~~~~~~~~~~~~~~~~2
500 c Debt/export ratio (left scale) 8- Debt service ratio (right scale) 1\ NPV of debt/export ratio(left scale) la
40014
* ~~~~~~~~~~~~~~~~~~~~12300 1
2008
B
100 4
2
0 ;1988/89 1990/91 1992/93 1994/95 1996/97 1998/99 2000/01 2002/03
Sources: Data provided by Bangladesh authoriUes; and staff edtimate.1/ Consbitent with asumptione in the medium-term reform scenario.2/ Consitent with aumptions in the medium-tem low-growth scenario.


I MA( ING,
Report No: 15905 BIE)Type: ER,