Report No. 116 Effects of upland afforestation on water resources
58
Institute of Hydrology Report No. 116 Effects of upland afforestation on water resources The Balquhidder Experiment 1981-1991 N~ Las RIc Ca
Transcript of Report No. 116 Effects of upland afforestation on water resources

Institute ofHydrology
Report No. 116
Effects of upland afforestationon water resourcesThe Balquhidder Experiment 1981-1991
N~ Las RIc Ca

Report No. 116Second edition
Effects of upland afforestationon water resourcesThe Balquhidder Experiment 1981-1991
Edited by R C Johnson
May 1995
Institute of HydrologyCrowrnarsh GiffordWallingfordOxfordshireOX1O 8BBUK

© Copyright institute of Hydrology 1995
ISBN 0 948540 49 4 (revised edition)(Original 1991 edition ISBN 0 948540 29 X)
IH Report No. 116
published by the Institute of Hydrology
May 1995
British Library Cataloguing-in-Publication Data
A catalogue record for this book is available from the British Library

Foreword
This report on the results of the research carried changed, more detail is included in this secondout in the Balquhidder catchments is an updated edition. The section on water quality has beenversion of the original Institute of Hydrology omitted from this edition, because that analysisReport No. 116 produced in 1991. Further has been greatly expanded and is publishedanalysis was carried out following the original separately in a report to the Scottish Officepublication and, although no results have (Harriman & Miller, 1994).

Abstract
The effects of upland afforestation on water spatial variability of upland meteorologicalresources have been studied in two upland parameters which control evaporation rates;catchments, Kirkion and Monachyle, atBalquhidder in Highland Scotland. These 4. To determine, in typical Scottish Highlandcatchments are similar in orientation, area and conditions of climate, topography and soils,altitude range, but differ in detailed topography, the integrated effects of two different forms ofprecipitation amount and land use. The initial land use:objectives were: a. plantation forest
b. rough grazing1. To replicate and extend the Plynlimon study on streamflow, sediment and nutrient load-
on the effects of upland afforestation on water ings, thereby determining the effects ofresources into Highland Scotland where the afforestation on the quantity and quality ofindigenous vegetation, typically coarse upland water resources.grasses and heather, is aerodynamicallyrougher than the short cropped grass found Results of the catchment monitoring and sitein Wales and the distribution and type of process studies are reported. The land-useprecipitation is also different; changes - afforestation in the Monachyle and
clearfelling in the Kirkton - are assessed in2. To develop and improve applied terms of their impacts on catchment water
evaporation models for upland areas; yields, stream flows and sediment loads.Analysis is carried out using standard tech-
3. To determine the seasonal differences in niques and existing models, and a model isevaporation rates, mcluding snow conditions, developed of the effects of land-use change onbetween forest, heather and grass, and the streamflow.
Acknowledgements
Local cooperation from the community at The Balquhidder experiment is funded by aBalquhidder has been invaluable. Particular consortium of interested bodies. The Institute ofthanks must be given to the private landowners Hydrology would hke to thank the members ofand the local Forestry Commission officers who this consortium, who have included the Scottishhave assisted with our research. Their names Development Department, Department of theare listed below in acknowledgement. Environment, Natural Environment Research
Council, Forestry Commission, Water ResearchMonachyle west: Mr R. Gauld, Mr R. Lewis. Centre and the North of Scotland Hydro-ElectricUpper Monachyle: Mrs J. Bowser. Board.Monachyle east: Mr R. Gauld, Mr G. Cummins.Kirkton west: Mr D. McDiarmid, Mr R. Brown. The support of Strathclyde Regional Council,Kirkton east: Mr P. Ferguson, Mr C. Methven. Central Regional Council, British WaterwaysForestry Comrission District Managers Board, Forth River Purification Board and theMr D. McAskill, Mr B. Roebuck, Mr D. Howat, Meteorological Office is also acknowledged.Mr K. Wilkinson.

ContentsPage
Executive Sunmmary
1 Introduction
1 .1 Development of research into the effects of forest 11.2 Forestry in Scotland and the need for research catchments 2
2 The Balquhidder catchments, Instrument networks and data base 4
2.1 The physical characteristics of the Balquhidder catchments 42.2 Catchment instrumentation and networks 72.3 Catchment database 72.4 Precipitation variations in the Balquhidder catchments 72.5 Streamflow in the Balquhidder catchments 112.6 Errors in precipitation and streamflow measurements 132.7 1983-89 Precipitation in an historical perspective 15
3 Site studies of interception and transpiration rates 16
3,1 The seasonal water use of upland grass 163.2 Forest interception 18
4 Modelling the impacts of land-use change 21
4.1 Process model of catchment evaporaton (THISTLE) 214.2 A land-use model to estimate streamSfow 244.3 Topographic model for streamflow analysis (TOPMODEL) 284.4 Streamflow separation model (IHACRES) 31
S Catchment evaporation 35
5.1 Annual catchment water balance 355.2 Penman potential transpiration estimates 365.3 Development of the Calder-Newson water-use model 385.4 Impact of land-use change on water resources 40
6 Iluvial sediment studies 43
6.1 Sediment sources within the Balquhidder catchments 446.2 Bedload 446.3 Suspended sediment 446.4 Sediment loads 45
7 Conclusions 47
References 48
Contents of Balquhidder Special Issue of journal of Hydrology . 51

Executive Summary
This report summarises work on the effects of Monachyle, the more westerly catchment, is theupland afforestation on water resources, carried wetter (it receives some 18% more precipitationout by the Institute of Hydrology in the two than Kirkton). It was initially under heather/grassBalquhidder catchments between 1981 and moorland, but 14% of the Monachyle catchment1991. The pro]ect has been managed by a has now been planted with trees. Kirkton startedconsortium of interested bodies, including the with a 40% cover of mature forest, with theScottish Office Environment Department, upper slopes under rough grazing and smallDepartment of the Environment, Natural areas of heather. Half of the forest cover hasEnvironment Research Council, Forestry now been clearfelled.Commission, Water Research Centre, ScottishHydro-Electric and Strathclyde and Central 2. These catchments were chosen becauseRegional Councils. access is easy, they provide an opportunity to
study differences between afforested and non-afforested catchments in Highland Scotland and
Objectives of the Research they receive a high proportion of snow in thewinter precipitation.
The initial objectives were:3. Instrumentation in the catchments comprises
1. To replicate and extend in Highland Scotland networks of precipitation gauges, three streamthe study begun at Plynlimon in Mid-Wales gauging structures, six automatic weatherinto the effects of upland afforestation on stations and sites for studying forestwater resources - the indigenous interception, upland grass evaporation andvegetation, typically coarse grasses and snow and soil moisture storage. There are alsoheather, is aerodynamically rougher than the sites for monitoring water quality (streamwatershort-cropped grass found in Wales and the solutes, invertebrate communities, fishdistribution and type of precipitation is also populations and sediments).different;
2. To develop and improve applied Site process studiesevaporation models for upland areas; '
1. An upland grass site was instrumented with3. To,determine the seasonal differences in, two lysimeters, soil moisture access tubes and
evaporation rates, including snow conditions, inicro-meteorological equipment to recordbetween forest, heather and grass, and:the continuously the water use of grass freelyspatial variability of upland meteorologidal supplied with water and to provide estimates ofparameters which control evaporation rates; the Penman potential evaporation, Et. Results
have been developed into a seasonal grass4. To determine, in typical Scottish Highland water use model. The main conclusions were
conditions of climate, topography and soils, that th' grass becomes dormant in the winterthe integrated effects of two different forms of and water use increases from 0.5 of Et in lateland use: spring to E, in summer, giving an annual grass
a. plantation forest . evaporation of around 0.75 of the E, value.b, rough grazing
on streamflow, sediment and nutrient load- 2. Results from a forest interception site showedings, thereby determining the effects of that the mean interception loss from the treesafforestation on the quantity and quality of was 28% of the precipitation. The throughfallupland water resources. and stemflow components of the net precipi-
tation were 97% and 3% respectively. Acompanson with other studies in the UK
The Balquhidder catchments suggested that these proportions vary with age,throughfall increasmg and stemflow decreasing
1. The two catchments, Monachyle and Kirkton, from around an age of 10 to 15 years.are in the Balquhidder Glen, 60 lan north ofGlasgow. They are similar in orientation, area 3. Analysis and intercomparisonsTof the dataand altitude range, but differ in their detailed from .the individual automatic weather stationstopography, precipitation and land use. shoWed that the Penman potential-evaporation
vi

(E,) values from the high altitude, exposed sites Streamflow effectswere significantly greater than those from thevalley bottom sites. The higher radiation and 1. To convert the water use estimates intowind speed values at the high altitude sites were predictions of streamfLow pattems, the THISTLEthe major factors responsible for increasing the model parameters were incorporated into aE, values outweighing the effects of lower version of the IH Land-use Model. This lumpedtemperatures and humidity deficits. conceptual model was calibrated on data from
the 1985 period, prior to the land-use changes,with the Monachyle volume flows reproduced to
Catchment water use within 0.7%, and daily flows with an explainedvariance of 90%. The model was then used to
1. The water balance results showed that mean predict flows from the catchments over theannual water use (1983-89) from the predomin- period 1986-89 assuming that no changes hadantly heather and grass Monachyle catchment, taken place. Comparison of these predictedwas 621 mm (22% of the precipitation), higher flows with the observed flows suggested that nothan the Penman potential evaporation estimate, significant changes in total flow occurred in theEt (551 mm), whilst the mean annual value for Monachyle catchment in the immediate after-the predominantly forest and grass Kirkton math of the planting of 14% of it in 1986, but thatcatchment, 423 mm (17% of the precipitation), there was a small increase in flow from thewas lower than the E, estimate (484 mm). Use of Kirkton as a result of felling some 50% of thesimple annual evaporation models suggested forest during the period.that the differences in evaporation measuredbetween the catchments could be explained 2. Two models developed elsewhereprimarily by (a) the different vegetation types, (TOPMODEL and IHACRES) were applied to the(b) the higher precipitation in the Monachyle, catchments to investigate their streamflowand (c) the different altitudinal distributions of response characteristics. Both suggested thatvegetation types in the two catchments. In the the catchments had significantly differentKirkton, grass (Low evaporation) dominates the responses to precipitation inputs, with theupper, wetter altitudes with forest (high Monachyle being the 'flashier' of the two, butevaporation) at the lower, drier altitudes. In the neither model could detect any significantMonachyle grass dominates at the lower change in response characteristics in thealtitudes with heather (high evaporation) Kirkton immediately after the felling operations.dominating at the upper altitudes. Any changes IHACRES detected no change in the Monachylein the water use resuLting from the planting of response after the planting operation, whilst14% of the Monachyle and the progressive TOPMODEL identified some change in thefelling of half of the forest area in the Kirkton are transmissivity profile but no overall change innot yet detectable from the annual water the ratio of subsurface to rapid response flow,balance data.
2. A suite of sophisticated water use models Forestry and water resources(THISTLE) was developed from process studiescarried out at Balquhidder and at other sites in The effects of the different land-use evaporativeScotland. Application of these models to the regimes on low flows and catchment yield wasBalquhidder catchments indicated a mean investigated by using standard modelling andannual water use of the Monachyle (1984-89) of flow analysis procedures, The IH Land-use521 mm, exceeding E, for the same period Model described above was applied to a(474 mm) but some 16% lower than the water simulated 25-year rainfall series to give dailybalance estimate (622 mm). For the Kirkton the flow sequences for each catchment, eachmodels estimated the water use as 562 mm, sequence representing the response of a foresthigher than E, (474 mm), but some 40% higher cover ranging from 0% to 100%.than the catchment water balance estimate(404 mm). These apparent discrepancies must 2. The simulation runs of the calibrated modelbe viewed against the uncertainties associated indicated that with increasing afforestation inwith each approach: the possible errors in the both catchments: (a) the mean flow willmeasurements of precipitation and streamfLow, decrease, (b) the flow duration curves will shiftand any errors in the assumptions incorporated down, and (c) the annual mmimum flows will bein the models and in the E, values on which they reduced.operate. The estimated error bands for bothapproaches overlapped in each case, but the 3. Reservoir storage yield curves computeddifferences were in the opposite direction in the from the simuLated streamfiow sequencestwo catchments. indicated a decease in yield from each catch-
vii

ment as the forest area, and therefore the that no changes have occurred since the startevaporation, increases. The size of reservoir of the clearfelling although monitoring in oneneeded to sustain a given yield from a catch- clearfelled tributary has indicated a doublingment increases as the area of mature forest of nitrate concentrations and a significantcover increases. reduction in chloride levels since clearfelling
started. Fish populations have beenunaffected below the clearfelling but have
Water quality declined significantly in an upper reach. Thisdecline is considered to be due to forest
1, Stream water chemistry and aquatic biota debris blocking the narrower upper reachhave been monitored in both catchments and preventing the movement of fry fromthroughout the period of land-use change. The elsewhere.results are presented in a separate report: thesignificant results are 2. Sediment discharge increased in both catch-
ments since 1986 when the land use changeda, The Monachyle stream supports a healthy and the annual precipitation increased. Most of
population of fish and mnvertebrates, includ- the load was in suspension; concentrations ining low numbers of some acid-sensitive the low flows increased proportionally morespecies. Chemical studies indicate that the than in the high flows. Sediment yieldsstream is likely to be sensitive to any further increased to 312% of former levels in theacidification. To date there have been no Monachyle and 818% in the Kirkton. Theobvious chemical and biological changes increases resulting solely from the land-usefollowing ploughing and planting of the changes were estimated to be 121% for thecatchment. Monachyle catchment (pre-afforestation
ditching) and 595% for the Kirkton (roadb. The Kirkton catchment has a small outcrop of maintenance and use). The increases in
limestone in the headwater region, providing suspended sediment load did not appear toa source of relatively alkaline water. Chemic- have had any effect on streamwater biology oral monitoring in the main stream has shown chemistry.
viii

1 Introduction
The Balquhidder catchments study was water engineers has become a constructiveestablished in 1981 by the Institute of Hydrology working situation: this is illustrated by theto study the effects of forestry on water development of jointly produced documentsresources in the central Highlands of Scotland. such as the Forests and Water GuidelinesTen years of research have achieved a number (Forestry Commnssion, 1988).of important results which are of significance tothe forestry, hydroelectric and water resources Of paramount importance is the need to main-industries as well as to hill farming, nature tain a plentiful supply of good, clean water toconservation and the general sustainability of domestic and industrial consumers. The uplandsthe UK uplands. This report summarises the form the main source of water in Bntain andresults from the analysis of the first ten years of provide high-quality supplies to the majorthe catchment data, from the process studies consumers in the lowlands. The impacts of anyand from comparison with results from other UK potential changes in land use in the uplandsstudies. It complements the selection of papers must be fully understood and evaluated beforeon the Balquhidder study published in the May they are implemented. This is the main purpose1993 Special Issue of the Joumal of Hydrology. of the research at Balquhidder, in the headwater
catchments of the River Forth, where afforest-The demand on water resources in Britain ation has been widespread and where there areincreased from early in the 19th century as a still more demands for future forestryresult of industrial development and nsing development.standards of living. This continued into the 20thcentury, but in the late 1970s the increase in 1.1 Development of research into thedemand slowed down, mainly because of effects of forestsreduced industrial requirements associated witha national economic recession. Expansion of Much of the early research into the effects offorestry in Bntain had been taking place since forests concentrated on changes in the annualthe inception of the Forestry Commission in water yield resulting from deforestabon (Bosch1919. Much planting was carried out after the & Hewlett, 1982). In Europe and the USA smallFirst World War to make good the reduction in catchment studies were carried out in a range ofthe timber stocks and to reduce the country's climatic conditions. Even though the differentdependence on imported timber, although it precipitation regimes resulted in some largewas not until after the Second World War that variations between the catchments, there was alarge-scale plantation forestry really expanded consistent pattern of increased annual stream-in upland Britain. flow after deforestation. At Wagon Wheel Gap in
southern Colorado, USA, clearfelling of oneArguments can be put forward that afforestation catchment resulted in an increased streamflowwill eventually return the countryside to its of 30 mm year-' which is 6% of the precipitationnatural wooded state (although mainly with (Bates & Henry, 1928) and at Coweeta in Northexotic species) and that imports of timber must Carolina, USA, clearfelling increased the meanbe reduced for the sake of the national econ- stormflow and peak flows by some 15% (Swankomy. Over the past 40 years however, research & Crossley, 1988).in British upland catchments has mcreasinglydemonstrated that evaporation rates from The numerous catchment studies which haveconifers are greater than for shorter vegetation been undertaken were considered necessarytypes (Calder, 1990; Blaclie & Newson, 1986). because of the range of climates, catchmentThis results in a reduction of the water resource characteristics (geology, soils, topography, etc.)in a forested catchment. Conifer plantations also and the range of forest management beingaffect the quality of the water, with increases in applied. Although these catchment studiessediment loads (Soutar, 1989), increasing proved invaluable the results could only be fulLyacidification of the surface waters (Homung et interpreted and applied following the addition ofal., 1987) and reductions in fish populations further studies to look at the processes taking(Harriman et a]., 1987) all being observed. The place within the catchments. This also enabledforestry industry is aware of these potential new forestry techniques to be studied such asproblems and is prepared to compromise in the the strip harvesting at Hubbard Brook m Newinterest of the water resource. What once Hampshire, USA (Hornbeck, 1975).looked like a conflict between foresters and

In the UK the water gathering grounds were catchment were lower than the grasslandoften in remote areas where sheep farming was catchment for small events but similar for thethe traditional land use. These areas were the larger events. The baseflows, controlled bymajor source of water for the more densely catchment geology, did not vary with differentpopulated and industrial lowlands. Water surface vegetation cover.supplies were reliable, with high rainfall andstreamflows. There were few sources of 1.2 Forestr in Scotland and the needpollution and reservoir construction was often a 1 restrch catlant hfeasible way to regulate the supply of water for f research catchmentsconsumption and hydroelectricity generation. Recently published figures imustrate the relative
positions of forestry and water resources inEarly research efforts in the UK into the impacts Scotland: of the 915,000 ha of land in Britainof plantation forestry concentrated on the which is afforested, 60% is in Scotland (Forestrychanges in runoff from upland catchments. The Commission, 1989), while mn the Strathclydepioneering work of Frank Law at Stocks Region alone there are 75 (52%) water supplyReservoir in Lancashire (Law, 1956) first showed catchments containing some forestry (Greene &that there was an increased water use by trees Taylor, 1989).compared to grassland. The result was obtainedfrom a lysimeter experiment in the catchment Opinion in Scotland up until the 1970s was thatand showed that the conifer forest had an water was in plentiful supply, with higheradditional evaporation loss of 290 mm per year precipitation and lower evaporation than incompared to the grassland. Law estimated this England and Wales. However, as Calder &to represent an annual loss in revenue to the Newson (1980) pointed out, an increase inwater company of some £500 ha-'. This result evaporation because of afforestation wouldwas sufficiently convincing to initiate further result in a greater volumetric loss of water fromstudies into the physical processes of Scottish supply catchments, The water supphersevaporation from vegetation and the assessment and hydroelectricity generators were concernedof water balances in catchments with different not only about the annual water balance but alsoclimates, topography and land uses, about seasonal effects, especially in years of
summer drought. Clarke & Newson (1978)In 1966 the Coalbum catchment study was illustrated this using hypothetical reservoirestablished in northem England where the storage and streamflows, simulating the effectshydrology of a single catchment was monitored of afforestation, to indicate the possible effects offor five years before any pre-planting drainage an extreme (1000-year) drought on reservoirand afforestation were carried out (Robinson et water levels if land-use changes were notal., 1993). Results from this study have shown considered in the management of the resource.that there was an initial increase in runofffollowing the drainage. As the trees developed, The concern in the late 1970s was about how tostreamflow decreased, but even after 20 years it continue expanding the forestry industry inremained at or above the pre-planting levels. Scotland without detriment to water resources,The drainage also resulted in large initial and whether the water balance results from thesediment yields and storm peaks. Plynlimon research catchments in mid-Wales
could be applied to Scotland. To answer theseIn 1968 two catchments on Plynlimon in central questions it was decided that a major researchWales were selected for detailed catchnent , study was required in Scotland with theresearch. One catchment, the Wye, was sheep following objectives:pasture; the other, the Severn, was 62%covered with forest. Early results from 1. To replicate and extend the Plynlimon studyPlynhmon (Calder & Newson, 1979) confirmed on the effects of upland afforestation on waterthose of Law with the water use of the Sevem resources into Highland Scotland where thecatchment (adjusted to 100% forest cover) being -indigenous vegetation, typically coarse21 % of the rainfall greater than the Wye grasses and heather, is aerodynamicallycatchment. Previous studies demonstrated that it rougher than the short cropped grass foundis rainfall interception and transpiration by the in Wales and the distribution and type oftrees which leads to the increased water use in precipitation is also different;forested catchments and so to reductions instreamflow, 2. To develop and improve applied evaporation
models for upland areas;The Plynlimon study also showed significantdifferences between the catchmnents in the 3. To determine the seasonal differences instream responses. Flood peaks in the forested evaporation rates, including snow conditions,
2

between forest, heather and grass, and the Two catchments at Balquiidder in Centralspatial variability of upland meteorological Scotland were selected which had physicalparameters which control evaporation rates; similarities but supported different land uses:
one was a moorland catchment, the other was4. To determine, in typical Scottish Highland partially (42%) forested. With the cooperation of
conditions of climate, topography and soils, the private landowners, as well as the agree-the integrated effects of two different forns of ment of the Forestry Commission to delay anyland use - (a) plantation forest, and (b) planting and clearfelling for five years, and therough grazing - on streamfiow, sediment backing of a funding consortium (Blaclhe, 1987),and nutrient loadings, thereby determining fieldwork began in 1981,the effects of afforestation on the quantity andquality of upland water resources,

2 The Balquhidder catchments,instrument networks and data base
2.1 The physical characteristics of the Table ] Catchmnent dimensionsBalquhidder catchmnents
The Balquhidder catchments, Kirkton and Monachyle KlrktonMonachyle, lie 60 km north of Glasgow in the Length, km 3.71 3.32Grampian Mountain range, also referred to asthe southem or central Highlands of Scotland Width, km 2.82 2.72Qohnson & Law, 1992). The two catchments (see Orientation, degrees 006 343Figure 1) are on the north side of the mainBalqubidder glen (OS Grid Reference NN5020), Area, knrm - plan 7.70 6.85a deeply glaciated valley which contains the two surface 8.08 7.34lochs, Voil and Doine. A small catchment, GlenCrotha, separates the Kirkton and Monachyle Altitude, m - median 470 540catchments by 2 lan. maximum 906 852
The catclments are south facing, with an area of minimum 292 2426.85 km2 for the Kirkton and 7.70 km2 for theMonachyle (Table 1). The Upper Monachyle, a Mean slope, degrees 15.8 19.9sub-catchment in the Monachyle, has an area of Drainage density, km km2 3.8 5.12.24 kin 2 and forms a northern lobe of the maincatchment. The altitude of the catchment ouffallsis 242 m (Kirkton) and 292 m (Monachyle); the proportion of higher altitude land, with a medianmaximum altitude is 852 m and 906 m altitude of 540 m; the Monachyle's medianrespectively. The Kirkton has the greater altitude is 470 m. The Kirkton is also the steeper
r - Monachyle catchment /x WEIR( ,_ / \ .RAINGAUGE
; / f X / \ al AUTOMATIC BaiQuhidder/ | X / \ / | WEATHEn STATION
UPPER M A I V
/ * . \ I J Kirkton catchment
- -- V - 2 0 20Balquhidder - -
\\toIoYl0, ___-LCG-<R
FIgure 1 The Monachyle and Kirkton catchments showing the main nstrument networks
4

total area of new drainage was 45 ha. or 6% of in more suitable conditons, i.e. a straight, lowthe total catchmnent area. Drainage lines, 20 to gradient reach, precluded the need for30 cm deep, were perpendicular to the independent calibration.contours; shallow-gradient cut-off drains, 60 cmdeep, were dug where necessary. To cope with the harsh working environments,
the stage measurements, obtained using floatThe subsequent planting covered an area of sensing systems, are backed up by pressure111 ha, or 14% of the total catchment area. transducers for icing conditions, while
secondary loggers safeguard the loss of datathrough battery failure. Water levels are sensed2.2 Catchment instrumentation and at ten-second intervals, converted to flow ratesnetworks and integrated to give the flow volume in eachquarter of an hour.
The main instrument sites are shown on thecatchment map, Figure 1. Six Didcot automatic weather stations (AWS)
(Strangeways, 1976) have been used in theThe measurement of precipitaton has been catchments, two at high altitudes, three at lowdiscussed in detail in previously published altitudes and one outside both catchments at areports and papers Tohnson, 1989; Johnson et very low altitude Johnson & Simpson, 1991).al., 1990) so only a brief description is given Their locations were determined by altitude,here. The main type of raingauge used is the vegetahon and exposure. Seven parameters areground-level gauge, installed with its rim monitored: radiation (solar and net), tempera-parallel to the slope. For snowfall, standard ture (dry and wet bulb), wind (speed andgauges, with corrections for gauge exposure, direction) and rainfall. From these measure-tall snow gauges and snow surveys are used ments, estimates of the potential evaporation (E,)depending on the amount of snow accumulation. are derived (Penman, 1948).
The gauge networks were designed using a The storage of water and snow in the catch-domain principle, where domains are deter- ments is very difficult to determine. Soil moist-mined by homogeneity of altitude, aspect and ure is measured at four key locations in theslope. Twelve gauge sites in each catchment are catchments using a neutron probe (Bell &used. Time distribution of the montily-read McCulloch, 1969). The sites are on the main soiltotals is achieved using the gauges at the auto- and vegetation types and comprise a total of 24matic weather station sites and from a daily read access tubes down to depths of 2 m. Snowstandard gauge at Tulloch Farm. Catchment storage is estimated manually by dailymean values have been calculated by the observations of the snow line supplemented byarithmetic mean of the 12 gauges, weighting the depth and density readings when and wheregauge catches by the area of the domain and by possible. Groundwater storage is not measuredconstructing isohyets and weighting the mean but can be estimated using within year waterrainfall between isohyets by the area between balances.the isohyets. Little difference was foundbetween these three methods as illustrated inJohnson et a]. (1990) where rainfall, calculated 2.3 Catchment databasefor the Kirkton catchment in 1986, showed a The data collected from the instrument networksdifference of less than 2% for monthly values has been organised into databases so thatand 1 % for the annual values. quality control procedures and accessing can
easily be carried out. Data collection from theStreamfiow is measured at three places in the various networks started at different times butcatchments: at the outfalls from the Knrkton and 1983 is the first year with complete flow andMonachyle catchments and from the Upper rainfall data. Table 3 lists the long-term andMonachyle sub-catchment. Crump weirs are short-term networks from which data areused at the main catchment sites with a flat V- available. Many discussions of data collectionweir at the Upper Monachyle (ohnson & and quality control procedures have beenHudson, 1987). The use of Crump weirs in these published: where applicable the references aremountain streams is taking these structures listed.beyond their design limits for stream steepness,uniformity of flow and minimum measurable The main components of the Balquhidderstage (British Standards Institution, 1969) and it database are the precipitation and streamflowwas necessary to determine empirical rating records. These are presented in Table 4 ascurves using current meters (Hudson et a]., monthly totals for the two main catchments and1990). The siting of the Upper Monachyle weir also for the Upper Monachyle sub-catchment.
7

Table3 ComponentsoftheBalqulhiddercatchmentdatabase
Component Number of sites Relevant reference
Long-term data base:
Precipitation 25 Johnson et al, 1989Johnson, 1989Johnson at al, 1990
Streamflow 3 Roberts, 1989Johnson & Hudson, 1987Hudson etal, 1990
Automatic weather stations 6 Roberts, 1989Johnson & Simpson, 1991
Manual weather station 1Snow RegionalSoil moisture 4Suspended sediment 2 Johnson, 1988Bedload 2Streamwater solutes 8 Harriman & Miller, 1994Precipitation quality 1 Devenish, 1986Freshwater biology 5 Harriman & Miller, 1994
Short-term data from site studies:
Forest interception 1 Johnson, 1990Grassland water use 1 Wright, 1990Nutrient cycling 3 Harriman & Miller, 1994Sediment sources Many Stott, 1987Bedload movement Many Drew, 1991
Table 4 Monthly totals ofprecipitation (P) and streamflow (Q) for the Monachyle, Upper Monachyle and Kirkton
catchments
Monachyle Upper Monachyle Klrkton
P Q P P 0
1983 J 522,6 437.4 556.0 ..... 433.2 333.7F 89.2 38.9 132.7 ..... 87.3 63.5M 247.1 259.8 294.5 . . 209.0 191.3A 76.4 59.7 74.0 . . 96.9 71.8M 172.2 113.8 168.5 . . 137.5 96.5J 94.7 56.4 91.9 . . 83.8 80.1J 32.8 6.5 , 29.8 .... 40.6 19.5A 46.9 4.1 43.2 ..... 45.1 12.0S 332.1 172.1 322.2 *... 291.3 143.7O 524.8 430.9 525.9 . . 416.7 354.2N 108.5 85.9 104.7 . . 95.8 83.7D 412.2 362.8 491.4 ..... 343.4 291.5
Total 2659.5 2028.3 2834.8 **** 2280.6 1721.5
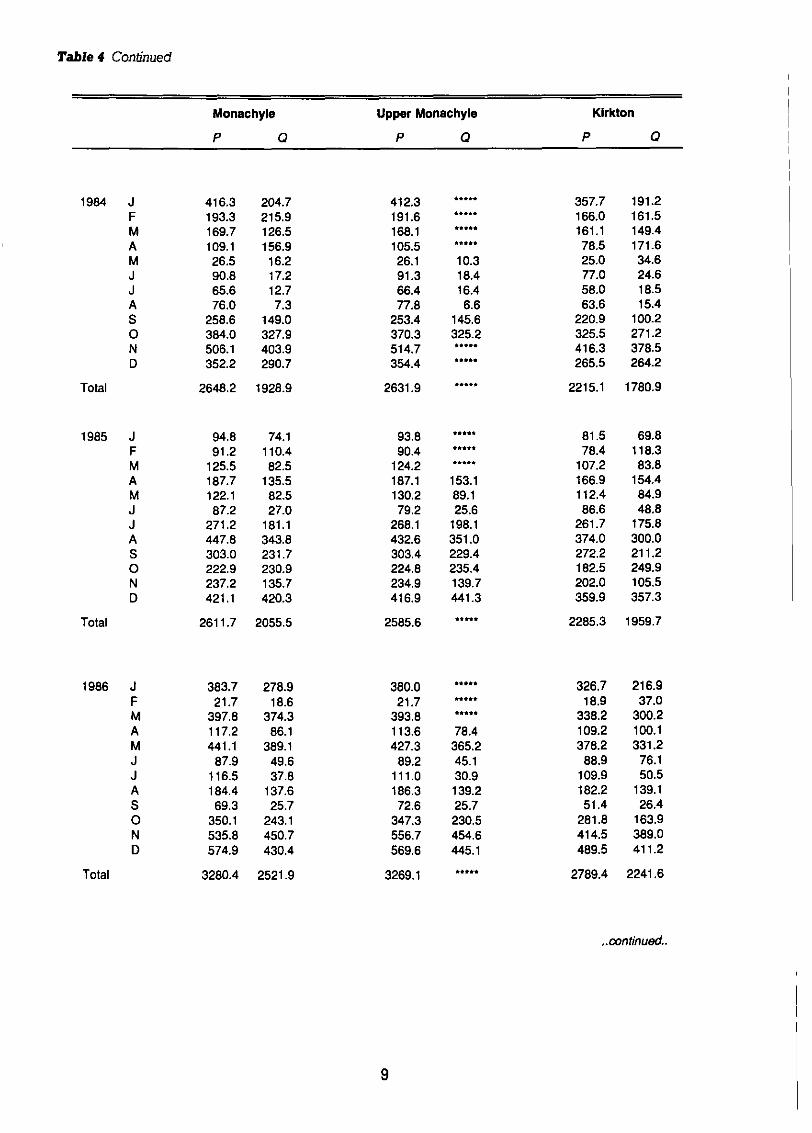
Table 4 Continued
Monachyle Upper Monachyle Kirkton
P O P O P O
1984 J 416.3 204.7 412.3 ..... 357.7 191.2F 193.3 215.9 191.6 ..... 166.0 161.5M 169.7 126.5 168.1 ..... 161.1 149.4A 109.1 156.9 105.5 ..... 78.5 171.6M 26.5 16.2 26.1 10.3 25.0 34.6J 90.8 17.2 91.3 18.4 77.0 24.6J 65.6 12.7 66.4 16.4 58.0 18.5A 76.0 7.3 77.8 6.6 63.6 15.4S 258.6 149.0 253.4 145.6 220.9 100.2O 384.0 327.9 370.3 325.2 325.5 271.2N 506.1 403.9 514.7 ..... 416.3 378.5D 352.2 290.7 354.4 ..... 265.5 264.2
Total 2648.2 1928.9 2631.9 ..... 2215.1 1780.9
1985 J 94.8 74.1 93.8 ..... 81.5 69.8F 91.2 110.4 90.4 ..... 78.4 118.3M 125.5 82.5 124.2 ..... 107.2 83.8A 187.7 135.5 187.1 153.1 166.9 154.4M 122.1 82.5 130.2 89.1 112.4 84.9J 87.2 27.0 79.2 25.6 86.6 48.8J 271.2 181.1 268.1 198.1 261.7 175.8A 447.8 343.8 432.6 351.0 374.0 300.0S 303.0 231.7 303.4 229.4 272.2 211.2O 222.9 230.9 224.8 235.4 182.5 249.9N 237.2 135.7 234.9 139.7 202.0 105.5D 421.1 420.3 416.9 441.3 359.9 357.3
Total 2611.7 2055.5 2585.6 ..... 2285.3 1959.7
1986 J 383.7 278.9 380.0 ..... 326.7 216.9F 21.7 18.6 21.7 ..... 18.9 37.0M 397.8 374.3 393.8 ..... 338.2 300.2A 117.2 86.1 113.6 78.4 109.2 100.1M 441.1 389.1 427.3 365.2 378.2 331.2J 87.9 49.6 89.2 45.1 88.9 76.1J 116.5 37.8 111.0 30.9 109.9 50.5A 184.4 137.6 186.3 139.2 182.2 139.1S 69.3 25.7 72.6 25.7 51.4 26.4O 350.1 243.1 347.3 230.5 281.8 163.9N 535.8 450.7 556.7 454.6 414.5 389.0D 574.9 430.4 569.6 445.1 489.5 411.2
Total 3280.4 2521.9 3269.1 ..... 2789.4 2241.6
..continued..

Table 4 Continued
Monachyle Upper Monachyle Kirkton
P Q P Q P 0
1987 J 104.3 138.4 103.3 144.1 88.6 142.9F 140.6 124.8 139.2 104.3 120.1 116.5M 212.4 178.2 210.5 185.1 181.5 160.7A 82.8 87.0 87.8 73.5 78.3 105.7M 86.1 27.2 83.8 25.5 83.9 42.3J 139.0 87.3 131.9 88.2 148.9 98.8J 113.5 62.4 111.7 59.0 98.9 61.1A 163.6 90.3 164.0 83.3 164.2 95.2S 341.8 263.5 348.7 270.4 250.0 215.4O 318.8 256.3 326.2 269.4 250.9 220.1N 196.7 172.5 199.6 183.5 149.9 143.6D 355.9 236.4 353.6 271.2 283.9 188.3
Total 2255.5 1724.3 2260.3 1757.5 1899.1 1591.6
1988 J 394.5 289.9 389.3 322.4 310.0 249.5F 248.9 273.8 246.5 304.1 223.1 223.5M 312.5 252.4 309.5 264.9 242.5 208.6A 104.5 113.2 101.5 82.0 100.9 128.3M 105.1 58.5 98.0 54.4 96.2 54.7J 30.5 19.7 28.2 12.3 35.8 37.2J 404.6 246.8 403.9 250.6 337.1 210.6A 302.1 216.9 301.4 212.0 256.4 183.4S 250.6 229.6 251.4 212.4 224.9 210.3O 390.6 328.5 389.2 321.2 309.5 308.0N 152.2 117.0 152.9 111.0 133.8 110.3D 256.2 242.2 257.7 228.5 222.6 201.4
Total 2952.3 2388.6 2929.5 2375.8 2492.8 2125.8
1989 J 506.9 450.2 502.3 470.3 432.6 359.7F 475.9 360.1 471.5 369.3 406.2 318.0M 419.2 432.0 414.8 483.6 368.8 356.6A 89.4 75.1 88.5 71.1 76.1 102.2M 66.2 46.2 67.4 33.9 62.5 47.9J 117.2 48.1 1 15.3 45.7 107.0 55.5J 77.9 23.9 '7i7.9 20.8 77.4 36.4A 369.3 235.7 376.2 234.8 297.4 190.6S 228.5 198.2 261.6 214.7 160.9 144.3O 349.6 252.9 352.8 250.3 284.5 219.3N 120.4 134.8 122.6 137.2 92.9 135.0D 164.2 139.8 177.6 152.8 152.4 132.5
Total 2984.7 2397.0 3028.5 2484.5 2518.7 2098.0
10

2.4 Precipitation variations in the longitude becomes the most important, i.e aBalquhidder catchments more regional variation in rainfall. TheBalquhidder catchments are situated in a very
The precipitation time series for the Kirkton steep, but non-linear, west-east gradient ofcatchment is shown in Figure 3. The most precipitation, so regional position would beprominent features of Figure 3 are the relatively expected to dominate rainfall totals.dry summer of 1984 and the wet winter of 1988- When multiple regressions are carried out,89 with the six-month moving average suggest- more of the rainfall distribution is explained. Theing an increase in rainfall over the period. From three topographic factors, altitude, slope andthe daily data in the 1983-89 period. precipita- aspect, combine well for the separatetion greater than 0.5 mm was recorded on 62% catchments but not when they are consideredof the days, with 20% of the days having more together. Combinations of the three bestthan 10 mm. individual parameters, longitude, latitude and
altitude give good results for both the individualTo study the rainfall distributions over the and combined catchments (Equation 1).catchments, regression analyses have beencarried out relating rainfall to site details: Rain (M+K) = 477 - 0.062 Lo - 0.005 Lalongitude, latitude, altitude, slope and aspect. + 0.066 Al (1)Data from periods when only rain fell have beenused to avoid the uncertainties in snow periods. Where Rain is the mean monthly rainfall M+KLinear regressions have been obtained for both the combined data from both catchments; Lo iscatchments separately and combined, taking the the longitude of the site; La is the latitude and Alannual mean rainfall at each site from eight the altitude.years of data.
When the catchments are analysed separately 2.5 Streamflow in the Dalqnhidderthe most important mndividual site parameter,from the coefficient of determination, is the The time series of monthly flow totals for thealtitude in the Kirkton and aspect in the Kirkton catchment (Figure 4) again suggest anMonachyle. With the two catchments combined, upward trend over the period of study. The
600
- 6 Month moving average3 Monthly total
400-
0
aui
7)
E200.0
0 1983 1984 1985 1986 1987 1988 1989
Figure 3 Kirkton catchment monthly precipitation totals, 1983-89
11
- 6 Month moving average
> Monthly total
400
E
F 200
0
200
1983 1984 1985 1986 1987 1988 1989
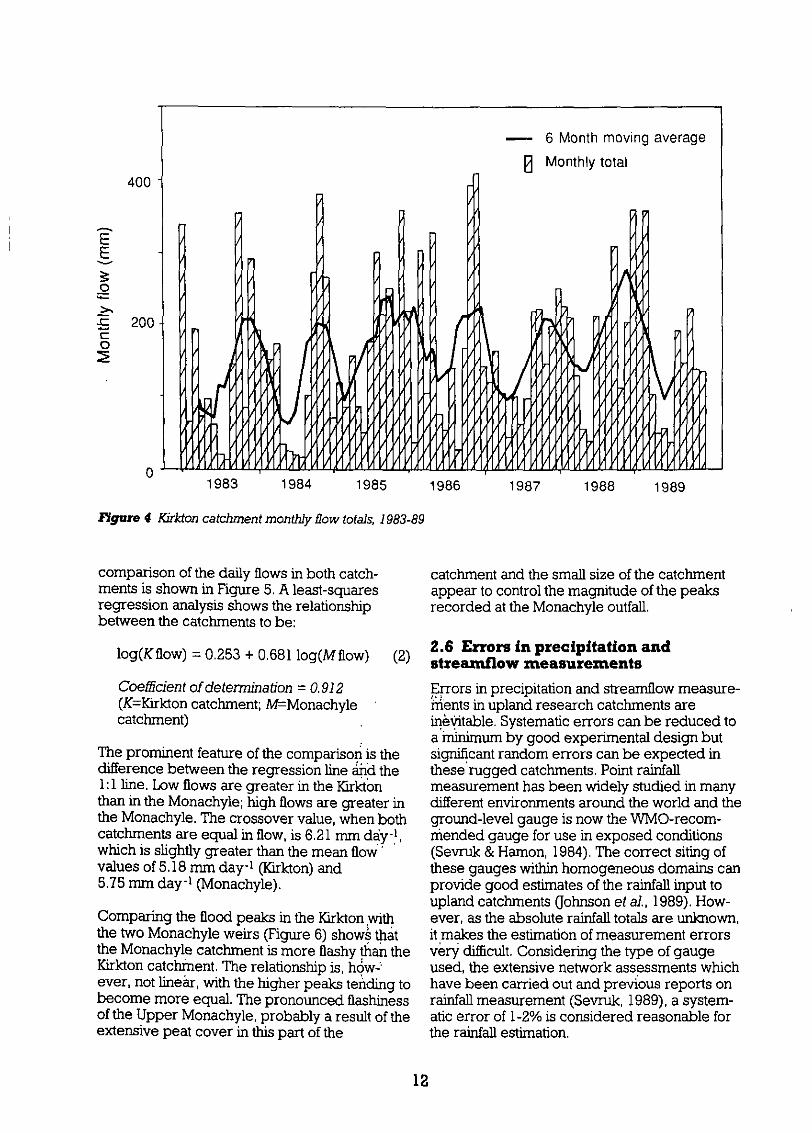
Fnge 4 Cirkton catchment monthly fow totals, 1983-89
comparison of the daily flows in both catch- catclment and the small size of the catchmentments is shown in Figure 5. A least-squares appear to control the magnitude of the peaksregression analysis shows the relationship recorded at the Monachyle outfall.between the catchments to be:
log(Kflow) = 0.253 + 0.681 log(Mflow) (2) 2-6 Errors in precipitation andstrearnflow measurements
Coefficient of determination = 0.912 Errors in precipitation and streamflow measure-(K=Kirkton catchment; M=Monachyle ments in upland research catchments arecatchment) . inevtable. Systematic errors can be reduced to
a uminimum by good experimental design butThe prominent feature of the comparison is the significant random errors can be expected indifference between the regression line and the these rugged catchments. Point rainfall1:1 line. Low flows are greater in the Kirkton measurement has been widely studied in manythan in the Monachyle; high flows are greater in different environments around the world and thethe Monachyle. The crossover value, when both ground-level gauge is now the WMO-recom-catchments are equal in flow, is 6.21 mm day-1, niended gauge for use in exposed conditionswhich is slightly greater than the mean flow' (Sevruk & Hamon, 1984). The correct siting ofvalues of 5.18 mm day-1 (Kirkton) and these gauges within homogeneous domains can5.75 mm day-1 (Monachyle). provide good estimates of the rainfall input to
upland catchments Uohnson et al., 1989). How-Comparing the flood peaks in the Kirkton ,with ever, as the absolute rainfall totals are unknown,the two Monachyle weirs (Figure 6) shows that it makes the estimation of measurement errorsthe Monachyle catchment is more flashy than the very difficult. Considering the type of gaugeKirkton catchinent. The relationship is, how-' used, the extensive network assessments whichever, not linear, with the higher peaks tending to have been carried out and previous reports onbecome more equal. The pronounced flashiness rainfall measurement (Sevruk, 1989), a system-of the Upper Monachyle, probably a result of the atic error of 1-2% is considered reasonable forextensive peat cover in this part of the the rainfall estimation.
12

2
0)
0
-1 -0.5 0.5 1.5 2log. Monachyle daily flow
FIgure 5 Companison of the daily flows between the Kirkton and MonachW'ye catchmnents, 1983-89
2.4
2 4-
Ln + ~~~~~~~~C+zz1.6 +E + + +
E ~ ~+ + r]C* "clu
+ C4 -+ D
+~~~~~~
C 0.8 c)
0.4
0 0.4 0.8 1.2 1.6
Kiriton flow (mm/lb5 minis)Upper Monachyle ± MonachyleE
Figqure 6 Comparison of the IS5-mmnute flow maxima between the Monachyle, Upper Monachyle and Kirkton,1983-89
13

Table 5 Estimated errors in the catchment water balance
Eatimate 1 Estimate 2
Monachyle Preciphation (P) 59 mm 142 mm
Streamflow (Q) 43 mm 86 mm
(P-Q) 73 mm 166 mm
Kirkton Precipitation (P) 49 mm 120 mm
Streamflow (0) 39 mm 78 mm
(P-a) 63 mm 143 mm
Random errors in rainfaU measurement, mainly March with the higher altitude gauges affected
caused by observer error, are more difficult to much more frequently than those in the valleyquantify but through rigorous quality control on bottoms. For 'partial' snow events the highthe data any gross errors can be eliminated. altitude gauges are corrected using relation-Smaller errors can not be distinguished from ships with low altitude gauges established innatural variability but are considered to be less rainfall conditions. Whether this applies to
than 5% of the true value for a single gauge. snowfall is debatable however this is currentlyOnce bulked into a catchment mean this random the best technique available. Using this tech-error is reduced to less than 1% of the mean of nique the error in the measurement of snowfall12 gauges. Therefore the combined error input to the Balquhidder catchments is estimat-
(systematic plus random) for rainfall is ed to be at best the same as that in rainfall (2%)
estimated to be 2%. and at worst no more than 20% from the truevalue. Considering the consistency of the winter
Errors in the measurement of snowfall are more water balance results with results from otherdifficult to quantify. Snowfall generally only seasons the estimation of the snow inputs
affects precipitation totals between January and appears to have been accomplished with a
600 7
1860 1870 1880 1890 1900 10 9; 3 1940 1950 1960 1970 1980
Decad e
1igure 7 Total decade precipitation from Loch Venachar, Central Scotland
14

similar error factor as in rainfall. Therefore a By combining the errors for the annual catch-20% error in snow is a very pessimistic error. ment precipitation and streamflow, two
estimates, have been derived for the (P-Q)By considering the proportions of annual values (see Table 5).precipitation which fall as rain and as snow, anestimate of the error in the annual totals can be 2.7 1983-1989 Precipitation in anmade. Combining these errors gives an historical perspectiveestimate of the annual precipitation error foreach catchment, Table 5. It should be noted Annual precipitation data have been extractedhowever that the methods of checking and from the Meteorological Office British Rainfallcorrecting catchment mean precipitation inputs records for the Loch Venachar station some 16adopted in these catchment aohnson et al., lan south of Balquhidder. The data set is shown1990) make it extremely unlikely that the errors in Figure 7 as total precipitation in each decade.in the annual totals have ever approached the The 1980s stand out as a decade of very highextreme of this range. - precipitation.
Errors in streamflow are potentially more Of the 129 years of records from 1861 to 1989,systematic than random. Serious systematic the wettest year was 1928, with 2076 mm. Threeerrors in the rating equations were identified of the years during the Balquhidder study rankand corrected early in the experiment (Hudson in the top ten wettest years: 1989 (5th), 1986et al., 1990). Other systematic errors due to (7th) and 1988 (8th). Taking groups of consecu-instrument sensitivity can be quantified as, say, tive three-year periods, the wettest was 1881-831 mm in stage values. Random errors in the with 5529 mm. Four of the Balquhidder studyform of bed level fluctuations remain unknown periods were ranked in the top ten: 1987-89quantities, but other problems such as winter (2nd), 1986-88 (3rd), 1984-86 (4th) and 1985-87icing can be ehlminated in the data quality (6th).control process. Percentage errors in annualdischarge totals are difficult to quantify. This shows that the Balquhidder study period,Considering all the possibilities, an estimate of 1983-89, has been an exceptionally wet period.2% is probably reasonable.

3 Site studies of interception andtranspiration rates
The understanding of a complex hydrological remaining vegetation type is upland grass forsystem such as an upland catchment can only be which no other comprehensive data exist. Aachieved by detailed studies of the processes detailed study of grass was carried out as, intaking place within the system. Potential terms of areal cover, it is one of the dominantevaporation, which can be computed from vegetation types.meteorological data using the Penman (1948)expression, is controlled both by the available 3.1 The seasonal water use of uplandenergy and by the advection of dry and warm sair over the evaporating surface.
Upland grass has been identified in the past asPotential evaporation has a large spatial having a significantly different water use fromvariability in complex topographical catchments lowland grass (Calder & Newson, 1979). In thesuch as the Monachyle and Kirkton. Analysis of uplands, the grasses have a winter dormantthe data from the AWS sites (Blackie & Simpson, period because of the low air temperatures1993) has shown that potential evaporation is when transpiration effectively ceases. Grassessignificantly greater at the high altitude, in the lowlands usually suffer from water stressexposed sites than at the lower valley bottom in the summer due to the high evaporationsites. As surface water bodies in the demand relative to rainfall. Therefore during theBalquhidder catchments are very small, most of winter lowland grass water use could bethe catchment evaporation is from the vegeta- expected to be proportionally higher than that oftion. Actual evaporation from the vegetation upland grass and with reversal during theoccurs as transpiration when soil moisture is summer. This pattern is complicated byfreely available to the root system or as direct frequent winter snow cover in upland catch-evaporation of water intercepted on the leaf ments which further reduces transpiration andcanopy. The processes taking place for each by summer water stress in those upland areasvegetation type must therefore be fuDly where very thin soils limit moisture storage.understood so that the catchment scale waterbalance results can be interpreted and models To study the seasonal water use of upland grassdeveloped to predict land-use effects on water at Balquhidder a pair of lysimeters wereresources elsewhere. installed at a site in Glen Crotha, between the
Monachyle and Kirkton catchments (Figure 1),The three main vegetation types in the catch- and operated between 1987 and 1989 (Wright &ments are heather, forest and grass. These are Harding, 1993). The site was on a small levelcoarse vegetation types, common to most terrace at an altitude of 595 m. The soil wasScottish Highland catchments. Heather evapora- mainly peat, having a depth of 200-1300 mm,don experiments were carried out by the , and the predominant vegetation was perennialInstitute of Hydrology near Killin, 8 km northeast grasses (Festuca ovina and Nardus sticta) andof Balquhidder, and the results have been . marsh plants (Carex and Juncus) with patches ofreported elsewhere (Calder et al., 1984; Hall, heather (Calluna vulgaris) and bilberry1985). Both interception and transpiration rates (Vac cinium myrtillus).were studied: since the results were consideredto be applicable to the Balquhidder catchments, The main instrumentation comprised twono further heather studies were carried out in monolith weighing lysimeters and an automaticthe catchments. Several forest evaporation weather station (Wnght, 1990). The lysimetersstudies have been carried out in other UK were 800 mm in diameter and 650 mm deepupland forests: Calder (1976), Gash et a! (1980), with an automatic pump system to maintain theAnderson & Fyatt (1986), Hudson, (1988), water status within the soil samples to that of theAnderson et a!. (1990) and Calder (1990). surrounding soils. The weight of the soilBecause of the perceived importance of forest samples was monitored continuously using aevaporation to the overall Balquhidder study a load cell to give storage changes; the otherfurther study was undertaken in the Kirkton water balance variables were monitored using aforest, where the interception losses were raingauge for the input and tipping buckets tomeasured over a three-year period. The monitor the pumped output.

Table 6 Evaporation totals (mm) for the two Jysimneters during the snow-free penods 1988 and 1989
Period 23 March - 21 September 1988 18 April - 18 October 1989
No. of days 188 183
Lysimeter A 330 354
Lysimeter 8 308 352
ilt 397 375
Daily and seasonal evaporation rates from the , 0lysimeters were calculated from rainfalL, X 1987drainage and weight changes of the soil blocks. + 1988Measurements were taken only from April to 08 . 1989November as the system was unable to cope 2with snowfall or prolonged sub-zero tempera- 0.6tures. Potential evaporation, Et (Penman, 1948). s0 4 . +was calculated from an AWS on site and thebiomass composition was sampled throughout .the two seasons. 02 _1
02T
The totals of evaporation for the two seasons ofoperation are shown in Table 6 as well as the Et 0values forthe same periods. The results show F M A M J J A S 0 N 0that measured evaporation totals were lowerthan the Et values for both periods, being 80% Figure 8 Biomass index for upland grass in theand 94% of Et in 1988 and 1989 respectively. Balquhiddercatchments
A biomass index, expressed as the ratio of thelive vegetation weight to the total biomass ratio is estimated to be 0.75. The biomass indexweight, was estimated at approximately monthly and the evaporation ratios show a clear link forintervals each time taking 30 random samples of the April to September period.0.25 m 2. A sinusoidal curve was fitted throughthe points (Figure 8). Figure 9 shows the mean The main use of these results is in the develop-measured evaporation, Em, expressed as a rato ment of a grass component of a seasonal water-of Et. The ratio is around unity in summer but use model which can be applied to other sites tofalls to around 0.5 in the winter; the mean aniual estimate the likely effect of land-use change on
Em = Measured evaporation
E,= Penman estimated evaporation
2
1 6
uP- 1.2
0,4
0 April May June July Aug Sept April May June July Aug Sept Oct
1988 1989
Figure 9 Evaporation results from the grass lysimeters for 1988 and 1989
1 7

catchment water use. The model is based on 280
physical principles of evaporation and plantphysiology and uses inputs of daily rainfall, 240 - model
temperature and Et. Three versions of the grass M.cual
model were tested (Wright & Harding, 1993). In E 200
the first- the Penman model-water use isequated to E, where E, is calculated using the ie,oPenman (1948) equation with the addition of thenet radiation term. In the second, evaporation is 1 20
related to the biomass index. The third adjuststhe evaporation using temperature as the E0
control.40
The simple Penman model overestimates theevaporation particularly in the early part of the 0 , Jyg-
year but the use of a sinusoidal crop factor with April May June July August
a single optimised parameter increased the ngure 10 Comparison of the actual and modelledexplained variance but still overestimated the evaporation from the grass lysimeters during 1988losses by 5.8%. The temperature model wasdeveloped in several forms from theunoptimised use of air temperature to the two-parameter optimisation of near surface model and the potential for applying it to othertemperature. The unoptimised temperature years.function, when used with air temperature,produces a poor fit, overestimating the total 3.2 Forest interceptionlosses but the fit improves when optiniisation iscarried out using near-surface temperature. A forest interception site was operated in the
Eirkton catchment from October 1983 to JuneOptiisation was carried out on the 1989 data 1986 (ohnson, 1990). The location of this siteand, using the same parameter values, the 1988 (Figure 1) was in the lower part of the forestevaporation was predicted. The modelled area, close to an established raingauge site.values were within 0.03% of the observed Precipitation, throughfall and stemflow measure-(Figure 10) which indicates the success of the ments were taken at approximately two-week
1 000 1983, 1984 1985 1986
80>
o 0 440 0 tiuo
02 0~~~~~~~00 §~~~~~~~
40 0~~~ t 0~&b 00
20 rxl ~~~006 0, 0@
~~~~0 0~~~~~~~~ 7>1200U '.N4 I'
200 400 600 800 1000 1200 1400
Day number
flgure 11 Interception loss from the Kirkton forest, 1983-86

intervals for the 33-month period. Throughfall winter values (26%). Table 7, summarising thewas measured in a 30x30 m square using 60 results, shows that over the whole periodrandomly-placed collectors and stemflow was throughfall constituted 69% of the precipitation,measured on nine tree stems systematically stemflow 3% and therefore interception lossselected by girth. 28%.
The difference between the precipitation and A comparison with other UK published resultsthe sum of the throughfall and stemflow is (Table 8) shows that the Balquhidder meanassumed to be a measure of the interception interception of 28% is the second lowest alterloss from the forest canopy. The nominal two- the Plynlimon result, This is consistent with theweekly totals of interception loss are shown in a results published in Calder & Newson (197 9)time series in Fgure 1 1. The large variability from British forests which show that thehas no obvious seasonal trend although the interception fraction decreases with increasingsummer mean values are greater (34%) than the rainfall. Two of the higher interception values,
Table 7 Summary of results from the Kirkton forest interception site
P T S I
Total (mm) 5791 3984 175 1632Per cent of gross P: Annual 69 3 28
Summer 64 2 34
Winter 71 4 26Per cent of net P (T+S) 96 4Max 2-week mean (% of P) 93 7 79Min 2-week mean (% of P) 21 0 0Standard error of mean 2.03 0.23 2.19
P = Precipitation T = Throughfall S = Stemflow I = Interception -= not included
Table f Interception results from upland catchments in the UK
Site and reference A T S IGreskine 14 61 39 30
(Ford & Deans, 1978)
Stocks reservoir 25 89 11 38(Law, 1956)
Kielder (1) 25 82 18 29(Anderson & Pyatt, 1986)
Plynlimon 29 82 18 25(Hudson, 1988)
Kershope 35 86 14 38(Anderson et at., 1990)
3alquhidder 50 96 4 28(Johnson, 1990)
Kielder (2) 63 98 2 49(Anderson & Pyatt, 1986)
A = Age of trees (years) T . Throughfall (% of net precipitation)S = Stemflow (% of net precipitation) I I interception (% of gross precipitation)
19

Kielder (2) and Stocks could also be explained The explanation of this change with tree age isby the structure of the forests. Anderson & Pyatt, probably in the tree structure with young1986, give the possible explanation to the high branches being shorter, straighter and angledKielder result as being the greater height of the upwards. The older tree branches are longermonitored stand of trees above the general and tend to be more horizontal or even bentcanopy level while the Stocks result is possibly downwards towards the ends, Therefore, theexplained by the site being a relatively small routing of water along the branches could beopen structure of trees. towards the stem in young trees and away from
the stem in old trees.Comparing the relative proportions of through-fall and stemiflow in forests of different ages(Table 8 and Figure 12) has shown a resultwhich potentially has significance for water '0" -quality in juvenile forests. These proportionsshow a general trend from around 15 years 8o Throughiall
when throughfall increases and stemfiowdecreases with age. Stemfiow and throughfall in 60 ' _ Ad.o (1)
the age range younger than 14 years have also '
been interpolated in Figure 12. This has usedthe fact that throughfall must be 100% at an age K 4 _XId, (21
of 0, as it is defined to include direct 'precipitation. Figure 12 suggests that the tree 20 stem
age of around 10 years is an important time inthe forest development, when stemflow reaches _ __,_
0 0 20 30 40 50 60 70a maximum and throughfall a minimum, Canopy Age of treesclosure is generally considered to occur at 10-15 years and the two processes do appear to be Rgure 12 Variation with age of the proportion ofclosely related. throughfall and stemfiow
20

4 Modelling the impacts of land-usechange
Development of models from the Balquhidder data from upland catchments, probablyresults is an essential part of the study, These including those catchments planned for forestrymodels should bring together the results from or water resources development, means thatindividual site studies and from the catchment there must be a compromise between morescale so as to gain a better understanding of the accurate but complex models and simplerrelative components in the catchment systems. models requiring more easily acquired data.Different combinations of these models and The approach taken at Balquhldder has been todifferent complexities can be used depending develop the THISTLE model from the detailedon the range and quality of data available, process studies of evaporation from the main
vegetation types and then to use these to deriveThe results from the grassland and forest site a simpler model.studies, described in the previous section, havebeen combined with results from other studies The catchment water use models have theirin Scotland and elsewhere in the UK on heather origins in the annual model of Calder & Newsonand snow to develop a catchment water use (1979) but have been developed to predict themodel (THISTLE). Streamflow models, such as evaporation from a catchment on shorter time-the IH land-use model, TOPMODEL and scales and with a wider range of vegetationIHACRES developed elsewhere, have been types. Evaporation process studies have beenapplied to the Balquhidder catchments to carded out at Balquhidder and other researchidentify hydrological contrasts between the two sites in the UK, on some of the major vegetationcatchments and any hydrological changes which types in upland catchments (Calder, 1986; Hall.have taken place in the period of the experi- 1987). The aim is to develop a model whichment, and to provide reasoned arguments for uses vegetation, daily precipitation and dailythe causes of these differences and changes. potential evapotranspiration and the spatial
distribution of these variables to predictApplying the models presented in this section as catchment water uses.forecasting tools is also seen as an importantpart of forestry development in the uplands. Any Three types of model have been derived: anplanned changes, such as afforestation, should annual whole catchment model, a seasonalbe assessed for their likely impact on the natural whole catchment model and a seasonal modelenvironment. The availability of models at distributed into altitude zones: these aredifferent levels of sophistication will enable described in detail in Hall & Harding (1993).developers to carry out initial impact assess-ments on all potential sites and to use more The annual model is based on the Calder-specialist knowledge to apply the complex Newson model which is a physically basedmodels to the most likely sites. model developed from insights gained from
process studies carried out in Mid-Wales. It hashere been extended to include estimates of
4.1 Process model of catchment evaporation from catchments containing aevaporation (THISTLE) heathland component. The main assumptions
are that the entire catchments are covered by aResults from the site studies, such as those comnbination of grass, heather and trees; the twodescribed in Section 3 of this Report, forrn the other vegetation types, bilberry and moss, havebasis for the development of a process model of been classified as heather and grass respective-evaporation in upland catchments (THISTLE). ly. It is also assumed that the annual evaporationThe airn of the model is to predict the effects of from grass on the Balquhidder catchments isafforestation on the water use of upland catch- 0.75 E, (Section 3.1) and no allowance is madements throughout the UK. The model is for snow.physically based and takes into considerationthe major vegetation types: upland grass, Seasonal modelsheather (Calluna vulgaris), coniferous forests, aswell as evaporation of snow from a forest The seasonal models estimate the dailycanopy or open moorland. The general lack of evaporation from each main vegetation type.
21

They make the same assumptions for vegetation vegetation in that zone and the catchmentcover as the annual model. It is assumed that evaporation is then the sum of the evaporationevaporation from snow is zero except when from the three zones.stored on the forest canopy.
Output from the seasonal models is in the formEvaporation from the grassland is calculated of cumulative daily estimates of the transpirationusing a seasonally dependent function and interception loss from each of the vegetationdeveloped by Wright & Harding (1993) while types. Figures 13 and 14 show the transpirationevaporation from the heather and forest is and interception losses per unit area for thecalculated as the sum of transpiration and Kirkton vegetation in 1988. The models assumeinterception loss terms. Transpiration from the that the transpiration and interception loss ratesheather and forest is estimated using Et multi- from grass are the same.plied by an appropriate transpiration factor (Hall& Harding, 1993). The daily interception losses Both forest transpiration and interceptionare calculated using an exponential model exceed that of heather; the interception loss(Calder, 1986) with parameters from heather from forest being more than twice that from theand forest derived from the relevant process heather. Forest brash is assumed to have anstudies (Hall, 1987; Johnson, 1990) interception loss similar to deep heather. The
large difference between grass, heather andThe altitude zone model allows for the effects of forest in the early part of 1988 is due to snowaltitude on evaporation and rainfall. In the model cover at high altitudes, resulting in the grass andeach catchment is divided into three altitude heather having zero losses.zones, each represented by an AWS withclassification into vegetation cover within each The resulting total catchment evaporation forzone (Table 9). Evaporation from each zone is each vegetation type (Figure 15) is computedthe sum of the evaporation from each class of from the daily transpiration and interception
Table 9 Percentages of main vegetation types in selected altitude ranges
Altitude (in) Grass Heather Forest Other
Monachyle <400 57.2 42.8 0 0
400-600 34.2 65.8 0 0
>600 64.3 35.7 0 0
Kirkton <400 6.0 0.5 81.7 1 1.8
400-600 41.5 11.0 41.4 6.1
>600 77.0 23.0 0 0
4 - _or,'t00
' 200 .. ,' .. ' = 400E=3 0 0 , , -w ~.0 ---- 300
o ~~~~~~~~~~~~~~~4002E 200 ._ .
ioo :~~~ ~ ~~~~~~~~~~200 f-
1 00 - _ _ _ _ _ _ _ _ _ _ _ _ _ _
% °t ) 100 200 300 400 0 10o 200 300 4Z0Daynumber Daynumber
YIgure 13 Cumulative daily estimate of transpiration flgure 14 Cumuladve daily estimates of interceptionfrom three vegetabon types in the Kirkton catchment loss from three vegetaton types in the Kirkton1988 catchment, 1988
22

more than heather. The distribution of the mainvegetation types with altitude is therefore
GHter, important in determining the total evaporation150 - -r -h from a catchment.150,
Figure 16 compares the Kirkton and Monachyleseasonal model estimates of water use with the
f100 - water balance (P-Q) results (Section 5.1). Thediscrepancy in the comparison, with the model
et. s * -' ' -underestimating in Monachyle and overestimat-tD ,_.'/ y ______ , ing in Kirkton, appears to be systematic. Applic-
ation of the annual model produced similar100 c00 300 00 departures from the observed (P-Q) values.
Daynumber This is discussed in more detail in Section 5.4.
nFgure 15 Cumulative daily total evaporation from One area of uncertainty in the process models isthe vegetation components in the Kirkton catchment, the transpiration of upland grass. The work1988 carried out at Balquhidder (Section 3. 1)
required a deep soil: this is not typical in thelosses and the areal cover of each vegetation catchments and a vegetation stress factor shouldtype in different altitude zones. The simplified probably be incorporated into the grass model.vegetation distributions in Table 9 have been However, the fact that most summers during theproduced by including bilberry with heather, measurement period have been wet suggestsmoss with grass, bracken with grass (bracken that such a factor could be small. Other import-seasonal) and brash with heather. ant sources of uncertainty are total evaporation
losses from bilberry and mesomires andIt is interesting that in 1988, when almost half of evaporation from snow cover on rough moor-the Kirkton forest had been felled, the forest land vegetation.area still had the largest water use. Moreover,although the evaporation from grass per unit On the basis of these considerations, thearea is much less than that from forest or uncertainty in the water use model estimates isheather, its large areal coverage, especially in considered to be some 15%. Potential errors inthe altitude ranges of greatest potential precipitation and flow measurements result inevaporation in the Kirkton catchment (Section water balance, (P-Q), errors that have been5.3), results in the total annual grass evaporation estimated at 10-15% (Section 2.6). With thesebeing almost as much as the forest and much possible errors considered, the error bars of the
700
600
5007 7E
.0
0)
300
200
100
1984185 1985/8 1986/7 1987/8 19 89
Monachyle model Monachyle water balance Kirkton model Kirkton water balance
Flgure 16 Comparison of the catchment water use results from the model and water balance methods
23

model estimates and the water balance results .. e..o.a.n - 470mm,
overlap, but the systematic nature of the differ- '.'ences suggests that further investigation isrequired. It should be noted also that the quoted .15% uncertainty in the model estimates does not ' 0include the uncertainties in the Penman E, andcatchment precipitation data on which the model E
Eoperates. E
From the seasonal models, developed from the m 04 - l ---- a2
components of the vegetation cover, a simpli-fied annual water-use model has been derived. 02
This version is for use in catchments wherelimited data can be expected. It provides ° a so 2000 2500 3000 3500 4000
estimates of the average annual water use of Pr6cptaIcn (mm)forest, grassland and heather, and requires asinput the long-term annual rainfall total and the lngure 17 Generalised models of annual water use ofaverage potential evaporation. The catchment individual vegetation typesaverage water use is calculated from the sum ofthe water uses of individual vegetation types,weighted by their proportional areal cover. Application of the THFSTLE model to the
Monachyle catchment shows how the modelAn example of this simple model of water use as could be used as a predictive tool. Taking thea function of rainfall are shown in Figure 17. The planted area to be 14% of the total catchmentexample uses an annual potential evaporation of area and assuming that it replaced both grass470 mm, approximately that measured for the and heather, the water use of the vegetationBalquhidder catchments. The calculations are components can be calculated. Evaporationonly shown for an annual precipitation of above from the forest increases with time and1000 mm: the model makes no allowance for decreases from the grass and heather, as shownsummer water stress and so should not be used in Table 10. The most dramatic time is aroundin the drier parts of the country or where soils canopy closure (11 to 15 years) when forestare especially thin. The model assumes 100% evaporation increases to 241 mm, i.e. 38% of thecover for the vegetation types shown. total catchment evaporation.
Figure 17 can be used to give an indication of 4.2 A lad-use model to estimatewater use (interception plus transpiration) in streamnflowother catchments, and of the possible effects of Aland-use changes such as afforestation. The ' The TFHSTLE model (Section 4.1) incorporatescalculation would be more accurate if variations the:evaporation processes identified with theof ET were taken into account, but to a first major vegetation types on the Balqulidderapproximation Figure 17 can be used. catchments into a model for the prediction of
Table 10 Catchment water use model applied to the Moniachyle catchment with a developing forest
Age of trees (years) E. E, E,
0-5 521 189 300 32
6-10 559 174 279 106
11-15 630 147 242 241
16-20 663 134 224 305
>20 671 131 219 321
E= . Annual catchment evaporation, mm Ep. Annual grass evaporation, mmEh - Annual heather evaporation, mm E= Annual forest evaporation, mm
24

catchment water use. This provides a means of One of these models, the IH land-use model hasestimating, on a seasonal or annual basis, the been applied to the Balquhidder catchments toprobable effects of land-use change on the estimate the effects of the land-use changes onwater balance. For many water resources streamniows. The land-use model wasassessment purposes there is a need to translate developed to extend the usefulness of thethese effects into an estimate of the changes in lumped conceptual model by incorporating thethe volume and seasonal pattern of streamflow physical process models of evaporation fromemerging from the catchment. Rainfallrunoff each major vegetation type (forest, grasslandmodels, as exemplified by the family of Institute and heather) into the general model stucture.of Hydrology Lumped Conceptual Models An early version of this approach was applied(Blaclde & Eeles, 1985), of which HYRROM is with some success to assess the effects ofthe best known example, can be used to afforestation on water yield from the catchmentsforecast streamnflow patterns from rainfall and of the Elan Valley reservoirs and was alsopotential evaporation data once the models have applied to a number of FRIEND catchmentsbeen calibrated and validated on a few years of (Gross et a]., 1989). In this version (Figure 18)good streamflow data from the catchment. the loss functions used for transpiration and
.- ~ ~ ~ ~ ~~~"\kRnf -\ inerepio A$ 4
Runol I(Flow)
Rainfall Evaporation
Interception Ru~~~~ntereon,
Time Store SFooeTime ~ ~~~~~~~~~~~~~~ t ren FLo
Transpiration Dclay
Sodl Sto'e I P Time
1 ~~~TimeGroundwater | Delay
figure 18 The HYRROMmodel
25

interception are taken from the THISTLE model possible to follow the model calibration by aand are applied to the areas in each catchment model validation, in the strictest sense, on aunder forest, grass and heather, as determined comparable run of data. Instead the modelsby vegetation surveys (Roberts et al., 1993) were used to simulate the streamflow that wouldprior to the land-use changes. After partitioning have occurred in the period January 1986 toeffective rainfall between surface runoff and December 1988 in the absence of land-useinfiltration, transpiration loss, soil moisture change. The Kirkton model was then re-run withchanges and recharge to ground water under the areas of vegetation changed to represent theeach vegetation area are computed on a daily felling that occurred in this period. As can bebasis. The surface runoff and the recharge seen from the summary data in Table 11 that thecomponents are then lumped and reservoir and simulated flow in the Monachyle for this period,delay functions similar to those incorporated in when 14% of the catchment was being planted,the HYRROM version are used to compute the was within 0.2% of the observed flow, suggest-rapid response and baseflow contributions to ing that the planting had no significant effect onstreamflow. These are then combined to give the streamflow at this early stage. By contrastpredicted daily streamflow values. The structure the Kirkton 'no change' simulation was 6.5%of the model is described in greater detail in lower than the observed whilst the 'felling'Eeles & Blackie (1993). simulation was 3.4% lower, comparable to the
error in the calibration period. This suggestsThe models for each catchment were calibrated that a small change in streamflow response hadon data for the period May to December 1985, a been brought about by the felling.perod for which continuous good records wereavailable and within which no major snow The model was then used to produce estimatesaccumulations occurred. Over this period the of the long term effects of a range of differentparameters not evaluated from the TFHSTLE levels of mature forest cover on the twofunctions were optirmised, initially using the catchments. Twenty five years of rainfall data forRosenbrock routine with subsequent fine tuning each catchment were synthesised using theby the Simplex method (Nelder & Mead, 1965). 1983-88 regression relationships between
observed catchment rainfall and the long termThe Monachyle strearnflow hydrograph was records from a gauge at the nearby Lochayaccurately simulated during this calibration Power Station (OS grid reference NN 545 350).period with a daily correlation of 0.90 and a No comparable station was available forvolume error of only +0.7% but the Kirkton extending the Penman El record but, as asimulation was not as good, giving a correlation substitute, the mean annual E, distributions fromof 0.86 and a volume error of -3.9%. A possible the 1983-88 period were used to provide Etreason for this underestimate in the Kirkton inputs for the remainder of the 25 year period.streamflow is the use of E£ data from the KirktonHigh AWS to represent catchment mean F-. The 'Monachyle' and 'Kirkton' models were thenSubsequent data from the Lower Kirkton AWS applied to these synthetic data sets to produce asuggests that the Kirkton High data overestimate 25 year time series of simulated daily flows withthe catchment mean E, by some 10%. the areas of mature forest in each catchment set
at 0%, 20%, 40%, 60%, 80% and 100%. For eachSince land-use changes occurred in both setting the remaining areas in the catchmentscatchments from 1986 onwards it was not were apportioned between grass and heather in
Table 11 Mean monthly flows. observed and simulated
Period Comment Observed (mm) Simulated (mm) Volume error (%)
Monachyle
5/84-12185 Calibration 164.1 165.2 +0.7
1/86-12/88 Prediction 184.3 184.7 +0.2
Kirkton
5184-12/85 Calibration 155.3 147.3 -3.9
1/86-12t88 Prediction - no felling 167.3 156.5 -6.5
1/86-12188 Prediction - 167.3 161.6 -3.4progressive felling
26

Kirkton CatchmentModel lPrediction
3Observed Flow
2
Predicted Flow
2-
1986 1987 1988
Monachyle CatchmentModel Prediction
Observed Flow
~~~~~I _ _ ½~~~~~ ~4
1]:-
1986 1987 1988
igure 19 Comparison of observed and predicted flows for the HYRROM evaluation period, 1986-88
27

the ratios existing in the 1984-85 calibration with low index values are usually drier resultingperiod. The results are summarised in Figure 19 either from steep slopes or from a smallin terms of the mean percentage changes in contributing drainage area. Grid squares withstreamflow, relative to the 0% forest runs, the same index value are assumed to behave inresulting from each level of forest cover. The a hydrologically similar manner. As a result ofgreater reductions predicted in the 'Kirkton' this assumption, the catchment's topographyscenario are due to the residual area of the may be summarised by the distribution of thecatchment being predominantly under grass as index values.compared to the 50:50 heather:grass cover inthe Monachyle. The actual values of the TOPMODEL identifies two sources of streamreductions relate to the rainfall and climatic water. The first of these sources is waterconditions in these catchments, factors which draining from subsurface saturated zones. Themust be taken into account in any attempt to second source is rainwater falling ontoextrapolate to other sites. completely saturated parts of the catchment.
This water is assumed to move or displaceThe data sets produced were subsequently water quickly to the stream through, foranalysed to produce an assessment of the water example, macropore flow, old waterresource imphcations of varying levels of displacement or overland flow. The saturatedafforestation in regions with smiilar climate and contributing area will both grow and declinecatchment response characteristics to the during the course of a storm event.Balquhidder area (Gustard & Wesselink, 1993).Their findings are summarised in Section 5.5 of Maps of ln(a/tanp) provide information whichthis Report. can be used to help characterise a catchment's
hydrological and hydrochemical behaviour. The
4.3 Topographic model for streamflow maps can be used to help identify source areasanalysis (TOPMODEL) within the catchment, which are potentially
important in the control of the chemical charac-TOPMODEL is a physically based, semi- teristics of the stream and in sediment transport.distributed model developed for use in predict- The maps provide a simple tool which allowsing and understanding rainfall-nnoff mechan- hydrologically important differences resultingisms. It provides a compromise between the from the topography to be identified.complexity of a fully distributed model such asIHDM (Calver, 1988) and the relative crudity of Maps of the index values show that the twolumped models such as Birkenes catchments are quite different in terms of the(Christophersen et al., 1982). Heterogeneity in spatial distribution of ln(a/tan,) (Figures 20 andcatchment topography is incorporated into 21). The index vanes smoothly across theTOPMODEL by means of a topographic index; Kirkton catchment, increasing almost monoton-the movement of water through the catchment is ically with height. High index values are concen-founded on a simple representation of physical trated along a continuous band near the stream,processes. - widening towards the catchment outlet. Two
additional source areas are also visible on theTOPMODEL was applied to the Balquhidder higher parts of the catchment: one to thecatchments with these three aims: (a) to northeast and the other to the west near twocompare the hydrological response of the two small lochans.catchments, (b) to relate these responses to theflow generation mechanisms operating in'the The Monachyle map appearance is much morecatchments, and (c) to identify any effects the irregular - a direct result of its more ruggedland-use changes may have brought about. A topography. A large proportion of high In(a/fuller description of the application is given in tanp) index values occur in the fat UpperRobson et al (1993). Monachyle sub-catchment. Further high index
values are also seen along the lower streamCatchment topography is represented by banks, although this band is neither so wide normeans of a topographic index, ln(aItanp), where so smooth as for the Kirkton catchment.a is the area draining through a grid square perunit length of contour and tanp is the average The cumulative distributions of the indices areoutflow gradient from the square. The mdex is compared in Figure 22. The distributions arecalculated from a digital terrain map across a fairly similar, although the Monachyle catchmentgrid covering the catchment. A high index value has a slightly larger proportion of the higherusually indicates a wet part of the catchment: index values. This means that there is likely tothis can arise either from a large contnbuting be more flow generated in the Monachyle fromdrainage area or from very gentle slopes. Areas the saturated contributing (source) areas.
28

LN (A/TAN fi)W ABOVE 14.0
LII 13.O - 14.0EZ i2.O - 13.0
8.0 - 9 0 ~~Monachyle
7.0 - ~~~~Oo catchmnent
Balquhidd er
Figure 20 V'anatons in the TOPMODEL index values for the Monachyle catchment
29

LN (A/TANg9)
ABOVE 14.0[X ~13.0 - 14.0
[I]12.0 - 1,u1.0 - liaoto1.0 - 11.09.0 - 10.0- ~~8.0 -9.0
H~~o . Kirkton catchment- ~~5.0 - 0BELOW ~.5), Balquhidder
flgure 21 Vanations in the TOPMODEL index values for the Kirkon catchment
30

1.0 1.2-
0.8 Kirkton, 1.0 - .98485
0.6 7 0.8 1~~~~~~~~~~~~~~~~~~~~~~~~~987/88 ---LU 0.6 ^ /Monachyle Klrkton
0.6
o -ŽI. > 0.6
'S 0.4 \ MonachyleE 20.4.-
0.2 2
0 o~~~~~~~~~~~~~0
o Z 4v 6 8 rO 12 14 16 18 0 0W2 0.4 0.6 08 1.0
In (a/ltau ) value Depth (m)
FIgure 22 Cumulative distributions of TOPMODEL Figure 23 TOPMODEL transmissnivty profiles for theindex values Monachyle and Kirkton catchments before and after
the land-use changes
TOPMODEL was calibrated for both catchments substantial reduction in the shallow subsurfaceusing daily rainfall and flow records for the year flow and a corresponding increase in theJune 1984 to June 1985. The modelled flow is subsurface flow at depth.subdivided into subsurface flow and saturatedoverland flow. Both catchments are very flashy Despite the altered transmissivity profileand a relatively high proportion of the total between the two periods, the total subsurfaceresponse is made up of water from saturated flow from the Monachyle has not changed as acontributing areas. The Kirkton catchment gives proportion of the total flow. Instead, the pattemthe higher proportion of subsurface flow; it also of subsurface flow emergence has changed,gives the better fit. The higher saturated with the 1987/88 subsurface response beingoverland flow for the Monachyle has a physical more damped than in 1984/85. These changescorrespondence with the extensive peat areas in may be a result of the land-use changes in thethe Upper Monachyle sub-catchment which Monachyle in which 6% of the catchment waswould be capable of generating such flows (see ploughed. Although the ploughing covered aalso Section 2.5). very small proportion of the catchment, the
results from this model indicate that the areasA validation run, using the estimated parameters ploughed (i.e. the lower slopes) arefrom 1984-85, was undertaken for both hydrologically very sensitive.catchments between June 1987 and June 1988(Figure 24). During the winter of 1987/88 both 4.4 Strearnflow separation modelcatchments show a period of poor model fit IHACRES)when snow storage and melt affected the 'l Sresults. The calibration and validation runs can A recently developed catchment rainfall-also be used to assess whether any change in streamfilow model, IHACRES (akeman et al.,response has occurred in either catchment. 1990), has been applied to the BalquhidderLittle improvement in fit is seen for the Kirkton catchments. The objective was to quantify thecatchment and there is no evidence to suggest basic differences in quick and slow flowthat any change in flow generation mechanisms dynamic response characteristics of the twoor flow routing has occurred. catchments to rainfall and to detect if any
changes may have occurred as a result of theFor the Monachyle catchment an improved fit is land use changes (akeman et al., 1993).achieved with substantial differences in theoptimised parameter values. To illustrate these IHACRES is based on unit hydrograph theorydifferences, the transmissivity profiles for both and system identification techniques arecatchments are plotted in Figure 23. The profile adopted whereby rainfall excess is the input to aindicates how quickly water moves laterally at system of linear storages. Full details of thedifferent depths. For 1984/85 there is fast model including parameter estimation are givenmovement near the surface in both catchments injakeman et al. (1990). The model enables thebut with water moving relatively slowly at depth separation of hydrographs into identifiable flowin the Monachyle. There is little difference components on the basis of the information inbetween the Kirkton profiles for the two years, rainfall and streamfiow data. It then allows thebut for the Monachyle in 1987/88 there is a computation of the magnitudes and character-
31

Monachyle: Validation (1987/88)
80-
so-
0 650 100 150 200 250 300 350
g] 10
0 50 100 150 200 250 300 350
Kirkton: Validation (1987/88)
25-
6 50-1
2 5''l'1.,. ?' ,., ,,',g',j,i,''t ^ . . .... .,.
0 50 100 150 Days 200 250 300 350
IlguLre 24 TOPMODELJ validation run, J987-88
32
0 50 100 150 Days 200 250 '300 350
32

and slow flow components. These analyses ',auickflow .. . . were used on daily data for the M6nachyle and.
- ldq _4 ~- Kirkton catchments for the five consecutive 12-~1 + ~a r'~ |month periods starting in July 1984, which
Raintall a-.+Stramflow4 r1included the periods before and after the start of.exce.ss.-----amfow the land-use changes.
Slowflow , .: ,.. .,..
LF ._1, -:~ 'As discussed in Section 2.5, the Monachylecatchment has a flashier response and lowerbaseflows than the Kirkton, even though it is the
Figure 25 Schematic diagram representing the larger catchment. Differences between the tworainfall-strearnflow model, IHACRES. Parameter a is catchments' physical characteristics, such asdirectly related to the time constant of a flow slope, soils, glacial deposits, vegetation andcomponent reservoir ,3/(l +a) is the contribution of a drainage density, undoubtedly cause thisflow to the total flow volume. difference in the flow regimes.
The effect of antecedent rainfall on catchmentstreamflow response was investigated by use of
istic response times of the separate unit . a rainfall-rainfall excess model Jakeman et al.hydrographs for these flow components. (1990). No improvement was obtained in the
predicted streamflow using a range of values forGenerally there are two identifiable components this parameter. This was thought to be due tocorresponding to two linear storages acting in the regular occurrence of rainfall and relativelyparallel, they have different response times to . low rates of evaporation minirnising the effectrainfall and consequently are referred to as when consideringdaily data. For the model,quick and slowcomponents of streamflow.-, rainfall excess was therefore considered to be
proportional to rainfall.IHACRES also calculates separate characteristic: . .response times, relative contributions to the flow The relationship between rainfall excess andpeaks and volumetric throughputs for the. quick streamflow.was described using a series of
' - OBSERVED .......... FORECAST
C.D
40 ,
.~~ ~ ~~~~~~~~~~~~~ . . .r 1
0.
*~~~~~~~ .1O.9E --. rRCS
., , .. . '
0.- . ''.. .'4.' ''.
0. 50. 100. 150. 200. 250. O300. .350.
SEQUENCE NUMBER
ERROR SERIES
21.3-17.7-
0,2-10.
12-.-'v' -50.8>1 iis0. 2i 3t. 'si.3.5- - I
-10.8 ? 2 '- 5 0 0
Fgure 26 IHACRES model fitted to the Kirkton 1984-85
33

Table 12 Dynamic response characteristics of Kirkton (first row) and Monachyle (second row) catchmentsestimated by IHACRES using annual sets of daily rainfaDl-streamfiow data
Period of estimation1984-85 1985-86 1986-87 1987-88 1988-89
Response time, 1.39 1.35 1.49 1.26 1.47quick (days) 1.00 0.85 0.84 1.03 0.84
Response time, 20 46 35 16 25slow (days) - 39 43 29 13
Volume throughput, 0.72 0.85 0.72 0.62 0.74quick 1.00 0.93 0.85 0.76 0.83
Volume throughout, 0.28 0.15 0.28 0.38 0.26slow 0.00 0.07 0.15 0.24 0.17
Peak flow, quick 0.964 0.993 0.978 0.937 0.9741.00 0.997 0.994 0.98 0.979
Peak flow, slow 0.036 0.007 0.002 0.063 0.0260.000 0.03 0.006 0.017 0.021
linear storages. In all but one year (Monachyle The characteristic response times for the Kirkton1984-85) the appropriate configuration was a average 1.37 days (quick flow) and 31 daysquick flow storage and a slow flow storage (slow flow). For the Monachyle the equivalentacting in parallel. Figure 26 shows an example figures are 0.91 and 31 days respectively.of the IHACRES model fitted to the Kirkton daily Relative volumetric throughputs for the quickstreamflows for 1984/85. Although there are and slow flow components average 0.73 anddiscrepancies over some parts of the record it is 0.27 respectively for the Kirkton and 0.87 andconsidered that the dynamics of the quick and 0.13 respectively for the Monachyle. Theslow flow components are adequately relative contributions of quick and slowrepresented by the model. instantaneous unit hydrograph (IUH) peaks to
the IUH peak for total streamflow average 0.969Similar model fits were obtained for other years and 0.031 respectively for the Kirkton and 0.991for both catchments. It should be noted that ho and 0.009 respectively for the Monachyle.adjustments were made to rainfall inputs toaccount for the effects of variable catchment These results show clear differences betweenwetness or seasonal variations in the catchments confirming that the Monachyle isevapotranspiration. th6e flashier catchment but the Kirkton has the
higher baseflows. There is, however, littleThe basic hydrological differences between the indication that, on a daily time scale, thecatchments have been quantified by the hydrology of either catchment has beenIHACRES analysis. The model yields values of significantly altered by the land-use changes.characteristic response times, volumetricthroughput and the relative contributions to thepeak of the unit hydrograph for each 12-monthperiod, Table 12.
34

5 Catchment evaporation
5.1 Annual catchment water balance temporal variations in precipitation and flow inSections 2.4 and 2.5.
Water balance results from Plynlimon in Mid-Wales show that in the two neighbouring The precipitation data were for most yearscatchments with similar rainfall totals, the 70% derived from the catchment networks by theforested Sevem catchment has a greater water anthmetic mean approach, after the applicationuse than the grassland Wye catchment (Kirby et of the corrections described in Johnson et a]a], 199 1). Over the 1 1 year period 1975-1985 the (1990). A different method was applied for thewater use of the Sevem was 549 mm while in 1983 data. Examinations of 1983 data publishedthe Wye it was 351 mm, the difference being previously revealed that data for certain winterequivalent to 8% of the mean precipitation. A months were in error. Corrected values forsimilar experimental methodology was used in these months were derived using relationshipsthe Balquhidder catchments but direct compari- with other raingauge sites as described inson of these two catchments was found to be Blachie (1993).difficult due to the different rainfall totals, theMonachyle being the wetter catchment by some The streamflow data, expressed as a depth in400 mm per annum. millimetres over the plan areas of the
catchments were obtained from the volumeThe basic method of evaluating an annual flows given by the updated rating curvescatchment water balance involves the accurate modified after intensive current meteringmeasurement of the precipitation input, P and checks on the structures (Hudson et a], 1990).the streamflow, Q. In the Scottish upland A catchment water balance equation can beenvironment both of these measured variables expressed as:are considerably larger than in lowland environ-ments but the measurement is complicated by AE = P - Q ± S (3)large spatial variability, significant snowfall inputand by the flashy nature of the streamflow. The where: AE = actual evaporationestimation of the long-term water balance (P-Q) P = precipitation inputis therefore critically dependent on the accuracy Q = streamfiow outputof measurement of the input variables. S = change in storage
The instrument networks m the Balquhidder The storage terms in the equation comprisecatchments for measuring P and Q were snow, soil moisture and groundwater storages.described in Section 2.2 and the spatial and Over a period of years the cumulative (P-Q)
Table 13 Summnary of the water balance results 1983-1989 for the Monachyle (M) and Kirkton (K) catchmrents
P (mm) 0 (mm) P-Q (mm)
Year M K M K M K
1983 2659 2281 2028 1721 631 560
1984 2648 2215 1929 1781 719 434
1985 2612 2285 2056 1960 556 325
1986 3280 2789 2522 2242 758 547
1987 2255 1899 1724 1592 531 307
1988 2952 2493 2389 2126 563 367
1989 2985 2519 2397 2098 588 421
Mean 2770 2354 2149 1931 621 42383-89
% P 22.4 18.0
35

term becomes a more accurate estimate of AE Evaporation = 0.275 Precipitation - 184 (4)as the storage terms simply fluctuate within a orrange prescribed by the physical characteristics Evaporation = 0.205 Precipitation (5)of the catchment.
There is no obvious grouping of the yearsTable 13 show the annual totals of precipitation before and after the land uses changed, againand streamflow for both catchments from 1983 indicating no apparent effect of the planting orto 1989 inclusive and Figure 27 the annual (P-Q) clearfelling. It is interesting to note (Figure 29)values. The mean annual catchment evaporation that the three years with the lowest evaporation.totals, Monachyle 621 mm (22% of precipitation) 1985, 1987 and 1988, were also the three yearsand Kirkton 423 mm (18%), show that the with the highest proportions of precipitationevaporation is greater from the moorland falling in the surmmer months.catchment than from the forest and grass one.Superficially this appears to contradict the 5.2 Pemn potential transpirationPlynlimon results but it is only valid to make Stimatesdirect comparisons of two catchments if they aresubjected to closely similar precipitation and A catchment study aimed at determining waterPenman E, values. The process studies (Sections use is of limited value unless there is a basis for3.1 and 3.2) and the development of the process comparison with results obtained elsewheremodel, THISTLE (Section 4.2) have shown that and for the extrapolation of results to otherthe distribution of vegetation types with respect areas. A widely used basis for comparingto catchment climatic zones can broadly explain meteorological conditions is the Penman (1948)the overall water use in each catchment and that estimate of potential evaporation, Et.the evaporative behaviour of the forest andgrass vegetation is similar to that found atPlynlimon.
300 -Figure 28 shows the annual differences in theevaporation amounts (Monachyle - Kirkton) Ebetween the catchments. There appears to be a 200downward trend, with the two catchments' 200-evaporation totals becoming closer together. e There is no obvious step or change in slope in tFigure 28 around 1986 to comcide with the a, -changes in land use. C-
A comparison of the (P-Q) values with the cannual precipitation is shown in Figure 29. < I - - - - -
Considering data from both catchments 1983 1984 1985 1986 1987 1988 1989together, there is a general increase incatchment water use with precipitation, Figure 28 Annual evaporation totals for thedescribed by the regression equations: Balquhidder catchments, 1983-89
800 -
800
1983 1984 1985 1986 198719881989 700086
400 E 600 - 839 t ~~~~aE8f
36~~~~~~~~~~58
aL500 - 87
< 200 c400 84c IR~~~~~9
300 - 850 ~~~ ~~~~~~~~~~~~~~87 8
1983 1984 1985 1986 1987 1988 1989 200
*Monactiyle ID Kirkton ~~~1500 2000 2500 3000 3500mi Monachyle r-1 Kirkton ~~Annual P, mm
Figure 27 AnnU'al diference (Monachyle - Krt) FIlgure 29 Annual catchment water use (P-Q) as abetween the catchment evaporation totals fuinction of annual precipitation (P)
36

Table 14 Estimates of annual E, (mm) from each AWS at Balquhidder for the period 1983-88
TF MG UM KH LK
Altitude (m) 135 310 430 668 275
1983 438 496 517 521 4161984 504 557 634 635 518
1985 370 392 464 446 347
1986 415 458 584 558 449
1987 415 443 492 491 389
1988 447 463 527 516 411
Mean 431 468 536 528 422
At Balquhidder an initial network of three The period July 1989 to June 1990 was selectedautomatic weather stations (AWS), Tulloch Farm for a more detailed study because it includesCMF), Monachyle Glen (MG) and Kirkton High data from the lower Kirkton (IX) site within the(KH), was installed over the altitude range and clearfeUled area. By then also, all stations werethis was later supplemented by two further equipped with the more reliable solid statestations, Upper Monachyle (UM) and Lower (Campbell CRIO) loggers and most sensorKirkton (LK), (ohnson & Simpson, 1991). The problems had been rectified. The mean valuesestimates of annual E, totals for the period 1983- of the meteorological variables over this 121988 are summarised in Table 14. Early month period are presented in Table 15.problems with sensors and magnetic tapeloggers required some infilling using well The Penman expression can be presented asdefined inter-site relationships (Blackie, 1987). the sum of an energy balance term and anThe values obtained suggest that E, is greater at aerodynamic termn:the high altitude sites than in the valley bottoms. A R- .EA (6)This is contrary to the traditional assumption, for Et= y. n A ,+yexample in MAFF Technical Bulletin 16 (Ministryof Agriculture ,Fisheries and Food, 1967) that E, where R. =Net radiation;decreases with altitude. However the results EA = Constant x Specific humidity deficit xshown in Table 14 show that there is not a f (wind speed);simple relationship between E, and altitude or A = Slope of the saturated humidity/exposure, as the mean value for the Upper temperature curve at dry bulb temperature;Monachyle site (430 m) is marginally higher Y= C /Xthan that from the higher altitude Kirkton High Cp = Specific heat of air at constant pressure;site (668 m). = Latent heat of water.
_ - UFw.tMonachy19E .on Hih ET
- TuflOd, Fom _ _ - Oner9gyE _ - Eowe F9blon __ rodyn4mc
(U3 \, (U3
E 2 \ e Xv £0~~~~~~~~~~~~~~~~~*
> > - - - -
W W
* A S O N D J F 4 A M 3 S O N D , F A
Months (1989/90) Months (1 989/90)
Figure 30 Monthly mean values of ET for four IYgure 31 Monthly contribution of the energy balanceBalquhidder automatic weather stabons, July 1989 to and aerodynamic terms to the Penman E, estimateMue 1990
37

Table 15 Mean values of meteorological data and totals of Penman Et and its two components from July 1989 toJune 1990
TF MG UM KH LK
A WS data
Solar radiation (Wm2) 91.0 85.6 94.6 94.6 87.7
Net radiation (Wm-2) 41.5 34.5 51.0 43.7 36.0
Air temperature (.C) 8.2 7.6 6.5 5.1 7.4
Wind speed (ms-') 2.24 3.44 4.36 5.89 1.84
Penman terms
E, (mm) 496 - 623 544 437
Energy balance term (mm) 309 257 372 311 266
Aerodynamic term (mm) 187 - 251 233 171
The first term in Equation 6 is normally referred wind speed, specific humidity deficit andto as the energy balance term and the second as temperature and conclude that although thethe aerodynamic term. In Figure 30 the monthly effect of the higher wind speeds at the uppermeans of the daily values of E, are shown for sites is dominant there is still a considerablefour of the stations, indicating a similar ranldng influence from the specific humidity deficit term.of stations to Table 14. The UM site consistentlygives the highest value through the year and the The energy balance term has the variables netLK the lowest value. The percentage radiation and a function of temperature. Detailedcontributions of the energy balance and analysis of the individual variables is againaerodynamic terms to Et for the 12-month given in Blachie & Simpson (1993), and theyperiod, given in Table 16, show that the energy conclude that net radiation is the dominantbalance term is greater than the aerodynamic variable in determining the energy balance termterm for all stations. Their distributions through and hence the summer E, values,the year differ, however and Figure 31 showsthat the energy balance term is the greater m 5.3 Development of the Calder-the summer and the aerodynannic term is Nwo waterouse odelgreater in winter. Newson water use model
To predict catchment water use the Calder-The variables contributing to the aerodynamic Newson approach estimates the water use fromterm are wind speed, specific humidity deficit the main vegetation types and sums the individ-and, less directly, temperature. Values for all ual totals determined by the proportional area ofsites lie in the range 0. 15-0.95 mm day-' with the the catchment covered by each (Calder &ranidng the same as for E, (i.e. the highest value Newson, 1979). The version used here, thefor Upper Monachyle and the lowest for Lower whole catchment annual model of Section 4.2,Kirkton). Blackhe & Simpson (1993) show incorporates a function for heather water use asdetailed analyses of the seasonal patterns of well as the forest and grass components in the
original Calder-Newson expression. Thisapproach therefore uses c]imatological informa-
Table 16 Percentage contnbutions of the energy tion from the automatic weather stations (Sectionbalance term (EB) and the aerodynamic term (AD) in 5.2) and results from the process studiesthe Penman E1 estimate at four sites m the (Sections 3.1 and 3.2)Balqauhidder cat chments
The equations for predicting annual water use inthe catchments are:
Station EB AD
TF 62% 38% irkton (7)UM 60% 40%KH 57% 43% AE=AF[O.28PF+(1-RD/365).FACF.Etp]LK 61% 39% +0.61 .FACGEItG+(AG-0.6 1).FACG.EIF
TF - Tulloch Farm; UM = Upper Monachyle Monachyle (8)
KH = Kirkton High; LK = Lower Kirkton AE=AH(I.P+(1-RD/365).FACH.E)+AG.FACG.Et
38

Table 17 Results of applying the annual model to the Table 18 Results of applying the annual model to theK)rkton data Monachyle data
P-C AE' AE 2 AE 3 P-Q AE1 AE'
1983 560 472 436 436 1983 631 585 590
1984 434 532 489 489 1984 719 645 643
1985 325 444 413 413 1985 556 565 572
1986 547 518 477 501 1986 758 698 707
1987 307 403 365 405 1987 531 538 539
1988 367 425 383 459 1988 563 634 642
1989 421 447 394 495 1989 588 684 686
Mean 423 463 423 457 Mean 621 621 626
Using FACG = 0.65 1 Using IH = 0.21Z Using FACG = 0.53 2 Using IH ° 0.23 and FACG = 0.823 Using FACG = 0.53 and AF and AG held constant
at 0.39 and 0.61 respectively (i.e. no felling)
where AE is the catchment water use; AF' AH (1993) and is thought to be due to widespreadand AG are the proportional areas of forest, moisture stress reducing the transpiration ratesheather and grass respectively, PF and PH are from the grass growing on shallow soils.the annual mean precipitation totals over theforest and heather covered areas respectively, Initially the Monachyle model runs used valuesRD is the number of rain days, ET, EtH and EtG of INTH and FACH of 0.2 and 0.5 respectivelyare the Penman estimates over the forest, taken from Calder (1986) and FACG equal to 1.0.heather and grass areas respectively, FACF, The FACG value for the Monachyle would beFACH and FACG are the factors to be applied to expected to be significantly different from that inEt to give forest, heather and grass transpiration the Kirkton and that obtained from the grassrespectively and I is the proportion of the annual lysimeters as the majority of the grass area inprecipitation lost as interception. The mean the Monachyle is at low altitude and is generallyvalues of P, E, and RD for each vegetation type ungrazed and on wet soils. The model is veryare given in Blaclhe (1993). sensitive to variations in the INTH parameter and
the best agreement with the water balance (P-When this model is applied with the appropri- Q) results was obtained when INTH equalledate values obtained from process studies the 0.21. If the FACG parameter is reduced to aagreement with the catchment water balance value of 0.82 then the INTH parameter has to beestimates is not particularly good, as discussed adjusted to 0.23 to maintain agreement with thein Section 4.2. In an attempt to identify possible (P-Q) results.reasons for the differences, Blaclde (1993)progressively adjusted the parameters in the The optimised models were also used to explainKirkton and Monachyle versions until good the effects of land-use changes on the catchmentagreement with the water balance results was water uses. For the Kirkton the results showachieved. Tables 17 and 18 show the results reductions in annual water uses of 24 mm,from the two most successful runs from the 40 mm, 76 mm and 101 mm, as the area ofKirkton and Monachyle respectively. For the forest is reduced from 39% to 20%. ApplyingKirkton the progressive clear-felling from 1986 the model to the 1983-89 period, but with zerois taken into account with the proportional area forest cover, gives an estimated mean annualof forest reducing from 0.39 in 1985 to 0.20 in water use of 256 mm (i.e. 167 mm lower than1989. The value of FACF was taken to be 1.0 the estimate with 39% forest).while FACQ was varied between 0.53 and 1.0;Hall and Harding (1993) showed that for one The prediction of the effects of afforestation inupland grass site at Balquhidder FACG for a the Monachyle indicates that the 1986 level ofcomplete year should be around 0.75. The planting (14%) will increase the water use byoutput from the model run which was closest to 43 mm when the forest matures whereasthe water balance (P-Q) data was when FACG increasing the area under forest to 31% and 56%was reduced to 0.53. This is significantly less would produce annual water use increases ofthan the value suggested by Hall and Harding 96 mm and 172 mm respectively.
39

5.4 Impact of land-use change on Direct comparisons of the flow statisticswater resources between the two catchments do not allow the
impact of land-use change to be assessed. ThisIn the previous sections of this report the water is because comparisons of the water useuse of catchments with various types of land use between two catchments is of limited signifi-has been investigated using a number of cance as a result of the large differences inprocess and catchment studies. These studies precipitation and Penman potential evaporationhave focused on understanding and modelling between the two catchments. To determine theevaporation and transpiration processes and on sensitivity of low flows to land-use change it isestimating the impact of land-use change on therefore necessary to model the influence offlows. Although the implications for water land use change on each catchment and thenresources have been generalised to other derive low flow statistics from the simulatedregions of the UK (Newson & Calder, 1989) time series.there have been only a limited number ofdetailed studies of the water resource implica- Mean flowtions of land use change (Calder & Newson,1979). Comparison of the observed and simulated
mean flows (Table 19) shows that the mean ofIn this section the flow predictions from the land the modelled flows is within 5% of the observeduse conceptual model (Eeles & Blackie, 1993), mean. The mean flow, of the simulated recordsdescribed in Section 4.2, are analysed using for the longer period 1964-88 is, in bothflow duration curves, annual minimum seres catchments, lower than for the observed recordand storage-yield relationships. By simulating 1984-88.flows for various land-use scenarios the impactof land-use change on water resources can be The mean flow was determined from theestimated. This analysis is described in more simulated flow records 1964-88 (Table 20) fordetail in Gustard and Wesselink (1993). The various proportions of forest. For example, inmeasured and simulated daily flow series were the extreme land-use change scenario theanalysed using procedures described in the Monachyle mean flow decreased from 0.404 toLow Flow Studies report (Institute of Hydrology, 0.315 m 3 Sa (i.e. by 22%) as the proportion of1980) for deriving flow duration curves and forest in the catchment increased from 0 toannual minimum series and by Brown (1991) for 100%. In the Kirkton catchment the mean flowderiving storage-yield relationships. Table 19 decreased from 0.325 to 0.248 m 3 s-' (i.e. bysummarises the low flow statistics derived from 24%) when the same change in land use wasthe observed and simulated data. simulated.
Table 19 Summary of flow statistics for observed (Obs) and sirnulated (Sim) data
Monachyle KirktonObs Sim Sim Obs Sim Sim
1984-88 1984-88 1964-88 1984-88 1984-88 1964-88
Mean flow (m3s') 0.517 0.525 0.404 0.418 0.402 0.298
Flow duration curve
095 (m3s') 0.027 0.028 0.020 0.057 0.028 0.023
050 (m3 sn') 0.192 0.251 0.188 0.243 0.209 0.150
Flow frequency curve
MAM10 (m3s") 0.019 0.028 0.019 0.051 0.027 0.020
Storage for given yield' and return period of 20 years
Yield 20% n.a. n.a. 2.2 n.a. n.a. 3.3Yield 50% n.a. n.a. 10.9 n.a. n.a. 6.9Yield 80% n.a. n.a. 25.6 n.a. n.a. 36.4
Yield as percentage of mean flow for 0% forest. Storage as percentage of annual average runofffor 0% forest.n.a. a not applicable
40

Table 20 Sumrnary of flow statistics for land-use change simulation over the period 1964-1988
Monachyle Kirkton
Forest cover (%) 0 100 0 100
Mean flow (ms-1') 0.404 0.315 0.325 0.248
Flow duration curve
Q95 (m3s' ) 0.020 0.017 0.024 0.020
Q50(m3s ' ) 0.188 0.130 0.165 0.121
Flow frequency curve
MAM10 (m3s-') 0.019 0.016 0.020 0.019
Storage for given yield ' and return period of 20 years
Yield 20% 2.8 4.9 2.7 4.6
Yield 50% 13.7 24.8 14.1 23.7
Yield 80% 32.0 56.3 32.0 51.1
Yield as percentage of mean flow for 0% forest. Storage as percentage of annual average runofffor 0% forest.
1000
200 __ i... - _ _ - _ _
100
, __20A -
0.202 2__
0.1
0.1 1 5 10 20 30 40 60 70 80 90 95 99 99.5 99.9
Percentage of time discharge exceeded
One day averages1964-88
_.._. Monachyle Burn 0% forest-. - .- Monachyle Bum 100% forest
........... Kirton Bum 0% forest
IFgure 32 Flow duration curves for the Balquhidder catchments Kirkton Bum 100% forest
Flow duration curves 32). To facilitate comparison of curves betweenthe catchments and with different land uses the
Flow duration curves were derived for each discharge was standardised by the mean of thecatchment from the simulated data for the simulated flow series for 0% forest. In bothperiod 1964-88 for 0 and 100% forest (Figure catchments the flow duration curve shifts down
41
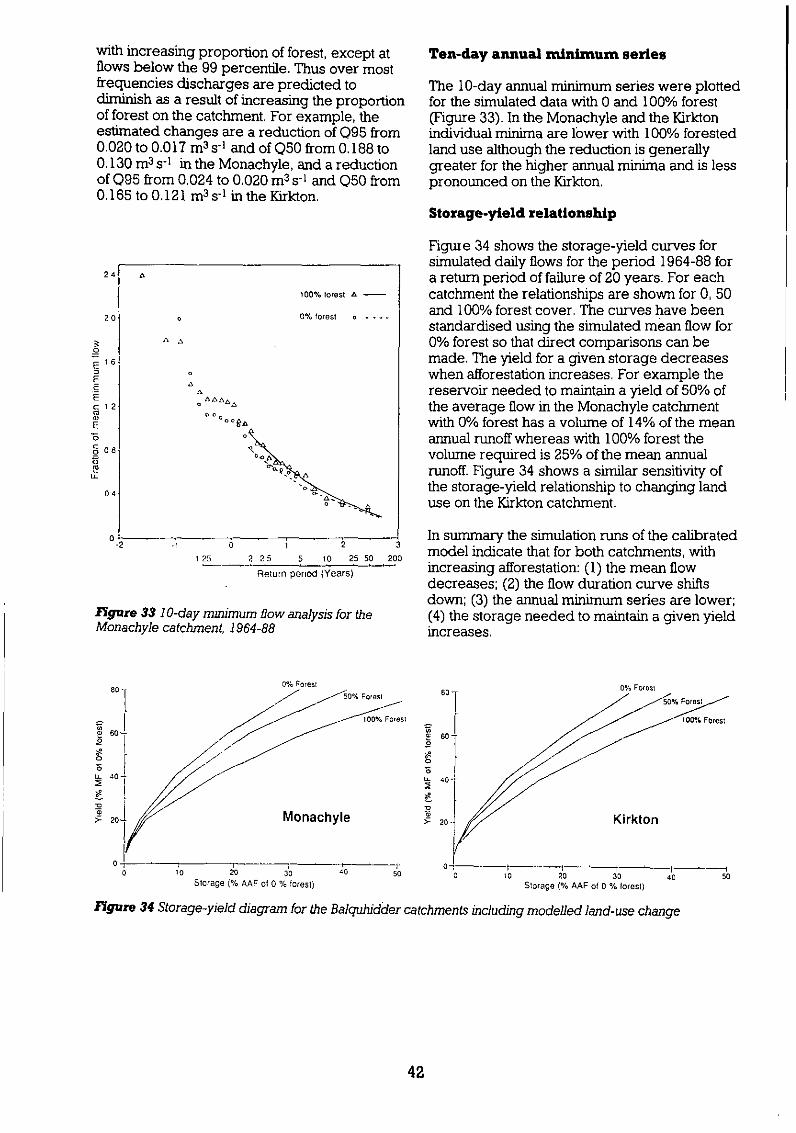
with increasing proportion of forest, except at Ten-day annual minimum seriesflows below the 99 percentile. Thus over mostfrequencies discharges are predicted to The 10-day annual minimum series were plotteddiminish as a result of increasing the proportion for the simulated data with 0 and 100% forestof forest on the catchment. For example, the (Figure 33). In the Monachyle and the Kirktonestimated changes are a reduction of Q95 from individual minima are lower with 100% forested0.020 to 0.0 17 m3 s-' and of Q50 from 0.188 to land use although the reduction is generally0.130 m3 s-1 in the Monachyle, and a reduction greater for the higher annual minima and is lessof Q95 from 0.024 to 0.020 m3 s-1 and Q50 from pronounced on the Kirkton.0.165to O.121 m 3 s-1 inthe Kirkton.
Storage-yield relationship
Figure 34 shows the storage-yield curves forsimulated daily flows for the period 1964-88 for
2 4 A a return period of failure of 20 years. For each100% f,st - catchment the relationships are shown for 0, 50
2 0 o 0-/. forest o and 100% forest cover. The curves have beenstandardised using the simulated mean flow for
B ^ A 0% forest so that direct comparisons can be0
-6 made. The yield for a given storage decreasesE o when afforestation increases. For example theE
A reservoir needed to maintain a yield of 50% of12 A the average flow in the Monachyle catchment
E p °-O¢e with 0% forest has a volume of 14% of the meanO 009 annual runoff whereas with 100% forest the
o 0 d 9 rX volume required is 25% of the mean annualr4 runoff. Figure 34 shows a similar sensitivity of
0 4 the storage-yield relationship to changing landuse on the Kirkton catchment.
o . 2 In summary the simulation runs of the calibrated-2 125 _ 2 25 5 10 2550 200 model indicate that for both catchments, with
Return period (Years) increasing afforestation: (1) the mean flowdecreases; (2) the flow duration curve shiftsdown; (3) the annual minimum series are lower;
flgure 33 1 0-day mmimum flow analysis for the (4) the storage needed to maintain a given yieldMonachyle catchment, 1964-88 increases.
0% Folest 0% Forest
| / /S~~~~~~~~~~~0% Forest 60 Forest0
0%69 1 / 1OO .Fo est _ [ / / / 00% Fores
60
140~~~~~~~~~~~~~~U 0
20 ~~~~~~~Monachyle 20Krko20
2° 1 / / 01/ /
0 10 20 30 40 so 0 1o 20 30 40 50
Storage (% AAF of 0 % forest) Storage (% AAF of 0 % forest)
flgure 34 Storage-yield diagram for the Balquhidder catchments including modelled land-use change
42

6 Fluvial sediment studies
Fluvial sediment loads have some of the most impact, or almost unpredictable, as in riverwide-ranging irnplications for stream and river bank collapse. This mixture of predictable andwater qLuality. Frequent problems associated unpredictable processes is notorious inwith sediments are reported, including the sediment analyses, quantification of river loadsquality of public water supplies (Greene, 1987), and catchrnent modelling.reservoir siltation (McManus & Duck, 1985), fishhabitats (Mills, 1985) and the transport of In the Balquhidder catchments the sedimentcontaminants (Walling & Kane, 1982). problem appears to be typical of most Highland
catchments. Natural causes of erosion includeSuspended and bed loads are controlled by raindrop impact, streamwater, frost, and surfacemany factors, from the soils and geology of the drying and craclkng. These processes occur tocatchment to the release and transport mechan- varying degrees in both catchments every year:isms such as rainfall intensity and river dis- in a study by Stott (1987) on the catchmentcharge. The release of sediment can at times be sediment sources, the erosion of stream bankspredictable, for example erosion by raindrop by water action was identified as the dominant
Table 21 Summary of the sedirnent discharge results from the Balquhidder catchments, 1983-89
MonachyleYear P SSC n SSL BL TSL V
1983 2659 12.6 245 293 2 295 38.31984 2648 20.2 91 280 2 282 36.61985 2612 8.8 71 326 2 328 42.61986 3280 40.9 179 934 3 937 121.71987 2255 58.9 438 909 1 910 118.21988 2952 25.0 741 493 2 495 64.31989 2985 40.0 739 1419 3 1422 184.7
1983-85 2639 14.0 407 300 2 302 39.2(before ploughing)
1986-89 2868 38.9 2097 939 3 942 122.3(after ploughing)
KlrktonYear P SSC n SSL BL TSL Y
1983 2281 65.7 123 321 20 332 48.51984 2215 49.1 94 275 13 288 42.01985 2285 23.9 116 526 17 543 79.31986 2789 154.2 319 4353 27 4380 639.41987 1899 51.7 432 599 6 605 88.31988 2493 123.3 1096 4044 14 4058 592.41989 2519 121.1 876 3610 31 3641 531.5
1983-85 2260 48.0 333 371 17 388 56.6(before clearfelling)
1986-89 2425 114.9 2722 3151 19 3170 462.8(during clearfelling)
P Total annual precipitation, mm SSL Suspended sediment load, tonnesSSC Mean suspended sediment concentration, mg 11 BL Bed load, tonnesn Number of samples in penod TSL Total sediment load, tonnesY Sediment yield, t ]an 2
43

natural process. In forested catchments there is ment of rating curves were initially used toalso the complication of man-induced erosional estimate the loads. Because of samplingprocesses such as increased drainage, plough- problems at high flows, another method wasing, soil exposure, roads and vehicles. The tried later: tethering a sampler to the streamresults from the sediment studies from both bed throughout flood events. Unfortunately thecatchments are discussed below. sampler had too small a capacity and was
frequently washed away and damaged. The6.1 Sedimet sources ithin theoriginal rating curve method, with extrapolation6.1 Seddient sources within the into high flow ranges, has been used to estimate
Balquhidder catchments the load since 1987. Table 21 gives the bestSediment sources within both catchments were estimates of the annual bedloads.extensively monitored between 1984 and 1986(Stott, 1987). The main sources were found to be 6 Suspended sedimentthe tributary streams, with suspended loadsdominating the bedloads by a ratio of 30:1. The quantification of the suspended sedimentComparing the two catchments, the monitored discharged from a catchment usually relies ontributaries in the Kirkton catchment had twice measurements of the sediment concentration inthe sediment yield of the monitored tributary in the stream. Table 21 shows that there have beenthe Monachyle catchment. Size analyses on significant changes in the mean annualsamples taken from the tributary banks showed suspended sediment concentrations (SSC) forthat between 70% and 90% of the material was both catchments between 1983-85 and 1986-89.less than 2.8 mm in diameter, i.e. in the sizerange likely to be transported in suspension. Although these coincide with the land-usePebble tracing showed that movement of the changes in both catchments, the samplingmaterial in the bed was very slow, especially in schemes have also changed from eventthe forested catchment where organic debris sampling in 1983-86 to continuous automaticjams hold back significant amounts of material. sampling since 1987. This has resulted in theTherefore, as the relatively small amounts of number of samples taken at low flows increas-bedload move very slowly, it is unlikely that ing considerably, although the number ofsignificant changes will be detected at the samples at high flows is similar. The samplecatchment outfalls. distribution in the 1987-89 period will therefore
be more closely related to the flow durationsSince the work of Stott was published, the than the 1983-86 samples, which are biased tosediment sources have been monitored by the higher flows. Therefore the mean SSC istaking spot samples in storm events around likely to be overestimated in the 1983-86 perioderoding sites. This work concentrated on the as SSC generally increases with flow.clearfelling in the Kirkton, as resources werelimited, and whereas several other studies havebeen done on land cultivation (Robinson & Blyth,1982; Francis & Taylor, 1989) little work hasbeen done on clearfelling.
By several series of spot samples taken fromforest road drains, the heavy use of roads in the 30
timber extraction phase has been identified as amajor new source of suspended sediment. Road * 25
surfaces can become very loose, especially in 20
confined turning areas, and the route taken by -2 0
surface water into the drains and tributaries is g , N -,critical in determining how much sediment 15 ._ ,. \//
reaches natural water courses. 0 / *._ . /
. Monachylo 1986689
6.2 Bedload 0.5 , Monachyl 198385K,rkion' 1gBB-89
Bedload measurements in both catchments have . K........ Krkion 1983*85
shown that bedload contributes a very small °-0 5 0 Dpercentage of the annual catchment load. 109. FlowWithout the use of traps and mechanical diggersor sophisticated measurement techniques suchas developed by Reid (1984) the sampling is concentration for the Monachyle and Kirktonvery difficult. Spot sampling and the develop- catchments
44

Table 22 Annual rating equations of suspended sedirnent concentrations (SSC) and streamfiow (Q)
Kirkton Monachyle
1983 log (SSC) = 0.960 + 1.292 log (0) (r2 = 0.560) 1983 log (SSC) = 0.691 + 0.818 lg (0) (r2 = 0.321)1984 log (SSC) = 1.056 + 1.186 log (0) (r9 = 0.616) 1984 log (SSC) = 0.910 + 0.443 log (0) (r2 8 0.113)1985 log (SSC) = 0.784 + 1.732 log (0) (r2 = 0.567) 1985 log (SSC) = 0.768 + 0.275 log (Q) (r2 a 0.134)1986 log (SSC) = 1.767 + 0.885 log (0) (r2 = 0.252) 1986 log (SSC) = 1.331 + 0.239 log (Q) (r9 = 0.087)1987 log (SSC) = 1.245 + 0.034 log (Q) (r2 = 0.000) 1987 log (SSC) = 1.076 + 0.011 log (0) (r2 = 0.000)1988 log (SSC) = 1.636 + 0.416 log (0) (r2 = 0.061) 1988 log (SSC) = 0.996 + 0.289 log (0) (r2 = 0.040)1989 log (SSC) = 1.901 + 0.594 log (0) (r2 = 0.177) 1989 log (SSC) = 1.491 + 0.350 log (0) (r2 = 0.132)
r2 = Coefficient of determination
The annual rating equations for SSC from both mean SSC for each individual flow groupcatchments (Table 22) show that there have remain independent of neighbouring groupbeen changes in the gradient of the equations values, unlike a global rating curve.and also in the scatter of data points. TheMonachyle equations show a steady decrease in Averages are calculated from each group ofthe gradient from 1983-87 with a possible SSC data and applied to the flow data to deriveupturn in the last two years. The scatter of data, annual loads (Table 21). By using this methodgiven by the coefficient of determination, is the large smoothing effect, using logarithmiclarge throughout, but particularly so in the data in rating equations, is provided. Bedloadperiod 1986 to 1988. calculation has proved more difficult because of
the problems with sampling. The bedload ratingThe Kirkton equations show a much clearer equations derived from the 1983-85 period havedifference between the 1983-85 and 1986-89 been applied to subsequent years of flow datadata. The gradient becomes much gentler, to provide an estimate of the loads in laterbecause of increases in the low flow concentra- years.tions, and there is a large increase in the scatter.These findings compare favourably with results There is clear evidence from Table 23 and thefrom the Loch Ard catchments, some 20 km double mass curve of monthly streamflow andsouth of Balquhidder (Ferguson et a), 1992), sediment load (Figure 36) that sediment loads inwhere clearfelling was also being studied. both catchments have increased since 1986. The
increase is much greater for the forested KirktonFigure 35 shows the mean SSC in specific flow catchment (2782 t) than for the moorlandranges, group averages, for the two periods Monachyle (640 t). However, not all of thebefore and after the land uses changed. increase should be attributed to forestry: annualAlthough the SSC are shown in logarithmic units precipitation has also increased since 1986.the mean values were calculated from thenormalised data. Both catchments showincreases in SSC in all flow ranges, but the 12increase is greater in low flows than in higher Kirkton
flows. The increase in SSC in the Monachyle low -j ....... Monachyle
flows is around 3 times, whereas in high flows it 'is around 1.2 times. For the Kirkton the increase ° 1989
in SSC at low flows has been around 15 times, 8 8
whereas at high flows it is around 4 times. 6 1988
06
6.4 Sediment loads 094
The calculation of a catchment annual sediment m 1
load from data comprising spot samples is 1988
fraught with problems. The unreliability of the 0 2 1985 .............rating curve method has been discussed many 1985 ...... ir87
times before, notably in Walling & Webb (1981) 0and Ferguson (1986). For a highly variable data ° 5 ° is
set, such as the Balqubidder data, the group Cumulative flow (thousand mm)averages of SSC are considered to be the best lngure 36 Double mass curve for the Monachyle andmethod for the suspended load calculation. The Kirkton monthly flows and suspended sediment loads
45

Table 23 Division of the annual suspended sediment loads (tonnes) into the 'natural load 'and the 'forestry load'
Monachyle Klrkton
Natural Forestry Natural Forestry Area felled (ha)
1986 443 4914 711 3642 411987 247 662 235 364 311988 344 149 358 3686 23
1989 404 1015 672 2938'1989 1269 150 2110 1500 7
Mean 576 363 853 2298
* 1989 data denrved from 1983-8S relationships * Ploughing and planting+ Estimated division of 1989 data - see text
The 1986-88 pattern in the forestry loads in the year. Therefore the Monachyle 1989 forestryMonachyle indicates a similar trend to the one load has been estimated to be similar to thederived from the Coalbum catchment data 1988 load: the remaining load is considered to(Robinson & Blyth, 1982), although the peak be natural load (Table 23). As similar rainfallsediment load was delayed by about a year in was experienced in the Kirkton, the natural loadthe Monachyle. The Monachyle load division has also been increased by the same ratio asalso shows a large increase in forestry load in the Monachyle increase and the forestry load1989. adjusted.
As there was little visual evidence of reactiva- The Kirkton catchment results show that forestrytion of plough lines in this period, the load loads are high for wet years when felling wasincrease is assumed to be due to the exception- greatest (1986 and 1988). The very dry yearally heavy rainfall at the start of 1989. In the first 1987 shows a very low sediment load, showingthree months of 1989 a total of 1402 mm was that even during the most active felling, highrecorded in the Monachyle catchment, i.e. 47% rainfall is still needed to transport the sediments.of the annual total. This appears to have activat- The adjusted 1989 load also fits in with a year ofed many new natural sediment sources which reduced forestry activity within the catchment,continued to supply material throughout the even though the rainfall was high.
46

7 Conclusions
The ten years of research at Balquhidder have A catchment evaporation model (THISTLE) hasproduced a wealth of results concerning upland been developed from the process studiesafforestation and water resources in Highland carried out at sites within the BalquhidderScotland. The original objectives of the study, catchments and other UK studies. The majorlisted at the start of this report, have mostly vegetation types and areal cover have beenbeen fulfilled. identified from ground and aerial surveys and
related to catchment topography. Intensive siteThe Balquhidder study has rephcated the studies on the evaporation rates from grass andPlynlimon study in mid-Wales looking at the the interception of forest have been carried outeffects of upland afforestation on water through different seasons to develop theresources. In each case two catchments have individual components of the compositebeen studied, one partially covered by a mature catchment evaporation model,coniferous forest and the other by grassland(Plynlimon) or moorland (Balquhidder). The effects on streamflow of the land-use
changes in the catchments have been assessedInstrument networks have measured using existing models. These have shown howprecipitation input, storage changes within the sensitive upland catchments can be to changes,catchments and the streamflow from the although these changes are often difficult tocatchments. From these data the annual water detect and require long-term monitoring. It hasuse has been shown to average 423 mm for the also been proposed that the models can beKirkton and 621 mm for the Monachyle. used to design forest developments and to
reduce their impacts to a minimum. CatchmentFive automatic weather stations distributed water yield models have been used with thethroughout the catchments have shown that in Balquhidder data to indicate the potential effectsgeneral potential evaporation increases with of forestry on catchment reservoir management.altitude and exposure although the relationshipis not simple in these catchments with rugged The Balquhidder research has therefore fulfilledtopography. Wind speed, specific humidity most of the original objectives of the project anddeficit and net radiation control the potential in doing this has produced a range of researchevaporation distribution with the latter term results which will be of value to water resourcesbeing the dominant. Site studies of evaporation management. The application of the results torates from grass, heather and forest have shown other regions of Scotland should be the nextthat grass has a very low annual evaporation step and also the implications of changes inrate compared to heather and forest and is forestry practice to the results. The need toestimated to be 0.75 of the annual potential continue the momtoring at Balquhidder isevaporation. Distribution of the main vegetation frequently demonstrated in the demands fortypes in an upland catchment is critical in long-term precision data sets which well-determining the catchment evaporation rate. established research catchments can supply.
47

References
Anderson, A.R. & Pyatt, D.G. 1986. Interception of Calder, lI.R. 1990. Evaporation in the Uplands. Johnpreclpitation by pole stage Sitka spruce and Wiley, Chichester.lodgepole pine and mature Sitka spruce at KielderForest, Northumberland. Forestry, 59, 29-38. Calder, I.R. & Newson, M.D. 1979. Land use and
upland water resources - a strategic look. Wat.Anderson, A.R., Pyatt, D.G. & Stanard, J.P 1990. The Resour. Bull., 16, 1628-1639.effects of clearfellmng a Sitka spruce stand on thewater balance of a peaty gley soil at Kershope forest, Calder, I.R. & Newson, M.D. 1980. The effects ofCumbria. Forestry, 63, 51-71. afforestation on water resources in Scotland. In: Land
assessment in Scotland. (Proc. Edinburgh Symp.). R.Bates, C.G. & Henry, AJ. 1928. Forest and stream- Scottish Geog. Soc., 5 1-62.flow experiment at Wagon Wheel Gap, Colorado,Mon. Weather Rev, Suppl., 30, 1-79. Calder, I.R., Hall, R.L., Harding, RJ. & Wright, I.R.
1984. The use of a wet surface weighing lysimeter inBell, J.P. & McCulloch, J.S.G. 1969. Soil moisture ramfall interception studies of heather. J Climateestimation by the neutron method in Britain. j Appl. Meteorol. 23, 103-105.Hydrol. 7, 415-433.
Calver, A. 1988. Calibration, sensitivity andBlacide, J.R. 1987. The Balquhidder catchments, validation of a physically based rainfall-runoff model.Scotland: the first four years. Trans. R. Soc. Edin., 78, J Hydrol. 103, 103-105.227-239.
Christophersen, N., Seip, H.M & Wright, R.F. 1982.Blacide, J.R. 1993. The water balance of the A model for streamwater chemistry at Birkenes,Balquhidder catchments. JHydrol. 145, 239-257. Norway. Wat. Resour. Res. 18, 977-996.
Blacide, J.R. & Eeles, C.W.O. 1985. Lumped Clarke, R.T. & Newson, M.D. 1978. Some detailedcatchment models. In: Anderson, M.G. & Bunrt, T.P. water balance studies of research catchments. Proc.(eds.) Hydrological Forecasting. John Wiley, R. Soc. Lond, 363, 21-42.Chichester, 311-345.
Devenish, M. 1986. The United Kingdom precip-Blackde, J.R. & Newson, M.D 1986. The effects of itation composition monitoring networks. Warrenforestry on the quantity and quality of runoff in Spring Laboratory Report No. LR 584 (AP) M.upland Britain. In J.F. Solbe (ed). Effects of Land Useon Fresh Waters, Ellis Horwood. 398-412. Drew, 1. 1992. The movement of bedload material in
two Scottish nvers. Unpubhshed PhD thesis,Blackie, J.R. & Simpson, T.K.M. 1993. Climatic University of St Andrews.variability within the Balquhidder catchments and itseffect on Penman potential evaporation. j Hydrol. Eeles, C.W.O. & Blackie, J.R. 1993. Land-use145, 371-387. changes in the Balquhidder catchments simulated by
adailystreamflowmodel J Hydrol. 145, 315-336Bosch, J.M. & Hewlett, J.A. 1982. A review ofcatchment experiments to determine the effect of Ferguson, R.I. 1986. River loads underestimation byvegetation changes on water yield and rating curves. Wat. Res. Research, 22, 74-76.evapotranspiration. JHydrol. 55, 3-23.
Ferguson, R.I., Grieve, I.C. & Harrison, DJ. 1992.British Standards Institute 1969. Long-base weirs. Disentangling land-use effects on sediments yieldsMethods of measurement of liquid flow in open from year to year climatic variability. In: Sedimentchannels. No. 3680, Part 4B. and stream water quality in a changing environment:
trends and explanation (Proc. Vienna Symp.). L/AHSBrown, R.P.C. 1991. Reservoir storage yield analysis Publ. No. 203, 13-20.using the annual failure method. JInst. Water Environ.Manage. 5, 116-122 Ford, E.D. & Deans, J.D. 1978. The effects of canopy
structure of stemfiow, throughfall and interceptionCalder, I.R. 1976. The measurement of water losses loss in a young Sitka spruce plantation. J Appl. Ecol.,from a forested area using a 'natural' lysimeter. 15, 905-917.JHydrol, 30, 311-325.
Forestry Commission 1988. Forests and waterCalder, I.R. 1986. The influence of land-use change guidelines, Forestry Commission, Edinburgh.on water yield in upland areas of the UK. J Hydrol.88, 201-212. Forestry Commission 1989. Forestry Commission
Annual Report 1988/9.
48

Francis, I,S. & Taylor, J.A. 1989. The effect of forest two mountain experimental basins. In: Hydrology indrainage operations on upland sediment yields: a Mountamious Regions (Proc. Lausanne Symp.) LAHSstudy of two peat-covered catchments. Earth Surf Publ. No. 193, 275-282.Processes, 14, 73-83.
Institute of Hydrology 1980. Low Flows StudiesGash, J.H.C., Wright, I.R. & Lloyd, C.R. 1980. Report No.1, Institute of Hydrology, Wallingford.Comparative estimates of interception loss from theconiferous forests in Great Britain. JHydrol.48, Jakeman, AJ, Littlewood, I.G. & Whitehead, P.G.89-105 1990. Computation of the instantaneous unit
hydrograph and identifiable component flows withGreene, L.A. 1987. The effect of catchment application to two small upland catchments. J Hydrol.afforestation on public water supplies in Strathclyde 117, 275-300.Region, Scotland. Trans. R. Soc Edin., 78, 335-340.
Jakeman, A.J., Littlewood, I.G. & Whitehead, P.G.Greene, L.A. & Taylor, J.A. 1989. Catchment 1993. An assessment of the dynamic responseafforestation and water supply in Strathclyde Region. characteristics of streamflow in the Balquhidderj IWEM, 3, 288-294. catchments. j Hydrol. 145, 337-355.
Gross, R., Eeles, C.W.O. & Gustard, A. 1989. Johnson, R.C. 1988. Changes in the sediment outputApplication of a lumped conceptual model to FREND of two upland drainage basins during forestry land-catchments. IAHS Publ. 187, 309-320. use changes. In: Sediment Budgets (Proc. Porto
Alegre Symp.). IAHS Pub. No. 174, 463-471.Gustard, A. & Wesselink, A.J. 1993. Impacts of land-use changes on water resources: Balquhidder Johnson, R.C. 1989. The accuracy of precipitationcatchments. JHydrol. 145, 389-401. measurement in the Balquhidder experimental
basins. In: Precipitation Measurement (Proc. WMO/Hall, R.L. 1985. Interception studies of heather using IAHS workshop, St. Moritz), 41-44.a wet-surface weighing lysimeter system. JHydrol.81, 193-210. Johnson, R.C. 1990. The interception, throughfall and
stemfiow in a forest in Highland Scotland andHall, R.L. 1987. Processes of evaporation from comparison with other upland forests in the UK. jvegetation of uplands of Scotland. Trans. R. Soc. Hydrol. 188, 281-287.Edin., 78, 379-384.
Johnson, R.C. & Hudson, J.A. 1987. Flow gauging inHall, R.L. & Harding, R.J. 1993. The water use of the two Scottish upland catchments. In: First BHSBalquhidder catchments: a processes approach. National Hydrology Symp., Hull, 35.1-35.2.j. Hydrol. 145, 285-314.
Johnson, R.C., BlaciGe, J.R., Hudson, J.A., Simpson,Harriman, R. & Miller, J.D. 1994. The effects of T.K.M., Harding, RJ. & Wright, I.R. 1989. Progressforestry practices on water quality and biota in the report on the Balquhidder catchment studies andBalquhidder catchments 1983-1993. Report to the process studies 1988/89. Institute of Hydrology,Scottlsh Office, Enviromnent Department. Wallingford.
Harriman, R., Morrison, B.R.S., Caines, L.A., Collen, Johnson, R.C., Blackle, J.R. & Hudson, J.A. 1990.P. & Watt, A.W. 1987. Long-term changes in fish Methods of estimating precipitation inputs to thepopulations of acid streams and lochs in Galloway, Balqubidder experimental basins, Scotland. In:South west Scotland. Water, Air & Soil Poll. 32, 89- Hydrology min Mountainous Regions (Proc. Lausanne112. Syrmp.) AL4HS Publ. No. 193, 7-14.
Hornbeck, J.W. 1975. Streamflow response to forest Johnson, R.C. & Simpson, T.K.M. 1991. The automaticcutting and vegetation. Wat. Resour. Res. 11, 1257- weather station network in the Balquhidder1260. catchments, Scotland. Weather, 46, 47-50.
Homnung, M., Reynolds, B., Stevens, PA. & Neal, C. Johnson, R.C. & Law, J.T. 1992. The physical1987. Stream acidification min the UK: evaluation of characteristics of the Balquhidder catchments.causes and possible ameliorative measures. In: Institute of Hydrology, Wallmingford.Forest Hydrology and Watershed Management(Proc. Vancouver Symp.) IAHSPubl. No. 167, 65-74. Kirby, C., Newson, M.D. & Gilman, K. 1991.
Plynlimon research: the first two decades. -Institute ofHudson, J.A. 1988. The contribution of soil moisture Hydrology Report No. 109. Institute of Hydrology,storage to the water balances of upland forested and Wallingford.grassland catchments. Hydrol. Sci. J, 33, 289-309.
Law, F. 1956. The effect of afforestation upon yield ofHudson, J.A., Johnson, R.C. & Blackie, J.R. 1990. water catchment areas. j Br WaterworksAssn, 38,Choice and cahbration of streamflow structures for 484-494.
49

McManus, J, & Duck, R.W. 1985. Sediment yield Robson, Aj., Whitehead, P.G. & Johnson, R.C. 1993.estimated from reservoir siltation in the Ochil Hills, An apphcation of a physically based semi-Scotland. Earth Suff Processes, 10, 193-200. distributed model to the Balquhidder catchments.
JHydrol, 145, 357-370.Mills, D.H. 1985. The effects of afforestation onsalmon and trout rivers and suggestions for their Sevruk, B. 1989. Reliability of precipitation measure-control. In: J.F. Solbe (ed.), Effects of Land Use on ment. In: Sevruk, B. (Ed.), Precipitation Measurement,Fresh Waters, Ellis Horwood, 422-431. Proc. Workshop on Precipitation Measurement,
St.Montz, WMO / IAHS / ETH Zurich, 13-19.Ministry of Agriculture, Fisheries & Food 1967.Potential Transpiration. Tech. Bull. 16. HMSO, Sevruk, B. & Hamon, W.R. 1984. InternationalLondon, 77pp. comparison of national precipitation gauges with a
reference pit gauge. WMO Instruments andNelder, J.A. & Mead, R. 1965. A Simplex method for Observing Methods, Report No. 17, 13Opp.function mmnimisation. Comput. J 7, 308-3 13.
Soutar, R.G. 1989. Afforestation and sediment yieldsNewson, M.D. & Calder, I.R. 1989. Forests and water in British fresh waters. Soil Use & Manage., 5, 82-86.resources: problems of prediction in a regionalscience. Phil. Trans. R. Soc. London, B 324: 283-298. Stott, T.A. 1987. Forestry effects on sediment sources
and yields in the Balquhidder catchments, centralPenman, ].L. 1948. Natural evaporation from open Scotland. PhD thesis, University of Stirling.waters, bare soil and grass. Proc. R. Soc. London, A193, 120-145. Strangeways, l.C. 1976. The long-term performance
of a network of automatic weather stations and theReid, L., Brayshaw, A.C. & Frostick, L.E. 1984. An factors affecting this. Proc. Tech. Conf. on automaticelectromagnetic device for automatic detection of weather stations, Reading University, 24-45.bedload motion and its field applicationSedimentology, 31, 269-276. Swank, W.T. & Crossley, D.A. (Editors) 1988. Forest
Hydrology and Ecology at Coweeta. EcologicalRoberts, A.M. 1989. The catchment research data Studies. No. 66. Springer-Verlag. New York. 469pp.base at the Institute of Hydrology. IH Report No. 106.Institute of Hydrology, Wallingford. Waling, D.E. & Kane, P. 1982. Temporal variations of
suspended sediment properties. In: Recent develop-Roberts, G., France, M., Johnson, R.C. & Law, L.T. ments in the Explanation and Prediction of Erosion1993. The analysis of remotely sensed images of the and Sediment Yield (Proc. Exeter Symp.) L4HS PublBalquhidder area of Scotland for estimating percent- No. 137, 409-419.ages of land cover types. j Hydrol 145, 259-265.
Walling, DE. & Webb, B.W. 1981. The reliability ofRobins, N.S. & Mendum, J.R. 1987. Geology and suspended sediment load data. In: Erosion andHydrogeology of Kirkton Glen, Balquhidder. In: Sediment Transport Measurement (Proc. FlorenceHydrogeology in Scotland. BGS Report 87, British Symp.) lAHS-Publ No. 133, 177-194.Geological Survey, Edinburgh.
Wright, I.R. 1990. A lysimeter for the measurementRobinson, M., and Blyth, K. 1982. The effects of of evaporation from high altitude grass. In:forestry drainage operations on upland sediment Hydrology in Mountainous Regions (Proc. Lausanneyields: a case study. Earth Suff Processes 7, 85-90. Symp.) IAHS Publ No. 193, 79-86.
Robinson, M., Jones, T.K. & Blachce, J.R. 1993. The Wright, l.R. & Harding, RJ. 1993. Evaporation fromCoalburn catchment experiment - 25-year review. natural mountain grassland. j Hydrol. 145, 267-283.Institute of Hydrology, Walingford, 29pp
50

The Balquhidder Catchment and Process StudiesA special issue of journal of Hydrology (Volume 145 Nos. 3-4), published 1993
CONTENTS
ForewordP G Whitehead & I R Calder
1. Experimental basin studies - an 10. Climatic variability within the Balquhidderinternational and historical perspective of catchments and its effect on Penmanforest impacts potential evaporationP G Whitehead & M Robinson J R Blaclie & T K M Simpson
2. An introduction to the research in the 11, Impact of land-use change on waterBalquhidder experimental catchments resources: Balquhidder catchmentsR C Johnson & P G Whitehead A Gustard & A J Wesselink
3. The water balance of the Balquhldder 12. Effects of forestry on suspended solids andcatchments bedload yields in the BalquhidderJ R Blackie catchments
R C Johnson4. The analysis of remotely-sensed images of
the Balquhidder catchments for estimating 13. A comparison of above-ground componentpercentages of land cover types weights and element amounts in four forestG Roberts, M France, R C Johnson & J T Law species at Kirkton Glen
J D Miller, J M Cooper & H G Miller5. Evaporation from natural mountain
grassland 14. Some effects of 50 Years of afforestation onI R Wright & R J Harding soils in the Kirkton Glen, BalquhidderH A Anderson, J D Miller, J H Gauld,
6. The water use of the Balquhidder A Hepburn & M Stewartcatchments: a processes approachR L Hall & R J Harding 15. Potential impacts of afforestation and climate
change on the stream water chemistry of7. Land-use changes in the Balquhidder the Monachyle catchment
catchments simulated by a daily streamflow R C Ferrier & P G WhiteheadmodelC W 0 Eeles & J R Blackie 16. The Balquhidder catchment water balance
and process experiment results in context8. An assessment of the dynamic response - what do they reveal?
characteristics of streamflow in the I R CalderBalquhidder catchmentsAJJakeman, I G Littlewood &P G Whitehead
9. An application of a physically-based semi-distributed model to the BalquhiddercatchmentsA J Robson, P G Whitehead & R C Johnson
51