REPORT NI 43-101 TECHNICAL REPORT ON THE MINERAL …€¦ · TECHNICAL REPORT ON THE MINERAL...
117
Los_Santos_43-101_Tech Rep_Oct13_v4.doc 11 th December 2013 REPORT NI 43-101 TECHNICAL REPORT ON THE MINERAL RESOURCES AND RESERVES OF THE LOS SANTOS MINE PROJECT, SPAIN Prepared for Daytal Resources Spain S.L. by Adam Wheeler Mining Consultant Cambrose Farm, Redruth Cornwall, TR16 4HT England. Tel/Fax: +44 1209-899042 E-mail: [email protected] 31 st October 2013
Transcript of REPORT NI 43-101 TECHNICAL REPORT ON THE MINERAL …€¦ · TECHNICAL REPORT ON THE MINERAL...
Los_Santos_43-101_Tech Rep_Oct13_v4.doc 11th December 2013
REPORT NI 43-101
TECHNICAL REPORT ON THE
MINERAL RESOURCES AND RESERVES OF THE
LOS SANTOS MINE PROJECT,
SPAIN
Prepared for
Daytal Resources Spain S.L.
by
Adam WheelerMining Consultant
Cambrose Farm, RedruthCornwall, TR16 4HT
England.Tel/Fax: +44 1209-899042
E-mail: [email protected]
31st
October 2013

Technical Report on the Los Santos Mine Project
November 2013i
TABLE OF CONTENTSPage
1 SUMMARY ..........................................................................................................................61.1 Introduction and Overview..........................................................................................61.2 Ownership...................................................................................................................61.3 Geology and Mineralization ........................................................................................71.4 Database and Resource Estimation ...........................................................................81.5 Mine Planning .............................................................................................................91.6 Mineral Processing .................................................................................................. 101.7 Mineral Resource and Reserve Estimates .............................................................. 111.8 Conclusions ............................................................................................................. 13
2 INTRODUCTION.............................................................................................................. 142.1 Introduction .............................................................................................................. 142.2 Terms of Reference................................................................................................. 142.3 Sources of Information............................................................................................. 152.4 Units and Currency .................................................................................................. 152.5 Disclaimer ................................................................................................................ 15
3 RELIANCE ON OTHER EXPERTS.................................................................................. 164 PROPERTY DESCRIPTION AND LOCATION................................................................ 165 ACCESSIBILITY, CLIMATE, LOCAL RESOURCES, INFRASTRUCTURE,PHYSIOGRAPHY.................................................................................................................... 196 HISTORY.......................................................................................................................... 227 GEOLOGICAL SETTING AND MINERALIZATION ......................................................... 238 DEPOSIT TYPES............................................................................................................. 279 EXPLORATION................................................................................................................ 27
9.1 Previous Exploration................................................................................................ 279.2 Daytal Exploration.................................................................................................... 28
10 DRILLING ..................................................................................................................... 2911 SAMPLE PREPARATION, ANALYSES AND SECURITY ........................................... 31
11.1 Diamond Core Sampling.......................................................................................... 3111.2 Trench Sampling...................................................................................................... 3311.3 Sample Preparation ................................................................................................. 3311.4 Laboratory Sample Analysis.................................................................................... 3411.5 Sample Security....................................................................................................... 36
12 DATA VERIFICATION .................................................................................................. 3712.1 Billiton Campaign - Quality Control.......................................................................... 3712.2 Daytal Campaign - Quality Control .......................................................................... 3912.3 Drillhole Database ................................................................................................... 4312.4 Survey Control ......................................................................................................... 43
13 MINERAL PROCESSING AND METALLURGICAL TESTING .................................... 4413.1 Introduction .............................................................................................................. 4413.2 Crushing .................................................................................................................. 4413.3 Grinding ................................................................................................................... 4513.4 Spiral Separation ..................................................................................................... 4613.5 Continuous flotation ................................................................................................. 4913.6 Table Separation ..................................................................................................... 5013.7 Tailings and Fines.................................................................................................... 5013.8 Final Flotation .......................................................................................................... 5113.9 Magnetic Separation................................................................................................ 52
14 MINERAL RESOURCE ESTIMATES........................................................................... 5514.1 General Methodology .............................................................................................. 5514.2 Interpretation and Sample Data Processing............................................................ 5614.3 Geostatistics ............................................................................................................ 6014.4 Volumetric Modelling ............................................................................................... 6314.5 Densities .................................................................................................................. 6514.6 Grade Estimation ..................................................................................................... 6614.7 Mineral Resource Classification .............................................................................. 6814.8 Model Validation ...................................................................................................... 6914.9 Mineral Resource Reporting.................................................................................... 72

Technical Report on the Los Santos Mine Project
November 2013ii
15 MINERAL RESERVE ESTIMATES .............................................................................. 7415.1 Open Pit Mine Planning ........................................................................................... 7415.2 Underground Mine Planning.................................................................................... 7815.3 Tailings Re-Processing............................................................................................ 8015.4 Mineral Reserves..................................................................................................... 82
16 MINING METHODS...................................................................................................... 8617 RECOVERY METHODS............................................................................................... 9018 PROJECT INFRASTRUCTURE................................................................................... 9219 MARKET STUDIES AND CONTRACTS ...................................................................... 9520 ENVIRONMENTAL STUDIES, PERMITTING AND SOCIAL IMPACT ........................ 9521 CAPITAL AND OPERATING COSTS .......................................................................... 9822 ECONOMIC ANALYSIS ............................................................................................... 9923 ADJACENT PROPERTIES......................................................................................... 10124 OTHER RELEVANT INFORMATION......................................................................... 104
24.1 Geotechnical Studies............................................................................................. 10424.2 Water Management ............................................................................................... 104
25 CONCLUSIONS AND RECOMMENDATIONS .......................................................... 10526 REFERENCES ........................................................................................................... 108QUALIFIED PERSONS CERTIFICATES.............................................................................. 109
Technical Report on the Los Santos Mine Project
November 2013iii
LIST OF TABLES
Table 1-1 Los Santos – Measured and Indicated Mineral Resources ................................... 11
Table 1-2. Los Santos – Inferred Mineral Resources............................................................. 11
Table 1-3 Los Santos – Proven and Probable Mineral Reserves ........................................... 12
Table 7-1 Summary of Local Stratigraphy.............................................................................. 24
Table 10-1. Summary of Drillhole Database .......................................................................... 29
Table 12-1. Check Sample Summary Results 2009-2013 ..................................................... 40
Table 14-1. General Zone Dimensions................................................................................... 57
Table 14-2. Exploration Sample Summary............................................................................. 59
Table 14-3. Summary Statistics of Samples By Mineralised Zone ........................................ 60
Table 14-4. WO3 Top-Cut Levels ........................................................................................... 60
Table 14-5. Decile Analysis .................................................................................................... 61
Table 14-6. Statistical Summary of Composites .................................................................... 62
Table 14-7. Model Variogram Parameters ............................................................................. 63
Table 14-8. Model Prototype Parameters .............................................................................. 64
Table 14-9. Density Values .................................................................................................... 65
Table 14-10. Grade Estimation Parameters.......................................................................... 67
Table 14-11. Zone Orientations.............................................................................................. 67
Table 14-12. Comparison of Average Sample and Model ..................................................... 69
Table 14-13. Grade-Tonnage Table – Measured and Indicated Resources Only ................. 72
Table 14-14 Resource Model Breakdown .............................................................................. 73
Table 15-1. Open Pit Parameters........................................................................................... 76
Table 15-2. Underground Cut-Off Grade Calculation............................................................. 78
Table 15-3. Summary of Tailings Material Identified for Re-Processing ................................ 80
Table 15-4. Reserve Evaluation Summary............................................................................. 82
Table 15-5. In-Pit/Mine Inferred Resources ........................................................................... 83
Table 15-6 Reserve Breakdown ............................................................................................. 84
Table 15-7. Grade-Tonnage Table – Proven and Probable Reserves................................... 85
Table 20-1. Summary of Permits............................................................................................ 95
Table 21-1. Average Unit Costs from Last 10 Months to June 2013 ..................................... 98
Table 21-2. Capital Expenditures – Last 12 Months .............................................................. 98
Table 21-3. Planned Capital Expenditure – Next 12 Months ................................................. 98
Table 22-1. Main Economic Parameters for LOM.................................................................. 99
Table 22-2. LOM Economic Analysis ................................................................................... 100
Table 25-1 Los Santos – Measured and Indicated Mineral Resources ............................... 105
Table 25-2 Los Santos – Inferred Mineral Resources........................................................... 105
Table 25-3 Los Santos – Proven and Probable Mineral Reserves ....................................... 106

Technical Report on the Los Santos Mine Project
November 2013iv
LIST OF FIGURES
Figure 4-1. Overall Location Map ........................................................................................... 17
Figure 4-2. Mine Location and Los Santos Village.................................................................. 18
Figure 5-1. Site Plan............................................................................................................... 20
Figure 7-1. Geology of the North-West Corner of the Iberian Peninsula ............................... 24
Figure 7-2. Plan of Local Geology.......................................................................................... 26
Figure 9-1. Diamond Drilling Operations at Los Santos ......................................................... 28
Figure 10-1 Plan of Exploration Drillholes ............................................................................... 30
Figure 11-1. Example of Corebox Photograph....................................................................... 31
Figure 11-2. Core Logging Operations ................................................................................... 32
Figure 11-3. Core Logging Area. ............................................................................................ 32
Figure 11-4. On-Site Laboratory Facilities at Los Santos....................................................... 35
Figure 11-5. On-Site SPECTRO XRF Assaying Equipment .................................................. 36
Figure 11-6. Daytal’s Core Shed and Logging Facility ............................................................ 36
Figure 12-1. Billiton Campaign – Standard Sampling Results ............................................... 38
Figure 12-2. Billiton – Graph of Check Sampling Results ...................................................... 38
Figure 12-3. Los Santos Blank Measurements 2012-13........................................................ 39
Figure 12-4. HARD Plot – ALS Internal Duplicates, 2012-13................................................. 41
Figure 12-5. HARD Plot – ALS v SGS Duplicates.................................................................. 41
Figure 12-6. Los Santos Internal Standard Testing July 2012 – June 2013 .......................... 42
Figure 13-1. Intermediate Crushed Stockpile. ........................................................................ 45
Figure 13-2. Spiral Classifiers ................................................................................................ 46
Figure 13-3. Overall General Flowsheet................................................................................. 47
Figure 13-4. Crushing Circuit.................................................................................................. 48
Figure 13-5. Continuous Flotation Cell ................................................................................... 49
Figure 13-6. Table Separation –Scheelite Under UV Light. .................................................... 50
Figure 13-7. Discontinuous Flotation – Concentrate Cleaning............................................... 51
Figure 13-8. Storage of Concentrates ..................................................................................... 52
Figure 13-9. Grinding, Spirals, Flotation and Tables Flowsheet ............................................. 53
Figure 13-10. Final Flotation, Drying and Magnetic Separation Flowsheet ........................... 54
Figure 14-1. Block Modelling Methodology ............................................................................ 55
Figure 14-2. 3D View of Capa E and LSS_SW Mineralized Zones ....................................... 57
Figure 14-3. Experimental and Model Variograms for Los Santos Sur.................................. 62
Figure 14-4. Example of Resource Classification – Los Santos Bed 7 Long Section............ 68
Figure 14-5. Example Block Model Cross-Section – Los Santos Sur .................................... 70
Figure 14-6. Example Grade Profile Plot – Capa Este........................................................... 70
Figure 14-7. Bulk Sample and Block Model Grade Comparison............................................ 71
Figure 15-1. Los Santos Sur – Cut-Away View - Pit Design and Skarn Block Model ............ 75
Figure 15-2. Ultimate Pit Designs – Capa E and Los Santos Sur........................................... 75
Figure 15-3. Plan of Final Pit Designs .................................................................................... 77
Technical Report on the Los Santos Mine Project
November 2013v
Figure 15-4. Underground Reserves – W-E Long Section..................................................... 79
Figure 15-5. Plan of Tailings Areas Identified for Re-Processing .......................................... 81
Figure 15-6. Aerial Photograph of Tailings Areas .................................................................. 81
Figure 16-1. Blasthole Drilling Operations.............................................................................. 86
Figure 16-2. Pre-Split Drilling Operations............................................................................... 86
Figure 16-3. Explosives Loading at Los Santos Sur. ............................................................. 87
Figure 16-4. Mucking Operations at Los Santos Sur ............................................................. 88
Figure 16-5. Photograph of Las Cortina West Pit................................................................... 88
Figure 16-6. Mining Operations in Las Cortinas West............................................................ 89
Figure 16-7. Photograph of Los Santos Sur Pit...................................................................... 89
Figure 17-1. Photograph of Crushing Facilities and Ore Feed to the Mill .............................. 90
Figure 17-2. Dust Control System .......................................................................................... 91
Figure 18-1. Typical Bench Configuration of Waste Dump. ................................................... 92
Figure 18-2. Pylons Connecting Grid With Los Santos .......................................................... 93
Figure 18-3. Grid Connection at Los Santos .......................................................................... 93
Figure 18-4. Site Plan.............................................................................................................. 94
Figure 20-1. Example of Restoration...................................................................................... 96
Figure 23-1. Map Showing Location of Valtreixal Project .................................................... 102
Figure 23-2. Trenching Operations at Valtreixal................................................................... 102
Figure 23-3. Plan Map of Valtreixal Geology........................................................................ 103
APPENDICES
A Geostatistical PlotsB Glossary of Terms

Technical Report on the Los Santos Mine Project
November 20136
1 SUMMARY
1.1 Introduction and Overview
This report was prepared to provide a Technical Report compliant with the provisions of
National Instrument 43-101 - Standards of Disclosure for Mineral Projects, (“NI 43-101”), by
way of a review and summary of Resource and Reserve Estimations for the Los Santos Mine,
up to the end of June 2013. This current estimate was completed during August-October,
2013. The mine is currently an open pit operation, and is located in the Province of
Salamanca in Spain. The principal product of the mine is a tungsten concentrate.
This report was prepared by Adam Wheeler, at the request of Mr. N. Alves, Manager of Mine
Area for Daytal Resources Spain S.L. (“Daytal”). Assistance and technical detail were
supplied by the technical personnel at Los Santos. Adam Wheeler has been involved with
resource and reserve estimation at the mine since 2006, and has visited the site many times.
In connection with the latest resource and reserve estimate, and with the preparation of this
report, Adam Wheeler visited the site from August 20th
-22nd
, 2013.
The mine started open pit ore production during 2008, and the mill was commissioned during
the same year.
1.2 Ownership
Daytal Resources Spain S.L. (“Daytal”) is a wholly owned Spanish subsidiary of Almonty
Industries Inc (Almonty), a corporation governed by the Canada Business Corporations Act
(the “CBCA”). Almonty trades on the TSX Venture Exchange (TSX-V) under the symbol “AII”.
The Los Santos mine is 100% owned by Daytal.
Technical Report on the Los Santos Mine Project
November 20137
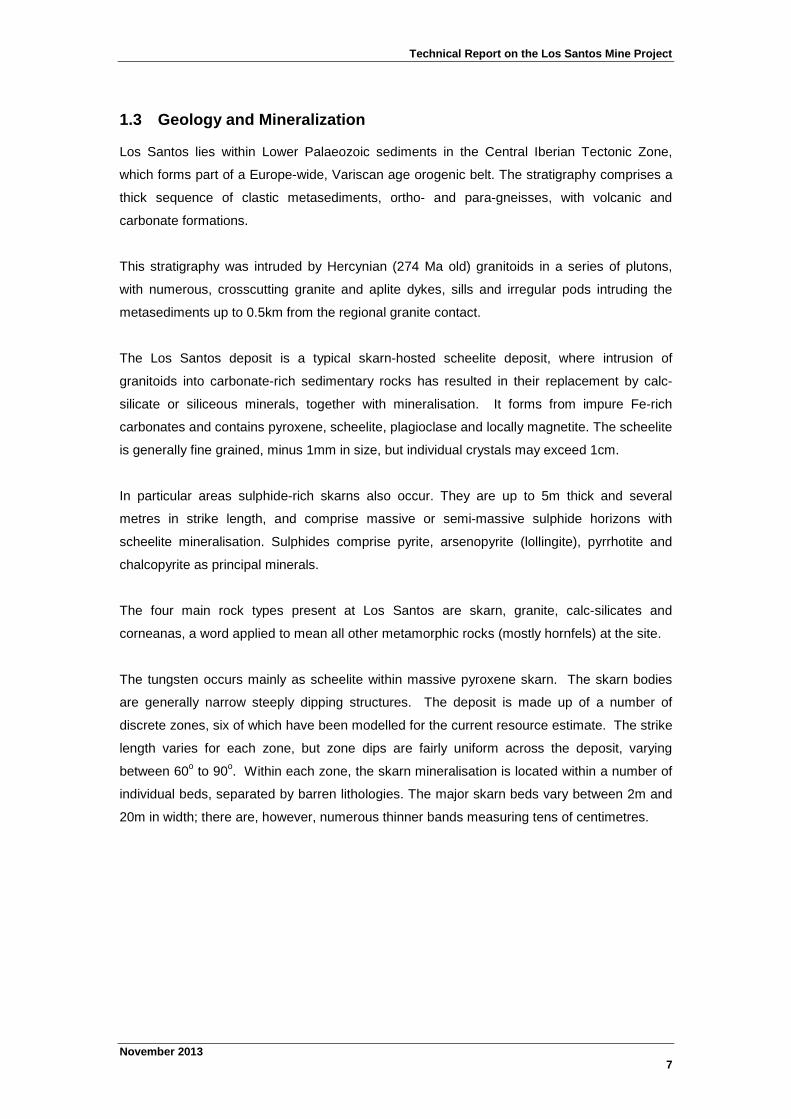
1.3 Geology and Mineralization
Los Santos lies within Lower Palaeozoic sediments in the Central Iberian Tectonic Zone,
which forms part of a Europe-wide, Variscan age orogenic belt. The stratigraphy comprises a
thick sequence of clastic metasediments, ortho- and para-gneisses, with volcanic and
carbonate formations.
This stratigraphy was intruded by Hercynian (274 Ma old) granitoids in a series of plutons,
with numerous, crosscutting granite and aplite dykes, sills and irregular pods intruding the
metasediments up to 0.5km from the regional granite contact.
The Los Santos deposit is a typical skarn-hosted scheelite deposit, where intrusion of
granitoids into carbonate-rich sedimentary rocks has resulted in their replacement by calc-
silicate or siliceous minerals, together with mineralisation. It forms from impure Fe-rich
carbonates and contains pyroxene, scheelite, plagioclase and locally magnetite. The scheelite
is generally fine grained, minus 1mm in size, but individual crystals may exceed 1cm.
In particular areas sulphide-rich skarns also occur. They are up to 5m thick and several
metres in strike length, and comprise massive or semi-massive sulphide horizons with
scheelite mineralisation. Sulphides comprise pyrite, arsenopyrite (lollingite), pyrrhotite and
chalcopyrite as principal minerals.
The four main rock types present at Los Santos are skarn, granite, calc-silicates and
corneanas, a word applied to mean all other metamorphic rocks (mostly hornfels) at the site.
The tungsten occurs mainly as scheelite within massive pyroxene skarn. The skarn bodies
are generally narrow steeply dipping structures. The deposit is made up of a number of
discrete zones, six of which have been modelled for the current resource estimate. The strike
length varies for each zone, but zone dips are fairly uniform across the deposit, varying
between 60o
to 90o. Within each zone, the skarn mineralisation is located within a number of
individual beds, separated by barren lithologies. The major skarn beds vary between 2m and
20m in width; there are, however, numerous thinner bands measuring tens of centimetres.
Technical Report on the Los Santos Mine Project
November 20138
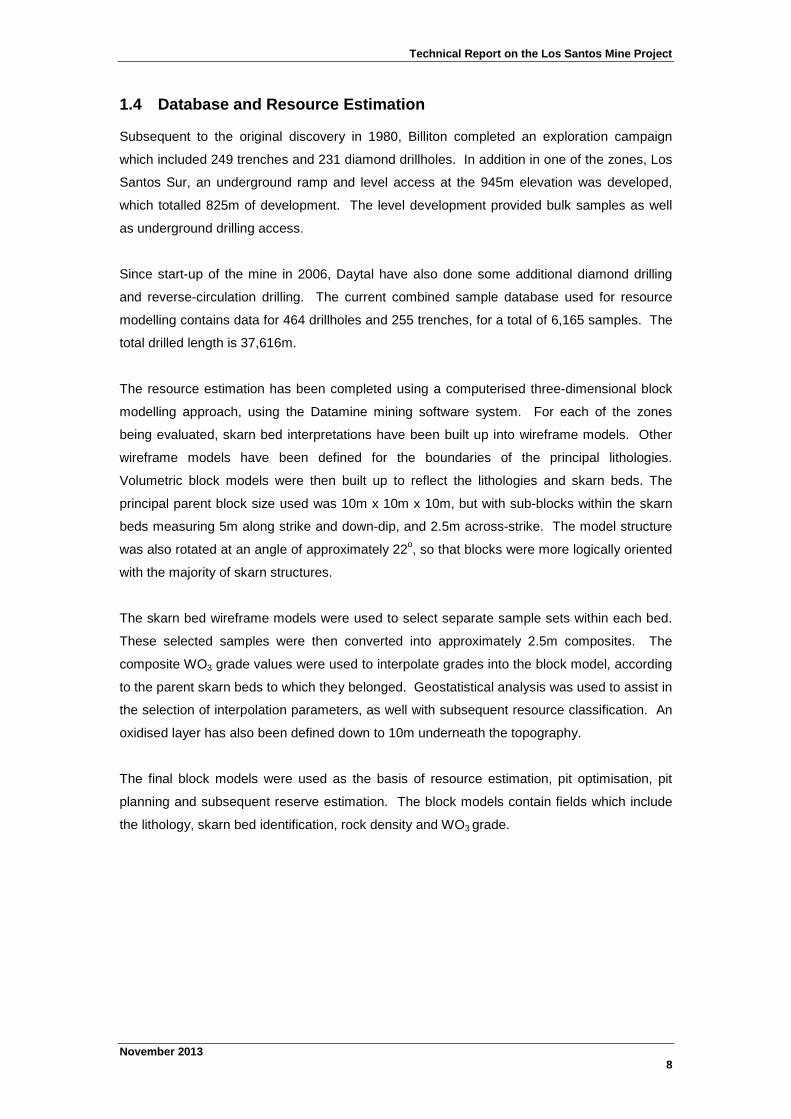
1.4 Database and Resource Estimation
Subsequent to the original discovery in 1980, Billiton completed an exploration campaign
which included 249 trenches and 231 diamond drillholes. In addition in one of the zones, Los
Santos Sur, an underground ramp and level access at the 945m elevation was developed,
which totalled 825m of development. The level development provided bulk samples as well
as underground drilling access.
Since start-up of the mine in 2006, Daytal have also done some additional diamond drilling
and reverse-circulation drilling. The current combined sample database used for resource
modelling contains data for 464 drillholes and 255 trenches, for a total of 6,165 samples. The
total drilled length is 37,616m.
The resource estimation has been completed using a computerised three-dimensional block
modelling approach, using the Datamine mining software system. For each of the zones
being evaluated, skarn bed interpretations have been built up into wireframe models. Other
wireframe models have been defined for the boundaries of the principal lithologies.
Volumetric block models were then built up to reflect the lithologies and skarn beds. The
principal parent block size used was 10m x 10m x 10m, but with sub-blocks within the skarn
beds measuring 5m along strike and down-dip, and 2.5m across-strike. The model structure
was also rotated at an angle of approximately 22o, so that blocks were more logically oriented
with the majority of skarn structures.
The skarn bed wireframe models were used to select separate sample sets within each bed.
These selected samples were then converted into approximately 2.5m composites. The
composite WO3 grade values were used to interpolate grades into the block model, according
to the parent skarn beds to which they belonged. Geostatistical analysis was used to assist in
the selection of interpolation parameters, as well with subsequent resource classification. An
oxidised layer has also been defined down to 10m underneath the topography.
The final block models were used as the basis of resource estimation, pit optimisation, pit
planning and subsequent reserve estimation. The block models contain fields which include
the lithology, skarn bed identification, rock density and WO3 grade.

Technical Report on the Los Santos Mine Project
November 20139
1.5 Mine Planning
The resource block models for each zone have been used for pit optimisation. The pit slope
parameters were derived from the geotechnical studies. Overall slope angles, allowing for
road intersections and bench configurations, of approximately of 55o
(North) and 48o
(South)
have been applied. For the top 10m of superficial material, a lower overall slope of 45o
was
applied.
The resultant optimised pit models were used as the basis for final pit designs. Since mine
start-up in 2006 open pit mining has started in four zones – Los Santos Sur, Las Cortinas,
Sector Central and Capa Este. The pits have 10m benches, although within the skarn ore
zones this is reduced to 5m sub-benches. All material is drilled and blasted, using Tamrock
CHA1100 drills making 3.5in diameter blastholes. Pre-split lines are used for final pit walls.
The haul roads are 10m wide with a 10% gradient, and currently Komatsu HD465 trucks are
used, which carry approximately 55t.
In or near ore, all blasthole cuttings are sampled. This data is used to build up short-term
planning block models, from which all ore and waste outlines are blocked out. As well as
demarcating the ore boundaries in the pit with ribbons, a geological technician is present at all
times during production in the pits, to assist with ore/waste definition during mucking.
Komatsu and Hitachi crawler-excavators are used for both ore and waste excavation.
All mining work is carried out using a Spanish mining contractor, Sanchez y Lago. There are
two main separate waste dumping areas, and as more pits are mined, some waste is also
used to backfill mined-out pits. Ore is split into different grade categories, and deposited in
separate areas on the run-of-mine (ROM) pad or on a separate low grade stockpile.
For the 12 months preceding June 2013, approximately 516 kt of ore were mined, along with
3,122 kt of waste, all from 3 open pits: Santos Sur, Las Cortinas East and Capa Este.
In the reserve estimation, a small amount of underground ore has also been blocked out from
small narrow bed extensions to the south side of the Los Santos Sur pit, as well as beneath
the ‘Day 1’ pit to the west of Los Santos Sur. These parts can be reached by adit access
from the pit or by access from the existing underground ramp. A 3m minimum mining width
has been used blocking out these underground reserves, and assumes an overhand cut-and-
fill stoping method.
Recent planning work has now also added pit reserves to the Los Santos Sur – South West
areas, which lie to the west of the current Los Santos Sur pit.
Technical Report on the Los Santos Mine Project
November 201310
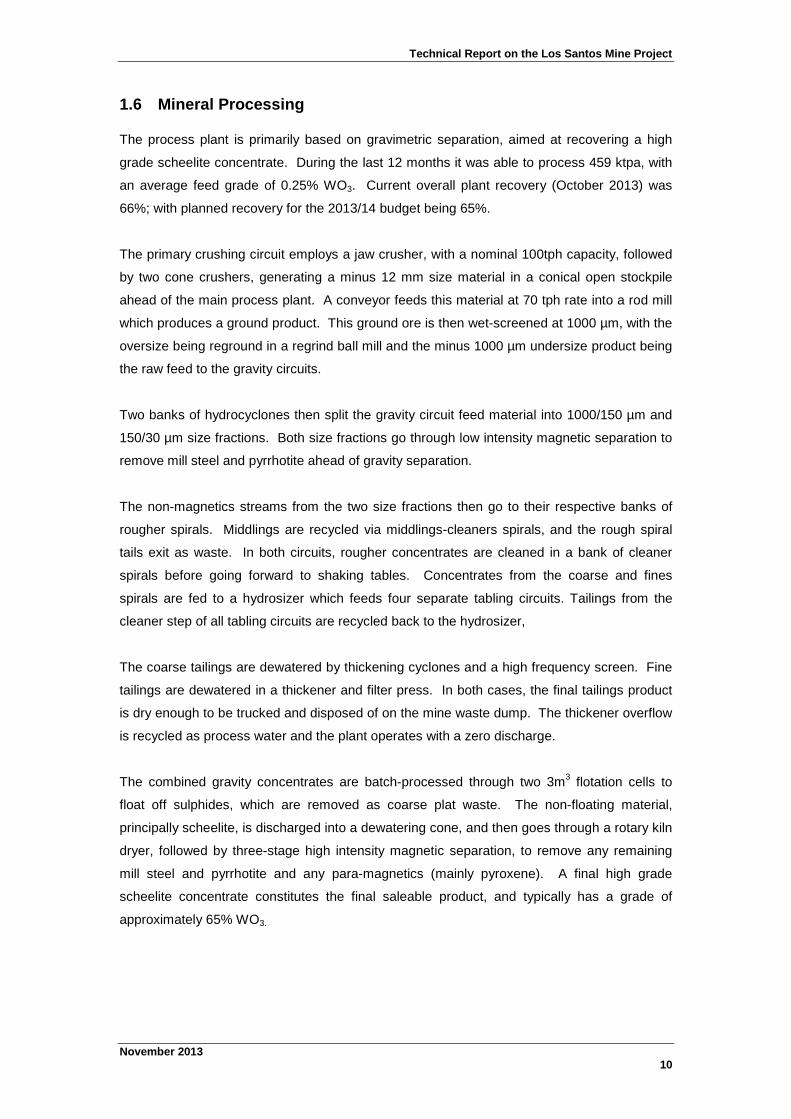
1.6 Mineral Processing
The process plant is primarily based on gravimetric separation, aimed at recovering a high
grade scheelite concentrate. During the last 12 months it was able to process 459 ktpa, with
an average feed grade of 0.25% WO3. Current overall plant recovery (October 2013) was
66%; with planned recovery for the 2013/14 budget being 65%.
The primary crushing circuit employs a jaw crusher, with a nominal 100tph capacity, followed
by two cone crushers, generating a minus 12 mm size material in a conical open stockpile
ahead of the main process plant. A conveyor feeds this material at 70 tph rate into a rod mill
which produces a ground product. This ground ore is then wet-screened at 1000 µm, with the
oversize being reground in a regrind ball mill and the minus 1000 µm undersize product being
the raw feed to the gravity circuits.
Two banks of hydrocyclones then split the gravity circuit feed material into 1000/150 µm and
150/30 µm size fractions. Both size fractions go through low intensity magnetic separation to
remove mill steel and pyrrhotite ahead of gravity separation.
The non-magnetics streams from the two size fractions then go to their respective banks of
rougher spirals. Middlings are recycled via middlings-cleaners spirals, and the rough spiral
tails exit as waste. In both circuits, rougher concentrates are cleaned in a bank of cleaner
spirals before going forward to shaking tables. Concentrates from the coarse and fines
spirals are fed to a hydrosizer which feeds four separate tabling circuits. Tailings from the
cleaner step of all tabling circuits are recycled back to the hydrosizer,
The coarse tailings are dewatered by thickening cyclones and a high frequency screen. Fine
tailings are dewatered in a thickener and filter press. In both cases, the final tailings product
is dry enough to be trucked and disposed of on the mine waste dump. The thickener overflow
is recycled as process water and the plant operates with a zero discharge.
The combined gravity concentrates are batch-processed through two 3m3
flotation cells to
float off sulphides, which are removed as coarse plat waste. The non-floating material,
principally scheelite, is discharged into a dewatering cone, and then goes through a rotary kiln
dryer, followed by three-stage high intensity magnetic separation, to remove any remaining
mill steel and pyrrhotite and any para-magnetics (mainly pyroxene). A final high grade
scheelite concentrate constitutes the final saleable product, and typically has a grade of
approximately 65% WO3.

Technical Report on the Los Santos Mine Project
November 201311
1.7 Mineral Resource and Reserve Estimates
The evaluation work was carried out and prepared in compliance with Canadian National
Instrument 43-101, and the mineral resources in this estimate were calculated using the
Canadian Institute of Mining, Metallurgy and Petroleum (CIM), CIM Standards on Mineral
Resources and Reserves, Definitions and Guidelines prepared by the CIM Standing
Committee on Reserve Definitions and adopted by CIM Council December 11, 2005. The
current resource estimation is shown in Table 1-1 and Table 1-2.
Table 1-1 Los Santos – Measured and Indicated Mineral ResourcesAt 30
thJune, 2013
Resource Category Tonnes WO3 WO3
Kt % t
Measured 434 0.40 1,735
Indicated 2,326 0.31 7,139
Total 2,760 0.32 8,874
Notes
. Cut-Off Grade = 0.05%WO3
. Minimum width = 2.5m
. Resources shown are inclusive of reserves
Table 1-2. Los Santos – Inferred Mineral ResourcesAt 30
thJune, 2013
Tonnes WO3 WO3
Kt % t
Inferred 1,527 0.24 3,648
Notes
. Cut-Off Grade = 0.05%WO3
. Minimum width = 2.5m

Technical Report on the Los Santos Mine Project
November 201312
The current reserve estimation, stemming from the mine plan developed from this resource
base, is shown in Table 1-3.
Table 1-3 Los Santos – Proven and Probable Mineral ReservesAt 30
thJune, 2013
Reserve Tonnes WO3 WO3
Category t ('000) % Tonnes
Proven 357 0.45 1,618
Probable 1,523 0.38 5,791
Proven + Probable 1,880 0.39 7,409
Tailings Tonnes WO3 WO3
t ('000) % Tonnes
Coarse rejects (Arenas) 1,338 0.13 1,739
Fine rejects (Tortas) 594 0.23 1,366
1,932 0.16 3,105
Stockpiles Tonnes WO3 WO3
t % Tonnes
Marginal stockpile 37,052 0.24 89
Ore A stockpile 673 0.81 5
Ore B stockpile 7,094 0.29 21 Grand
Oxide stockpile 21,302 0.17 36 Total
High Grade Conc. Stock 17 64.0 10.9 WO3
Low Grade Conc. Stock 3 55.0 1.7 Tonnes
Total 66,141 0.25 164 10,678
Notes
. Ore cut-offs used :
. Open pits 0.07%WO3
. Los Santos Sur underground 0.3% WO3
. Re-Processed Tailings 0.04 WO3
. Cut-offs derived from a long term planning price of $40,000/t WO3 APT
Mine Reserves
The principal operating costs used in connection with this reserve calculation were $13/t ore
for processing and administration, $2.37/t ore for open pit mining, and $30.42/t ore for
underground mining. Of the total 1,880 Kt of mining reserves, 1,767 Kt of ore comes from 4
separate open pits and 113 Kt of ore comes from underground workings.
The pits encompassing the reserves shown in Table 1-3 also contain 273 Kt of inferred
resources at economic grades. Two other zones outside of the designed pits have also been
optimised, and contain 177 Kt of inferred resources at economic grades. At an annual ore
production rate of 500 ktpa, and this reserve base, including approximately 1.9 Mt of tailings
that can be re-processed, a mine life of approximately 9 years is suggested.
Technical Report on the Los Santos Mine Project
November 201313
1.8 Conclusions
1. The Los Santos mine has now been producing for 5 years. The open pit mining practices
have been progressively improved, along with the planning and grade control systems.
2. Daytal has all permits and licenses to operate and remain in compliance with appropriate
regulations. It has no restrictions with respect to waste dumping capacity, including dry
tailings, and it has been possible to backfill some of the excavated pits with waste.
3. The diamond drilling campaigns completed by Daytal over the last 5 years have in
general confirmed the overall quantities and grades of the scheelite ore which was
originally delineated by Billiton in the 1980s.
4. The recent drilling campaigns have also identified some potential mineralized extensions
beyond the currently modelled zones. These positive results, along with predicted high
metal prices, suggest that the mine life derived from the current reserve base is
conservative. Exploration drilling planned during 2013 has helped delineate additional
open pit and underground reserves to the west of Los Santos Sur.
5. Significant improvements have been made to the plant since mine start-up.

Technical Report on the Los Santos Mine Project
November 201314
2 INTRODUCTION
2.1 Introduction
The Los Santos scheelite deposit in western Spain was originally investigated by Billiton in
the 1970s. Ownership passed into the hands of Siemcal S.A. (SIEMCALSA), a publicly
owned company of mining and geological consultants based in Salamanca, Spain. In 2007
the deposit was purchased by Daytal, which at the time was 100% owned by Heemskirk
Consolidated Limited (Heemskirk). The mine started production in 2008, managed by Daytal.
The mine has continued operation since. Daytal is now a wholly owned Spanish subsidiary of
Almonty Industries Inc (Almonty), a corporation governed by the Canada Business
Corporations Act (the “CBCA”). Almonty trades on the TSX Venture Exchange (TSX-V) under
the symbol “AII”. The Los Santos mine is 100% owned by Daytal.
In 2013 Adam Wheeler was requested by Daytal to assist in the preparation of an updated NI
43-101 report titled ‘Technical Report on the Mineral Resource and Reserves of the Los
Santos Mine Project, Spain.’
Adam Wheeler has worked on resource and reserve estimation for Los Santos annually since
2006. The current report was prepared by Adam Wheeler, with assistance from Daytal staff,
in order to present updated resource and reserve estimates as of the end of June, 2013. In
connection with this work, Adam Wheeler worked on site from August 20th
-22nd
, 2013, as
well as numerous earlier trips between 2007 and 2013.
2.2 Terms of Reference
The resource and reserve estimation work was commissioned by Daytal, a wholly owned
subsidiary of Almonty, and completed by Adam Wheeler, an independent mining consultant.
Adam Wheeler was retained by Daytal to provide an independent Technical Report on the
Mineral Resources and Mineral Reserves at Los Santos, as at June 30th, 2013. This
Technical Report has been prepared to be compliant with the provisions of National
Instrument 43-101 - Standards of Disclosure for Mineral Projects (“NI 43-101”).
The report is considered current as of October 31st, 2013.
The Qualified Person responsible for the preparation of this report is Adam Wheeler (C.Eng,
Eur.Ing), an independent mining consultant. In addition to site visits, Wheeler carried out a
study of all relevant parts of the available literature and documented results concerning the
project and held discussions with technical personnel from Daytal regarding all pertinent
aspects of the project. The reader is referred to these data sources, which are outlined in the
“Sources of Information” section of this report, for further details.
Technical Report on the Los Santos Mine Project
November 201315
The purpose of the current report is to provide an independent Technical Report and update
of the resources and reserves for the Los Santos mine, in conformance with the standards
required by NI 43-101 and Form 43-101F1. The estimate of mineral resources contained in
this report conforms to the CIM Mineral Resource and Mineral Reserve definitions
(December, 2005) referred to in NI 43-101.
2.3 Sources of Information
In conducting this study, Wheeler has relied on reports and information prepared by and for
Daytal. The information on which this report is based includes the references shown in
Section 26.
Adam Wheeler has made all reasonable enquiries to establish the completeness and
authenticity of the information provided, and a final draft of this report was provided to Daytal
along with a written request to identify any material errors or omissions prior to finalization.
2.4 Units and Currency
All measurement units used in this report are metric, and currency is expressed in US Dollars
unless stated otherwise. The exchange rate used in the study described in this report is
US$1.3 to 1.00 Euros (€), unless otherwise stated.
2.5 Disclaimer
Adam Wheeler has reviewed and analysed data provided by Daytal and its consultants and
has drawn his own conclusions there from. Adam Wheeler has not performed any
independent exploration work, drilled any holes or carried out any sampling and assaying.
While exercising all reasonable diligence in checking and confirmation, Adam Wheeler has
relied upon the data presented by Daytal, and previous reports on the property in formulating
his opinions.
Title to the mineral lands for the Los Santos property has not been investigated or confirmed
by Adam Wheeler and Adam Wheeler offers no opinion as to the validity of the exploration or
mineral title claimed.
Technical Report on the Los Santos Mine Project
November 201316
3 RELIANCE ON OTHER EXPERTS
The author has relied, and believes that he has a reasonable basis on which to rely, upon the
various topics that are taken directly or paraphrased from the Golder Associates feasibility
study report of May 2006. This also encompassed work provided by other consultants and
organisations, as summarised below:
Golder Associates Global Iberica, S.L.
Eral Equipos and Proyectos , S.A.
Prehenita (Spanish geological consultancy)
Control Ingeneria y Servicios S.A., Seinco.
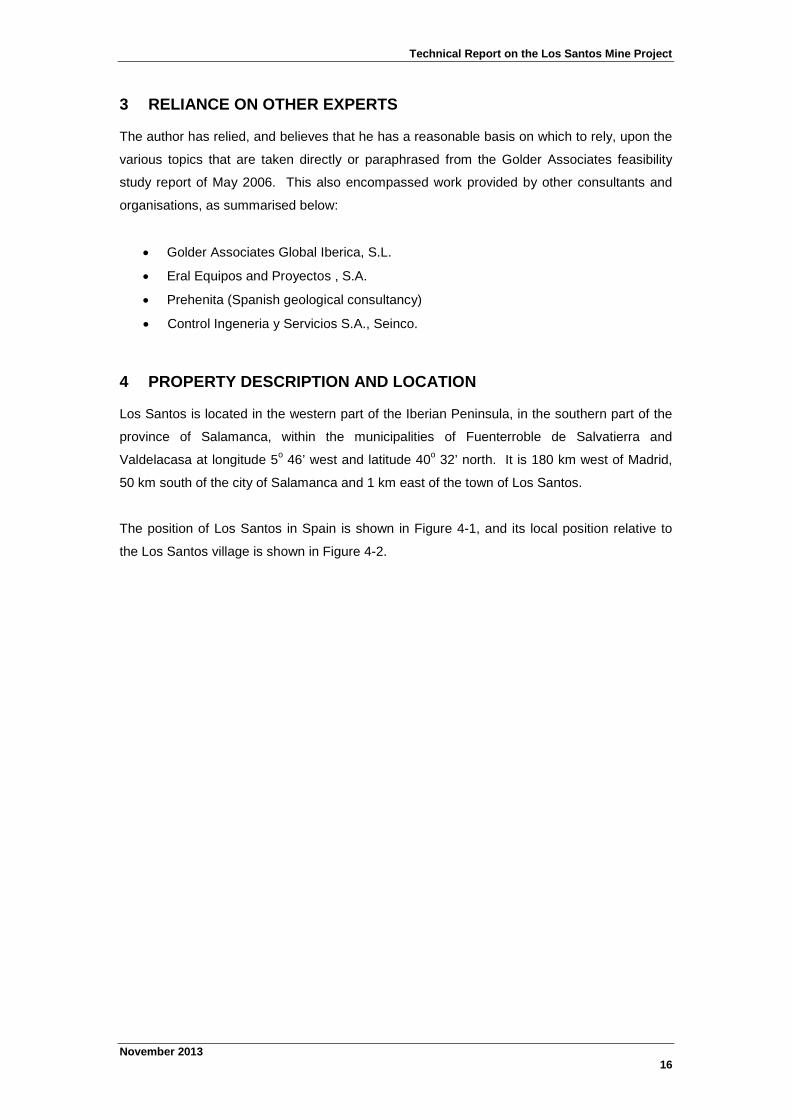
4 PROPERTY DESCRIPTION AND LOCATION
Los Santos is located in the western part of the Iberian Peninsula, in the southern part of the
province of Salamanca, within the municipalities of Fuenterroble de Salvatierra and
Valdelacasa at longitude 5o
46’ west and latitude 40o
32’ north. It is 180 km west of Madrid,
50 km south of the city of Salamanca and 1 km east of the town of Los Santos.
The position of Los Santos in Spain is shown in Figure 4-1, and its local position relative to
the Los Santos village is shown in Figure 4-2.

Technical Report on the Los Santos Mine Project
November 201317
Figure 4-1. Overall Location Map
Technical Report on the Los Santos Mine Project
November 201318
Figure 4-2. Mine Location and Los Santos Village
Technical Report on the Los Santos Mine Project
November 201319
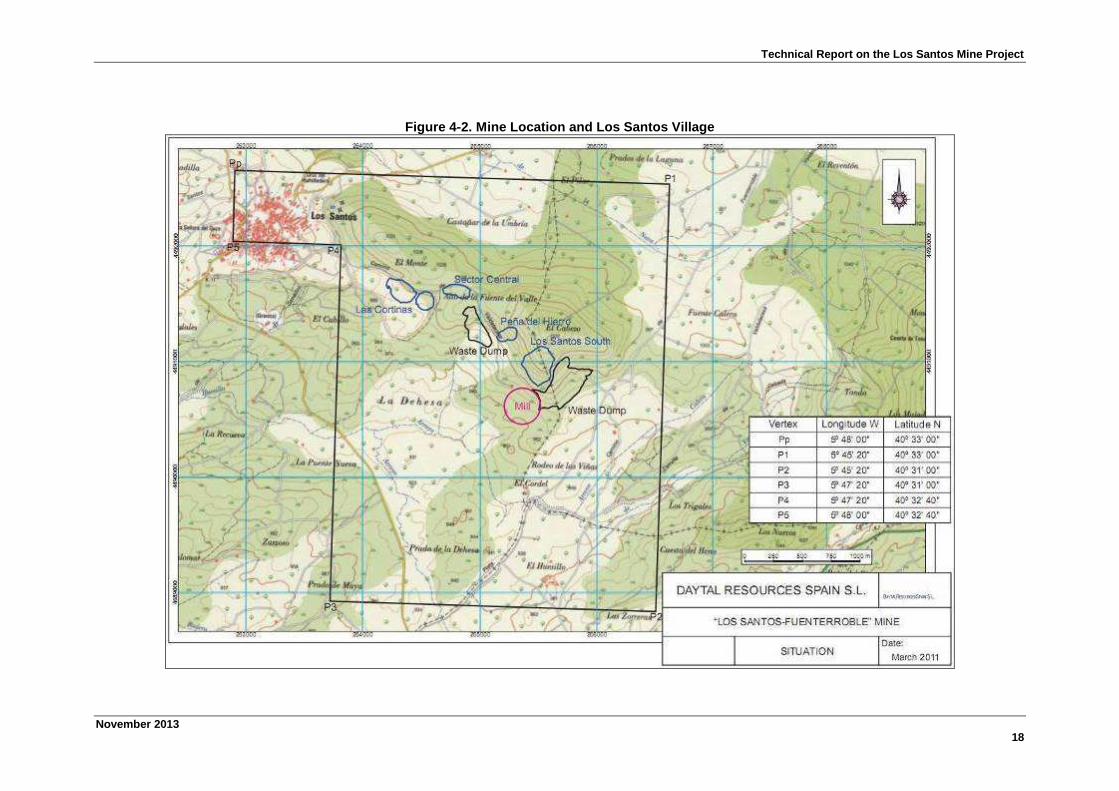
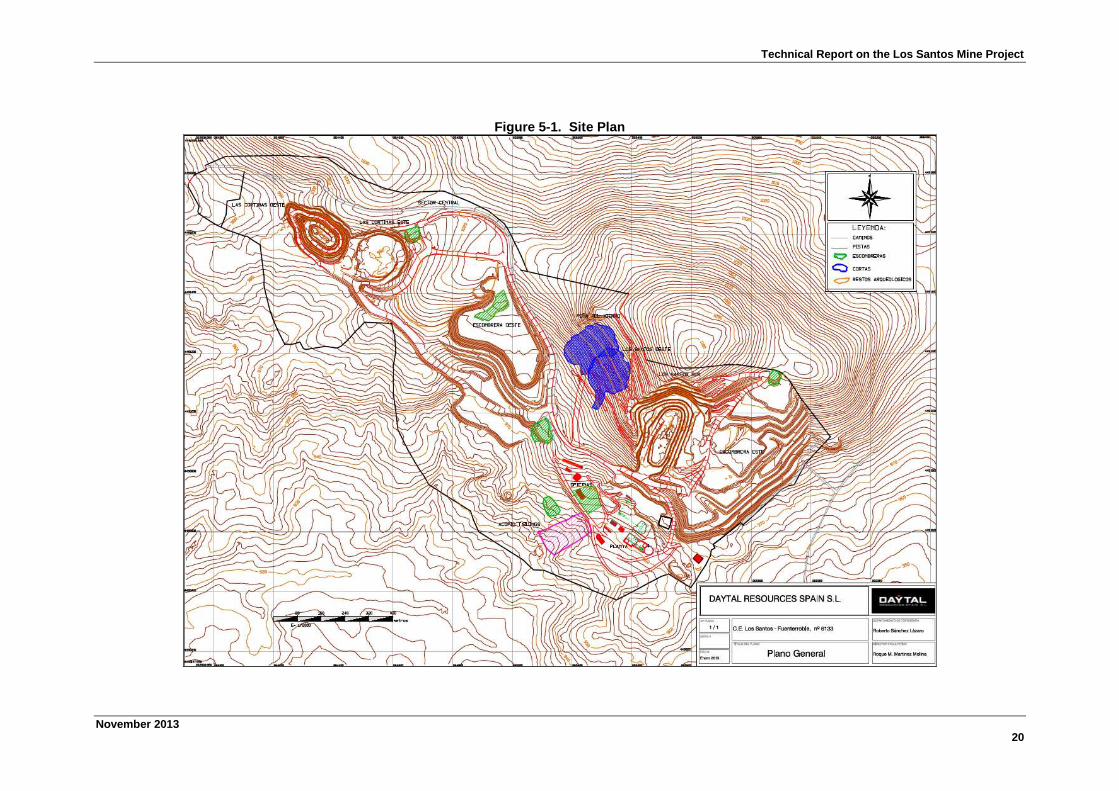
5 ACCESSIBILITY, CLIMATE, LOCAL RESOURCES,INFRASTRUCTURE, PHYSIOGRAPHY
The most direct route to Los Santos is on the A.66 road, part of the national network, from
Salamanca to Guijuelo. A site plan is shown in Figure 5-1.
The average altitude of the sector where the deposit is located is 1.000 m above sea level,
being located in the South slope of a hill, that extends 3 km from West to East, with a
maximum altitude of 1.108 m, descending towards the South to 900 m.
The climate is warm Mediterranean, with cold winters and an annual average rainfall of 900
mm, mainly between November and March, with minimums in June, July and August. The
average annual temperature is between 11°C and 14°C, with a maximum registered value of
38°C and a minimum of -14°C. The values for real evapotranspiration is between 40 and 80%
of precipitation. The solar evaporation is in the order of 1500 mm/year.
As for rainfall, all meteorological stations show high annual rainfall variability with an average
relationship of maximum/minimum rainfall higher than 3.5, average/minimum of 2 and
maximum/average less than 1.5. Therefore, mine plans are based on this irregular behaviour,
in particular for successive dry periods.
The region located SW of the studied area shows a higher precipitation pattern, decreasing
from N to E. Los Santos district shows average records of precipitation around 800 mm, or
even 900 mm (depending on sources). This is consistent with nearby meteorological stations
and with regional patterns such as the influence of the nearby “Sierra de Francia” hills. The
average minimum registered is around 387 mm. The maximums can be inferred, varying
between 556.9 mm and 1789 mm, considering a maximum average of 1173 mm/year.
Average annual rainfall is approximately 900 mm. Furthermore, for flood calculations in the
Acillero basin, the average of 725 mm registered at Guijuelo is recommended. For Las
Navas, the selected station is located at Casafranca, where records show an average of 750
mm per annum. For water availability calculation during dry periods, averages around 350-
400 mm per annum are recommended. The stations that support this assessment are
Guijuelo, Casafranca and Monleón, with minimum rainfall registers of around 368 mm, 400
mm and 600 mm per annum respectively. It is important to note a minimum of 230 mm per
annum registered at Miranda del Castañar as the worst-case scenario, and hence is
recommended for future calculations.
Technical Report on the Los Santos Mine Project
November 201320
Figure 5-1. Site Plan

Technical Report on the Los Santos Mine Project
November 201321
Daily maximum registers and maximum rainfall within 24 hours registered at nearby stations.
From this table it can be observed that the daily maximum rainfall oscillated between 120.4
and 50.3mm. It is important to note that 10 % of maximum rainfall in one year or 20 % of the
average annual rainfall may be registered in 1 day. From this observation, a proper water
management scheme based on dams is envisaged against the alternative of pumping
stations.
The project area is located within the Tajo hydrographical region, close to the limit with the
Duero Hydrographical Region which is located between the towns of Los Santos and
Fuenterrobles de Salvatierra.
Most of the drainage from the project site reports to the Santa Maria de las Navas stream,
with a certain proportion reporting to the south to the Acillero streams. Both streams drain to
the main water course in the area, the Alagón river.
The Santa Maria de las Navas stream flows from east to west, with a total catchment area of
some 29.6 km2. Two stream gauging stations were established in the Santa Maria de las
Navas. The total yearly flows were calculated over the period of operation of the stations:
• 625,000 m3 between may/83 and dec/83
• 1,700,000 m3 between jan/84 y dec/84
• 1,220,000 m3 between jan/85 y dec/85
• 1,300,000 m3 between jan/86 y jun/86
The Acillero stream has an approximate catchment area (above the project location) of 6.5
km2. There only exists 14 months of stream gauging, giving an accumulated flow of 2.5
Mm3. The flows in both streams are mainly seasonal (correlating with the precipitation
records), with large flows during winter and spring months, with much reduced or no flow
during the summer and autumn months.

Technical Report on the Los Santos Mine Project
November 201322
6 HISTORY
Promotora de Recursos Naturales, S.A. and Billiton Española, S.A. formed an exploration
joint venture partnership in the second half of 1979 and by March the following year had
discovered scheelite in skarn mineralisation near the Village of Los Santos which is situated
about 250 km west of Madrid in the Province of Salamanca. Exploration was focussed on
skarn mineralisation on the margin between the Bejar granodiorite and the surrounding
Cambrian metasediments. The discovery of the Los Santos tungsten bearing skarns was the
result of regional geological reconnaissance and the targeted night-time use of ultra-violet
lamps to disclose the presence of the tungsten mineral, scheelite (CaWO4) which fluoresces
under ultra violet light.
A period of intense exploration activity followed, including diamond drilling and some
preliminary engineering, until the ´80s when it was decided to carry out a pre-feasibility study
of the prospect. By 1985, however, with a prevailing tungsten price of US$81/mtu, the project
was not considered viable.
Ownership then passed into the hands of SIEMCALSA, a publicly owned company of mining
and geological consultants. In 1995, the UK based company, Navan Resources, entered into
an agreement with SIEMCALSA with an option to acquire 65% of the project. Navan
undertook additional metallurgical test work, resource modelling and preliminary mine-
planning, however, again concluded that at the prevailing commodity prices the project
remained uneconomic and it reverted to SIEMCALSA.
In 2005 the Joint Venture of Cambrian Mining Plc, Tungsten SA Pty Ltd and Prehenita S.L.
(Daytal hereafter) assessed the Los Santos Tungsten Project (Los Santos Project hereafter)
feasibility. This culminated in a feasibility study report compiled by Golder Associates in
2006. Start-up was achieved through its full subsidiary Daytal Resources S.L.
In 2006, Daytal Resources Spain acquired the project and was in turn acquired by an
Australian public company, Heemskirk Consolidated Limited. Heemskirk reappraised the
earlier technical information and concluded that the prevailing APT commodity price around
US$250/mtu and underlying supply demand position for tungsten concentrates justified
development of the Los Santos deposit. Project development was approved and the mine
opened in June 2008.
In 2009, the impact of the global financial crisis reduced APT prices to below US$200/mtu
and Heemskirk concluded that it needed to improve tungsten recovery to maintain viability.
As a result, the process plant was improved and expanded with the installation of a secondary
ball mill and additional table and spiral capacity. Daytal is now a wholly owned Spanish
subsidiary of Almonty.

Technical Report on the Los Santos Mine Project
November 201323
7 GEOLOGICAL SETTING AND MINERALIZATION
The Los Santos tungsten deposit is located within metamorphosed, lower Cambrian age,
Lower Tamames limestones within the Spanish Variscan orogenic belt. These rocks occur
along the northern margin of the late Devonian/early Permian age Alberca-Bejar intrusion
which constitutes the western extremity of the Avila batholith. Contact metamorphism at the
junction of the intrusive and limestone horizons within the sub vertical northern limb of the
Tamamaes syncline formed skarns which, in the Los Santos area of Salamanca Province,
Spain, contain economic tungsten mineralisation.
The Variscan orogeny was the result of the late Proterozoic collision between the
supercontinents of Gondwana to the south and Laurentia Baltica to the north. The collision
caused the closure of the intervening oceanic areas and intense deformation of the
continental boundaries. The Variscan chain now represents the pre Mesozoic basement of
most of western Europe and crops out in a number of mountain belts from Armorican Massif
and Massif Central in France to the Ardennes and the Bohemian Massifs in Germany and the
Czech Republic.
The Variscan orogeny formed the Iberian Massif of western Spain and Portugal. From NE to
SW, five zones have been recognised:-
The Cantabrian Zone
The West Asturian-Leonese zone
The Central Iberian Zone
The Ossa Morena Zone
The South Portuguese Zone
The Los Santos region is located in the autocthanous Central Iberian zone. Emplacement of
the Alberca-Bejar granitoids produced a contact metamorphic aureole which extends, in plan
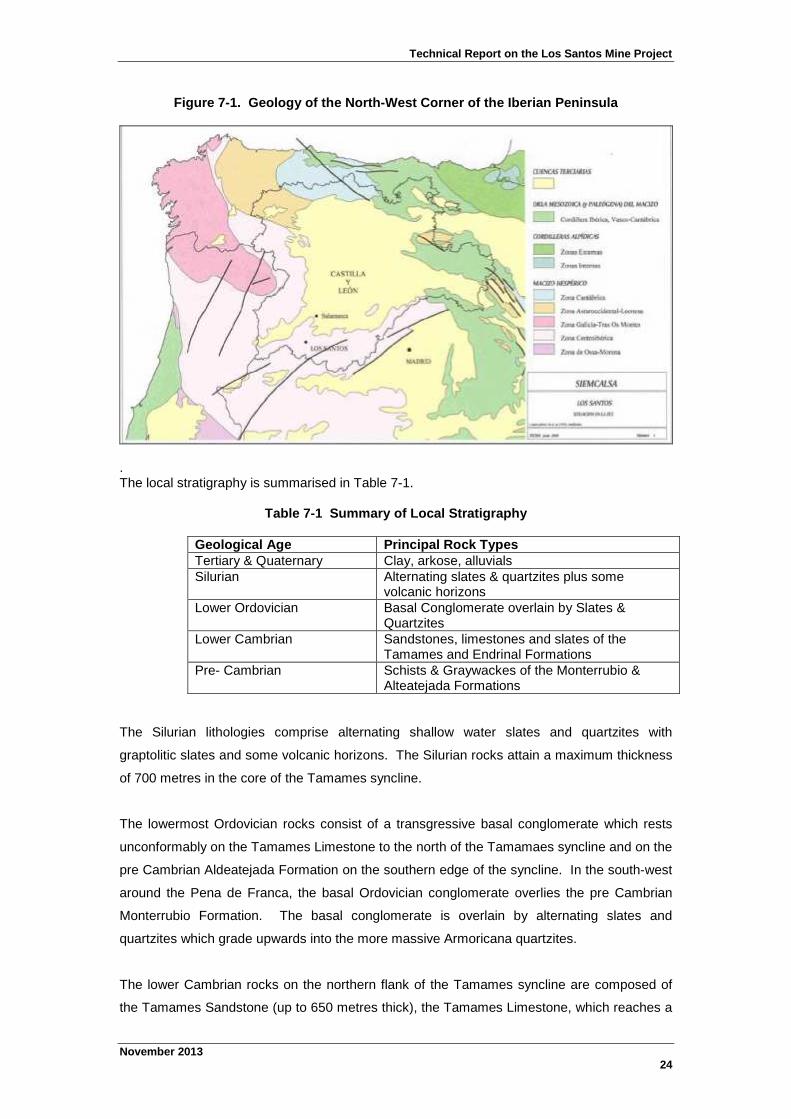
view, from 1.5 km up to 8 km from the intrusive contacts. Figure 7-1 shows a plan of the
geology of the north-west corner of the north-west corner of the Iberian peninsula.
Technical Report on the Los Santos Mine Project
November 201324
Figure 7-1. Geology of the North-West Corner of the Iberian Peninsula
.The local stratigraphy is summarised in Table 7-1.
Table 7-1 Summary of Local Stratigraphy
Geological Age Principal Rock TypesTertiary & Quaternary Clay, arkose, alluvialsSilurian Alternating slates & quartzites plus some
volcanic horizonsLower Ordovician Basal Conglomerate overlain by Slates &
QuartzitesLower Cambrian Sandstones, limestones and slates of the
Tamames and Endrinal FormationsPre- Cambrian Schists & Graywackes of the Monterrubio &
Alteatejada Formations
The Silurian lithologies comprise alternating shallow water slates and quartzites with
graptolitic slates and some volcanic horizons. The Silurian rocks attain a maximum thickness
of 700 metres in the core of the Tamames syncline.
The lowermost Ordovician rocks consist of a transgressive basal conglomerate which rests
unconformably on the Tamames Limestone to the north of the Tamamaes syncline and on the
pre Cambrian Aldeatejada Formation on the southern edge of the syncline. In the south-west
around the Pena de Franca, the basal Ordovician conglomerate overlies the pre Cambrian
Monterrubio Formation. The basal conglomerate is overlain by alternating slates and
quartzites which grade upwards into the more massive Armoricana quartzites.
The lower Cambrian rocks on the northern flank of the Tamames syncline are composed of
the Tamames Sandstone (up to 650 metres thick), the Tamames Limestone, which reaches a

Technical Report on the Los Santos Mine Project
November 201325
similar thickness and the overlying Endrinal Shale which are believed to represent shallow
water, near tidal deposits up to 250 metres thick. Metamorphism of the limestone members
of the sequence has resulted in the calc-silicate horizons which host the economic
mineralisation at Los Santos.
The oldest rocks are Pre-Cambrian, in the vicinity of Los Santos comprise the slates,
conglomerates and volcanic rocks of the Monterrubio Formation. The overlying slates,
dolomite breccias and conglomerates of the Aldeatejada Formation are thought to grade
upwards into the Cambrian rocks of the Tamames Formations.
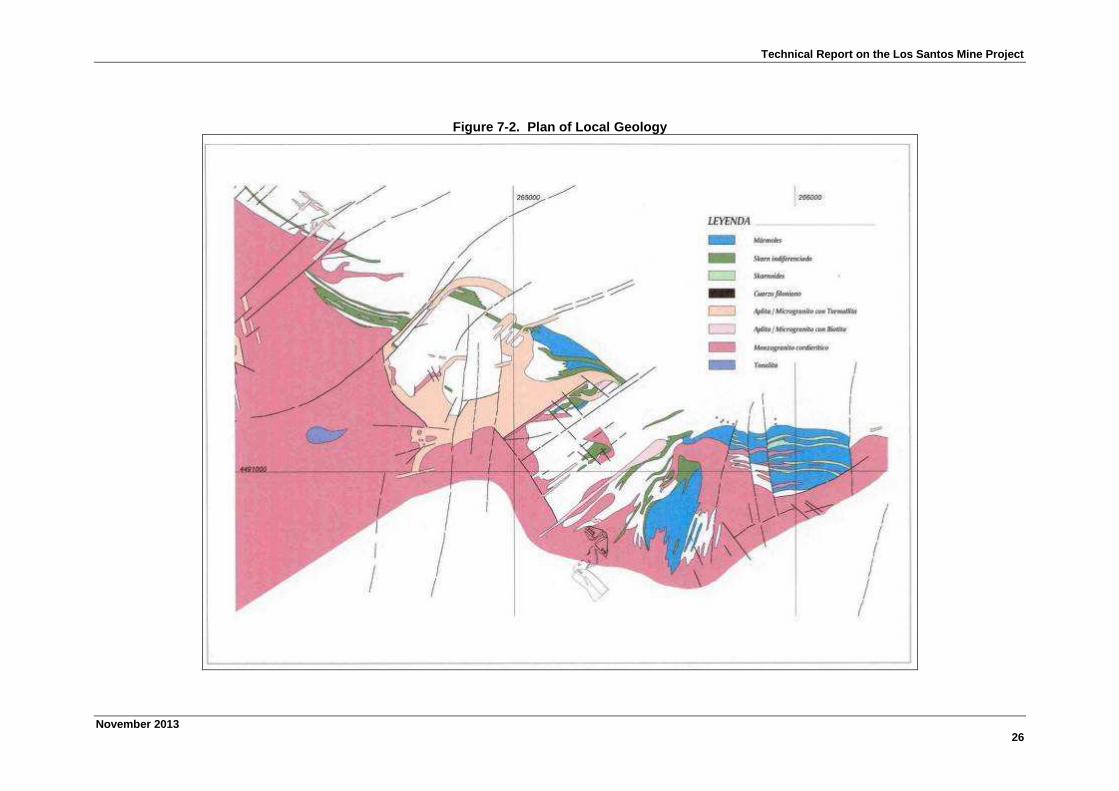
A plan of the local geology and mineralization is shown in Figure 7-2. There are several
varieties of skarn mineralisation, economically the most important being the fine to medium
grained, equigranular pyroxene skarn with scheelite mineralisation. The pyroxene is
predominantly a dark green variety of hedenbergite.
Pyroxene skarn occurs in all zones at Los Santos. It forms from impure Fe-rich carbonates
and contains pyroxene, scheelite, plagioclase and locally magnetite. The scheelite is
generally fine grained, minus 1mm in size, but individual crystals may exceed 1cm.
At the eastern margin of Las Cortinas, sulphide-rich skarns occur. They are up to 5m thick
and several metres in strike length, and comprise massive or semi-massive sulphide horizons
with scheelite mineralisation. Sulphides comprise pyrite, arsenopyrite (lollingite), pyrrhotite
and chalcopyrite as principal minerals and scheelite, sphalerite, native bismuth, bismuthinite
and marcasite as accessories. Wolframite also occurs at Las Cortinas: approximately 6% of
the tungsten in this area. There are also some higher amounts of wolframite in sulphide
zones in Capa Este.
It has been deduced that the scheelite and pyroxene have crystallized simultaneously, within
a high temperature phase. Later, remobilisation has led to amphibole, or apatite as in the talc
veins at Las Cortinas. In eastern and western ends of Las Cortinas sector, scheelite and
wolframite are associated with massive sulphides, with the following minerals:
Main minerals: Pyrite, arsenopyrite (and/or lollingite), pyrrhotite and chalcopyrite.
Pyrite, arsenopyrite (and/or lollingite), pyrrhotite and chalcopyrite.
Accessory minerals: Scheelite, pseudo galena, bismuth, bismuthinite, and marcasite.
Two metallogenetic stages have been recognized, the first one of As-W in which arsenopyrite,
scheelite and pyrite have been deposited. Later, a breccification phase has taken place in
which these minerals have been fractured and, through the fissures and hollows, the other
minerals of the paragenesis have been introduced: pyrrhotite, chalcopyrite, pseudo galena,
bismuth and bismuthinite.
Technical Report on the Los Santos Mine Project
November 201326
Figure 7-2. Plan of Local Geology

Technical Report on the Los Santos Mine Project
November 201327
8 DEPOSIT TYPES
The Los Santos deposit is a typical skarn-hosted scheelite deposit, where intrusion of
granitoids into carbonate-rich sedimentary rocks has resulted in their replacement by calc-
silicate or siliceous minerals, together with mineralisation.
Contact metamorphism is accompanied by strong dehydration of the affected country rocks,
which increases the proportion of metasomatic fluid phases. These fluids combine with the
carbonate ions released, to provide an effective agent for transportation of the wolfram into
zones further from the granite. In contact with the host Tamames Limestone, which outcrops
over a distance of more than 2 km in the vicinity of the Los Santos mine, these fluids resulted
in the emplacement of scheelite (CaWO4) mineralisation in a series of irregular beds and
pods immediately adjacent to the granite contact.
The deposit has been divided into a number of zones, six of which form the basis of the
current project. From west to east these are known as Las Cortinas, Sector Central, Capa
East and Los Santos Sur. The strike length varies for each zone and zone dips are fairly
uniform across the deposit varying between 60o
to 90o.
Within each zone, the skarn mineralisation is located within a number of individual beds,
separated by barren lithologies. The major skarn beds vary between 2m and 20m in width;
there are, however, numerous thinner bands measuring tens of centimetres. Figure 7-2
shows a geological plan of the site, with the principal skarn zones.
9 EXPLORATION
9.1 Previous Exploration
Applying a scheelite-in-skarn exploration model to a granite-metasediment contact zone in the
Guijuelo concession, the Promotora de Recursos Naturales/Billiton Exploration (PRN/BESA)
joint venture discovered mineralisation at Los Santos in March 1980.
The exploration programme included aerial photograph interpretation, geological mapping,
stream sediment, soil and rock geochemistry and a variety of geophysical techniques.
The initial discovery was followed up by a combination of trenching and drilling. A total of 249
trenches (totalling 10,142m) and 231 drillholes (17,874m) were completed.
3,215 samples were collected over the mineralised intervals and assayed primarily for WO3.
Mineralised intervals were defined by Billiton by lamping the core with an ultraviolet lamp and
Technical Report on the Los Santos Mine Project
November 201328
only those samples fluorescing (indicating the presence of scheelite) were sent for WO3
analysis.
A limited number of sulphide intervals intersected in drillcore at Las Cortinas were analysed
for a broader range of elements; including copper, lead, zinc, arsenic and gold. These
additional elements do not form part of this study.
At Los Santos Sur the orebodies were accessed underground in order to obtain bulk samples
for metallurgical testwork. An 825m ramp was constructed down to the 950m level and a
footwall drive with 7 crosscuts and 3 drives in ore completed. A total of 185 bulk samples
totalling 5,500t were collected and stored on surface in individual piles.
When Navan reviewed the project in 1996 their final database comprised 483 drillhole or
trench records of which 191 were surface holes, 37 underground drillholes at Los Santos
South and 255 surface trenches.
This was the same database that was used for the feasibility study completed in 2006.
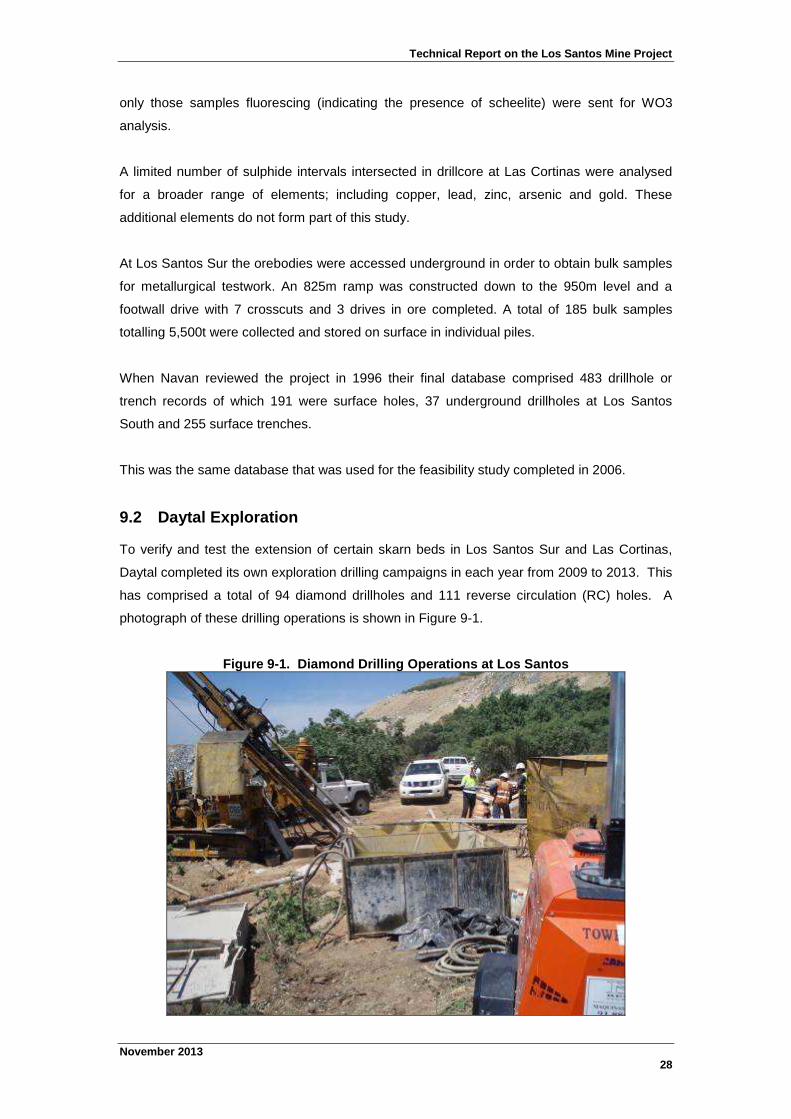
9.2 Daytal Exploration
To verify and test the extension of certain skarn beds in Los Santos Sur and Las Cortinas,
Daytal completed its own exploration drilling campaigns in each year from 2009 to 2013. This
has comprised a total of 94 diamond drillholes and 111 reverse circulation (RC) holes. A
photograph of these drilling operations is shown in Figure 9-1.
Figure 9-1. Diamond Drilling Operations at Los Santos
Technical Report on the Los Santos Mine Project
November 201329
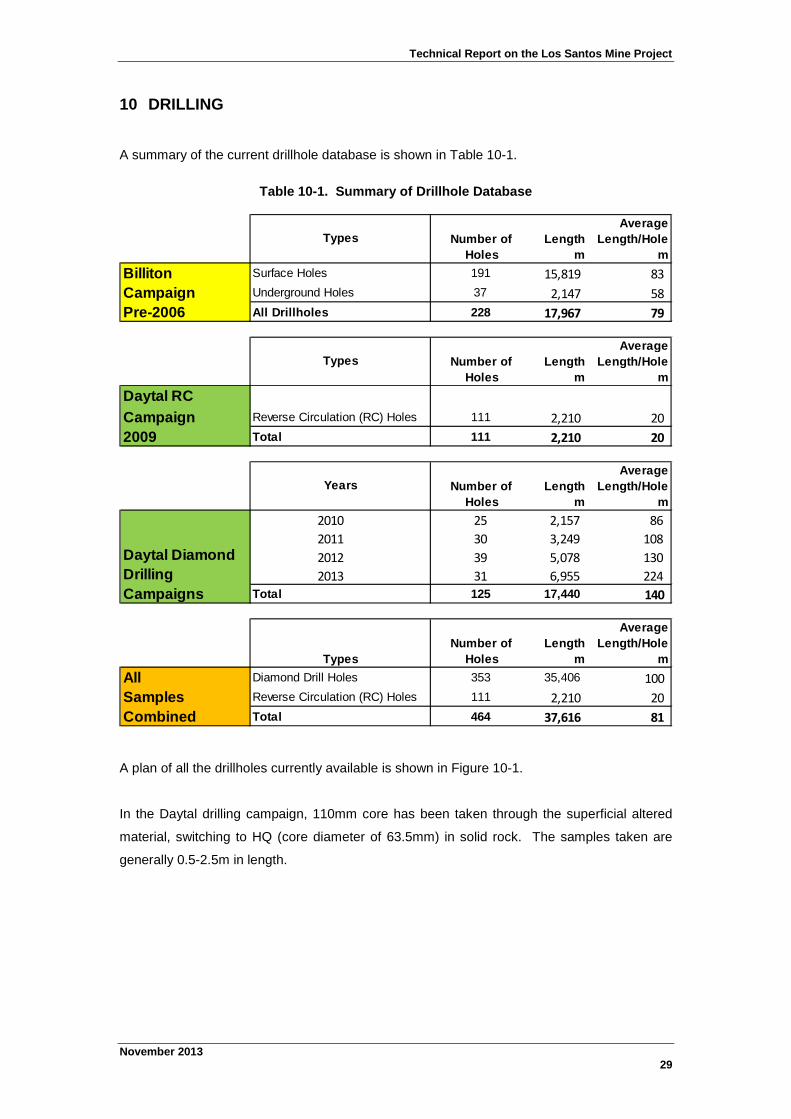
10 DRILLING
A summary of the current drillhole database is shown in Table 10-1.
Table 10-1. Summary of Drillhole Database
Number of
Holes
Length
m
Average
Length/Hole
m
Billiton Surface Holes 191 15,819 83
Campaign Underground Holes 37 2,147 58
Pre-2006 All Drillholes 228 17,967 79
Number of
Holes
Length
m
Average
Length/Hole
m
Daytal RC
Campaign Reverse Circulation (RC) Holes 111 2,210 20
2009 Total 111 2,210 20
Number of
Holes
Length
m
Average
Length/Hole
m
2010 25 2,157 86
2011 30 3,249 108
2012 39 5,078 130
2013 31 6,955 224Total 125 17,440 140
Number of
Holes
Length
m
Average
Length/Hole
m
All Diamond Drill Holes 353 35,406 100
Samples Reverse Circulation (RC) Holes 111 2,210 20
Combined Total 464 37,616 81
Types
Types
Years
Daytal Diamond
Drilling
Campaigns
Types
A plan of all the drillholes currently available is shown in Figure 10-1.
In the Daytal drilling campaign, 110mm core has been taken through the superficial altered
material, switching to HQ (core diameter of 63.5mm) in solid rock. The samples taken are
generally 0.5-2.5m in length.

Technical Report on the Los Santos Mine Project
November 201330
Figure 10-1 Plan of Exploration Drillholes

Technical Report on the Los Santos Mine Project
November 201331
11 SAMPLE PREPARATION, ANALYSES AND SECURITY
11.1 Diamond Core Sampling
In the Billiton and Daytal drilling campaigns, mineralised intervals were generally defined by
lamping the core with an ultraviolet lamp and only those samples fluorescing (indicating the
presence of scheelite) were sent for WO3 analysis. Sample intervals were also selected so as
to correspond with lithological intervals. If a lithological interval was less than 0.5m, this was
then included in the previous or subsequent sample.
Information recorded during core logging included lithological intervals, the appearance under
ultra-violet, and a visual estimation of scheelite content, sulphur content and any other altered
material. Contact types were also recorded, along with the presence of banding, fractures,
vein and dykes.
Core logging during Billiton’s campaign was recorded as being generally excellent in skarn
intersections. During Daytal’s campaign, the drillhole recovery was 97.5% overall, and 96.3%
for those portions from which samples were taken. There does not appear to be any
relationship between grade and recovery.
During the Daytal campaign, when the core boxes arrived in the storehouse, a photo of each
box is taken, as in the example in Figure 11-1. Samples taken ranged in length from 0.5 m to
2 m.
Figure 11-1. Example of Corebox Photograph
Once the samples were described and sampled, they were piled in a two-store pallet to make
the transport easier and placed in order in a specific location in the storehouse. Figure 11-2
shows a photograph of a geologist logging the core, with ultra-violet light assistance.

Technical Report on the Los Santos Mine Project
November 201332
Figure 11-2. Core Logging Operations
Figure 11-3. Core Logging Area.
Technical Report on the Los Santos Mine Project
November 201333
11.2 Trench Sampling
Trench sample were also taken as part of the Billiton’s exploration campaign.
When sampling in trenches, lithological intervals were considered and samples ranged from
2m maximum to 0.5 m minimum. In the trench wall, a channel of 20 cm wide and 2-3 cm
deep was made in fresh rock and the channel must be perpendicular to the stratification, the
mean structure, the existing banded or foliation.
.
11.3 Sample Preparation
After logging, all core for sampling was sawn in two pieces, with one piece being sent onto
sample preparation. Similar steps were taken with trench samples. In both the Billiton and
Daytal campaigns, the sample preparation steps may be summarised as follows:
The entire half of the core (3,5 Kg approximately for 1m) was put in a laboratory bag
(numbered and with description), then sent to the Drying Oven (aluminium trays).
Crushing 100% < 50 mm
Roll Mill 100% <1,5 mm
Homogenizer
Splitter
Ring Mill. In the Daytal campaign, 1 Kg is pulverised in 3 parts. The reduction was to
less than 85 µm in the Billiton campaign, and less than 63 µm in the Daytal campaign,
with a ring of chrome-nickel in order to avoid WO3 contamination. Grind checks were
made 2-3 times a week, to ensure 90% was passing 60 µm.
In the Daytal campaign, 40g samples were then taken to send to an external laboratory
(ALS), and a 4g sample was taken for the Los Santos laboratory. Internal check samples
were taken every 20-30 samples.

Technical Report on the Los Santos Mine Project
November 201334
11.4 Laboratory Sample Analysis
During the Billiton campaign, the principal laboratory used was ADARO – Empresa Nacional
Adaro de Investigaciones Mineras, S.A. The principal assay method was Fluorescence
Spectroscopy (XRF). This was also employed in the BRA laboratories.
In X-ray fluorescence spectroscopy, a beam of electrons strikes a target (such as Mo or Au)
causing the target to release a primary source of X-rays. These primary X-rays are then
used to irradiate a secondary target (the sample), causing the sample to produce
fluorescent (secondary) X-rays. These fluorescent X-rays are emitted with characteristic
energies that can be used to identify the nucleus (i.e. element) from which they arise. The
number of X-rays measured at each characteristic energy can therefore in principle be used
to measure the concentration of the element from which it arises.
The fluorescent X-rays are then dispersed and sorted by wavelength using a selection of
different diffraction crystals, hence the term wavelength-dispersive X-ray fluorescence. The
dispersed X-rays are then detected with a thallium-doped sodium iodide detector or a flow
proportional counter. Each X-ray striking the detector causes a small electrical impulse
which can be amplified and measured using a computer-controlled multichannel analyzer.
Samples of unknown concentration are compared with well-known international standard
reference materials in order to define precise concentration levels of the unknown sample.
The advantages of XRF spectroscopy include:
The technique is ideal for the measurement of major and minor elements and is
thus a preferred technique for whole rock characterization.
The fusion technique minimizes particle size effects that could otherwise cause
problems with the measurement process.
Numerous trace elements can also be determined from the same fused disk, e.g. Y,
Nb, Zr. The disks themselves can be stored indefinitely.
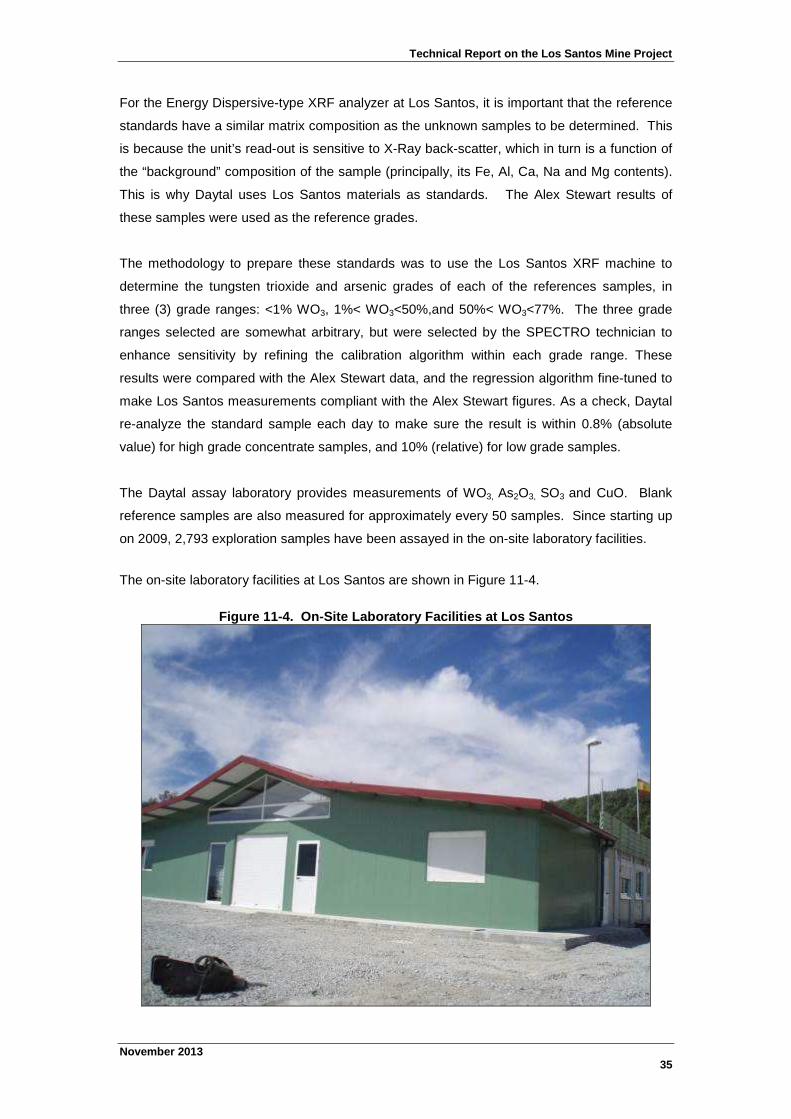
Daytal have their own on-site laboratory, equipped with a Spectro XEPOS XRF-ED
Spectrometer. The principle of operation of the Daytal spectroscope is the same as outlined
above, except that the unit sorts the secondary X-rays according to their energy levels rather
than their wavelengths. This is calibrated daily against 3 standard samples for different grade
ranges. These sets of standard samples were certified by Alex Stewart Assayers Limited of
the UK.
Technical Report on the Los Santos Mine Project
November 201335
For the Energy Dispersive-type XRF analyzer at Los Santos, it is important that the reference
standards have a similar matrix composition as the unknown samples to be determined. This
is because the unit’s read-out is sensitive to X-Ray back-scatter, which in turn is a function of
the “background” composition of the sample (principally, its Fe, Al, Ca, Na and Mg contents).
This is why Daytal uses Los Santos materials as standards. The Alex Stewart results of
these samples were used as the reference grades.
The methodology to prepare these standards was to use the Los Santos XRF machine to
determine the tungsten trioxide and arsenic grades of each of the references samples, in
three (3) grade ranges: <1% WO3, 1%< WO3<50%,and 50%< WO3<77%. The three grade
ranges selected are somewhat arbitrary, but were selected by the SPECTRO technician to
enhance sensitivity by refining the calibration algorithm within each grade range. These
results were compared with the Alex Stewart data, and the regression algorithm fine-tuned to
make Los Santos measurements compliant with the Alex Stewart figures. As a check, Daytal
re-analyze the standard sample each day to make sure the result is within 0.8% (absolute
value) for high grade concentrate samples, and 10% (relative) for low grade samples.
The Daytal assay laboratory provides measurements of WO3, As2O3, SO3 and CuO. Blank
reference samples are also measured for approximately every 50 samples. Since starting up
on 2009, 2,793 exploration samples have been assayed in the on-site laboratory facilities.
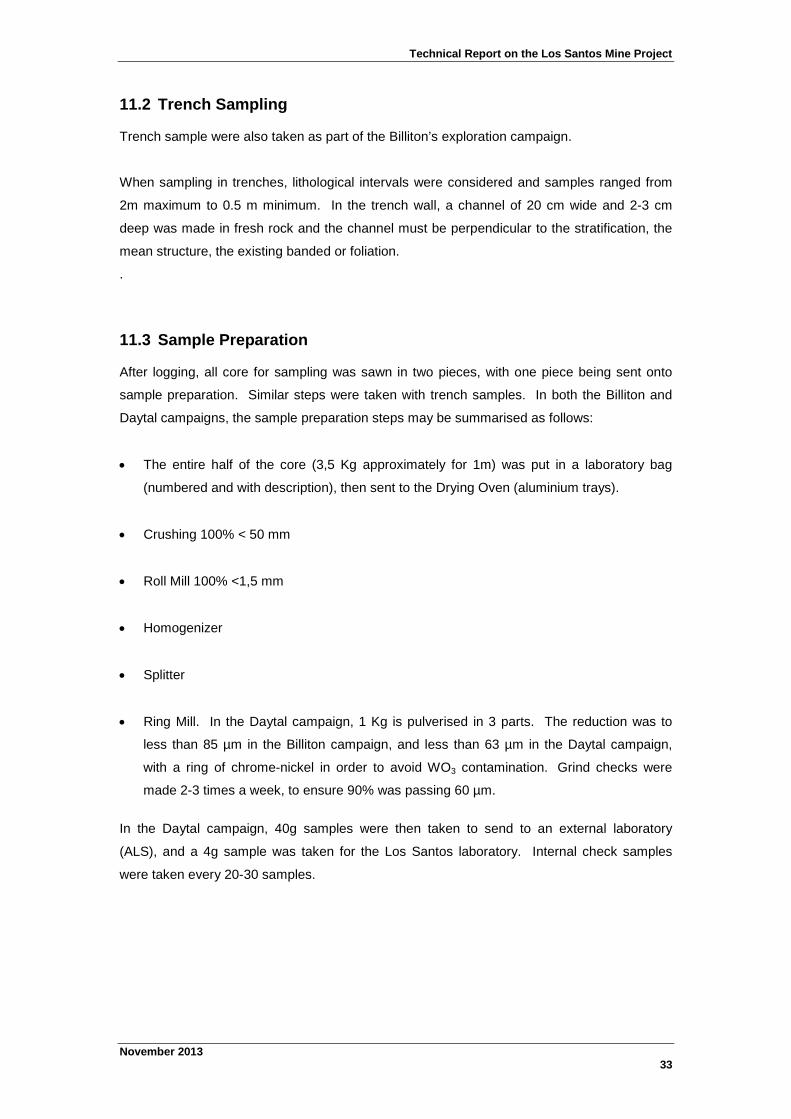
The on-site laboratory facilities at Los Santos are shown in Figure 11-4.
Figure 11-4. On-Site Laboratory Facilities at Los Santos
Technical Report on the Los Santos Mine Project
November 201336
Figure 11-5. On-Site SPECTRO XRF Assaying Equipment
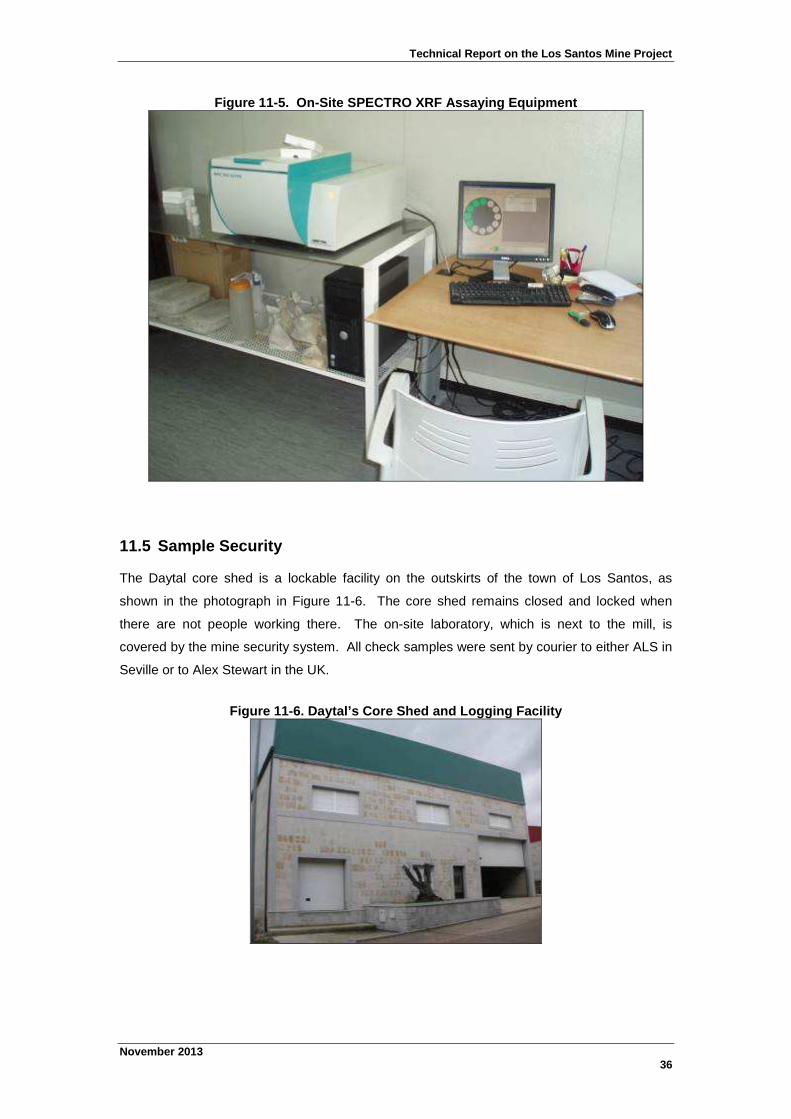
11.5 Sample Security
The Daytal core shed is a lockable facility on the outskirts of the town of Los Santos, as
shown in the photograph in Figure 11-6. The core shed remains closed and locked when
there are not people working there. The on-site laboratory, which is next to the mill, is
covered by the mine security system. All check samples were sent by courier to either ALS in
Seville or to Alex Stewart in the UK.
Figure 11-6. Daytal’s Core Shed and Logging Facility

Technical Report on the Los Santos Mine Project
November 201337
12 DATA VERIFICATION
12.1 Billiton Campaign - Quality Control
The steps completed by Billiton, related sample quality control, are summarised below.
Twin Hole Samples (TS)
Although no specific twin drillholes were drilled, eight underground cross-cuts were developed
across the principal skarn beds in the Los Santos Sur zone, at an elevation of 950m,
approximately 100m below surface. Prior to the development of these cross-cuts, drillholes
were put in along the line of each cross-cut. During subsequent development of the cross-
cuts, detailed bulk samples were taken, particularly through the skarn intersections. On
average 270t of bulk samples were taken in each crosscut, for a total of 2,220t. These bulk
samples (sometimes more than 30t), were prepared right outside the mine in Los Santos
(Crushing, Classifying, Cone Crusher), and then sent to ADARO for analysis and treatment of
metallurgical tests.
Access is still available to view the current exposure in the ramp and crosscuts.
An additional bulk sampling exercise was also undertaken from a surface exposure at the
Sector Central. This was in the form a box-cut, measuring approximately 40m x 20m.
Pulp Duplicates (PD)
Pulp duplicates were sent to same laboratory approximately every 20-30 samples.
Standard Samples (SS)
Standard samples were also sent periodically to the Adaro and BRA laboratories. Results of
218 such measurements, taken between 1981 and 1986, are summarised in the chart in
Figure 12-1. These cover 3 different WO3 grade levels.

Technical Report on the Los Santos Mine Project
November 201338
Figure 12-1. Billiton Campaign – Standard Sampling Results
StandardSamplingResults
0.00
0.50
1.00
1.50
2.00
2.50
06-O
ct-80
18-F
eb-8
2
03-J
ul-83
14-N
ov-8
4
29-M
ar-
86
11-A
ug-8
7
Date
WO
3.
SPE 3 1,69
Desvi 0,17
SPE 2 0,18
Desvi 0,03
SPE 1 0,06
Desvi 0,01
Check Samples (CS)
Check samples were sent to a BRA laboratory. A further 10% of these were checked again
by Alfred H. Knight. These check samples were taken for 40% of all the primary samples. A
graph summarising the majority of these check samples is shown below in Figure 12-2, and
shows a very good correlation.
Figure 12-2. Billiton – Graph of Check Sampling Results
Proyecto LosSantos
Comparación entre laboratorios(ADARO-BRA)
1289 muestrasrepetidas
y=1.0093x+226.94
R2=0.9783
0
10000
20000
30000
40000
50000
60000
70000
80000
90000
0 10000 20000 30000 40000 50000 60000 70000 80000 90000
WO3 ADARO
WO
3B
RA
.
Technical Report on the Los Santos Mine Project
November 201339
12.2 Daytal Campaign - Quality Control
During the diamond drilling campaigns from 2009-12, for almost every sample send to the Los
Santos laboratory, a sample was also sent to an external laboratory (ALS). The ALS
laboratory also made their own internal duplicates’ test assays. Additional check samples
were also sent to an external SGS check laboratory. In the Los Santos laboratory, internal
duplicates were also taken for one for every 20 samples. Duplicates were also sent to the
external laboratory for grade control (blasthole) samples, as well for reverse circulation
drilling. The results of these summarising the various types of diamond drilling duplicates are
shown in Table 12-1.
A relatively poor precision was obtained between the ALS and Los Santos duplicates. The
ALS-sourced grades are those used for subsequent resource estimation work. These ALS
internal duplicates generally demonstrate an acceptable level of precision, and a low
proportion of mis-classifications. Results depicting the HARD (half absolute relative
difference) graphs for ALS duplicates are shown in Figure 12-4 and Figure 12-5 . Although
the ALS-SGS duplicates show a medium to poor level of precision, the overall mean and
median values are very similar, with generally good correlation.
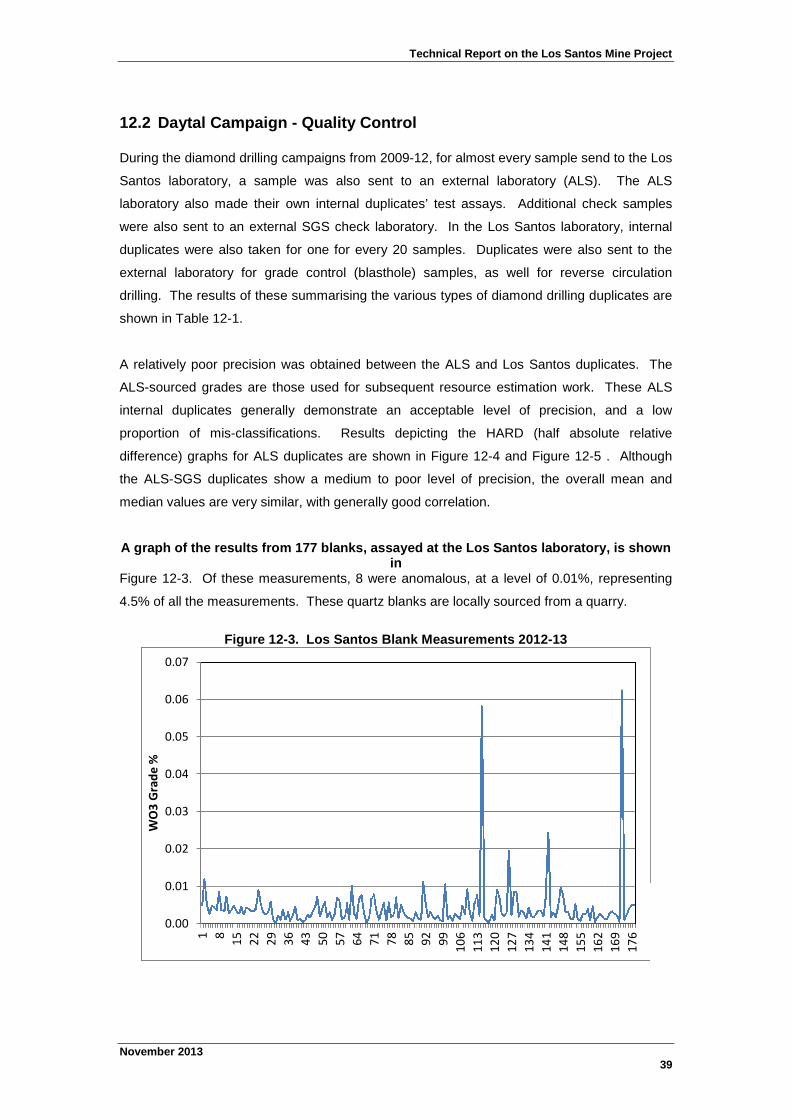
A graph of the results from 177 blanks, assayed at the Los Santos laboratory, is shownin
Figure 12-3. Of these measurements, 8 were anomalous, at a level of 0.01%, representing
4.5% of all the measurements. These quartz blanks are locally sourced from a quarry.
Figure 12-3. Los Santos Blank Measurements 2012-13
0.00
0.01
0.02
0.03
0.04
0.05
0.06
0.07
1 8
15
22
29
36
43
50
57
64
71
78
85
92
99
10
6
11
3
12
0
12
7
13
4
14
1
14
8
15
5
16
2
16
9
17
6
WO
3G
rad
e%

Technical Report on the Los Santos Mine Project
November 201340
Table 12-1. Check Sample Summary Results 2009-2013
Orig Dup Orig Dup Orig Dup Orig Dup Orig Dup Orig Dup
Los Santos Lab duplicates 695 0.0003 0.0004 3.75 3.74 0.16 0.15 0.04 0.04 0.39 0.38 2.5 2.5 12.3% 2.51% -0.03% 0.95 0.93 2.3%
ALS Internal Lab duplicates 150 0.0006 0.0006 33.17 33.17 0.69 0.69 0.12 0.12 2.99 2.99 4.33 4.3 6.7% 0.00% 0.00% 1.00 1.00 0.7%
ALS v SGS Duplicates 42 0.0126 0.005 3.06 3.01 0.32 0.33 0.10 0.12 0.55 0.58 1.75 1.7 32.9% 8.65% -6.23% 1.00 1.01 0.0%
ALS v LS duplicates 1632 0.0006 0.0002 33.17 33.36 0.24 0.23 0.03 0.02 1.19 1.07 4.88 4.7 82.5% 17.85% 0.50% 0.97 0.88 3.1%
Los Santos Lab duplicates 421 0.001 0.001 6.83 6.54 0.24 0.24 0.05 0.05 0.55 0.55 2.34 2.3 16.3% 2.40% 0.80% 1.00 0.99 1.4%
ALS Internal Lab duplicates 30 0.013 0.006 3.20 3.17 0.54 0.54 0.23 0.24 0.74 0.74 1.37 1.4 9.1% 0.55% 0.00% 1.00 1.00 0.0%
ALS v LS duplicates 264 0.03 0.011 6.94 7.18 0.59 0.58 0.21 0.20 0.99 0.96 1.7 1.6 22.5% 6.05% 1.78% 0.99 0.97 4.5%
Notes
. HARD = Half Absolute Relative Difference
. HRD = Half Relative Difference
. ALS = ALS laboratory
. LS = Los Santos laboratory
. SGS = SGS laboratory
. 0.07% WO3 used as cut-off in mis-classification test
SD
2009 -
2012
2013
NumberMinimum Maximum Mean Median Prop'n Mis-
classified %
CV
HARD
Precision
@90%
Rank
Median
HARD
Median
HRD
Correlation
Coefficient
Slope of
Regression
Line
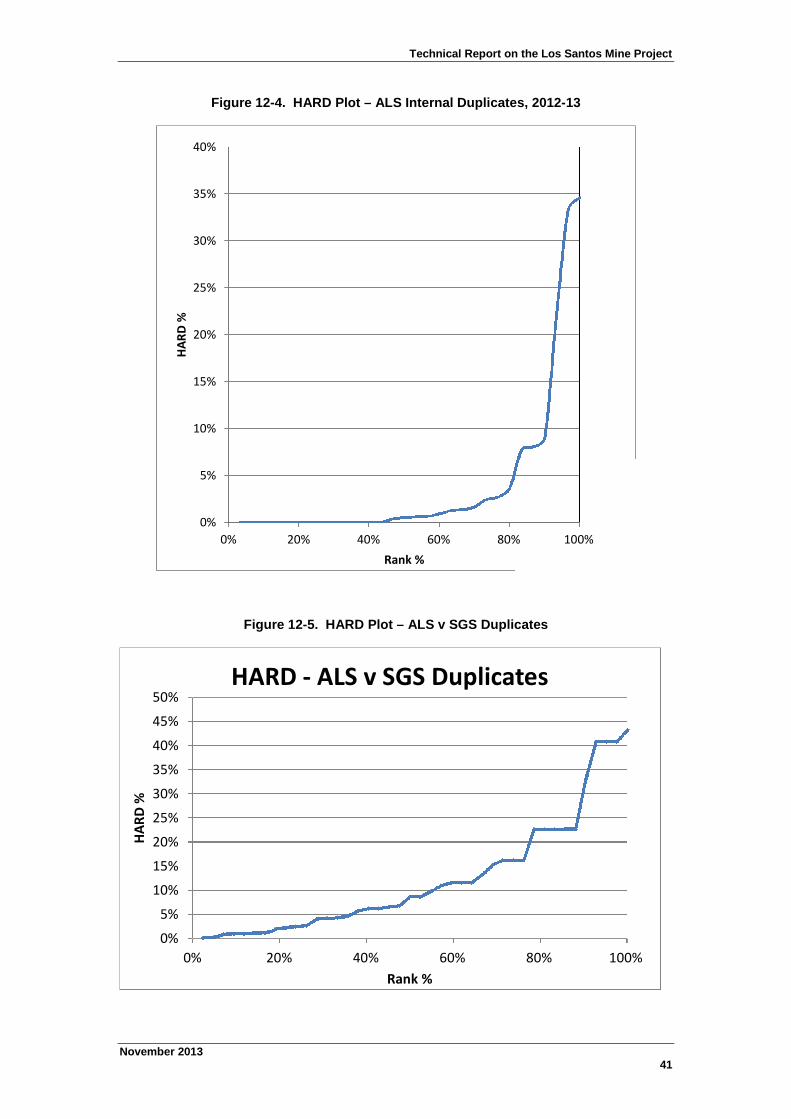
Technical Report on the Los Santos Mine Project
November 201341
Figure 12-4. HARD Plot – ALS Internal Duplicates, 2012-13
0%
5%
10%
15%
20%
25%
30%
35%
40%
0% 20% 40% 60% 80% 100%
HA
RD
%
Rank %
Figure 12-5. HARD Plot – ALS v SGS Duplicates
0%
5%
10%
15%
20%
25%
30%
35%
40%
45%
50%
0% 20% 40% 60% 80% 100%
HA
RD
%
Rank %
HARD - ALS v SGS Duplicates

Technical Report on the Los Santos Mine Project
November 201342
A prepared standard was tested regularly in the Los Santos laboratory, with a certified value
of 0.18% WO3. The assay results for this standard are shown in Figure 12-6, for the time
periods from July 2012 to June 2013. These results show an acceptable level of precision.
Figure 12-6. Los Santos Internal Standard Testing July 2012 – June 2013
0.16
0.17
0.18
0.19
0.20
0.21
0.22
1
11
21
31
41
51
61
71
81
91
10
1
11
1
12
1
13
1
14
1
15
1
16
1
17
1
18
1
19
1
20
1
21
1
22
1
23
1
24
1
25
1
WO
3%
Data
Target
-2SD
+2SD

Technical Report on the Los Santos Mine Project
November 201343
12.3 Drillhole Database
Data related to the drill holes are kept in two different formats. Each drill hole has an
individual excel spreadsheet where the collar, surveys, lithology, recovery and the names of
the sample are included. The assays of the samples supplied by the laboratories are updated
by the Geology Manager. These spreadsheets also contain the intercepts of every drill hole.
This Excel data is imported into Datamine, and subjected to From-To sequence tests as well
as range checks. The drillhole data files are all combined together into individual desurveyed
drillhole files, in which the three-dimensional position and orientation of each sample has
been determined. This combination automatically incorporates various cross-checks between
the different original files. Subsequent three-dimensional visualisation and generation of
sections and plans also offers a means of validation.
12.4 Survey Control
All surface surveying measurements are generated in UTM Coordinates, and are referenced
to the UTM30 7P coordinate system. Topographical data is measured using a GPS Leica
1200 system.
All drillhole collars are measured where the rod line intersects the surface. In the latest
Daytal drilling campaign, downhole surveys were completed using a Reflex Gyro system.

Technical Report on the Los Santos Mine Project
November 201344
13 MINERAL PROCESSING AND METALLURGICAL TESTING
13.1 Introduction
The process plant was designed by Eral Equipos and Proyectos, S.A. (ERAL). After initial
operation with a production rate of up to 300 ktpa during 2010, the plant is now processing
500ktpa. The plant is primarily based on gravimetric separation, aimed at recovering
scheelite, so as to provide a concentrate containing greater than 68% WO3. Current overall
plant recovery of scheelite is approximately 60%. The overall mill flowsheet is shown in
Figure 13-3.
The plant is located immediately to the south of the Los Santos Sur pit, near the existing
underground portal, in an area close to existing mine workings, the main waste dump and
other infrastructure.
13.2 Crushing
Run of mine ore (ROM) is dumped in various locations on the ROM pad according to grade
range categories and for weathered material. This material is then blended by feeding into a
primary jaw crusher, using a front-end loader at a nominal 100 t/h rate. The jaw crusher
product is then delivered by conveyor to a primary cone crusher and the product from this
crusher is dry-screened on a double-deck vibrating screen. A flowsheet of the crushing
circuit is shown in Figure 13-4.
The top deck oversize (plus 27mm) is returned to the primary cone crusher, while the bottom
deck oversize (plus12.5mm) is passed to a secondary cone crusher. The secondary cone
crusher product joins the primary cone crusher product and recycles back to the screen, while
the bottom deck undersize at minus 8mm size is discharged to a stack-out conveyor which
forms a conical open stockpile ahead of the main process plant. A view of the crushed
intermediate stockpile is shown in Figure 13-1.
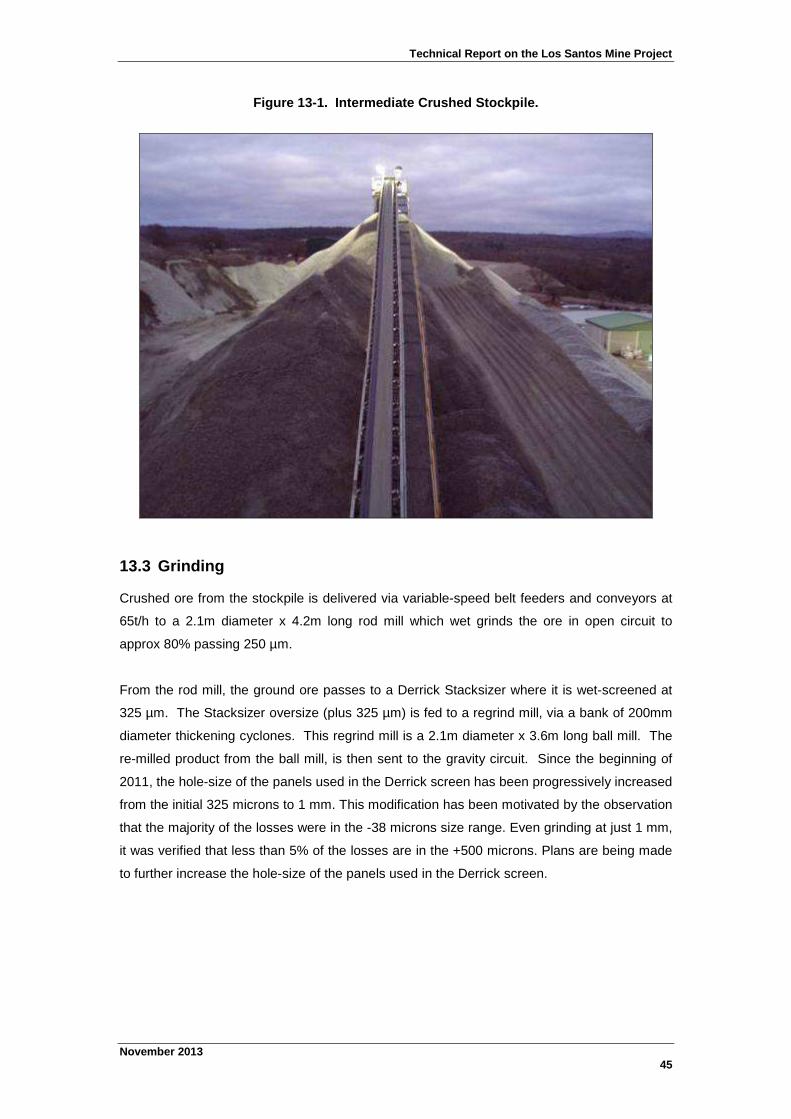
Technical Report on the Los Santos Mine Project
November 201345
Figure 13-1. Intermediate Crushed Stockpile.
13.3 Grinding
Crushed ore from the stockpile is delivered via variable-speed belt feeders and conveyors at
65t/h to a 2.1m diameter x 4.2m long rod mill which wet grinds the ore in open circuit to
approx 80% passing 250 µm.
From the rod mill, the ground ore passes to a Derrick Stacksizer where it is wet-screened at
325 µm. The Stacksizer oversize (plus 325 µm) is fed to a regrind mill, via a bank of 200mm
diameter thickening cyclones. This regrind mill is a 2.1m diameter x 3.6m long ball mill. The
re-milled product from the ball mill, is then sent to the gravity circuit. Since the beginning of
2011, the hole-size of the panels used in the Derrick screen has been progressively increased
from the initial 325 microns to 1 mm. This modification has been motivated by the observation
that the majority of the losses were in the -38 microns size range. Even grinding at just 1 mm,
it was verified that less than 5% of the losses are in the +500 microns. Plans are being made
to further increase the hole-size of the panels used in the Derrick screen.

Technical Report on the Los Santos Mine Project
November 201346
13.4 Spiral Separation
The ground ore is first classified into separate coarse (minus 1000 µm, nominally plus 150
µm), and fine (nominally minus 150, plus 30 µm) fractions using banks of hydrocyclones. The
final cyclone overflow, nominally minus 30 µm in size, is not processed in the gravity circuits
and goes direct to the tailings thickener. The first separation step is the removal of strongly
magnetic particles, mainly mill steel and pyrrhotite, using one-off, wet low intensity magnetic
drum separator in each of the two gravity circuits.
The non-magnetics in the coarse circuit pass to a bank of coarse rougher spirals (36 starts),
the concentrate from these spirals going to a bank of cleaner spirals (12 starts) and the
middlings going to a bank of middlings-cleaner spirals (12 starts). The tailings from the
rougher and middlings-cleaner spirals go to final tailings (as does the middlings from this last
bank), while the tails from the cleaner bank go back to the regrind ball mill, and the middlings
are recycled back to the feed.
In the fines circuit, the rougher spirals comprise one bank of 48 starts. The concentrate from
these fines rougher spirals goes to a bank of fines cleaner spirals (12 starts) and the
middlings, from both banks, recirculate back to the rougher bank. The tails from both banks of
spirals go to the new fines scavenging circuit.
The new fines scavenging circuit comprises a bank of rougher spirals (36 starts) and a bank
of cleaner spirals (12 starts). The middlings from each bank recirculate over the respective
feed, and the tailings are discarded as final tailings. The concentrate from the cleaner spirals
is sent to the hydrosizer (table circuit). The overflow from the cyclones that control the pulp
dilution in the rougher bank is thickened in a second group of cyclones, being the underflow
fed to another set of fine spirals (12 starts). The middlings from these spirals recirculate over
the feed, and the tailings are discarded as final tailings. The concentrate is sent directly to the
ultra-fine group of tables (table circuit).
Figure 13-2. Spiral Classifiers

Technical Report on the Los Santos Mine Project
November 201347
Figure 13-3. Overall General Flowsheet

Technical Report on the Los Santos Mine Project
November 201348
Figure 13-4. Crushing Circuit
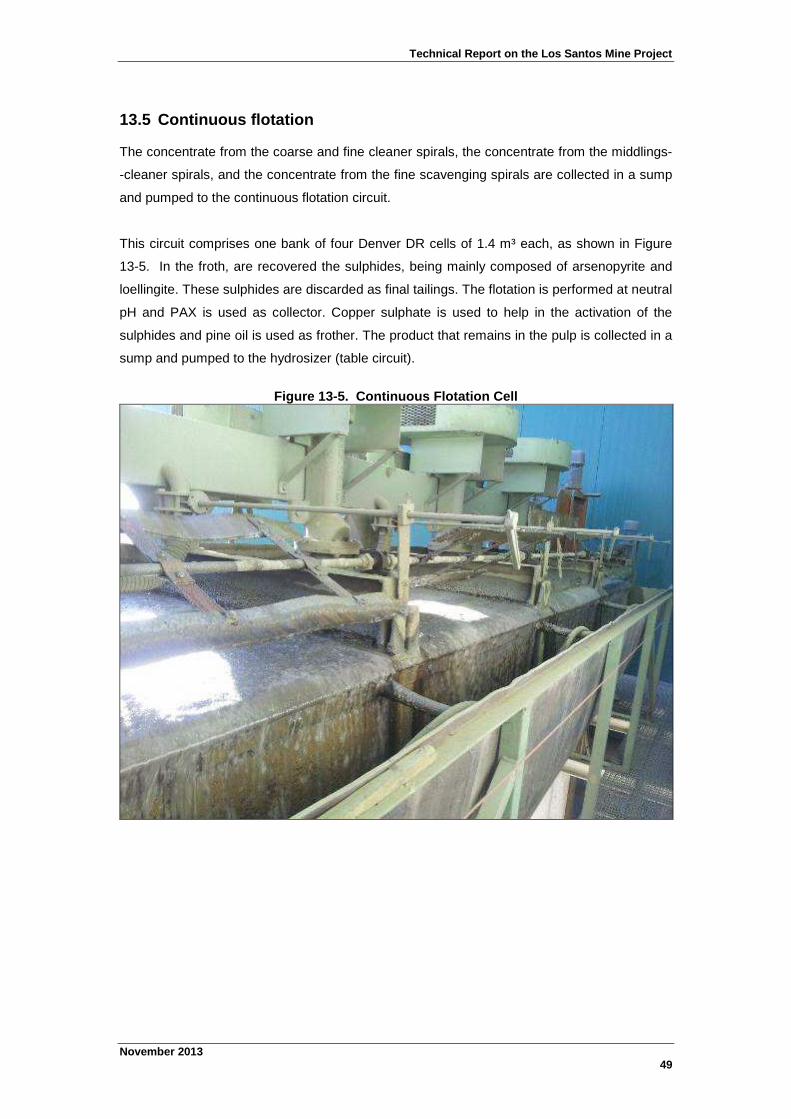
Technical Report on the Los Santos Mine Project
November 201349
13.5 Continuous flotation
The concentrate from the coarse and fine cleaner spirals, the concentrate from the middlings-
-cleaner spirals, and the concentrate from the fine scavenging spirals are collected in a sump
and pumped to the continuous flotation circuit.
This circuit comprises one bank of four Denver DR cells of 1.4 m³ each, as shown in Figure
13-5. In the froth, are recovered the sulphides, being mainly composed of arsenopyrite and
loellingite. These sulphides are discarded as final tailings. The flotation is performed at neutral
pH and PAX is used as collector. Copper sulphate is used to help in the activation of the
sulphides and pine oil is used as frother. The product that remains in the pulp is collected in a
sump and pumped to the hydrosizer (table circuit).
Figure 13-5. Continuous Flotation Cell

Technical Report on the Los Santos Mine Project
November 201350
13.6 Table Separation
The hydrosizer comprises nine chambers, and feeds four separate tabling circuits. All the
circuits are structured in rougher and cleaner steps, with the exception of the ultra-fine circuit,
which only has rougher tables. The tailings from the rougher step of the coarse and
intermediate tabling circuits are sent to regrinding. The tailings from the rougher fine tables
are sent to the fine rougher spirals, while the tailings from the ultra-fine tables are considered
final tailings.
The tailings from the cleaner step of all tabling circuits are recycled back to the hydrosizer.
Finally, the concentrate from all the cleaner tables and from the ultra-fine rougher tables
forms the gravity preconcentrate. A flowsheet depicting grinding, spirals, flotation and tables
is shown in Figure 13-6.
Figure 13-6. Table Separation –Scheelite Under UV Light.
13.7 Tailings and Fines
Tailings from the spirals and tables, as well as magnetic fractions from the low intensity drum
magnets, are pumped to a bank of dewatering cyclones, with the underflow reporting to a high
frequency dewatering screen, from where the undersize is recycled back to the sump of the
pump that feeds the de-watering cyclones.
Fine solids, mainly from the overflow of the second group of fines classifying cyclones of the
scavenging circuit, go directly to a 12m diameter thickener. Thickener underflow is batched to
a 2.25m2
x 136-plate filter press, which produces a cake suitable for conveyor discharge onto
a fines waste stockpile. Overflow from the thickener is recycled as process water. There is no
tailings discharge from the process and no tailings dam: all plant waste is dewatered and
transported back to the mine waste dumps for disposal.

Technical Report on the Los Santos Mine Project
November 201351
13.8 Final Flotation
The combined concentrates from the gravity circuits (the so-called “pre-concentrate”) is fed
into a round screen (via a dewatering cyclone). The oversize (+500μm) is reground in a
900x1200mm rod mill, in close circuit with the screen. The undersize is stored and semi-
dewatered in a settling cone, which feeds a 3m3
batch flotation cell where flotation of the
sulphides takes place, as shown in xx. Recently, a second cell of 3m³ has been installed.
Typical flotation reagents are dosed to the cell and flotation takes place over about 120
minutes at pH <4.3 to remove sulphides as a froth concentrate. These sulphides recirculate
to the continuous flotation circuit. The non-floating material, which is principally scheelite and
calc-silicates, is discharged from the batch cell into a dewatering / settling cone and hence
transferred to Area 60 for drying and final processing. A filter press has also been recently
installed ahead from the dryer, in order to avoid the losses of fines that would occur if the
material was stored and dewatered in bulk bags.
Figure 13-7. Discontinuous Flotation – Concentrate Cleaning
The scheelite flotation project has been abandoned, due to technical and economical
difficulties, in favour of the installation of the scavenging spirals.

Technical Report on the Los Santos Mine Project
November 201352
13.9 Magnetic Separation
The semi-dewatered non-float product from the filter press is directly fed into a 20t-capacity
surge hopper, from which is extracted at nominally 1t/h rate by a variable-speed belt feeder,
and hence by conveyor into a rotary kiln drier. The bone-dry material is then subjected to
high intensity, dry, magnetic separation in a three-stage, rare earth roll (RER) magnetic
separator. More than 90% of the material collected by the separator comes out in the first
roll. The mineralogical composition of this product is mainly magnetic pyroxene
(hedenbergite). Due to the presence of scheelite and wolframite, the WO₃ content can be as
high as 3%. The product that comes out in the second and third rolls is progressively less
rich in magnetic pyroxene and with a higher content in WO₃.
The intermediate products from the RER magnetic separator are now dressed on a double-
deck table, from which it is possible to obtain a low-grade concentrate, of about 45% WO₃. It
is important to notice that in this way it is possible not only to recover scheelite but also
wolframite.
Figure 13-8. Storage of Concentrates
A flowsheet depicting the final flotation, drying and magnetic separation is shown in Figure
13-10.

Technical Report on the Los Santos Mine Project
November 201353
Figure 13-9. Grinding, Spirals, Flotation and Tables Flowsheet

Technical Report on the Los Santos Mine Project
November 201354
Figure 13-10. Final Flotation, Drying and Magnetic Separation Flowsheet
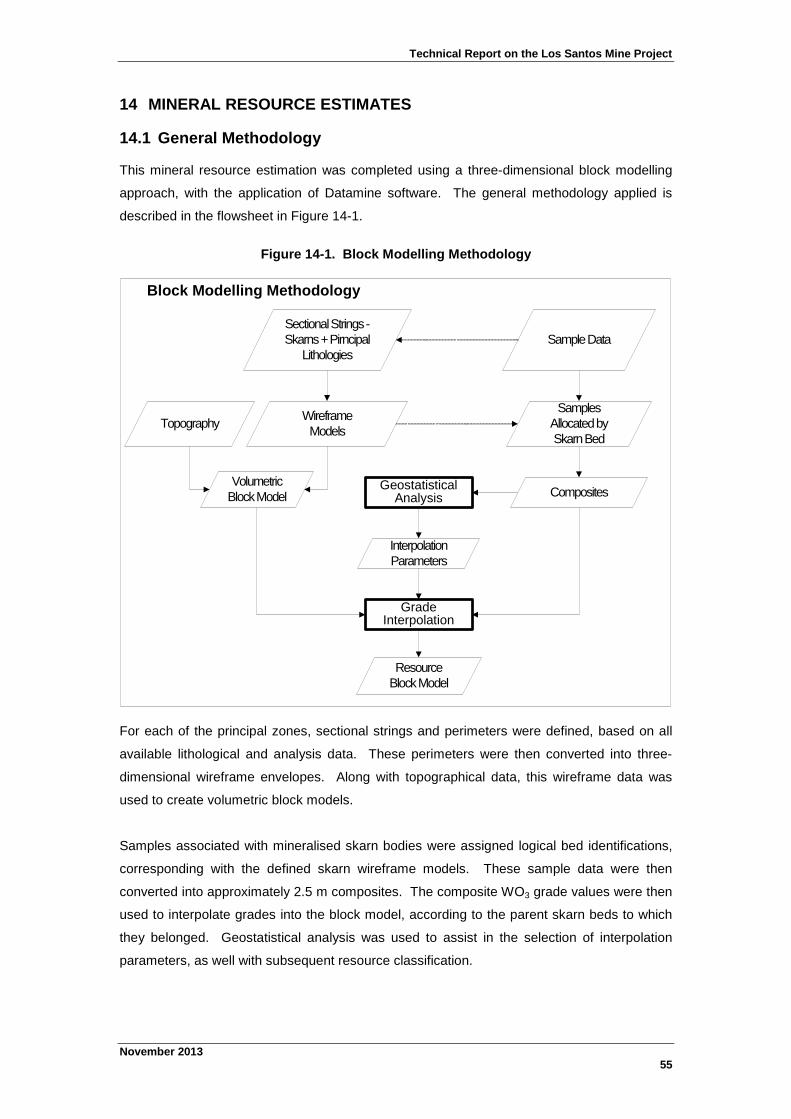
Technical Report on the Los Santos Mine Project
November 201355
14 MINERAL RESOURCE ESTIMATES
14.1 General Methodology
This mineral resource estimation was completed using a three-dimensional block modelling
approach, with the application of Datamine software. The general methodology applied is
described in the flowsheet in Figure 14-1.
Figure 14-1. Block Modelling Methodology
Block Modelling Methodology
SampleData
GradeInterpolation
WireframeModels
SectionalStrings-Skarns+Pirncipal
Lithologies
SamplesAllocatedbySkarnBed
CompositesGeostatistical
Analysis
Topography
ResourceBlockModel
VolumetricBlockModel
InterpolationParameters
For each of the principal zones, sectional strings and perimeters were defined, based on all
available lithological and analysis data. These perimeters were then converted into three-
dimensional wireframe envelopes. Along with topographical data, this wireframe data was
used to create volumetric block models.
Samples associated with mineralised skarn bodies were assigned logical bed identifications,
corresponding with the defined skarn wireframe models. These sample data were then
converted into approximately 2.5 m composites. The composite WO3 grade values were then
used to interpolate grades into the block model, according to the parent skarn beds to which
they belonged. Geostatistical analysis was used to assist in the selection of interpolation
parameters, as well with subsequent resource classification.
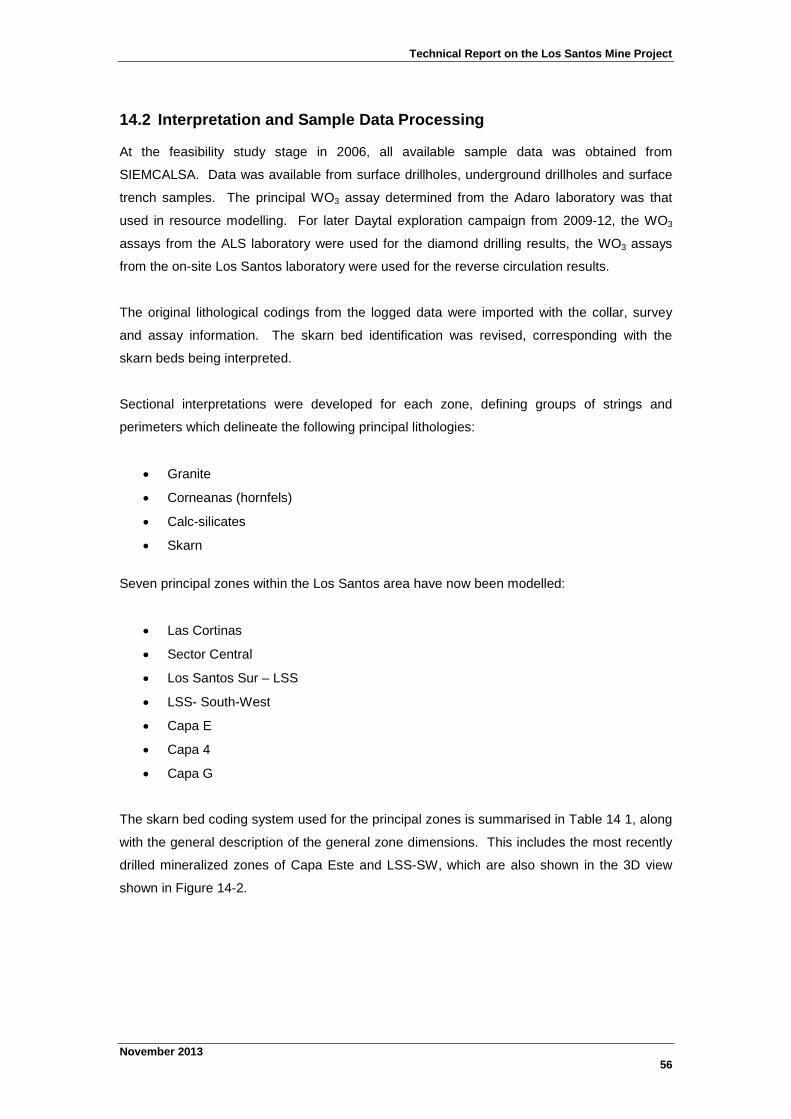
Technical Report on the Los Santos Mine Project
November 201356
14.2 Interpretation and Sample Data Processing
At the feasibility study stage in 2006, all available sample data was obtained from
SIEMCALSA. Data was available from surface drillholes, underground drillholes and surface
trench samples. The principal WO3 assay determined from the Adaro laboratory was that
used in resource modelling. For later Daytal exploration campaign from 2009-12, the WO3
assays from the ALS laboratory were used for the diamond drilling results, the WO3 assays
from the on-site Los Santos laboratory were used for the reverse circulation results.
The original lithological codings from the logged data were imported with the collar, survey
and assay information. The skarn bed identification was revised, corresponding with the
skarn beds being interpreted.
Sectional interpretations were developed for each zone, defining groups of strings and
perimeters which delineate the following principal lithologies:
Granite
Corneanas (hornfels)
Calc-silicates
Skarn
Seven principal zones within the Los Santos area have now been modelled:
Las Cortinas
Sector Central
Los Santos Sur – LSS
LSS- South-West
Capa E
Capa 4
Capa G
The skarn bed coding system used for the principal zones is summarised in Table 14 1, along
with the general description of the general zone dimensions. This includes the most recently
drilled mineralized zones of Capa Este and LSS-SW, which are also shown in the 3D view
shown in Figure 14-2.
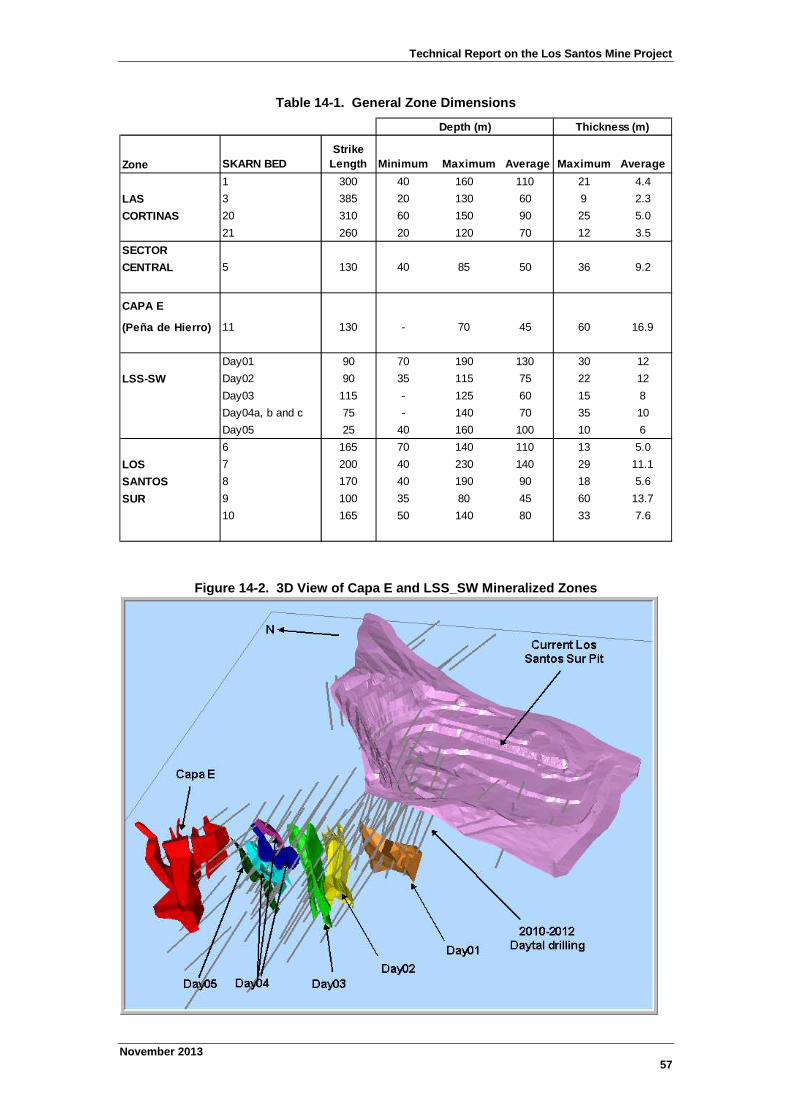
Technical Report on the Los Santos Mine Project
November 201357
Table 14-1. General Zone Dimensions
Zone SKARN BED
Strike
Length Minimum Maximum Average Maximum Average
1 300 40 160 110 21 4.4
LAS 3 385 20 130 60 9 2.3
CORTINAS 20 310 60 150 90 25 5.0
21 260 20 120 70 12 3.5
SECTOR
CENTRAL 5 130 40 85 50 36 9.2
CAPA E
(Peña de Hierro) 11 130 - 70 45 60 16.9
Day01 90 70 190 130 30 12
LSS-SW Day02 90 35 115 75 22 12
Day03 115 - 125 60 15 8
Day04a, b and c 75 - 140 70 35 10
Day05 25 40 160 100 10 6
6 165 70 140 110 13 5.0
LOS 7 200 40 230 140 29 11.1
SANTOS 8 170 40 190 90 18 5.6
SUR 9 100 35 80 45 60 13.7
10 165 50 140 80 33 7.6
Depth (m) Thickness (m)
Figure 14-2. 3D View of Capa E and LSS_SW Mineralized Zones

Technical Report on the Los Santos Mine Project
November 201358
The skarn identification used included all of the different skarn types, as the types of skarn
can change within the same bed. For each zone, once the lithological wireframes had been
developed, the following checks were made:
- Samples were selected according to the three-dimensional position of samples against
the wireframe envelopes. Sections were then produced, showing additional samples
within the beds that had not been previously identified, as well as previously coded skarn
samples which appeared to be outside the wireframes. Apparent errors were then
collated and used to refine both the structural wireframes as well as the assigned bed
codings.
- Range checks.
After editing of located errors, the final set of structural wireframes and coded sample data
were used for subsequent resource modelling purposes. The selected sample sets, for each
zone and each bed, were used to create 2.5 m composites across each intersection, for both
drillholes and trenches. Prior to compositing, WO3 top-cut levels were also applied, which are
discussed in more detail in the next section. The composites had a slightly variable length, so
as to fit a whole number of composites into each intersection. During subsequent
compositing, some additional drillhole intersections were also located, where no samples had
been taken when passing through interpreted skarn beds. In such cases, additional
composites were created with the grade set to WO3=0.01%.
The overall summary of samples is shown in Table 14-2, for data up to the end of 2013.

Technical Report on the Los Santos Mine Project
November 201359
Table 14-2. Exploration Sample Summary
Number of
Holes/Trenches Length
Number of
Samples
Billiton Surface Holes 191 15,819 1,490
Campaign Underground Holes 37 2,147 439
Pre-2006 All Drillholes 228 17,967 1,929
Surface Trenches 255 10,167 784
Total 483 28,134 2,713
Number of
Holes Length
Number of
Samples
Daytal RC
Campaign Reverse Circulation (RC) Holes 111 2,210 942
2009 Total 111 2,210 942
Number of
Holes Length
Number of
Samples
2010 25 2,157 491
2011 30 3,249 509
2012 39 5,078 931
2013 31 6,955 579Total 125 17,440 2,510
Number of
Holes/Trenches Length
Number of
Samples
All Drillholes 464 37,616 5,381
Samples Surface Trenches 255 10,167 784
Combined Total 719 47,783 6,165
Types
Types
Daytal
Diamond
Drilling
Campaigns
Types
Years

Technical Report on the Los Santos Mine Project
November 201360
14.3 Geostatistics
Statistical parameters were determined for the selected sample sets in zone and in each
skarn bed, as summarised in Table 14-3. As samples were often taken on erratic lengths,
statistical parameters were determined with length-weighting. In most cases, the sample
length is between 2 and 2.5m.
Table 14-3. Summary Statistics of Samples By Mineralised Zone
ZONE BED NUMBER MINIMUM MAXIMUM MEAN VARIANCE
STANDARD
DEVIATION
LOG
ESTIMATE
OF MEAN
COEFF.OF
VARIATION
CAPA ESTE 11 230 0.001 2.55 0.17 0.09 0.30 0.20 1.79
1 211 0.001 12.99 0.85 3.03 1.74 1.07 2.04
LAS 3 92 0.002 7.37 0.43 0.90 0.95 0.47 2.21
CORTINAS 20 213 0.001 3.70 0.18 0.17 0.42 0.24 2.27
21 132 0.001 2.82 0.28 0.18 0.42 0.49 1.49
6 262 0.001 4.11 0.20 0.11 0.34 0.58 1.70
7 638 0.001 4.37 0.38 0.28 0.53 0.83 1.42
LOS 8 153 0.001 4.03 0.29 0.36 0.60 0.44 2.09
SANTOS SUR 9 120 0.001 3.43 0.68 0.68 0.82 1.47 1.21
10 192 0.001 5.88 0.28 0.48 0.69 0.42 2.49
11 38 0.001 2.06 0.36 0.23 0.48 4.92 1.35
LSS - SW 11 482 0.001 33.17 0.40 1.66 1.29 0.46 3.23
SECTOR CENTRAL 5 148 0.0010 8.88 0.39 1.04 1.02 0.48 2.60
In many cases, the maximum grade is considerably higher than the average grades. To
better analyse these outlier grades, decile analyses were also completed for the sample sets
in each zone, as summarised in Table 14-5. Log probability plots were also prepared for the
same sample sets, and are shown in Appendix A. In most cases the majority of samples
conform approximately to a single log-normal population. However, in many cases, a high
grade tail is apparent, indicating outlier grades. Examination of these outlier grades in 3D
seldom showed clear zonations, where they might be physically constrained. From these
noticeable high grade tails, therefore, as well as from the decile analyses, WO3 top-cut levels
were determined. These top-cut values, by zone, are summarised in Table 14-4, and were
applied prior to compositing.
Table 14-4. WO3 Top-Cut Levels
Zone Value
Sector Central 4.5
Las Cortinas 3.7
Los Santos Sur 2.7
Capa E 5
LSS-SW 5
A composite length of 2.5m was selected, as being near to or above most of the original
sample lengths. It was also an appropriate length in terms of a selectable mining width during
subsequent mine planning. Statistics of the resultant composite data sets are summarised in
Table 14-6.
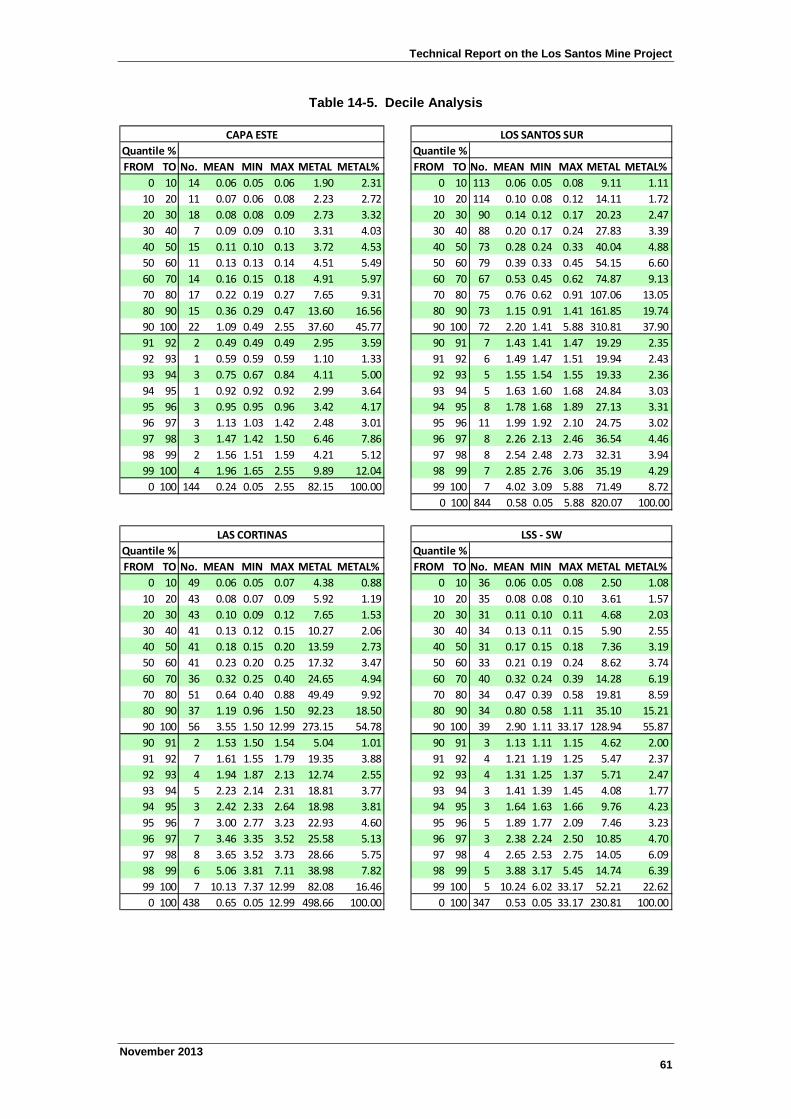
Technical Report on the Los Santos Mine Project
November 201361
Table 14-5. Decile Analysis
FROM TO No. MEAN MIN MAX METAL METAL% FROM TO No. MEAN MIN MAX METAL METAL%
0 10 14 0.06 0.05 0.06 1.90 2.31 0 10 113 0.06 0.05 0.08 9.11 1.11
10 20 11 0.07 0.06 0.08 2.23 2.72 10 20 114 0.10 0.08 0.12 14.11 1.72
20 30 18 0.08 0.08 0.09 2.73 3.32 20 30 90 0.14 0.12 0.17 20.23 2.47
30 40 7 0.09 0.09 0.10 3.31 4.03 30 40 88 0.20 0.17 0.24 27.83 3.39
40 50 15 0.11 0.10 0.13 3.72 4.53 40 50 73 0.28 0.24 0.33 40.04 4.88
50 60 11 0.13 0.13 0.14 4.51 5.49 50 60 79 0.39 0.33 0.45 54.15 6.60
60 70 14 0.16 0.15 0.18 4.91 5.97 60 70 67 0.53 0.45 0.62 74.87 9.13
70 80 17 0.22 0.19 0.27 7.65 9.31 70 80 75 0.76 0.62 0.91 107.06 13.05
80 90 15 0.36 0.29 0.47 13.60 16.56 80 90 73 1.15 0.91 1.41 161.85 19.74
90 100 22 1.09 0.49 2.55 37.60 45.77 90 100 72 2.20 1.41 5.88 310.81 37.90
91 92 2 0.49 0.49 0.49 2.95 3.59 90 91 7 1.43 1.41 1.47 19.29 2.35
92 93 1 0.59 0.59 0.59 1.10 1.33 91 92 6 1.49 1.47 1.51 19.94 2.43
93 94 3 0.75 0.67 0.84 4.11 5.00 92 93 5 1.55 1.54 1.55 19.33 2.36
94 95 1 0.92 0.92 0.92 2.99 3.64 93 94 5 1.63 1.60 1.68 24.84 3.03
95 96 3 0.95 0.95 0.96 3.42 4.17 94 95 8 1.78 1.68 1.89 27.13 3.31
96 97 3 1.13 1.03 1.42 2.48 3.01 95 96 11 1.99 1.92 2.10 24.75 3.02
97 98 3 1.47 1.42 1.50 6.46 7.86 96 97 8 2.26 2.13 2.46 36.54 4.46
98 99 2 1.56 1.51 1.59 4.21 5.12 97 98 8 2.54 2.48 2.73 32.31 3.94
99 100 4 1.96 1.65 2.55 9.89 12.04 98 99 7 2.85 2.76 3.06 35.19 4.29
0 100 144 0.24 0.05 2.55 82.15 100.00 99 100 7 4.02 3.09 5.88 71.49 8.72
0 100 844 0.58 0.05 5.88 820.07 100.00
FROM TO No. MEAN MIN MAX METAL METAL% FROM TO No. MEAN MIN MAX METAL METAL%
0 10 49 0.06 0.05 0.07 4.38 0.88 0 10 36 0.06 0.05 0.08 2.50 1.08
10 20 43 0.08 0.07 0.09 5.92 1.19 10 20 35 0.08 0.08 0.10 3.61 1.57
20 30 43 0.10 0.09 0.12 7.65 1.53 20 30 31 0.11 0.10 0.11 4.68 2.03
30 40 41 0.13 0.12 0.15 10.27 2.06 30 40 34 0.13 0.11 0.15 5.90 2.55
40 50 41 0.18 0.15 0.20 13.59 2.73 40 50 31 0.17 0.15 0.18 7.36 3.19
50 60 41 0.23 0.20 0.25 17.32 3.47 50 60 33 0.21 0.19 0.24 8.62 3.74
60 70 36 0.32 0.25 0.40 24.65 4.94 60 70 40 0.32 0.24 0.39 14.28 6.19
70 80 51 0.64 0.40 0.88 49.49 9.92 70 80 34 0.47 0.39 0.58 19.81 8.59
80 90 37 1.19 0.96 1.50 92.23 18.50 80 90 34 0.80 0.58 1.11 35.10 15.21
90 100 56 3.55 1.50 12.99 273.15 54.78 90 100 39 2.90 1.11 33.17 128.94 55.87
90 91 2 1.53 1.50 1.54 5.04 1.01 90 91 3 1.13 1.11 1.15 4.62 2.00
91 92 7 1.61 1.55 1.79 19.35 3.88 91 92 4 1.21 1.19 1.25 5.47 2.37
92 93 4 1.94 1.87 2.13 12.74 2.55 92 93 4 1.31 1.25 1.37 5.71 2.47
93 94 5 2.23 2.14 2.31 18.81 3.77 93 94 3 1.41 1.39 1.45 4.08 1.77
94 95 3 2.42 2.33 2.64 18.98 3.81 94 95 3 1.64 1.63 1.66 9.76 4.23
95 96 7 3.00 2.77 3.23 22.93 4.60 95 96 5 1.89 1.77 2.09 7.46 3.23
96 97 7 3.46 3.35 3.52 25.58 5.13 96 97 3 2.38 2.24 2.50 10.85 4.70
97 98 8 3.65 3.52 3.73 28.66 5.75 97 98 4 2.65 2.53 2.75 14.05 6.09
98 99 6 5.06 3.81 7.11 38.98 7.82 98 99 5 3.88 3.17 5.45 14.74 6.39
99 100 7 10.13 7.37 12.99 82.08 16.46 99 100 5 10.24 6.02 33.17 52.21 22.62
0 100 438 0.65 0.05 12.99 498.66 100.00 0 100 347 0.53 0.05 33.17 230.81 100.00
Quantile % Quantile %
CAPA ESTE
LAS CORTINAS
LOS SANTOS SUR
LSS - SW
Quantile % Quantile %
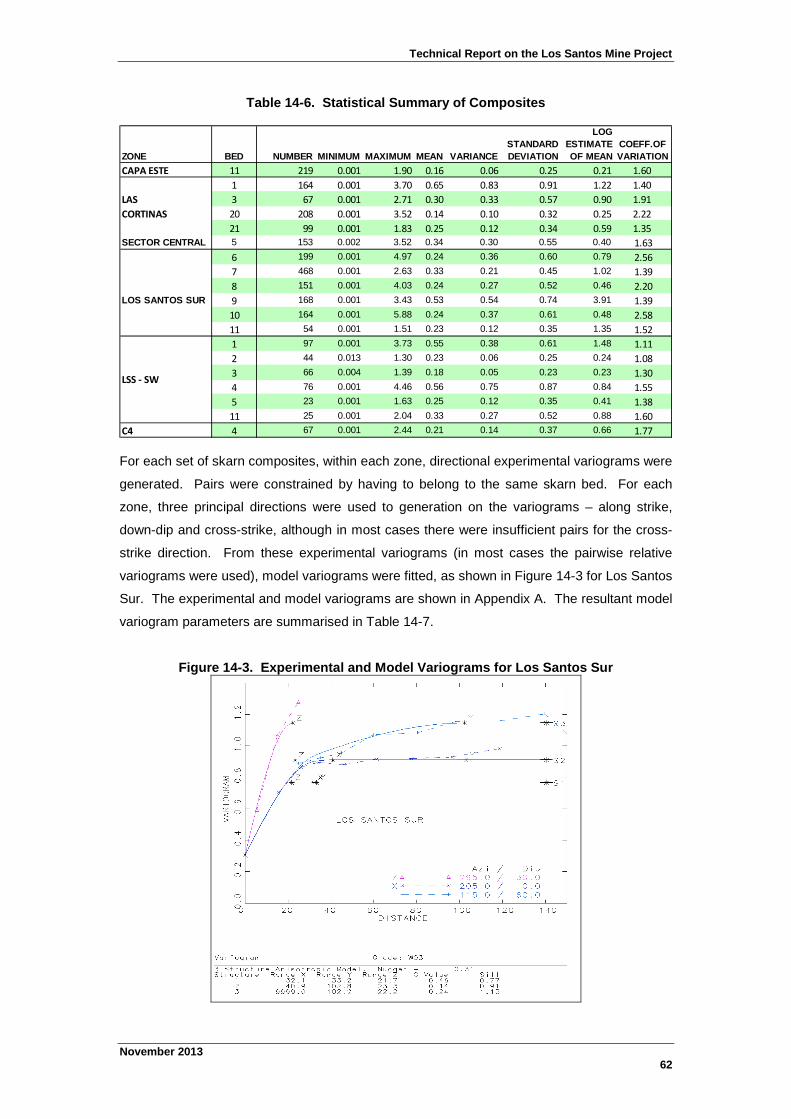
Technical Report on the Los Santos Mine Project
November 201362
Table 14-6. Statistical Summary of Composites
ZONE BED NUMBER MINIMUM MAXIMUM MEAN VARIANCE
STANDARD
DEVIATION
LOG
ESTIMATE
OF MEAN
COEFF.OF
VARIATION
CAPA ESTE 11 219 0.001 1.90 0.16 0.06 0.25 0.21 1.60
1 164 0.001 3.70 0.65 0.83 0.91 1.22 1.40
LAS 3 67 0.001 2.71 0.30 0.33 0.57 0.90 1.91
CORTINAS 20 208 0.001 3.52 0.14 0.10 0.32 0.25 2.22
21 99 0.001 1.83 0.25 0.12 0.34 0.59 1.35
SECTOR CENTRAL 5 153 0.002 3.52 0.34 0.30 0.55 0.40 1.63
6 199 0.001 4.97 0.24 0.36 0.60 0.79 2.56
7 468 0.001 2.63 0.33 0.21 0.45 1.02 1.39
8 151 0.001 4.03 0.24 0.27 0.52 0.46 2.20
LOS SANTOS SUR 9 168 0.001 3.43 0.53 0.54 0.74 3.91 1.39
10 164 0.001 5.88 0.24 0.37 0.61 0.48 2.58
11 54 0.001 1.51 0.23 0.12 0.35 1.35 1.52
1 97 0.001 3.73 0.55 0.38 0.61 1.48 1.11
2 44 0.013 1.30 0.23 0.06 0.25 0.24 1.08
3 66 0.004 1.39 0.18 0.05 0.23 0.23 1.30
4 76 0.001 4.46 0.56 0.75 0.87 0.84 1.55
5 23 0.001 1.63 0.25 0.12 0.35 0.41 1.38
11 25 0.001 2.04 0.33 0.27 0.52 0.88 1.60
C4 4 67 0.001 2.44 0.21 0.14 0.37 0.66 1.77
LSS - SW
For each set of skarn composites, within each zone, directional experimental variograms were
generated. Pairs were constrained by having to belong to the same skarn bed. For each
zone, three principal directions were used to generation on the variograms – along strike,
down-dip and cross-strike, although in most cases there were insufficient pairs for the cross-
strike direction. From these experimental variograms (in most cases the pairwise relative
variograms were used), model variograms were fitted, as shown in Figure 14-3 for Los Santos
Sur. The experimental and model variograms are shown in Appendix A. The resultant model
variogram parameters are summarised in Table 14-7.
Figure 14-3. Experimental and Model Variograms for Los Santos Sur

Technical Report on the Los Santos Mine Project
November 201363
Table 14-7. Model Variogram Parameters
Zone Bed NUGGET C1 C2 C3
ANGLE1 ANGLE2 1 2 3 1 2 3 1 2 3
Los Santos Sur 1 115 60 0.31 32 33 22 0.46 41 103 23 0.14 9999 102 22 0.24
Los Santos Sur 6 155 60 0.31 32 33 22 0.46 41 103 23 0.14 9999 102 22 0.24
Las Cortinas 35 70 0.28 7 7 4 0.20 16 25 9 0.15 9999 30 12 0.04
Capa E 0.03 16 16 16 0.02 30 30 30 0.01 - - - -
Sector Central 22 80 0.44 59 21 5 0.44
Capa 4 0.10 42 42 42 1.29
LSS_SW 0.03 10 10 10 0.23 51 51 51 0.07
Notes
. Angle1 is about axis 3 (z)
. Angle 2 is about axis 1 (x)
Orientation Range 1 (m) Range 2 (m) Range 3 (m)
14.4 Volumetric Modelling
The various interpreted three-dimensional wireframe models were used to construct separate
volumetric block models for each zone. After grade interpolation, these separate block
models were then subsequently combined to form an overall block model for the whole Los
Santos area, which was used for pit optimisation.
For each zone, the principal wireframes used were for the following lithologies.
• Granite
• Corneanas (hornfels)
• Calc-silicates
• Skarn
An additional topographic wireframe model was also used to cut blocks off against the
surface. For the areas which have been mined this topography represented the surface at
the end of June, 2013. All zones were modelled within the same common model prototype,
which is summarised in Table 14-8. The principal parent block size used was 10m x 10m x
10m, but with sub-blocks within the skarn beds measuring 5m x 5m x 5m. Additional sub-
blocks with varying sizes were created against zone boundaries, to provide an appropriate
volumetric fit. The model structure was also rotated at angle of approximately 22o, so that
blocks were more logically oriented with the majority of skarn structures.
An oxidised layer was also modelled, with lower densities, for material up to 10m below the
original topography.
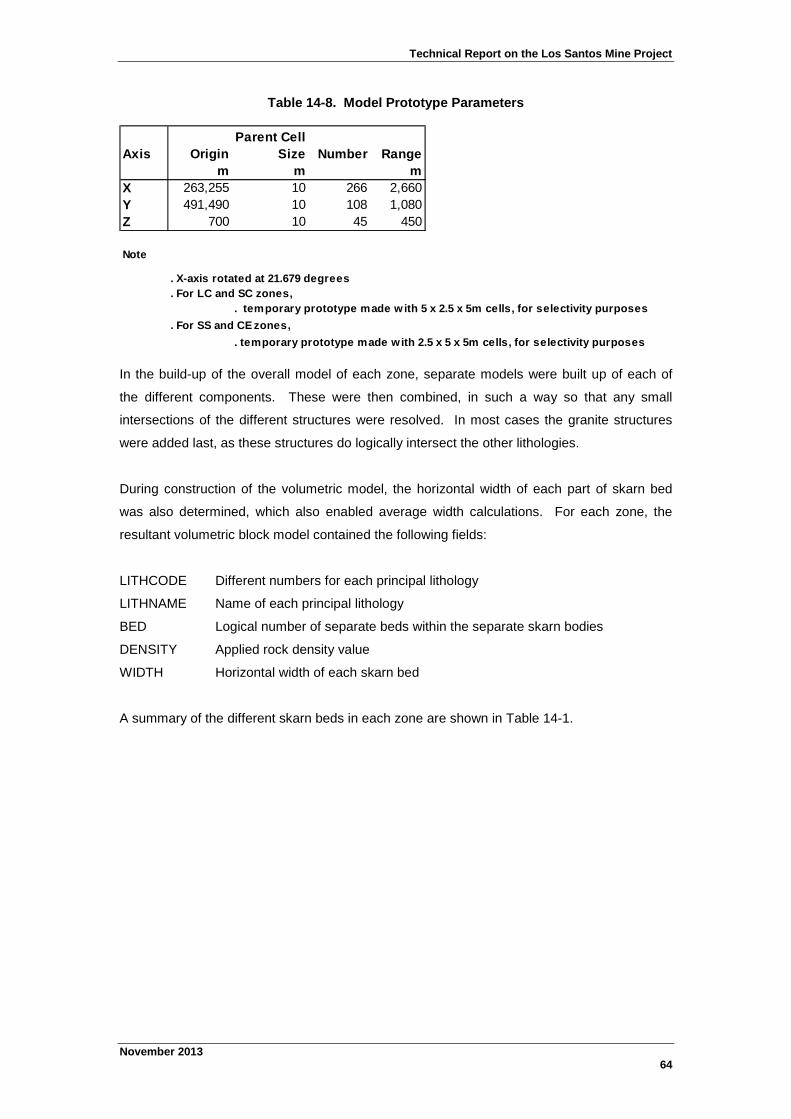
Technical Report on the Los Santos Mine Project
November 201364
Table 14-8. Model Prototype Parameters
Axis Origin
Parent Cell
Size Number Range
m m m
X 263,255 10 266 2,660
Y 491,490 10 108 1,080
Z 700 10 45 450
Note
. X-axis rotated at 21.679 degrees
. For LC and SC zones,
. temporary prototype made with 5 x 2.5 x 5m cells, for selectivity purposes
. For SS and CE zones,
. temporary prototype made with 2.5 x 5 x 5m cells, for selectivity purposes
In the build-up of the overall model of each zone, separate models were built up of each of
the different components. These were then combined, in such a way so that any small
intersections of the different structures were resolved. In most cases the granite structures
were added last, as these structures do logically intersect the other lithologies.
During construction of the volumetric model, the horizontal width of each part of skarn bed
was also determined, which also enabled average width calculations. For each zone, the
resultant volumetric block model contained the following fields:
LITHCODE Different numbers for each principal lithology
LITHNAME Name of each principal lithology
BED Logical number of separate beds within the separate skarn bodies
DENSITY Applied rock density value
WIDTH Horizontal width of each skarn bed
A summary of the different skarn beds in each zone are shown in Table 14-1.

Technical Report on the Los Santos Mine Project
November 201365
14.5 Densities
Separate density values were assigned to each principal lithology. The principaldensity measurements made during previous studies, along with the final density
values used in the current study, are shown inTable 14-9. The different laboratories used for these densities measurements are
summarised below:
- ADARO
- THACSA
- BESA (Billition)
- Escuela Tecnica Superior de Ingenieros de Minas de Madrid
Table 14-9. Density Values
ADARO THACSA
Study Rock Type Density Density Sample No. Drillhole Depth
Pyroxene skarn 3.48 3.53 7931 29 19.1
Pyroxene skarn 3.39 3.41 7953 28 71
Pyroxene skarn 3.42 3.42 7961 24 74.3
Pyrite skarn 3.33 3.49 7939 29 44.1
Pyrrhotite skarn 3.54 3.60 7945 30 46.8
D.Carter 3.43 3.49
Nov-82
Pyroxene-feldspar skarn 2.84 2.86 7948 30 37.8
Feldspar skarn 2.92 2.89 7964 27 46.3
Marble 2.73 2.76 7936 29 64.78
Schist 2.74 2.71 7968 27 20.7
Granite 2.61 2.63 7969 29 91.5
Rock Type No of Samples Density
Granite 3 2.72
Dames & Moore 84 Aplite 3 2.65 Escuela Tecnica Superior
Schist 5 2.76 de Ingenieros de Minas de Madrid
Calcsilicate 16 3.07
Marble 4 2.87
Skarn 5 3.36
Rock Type No of Samples Density
Granodiorite, granite & aplite 6 2.69 BESA
Piteau Associates 85 Schist 5 2.76
Calcsilicate 15 3.08
Marble 4 2.87
Skarn 5 3.36
Overall Summary
Carter Dames & Moore Piteau Average - Value Used
Rock Type 82 84 85 In Current Study t/m3
Corneanas (schist) 2.73 2.76 2.76 2.75
Calcsilicate 3.07 3.08 3.07
Granite 2.62 2.72 2.69 2.68
Skarn 3.46 3.36 3.36 3.40
Source

Technical Report on the Los Santos Mine Project
November 201366
14.6 Grade Estimation
For each zone, the skarn composite data sets were used to interpolate WO3 grades into the
corresponding skarn bed blocks of the volumetric block model in each zone. The
geostatistical analysis was used to help derive interpolation parameters.
When the interpolation procedure took place for each block, a number of progressively larger
searches for available samples were attempted, until sufficient samples had been found. This
process also recorded which search was successful in locating samples. The initial search
ellipse distances stemmed from the 2/3 level of the model variograms. If insufficient samples
were found, then a second larger search ellipse was used, as approximately the dimensions
of the model variogram ranges. Again if insufficient samples were found, then a final 3rd
search was used with very large distances, to ensure that practically all blocks within the
modelled skarn structures did receive some WO3 grades.
An additional control was placed on the first 2 searches, for the allocation of measured and
indicated resources, which was to only allow this allocation if at least two drillholes were
encountered. During the interpolation of each skarn block, a maximum of twelve composites
could be used. From any particular drillhole, only a maximum of two 2.5 m composites could
be used, so that other composites would have to be found from other drillholes. In all cases,
grades were only interpolated from composites belong to the same corresponding skarn and
bed identification.
The interpolation parameters used are summarised in Table 14-10. For each zone, the
search ellipses were oriented so as to be parallel with the skarn beds in that zone. These
orientations are summarised in Table 14-11. In Sector Central, the dip varies both along
strike and down-dip. For this zone, therefore, a set or orientation strings were defined
throughout the skarn bed. These strings were subsequently used to interpolate a dip value
into the block model, and then these dip values were utilised during the grade interpolation.
In Los Santos Sur, one particular set of beds (bed 6) has a quite different orientation to the
other beds. A separate orientation was therefore used for this bed.
The principal method of WO3 grade interpolation used was ordinary kriging (OK). However,
for subsequent testing and validation purposes, alternative WO3 grade values were also
interpolated using nearest-neighbour and inverse-distance weighting methods.
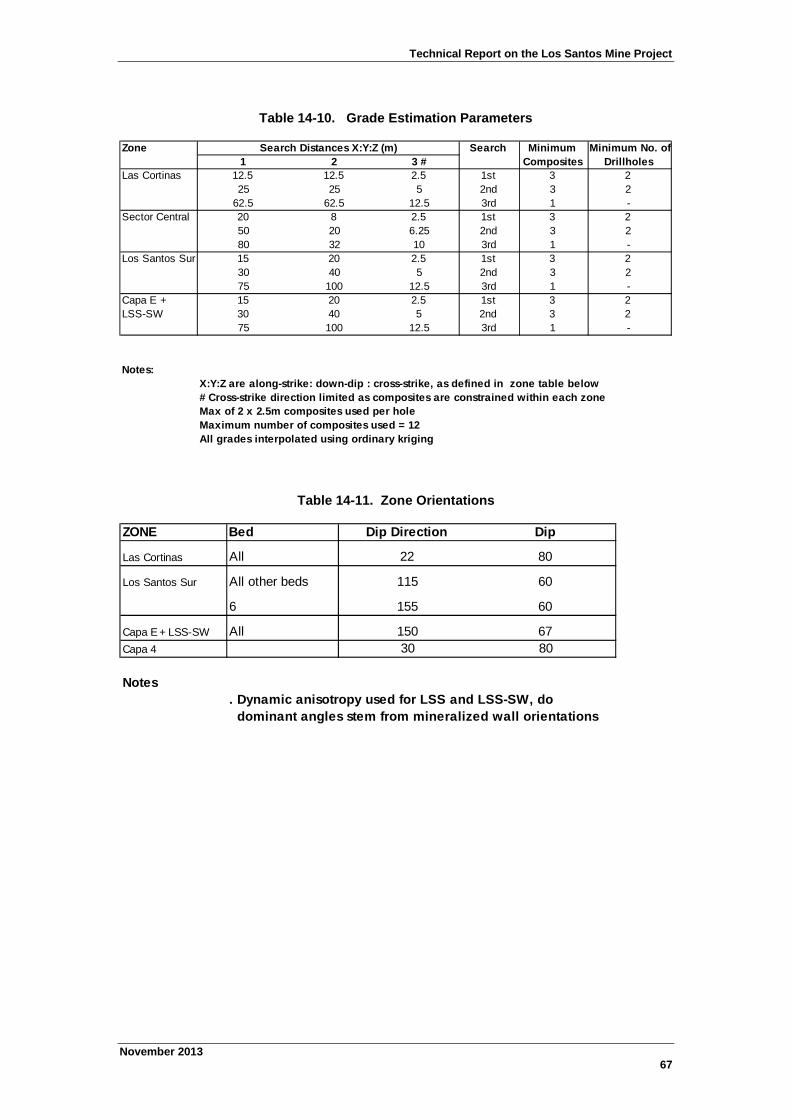
Technical Report on the Los Santos Mine Project
November 201367
Table 14-10. Grade Estimation Parameters
Zone Search Minimum Minimum No. of
1 2 3 # Composites Drillholes
Las Cortinas 12.5 12.5 2.5 1st 3 2
25 25 5 2nd 3 2
62.5 62.5 12.5 3rd 1 -
Sector Central 20 8 2.5 1st 3 2
50 20 6.25 2nd 3 2
80 32 10 3rd 1 -
Los Santos Sur 15 20 2.5 1st 3 2
30 40 5 2nd 3 2
75 100 12.5 3rd 1 -
Capa E + 15 20 2.5 1st 3 2
LSS-SW 30 40 5 2nd 3 2
75 100 12.5 3rd 1 -
Notes:
X:Y:Z are along-strike: down-dip : cross-strike, as defined in zone table below
# Cross-strike direction limited as composites are constrained within each zone
Max of 2 x 2.5m composites used per hole
Maximum number of composites used = 12
All grades interpolated using ordinary kriging
Search Distances X:Y:Z (m)
Table 14-11. Zone Orientations
ZONE Bed Dip Direction Dip
Las Cortinas All 22 80
Los Santos Sur All other beds 115 60
6 155 60
Capa E + LSS-SW All 150 67
Capa 4 30 80
Notes
. Dynamic anisotropy used for LSS and LSS-SW, do
dominant angles stem from mineralized wall orientations

Technical Report on the Los Santos Mine Project
November 201368
14.7 Mineral Resource Classification
Resource classification criteria were based on a “Two-Thirds Rule”, which placed the
boundary between Measured and Indicated Resources at approximately the sampling
distance which explains at least two thirds of the data variability, as represented by the sill of
the variogram. This is thus dependent on the nugget effect, Co, as well as on other
characteristics of the model variogram. Thus, for the WO3 variograms for Las Cortinas,
‘measured’ distances of approximately 20m along-strike and 12.5m down-dip were derived.
This distance was then doubled for a distance to be appropriate for indicated resources,
which in most cases gave a distance very close to or less than the variogram range.
The 1st and 2nd search volumes, therefore, broadly corresponded to measured and indicated
resources, respectively. However, owing to the complex pattern of drillholes intersections,
this could sometimes produce very complicated groups of different resource categories. Each
bed and each zone were therefore examined in long-section, and a set of strings defined,
stemming from the initial resource demarcation, to break up each bed into more logical
portions of different resource classes. This is demonstrated in the example shown in Figure
14-4 . In general, the resultant applied resource classification can be summarised as follows:
Measured Covered by a grid of bed intersections at least 15m x 15m
Indicated Covered by a grid of bed intersections at least 30m x 30m
Inferred Within the interpreted skarn beds, but with sampling that is not in a regulargrid of at least 30m x 30m
Figure 14-4. Example of Resource Classification – Los Santos Bed 7 Long Section

Technical Report on the Los Santos Mine Project
November 201369
14.8 Model Validation
A comparison was made of the average WO3 model grades, for all resource levels, with the
corresponding average sample and composite grades for the different modelled beds. These
results are summarised for the zones remodelled in 2013, as shown in Table 14-12.
Table 14-12. Comparison of Average Sample and Model
Zone Bed Samples Composites OK NN ID
1 0.51 0.49 0.46 0.48 0.48
LSS- 2 0.23 0.23 0.22 0.21 0.22
SW 3 0.18 0.18 0.18 0.20 0.21
4 0.73 0.54 0.48 0.46 0.51
5 0.26 0.25 0.22 0.23 0.24
Capa Este 0.17 0.16 0.16 0.16 0.18
Capa 4 0.35 0.34 0.40 0.34 0.36
6 0.36 0.36 0.32 0.30 0.31
7 0.45 0.46 0.50 0.47 0.50
8 0.44 0.45 0.49 0.49 0.47
9 0.77 0.77 0.48 0.44 0.51
10 0.41 0.41 0.42 0.40 0.42
11 0.50 0.50 0.48 0.54 0.51
Notes
. Bed ID for LSS-SW is specific to just that zone
. OK - Ordinary kriging
. NN - nearest neighbour
. ID - inverse distance weighting
. For LSS, Bed 9 only represents 1% of LSS tonnage
Model Grades
LSS
As would be expected, the average grades decline from the sample to the composite stage,
due to the effects of top-cutting. The model average grades effectively represent a
declustering of these high grade intersections. Overall the average model grades compare
well the overall sample and composite grades. Detailed block model sections showing the
both the composite and block model WO3 grades, were also examined, as shown in the
example in Figure 14-5. Sections through all of the zones were closely examined during
testing of different interpolation methods and parameters.
As part of the model validation process, grade profiles (swath plots) were also produced on
20m slices, and the average grades per slice compared with the composites on the same
slices. An example of a grade profile plot is shown in Figure 14-6, for Capa Este. This shows
a favourable comparison between composite grades and model grades, derived from kriging,
inverse distance weighting and nearest neighbour estimation. All of the grade profiles for
recently updated LSS-SW zones are shown in Appendix A.
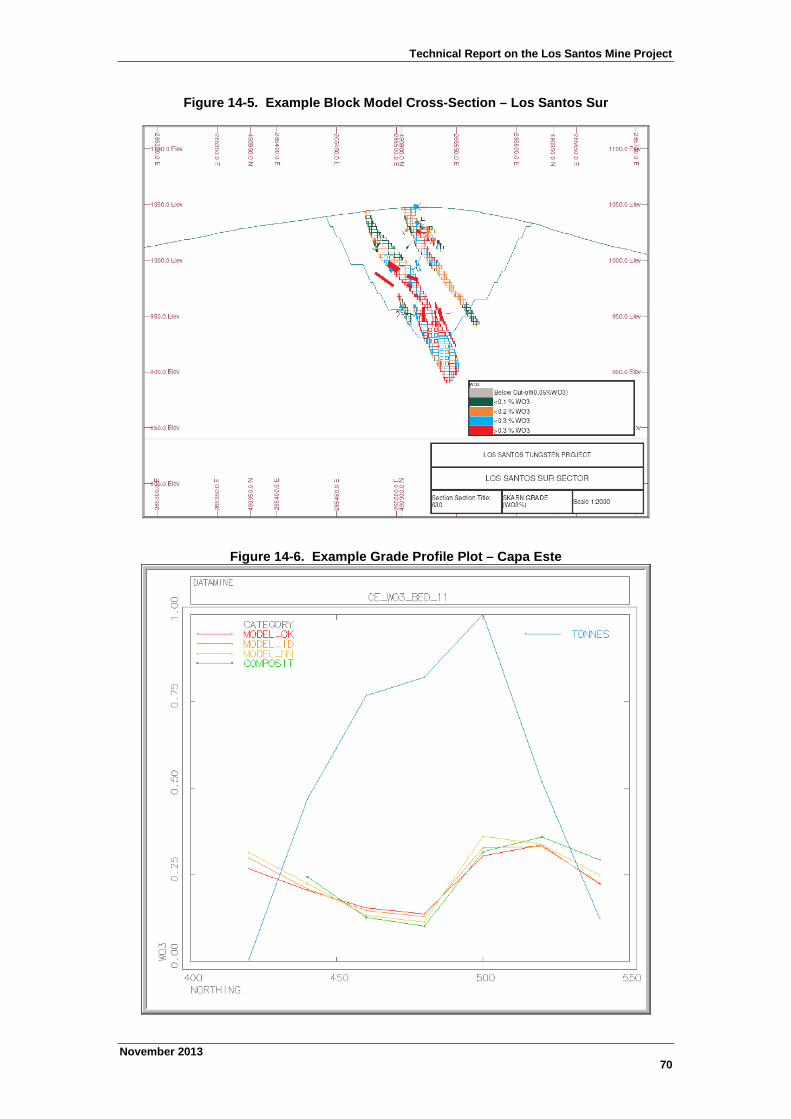
Technical Report on the Los Santos Mine Project
November 201370
Figure 14-5. Example Block Model Cross-Section – Los Santos Sur
Figure 14-6. Example Grade Profile Plot – Capa Este
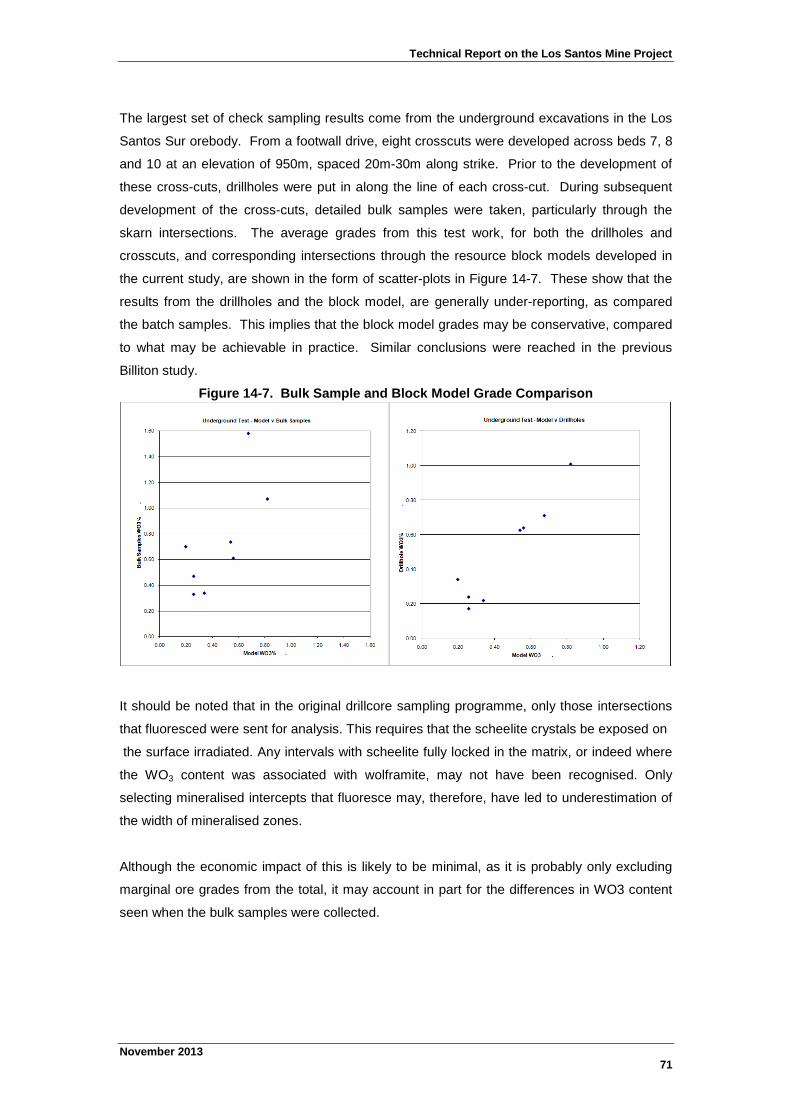
Technical Report on the Los Santos Mine Project
November 201371
The largest set of check sampling results come from the underground excavations in the Los
Santos Sur orebody. From a footwall drive, eight crosscuts were developed across beds 7, 8
and 10 at an elevation of 950m, spaced 20m-30m along strike. Prior to the development of
these cross-cuts, drillholes were put in along the line of each cross-cut. During subsequent
development of the cross-cuts, detailed bulk samples were taken, particularly through the
skarn intersections. The average grades from this test work, for both the drillholes and
crosscuts, and corresponding intersections through the resource block models developed in
the current study, are shown in the form of scatter-plots in Figure 14-7. These show that the
results from the drillholes and the block model, are generally under-reporting, as compared
the batch samples. This implies that the block model grades may be conservative, compared
to what may be achievable in practice. Similar conclusions were reached in the previous
Billiton study.
Figure 14-7. Bulk Sample and Block Model Grade Comparison
It should be noted that in the original drillcore sampling programme, only those intersections
that fluoresced were sent for analysis. This requires that the scheelite crystals be exposed on
the surface irradiated. Any intervals with scheelite fully locked in the matrix, or indeed where
the WO3 content was associated with wolframite, may not have been recognised. Only
selecting mineralised intercepts that fluoresce may, therefore, have led to underestimation of
the width of mineralised zones.
Although the economic impact of this is likely to be minimal, as it is probably only excluding
marginal ore grades from the total, it may account in part for the differences in WO3 content
seen when the bulk samples were collected.
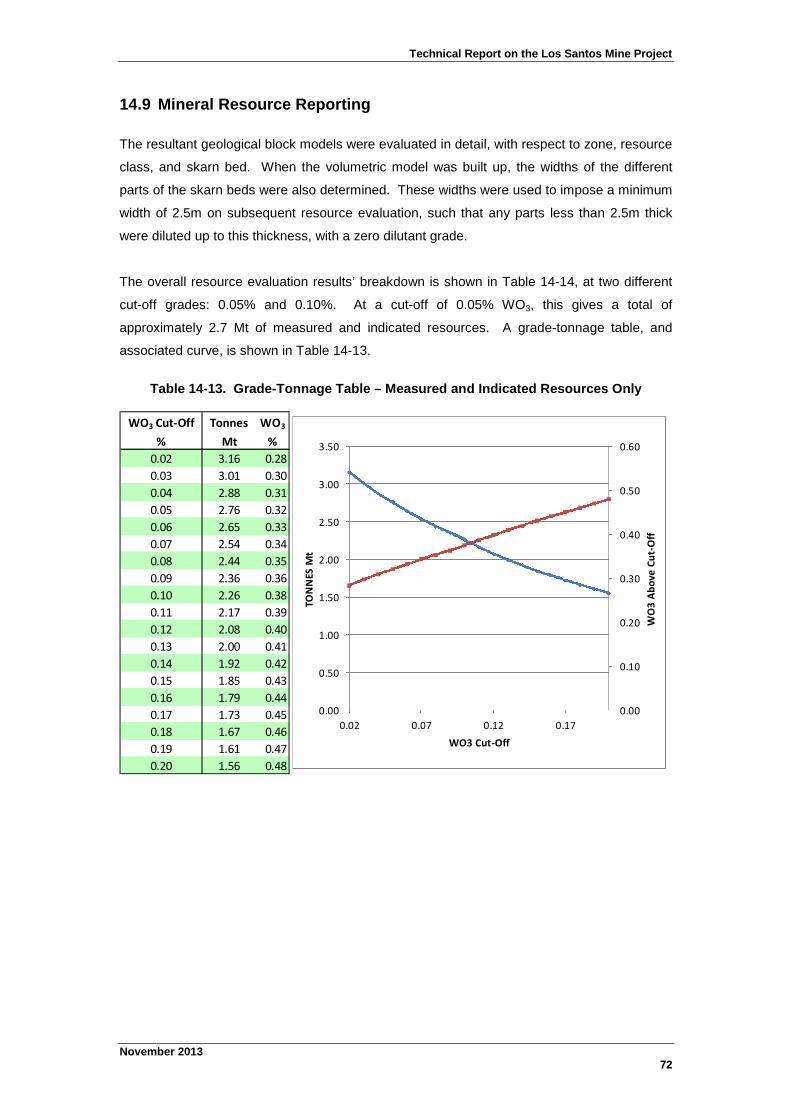
Technical Report on the Los Santos Mine Project
November 201372
14.9 Mineral Resource Reporting
The resultant geological block models were evaluated in detail, with respect to zone, resource
class, and skarn bed. When the volumetric model was built up, the widths of the different
parts of the skarn beds were also determined. These widths were used to impose a minimum
width of 2.5m on subsequent resource evaluation, such that any parts less than 2.5m thick
were diluted up to this thickness, with a zero dilutant grade.
The overall resource evaluation results’ breakdown is shown in Table 14-14, at two different
cut-off grades: 0.05% and 0.10%. At a cut-off of 0.05% WO3, this gives a total of
approximately 2.7 Mt of measured and indicated resources. A grade-tonnage table, and
associated curve, is shown in Table 14-13.
Table 14-13. Grade-Tonnage Table – Measured and Indicated Resources Only
WO3 Cut-Off Tonnes WO3
% Mt %
0.02 3.16 0.28
0.03 3.01 0.30
0.04 2.88 0.31
0.05 2.76 0.32
0.06 2.65 0.33
0.07 2.54 0.34
0.08 2.44 0.35
0.09 2.36 0.36
0.10 2.26 0.38
0.11 2.17 0.39
0.12 2.08 0.40
0.13 2.00 0.41
0.14 1.92 0.42
0.15 1.85 0.43
0.16 1.79 0.44
0.17 1.73 0.45
0.18 1.67 0.46
0.19 1.61 0.47
0.20 1.56 0.48
0.00
0.10
0.20
0.30
0.40
0.50
0.60
0.00
0.50
1.00
1.50
2.00
2.50
3.00
3.50
0.02 0.07 0.12 0.17
WO
3A
bo
veC
ut-
Off
TON
NES
Mt
WO3 Cut-Off
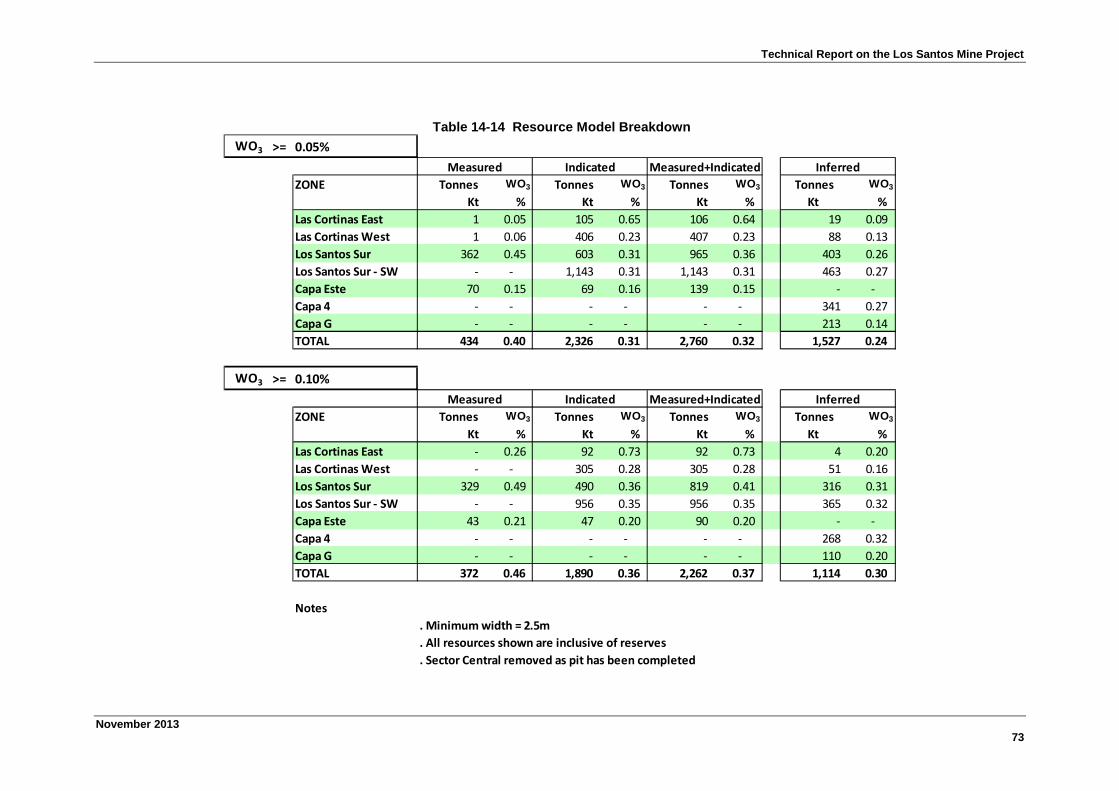
Technical Report on the Los Santos Mine Project
November 201373
Table 14-14 Resource Model Breakdown
WO3 >= 0.05%
ZONE Tonnes WO3 Tonnes WO3 Tonnes WO3 Tonnes WO3
Kt % Kt % Kt % Kt %
Las Cortinas East 1 0.05 105 0.65 106 0.64 19 0.09
Las Cortinas West 1 0.06 406 0.23 407 0.23 88 0.13
Los Santos Sur 362 0.45 603 0.31 965 0.36 403 0.26
Los Santos Sur - SW - - 1,143 0.31 1,143 0.31 463 0.27
Capa Este 70 0.15 69 0.16 139 0.15 - -
Capa 4 - - - - - - 341 0.27
Capa G - - - - - - 213 0.14
TOTAL 434 0.40 2,326 0.31 2,760 0.32 1,527 0.24
WO3 >= 0.10%
ZONE Tonnes WO3 Tonnes WO3 Tonnes WO3 Tonnes WO3
Kt % Kt % Kt % Kt %
Las Cortinas East - 0.26 92 0.73 92 0.73 4 0.20
Las Cortinas West - - 305 0.28 305 0.28 51 0.16
Los Santos Sur 329 0.49 490 0.36 819 0.41 316 0.31
Los Santos Sur - SW - - 956 0.35 956 0.35 365 0.32
Capa Este 43 0.21 47 0.20 90 0.20 - -
Capa 4 - - - - - - 268 0.32
Capa G - - - - - - 110 0.20
TOTAL 372 0.46 1,890 0.36 2,262 0.37 1,114 0.30
Notes
. Minimum width = 2.5m
. All resources shown are inclusive of reserves
. Sector Central removed as pit has been completed
Measured Indicated Measured+Indicated Inferred
Measured Indicated Measured+Indicated Inferred

Technical Report on the Los Santos Mine Project
November 201374
15 MINERAL RESERVE ESTIMATES
15.1 Open Pit Mine Planning
The approach taken may be summarised by the following steps:
1. Preparation of the block model for each zone, such that grades were regularised to a
selective mining unit size of 2.5m x 5m x 5m. For each zone, the 2.5m was oriented
cross-strike to the main bed orientations.
2. Combination of the block models from each zone, to create a complete block model for all
zones.
3. Pit optimisation, to produce series of optimised pit shells, for range of different scenarios
and parameters.
4. Selection of the most appropriate ultimate pit shells for subsequent reference purposes in
actual pit design.
5. Pit design, followed by evaluation, to produce a reserve estimate appropriate to open pit
mining.
6. Final schedule development based on the final pit designs.
The economic parameters were prepared by Daytal, based on data from the actual mining
operation, as well as on reasonable projections. A summary of the current base case open
pit parameters are shown in Table 15-1. No additional mining factors were applied, because
of the dilution already embedded in the regularised block model, to represent a minimum
selective width of 2.5m.
The pit slope parameters were derived from geotechnical studies - originally Piteau 1985 and
Metales Hispania 2000. More recently in 2011 a geotechnical study was completed by
SADIM. From the studies face angles of 73o
(in all directions) have been recommended. In
oxidised material, approximately 10m below the topography, a face angle of 45o
has been
recommended. The bench configuration is based on a 4m safety berm for every 20m
vertically. With a 10m haul road being used, final overall slope angles are typically between
55o
and 48o, depending on the predominant location of the haul road relative to the pit.
Examples of the final designs are shown in 3D views for Las Cortinas and Los Santos
Sur/Capa Este, with the skarn block model contents are shown in Figure 15-1 and Figure
15-2.

Technical Report on the Los Santos Mine Project
November 201375
Figure 15-1. Los Santos Sur – Cut-Away View - Pit Design and Skarn Block Model
Figure 15-2. Ultimate Pit Designs – Capa E and Los Santos Sur

Technical Report on the Los Santos Mine Project
November 201376
Table 15-1. Open Pit ParametersUnit Values
Processing
APT Price $/mtu WO3 347
Metal Price - received, $/mtu WO3 270
after transport + smelting $/t WO3 27,000
Recovery % 61.6%
Processing Cost $/t ore 16.65
G & A $/t ore 3.83
Total Applied Ore Cost $/t ore 20.08
(Processing+G&A+OreMining-WasteMining)
Mining
Ore mining $/t ore 2.37
Waste mining $/t waste 2.76
Applied cut-off grade % WO3
0.07%
Mining Parameters
Minimum selectivity w idth m 2.5
Mining Recovery 100
Dilution 0
Derived breakeven cut-off 0.12%
Pit Slope Parameters
Bench Configuration
Face Angle 73o
Berm Width, every 20m m 4
Bench Height m 10
Overall max slope w ith road intersections 55o
Face Angle for top oxidised 10m 45o
Haul Road
Gradient 10%
Width m 10
Width for bottom 2 benches m 6
Key
Bold Value supplied
Normal Derived
Yellow Values used directly in optimisation process
Description
The economic parameters shown in Table 15-1 are derived from the actual operating costs
over the first 6 months of 2013. Considering the range of breakeven cut-off grades for
different potential tungsten prices, along with the continuity of ore zones and what can
practically be outlined and selectively mined in the current open pit operations, it was decided
to continue the use of 0.07% WO3 as the cut-off for ore/waste definition purposes for long
term planning and reserve estimation at the current time.
Pit designs were based on the maximum cashflow optimisation shells for each zone. For
each pit, the exit point was positioned on the south down-slope side. A main haul road width
of 10m width was applied, with a 6m road width for bottom-most 20m. In some cases, small
additional 5m cuts was also taken from the designed pit bases. Near surface, a lower face
angle of 45o
was applied to allow superficial oxidised material. A plan of the current final pit
designs is shown in Figure 15-3.

Technical Report on the Los Santos Mine Project
November 201377
Figure 15-3. Plan of Final Pit Designs
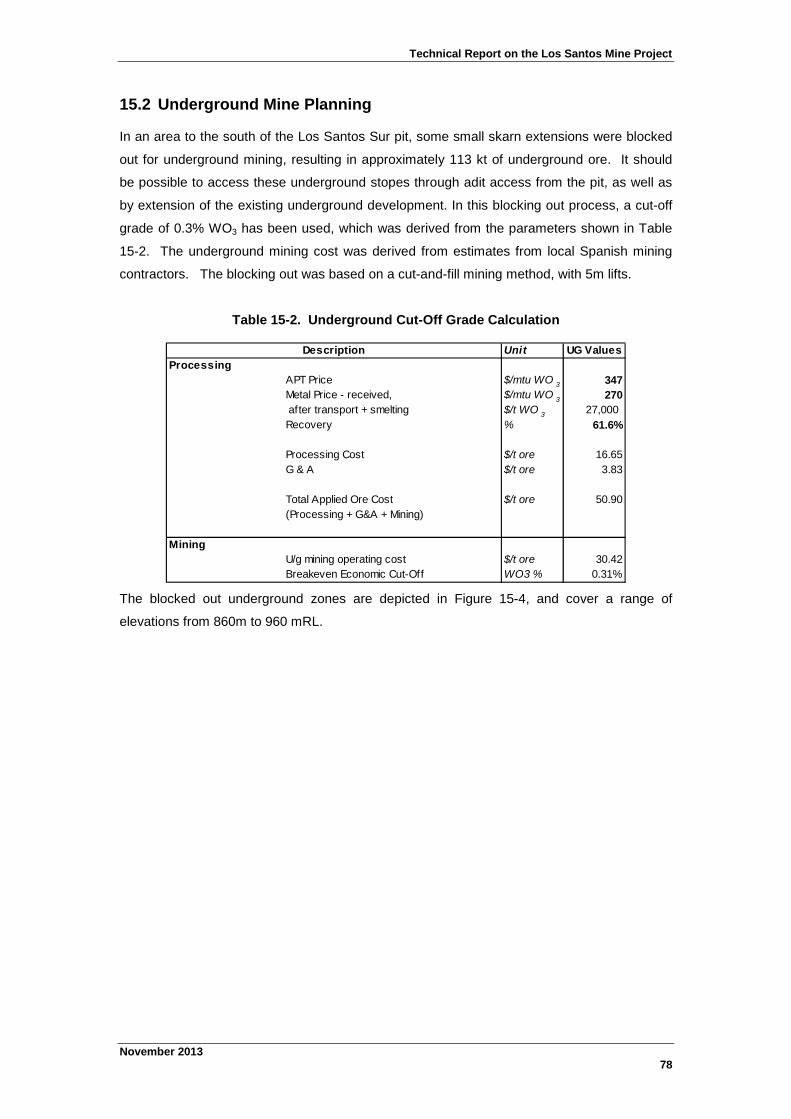
Technical Report on the Los Santos Mine Project
November 201378
15.2 Underground Mine Planning
In an area to the south of the Los Santos Sur pit, some small skarn extensions were blocked
out for underground mining, resulting in approximately 113 kt of underground ore. It should
be possible to access these underground stopes through adit access from the pit, as well as
by extension of the existing underground development. In this blocking out process, a cut-off
grade of 0.3% WO3 has been used, which was derived from the parameters shown in Table
15-2. The underground mining cost was derived from estimates from local Spanish mining
contractors. The blocking out was based on a cut-and-fill mining method, with 5m lifts.
Table 15-2. Underground Cut-Off Grade Calculation
Unit UG Values
Processing
APT Price $/mtu WO 3 347
Metal Price - received, $/mtu WO3 270
after transport + smelting $/t WO3
27,000
Recovery % 61.6%
Processing Cost $/t ore 16.65
G & A $/t ore 3.83
Total Applied Ore Cost $/t ore 50.90
(Processing + G&A + Mining)
Mining
U/g mining operating cost $/t ore 30.42
Breakeven Economic Cut-Off WO3 % 0.31%
Description
The blocked out underground zones are depicted in Figure 15-4, and cover a range of
elevations from 860m to 960 mRL.
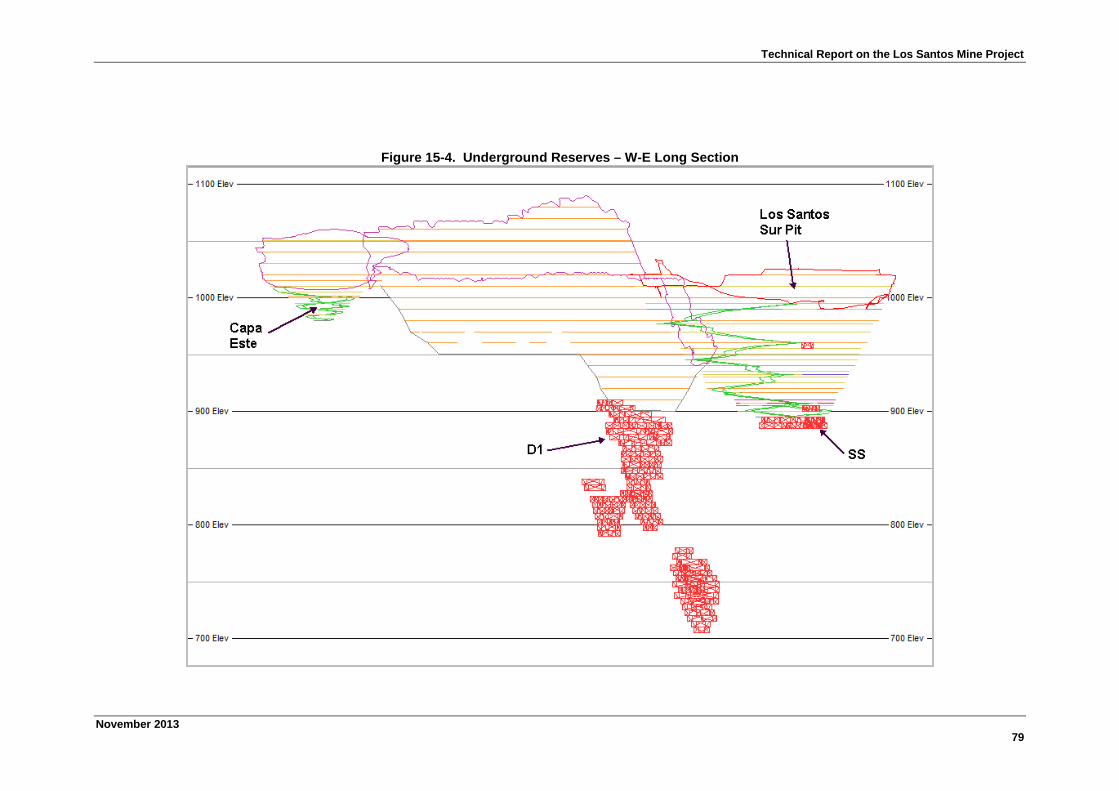
Technical Report on the Los Santos Mine Project
November 201379
Figure 15-4. Underground Reserves – W-E Long Section

Technical Report on the Los Santos Mine Project
November 201380
15.3 Tailings Re-Processing
With improvements in mill recovery, this has meant that specific areas where tailings have
historically been deposited still contain economic WO3 grades. These tailing areas comprise
two different kinds of tailings:
a) Coarse rejects from the thickening cyclones and dewatering screens (Arenas).
b) Fine rejects from the filter press (Tortas).
Separate dumps have and are being were made for these different types of tailings. Since
June, 2010, the dumping locations have been recorded and collated in some detail, with the
known tailings grades by time period. Volumes of the separate dumping areas have been
determined by the development of wireframe models of the pre-dump surfaces, along with the
dumped surfaces at different time periods. During 2012 in-situ tailings density and humidity
measurements were made (by the company Seinco – stability study). All of these collated
volumes, grades and resultant tonnages have been collated as shown in Table 15-3.
Table 15-3. Summary of Tailings Material Identified for Re-Processing
Volume WO3 Volume WO3 Volume WO3 Volume Tonnes WO3 Volume Tonnes WO3 Volume Tonnes WO3
m3
x 1000 % m3
x 1000 % m3
x 1000 % m3
x 1000 t x1000 % m3
x 1000 t x1000 % m3
x 1000 t x1000 %
1 29 0.10 29 66 0.10 29 66 0.10
2 12 0.17 12 28 0.17 12 28 0.17
Coarse rejects 3 65 0.17 85 0.09 149 343 0.12 149 343 0.12
(Arenas) 4 204 0.17 56 0.09 260 597 0.15 260 597 0.15
5 138 304 0.10 138 304 0.10
Sub-Total 450 1,034 0.14 138 304 0.10 588 1,338 0.13
Fine rejects 1 146 0.24 18 0.25 163 340 0.24 2 4 0.20 165 344 0.24
(Tortas) 2 42 0.25 42 87 0.25 74 163 0.20 116 250 0.22
Sub-Total 205 427 0.24 76 167 0.20 281 594 0.23
29 0.10 427 0.19 200 0.14 656 1,461 0.17 214 471 0.14 869 1,932 0.16
June 2010 October 2011 July 2012 Sub-Total July 2012 July 2012 - June 2013 Total June 2013
The envisaged processing cost for re-processed tailing is 6.6 Euros/tonne ($8.25/t) leading to
a breakeven cut-off grade 0.04% WO3. This implies that all of the identified tailings material is
economically viable to process, and so is included in the reserve inventory.

Technical Report on the Los Santos Mine Project
November 201381
Figure 15-5. Plan of Tailings Areas Identified for Re-Processing
Figure 15-6. Aerial Photograph of Tailings Areas
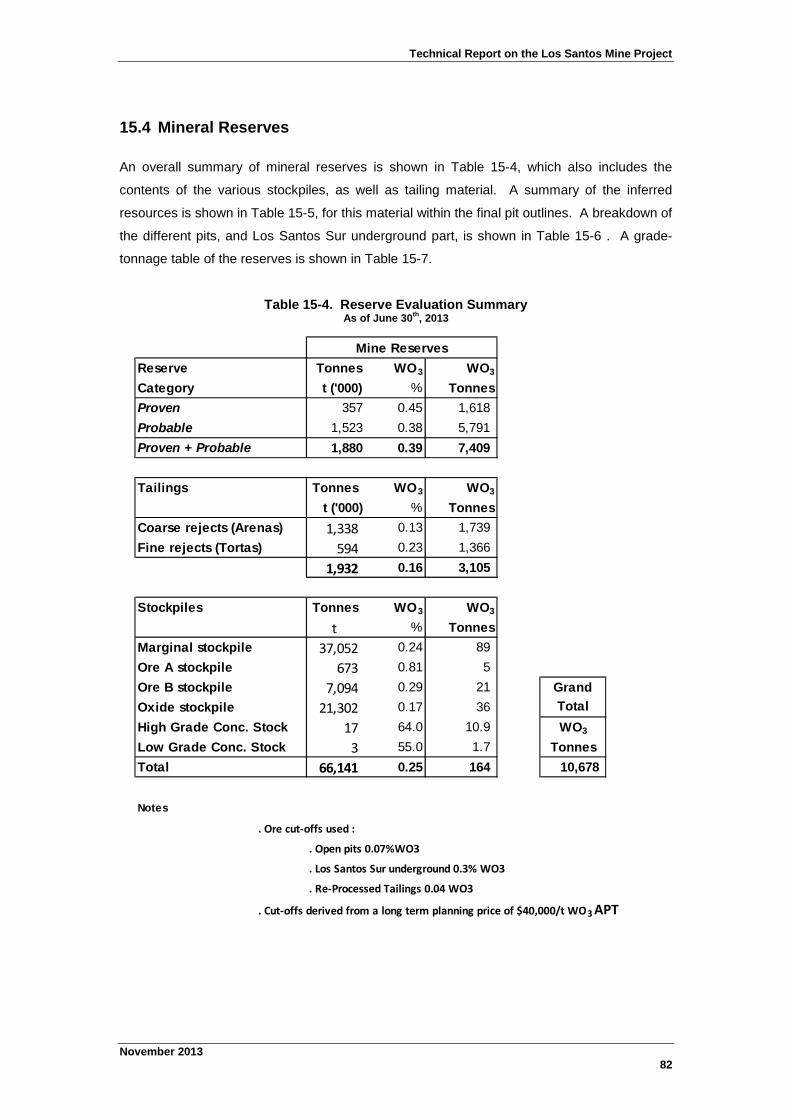
Technical Report on the Los Santos Mine Project
November 201382
15.4 Mineral Reserves
An overall summary of mineral reserves is shown in Table 15-4, which also includes the
contents of the various stockpiles, as well as tailing material. A summary of the inferred
resources is shown in Table 15-5, for this material within the final pit outlines. A breakdown of
the different pits, and Los Santos Sur underground part, is shown in Table 15-6 . A grade-
tonnage table of the reserves is shown in Table 15-7.
Table 15-4. Reserve Evaluation SummaryAs of June 30th, 2013
Reserve Tonnes WO3 WO3
Category t ('000) % Tonnes
Proven 357 0.45 1,618
Probable 1,523 0.38 5,791
Proven + Probable 1,880 0.39 7,409
Tailings Tonnes WO3 WO3
t ('000) % Tonnes
Coarse rejects (Arenas) 1,338 0.13 1,739
Fine rejects (Tortas) 594 0.23 1,366
1,932 0.16 3,105
Stockpiles Tonnes WO3 WO3
t % Tonnes
Marginal stockpile 37,052 0.24 89
Ore A stockpile 673 0.81 5
Ore B stockpile 7,094 0.29 21 Grand
Oxide stockpile 21,302 0.17 36 Total
High Grade Conc. Stock 17 64.0 10.9 WO3
Low Grade Conc. Stock 3 55.0 1.7 Tonnes
Total 66,141 0.25 164 10,678
Notes
. Ore cut-offs used :
. Open pits 0.07%WO3
. Los Santos Sur underground 0.3% WO3
. Re-Processed Tailings 0.04 WO3
. Cut-offs derived from a long term planning price of $40,000/t WO3 APT
Mine Reserves

Technical Report on the Los Santos Mine Project
November 201383
Table 15-5. In-Pit/Mine Inferred ResourcesAs of June 30th, 2013
Tonnes WO3 WO3
t ('000) % Tonnes
273 0.36 974
82 0.54 446
177 0.35 619
Total 532 0.38 2,039
Main Pit Designs -
Los Santos Sur, Las
Cortinas,Capa Este
and LSS-SW
Optimisations -
Capa 4 and Capa G
Inside SS/D1
underground
extents

Technical Report on the Los Santos Mine Project
November 201384
Table 15-6 Reserve Breakdown
Kt WO3 % Kt WO3 % Kt WO3 % Kt WO3 % Kt WO3 % Kt WO3 % Kt WO3 % Kt WO3 % Kt WO3 %
Proven Reserves 0.0 0.00 0 0.00 25 0.23 332 0.47 0 0.00 0 0.00 357 0.45
Probable Reserves 228 0.29 86 0.73 730 0.34 366 0.38 21 0.50 92 0.57 1,523 0.38
Proven + Probable 228 0.29 86 0.73 755 0.34 698 0.42 21 0.50 92 0.57 1,880 0.39
In-Design Inferred 11 0.19 0 0.21 78 0.42 184 0.34 4 0.42 78 0.55 108 0.42 69 0.25 532 0.38
Waste 2,253 768 6,814 4,789 0 205 60 14,890
Waste+Inferred 2,264 768 6,892 4,973 4 313 129 15,343
Strip Ratio t/t 9.9 8.9 9.1 7.1 0.2 8.2
Total Rock 2,492 854 7,647 5,671 0 92 313 129 17,198
Notes
. Ore cut-offs used :
. Open pits 0.07%WO3
. Los Santos Sur underground 0.3% WO3
Open PitLas Cortinas
WestLas Cortinas East CE, SW, D1 Los Santos Sur SS D1 Capa 4
UndergroundOpen pit
Capa G Total

Technical Report on the Los Santos Mine Project
November 201385
Table 15-7. Grade-Tonnage Table – Proven and Probable ReservesWO3 Cut-Off Tonnes WO3 WO3
% Mt % t
0.01 2.34 0.33 7,663
0.02 2.23 0.34 7,647 FILTER
0.03 2.15 0.35 7,628 CLASS = 1
0.04 2.08 0.37 7,604 Or
0.05 2.02 0.37 7,578 CLASS = 2
0.06 1.96 0.38 7,546
0.07 1.91 0.39 7,513
0.08 1.87 0.40 7,478
0.09 1.82 0.41 7,439
0.10 1.77 0.42 7,391
0.11 1.72 0.43 7,333
0.12 1.67 0.44 7,280
0.13 1.63 0.44 7,224
0.14 1.58 0.45 7,165
0.15 1.54 0.46 7,100
0.16 1.50 0.47 7,041
0.17 1.46 0.48 6,983
0.18 1.43 0.49 6,917
0.19 1.39 0.49 6,846
0.20 1.35 0.50 6,773
0.21 1.31 0.51 6,699
0.22 1.28 0.52 6,622
0.23 1.24 0.53 6,542
0.24 1.21 0.53 6,472
0.25 1.17 0.54 6,379
0.26 1.14 0.55 6,295
0.27 1.11 0.56 6,214
0.28 1.07 0.57 6,113
0.29 1.04 0.58 6,017
0.30 1.01 0.59 5,930
0.31 0.98 0.60 5,831
0.32 0.95 0.60 5,736
0.33 0.92 0.61 5,645
0.34 0.89 0.62 5,546
0.35 0.86 0.63 5,450
0.36 0.84 0.64 5,355
0.37 0.81 0.65 5,250
0.38 0.78 0.66 5,153
0.39 0.76 0.67 5,060
0.40 0.74 0.68 4,975
0.0
0.1
0.2
0.3
0.4
0.5
0.6
0.7
0.8
0.00
0.50
1.00
1.50
2.00
2.50
0.01 0.06 0.11 0.16 0.21 0.26 0.31 0.36
WO
3A
bo
veC
ut-
Off
%
TON
NES
Mt
WO3 Cut-Off %

Technical Report on the Los Santos Mine Project
November 201386
16 MINING METHODS
The open pit operations are conventional drill and blast operations, based on mining 10m
benches in waste, and 5m benches in ore, with 0.5m of sub-drilling. Tamrock CHA1100 rigs
are used for blasthole drilling. The blastholes are 3.5 in. in diameter, and drilled on a 3m x
2.5m pattern in Los Santos Sur, and a 3m x 2.5m pattern in the other pits. Typical blasthole
drilling operations are shown in Figure 16-1.
Figure 16-1. Blasthole Drilling Operations
Pre-split lines are drilled along the edges of final walls. These pre-split holes are 3 in. in
diameter, and are 0.8m apart. Typical pre-split drilling operations are shown in Figure 16-2,
along with pre-split lines from the bench above.
Figure 16-2. Pre-Split Drilling Operations
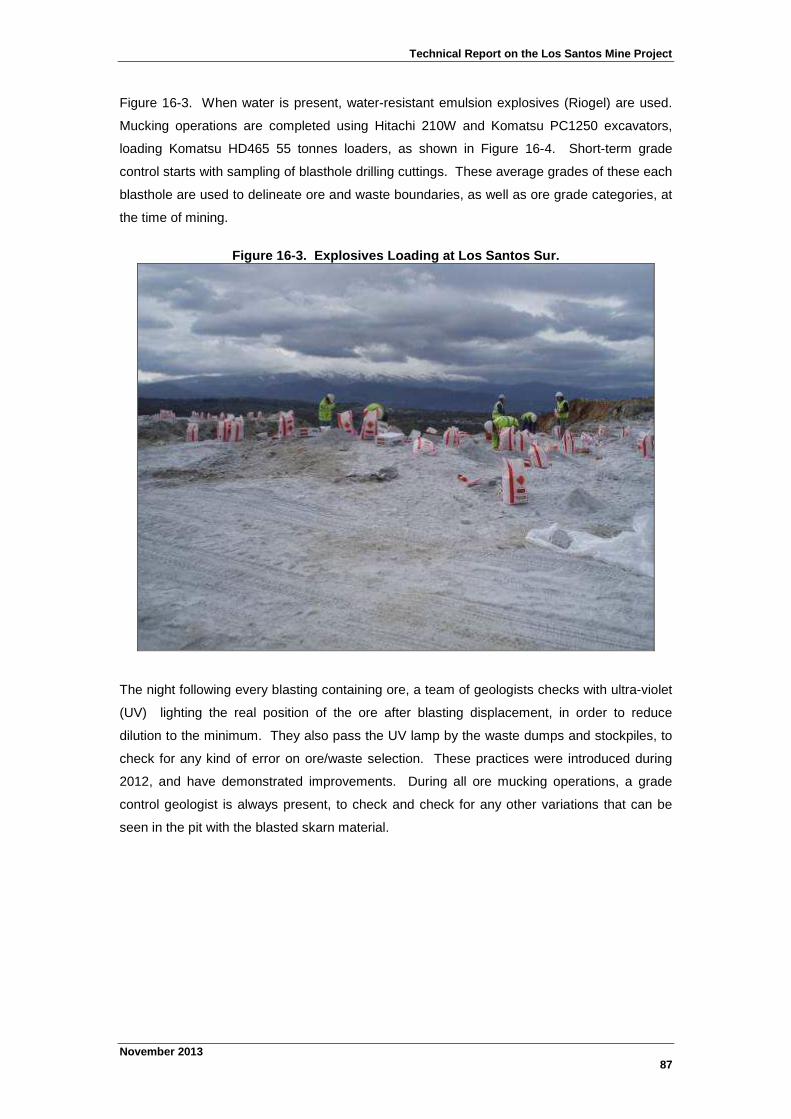
Technical Report on the Los Santos Mine Project
November 201387
Figure 16-3. When water is present, water-resistant emulsion explosives (Riogel) are used.
Mucking operations are completed using Hitachi 210W and Komatsu PC1250 excavators,
loading Komatsu HD465 55 tonnes loaders, as shown in Figure 16-4. Short-term grade
control starts with sampling of blasthole drilling cuttings. These average grades of these each
blasthole are used to delineate ore and waste boundaries, as well as ore grade categories, at
the time of mining.
Figure 16-3. Explosives Loading at Los Santos Sur.
The night following every blasting containing ore, a team of geologists checks with ultra-violet
(UV) lighting the real position of the ore after blasting displacement, in order to reduce
dilution to the minimum. They also pass the UV lamp by the waste dumps and stockpiles, to
check for any kind of error on ore/waste selection. These practices were introduced during
2012, and have demonstrated improvements. During all ore mucking operations, a grade
control geologist is always present, to check and check for any other variations that can be
seen in the pit with the blasted skarn material.

Technical Report on the Los Santos Mine Project
November 201388
Figure 16-4. Mucking Operations at Los Santos Sur
An aerial view of the mining operations Las Cortinas West pit is shown in Figure 16-5, with a
picture from the pit floor in Figure 16-6. An overall view of the Los Santos Sur pit is shown in
Figure 16-7.
The production mining operations currently employ 30 people – all contractors. All of the
other 68 employees on site work directly for Daytal.
Figure 16-5. Photograph of Las Cortina West Pit.

Technical Report on the Los Santos Mine Project
November 201389
Figure 16-6. Mining Operations in Las Cortinas West.
Figure 16-7. Photograph of Los Santos Sur Pit.

Technical Report on the Los Santos Mine Project
November 201390
17 RECOVERY METHODS
Figure 17-1. During the last 12 months it was able to process 459 ktpa, with an average feed
grade of 0.25% WO3. Current overall plant recovery of scheelite is approximately 66%.
The plant is primarily based on gravimetric separation, aimed at recovering scheelite, so as to
provide a concentrate containing greater than 68% WO3.
Total raw water consumption for the process plant and ancillaries is 5,500m3/month, or
approximately 9m3/h at full plant production rate. This usage is virtually all process make-up
water, to replace the water that exits the process with the dewatered coarse and fine plant
tailings, and is sourced under a water supply agreement with the town council of Fuenterroble
de Salvatierra as well as Los Santos.
Figure 17-1. Photograph of Crushing Facilities and Ore Feed to the Mill
For dust control straw is spread over the stockpile areas, and covered with a layer of
(mineralized ) mud from the cleaning of the thickener. This straw prevents cracking of the
clay surface after drying and this solution works well, as shown in Figure 17-2.

Technical Report on the Los Santos Mine Project
November 201391
Figure 17-2. Dust Control System
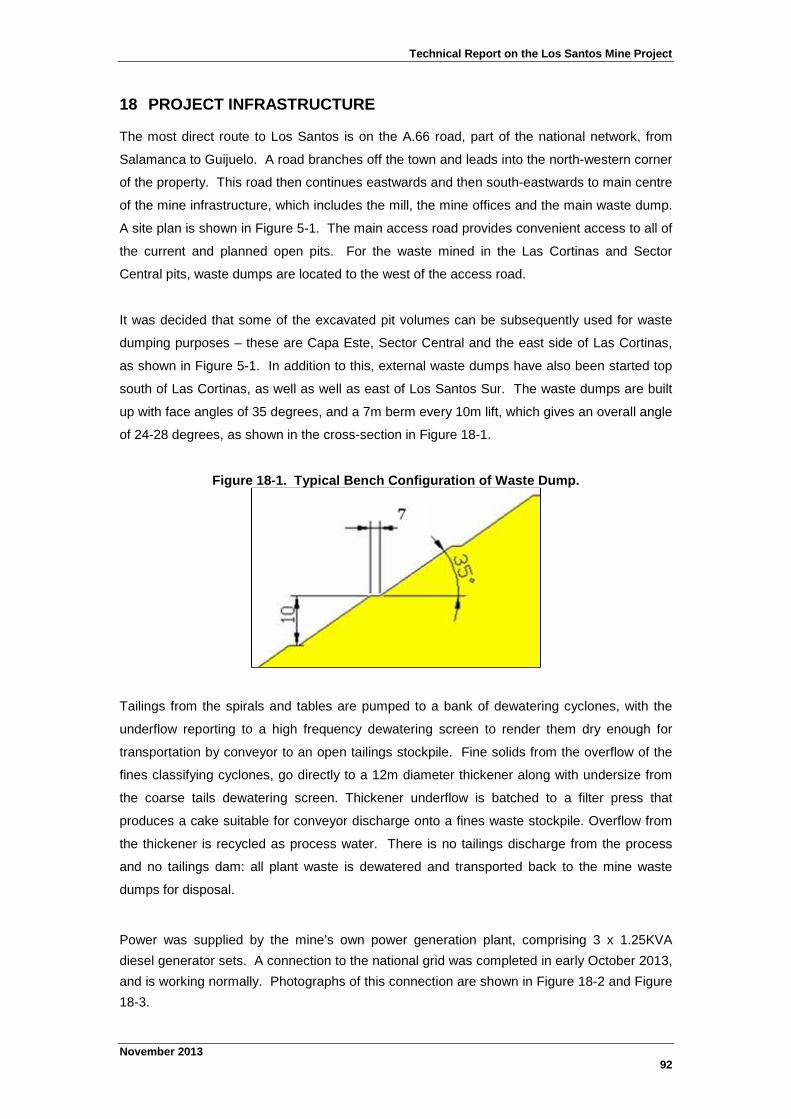
Technical Report on the Los Santos Mine Project
November 201392
18 PROJECT INFRASTRUCTURE
The most direct route to Los Santos is on the A.66 road, part of the national network, from
Salamanca to Guijuelo. A road branches off the town and leads into the north-western corner
of the property. This road then continues eastwards and then south-eastwards to main centre
of the mine infrastructure, which includes the mill, the mine offices and the main waste dump.
A site plan is shown in Figure 5-1. The main access road provides convenient access to all of
the current and planned open pits. For the waste mined in the Las Cortinas and Sector
Central pits, waste dumps are located to the west of the access road.
It was decided that some of the excavated pit volumes can be subsequently used for waste
dumping purposes – these are Capa Este, Sector Central and the east side of Las Cortinas,
as shown in Figure 5-1. In addition to this, external waste dumps have also been started top
south of Las Cortinas, as well as well as east of Los Santos Sur. The waste dumps are built
up with face angles of 35 degrees, and a 7m berm every 10m lift, which gives an overall angle
of 24-28 degrees, as shown in the cross-section in Figure 18-1.
Figure 18-1. Typical Bench Configuration of Waste Dump.
Tailings from the spirals and tables are pumped to a bank of dewatering cyclones, with the
underflow reporting to a high frequency dewatering screen to render them dry enough for
transportation by conveyor to an open tailings stockpile. Fine solids from the overflow of the
fines classifying cyclones, go directly to a 12m diameter thickener along with undersize from
the coarse tails dewatering screen. Thickener underflow is batched to a filter press that
produces a cake suitable for conveyor discharge onto a fines waste stockpile. Overflow from
the thickener is recycled as process water. There is no tailings discharge from the process
and no tailings dam: all plant waste is dewatered and transported back to the mine waste
dumps for disposal.
Power was supplied by the mine’s own power generation plant, comprising 3 x 1.25KVA
diesel generator sets. A connection to the national grid was completed in early October 2013,
and is working normally. Photographs of this connection are shown in Figure 18-2 and Figure
18-3.

Technical Report on the Los Santos Mine Project
November 201393
Figure 18-2. Pylons Connecting Grid With Los Santos
Figure 18-3. Grid Connection at Los Santos

Technical Report on the Los Santos Mine Project
November 201394
Figure 18-4. Site Plan

Technical Report on the Los Santos Mine Project
November 201395
19 MARKET STUDIES AND CONTRACTS
The majority of production is committed under a long-term contract, that was extended when
Almonty acquired control of Daytal, and now expires in 2015. This contract calls for delivery,
in 1 tonne Bulk Bags, in standard short container lots per consignment, of tungsten
concentrate grading plus 65% WO3.
As per standard industry practice, the price paid per tonne of concentrate is based on the
number of contained metric tonne units ("mtu") of Tungstic Oxide (WO3). This unit price
varies for individual consignments according to the prevailing Ammonium Paratungstate
(APT) price as published during the week of shipment in Metals Bulletin magazine ("the
Metals Bulletin price").
The details of the contract, including the APT discount rate applicable, are strictly commercial-
in-confidence and may not be disclosed, but equate to industry norms.
20 ENVIRONMENTAL STUDIES, PERMITTING AND SOCIAL IMPACT
Daytal has all permits and licenses to operate and in compliance with appropriate regulations.
A list of these permits and concessions is summarised below in Table 20-1.
Table 20-1. Summary of Permits
Description Date
Granting of perimission of investigation "Los Santos" (SIEMCALSA) 10/08/1993
Approval of Declaration of Environmental Impact 25/03/2002
Granting of Mining Concession "Los-Santos-Fuenterroble" No.6.133 (SIEMCALSA) 14/08/2002
Authorisation of transfer to Daytal Resource Spain S.L. 19/07/2006
Acceptance of appointment of Director Facultativo: Sebastián Maroto 08/02/2007
Environmental License 05/03/2007
Plant installation 19/03/2007
Urbanistic License 10/08/2007
Approval of Working Plan 2008 01/07/2008
Acceptance of appointment of Director Facultativo: Tomás Vecillas 04/06/2008
Presentation of Restoration Evaluation 20/08/2008
Approval of Working Plan 2009 03/04/2009
Approval of Working Plan 2010 01/12/2010
Authorisation of work contract (Sánchez y Lago S.L.) 17/10/2010
Approval of Working Plan 2011 04/02/2011
In accordance with Spanish law, the Environmental Plan and the Restoration Plan were
presented jointly with Exploitation Plan, had to be approved in order to start up the mine.
Daytal Resource Spain S.L. presented en 2002 the Environmental Impact Plan and the
Restoration Plan as part of the Mining Plan for Los Santos-Fuenterroble. This included the

Technical Report on the Los Santos Mine Project
November 201396
installation of the gravimetric and flotation parts of the processing plant, as well as a waste
dump an initial area of 14 hectares, and then 36 hectares for a second phase of expansion.
On the 25th
May, 2002, a positive result was received with respect to the Environmental
Impact Study, and declared publicly on 3rd
May, 2002, along with the declaration of 180,000
Euros being guaranteed for the restoration of space affected by mining activity. The mining
license was also approved in September, 2002.
In July, 2007, a study was completed with respect to the stability of the planned waste dump,
and presented to the local mineral authorities, along with a modified exploitation plan. An
example of revegetated area alongside the main mine access road is shown in Figure 20-1.
Figure 20-1. Example of Restoration

Technical Report on the Los Santos Mine Project
November 201397
With respect to water management, underground water is intercepted in some of the open pit
workings. This water is currently used for dust suppression on the haul roads. Currently a
plan is being developed to also use some of this water to augment the water used in the
processing plant, and so reduce processing costs.
The water used in the plant is sourced from the local municipal water supply. The plant
design has been modified to recycle as much water as possible. There is no tailings
discharge from the process and no tailings dam: all plant waste is dewatered and transported
back to the mine waste dumps for disposal.
The project has total support from the local community. This includes agreements with local
landowners affected by the mine exploitation. The mine closure plan incorporates the
dismantling of the processing plant, filling of the excavated pits, with the exception of Los
Santos Sur, revegetation of the waste dumps, budgeted at 368,800 Euros.
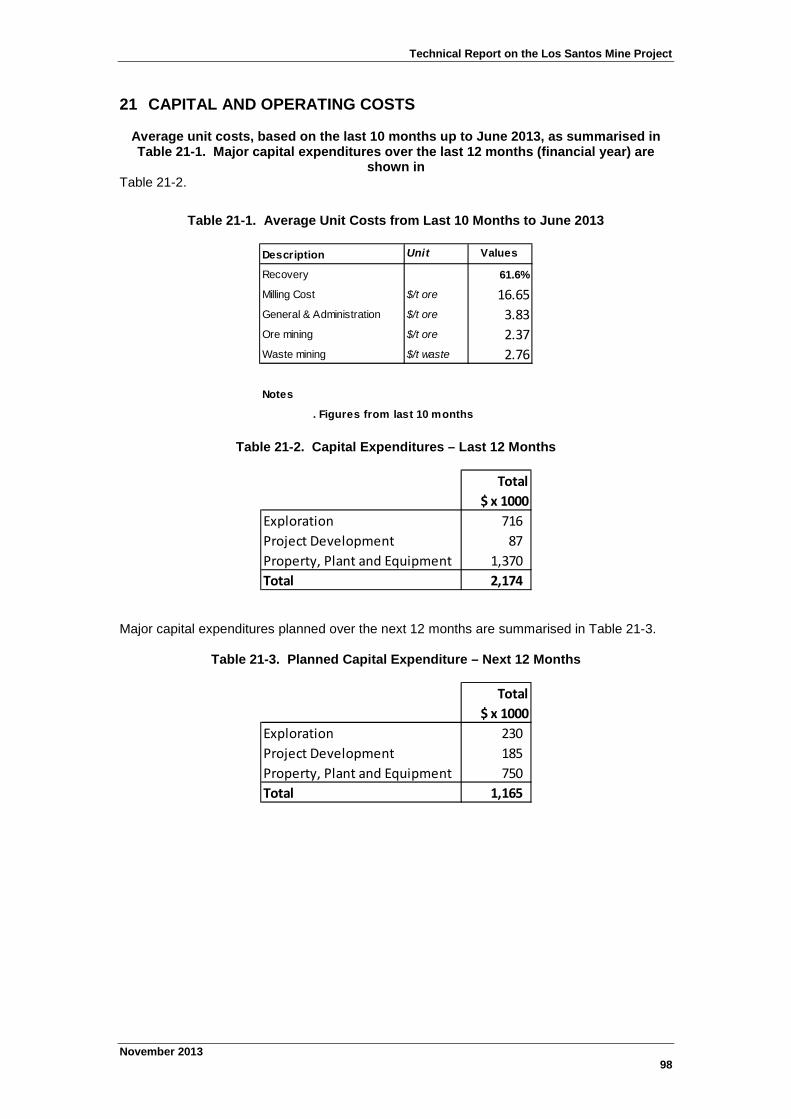
Technical Report on the Los Santos Mine Project
November 201398
21 CAPITAL AND OPERATING COSTS
Average unit costs, based on the last 10 months up to June 2013, as summarised inTable 21-1. Major capital expenditures over the last 12 months (financial year) are
shown inTable 21-2.
Table 21-1. Average Unit Costs from Last 10 Months to June 2013
Description Unit Values
Recovery 61.6%
Milling Cost $/t ore 16.65
General & Administration $/t ore 3.83
Ore mining $/t ore 2.37
Waste mining $/t waste 2.76
Notes
. Figures from last 10 months
Table 21-2. Capital Expenditures – Last 12 Months
Total
$ x 1000
Exploration 716
Project Development 87
Property, Plant and Equipment 1,370
Total 2,174
Major capital expenditures planned over the next 12 months are summarised in Table 21-3.
Table 21-3. Planned Capital Expenditure – Next 12 Months
Total
$ x 1000
Exploration 230
Project Development 185
Property, Plant and Equipment 750
Total 1,165

Technical Report on the Los Santos Mine Project
November 201399
22 ECONOMIC ANALYSIS
An economic analysis over the life-of-mine (LOM) plan, based on revenue derived from
reserves only, is summarised below in Table 22-2. This was based on a mill feed of
approximately 42,000 tonnes per month. The main economic parameters assumed in this
LOM plan are shown in Table 22-1. These operating costs are those planned in the mine
budget.
Table 22-1. Main Economic Parameters for LOMProcessing
APT Price $/mtu WO3
400
Metal Price - received, $/mtu WO3
312.0
after transport + smelting $/t WO3
31,200
Recovery % 65.0%
Processing Cost ROM ore $/t ore 13.00
G & A $/t ore 3.83
Processing Cost Tailings $/t ore 8.25
Total Applied Ore Cost $/t ore 16.44
(Processing+G&A+OreMining-WasteMining)
Mining
Ore mining $/t ore 2.37
Waste mining $/t waste 2.76
UG mining cost $/t ore 30.42

Technical Report on the Los Santos Mine Project
November 2013100
Table 22-2. LOM Economic AnalysisPit Year 1 2 3 4 5 6 7 8 9 Total
LCW Tonnes t - 6,260 101,403 117,633 - - - - - 225,296
WO3 % - 0.43 0.27 0.30 - - - - - 0.29
Tonnes t - 837 1,487 804 - - - - - 3,129
WO3 % - 0.08 0.08 0.08 - - - - - 0.08
Total Rock Tonnes t - 998,814 1,200,884 292,782 - - - - - 2,492,480
LCE Tonnes t 21,442 64,072 - - - - - - - 85,514
WO3 % 0.58 0.78 - - - - - - - 0.73
Tonnes t - - - - - - - - - -
WO3 % - - - - - - - - - -
Total Rock Tonnes t 498,722 355,421 - - - - - - - 854,142
Capa Tonnes t 61,207 - - - - - - - - 61,207
Este WO3 % 0.22 - - - - - - - - 0.22
Tonnes t 2,380 - - - - - - - - 2,380
WO3 % 0.08 - - - - - - - - 0.08
Total Rock Tonnes t 126,719 - - - - - - - - 126,719
SW Tonnes t 29,841 68,393 222,416 - - - - - - 320,650
WO3 % 0.25 0.30 0.33 - - - - - - 0.32
Tonnes t 2,022 3,822 8,373 - - - - - - 14,217
WO3 % 0.08 0.08 0.08 - - - - - - 0.08
Total Rock Tonnes t 1,199,703 799,965 841,245 - - - - - - 2,840,914
Day1 Tonnes t - - 4,625 239,894 99,375 - - - - 343,894
WO3 % - - 0.17 0.39 0.46 - - - - 0.41
Tonnes t - - 1,373 9,956 858 - - - - 12,186
WO3 % - - 0.08 0.08 0.08 - - - - 0.08
Total Rock Tonnes t - - 1,999,755 2,500,018 179,400 - - - - 4,679,173
SS Tonnes t - 359,592 321,481 - - - - - - 681,072
WO3 % - 0.44 0.43 - - - - - - 0.43
Tonnes t - 11,496 5,458 - - - - - - 16,954
WO3 % - 0.08 0.08 - - - - - - 0.08
Total Rock Tonnes t - 4,499,817 1,170,851 - - - - - - 5,670,668
Volume m3 686,282 2,376,006 1,863,210 998,107 60,437 - - - -
Tonnes Tonnes t 1,825,143 6,654,016 5,212,736 2,792,800 179,400 - - - - 16,664,096
Waste mined m3 648,485 2,215,227 1,659,147 885,496 29,375 - - - - 5,437,730
Waste mined t 1,708,251 6,139,545 4,546,120 2,424,514 79,167 - - - - 14,897,596
Ore m3 mined m3 37,798 160,779 204,063 112,611 31,062 - - - - 546,312
Ore mined t 116,893 514,471 666,615 368,287 100,233 - - - - 1,766,499
Ore Grade % 0.29 0.45 0.36 0.35 0.45 - - - - 0.39
Strip t/t 14.61 11.93 6.82 6.58 0.79 8.43
Strip m3/m3 17.16 13.78 8.13 7.86 0.95 9.95
Tonnes t 112,490 498,316 649,925 357,527 212,375 - - - - 1,830,633
WO3 % 0.30 0.46 0.37 0.36 0.51 - - - - 0.40
Tonnes t 4,403 16,155 16,691 10,760 1,932,858 - - - - 1,980,866
WO3 % 0.08 0.08 0.08 0.08 0.16 - - - - 0.16
Tonnes t 116,893 514,471 666,615 368,287 2,145,233 - - - - 3,811,499
WO3 % % 0.29 0.45 0.36 0.35 0.19 - - - - 0.28
In-Situ WO3 t 341 2,312 2,408 1,298 4,177 - - - - 10,536
Tonnes t 5,257 3,573 153,498 11,025 0 0 0 0 0
WO3 % 0.36 0.46 0.37 0.36 0.50 0.50 0.50 0.50 0.50
Tonnes t 70,524 86,679 103,370 114,124 1,770,382 1,270,382 770,382 270,382 0
WO3 % 0.22 0.19 0.18 0.17 0.16 0.16 0.16 0.16 0.16
Tonnes t 115,000 500,000 500,000 500,000 223,400 - 1,838,400
% 0.30 0.46 0.37 0.36 0.50 0.50 0.50 0.50 0.50 0.40
Tonnes t 5 276,600 500,000 500,000 500,000 270,382
WO3 % 0.18 0.16 0.16 0.16 0.16 0.16
TONS_ORE t 115,000 500,000 500,000 500,005 500,000 500,000 500,000 500,000 270,382 3,885,387
WO3 % 0.30 0.46 0.37 0.36 0.23 0.16 0.16 0.16 0.16 0.26
WO3 t Product t 224 1,496 1,199 1,180 731 521 521 521 282 6,676
Cum WO3 t
Product t 224 1,720 2,919 4,099 4,830 5,352 5,873 6,395 6,676 6,676
Waste $M 4.71 16.95 12.55 6.69 0.22 - - - - 41.12
Ore $M 0.28 1.22 1.58 0.87 3.68 - - - - 7.62
Total Mining Cost $M 4.99 18.16 14.13 7.56 3.89 - - - - 48.74
Processing Cost $M 1.50 6.50 6.50 6.50 6.50 4.13 4.13 4.13 2.23 42.10
G&A $M 0.44 1.92 1.92 1.92 1.92 1.92 1.92 1.92 1.04 14.88
Total Costs $M 6.93 26.58 22.54 15.98 12.31 6.04 6.04 6.04 3.27 105.72
Revenue WO3 $M 7.00 46.67 37.41 36.82 22.82 16.27 16.27 16.27 8.80 208.31
Operating Profit $M 0.07 20.09 14.87 20.84 10.51 10.23 10.23 10.23 5.53 102.58
Capex $M 1.17 - 1.17
Cashflow $M 1.10- 20.09 14.87 20.84 10.51 10.23 10.23 10.23 5.53 101.41
DCF $M 1.00- 16.60 11.17 14.24 6.52 5.77 5.25 4.77 2.35 65.67
Notes
Additional ore from SS/D1 underground operations
Re-treated tailing material
Year 1 Jun13- Sept 13
Year 2 Oct 13 - Sept 14
Year 3 …. Oct -Sept onwards
Low Grade ore
High Grade ore
Low Grade ore
High Grade ore
Low Grade ore
High Grade ore
Low Grade ore
High Grade ore
Low Grade ore
High Grade ore
Low Grade ore
High Grade ore
Mining Costs
Sub-total
Mined from
Pits
Ore
Breakdown
Mined - High Grade
Ore Onto ROM Pad
Mined - Onto Low
Grade Stockpile
Total Ore Mined
ROM Pad Contents
Stockpile Contents
Processed From
ROM Pad
Processed From
Stockpile
Total Processed

Technical Report on the Los Santos Mine Project
November 2013101
23 ADJACENT PROPERTIES
From June-August, 2012, Daytal completed the following work within two nearby investigationpermits:
• QUIÉN SABE investigation permit:
Daytal conducted a geological mapping study, placing greater interest in the areas of contact
between regional granite and hornfels, due to the possible formation of skarns in that area.
In Fuente Ladrón area, placed in the municipality of Los Santos, three trenches were made,
66.00 meters total length:
-TFD001: 26.50 meters.
-TFD002: 16.00 meters.
-TFD003: 23.50 meters.
Logging and sampling were completed in each trench. Samples were assayed in Los Santos
Mine lab and they had no significant mineralization.
• POR SI ACASO investigation permit:
Geological mapping and three channels sampling were made in this permit.
Channels sampling had 37.85 meters total length and were placed in the municipality ofMonleón:
-RM001: 10.80 meters.
-RM002: 17.30 meters.
-RM003: 9.75 meters.
Logging and sampling were completed in each channel. Samples were assayed in Los
Santos Mine lab. RM001 had some significant mineralization from 3.70 m to 5.40 m @ 0.12
%WO3.
• Valtreixal Tin-Tungsten Project:
Almonty entered into an option agreement, in March 2013, to acquire a 51% interest in, and
be the project operator of, the Valtreixal Sn-WO3 project in north-western Spain. Valtreixal is
approximately 250km from Los Santos. A historical estimate (not in accordance with 43-101)
was 8.65 Mt of mineralization at a grade of 0.23% Sn+WO3 (0.1% Sn+WO3 cut-off).
Sampling on this project come from 22 surface trenches covering 2,740 metres, 6 drillholes
covering 1,227 m and 28 underground galleries covering 1,072 metres. Figures connected
with Valtreixal are shown overleaf.

Technical Report on the Los Santos Mine Project
November 2013102
Figure 23-1. Map Showing Location of Valtreixal Project
Figure 23-2. Trenching Operations at Valtreixal
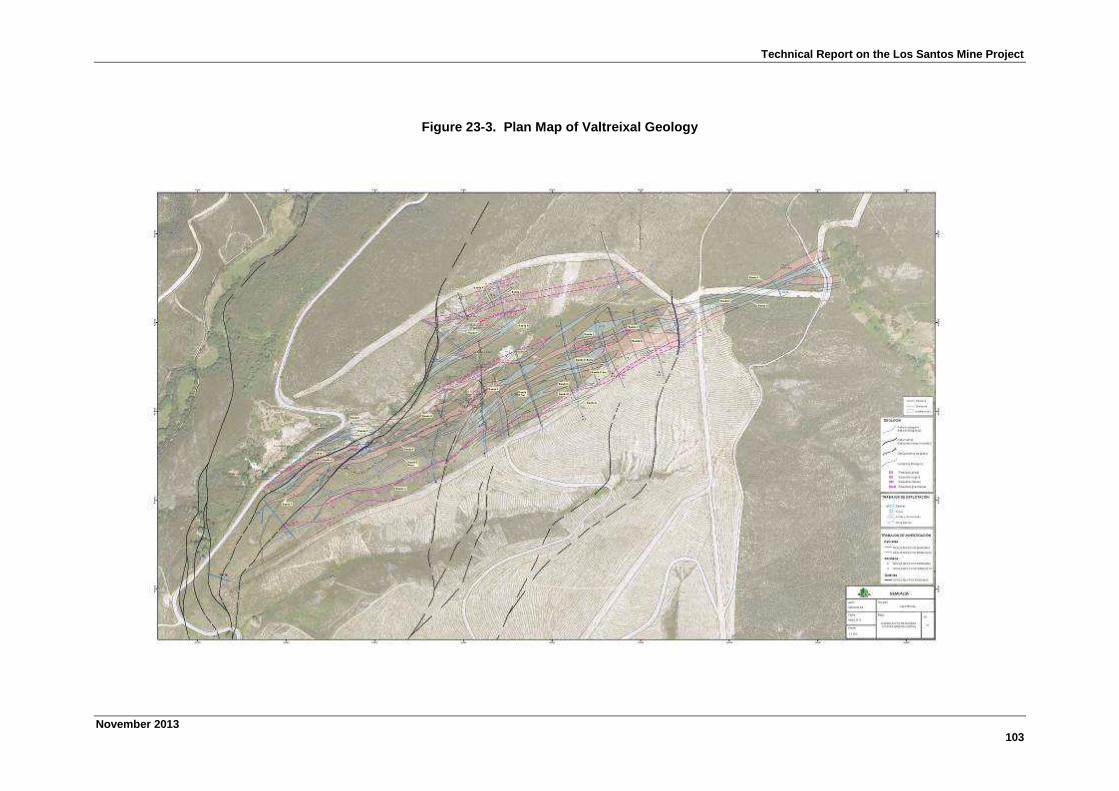
Technical Report on the Los Santos Mine Project
November 2013103
Figure 23-3. Plan Map of Valtreixal Geology

Technical Report on the Los Santos Mine Project
November 2013104
24 OTHER RELEVANT INFORMATION
24.1 Geotechnical Studies
The pit slope parameters were derived from geotechnical studies - originally Piteau 1985 and
Metales Hispania 2000. More recently in 2011 a geotechnical study was completed by
SADIM. From the studies face angles of 73o
(in all directions) have been recommended. In
oxidised material, approximately 10m below the topography, a face angle of 45o
has been
recommended. The bench configuration is based on a 4m safety berm for every 20m
vertically. With a 10m haul road being used, final overall slope angles are typically between
55o
and 48o, depending on the predominant location of the haul road relative to the pit.
24.2 Water Management
The water reuse at the plant is at levels of approximately 95-97%. The remaining difference
from 100%, sewage water, potable water and garden water represents an extra consumption
of 200-250 m3
day, that are acquired from the municipalities of Fueterroble and Los Santos.
The water for sanitary uses needs to be controlled water and will never be more than 25% of
that value and will always be supplied by external sources (municipalities). All the remaining
water (industrial water) will be from internal sources.
The area inside the mine boundary has the capacity to supply 10 times the mine’s annual
needs of industrial water. In 2012, a trench and concrete box were constructed, in order to
collect all the water from the higher slopes. This water is decanted in a small decantation
pound before coming to the underground gallery were it is stored. The pumping system of the
gallery was in 2012 reinforced, with a duplication of the water pipe from the gallery to the
plant, to make it completely independent. That pipe is also connected to the garden watering.
A steel tube is currently being installed in the former Sector Central mined excavation, which
has now been filled with waste rock. Pipes for pumping of water from this zone were placed
in 2010 and revised in July 2012. The water from the operating pits of the west zone (LCW
and LCE) will be pumped to Sector Central.
In addition to this two other new water sources are being planned:
1 – A new zone for storage of tailings for future reprocess was done down the office and with
a small decantation pond in the lower part. This is in a valley that collects a reasonable area
and the tailings contains 11% water. This means 4,400 m3
of water can be collected from this
source. Now a small pump for that zone is forecasted to be installed shortly.
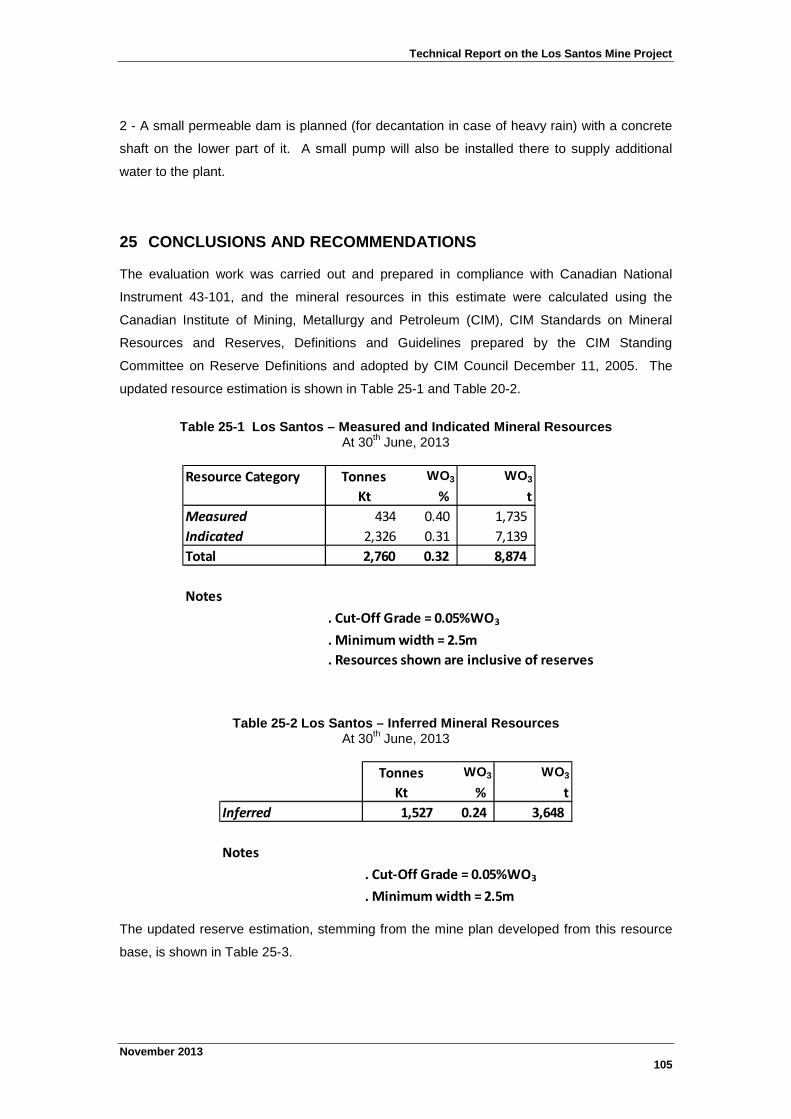
Technical Report on the Los Santos Mine Project
November 2013105
2 - A small permeable dam is planned (for decantation in case of heavy rain) with a concrete
shaft on the lower part of it. A small pump will also be installed there to supply additional
water to the plant.
25 CONCLUSIONS AND RECOMMENDATIONS
The evaluation work was carried out and prepared in compliance with Canadian National
Instrument 43-101, and the mineral resources in this estimate were calculated using the
Canadian Institute of Mining, Metallurgy and Petroleum (CIM), CIM Standards on Mineral
Resources and Reserves, Definitions and Guidelines prepared by the CIM Standing
Committee on Reserve Definitions and adopted by CIM Council December 11, 2005. The
updated resource estimation is shown in Table 25-1 and Table 20-2.
Table 25-1 Los Santos – Measured and Indicated Mineral ResourcesAt 30
thJune, 2013
Resource Category Tonnes WO3 WO3
Kt % t
Measured 434 0.40 1,735
Indicated 2,326 0.31 7,139
Total 2,760 0.32 8,874
Notes
. Cut-Off Grade = 0.05%WO3
. Minimum width = 2.5m
. Resources shown are inclusive of reserves
Table 25-2 Los Santos – Inferred Mineral ResourcesAt 30
thJune, 2013
Tonnes WO3 WO3
Kt % t
Inferred 1,527 0.24 3,648
Notes
. Cut-Off Grade = 0.05%WO3
. Minimum width = 2.5m
The updated reserve estimation, stemming from the mine plan developed from this resource
base, is shown in Table 25-3.
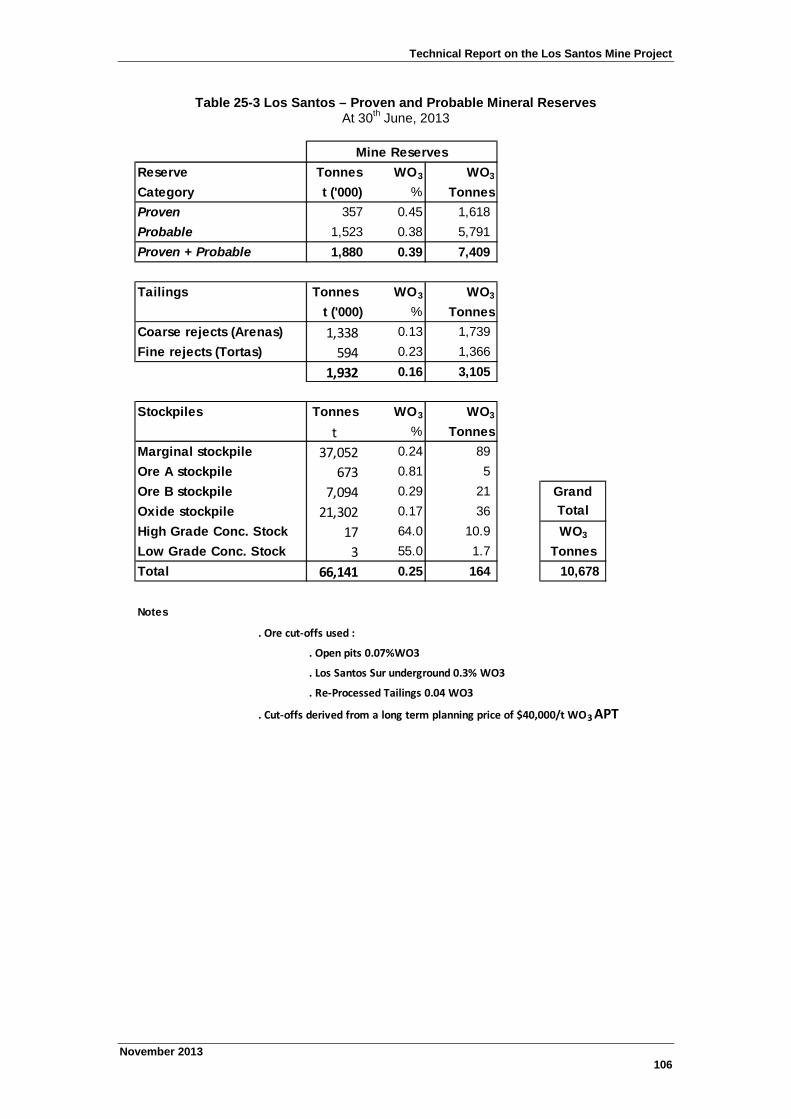
Technical Report on the Los Santos Mine Project
November 2013106
Table 25-3 Los Santos – Proven and Probable Mineral ReservesAt 30
thJune, 2013
Reserve Tonnes WO3 WO3
Category t ('000) % Tonnes
Proven 357 0.45 1,618
Probable 1,523 0.38 5,791
Proven + Probable 1,880 0.39 7,409
Tailings Tonnes WO3 WO3
t ('000) % Tonnes
Coarse rejects (Arenas) 1,338 0.13 1,739
Fine rejects (Tortas) 594 0.23 1,366
1,932 0.16 3,105
Stockpiles Tonnes WO3 WO3
t % Tonnes
Marginal stockpile 37,052 0.24 89
Ore A stockpile 673 0.81 5
Ore B stockpile 7,094 0.29 21 Grand
Oxide stockpile 21,302 0.17 36 Total
High Grade Conc. Stock 17 64.0 10.9 WO3
Low Grade Conc. Stock 3 55.0 1.7 Tonnes
Total 66,141 0.25 164 10,678
Notes
. Ore cut-offs used :
. Open pits 0.07%WO3
. Los Santos Sur underground 0.3% WO3
. Re-Processed Tailings 0.04 WO3
. Cut-offs derived from a long term planning price of $40,000/t WO3 APT
Mine Reserves
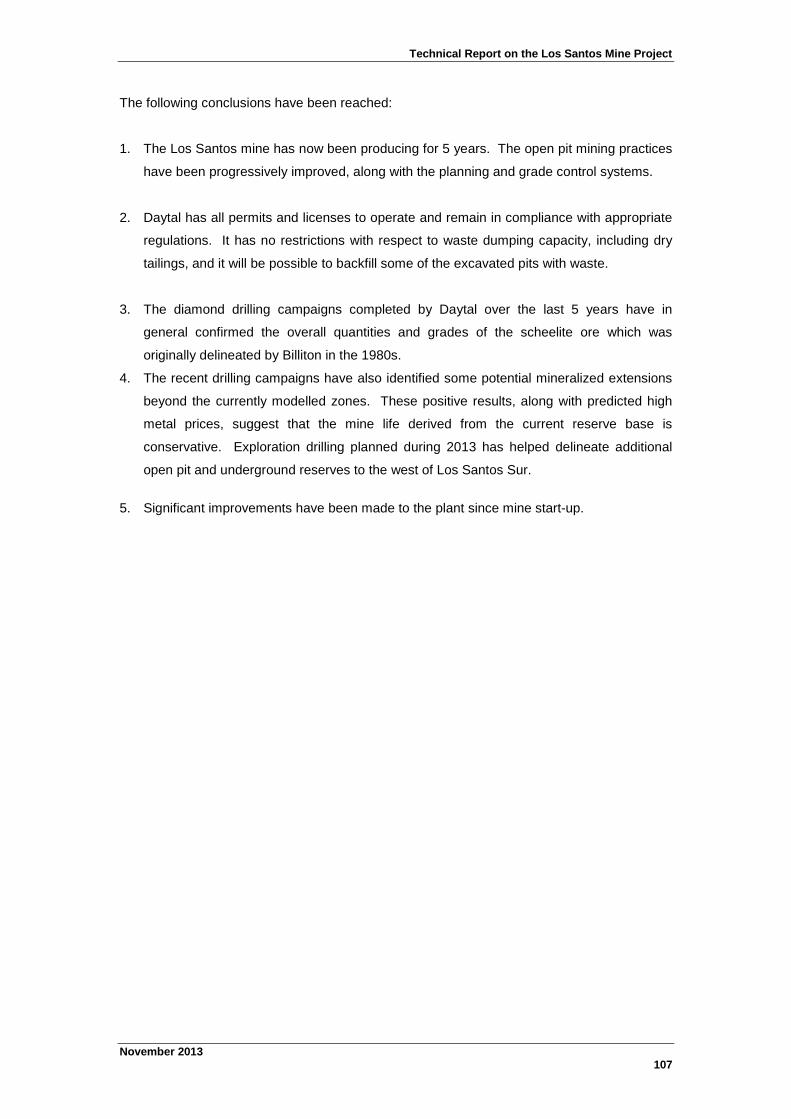
Technical Report on the Los Santos Mine Project
November 2013107
The following conclusions have been reached:
1. The Los Santos mine has now been producing for 5 years. The open pit mining practices
have been progressively improved, along with the planning and grade control systems.
2. Daytal has all permits and licenses to operate and remain in compliance with appropriate
regulations. It has no restrictions with respect to waste dumping capacity, including dry
tailings, and it will be possible to backfill some of the excavated pits with waste.
3. The diamond drilling campaigns completed by Daytal over the last 5 years have in
general confirmed the overall quantities and grades of the scheelite ore which was
originally delineated by Billiton in the 1980s.
4. The recent drilling campaigns have also identified some potential mineralized extensions
beyond the currently modelled zones. These positive results, along with predicted high
metal prices, suggest that the mine life derived from the current reserve base is
conservative. Exploration drilling planned during 2013 has helped delineate additional
open pit and underground reserves to the west of Los Santos Sur.
5. Significant improvements have been made to the plant since mine start-up.

Technical Report on the Los Santos Mine Project
November 2013108
26 REFERENCES
Golder Associates. “Optimisation, Basic Engineering and Independent Feasibility
Review Report”, May 2006.
Timon, S.M., Morom M.C., Cembranos, M.L., Fernandez, A. and Crespo, J.L.
“Contact Metamorphism in the Los Santos W Skarn (NW Spain).
Adam Wheeler. “Los Santos Resource and Reserve Estimation”, February 2006.
Adam Wheeler. “Technical Report on the Mineral Resources and Reserves of Los
Santos Mine Project, Spain”, March 2011.
Control Ingeneria y Servicios S.A., (Seinco). “Proyecto Estructural De Acopios En
Mina Los Santos - Fuenterobboble, Salamanca”, December, 2011.
SADIM, Alfredo. Menéndez Díaz, Cipriano López Fanjul “Mina Los Santos – Estudio
de Estabilidad de Taludes en Las Cortas Los Santos Sur y Las Cortinas Oeste”.
March, 2012.

Technical Report on the Los Santos Mine Project
November 2013109
QUALIFIED PERSONS CERTIFICATES
Certificate Of Author
Adam Wheeler, Mining Consultant,
Cambrose Farm, Redruth, Cornwall, TR16 4HT, England.
Tel/Fax: (44) 1209-899042; E-mail: [email protected]
As the author of this report on the Los Santos Mine, I, A. Wheeler do hereby certify that:-
1. I am an independent mining consultant, based at, Cambrose Farm, Redruth, Cornwall,
TR16 4HT, England.
2. I hold the following academic qualifications:-
B.Sc. (Mining) Camborne School of Mines 1981
M.Sc. (Mining Engineering) Queen’s University (Canada) 1982
3. I am a registered Chartered Engineer (C. Eng and Eur. Ing) with the Engineering
Council (UK). Reg. no. 371572.
4. I am a member in good standing of the Institute of Mining, Metallurgy and Materials
(Member).
5. I have worked as a mining engineer in the minerals industry for over 28 years. I have
experience with a wide variety of mineral deposits and reserve estimation techniques.
6. I have read NI 43-101 and the technical report, which is the subject of this certificate,
has been prepared in compliance with NI 43-101. By reason of my education,
experience and professional registration, I fulfil the requirements of a “qualified person”
as defined by NI 43-101. My work experience includes 5 years at an underground gold
mine, 7 years as a mining engineer in the development and application of mining and
geological software, and 19 years as an independent mining consultant, involved with
evaluation and planning projects for both open pit and underground mines.
7. I am responsible for the preparation of the technical report titled “Technical Report on
the Mineral Resource and Reserves of the Los Santos Mine” and dated October 31st,
2013. I have worked on site during various times since 2006, specifically from August
20th
-22nd
, 2013, in connection with the preparation of this report.
8. As of the date hereof, to the best of the my knowledge, information and belief, the
technical report, which is the subject of this certificate, contains all scientific and
technical information that is required to be disclosed to make such technical report not
misleading.
9. I am independent of Daytal Resources Spain S.L., pursuant to section 1.5 of the
Instrument.
10. I have read the National Instrument and Form 43-101F1 (the “Form”) and the Technical
Report has been prepared in compliance with the Instrument and the Form.
11. I consent to the filing of the report with any Canadian stock exchange or securities
regulatory authority, and any publication by them of the report.
Dated this 31st
of October, 2013
A. Wheeler, C.Eng.

Technical Report on Los Santos
0
APPENDIX A:
Geostatistical Plots

Technical Report on Los Santos
1
Log Probability Plots - Samples
Las Cortinas
Los Santos Sur
Capa Este
LSS- SW
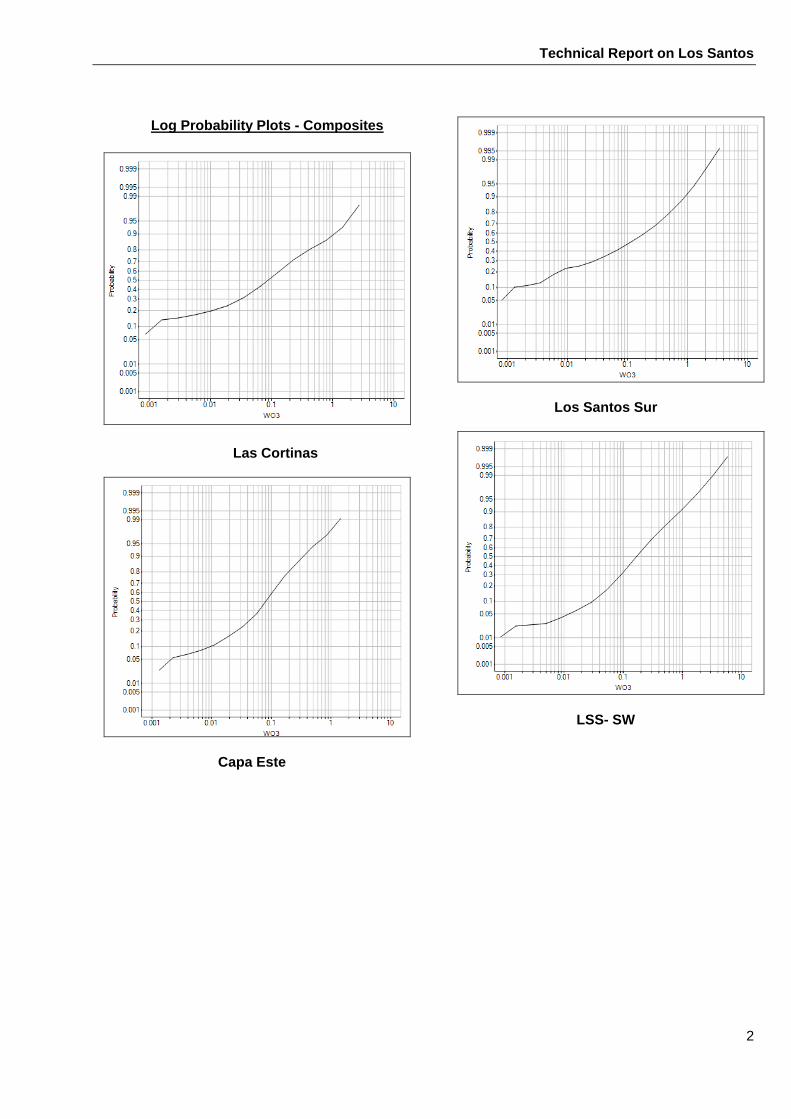
Technical Report on Los Santos
2
Log Probability Plots - Composites
Las Cortinas
Capa Este
Los Santos Sur
LSS- SW

Technical Report on Los Santos
3
Variograms
LLSW
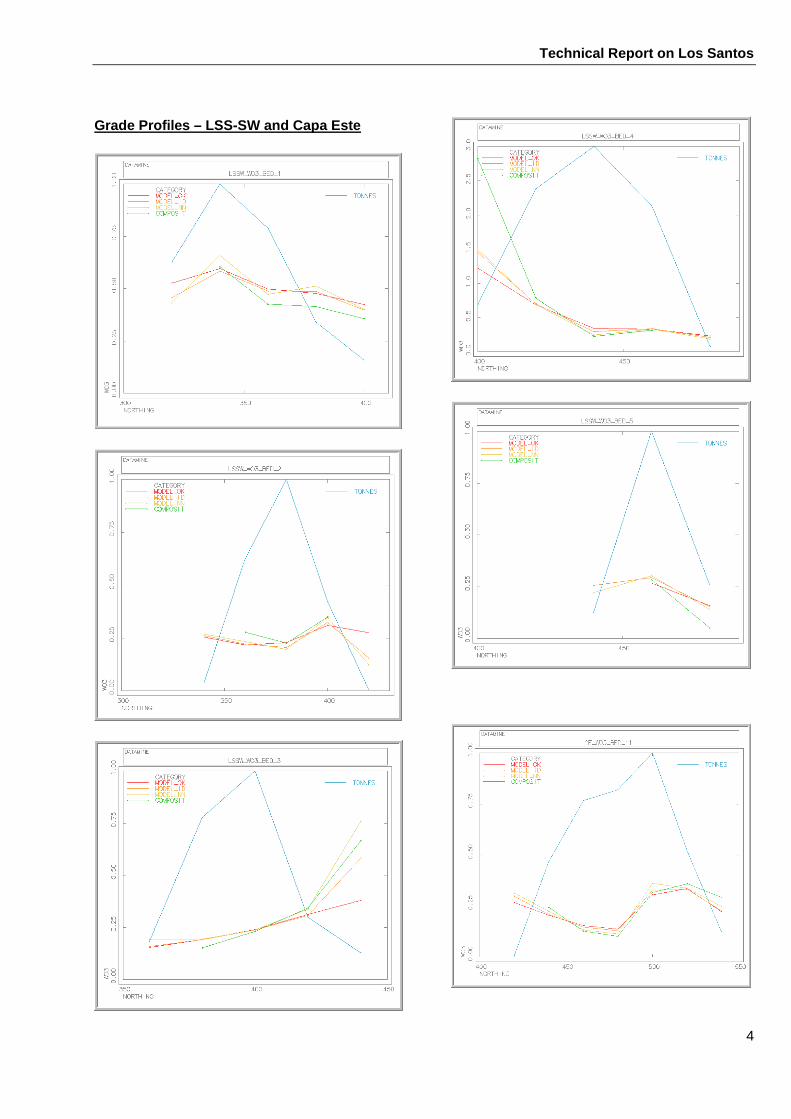
Technical Report on Los Santos
4
Grade Profiles – LSS-SW and Capa Este

Technical Report on Los Santos
APPENDIX B:
Glossary of Terms
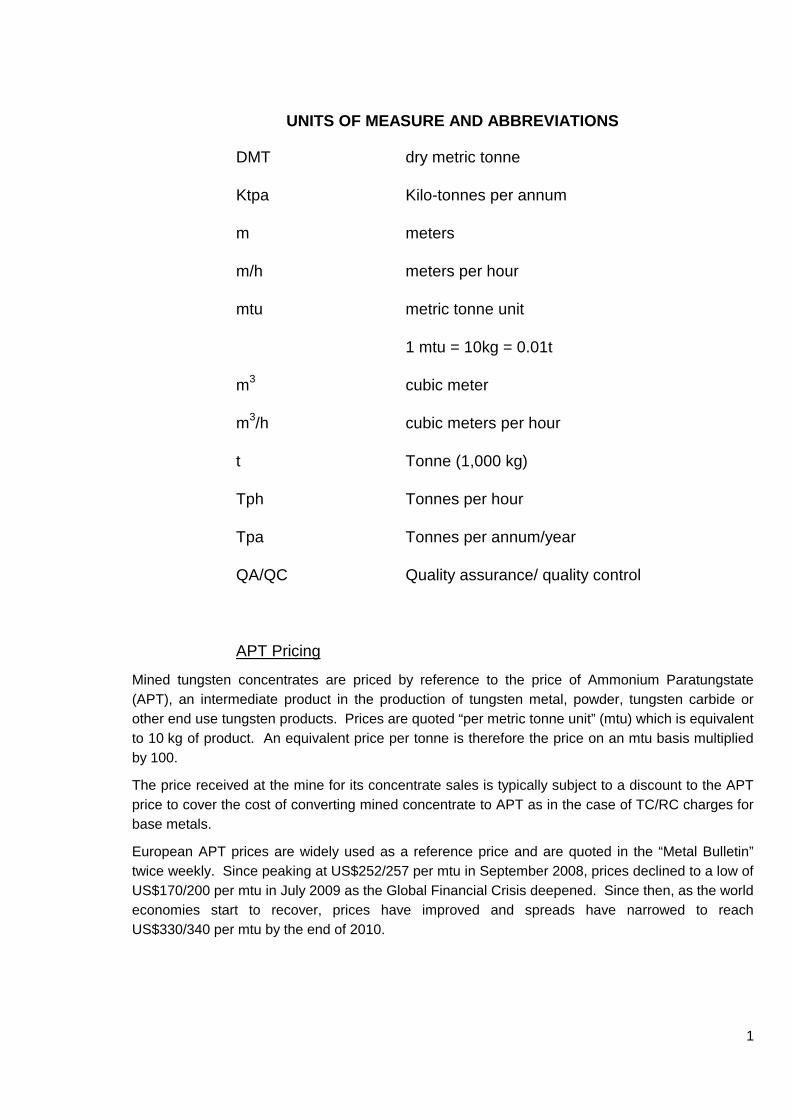
1
UNITS OF MEASURE AND ABBREVIATIONS
DMT dry metric tonne
Ktpa Kilo-tonnes per annum
m meters
m/h meters per hour
mtu metric tonne unit
1 mtu = 10kg = 0.01t
m3 cubic meter
m3/h cubic meters per hour
t Tonne (1,000 kg)
Tph Tonnes per hour
Tpa Tonnes per annum/year
QA/QC Quality assurance/ quality control
APT Pricing
Mined tungsten concentrates are priced by reference to the price of Ammonium Paratungstate
(APT), an intermediate product in the production of tungsten metal, powder, tungsten carbide or
other end use tungsten products. Prices are quoted “per metric tonne unit” (mtu) which is equivalent
to 10 kg of product. An equivalent price per tonne is therefore the price on an mtu basis multiplied
by 100.
The price received at the mine for its concentrate sales is typically subject to a discount to the APT
price to cover the cost of converting mined concentrate to APT as in the case of TC/RC charges for
base metals.
European APT prices are widely used as a reference price and are quoted in the “Metal Bulletin”
twice weekly. Since peaking at US$252/257 per mtu in September 2008, prices declined to a low of
US$170/200 per mtu in July 2009 as the Global Financial Crisis deepened. Since then, as the world
economies start to recover, prices have improved and spreads have narrowed to reach
US$330/340 per mtu by the end of 2010.