Report Name: Citrus Semi-annual
28
THIS REPORT CONTAINS ASSESSMENTS OF COMMODITY AND TRADE ISSUES MADE BY USDA STAFF AND NOT NECESSARILY STATEMENTS OF OFFICIAL U.S. GOVERNMENT POLICY Required Report: Required - Public Distribution Date: June 15, 2021 Report Number: SF2021-0035 Report Name: Citrus Semi-annual Country: South Africa - Republic of Post: Pretoria Report Category: Citrus Prepared By: Wellington Sikuka Approved By: Kyle Bonsu Report Highlights: The production of South African citrus, mainly soft citrus, new orange varieties, lemons and limes is estimated to continue its strong growth in the 2020/21 Marketing Year (MY), based on the increase in area planted, improved yields, high level of new-plantings coming into full production, and the minimal impact of COVID-19 on labor and input supply. This increase is expected to be partially offset by drought conditions in some production areas of the Eastern Cape, and hail damage in some production areas of Mpumalanga. Duty free exports of all citrus types to the United States under the African Growth Opportunity Act (AGOA) reached a peak of 91,402 MT in 2020, and are expected to continue their strong annual growth in 2021, as the United States is still considered a premium market.
Transcript of Report Name: Citrus Semi-annual
THIS REPORT CONTAINS ASSESSMENTS OF COMMODITY AND TRADE ISSUES MADE BY USDA STAFF AND NOT NECESSARILY STATEMENTS OF OFFICIAL U.S. GOVERNMENT POLICY
Required Report: Required - Public Distribution Date: June 15, 2021
Report Number: SF2021-0035
Report Name: Citrus Semi-annual
Country: South Africa - Republic of
Post: Pretoria
Report Category: Citrus
Prepared By: Wellington Sikuka
Approved By: Kyle Bonsu
Report Highlights:
The production of South African citrus, mainly soft citrus, new orange varieties, lemons and limes is
estimated to continue its strong growth in the 2020/21 Marketing Year (MY), based on the increase in
area planted, improved yields, high level of new-plantings coming into full production, and the minimal
impact of COVID-19 on labor and input supply. This increase is expected to be partially offset by
drought conditions in some production areas of the Eastern Cape, and hail damage in some production
areas of Mpumalanga. Duty free exports of all citrus types to the United States under the African
Growth Opportunity Act (AGOA) reached a peak of 91,402 MT in 2020, and are expected to continue
their strong annual growth in 2021, as the United States is still considered a premium market.
Page 1
Commodities:
Citrus, Other, Fresh
Grapefruit, Fresh
Oranges, Fresh
Tangerines/Mandarins, Fresh
Lemons, Fresh
Orange Juice
Exchange rate: Rand/US$ Exchange = 13.42 as of June 7, 2021
Marketing Year (MY) – January to December
MT – Metric Tons
Sources:
Citrus Growers Association - http://www.cga.co.za/
Summer Citrus South Africa - https://www.summercitrus.com/
Ministry of Agriculture, Land Reform and Rural Development - https://www.daff.gov.za/
South African Revenue Services - https://www.sars.gov.za/
Background
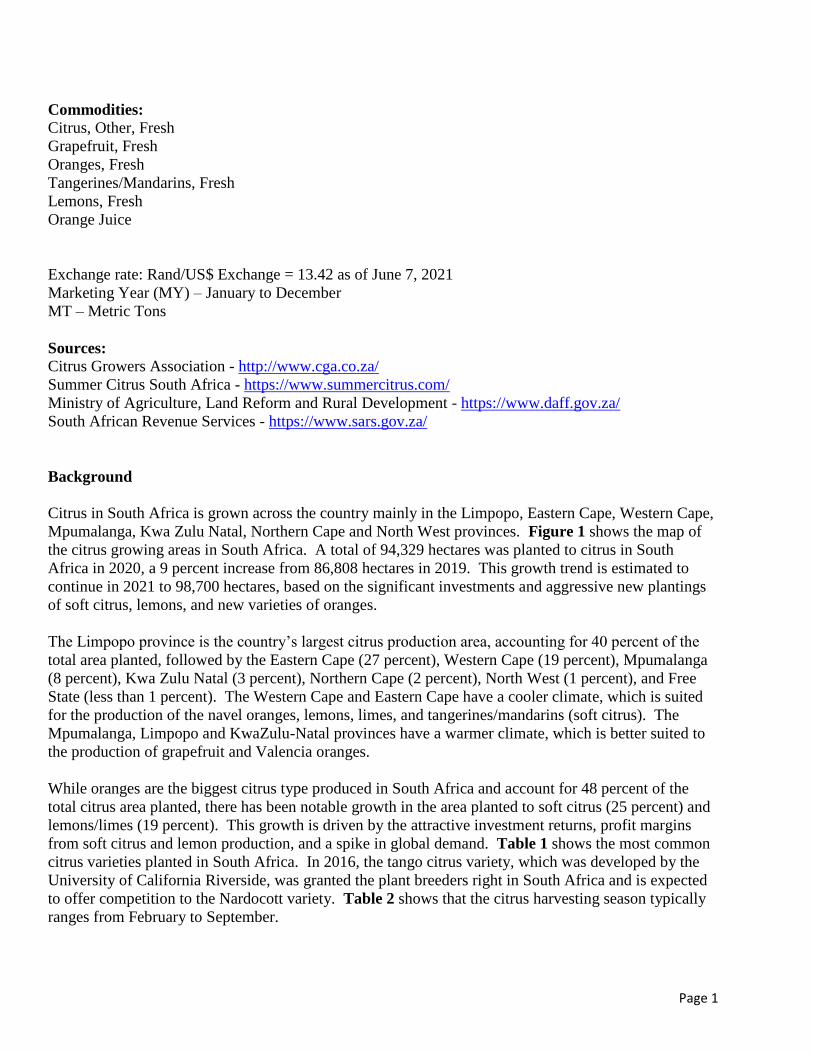
Citrus in South Africa is grown across the country mainly in the Limpopo, Eastern Cape, Western Cape,
Mpumalanga, Kwa Zulu Natal, Northern Cape and North West provinces. Figure 1 shows the map of
the citrus growing areas in South Africa. A total of 94,329 hectares was planted to citrus in South
Africa in 2020, a 9 percent increase from 86,808 hectares in 2019. This growth trend is estimated to
continue in 2021 to 98,700 hectares, based on the significant investments and aggressive new plantings
of soft citrus, lemons, and new varieties of oranges.
The Limpopo province is the country’s largest citrus production area, accounting for 40 percent of the
total area planted, followed by the Eastern Cape (27 percent), Western Cape (19 percent), Mpumalanga
(8 percent), Kwa Zulu Natal (3 percent), Northern Cape (2 percent), North West (1 percent), and Free
State (less than 1 percent). The Western Cape and Eastern Cape have a cooler climate, which is suited
for the production of the navel oranges, lemons, limes, and tangerines/mandarins (soft citrus). The
Mpumalanga, Limpopo and KwaZulu-Natal provinces have a warmer climate, which is better suited to
the production of grapefruit and Valencia oranges.
While oranges are the biggest citrus type produced in South Africa and account for 48 percent of the
total citrus area planted, there has been notable growth in the area planted to soft citrus (25 percent) and
lemons/limes (19 percent). This growth is driven by the attractive investment returns, profit margins
from soft citrus and lemon production, and a spike in global demand. Table 1 shows the most common
citrus varieties planted in South Africa. In 2016, the tango citrus variety, which was developed by the
University of California Riverside, was granted the plant breeders right in South Africa and is expected
to offer competition to the Nardocott variety. Table 2 shows that the citrus harvesting season typically
ranges from February to September.
Page 2
Figure 1: Citrus Growing Areas in South Africa.
Source: Citrus Growers Association (CGA)
Table 1: Citrus Varieties
Citrus Type Varieties
Grape fruit Star Ruby, Marsh, Rose, Flame, Nelspruit Ruby (Nelruby), Flamingo
Oranges Valencias - Delta, Midknight, Turkey, Oukloon (Olinda, Late), Du Roi, Benny.
Navels - Palmer, Bahianinha, Washington, Robyn, Navelina, Lane Late,
Newhall, Cambria, Cara, Rustenburg, Autumn Gold
Mandarins/
Tangarines
Clementine - Nules, Marisol, SRA, Oroval, Esbal, Clemenpons, Oronules.
Mandarin – Tango, Nadorcott (Afourer), Nova, Or (Orri), Minneola, Mor ,
B17, Tambor , Naartjie, Thoro Temple, Sonet, B24 (African Sunset)
Satsuma - Miho Wase, Owari, Kuno, Miyagawa Wase, Okitsu Wase, Aoshima.
Lemons/Lime Eureka, Eureka SL, Lisbon, Limoneira, Genoa
Source: CGA
Table 2: South Africa Harvest Period for Citrus
Citrus Harvest Period
Marsh Grapefruit March to June
Star Ruby Grapefruit April to September
Navel Oranges March to July
Valencia Oranges July to September
Mandarins/Tangarines March to August
Lemons/Lime February to September
Source: CGA
Page 3
Grapefruit, Fresh
Area Planted
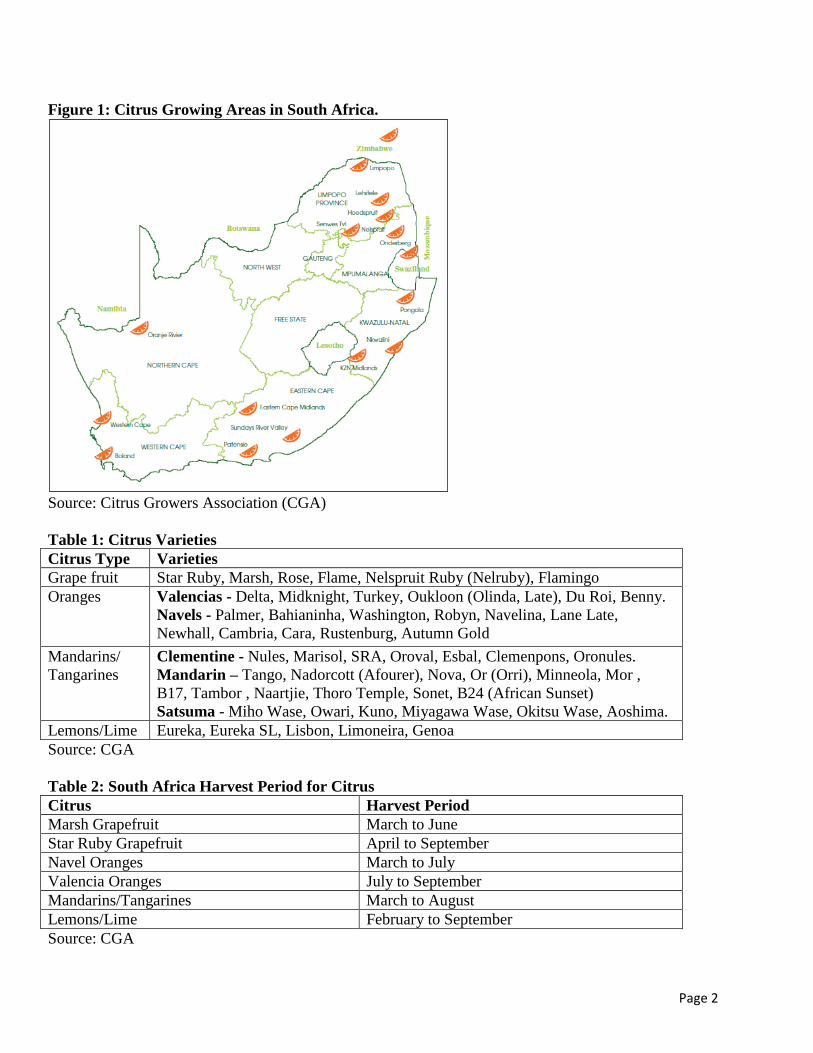
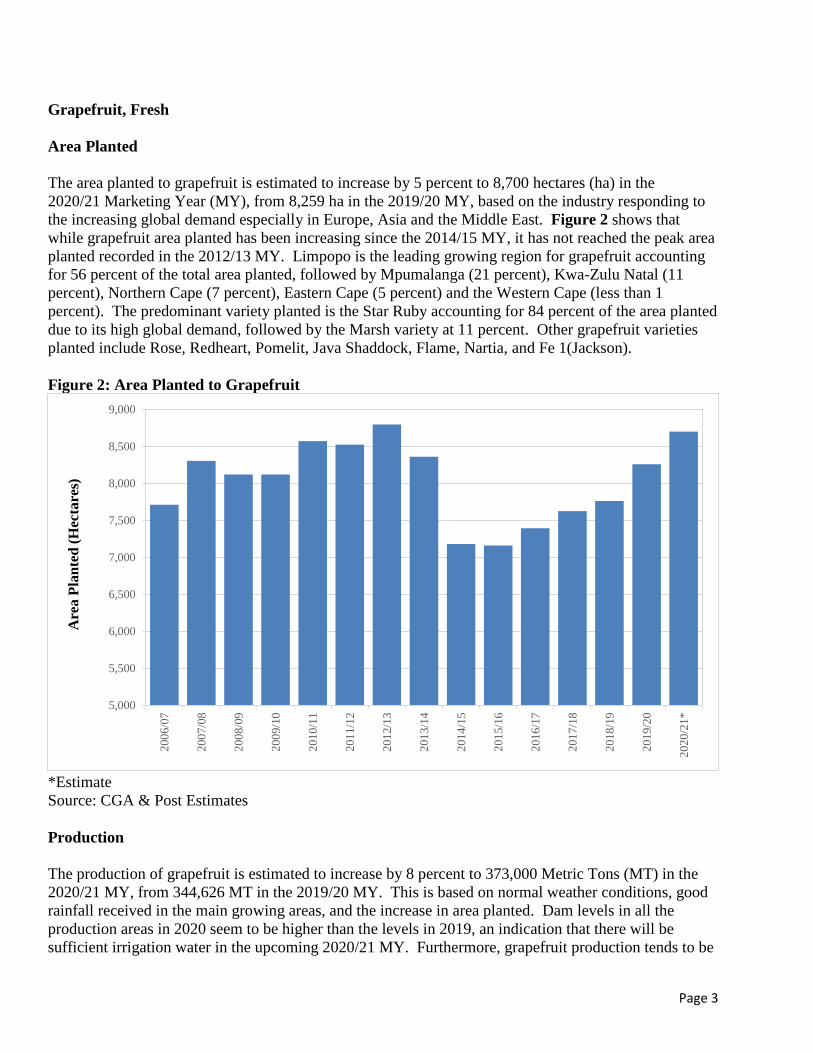
The area planted to grapefruit is estimated to increase by 5 percent to 8,700 hectares (ha) in the
2020/21 Marketing Year (MY), from 8,259 ha in the 2019/20 MY, based on the industry responding to
the increasing global demand especially in Europe, Asia and the Middle East. Figure 2 shows that
while grapefruit area planted has been increasing since the 2014/15 MY, it has not reached the peak area
planted recorded in the 2012/13 MY. Limpopo is the leading growing region for grapefruit accounting
for 56 percent of the total area planted, followed by Mpumalanga (21 percent), Kwa-Zulu Natal (11
percent), Northern Cape (7 percent), Eastern Cape (5 percent) and the Western Cape (less than 1
percent). The predominant variety planted is the Star Ruby accounting for 84 percent of the area planted
due to its high global demand, followed by the Marsh variety at 11 percent. Other grapefruit varieties
planted include Rose, Redheart, Pomelit, Java Shaddock, Flame, Nartia, and Fe 1(Jackson).
Figure 2: Area Planted to Grapefruit
*Estimate
Source: CGA & Post Estimates
Production
The production of grapefruit is estimated to increase by 8 percent to 373,000 Metric Tons (MT) in the
2020/21 MY, from 344,626 MT in the 2019/20 MY. This is based on normal weather conditions, good
rainfall received in the main growing areas, and the increase in area planted. Dam levels in all the
production areas in 2020 seem to be higher than the levels in 2019, an indication that there will be
sufficient irrigation water in the upcoming 2020/21 MY. Furthermore, grapefruit production tends to be
5,000
5,500
6,000
6,500
7,000
7,500
8,000
8,500
9,000
200
6/0
7
200
7/0
8
200
8/0
9
200
9/1
0
201
0/1
1
201
1/1
2
201
2/1
3
201
3/1
4
201
4/1
5
201
5/1
6
201
6/1
7
201
7/1
8
201
8/1
9
201
9/2
0
202
0/2
1*
Are
a P
lan
ted
(H
ecta
res)
Page 4
cyclical and the 2019/20 MY was a down year. Grapefruit is normally harvested between March and
September, and the impact of COVID-19 on production, harvest and labor has been minimal to date.
Consumption
Grapefruit consumption is estimated to increase to 8,500 MT in the 2020/21 MY, from 8,000 MT in the
2019/20 MY. This is based on the rise in production, and to the growing awareness and perceived
health benefits of grapefruit in the domestic market. Citrus has seen a surge in demand due to the
assumed benefits of Vitamin C in boosting immunity against COVID-19.
Notably, grapefruit is not a very popular citrus fruit in the domestic market, with many consumers
largely unfamiliar to its qualities and taste in South Africa. As a result, the fresh grapefruit per capita
consumption in South Africa is still relatively low at below 1 kg per annum because the majority of the
population has not acquired the taste for grapefruit.
Processing
On average, 29 percent of total grapefruit produced is used for processing. Post estimates that the
grapefruit delivered for processing will increase by 12 percent to 105,000 MT in the 2020/21 MY, from
94,000 MT in the 2019/20 MY, based on the increase in production. Grapefruit is processed to juice and
concentrate, the majority of which is exported to Europe. The left-over pulp following commercial juice
extraction is an important source of grapefruit oil which is used as a flavoring agent in many soft drinks.
The inner peel is a source of pectin and citric acid, which are both used by the food industry to preserve
fruits, jams, and marmalades. Naringin is also extracted from grapefruit peel, and gives tonic-water its
distinctive bitter flavor. The grapefruit peel oil is used in scented fragrances.
Exports
Post estimates that grapefruit exports will increase by 7 percent to 260,000 MT in the 2020/21 MY, from
244,334 MT in the 2019/20 MY, based on the rise in production, continued demand for citrus in global
markets for health reasons, and the pace of exports up to April 2021. Citrus has seen a surge in demand
due to the assumed benefits of Vitamin C in boosting immunity against COVID-19. The 2019/20 MY
export of grapefruit was revised downwards to 244,334 MT based on final Trade Data Monitor figures.
Europe is the largest market for South African grapefruit exports accounting for 42 percent of total
exports in 2019, followed by Asia at 39 percent. Although South Africa has a free trade agreement with
the European Union (EU) which allows duty free access for its citrus exports, South Africa continues to
face challenges due to Citrus Black Spot (CBS) and False Coddling Moth (FCM) in the EU market.
Industry estimates that it is costing South Africa almost R1.8 Billion (US$134 Million) to address and
comply with the CBS requirements in the EU market. In 2021, South Africa (“Fruit South Africa”) and
China (Chamber of Commerce) signed a Memorandum of Understanding (MOU) to promote greater
cooperation and statistical information exchange between the two countries` fresh fruit industries.
While total volumes are still low, grapefruit exports to the United States have been growing
exponentially by an average of 65 percent per annum in the past five years, from 76 MT in the 2012/13
MY, to 5,310 MT in the 2019/20 MY. Grapefruit exports to the United States are expected to continue
Page 5
rising based on the growing demand, good quality fruit, and to a lesser extent the continuation of duty
free access through the African Growth and Opportunity Act (AGOA). The Middle East, Canada and
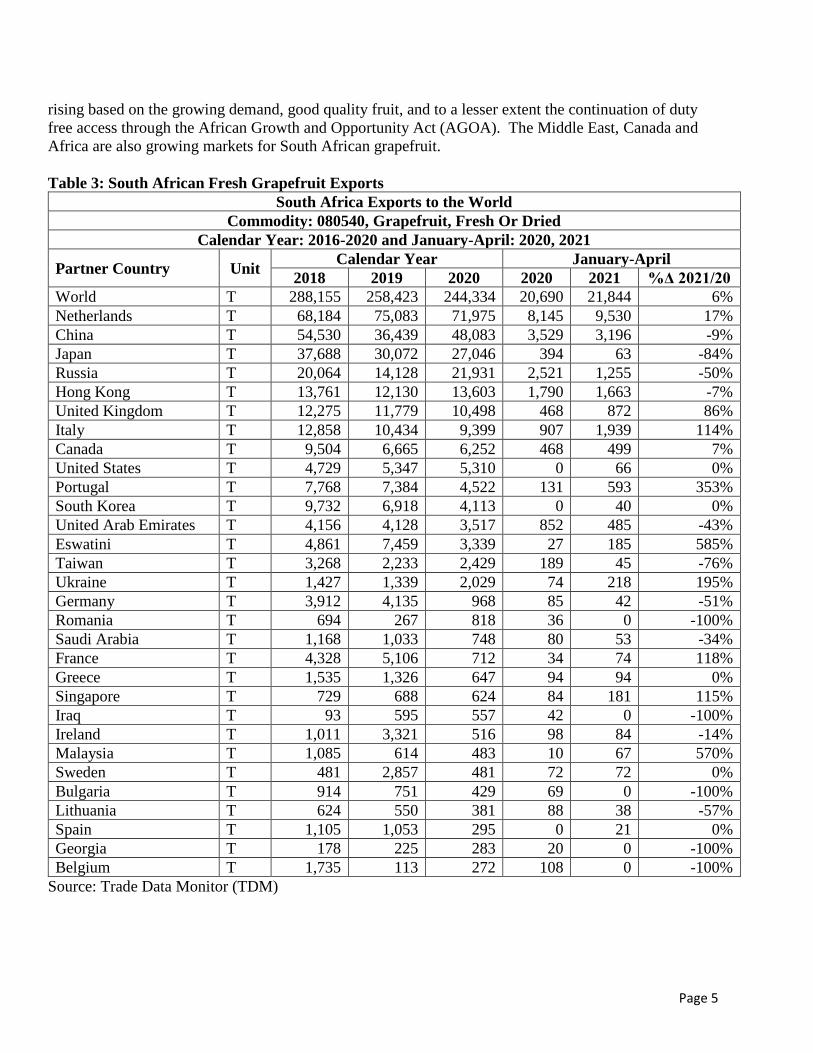
Africa are also growing markets for South African grapefruit.
Table 3: South African Fresh Grapefruit Exports
South Africa Exports to the World
Commodity: 080540, Grapefruit, Fresh Or Dried
Calendar Year: 2016-2020 and January-April: 2020, 2021
Partner Country Unit Calendar Year January-April
2018 2019 2020 2020 2021 %Δ 2021/20
World T 288,155 258,423 244,334 20,690 21,844 6%
Netherlands T 68,184 75,083 71,975 8,145 9,530 17%
China T 54,530 36,439 48,083 3,529 3,196 -9%
Japan T 37,688 30,072 27,046 394 63 -84%
Russia T 20,064 14,128 21,931 2,521 1,255 -50%
Hong Kong T 13,761 12,130 13,603 1,790 1,663 -7%
United Kingdom T 12,275 11,779 10,498 468 872 86%
Italy T 12,858 10,434 9,399 907 1,939 114%
Canada T 9,504 6,665 6,252 468 499 7%
United States T 4,729 5,347 5,310 0 66 0%
Portugal T 7,768 7,384 4,522 131 593 353%
South Korea T 9,732 6,918 4,113 0 40 0%
United Arab Emirates T 4,156 4,128 3,517 852 485 -43%
Eswatini T 4,861 7,459 3,339 27 185 585%
Taiwan T 3,268 2,233 2,429 189 45 -76%
Ukraine T 1,427 1,339 2,029 74 218 195%
Germany T 3,912 4,135 968 85 42 -51%
Romania T 694 267 818 36 0 -100%
Saudi Arabia T 1,168 1,033 748 80 53 -34%
France T 4,328 5,106 712 34 74 118%
Greece T 1,535 1,326 647 94 94 0%
Singapore T 729 688 624 84 181 115%
Iraq T 93 595 557 42 0 -100%
Ireland T 1,011 3,321 516 98 84 -14%
Malaysia T 1,085 614 483 10 67 570%
Sweden T 481 2,857 481 72 72 0%
Bulgaria T 914 751 429 69 0 -100%
Lithuania T 624 550 381 88 38 -57%
Spain T 1,105 1,053 295 0 21 0%
Georgia T 178 225 283 20 0 -100%
Belgium T 1,735 113 272 108 0 -100%
Source: Trade Data Monitor (TDM)
Page 6
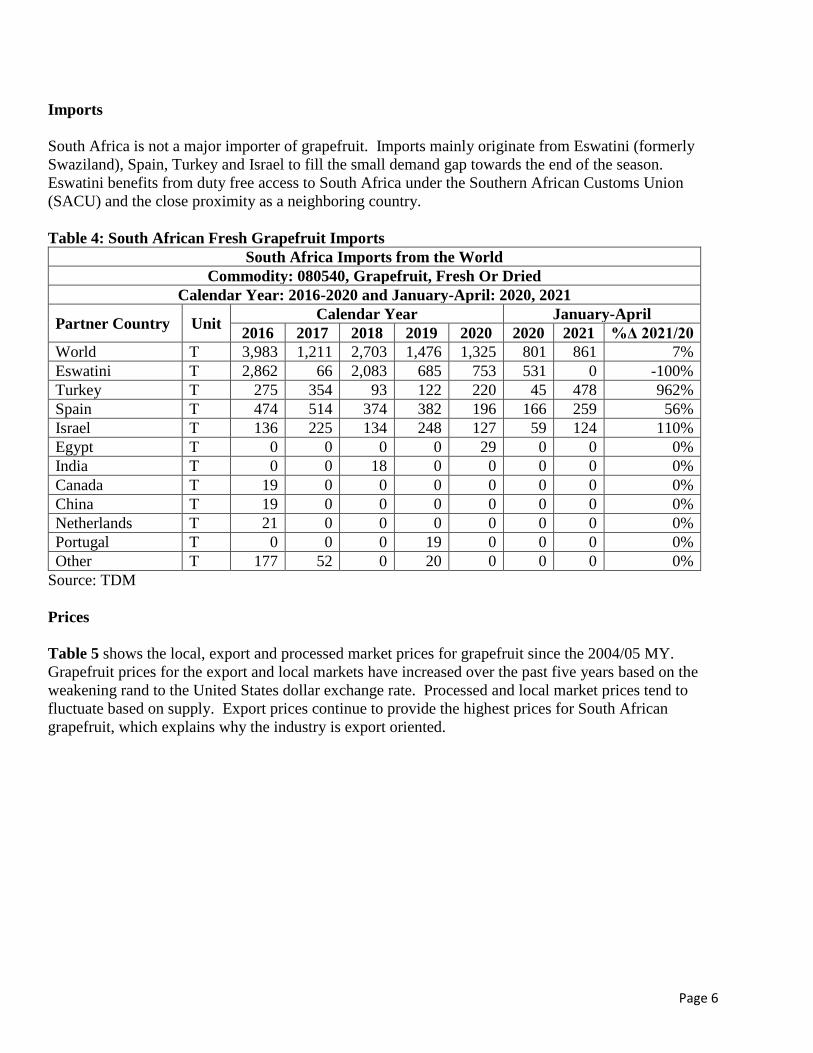
Imports
South Africa is not a major importer of grapefruit. Imports mainly originate from Eswatini (formerly
Swaziland), Spain, Turkey and Israel to fill the small demand gap towards the end of the season.
Eswatini benefits from duty free access to South Africa under the Southern African Customs Union
(SACU) and the close proximity as a neighboring country.
Table 4: South African Fresh Grapefruit Imports
South Africa Imports from the World
Commodity: 080540, Grapefruit, Fresh Or Dried
Calendar Year: 2016-2020 and January-April: 2020, 2021
Partner Country Unit Calendar Year January-April
2016 2017 2018 2019 2020 2020 2021 %Δ 2021/20
World T 3,983 1,211 2,703 1,476 1,325 801 861 7%
Eswatini T 2,862 66 2,083 685 753 531 0 -100%
Turkey T 275 354 93 122 220 45 478 962%
Spain T 474 514 374 382 196 166 259 56%
Israel T 136 225 134 248 127 59 124 110%
Egypt T 0 0 0 0 29 0 0 0%
India T 0 0 18 0 0 0 0 0%
Canada T 19 0 0 0 0 0 0 0%
China T 19 0 0 0 0 0 0 0%
Netherlands T 21 0 0 0 0 0 0 0%
Portugal T 0 0 0 19 0 0 0 0%
Other T 177 52 0 20 0 0 0 0%
Source: TDM
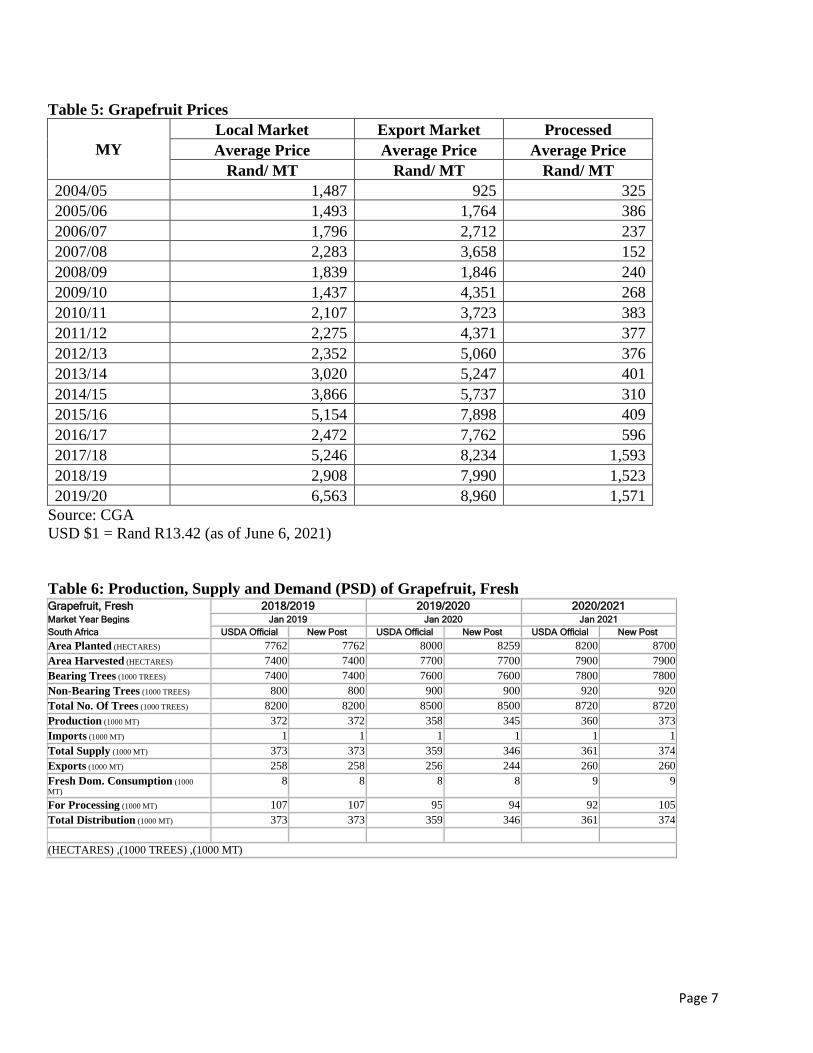
Prices
Table 5 shows the local, export and processed market prices for grapefruit since the 2004/05 MY.
Grapefruit prices for the export and local markets have increased over the past five years based on the
weakening rand to the United States dollar exchange rate. Processed and local market prices tend to
fluctuate based on supply. Export prices continue to provide the highest prices for South African
grapefruit, which explains why the industry is export oriented.
Page 7
Table 5: Grapefruit Prices
MY
Local Market Export Market Processed
Average Price Average Price Average Price
Rand/ MT Rand/ MT Rand/ MT
2004/05 1,487 925 325
2005/06 1,493 1,764 386
2006/07 1,796 2,712 237
2007/08 2,283 3,658 152
2008/09 1,839 1,846 240
2009/10 1,437 4,351 268
2010/11 2,107 3,723 383
2011/12 2,275 4,371 377
2012/13 2,352 5,060 376
2013/14 3,020 5,247 401
2014/15 3,866 5,737 310
2015/16 5,154 7,898 409
2016/17 2,472 7,762 596
2017/18 5,246 8,234 1,593
2018/19 2,908 7,990 1,523
2019/20 6,563 8,960 1,571
Source: CGA
USD $1 = Rand R13.42 (as of June 6, 2021)
Table 6: Production, Supply and Demand (PSD) of Grapefruit, Fresh Grapefruit, Fresh 2018/2019 2019/2020 2020/2021 Market Year Begins Jan 2019 Jan 2020 Jan 2021
South Africa USDA Official New Post USDA Official New Post USDA Official New Post
Area Planted (HECTARES) 7762 7762 8000 8259 8200 8700
Area Harvested (HECTARES) 7400 7400 7700 7700 7900 7900
Bearing Trees (1000 TREES) 7400 7400 7600 7600 7800 7800
Non-Bearing Trees (1000 TREES) 800 800 900 900 920 920
Total No. Of Trees (1000 TREES) 8200 8200 8500 8500 8720 8720
Production (1000 MT) 372 372 358 345 360 373
Imports (1000 MT) 1 1 1 1 1 1
Total Supply (1000 MT) 373 373 359 346 361 374
Exports (1000 MT) 258 258 256 244 260 260
Fresh Dom. Consumption (1000
MT) 8 8 8 8 9 9
For Processing (1000 MT) 107 107 95 94 92 105
Total Distribution (1000 MT) 373 373 359 346 361 374
(HECTARES) ,(1000 TREES) ,(1000 MT)
Page 8
Oranges, Fresh
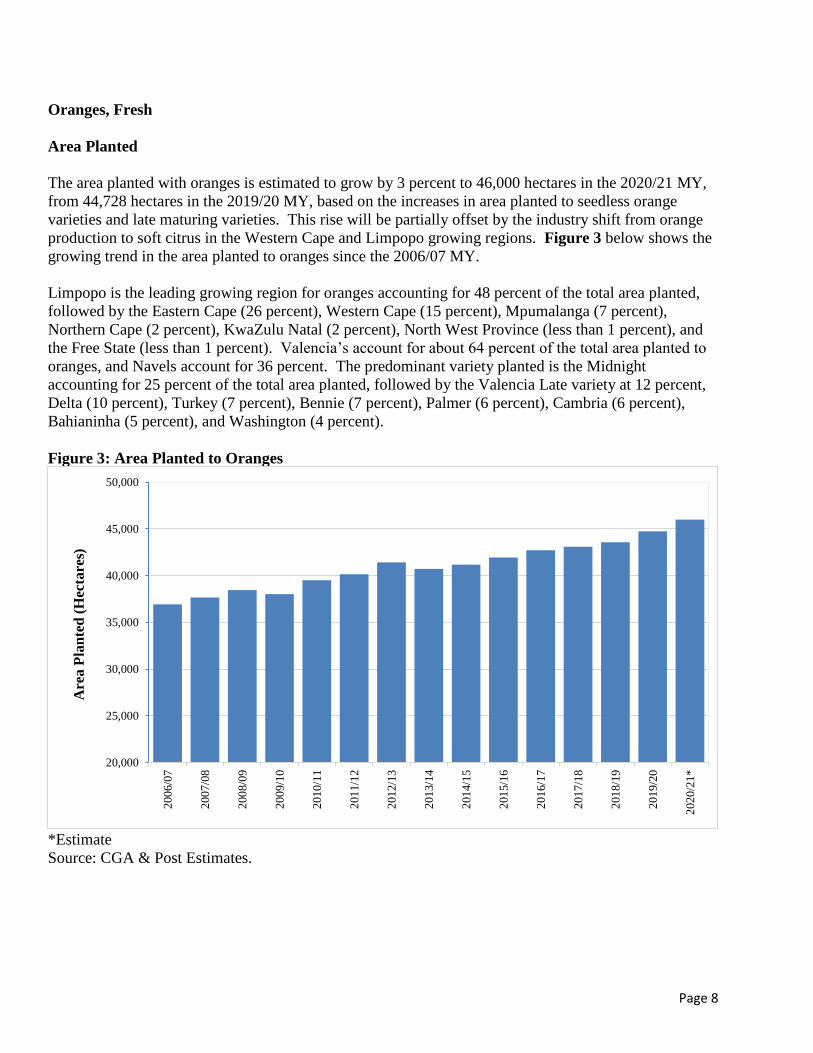
Area Planted
The area planted with oranges is estimated to grow by 3 percent to 46,000 hectares in the 2020/21 MY,
from 44,728 hectares in the 2019/20 MY, based on the increases in area planted to seedless orange
varieties and late maturing varieties. This rise will be partially offset by the industry shift from orange
production to soft citrus in the Western Cape and Limpopo growing regions. Figure 3 below shows the
growing trend in the area planted to oranges since the 2006/07 MY.
Limpopo is the leading growing region for oranges accounting for 48 percent of the total area planted,
followed by the Eastern Cape (26 percent), Western Cape (15 percent), Mpumalanga (7 percent),
Northern Cape (2 percent), KwaZulu Natal (2 percent), North West Province (less than 1 percent), and
the Free State (less than 1 percent). Valencia’s account for about 64 percent of the total area planted to
oranges, and Navels account for 36 percent. The predominant variety planted is the Midnight
accounting for 25 percent of the total area planted, followed by the Valencia Late variety at 12 percent,
Delta (10 percent), Turkey (7 percent), Bennie (7 percent), Palmer (6 percent), Cambria (6 percent),
Bahianinha (5 percent), and Washington (4 percent).
Figure 3: Area Planted to Oranges
*Estimate
Source: CGA & Post Estimates.
20,000
25,000
30,000
35,000
40,000
45,000
50,000
200
6/0
7
200
7/0
8
200
8/0
9
200
9/1
0
201
0/1
1
201
1/1
2
201
2/1
3
201
3/1
4
201
4/1
5
201
5/1
6
201
6/1
7
201
7/1
8
201
8/1
9
201
9/2
0
202
0/2
1*
Are
a P
lan
ted
(Hec
tare
s)
Page 9
Production
The production of oranges is estimated to increase by 2 percent to 1.65 million MT in the 2020/21 MY,
from 1.62 million MT in the 2019/20 MY. This increase is based on normal weather conditions, good
rainfall in the main growing regions, the rise in area planted, better water management techniques by
farmers, and new plantings of high yielding and late maturing varieties. However, this increase will be
partially offset by small fruit sizes in some production areas in the Eastern Cape due to drought
conditions; and hail damage in some growing regions in the Mpumalanga Province. The drought in the
Eastern Cape only affected growers who rely on the Gamtoos river system and the Kouga Dam, which
accounts for an estimated 30 percent of the production in the Eastern Cape. Oranges are normally
harvested between March and September, and the impact of COVID-19 on production, harvest and labor
has been minimal to date.
Consumption
Post estimates that the consumption of oranges will increase by 3 percent to 82,000 MT in the 2020/21
MY, from 80,000 MT in the 2019/20 MY, based on the rise in production and increase in demand due to
the associated benefits of Vitamin C in boosting immunity against COVID-19. South Africa prioritizes
supplying export markets, and the surplus oranges or those that do not meet the export standards are
supplied to the fresh domestic and processed markets. Fresh oranges are the most popular citrus
consumed in South Africa with a per capita consumption of about 1.5 kg per annum.
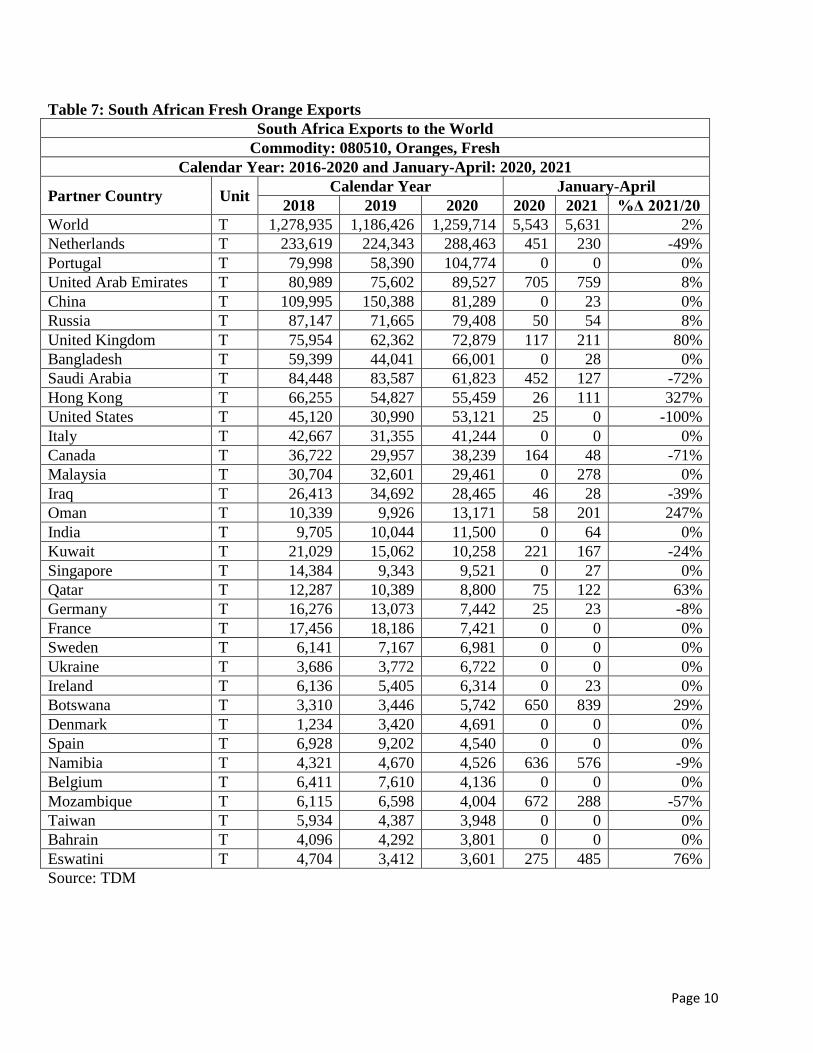
Exports
The export of oranges is estimated to rise by 3 percent to 1.29 million MT in the 2020/21 MY, from 1.26
million MT in the 2019/20 MY, based on the increase in production, continued spike in demand due to
the assumed benefits of Vitamin C in boosting immunity against COVID-19, and the pace of exports up
to April 2021. The growth in exports and the continued rise in citrus production resulted in the world
largest specialized reefer vessel (“the Cool Eagle”) being used in South Africa in 2021.
The EU remains South Africa’s largest export market for oranges, accounting for 44 percent of the total
export market. However, exports to Asia and the Middle East have grown steadily over the years due to
the industry’s focus on growing these markets.
Exports to the United States are expected to continue based on the duty free access under the African
Growth and Opportunity Act (AGOA). However, a gradual shift from oranges to easy peelers and soft
citrus exports is expected over time, as South African farmers supplying the U.S. market have been re-
planting their orchards from oranges to soft citrus and new orange varieties in response to market
preferences and the higher premium received in the U.S. market. Exports to the United States decreased
in 2019, due to the shift from oranges to soft citrus and small fruit sizes. However, orange exports to the
United States increased by 71 percent to 53,121 MT in the 2020, based on the record breaking
production in South Africa.
Page 10
Table 7: South African Fresh Orange Exports
South Africa Exports to the World
Commodity: 080510, Oranges, Fresh
Calendar Year: 2016-2020 and January-April: 2020, 2021
Partner Country Unit Calendar Year January-April
2018 2019 2020 2020 2021 %Δ 2021/20
World T 1,278,935 1,186,426 1,259,714 5,543 5,631 2%
Netherlands T 233,619 224,343 288,463 451 230 -49%
Portugal T 79,998 58,390 104,774 0 0 0%
United Arab Emirates T 80,989 75,602 89,527 705 759 8%
China T 109,995 150,388 81,289 0 23 0%
Russia T 87,147 71,665 79,408 50 54 8%
United Kingdom T 75,954 62,362 72,879 117 211 80%
Bangladesh T 59,399 44,041 66,001 0 28 0%
Saudi Arabia T 84,448 83,587 61,823 452 127 -72%
Hong Kong T 66,255 54,827 55,459 26 111 327%
United States T 45,120 30,990 53,121 25 0 -100%
Italy T 42,667 31,355 41,244 0 0 0%
Canada T 36,722 29,957 38,239 164 48 -71%
Malaysia T 30,704 32,601 29,461 0 278 0%
Iraq T 26,413 34,692 28,465 46 28 -39%
Oman T 10,339 9,926 13,171 58 201 247%
India T 9,705 10,044 11,500 0 64 0%
Kuwait T 21,029 15,062 10,258 221 167 -24%
Singapore T 14,384 9,343 9,521 0 27 0%
Qatar T 12,287 10,389 8,800 75 122 63%
Germany T 16,276 13,073 7,442 25 23 -8%
France T 17,456 18,186 7,421 0 0 0%
Sweden T 6,141 7,167 6,981 0 0 0%
Ukraine T 3,686 3,772 6,722 0 0 0%
Ireland T 6,136 5,405 6,314 0 23 0%
Botswana T 3,310 3,446 5,742 650 839 29%
Denmark T 1,234 3,420 4,691 0 0 0%
Spain T 6,928 9,202 4,540 0 0 0%
Namibia T 4,321 4,670 4,526 636 576 -9%
Belgium T 6,411 7,610 4,136 0 0 0%
Mozambique T 6,115 6,598 4,004 672 288 -57%
Taiwan T 5,934 4,387 3,948 0 0 0%
Bahrain T 4,096 4,292 3,801 0 0 0%
Eswatini T 4,704 3,412 3,601 275 485 76%
Source: TDM
Page 11
Imports
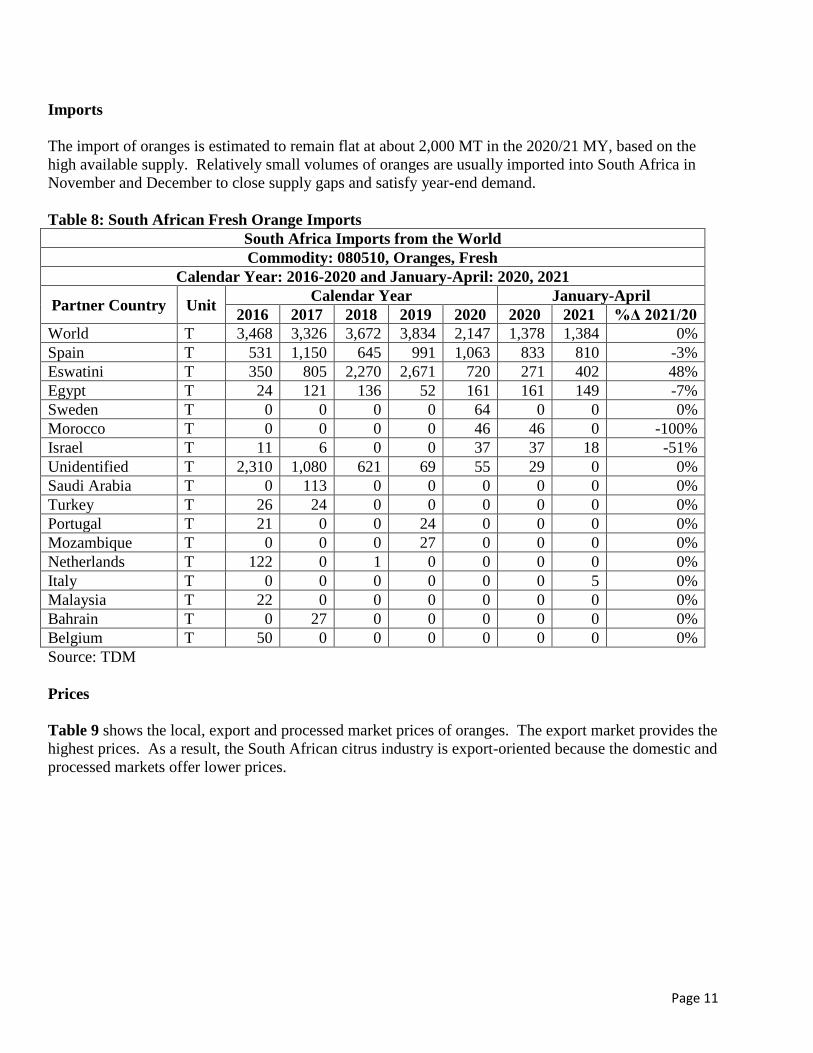
The import of oranges is estimated to remain flat at about 2,000 MT in the 2020/21 MY, based on the
high available supply. Relatively small volumes of oranges are usually imported into South Africa in
November and December to close supply gaps and satisfy year-end demand.
Table 8: South African Fresh Orange Imports
South Africa Imports from the World
Commodity: 080510, Oranges, Fresh
Calendar Year: 2016-2020 and January-April: 2020, 2021
Partner Country Unit Calendar Year January-April
2016 2017 2018 2019 2020 2020 2021 %Δ 2021/20
World T 3,468 3,326 3,672 3,834 2,147 1,378 1,384 0%
Spain T 531 1,150 645 991 1,063 833 810 -3%
Eswatini T 350 805 2,270 2,671 720 271 402 48%
Egypt T 24 121 136 52 161 161 149 -7%
Sweden T 0 0 0 0 64 0 0 0%
Morocco T 0 0 0 0 46 46 0 -100%
Israel T 11 6 0 0 37 37 18 -51%
Unidentified T 2,310 1,080 621 69 55 29 0 0%
Saudi Arabia T 0 113 0 0 0 0 0 0%
Turkey T 26 24 0 0 0 0 0 0%
Portugal T 21 0 0 24 0 0 0 0%
Mozambique T 0 0 0 27 0 0 0 0%
Netherlands T 122 0 1 0 0 0 0 0%
Italy T 0 0 0 0 0 0 5 0%
Malaysia T 22 0 0 0 0 0 0 0%
Bahrain T 0 27 0 0 0 0 0 0%
Belgium T 50 0 0 0 0 0 0 0%
Source: TDM
Prices
Table 9 shows the local, export and processed market prices of oranges. The export market provides the
highest prices. As a result, the South African citrus industry is export-oriented because the domestic and
processed markets offer lower prices.

Page 12
Table 9: Oranges Prices
MY
Local Market Export Market Processed
Average Price Average Price Average Price
Rand/ MT Rand/ MT Rand/ MT
2003/04 1,090 2,425 274
2004/05 1,111 1,580 229
2005/06 1,025 1,843 301
2006/07 1,278 2,832 354
2007/08 1,430 3,443 419
2008/09 1,483 3,235 268
2009/10 1,599 4,043 349
2010/11 1,762 4,691 529
2011/12 1,895 4,318 564
2012/13 2,054 4,975 591
2013/14 2,230 5,781 618
2014/15 2,535 6,576 652
2015/16 3,799 8,570 1,002
2016/17 3,604 8,656 1,069
2017/18 3,361 8,600 693
2018/19 3,643 8,268 699
2019/20 4,897 10,329 519
Source: CGA
Table 10: PSD for Oranges, Fresh Oranges, Fresh 2018/2019 2019/2020 2020/2021 Market Year Begins Jan 2019 Jan 2020 Jan 2021
South Africa USDA Official New Post USDA Official New Post USDA Official New Post
Area Planted (HECTARES) 43578 43578 44500 44728 46000 46000
Area Harvested (HECTARES) 39600 39600 40500 40500 41000 41000
Bearing Trees (1000 TREES) 39000 39000 39500 39500 40000 40000
Non-Bearing Trees (1000 TREES) 4200 4200 4300 4300 4400 4400
Total No. Of Trees (1000 TREES) 43200 43200 43800 43800 44400 44400
Production (1000 MT) 1590 1590 1650 1620 1700 1650
Imports (1000 MT) 4 4 2 2 2 2
Total Supply (1000 MT) 1594 1594 1652 1622 1702 1652
Exports (1000 MT) 1186 1186 1292 1260 1320 1285
Fresh Dom. Consumption (1000
MT) 75 75 78 80 80 82
For Processing (1000 MT) 333 333 282 282 302 285
Total Distribution (1000 MT) 1594 1594 1652 1622 1702 1652
(HECTARES) ,(1000 TREES) ,(1000 MT)
Page 13
Tangerines/Mandarins (Soft Citrus), Fresh
Area Planted
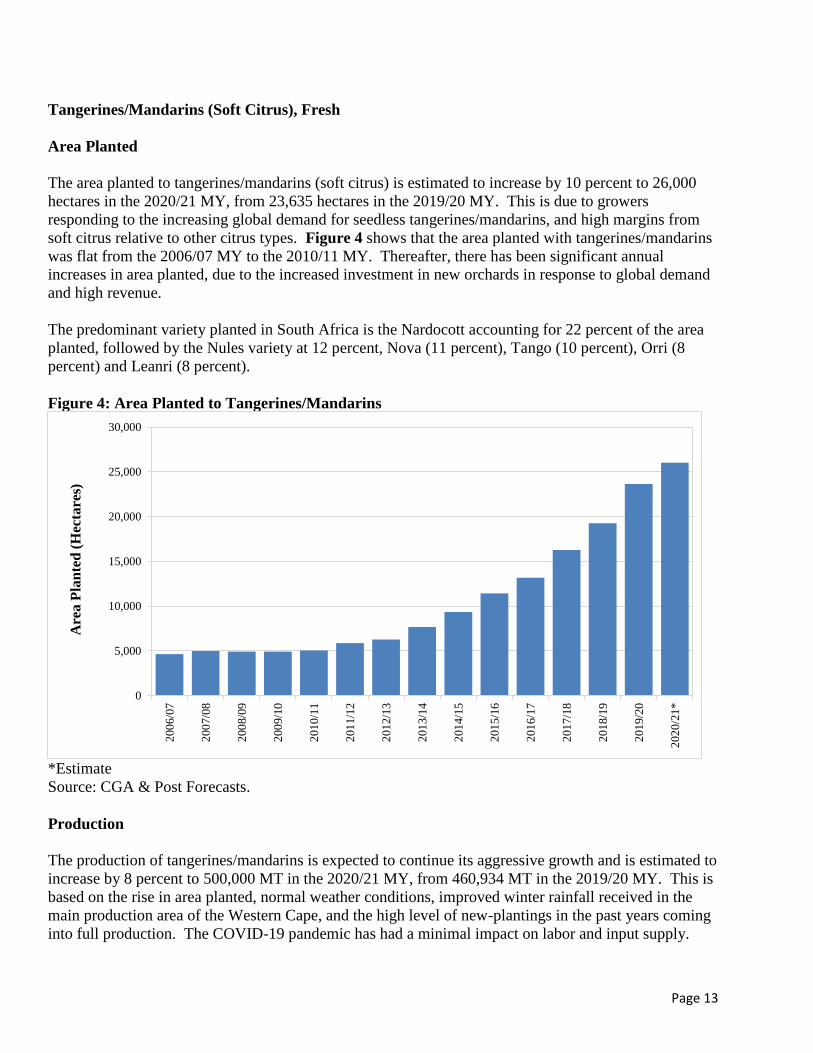
The area planted to tangerines/mandarins (soft citrus) is estimated to increase by 10 percent to 26,000
hectares in the 2020/21 MY, from 23,635 hectares in the 2019/20 MY. This is due to growers
responding to the increasing global demand for seedless tangerines/mandarins, and high margins from
soft citrus relative to other citrus types. Figure 4 shows that the area planted with tangerines/mandarins
was flat from the 2006/07 MY to the 2010/11 MY. Thereafter, there has been significant annual
increases in area planted, due to the increased investment in new orchards in response to global demand
and high revenue.
The predominant variety planted in South Africa is the Nardocott accounting for 22 percent of the area
planted, followed by the Nules variety at 12 percent, Nova (11 percent), Tango (10 percent), Orri (8
percent) and Leanri (8 percent).
Figure 4: Area Planted to Tangerines/Mandarins
*Estimate
Source: CGA & Post Forecasts.
Production
The production of tangerines/mandarins is expected to continue its aggressive growth and is estimated to
increase by 8 percent to 500,000 MT in the 2020/21 MY, from 460,934 MT in the 2019/20 MY. This is
based on the rise in area planted, normal weather conditions, improved winter rainfall received in the
main production area of the Western Cape, and the high level of new-plantings in the past years coming
into full production. The COVID-19 pandemic has had a minimal impact on labor and input supply.
0
5,000
10,000
15,000
20,000
25,000
30,000
200
6/0
7
200
7/0
8
200
8/0
9
200
9/1
0
201
0/1
1
201
1/1
2
201
2/1
3
201
3/1
4
201
4/1
5
201
5/1
6
201
6/1
7
201
7/1
8
201
8/1
9
201
9/2
0
202
0/2
1*
Are
a P
lan
ted
(H
ecta
res)
Page 14
There is a growing trend of farmers aggressively establishing new orchards under netting which has
improved the water efficiency, yields and the overall quality of soft citrus production in South Africa.
In addition, there is an increasing trend of late varieties being planted, which has seen the peak harvest
of soft citrus shift from week 20 (Beginning of May) to between weeks 21 to 30 (Mid-May to July).
About 37 percent of tangerines/mandarins are produced in the Western Cape, followed by 27 percent in
the Eastern Cape and 26 percent in Limpopo. The Western Cape is a winter rainfall region, and the
2020 winter rainfall will only be used for irrigation in the following year in 2021. Improved dam levels
in the Western Cape in 2019 had a positive impact to the 2019/20 MY crop.
Consumption
The consumption of tangerines/mandarins is estimated to increase by 7 percent to 29,000 MT in the
2020/21 MY, from 27,000 MT in the 2019/20 MY, due to the increase in production and a surge in
demand driven by the associated health benefits of citrus in boosting immunity and to fight COVID-19.
The industry prioritizes export markets for soft citrus and only supplies surplus fruit to the local market.
However, some high end retail chains such as Woolworths also sell some export grade citrus to the
domestic consumers.
Exports
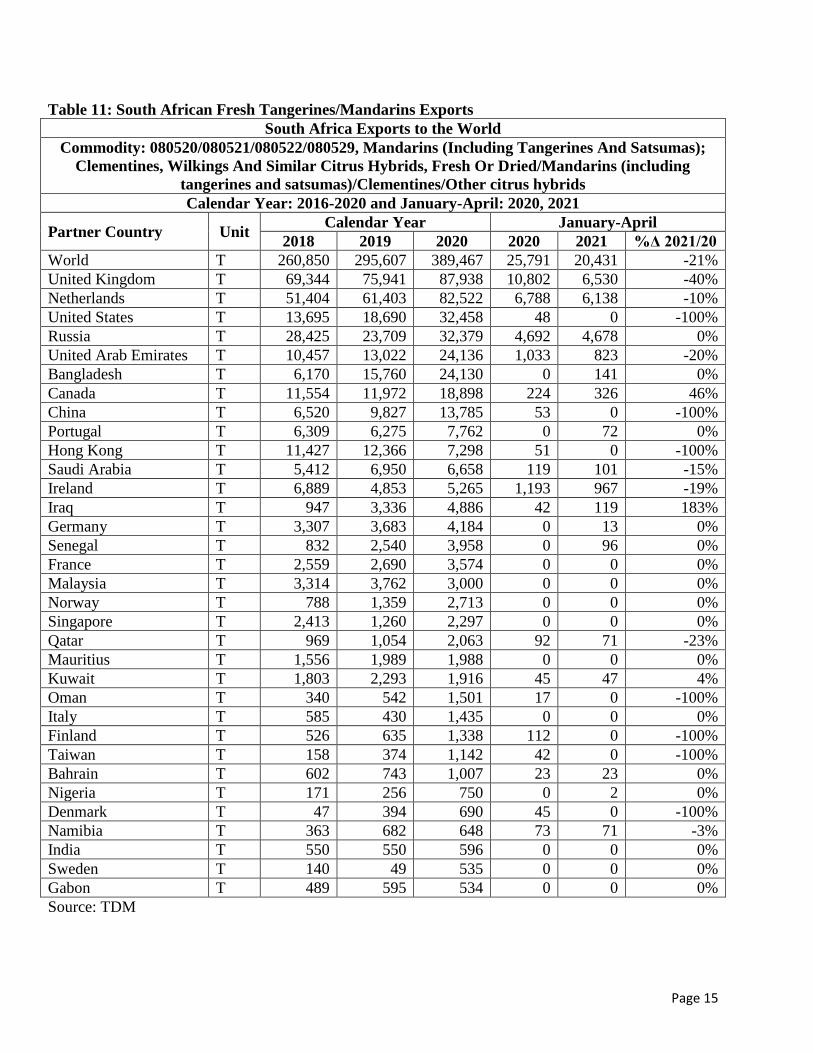
The export of tangerines/mandarins is estimated to increase by 7 percent to 415,000 MT in the 2020/21
MY, from 389,467 MT in the 2019/20 MY, based on the increase in production, the industry strategy of
prioritizing export markets over domestic markets, a surge in demand due to the assumed benefits of
Vitamin C in boosting immunity against COVID-19, and pace of exports up to April 2021.
Demand for tangerines/mandarins remains strong in the export markets, with the United Kingdom as the
leading export market accounting for 23 percent of the total exports, followed by the Netherlands (21
percent), United States (8 percent), Russia (8 percent) and the United Arab Emirates (6 percent).
Tangerines/mandarins exports are not impacted by South Africa’s CBS challenges in the EU market.
Exports to the United States under the AGOA have grown by an average of 35 percent per year over the
past four seasons, from 7,444 MT in the 2013/14 MY, to 32,458 MT in the 2019/20 MY. This growth
trend is expected to continue based on the rising U.S. market preference for easy peelers, and continued
duty free market access under AGOA.
Page 15
Table 11: South African Fresh Tangerines/Mandarins Exports
South Africa Exports to the World
Commodity: 080520/080521/080522/080529, Mandarins (Including Tangerines And Satsumas);
Clementines, Wilkings And Similar Citrus Hybrids, Fresh Or Dried/Mandarins (including
tangerines and satsumas)/Clementines/Other citrus hybrids
Calendar Year: 2016-2020 and January-April: 2020, 2021
Partner Country Unit Calendar Year January-April
2018 2019 2020 2020 2021 %Δ 2021/20
World T 260,850 295,607 389,467 25,791 20,431 -21%
United Kingdom T 69,344 75,941 87,938 10,802 6,530 -40%
Netherlands T 51,404 61,403 82,522 6,788 6,138 -10%
United States T 13,695 18,690 32,458 48 0 -100%
Russia T 28,425 23,709 32,379 4,692 4,678 0%
United Arab Emirates T 10,457 13,022 24,136 1,033 823 -20%
Bangladesh T 6,170 15,760 24,130 0 141 0%
Canada T 11,554 11,972 18,898 224 326 46%
China T 6,520 9,827 13,785 53 0 -100%
Portugal T 6,309 6,275 7,762 0 72 0%
Hong Kong T 11,427 12,366 7,298 51 0 -100%
Saudi Arabia T 5,412 6,950 6,658 119 101 -15%
Ireland T 6,889 4,853 5,265 1,193 967 -19%
Iraq T 947 3,336 4,886 42 119 183%
Germany T 3,307 3,683 4,184 0 13 0%
Senegal T 832 2,540 3,958 0 96 0%
France T 2,559 2,690 3,574 0 0 0%
Malaysia T 3,314 3,762 3,000 0 0 0%
Norway T 788 1,359 2,713 0 0 0%
Singapore T 2,413 1,260 2,297 0 0 0%
Qatar T 969 1,054 2,063 92 71 -23%
Mauritius T 1,556 1,989 1,988 0 0 0%
Kuwait T 1,803 2,293 1,916 45 47 4%
Oman T 340 542 1,501 17 0 -100%
Italy T 585 430 1,435 0 0 0%
Finland T 526 635 1,338 112 0 -100%
Taiwan T 158 374 1,142 42 0 -100%
Bahrain T 602 743 1,007 23 23 0%
Nigeria T 171 256 750 0 2 0%
Denmark T 47 394 690 45 0 -100%
Namibia T 363 682 648 73 71 -3%
India T 550 550 596 0 0 0%
Sweden T 140 49 535 0 0 0%
Gabon T 489 595 534 0 0 0%
Source: TDM
Page 16
Imports
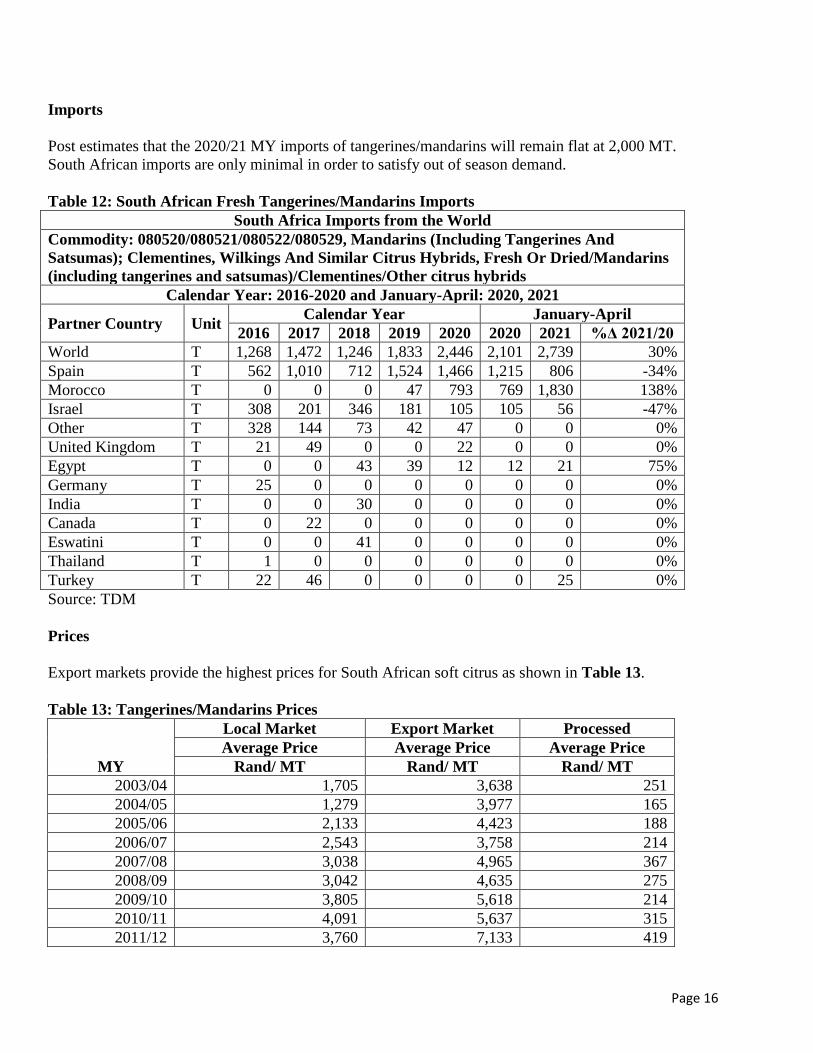
Post estimates that the 2020/21 MY imports of tangerines/mandarins will remain flat at 2,000 MT.
South African imports are only minimal in order to satisfy out of season demand.
Table 12: South African Fresh Tangerines/Mandarins Imports
South Africa Imports from the World
Commodity: 080520/080521/080522/080529, Mandarins (Including Tangerines And
Satsumas); Clementines, Wilkings And Similar Citrus Hybrids, Fresh Or Dried/Mandarins
(including tangerines and satsumas)/Clementines/Other citrus hybrids
Calendar Year: 2016-2020 and January-April: 2020, 2021
Partner Country Unit Calendar Year January-April
2016 2017 2018 2019 2020 2020 2021 %Δ 2021/20
World T 1,268 1,472 1,246 1,833 2,446 2,101 2,739 30%
Spain T 562 1,010 712 1,524 1,466 1,215 806 -34%
Morocco T 0 0 0 47 793 769 1,830 138%
Israel T 308 201 346 181 105 105 56 -47%
Other T 328 144 73 42 47 0 0 0%
United Kingdom T 21 49 0 0 22 0 0 0%
Egypt T 0 0 43 39 12 12 21 75%
Germany T 25 0 0 0 0 0 0 0%
India T 0 0 30 0 0 0 0 0%
Canada T 0 22 0 0 0 0 0 0%
Eswatini T 0 0 41 0 0 0 0 0%
Thailand T 1 0 0 0 0 0 0 0%
Turkey T 22 46 0 0 0 0 25 0%
Source: TDM
Prices
Export markets provide the highest prices for South African soft citrus as shown in Table 13.
Table 13: Tangerines/Mandarins Prices
MY
Local Market Export Market Processed
Average Price Average Price Average Price
Rand/ MT Rand/ MT Rand/ MT
2003/04 1,705 3,638 251
2004/05 1,279 3,977 165
2005/06 2,133 4,423 188
2006/07 2,543 3,758 214
2007/08 3,038 4,965 367
2008/09 3,042 4,635 275
2009/10 3,805 5,618 214
2010/11 4,091 5,637 315
2011/12 3,760 7,133 419
Page 17
2012/13 5,159 8,542 334
2013/14 5,442 10,004 465
2014/15 5,606 11,392 391
2015/16 6,785 14,242 532
2016/17 6,037 13,489 614
2017/18 6,617 13,498 709
2018/19 5,586 13,344 502
2019/20 6,866 16,387 280
Source: CGA
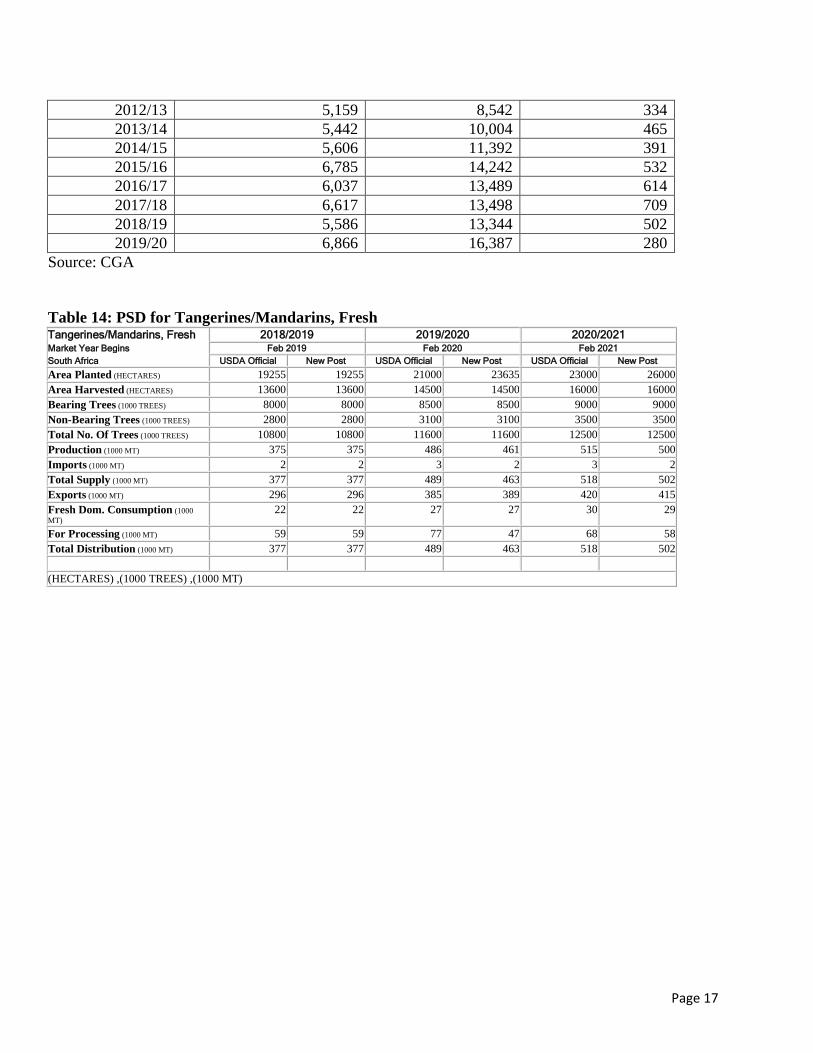
Table 14: PSD for Tangerines/Mandarins, Fresh Tangerines/Mandarins, Fresh 2018/2019 2019/2020 2020/2021 Market Year Begins Feb 2019 Feb 2020 Feb 2021
South Africa USDA Official New Post USDA Official New Post USDA Official New Post
Area Planted (HECTARES) 19255 19255 21000 23635 23000 26000
Area Harvested (HECTARES) 13600 13600 14500 14500 16000 16000
Bearing Trees (1000 TREES) 8000 8000 8500 8500 9000 9000
Non-Bearing Trees (1000 TREES) 2800 2800 3100 3100 3500 3500
Total No. Of Trees (1000 TREES) 10800 10800 11600 11600 12500 12500
Production (1000 MT) 375 375 486 461 515 500
Imports (1000 MT) 2 2 3 2 3 2
Total Supply (1000 MT) 377 377 489 463 518 502
Exports (1000 MT) 296 296 385 389 420 415
Fresh Dom. Consumption (1000
MT) 22 22 27 27 30 29
For Processing (1000 MT) 59 59 77 47 68 58
Total Distribution (1000 MT) 377 377 489 463 518 502
(HECTARES) ,(1000 TREES) ,(1000 MT)
Page 18
Lemons/Limes, Fresh
Area Planted
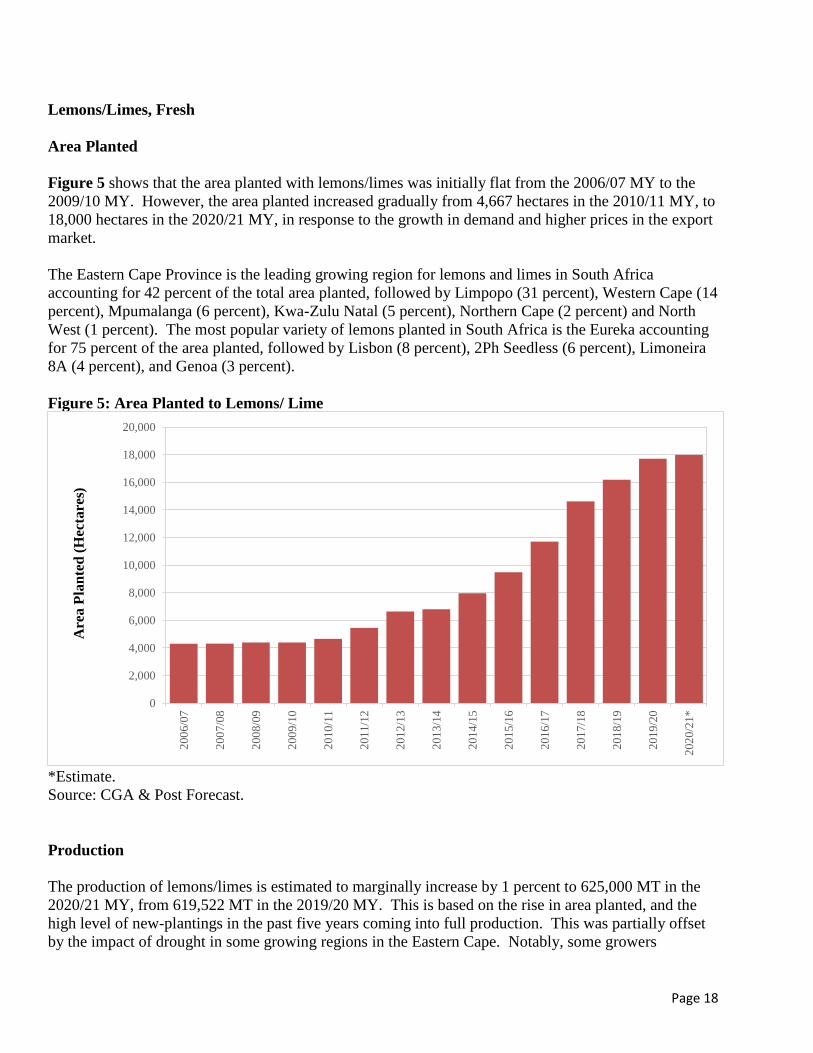
Figure 5 shows that the area planted with lemons/limes was initially flat from the 2006/07 MY to the
2009/10 MY. However, the area planted increased gradually from 4,667 hectares in the 2010/11 MY, to
18,000 hectares in the 2020/21 MY, in response to the growth in demand and higher prices in the export
market.
The Eastern Cape Province is the leading growing region for lemons and limes in South Africa
accounting for 42 percent of the total area planted, followed by Limpopo (31 percent), Western Cape (14
percent), Mpumalanga (6 percent), Kwa-Zulu Natal (5 percent), Northern Cape (2 percent) and North
West (1 percent). The most popular variety of lemons planted in South Africa is the Eureka accounting
for 75 percent of the area planted, followed by Lisbon (8 percent), 2Ph Seedless (6 percent), Limoneira
8A (4 percent), and Genoa (3 percent).
Figure 5: Area Planted to Lemons/ Lime
*Estimate.
Source: CGA & Post Forecast.
Production
The production of lemons/limes is estimated to marginally increase by 1 percent to 625,000 MT in the
2020/21 MY, from 619,522 MT in the 2019/20 MY. This is based on the rise in area planted, and the
high level of new-plantings in the past five years coming into full production. This was partially offset
by the impact of drought in some growing regions in the Eastern Cape. Notably, some growers
0
2,000
4,000
6,000
8,000
10,000
12,000
14,000
16,000
18,000
20,000
200
6/0
7
200
7/0
8
200
8/0
9
200
9/1
0
201
0/1
1
201
1/1
2
201
2/1
3
201
3/1
4
201
4/1
5
201
5/1
6
201
6/1
7
201
7/1
8
201
8/1
9
201
9/2
0
202
0/2
1*
Are
a P
lan
ted
(H
ecta
res)
Page 19
mitigated the impact of the drought by drilling more boreholes. The impact of COVID-19 on production
is expected to be minimal.
Consumption
The domestic consumption of lemons and limes is estimated to increase by 4 percent to 27,000 MT in
the 2020/21 MY, from 26,000 MT in the 2019/20 MY, based on the growth in production, and
increasing demand driven by health conscious consumers.
Processing
Post estimates that lemons and limes delivered for processing will increase by 1 percent to 139,000 MT
in the 2020/21 MY, from 138,000 MT in the 2019/20 MY, based on the increase in production.
Processed lemons and limes are used as flavoring for savory dishes, and food ingredient for
confectionary and dairy products. In the beverage industry lemons/limes are used to make lemonade,
smoothies and liquors. In the cleaning industry, lemon juice is used as a degreaser and disinfectant, due
to its high concentration of citric acid which can inhibit the proliferation of some molds and bacteria.
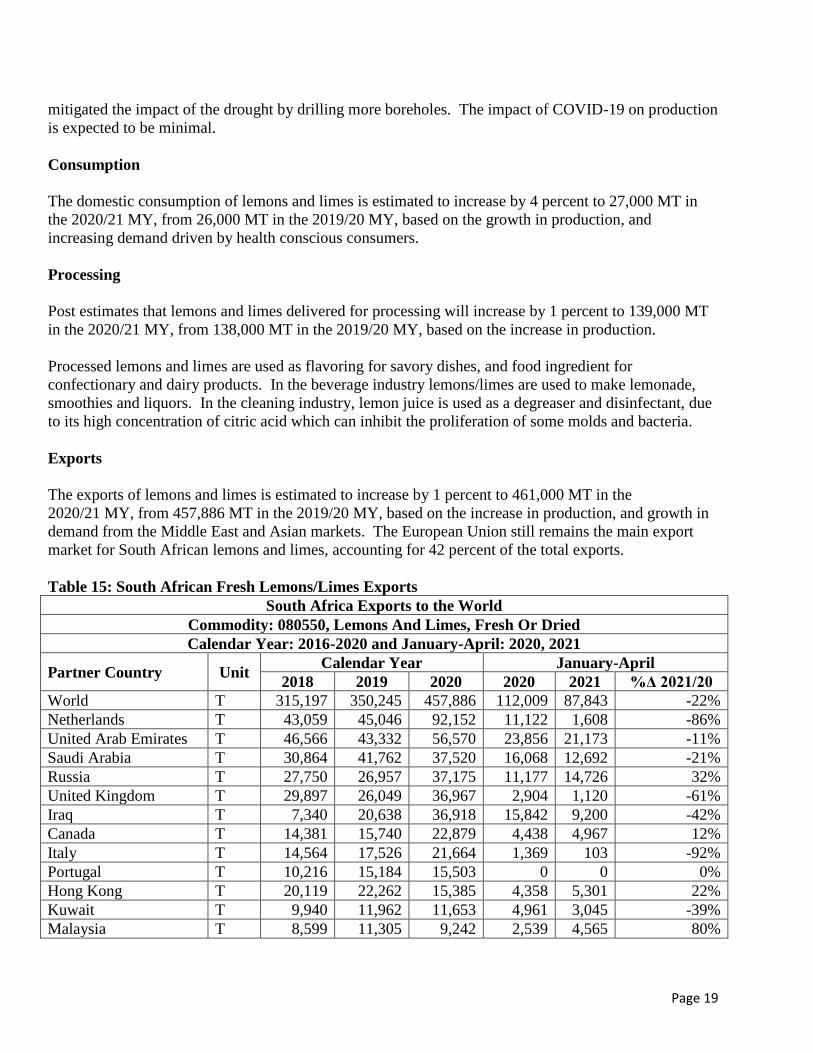
Exports
The exports of lemons and limes is estimated to increase by 1 percent to 461,000 MT in the
2020/21 MY, from 457,886 MT in the 2019/20 MY, based on the increase in production, and growth in
demand from the Middle East and Asian markets. The European Union still remains the main export
market for South African lemons and limes, accounting for 42 percent of the total exports.
Table 15: South African Fresh Lemons/Limes Exports
South Africa Exports to the World
Commodity: 080550, Lemons And Limes, Fresh Or Dried
Calendar Year: 2016-2020 and January-April: 2020, 2021
Partner Country Unit Calendar Year January-April
2018 2019 2020 2020 2021 %Δ 2021/20
World T 315,197 350,245 457,886 112,009 87,843 -22%
Netherlands T 43,059 45,046 92,152 11,122 1,608 -86%
United Arab Emirates T 46,566 43,332 56,570 23,856 21,173 -11%
Saudi Arabia T 30,864 41,762 37,520 16,068 12,692 -21%
Russia T 27,750 26,957 37,175 11,177 14,726 32%
United Kingdom T 29,897 26,049 36,967 2,904 1,120 -61%
Iraq T 7,340 20,638 36,918 15,842 9,200 -42%
Canada T 14,381 15,740 22,879 4,438 4,967 12%
Italy T 14,564 17,526 21,664 1,369 103 -92%
Portugal T 10,216 15,184 15,503 0 0 0%
Hong Kong T 20,119 22,262 15,385 4,358 5,301 22%
Kuwait T 9,940 11,962 11,653 4,961 3,045 -39%
Malaysia T 8,599 11,305 9,242 2,539 4,565 80%
Page 20
Germany T 4,059 6,891 6,593 772 173 -78%
Qatar T 4,097 5,254 6,109 3,352 1,765 -47%
Spain T 1,955 2,094 5,609 0 0 0%
Singapore T 4,632 4,176 5,088 1,072 1,502 40%
Bahrain T 3,298 2,564 3,671 2,001 893 -55%
Ukraine T 1,567 1,334 3,089 1,238 810 -35%
Greece T 2,091 2,255 2,966 297 381 28%
Oman T 3,456 3,243 2,922 1,155 745 -36%
Jordan T 180 684 2,330 396 462 17%
Denmark T 428 811 1,910 202 0 -100%
France T 3,111 1,559 1,877 143 89 -38%
Ireland T 2,404 1,760 1,770 138 124 -10%
Azerbaijan T 1,608 780 1,603 229 77 -66%
Japan T 920 1,050 1,449 0 75 0%
Mauritius T 1,121 1,106 1,256 180 113 -37%
Georgia T 306 722 1,250 344 165 -52%
Namibia T 521 629 1,042 268 228 -15%
Romania T 149 125 1,027 77 125 62%
Nigeria T 322 351 1,003 138 246 78%
Source: TDM
Imports
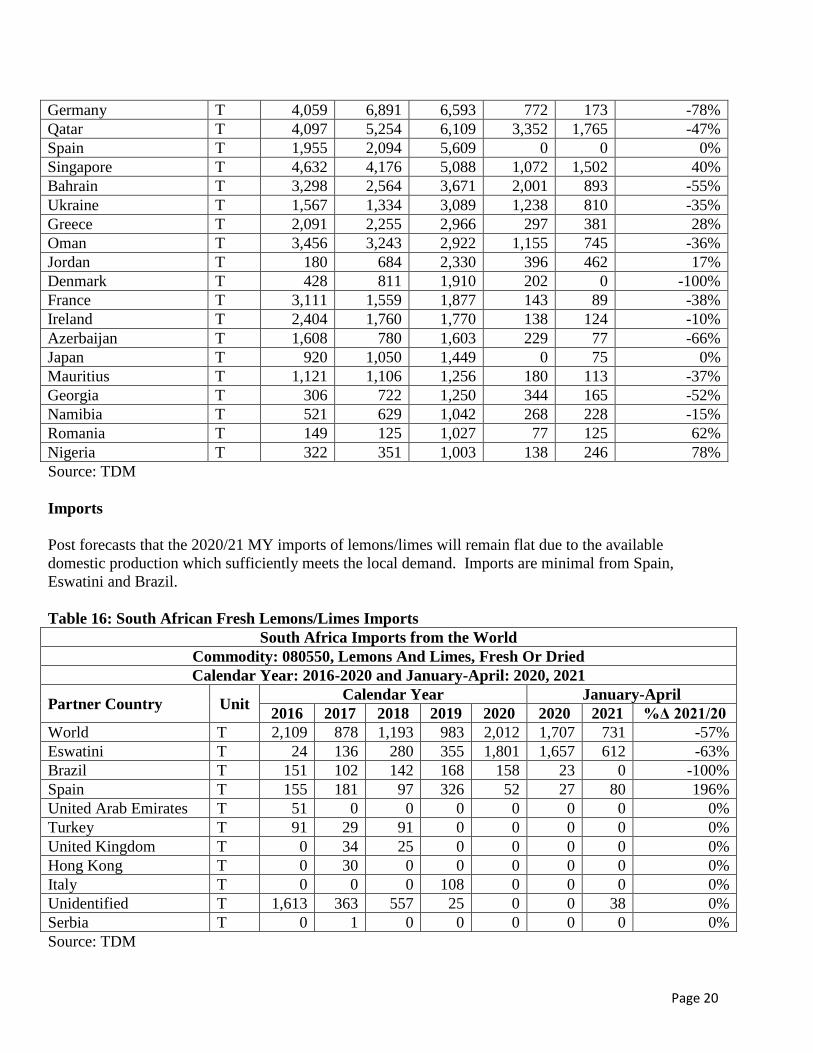
Post forecasts that the 2020/21 MY imports of lemons/limes will remain flat due to the available
domestic production which sufficiently meets the local demand. Imports are minimal from Spain,
Eswatini and Brazil.
Table 16: South African Fresh Lemons/Limes Imports
South Africa Imports from the World
Commodity: 080550, Lemons And Limes, Fresh Or Dried
Calendar Year: 2016-2020 and January-April: 2020, 2021
Partner Country Unit Calendar Year January-April
2016 2017 2018 2019 2020 2020 2021 %Δ 2021/20
World T 2,109 878 1,193 983 2,012 1,707 731 -57%
Eswatini T 24 136 280 355 1,801 1,657 612 -63%
Brazil T 151 102 142 168 158 23 0 -100%
Spain T 155 181 97 326 52 27 80 196%
United Arab Emirates T 51 0 0 0 0 0 0 0%
Turkey T 91 29 91 0 0 0 0 0%
United Kingdom T 0 34 25 0 0 0 0 0%
Hong Kong T 0 30 0 0 0 0 0 0%
Italy T 0 0 0 108 0 0 0 0%
Unidentified T 1,613 363 557 25 0 0 38 0%
Serbia T 0 1 0 0 0 0 0 0%
Source: TDM

Page 21
Prices
Export markets provide the highest prices for South African lemons/limes as shown in Table 17.
Table 17: Lemons/Limes Prices
MY
Local Market Export Market Processed
Average Price Average Price Average Price
Rand/ MT Rand/ MT Rand/ MT
2004/05 1,692 1,476 258
2005/06 1,753 2,478 178
2006/07 2,460 3,238 396
2007/08 3,105 3,961 611
2008/09 3,346 2,120 542
2009/10 3,940 5,329 731
2010/11 3,489 5,426 982
2011/12 4,291 5,426 720
2012/13 5,668 6,994 596
2013/14 6,619 11,058 1,288
2014/15 7,453 12,340 1,378
2015/16 7,697 16,483 1,842
2016/17 7,445 13,289 1,657
2017/18 6,697 11,151 1,463
2018/19 6,494 11,710 2,301
2019/20 5,804 13,570 770
Source: CGA
Table 18: PSD Lemons/Limes, Fresh Lemons/Limes, Fresh 2018/2019 2019/2020 2020/2021 Market Year Begins Jan 2019 Jan 2020 Jan 2021
South Africa USDA Official New Post USDA Official New Post USDA Official New Post
Area Planted (HECTARES) 16190 16190 17400 17707 18000 18000
Area Harvested (HECTARES) 11200 11200 12100 12100 14000 14000
Bearing Trees (1000 TREES) 6700 6700 7100 7100 7500 7500
Non-Bearing Trees (1000 TREES) 2500 2500 2600 2600 2900 2900
Total No. Of Trees (1000 TREES) 9200 9200 9700 9700 10400 10400
Production (1000 MT) 492 492 657 620 670 625
Imports (1000 MT) 1 1 2 2 2 2
Total Supply (1000 MT) 493 493 659 622 672 627
Exports (1000 MT) 350 350 455 458 500 461
Fresh Dom. Consumption (1000
MT) 21 21 26 26 27 27
For Processing (1000 MT) 122 122 178 138 145 139
Total Distribution (1000 MT) 493 493 659 622 672 627
(HECTARES) ,(1000 TREES) ,(1000 MT)
Page 22
Orange Juice
Production
The production of orange juice is estimated to increase by 1 percent to 50,000 MT in the 2020/21 MY,
from 49,494 MT in the 2019/20 MY, based on the increase in the quantity of fresh oranges delivered for
processing. The 2019/20 MY production of orange juice was slightly revised to 49,494 MT, based on
updated volume of oranges delivered for processing.
Concentrated orange juice accounts for at least 90 percent of the total orange juice produced in South
Africa. The South African citrus industry prioritizes the export of fresh citrus, and only processes the
fruit that does not meet export standards.
Industry coordinated statistics for orange juice are largely unavailable in South Africa. The production,
consumption and stock levels represent Post’s estimates based on information derived from various
sources, contacts and calculations of extractions from fresh oranges delivered for processing.
Consumption
The domestic consumption of orange juice is estimated to increase by 10 percent to 11,000 MT in the
2020/21 MY, from 10,000 MT in the 2019/20 MY, based on the increase in production and supply
availability. The relatively high food price inflation has resulted in restricted growth in the domestic
consumption of fresh fruit juices especially the one hundred percent fruit juice, and the shift in demand
to orange juice concentrates.
Export
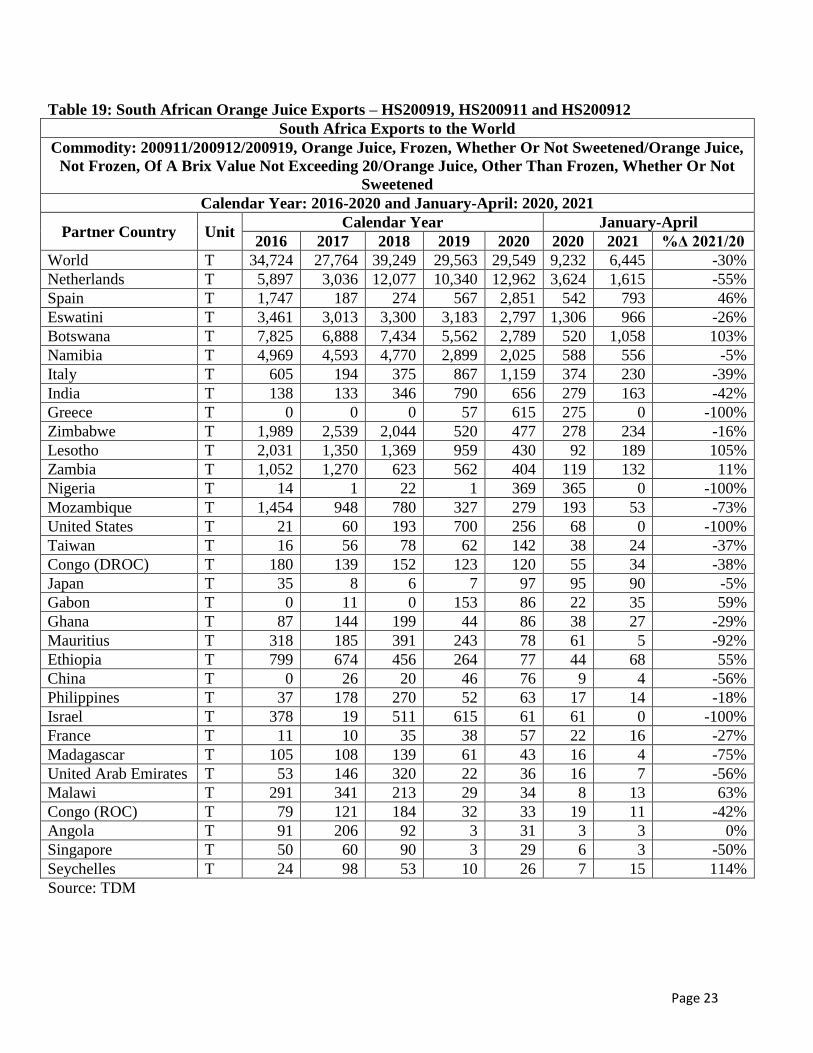
Post estimates that the 2020/21 MY exports of orange juice will increase significantly to 40,000 MT,
from 29,549 MT in the 2019/20 MY, based on the increase in production and pace of exports up to April
2021. The 2019/20 MY exports of orange juice were revised downwards to 29,549 MT, based final
Trade Data Monitor.
Post adjusted all the orange juice export data to the equivalent of 65 Degrees Brix based on the
respective conversion factors shown on the export tables below. The orange juice exports under
HS200919 were converted using a factor of 1.02. The orange juice exports under HS200911 were
converted using a factor of 1.00. The orange juice exports under HS200912 were converted using a
factor of 0.18. Degrees Brix represents the strength of the juice based on the sugar content. Thus, 65
Degrees Brix means that the orange juice has at least 65 grams of sucrose per 100 grams of orange juice.
Producers in South Africa prefer to export fresh oranges rather than to sell to processors as export prices
are at least eight times higher than prices achieved from processors. Netherlands, Botswana,
Mozambique, Mauritius, Namibia, Eswatini, Zambia and Zimbabwe are the biggest markets for South
African orange juice exports.
Page 23
Table 19: South African Orange Juice Exports – HS200919, HS200911 and HS200912
South Africa Exports to the World
Commodity: 200911/200912/200919, Orange Juice, Frozen, Whether Or Not Sweetened/Orange Juice,
Not Frozen, Of A Brix Value Not Exceeding 20/Orange Juice, Other Than Frozen, Whether Or Not
Sweetened
Calendar Year: 2016-2020 and January-April: 2020, 2021
Partner Country Unit Calendar Year January-April
2016 2017 2018 2019 2020 2020 2021 %Δ 2021/20
World T 34,724 27,764 39,249 29,563 29,549 9,232 6,445 -30%
Netherlands T 5,897 3,036 12,077 10,340 12,962 3,624 1,615 -55%
Spain T 1,747 187 274 567 2,851 542 793 46%
Eswatini T 3,461 3,013 3,300 3,183 2,797 1,306 966 -26%
Botswana T 7,825 6,888 7,434 5,562 2,789 520 1,058 103%
Namibia T 4,969 4,593 4,770 2,899 2,025 588 556 -5%
Italy T 605 194 375 867 1,159 374 230 -39%
India T 138 133 346 790 656 279 163 -42%
Greece T 0 0 0 57 615 275 0 -100%
Zimbabwe T 1,989 2,539 2,044 520 477 278 234 -16%
Lesotho T 2,031 1,350 1,369 959 430 92 189 105%
Zambia T 1,052 1,270 623 562 404 119 132 11%
Nigeria T 14 1 22 1 369 365 0 -100%
Mozambique T 1,454 948 780 327 279 193 53 -73%
United States T 21 60 193 700 256 68 0 -100%
Taiwan T 16 56 78 62 142 38 24 -37%
Congo (DROC) T 180 139 152 123 120 55 34 -38%
Japan T 35 8 6 7 97 95 90 -5%
Gabon T 0 11 0 153 86 22 35 59%
Ghana T 87 144 199 44 86 38 27 -29%
Mauritius T 318 185 391 243 78 61 5 -92%
Ethiopia T 799 674 456 264 77 44 68 55%
China T 0 26 20 46 76 9 4 -56%
Philippines T 37 178 270 52 63 17 14 -18%
Israel T 378 19 511 615 61 61 0 -100%
France T 11 10 35 38 57 22 16 -27%
Madagascar T 105 108 139 61 43 16 4 -75%
United Arab Emirates T 53 146 320 22 36 16 7 -56%
Malawi T 291 341 213 29 34 8 13 63%
Congo (ROC) T 79 121 184 32 33 19 11 -42%
Angola T 91 206 92 3 31 3 3 0%
Singapore T 50 60 90 3 29 6 3 -50%
Seychelles T 24 98 53 10 26 7 15 114%
Source: TDM
Page 24
Imports
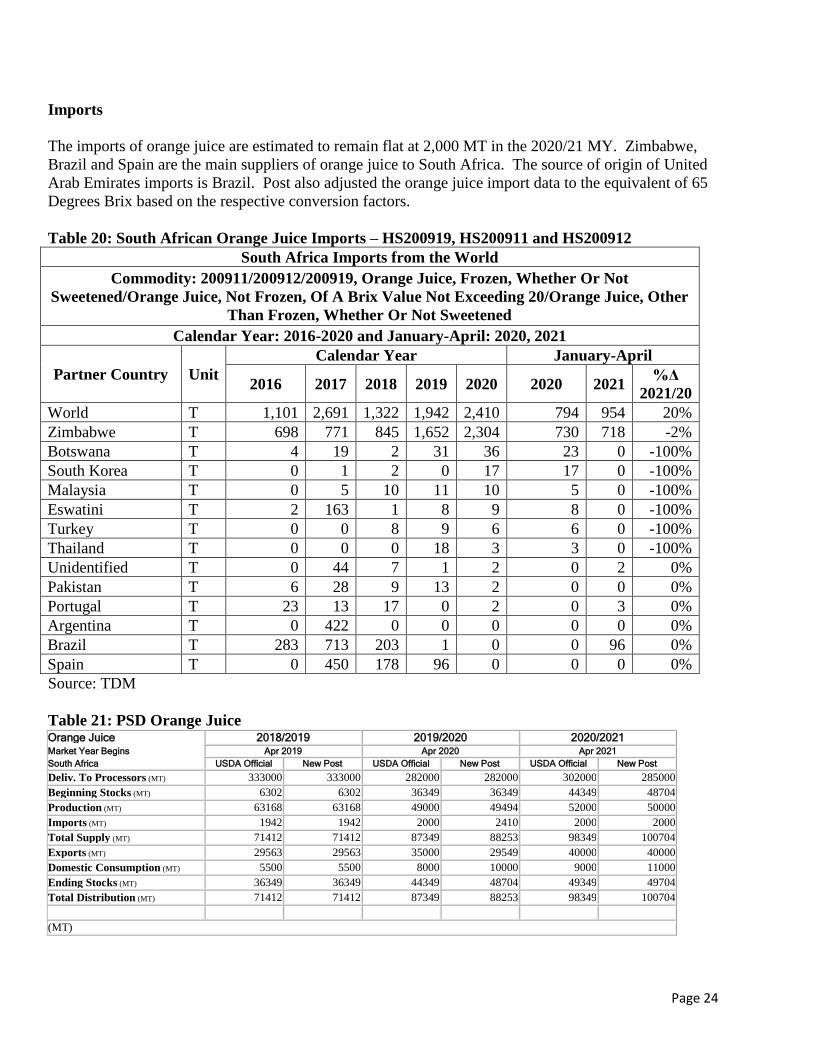
The imports of orange juice are estimated to remain flat at 2,000 MT in the 2020/21 MY. Zimbabwe,
Brazil and Spain are the main suppliers of orange juice to South Africa. The source of origin of United
Arab Emirates imports is Brazil. Post also adjusted the orange juice import data to the equivalent of 65
Degrees Brix based on the respective conversion factors.
Table 20: South African Orange Juice Imports – HS200919, HS200911 and HS200912
South Africa Imports from the World
Commodity: 200911/200912/200919, Orange Juice, Frozen, Whether Or Not
Sweetened/Orange Juice, Not Frozen, Of A Brix Value Not Exceeding 20/Orange Juice, Other
Than Frozen, Whether Or Not Sweetened
Calendar Year: 2016-2020 and January-April: 2020, 2021
Partner Country Unit
Calendar Year January-April
2016 2017 2018 2019 2020 2020 2021 %Δ
2021/20
World T 1,101 2,691 1,322 1,942 2,410 794 954 20%
Zimbabwe T 698 771 845 1,652 2,304 730 718 -2%
Botswana T 4 19 2 31 36 23 0 -100%
South Korea T 0 1 2 0 17 17 0 -100%
Malaysia T 0 5 10 11 10 5 0 -100%
Eswatini T 2 163 1 8 9 8 0 -100%
Turkey T 0 0 8 9 6 6 0 -100%
Thailand T 0 0 0 18 3 3 0 -100%
Unidentified T 0 44 7 1 2 0 2 0%
Pakistan T 6 28 9 13 2 0 0 0%
Portugal T 23 13 17 0 2 0 3 0%
Argentina T 0 422 0 0 0 0 0 0%
Brazil T 283 713 203 1 0 0 96 0%
Spain T 0 450 178 96 0 0 0 0%
Source: TDM
Table 21: PSD Orange Juice Orange Juice 2018/2019 2019/2020 2020/2021 Market Year Begins Apr 2019 Apr 2020 Apr 2021
South Africa USDA Official New Post USDA Official New Post USDA Official New Post
Deliv. To Processors (MT) 333000 333000 282000 282000 302000 285000
Beginning Stocks (MT) 6302 6302 36349 36349 44349 48704
Production (MT) 63168 63168 49000 49494 52000 50000
Imports (MT) 1942 1942 2000 2410 2000 2000
Total Supply (MT) 71412 71412 87349 88253 98349 100704
Exports (MT) 29563 29563 35000 29549 40000 40000
Domestic Consumption (MT) 5500 5500 8000 10000 9000 11000
Ending Stocks (MT) 36349 36349 44349 48704 49349 49704
Total Distribution (MT) 71412 71412 87349 88253 98349 100704
(MT)
Page 25
Policies and Regulations:
U.S Authorizes Importation of Cold-Treated Citrus from South Africa into All U.S. Ports of Entry
On November 4, 2020, the U.S. Department of Agriculture’s Animal and Plant Health Inspection
Service (APHIS) announced that it had authorized the importation of cold-treated fresh citrus fruit from
South Africa into all U.S. ports of entry. APHIS determined that citrus fruit from South Africa, which is
cold-treated in transit, can safely enter all U.S. ports of entry without increasing the risk of introducing
the false coddling moth or other pests of concern. Previously, APHIS restricted the entry of cold-treated
citrus fruit from South Africa to four U.S. ports that have cold treatment facilities: Newark,
Philadelphia, Houston and New Orleans. This action will help in facilitating trade by broadening the
reach of South African citrus to other regions within the U.S. market, provide flexibility to U.S. retailers
and wholesalers, and lower transportation costs of imported citrus.
United States Cold Sterilization Protocol
South Africa exports citrus to the United States under the cold treatment schedule to address False
Codling Moth (FCM). The United States Animal Plant Health Inspection Service (APHIS) has reduced
the cold treatment schedule from 24 to 22 days, which has been hugely beneficial to South Africa in
terms of reducing shipping costs and in reducing fruit loss from cold damage.
South African Citrus Exports from Citrus Black Spot (CBS) Areas to the United States
Currently, South Africa can only export citrus to the United States from official CBS free areas. The
CBS free areas are found in the Western Cape and Northern Cape, as well as relevant districts of the
Free State and North West provinces. In 2014, APHIS issued a notice proposing to amend the fruits and
vegetables regulations to allow the import of several varieties of fresh citrus fruit, as well as Citrus
hybrids, into the United States from areas in South Africa where citrus black spot has been known to
occur. The regulation would authorize imports on the condition of satisfying certain systems and SPS
treatment procedures. This proposal can be found on the following link;
http://www.regulations.gov/#!documentDetail;D=APHIS-2014-0015-0001. The comment period closed
and the regulation is still in the process of being finalized.
Citrus Black Spot Challenges in the European Union Market
South Africa still faces challenges in the EU market as a result of the stringent CBS requirements, and
normally voluntarily suspends citrus exports to the EU every season to avoid any further interceptions of
fruit with CBS. For example, in October 2017, South Africa voluntarily suspended citrus exports to the
EU, as a precaution and risk mitigation measure to prevent a ban on citrus exports to the EU.
Complying with the EU requirements for CBS costs the industry a lot of money, constrains the already
limited government capacity and the scientific basis for these measures have been questioned. In
addition, Argentina and Uruguay are reported to have higher CBS interceptions than South Africa.
Thus, South Africa considers these EU measures an unnecessary technical trade barrier, and the Ministry
of Agriculture has publicly indicated that the internal process of lodging a WTO dispute has been
initiated.
Page 26
South Africa Fresh Produce Importers Association
The Fresh Produce Importers Association assists members with the importation of fresh fruit and
vegetables in South Africa. Information on their members, contact details and services they provide can
be obtained from the following website link, http://www.fpia.co.za/contact-us/ .
Custom Duties
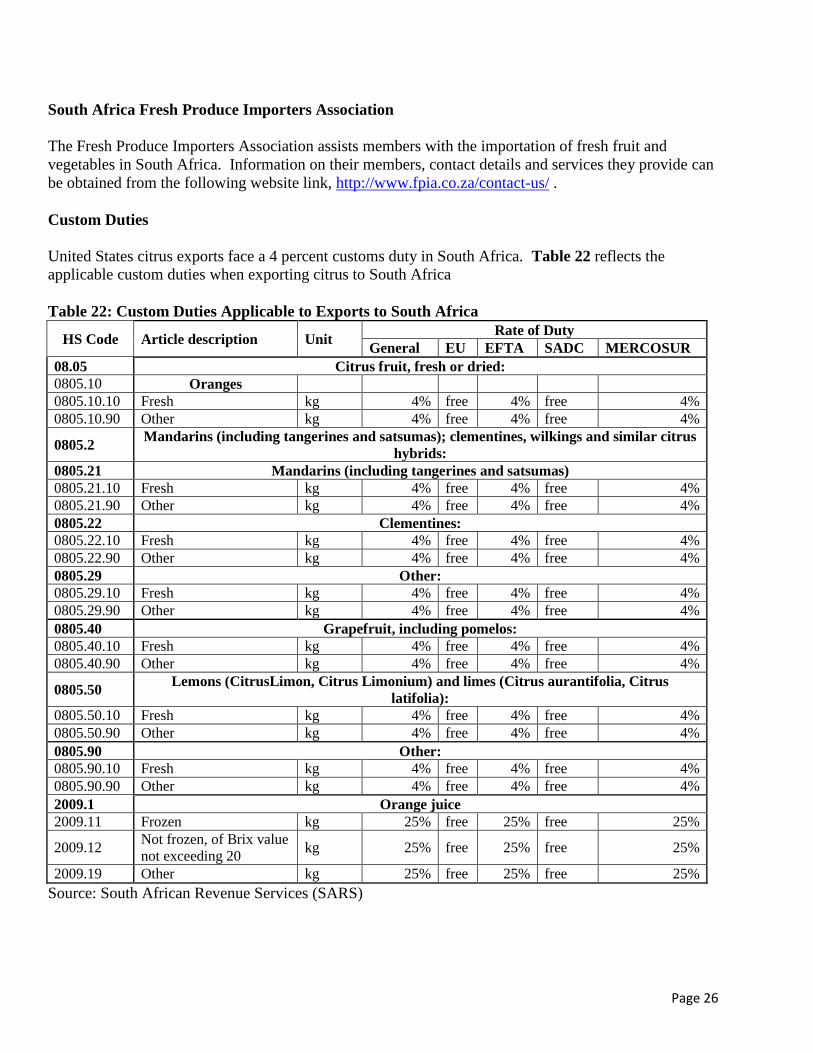
United States citrus exports face a 4 percent customs duty in South Africa. Table 22 reflects the
applicable custom duties when exporting citrus to South Africa
Table 22: Custom Duties Applicable to Exports to South Africa
HS Code Article description Unit Rate of Duty
General EU EFTA SADC MERCOSUR
08.05 Citrus fruit, fresh or dried:
0805.10 Oranges
0805.10.10 Fresh kg 4% free 4% free 4%
0805.10.90 Other kg 4% free 4% free 4%
0805.2 Mandarins (including tangerines and satsumas); clementines, wilkings and similar citrus
hybrids:
0805.21 Mandarins (including tangerines and satsumas)
0805.21.10 Fresh kg 4% free 4% free 4%
0805.21.90 Other kg 4% free 4% free 4%
0805.22 Clementines:
0805.22.10 Fresh kg 4% free 4% free 4%
0805.22.90 Other kg 4% free 4% free 4%
0805.29 Other:
0805.29.10 Fresh kg 4% free 4% free 4%
0805.29.90 Other kg 4% free 4% free 4%
0805.40 Grapefruit, including pomelos:
0805.40.10 Fresh kg 4% free 4% free 4%
0805.40.90 Other kg 4% free 4% free 4%
0805.50 Lemons (CitrusLimon, Citrus Limonium) and limes (Citrus aurantifolia, Citrus
latifolia):
0805.50.10 Fresh kg 4% free 4% free 4%
0805.50.90 Other kg 4% free 4% free 4%
0805.90 Other:
0805.90.10 Fresh kg 4% free 4% free 4%
0805.90.90 Other kg 4% free 4% free 4%
2009.1 Orange juice
2009.11 Frozen kg 25% free 25% free 25%
2009.12 Not frozen, of Brix value
not exceeding 20 kg 25% free 25% free 25%
2009.19 Other kg 25% free 25% free 25%
Source: South African Revenue Services (SARS)
Page 27
South African Import Regulations
The following links provide useful resources and regulations pertaining to importing fruit into South
Africa:
Export Procedures to South Africa
http://www.nda.agric.za/doaDev/sideMenu/plantHealth/docs/importProcedure.pdf.
Maximum Residue Limits
http://www.nda.agric.za/doaDev/sideMenu/foodSafety/doc/South%20African%20Citrus%20MRLs%20
2013.pdf
Agriculture Product Standards Act No 119 of 1990
http://www.nda.agric.za/doaDev/sideMenu/Food%20Import%20&%20Export%20Standard/docs/Agric
%20Product%20Standards%20Act%20No%20119%20%20of%201990.pdf
Agricultural Pests Amendment Act, 9 of 1992
http://www.nda.agric.za/doaDev/sideMenu/APIS/doc/Agricultural%20Pests%20Act.pdf
South African Special Export Protocols/ Programs/ Directives https://www.nda.agric.za/doaDev/sideMenu/plantHealth/exportsProg.htm
Attachments:
No Attachments