
Report # MATC-UNL: 205 Final...
47
® The contents of this report reflect the views of the authors, who are responsible for the facts and the accuracy of the information presented herein. This document is disseminated under the sponsorship of the Department of Transportation University Transportation Centers Program, in the interest of information exchange. The U.S. Government assumes no liability for the contents or use thereof. Report # MATC-UNL: 205 Final Report Impact of Truck Loading on Design and Analysis of Asphaltic Pavement Structure - Phase IV: Mixed- mode Fracture Characterization Yong-Rak Kim, Ph.D. Associate Professor Department of Civil Engineering University of Nebraska-Lincoln Soohyok Im, Ph.D. Assistant Transportation Researcher Texas A&M Transportation Institute Hoki Ban, Ph.D. Assistant Professor Department of Civil Engineering Kangwon National University Francisco Thiago Sacramento Aragão, Ph.D. Assistant Professor Department of Civil Engineering Universidade Federal do Rio de Janeiro/COPPE 2015 A Cooperative Research Project sponsored by U.S. Department of Transportation-Research and Innovative Technology Administration WBS:25-1121-0003-205
Transcript of Report # MATC-UNL: 205 Final...

®
The contents of this report reflect the views of the authors, who are responsible for the facts and the accuracy of the information presented herein. This document is disseminated under the sponsorship of the Department of Transportation
University Transportation Centers Program, in the interest of information exchange. The U.S. Government assumes no liability for the contents or use thereof.
Report # MATC-UNL: 205 Final Report
Impact of Truck Loading on Design and Analysis of Asphaltic Pavement Structure - Phase IV: Mixed-mode Fracture CharacterizationYong-Rak Kim, Ph.D.Associate ProfessorDepartment of Civil EngineeringUniversity of Nebraska-Lincoln
Soohyok Im, Ph.D.Assistant Transportation ResearcherTexas A&M Transportation Institute
Hoki Ban, Ph.D.Assistant ProfessorDepartment of Civil EngineeringKangwon National University
Francisco Thiago Sacramento Aragão, Ph.D.Assistant ProfessorDepartment of Civil EngineeringUniversidade Federal do Rio de Janeiro/COPPE
2015
A Cooperative Research Project sponsored by U.S. Department of Transportation-Research and Innovative Technology Administration
WBS:25-1121-0003-205

Impact of Truck Loading on Design and Analysis of Asphaltic Pavement Structures-Phase
IV: Mixed-mode Fracture Characterization
Yong-Rak Kim, Ph.D.
Associate Professor
Department of Civil Engineering
University of Nebraska-Lincoln
Soohyok Im, Ph.D.
Assistant Transportation Researcher
Texas A&M Transportation Institute
Hoki Ban, Ph.D.
Assistant Professor
Department of Civil Engineering
Kangwon National University
Francisco Thiago Sacramento Aragão, Ph.D.
Assistant Professor
Department of Civil Engineering
Universidade Federal do Rio de Janeiro/COPPE
A Report on Research Sponsored By
Mid-America Transportation Center
University of Nebraska-Lincoln
December 2014

ii
Technical Report Documentation Page
1. Report No.
WBS# 25-1121-0003-205
2. Government Accession No.
3. Recipient's Catalog No.
4. Title and Subtitle
Impact of Truck Loading on Design and Analysis of Asphaltic Pavement
Structures-Phase IV: Mixed-mode Fracture Characterization
5. Report Date
December 2014
6. Performing Organization Code
7. Author(s)
Yong-Rak Kim, Soohyok Im, Hoki Ban, and Francisco Thiago Sacramento
Aragão
8. Performing Organization Report No.
25-1121-0003-205
9. Performing Organization Name and Address
Mid-America Transportation Center
2200 Vine St.
PO Box 830851
Lincoln, NE 68583-0851
10. Work Unit No. (TRAIS)
11. Contract or Grant No.
12. Sponsoring Agency Name and Address
Research and Innovative Technology Administration
1200 New Jersey Ave., SE
Washington, D.C. 20590
13. Type of Report and Period Covered
July 2013 – December 2014
14. Sponsoring Agency Code
MATC TRB RiP No. 34756
15. Supplementary Notes
16. Abstract
Cracking in asphalt concrete pavements causes primary failure in the pavement structure. It is considered one of the key
issues to be addressed when selecting paving materials and designing sustainable pavement structures. Due to the diverse
nature of truck loads and pavement geometry, the asphalt mixture in the pavement is subjected to complex cracking
behavior, such as mixed-mode fracture, which is acombination of opening mode and shearing mode of fracture. For a
better understanding of asphalt fracture and a more accurate design of pavement structure, mode-dependent fracture
behavior needs to be characterized. This study presents integrated experimental-numerical efforts to characterize the
mixed-mode fracture of a fine aggregate matrix (FAM) which is the primary phase of cracks around stiffer coarse
aggregates when typical asphalt concrete mixtures are subjected to heavy truck loads at intermediate service temperatures.
Experimentally, semicircular bend (SCB) fracture tests were conducted by varying the geometric-loading configurations
with different initial notch inclination angles and supporting spans to achieve different fracture modes (opening, shearing,
and mixed). The SCB fracture test results were then integrated with the extended finite element modeling which is also
incorporated with mode-dependent cohesive zone fracture to properly identify the mode-dependent fracture properties. The
test and model simulation results indicated that the cohesive zone fracture toughness of mode-II (shearing) is quite
different from mode-I (opening) fracture toughness. The critical fracture energy was related to the mixed-mode ratio,
which presented a power relationship between the total fracture toughness and involvement of mode-II fracture in the total.
Findings and observations from this study, although they are limited at this stage, imply that the mixed-mode fracture
characteristics are significant and need to be considered in the structural design of asphalt pavements with which multi-
axial cracking is usually associated.
17. Key Words
18. Distribution Statement
19. Security Classif. (of this report)
Unclassified
20. Security Classif. (of this page)
Unclassified
21. No. of Pages
38
22. Price

iii
Table of Contents
Acknowledgements ........................................................................................................................ vi Disclaimer ..................................................................................................................................... vii
Abstract ........................................................................................................................................ viii Chapter 1 Introduction .................................................................................................................... 1
1.1 Research Objective and Scope ...................................................................................... 3 Chapter 2 Materials and Mixtures................................................................................................... 5 Chapter 3 Mode-Dependent SCB Fracture Test ............................................................................. 7
Chapter 4 SCB Fracture Test Results ........................................................................................... 12 Chapter 5 Fracture Property Characterization .............................................................................. 16
5.1 Fracture Characterization with Force-Displacement Curves ...................................... 16 5.2 Fracture Characterization with XFEM Modeling ....................................................... 21
Chapter 6 Summary and Conclusions ........................................................................................... 32 References ..................................................................................................................................... 34

iv
List of Figures
Figure 2.1 A typical three-phase microstructure of asphalt concrete mixtures .............................. 5
Figure 3.1 Geometry and loading conditions of the SCB specimen ............................................... 8
Figure 3.2 Illustration of specimen preparation and testing process .............................................10
Figure 4.1 SCB fracture test results: (a) s/r = 0.8, = 0o; (b) s/r = 0.4 - 0.8, = 45o;
(c) s/r = 0.4 - 0.8, = 50o ........................................................................................... 13
Figure 4.2 DIC analysis results (NTODs and NTSDs from each test case) ................................. 15
Figure 5.1 Force-NTOD and force-NTSD curves .........................................................................18
Figure 5.2 Mixed-mode fracture characteristics for asphalt mixture in this study ........................20
Figure 5.3 XFEM meshes constructed after mesh convergence analysis ......................................22
Figure 5.4 Illustration of the SCB specimen with cohesive zone fracture .....................................23
Figure 5.5 B-K mixed-mode fracture criterion ..............................................................................25
Figure 5.6 SCB test results vs. XFEM model simulation results for mode-I and mode-II ............26
Figure 5.7 SCB test results vs. XFEM model simulation results for mixed-model.......................27
Figure 5.8 Mixed mode fracture criterion of the FAM mixture ....................................................28
Figure 5.9 Crack path comparison between SCB tests and XFEM simulations ............................31

v
List of Tables
Table 2.1 FAM mix design and properties of fine aggregates ........................................................ 6
Table 3.1 Maximum span ratio (s/r) for mode-II fracture condition .............................................. 8
Table 5.1 Average Wcp value (J) of each test case .......................................................................19

vi
Acknowledgements
The authors would like to thank the Mid-America Transportation Center (MATC) for
their financial support needed to complete this study.

vii
Disclaimer
The contents of this report reflect the views of the authors, who are responsible for the
facts and the accuracy of the information presented herein. This document is disseminated under
the sponsorship of the U.S. Department of Transportation’s University Transportation Centers
Program, In the interest of information exchange. The U.S. Government assumes no liability for
the contents of use thereof.

viii
Abstract
Cracking in asphalt concrete pavements causes primary failure in the pavement structure.
It is considered one of the key issues to be addressed when selecting paving materials and
designing sustainable pavement structures. Due to the diverse nature of truck loads and pavement
geometry, the asphalt mixture in the pavement is subjected to complex cracking behavior, such
as mixed-mode fracture, which is a combination of opening mode and shearing mode of fracture.
For a better understanding of asphalt fracture and a more accurate design of pavement structure,
mode-dependent fracture behavior needs to be characterized. This study presents integrated
experimental-numerical efforts to characterize the mixed-mode fracture of a fine aggregate
matrix (FAM), which is the primary phase of cracks around stiffer coarse aggregates when
typical asphalt concrete mixtures are subjected to heavy truck loads at intermediate service
temperatures. Experimentally, semicircular bend (SCB) fracture tests were conducted by varying
the geometric-loading configurations with different initial notch inclination angles and
supporting spans to achieve different fracture modes (opening, shearing, and mixed). The SCB
fracture test results were then integrated with the extended finite element modeling, which is also
incorporated with mode-dependent cohesive zone fracture to properly identify the mode-
dependent fracture properties. The test and model simulation results indicated that the cohesive
zone fracture toughness of mode-II (shearing) is quite different from mode-I (opening) fracture
toughness. The critical fracture energy was related to the mixed-mode ratio, which presented a
power relationship between the total fracture toughness and involvement of mode-II fracture in
the total. Findings and observations from this study, although they are limited at this stage, imply
that the mixed-mode fracture characteristics are significant and need to be considered in the
structural design of asphalt pavements with which multi-axial cracking is usually associated.

1
Chapter 1 Introduction
Various asphalt pavement distresses are related to fracture, including fatigue cracking
(both top-down and bottom-up), thermal (transverse) cracking, and reflective cracking of the
asphalt layer. Cracking in asphalt concrete pavements causes primary failure in the pavement
structure and leads to long-term durability issues that are often related to moisture damage. The
fracture resistance and characteristics of asphalt materials significantly affect the service life of
asphalt pavements and, consequently, the maintenance and management of the pavement
network.
For a better understanding of the fracture behavior and cracking mechanisms in asphaltic
materials, recent studies have attempted various fracture tests and corresponding analysis
methods. They include the single-edge notched beam (SEB) test [1-3], the disk-shaped compact
tension (DCT) test [4, 5], the double-edged notched tension (DENT) test [6], and the
semicircular bend (SCB) test [7-11]. However, the tests in most studies cited above considered
only pure opening (i.e., mode-I) fracture. But mode-I cracking does not occur solely in asphalt
pavements because of multiaxial stresses due to traffic loads and the geometric complexity of
pavement structures. The limited effort of many studies is mainly due to technical challenges
involved both in performing shearing mode (i.e., mode-II) or mixed-mode fracture tests and in
the resulting data analyses. Very limited efforts have been attempted in the asphalt pavement
community, to the authors’ best knowledge, to characterize the mode-II fracture behavior of
asphalt mixtures. In 2008, Braham [12] conducted the SEB test with an offset notch to analyze
the mixed-mode fracture characteristics of different asphalt concrete mixtures. He clearly
showed that fracture is mixture-specific and that the fracture work increases as the level of

2
mode-II increases. However, the physical identification and quantification of the mode-II
fracture toughness in the mixed-mode test were not fully estimated.
Perhaps the characterization of a complicated fracture behavior such as the mixed-mode
fracture targeted in this study can be better achieved with the aid of well-defined numerical
techniques. Along with experimental efforts (i.e., laboratory fracture tests), the finite element
method (FEM) has been used to solve various crack problems in many studies. More recently,
the FEM has been incorporated into a rigorous fracture model, for example, the cohesive zone
concept, to simulate crack initiation and propagation of asphaltic media, as presented in several
studies [13-16]. The cohesive zone approach in asphalt materials and flexible pavements was
first employed by Jeng and co-workers [17, 18] to model crack resistance and propagation in
asphalt pavement overlays. Since then, it has received increasing attention from the asphalt
mechanics community because it can overcome the drawbacks of traditional approaches of linear
elastic fracture mechanics. Moreover, it provides great versatility and efficiency with various
computational methods, such as the FEM, for the modeling of both brittle and ductile failures,
which are typically observed in asphalt mixtures due to the wide range of service temperatures
and loading rates to which asphalt is subjected.
However, the conventional FEM with cohesive zones has an inherent drawback in
predicting randomly developed cracks, because cracks can only occur in a predefined mesh
structure. Thus, finite element simulation results are affected by the size and orientation of
cohesive zone elements. In order to properly capture the temporally and spatially dependent
development of cracks, enough cohesive zone elements need to be placed in an optimized
manner; otherwise, considerable accuracy can be lost. To overcome this limitation, Belytschko
and Black [19] introduced the extended finite element method (XFEM) as an extension of the

3
conventional FEM in order to model arbitrary cracks in finite element meshes. The key feature of
the XFEM, which is simulating arbitrary crack growth, can be efficiently integrated with the
experimental efforts and the cohesive zone concept for a more realistic characterization of
mixed-mode fracture in asphalt mixtures.
1.1 Research Objective and Scope
This research aims to explore a better understanding of the mode-dependent fracture
behavior of asphalt mixtures and to use the resulting fracture characteristics to aid understanding
of fundamental aspects of pavement design related to crack-associated distresses such as fatigue
cracking and thermal cracking. Clearly, research efforts are necessary to seek an appropriate
fracture test-analysis method that is fundamentally sound and practically efficient. Toward that
end, this research attempted experimental and numerical efforts to find overall mode-dependent
fracture characteristics (i.e., mode-I [opening], mode-II [shearing], and mixed-mode with
different levels) of asphalt mixtures. For this characterization, a simple and efficient fracture test
method was first explored, and the resulting test data were incorporated into relevant mechanical
theories (such as the cohesive zone fracture concept) and a numerical technique (i.e., XFEM).
At the current stage of our research efforts, a limited scope was attempted: only one
asphalt mixture was subjected to different fracture modes (opening, shearing, and mixed) with a
representative loading rate of 10 mm/min. and at intermediate testing temperature of 21oC. The
specific objectives of this research are:
To explore a mechanically sound and reasonable fracture test method that can identify
the mode-dependent fracture characteristics of asphalt mixtures;
To develop an integrated experimental-numerical approach for the characterization of
asphalt fracture in pavement structures; and

4
To identify fracture characteristics that account for the variation in mode-dependent
fracture resistance of asphaltic materials.
5
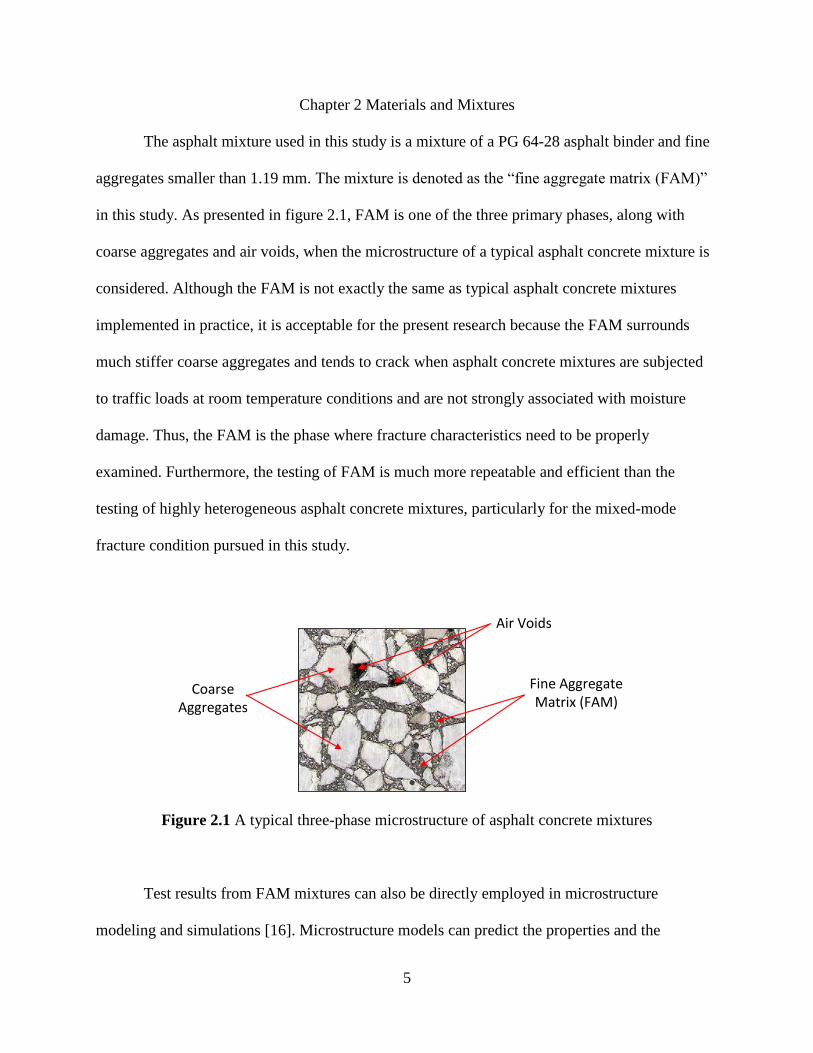
Chapter 2 Materials and Mixtures
The asphalt mixture used in this study is a mixture of a PG 64-28 asphalt binder and fine
aggregates smaller than 1.19 mm. The mixture is denoted as the “fine aggregate matrix (FAM)”
in this study. As presented in figure 2.1, FAM is one of the three primary phases, along with
coarse aggregates and air voids, when the microstructure of a typical asphalt concrete mixture is
considered. Although the FAM is not exactly the same as typical asphalt concrete mixtures
implemented in practice, it is acceptable for the present research because the FAM surrounds
much stiffer coarse aggregates and tends to crack when asphalt concrete mixtures are subjected
to traffic loads at room temperature conditions and are not strongly associated with moisture
damage. Thus, the FAM is the phase where fracture characteristics need to be properly
examined. Furthermore, the testing of FAM is much more repeatable and efficient than the
testing of highly heterogeneous asphalt concrete mixtures, particularly for the mixed-mode
fracture condition pursued in this study.
Coarse Aggregates
Air Voids
Fine Aggregate Matrix (FAM)
Figure 2.1 A typical three-phase microstructure of asphalt concrete mixtures
Test results from FAM mixtures can also be directly employed in microstructure
modeling and simulations [16]. Microstructure models can predict the properties and the

6
performance of asphalt concrete mixtures by accounting for the properties of the individual
components such as the FAM and the microstructural heterogeneity of the mixtures.
The FAM was designed based on the volumetric mix design characteristics of its
corresponding asphalt concrete mixture, which contains 4.0% air voids and 6.0% asphalt binder
by weight of total mixture. For the mix design of FAM, the same binder was mixed with fine
aggregates smaller than 1.19 mm (No.16 sieve). Because the FAM only contains particles
passing sieve No.16, a mix design of the FAM was postulated by assuming that the coarse
aggregates in the corresponding asphalt concrete mixture could be separated from the FAM by
virtually picking them out of the compacted asphalt concrete mixture microstructure. In other
words, algebraically, the required binder content to produce the FAM was proposed as what
remained after excluding the binder absorbed by the coarse aggregates from the total binder in
the asphalt concrete mixture. This approach resulted in a binder content of 8.0% by the total
weight of aggregates in the FAM mixture. It should be noted that the FAM mix design and
fabrication conducted in this study involves several technical assumptions that require further
investigation to confirm; however, the FAM is considered sufficient to meet the specific
objectives for this study. Table 2.1 shows the gradation, fine aggregate angularity (FAA), and
binder content of the FAM mixture used in this study.
Table 2.1 FAM mix design and properties of fine aggregates
Sieve Number
Sieve Size (mm)
#16
(1.19)
#30
(0.6)
#50
(0.3)
#100
(0.15)
#200
(0.075)
Gradation (% passing) 100.0 66.7 47.6 33.3 16.7
FAA (%) 45.0
Binder Type
Binder Content (%)
PG 64-28
8.00

7
Chapter 3 Mode-Dependent SCB Fracture Test
As mentioned earlier, one of the primary objectives of this study was to explore an
appropriate (simple, scientifically reasonable, and easy to perform) test method for the
characterization of mode-dependent (opening, shearing, and mixed) fracture behavior of asphalt
materials. Among the various fracture test geometries, the semicircular bend (SCB) test was
selected as it has several advantages compared to other fracture test methods and has been
evaluated by many researchers in the asphaltic materials/pavements community [8,10,11,15].
The SCB test is attractive because it is relatively repeatable, is simple to perform, and allows one
to prepare multiple testing specimens easily through a routine process of Superpave gyratory
compacting and/or field coring from asphalt roadways. The SCB geometry is particularly
attractive for mixed-mode fracture tests because several studies have attempted to characterize
the mode-dependent fracture toughness of engineering materials, such as concrete and rocks [20-
24].
Figure 3.1 shows a schematic representation of the SCB geometry-loading condition and
some of actual testing specimens used in this study for mixed-mode fracture characterization. As
illustrated, different fracture modes can be achieved depending on the geometric parameters
used, such as the inclination angle , notch length a, and supporting span s with the applied load.
For pure mode-I (opening), Chong and Kuruppu [25] suggested a geometry with a span ratio
(s/r) of 0.8 and = 0o to characterize the fracture behavior of rocks based on the concept of
linear elastic fracture mechanics. Since then, their testing configuration for mode-I fracture has
been selected for various materials, including asphalt mixtures. Lim et al. [20, 26] examined the
most appropriate SCB testing configuration to study mode-II fracture behavior. They reported

8
that the SCB geometries for pure mode-II (shearing) have a span ratio (s/r) of 0.5 and a
normalized notch length (a/r) of 0.35 ± 0.04 with an less than 60°.
P
a
2s
α
image pattern for DIC
dot gauges
150 mm
r = 75 mmY
X
s/r = 0.8
2s (mm)
dot gauges
a (mm)
Y
X
s/r = 0.4s/r = 0.6
(a) schematic configuration of SCB testing
(b) = 0o, s/r = 0.8 (c) = 45o, s/r = 0.6 (d) = 45o, s/r = 0.4
Figure 3.1 Geometry and loading conditions of the SCB specimen
Ayatollahi and Aliha [24] also investigated the SCB geometries that represent the mixed-
mode and the pure mode-II. Table 3.1 summarizes findings from the study by Ayatollahi and
Aliha [24]. It presents the maximum span ratio (s/r) necessary to yield a mode-II fracture
condition for a given normalized notch length (a/r) when the inclination angle is less than 60o.

9
Table 3.1 Maximum span ratio (s/r) for mode-II fracture condition
a/r 0.3 0.4 0.5 0.6
s/r 0.47 0.565 0.65 0.725
On the basis of findings from the aforementioned studies for other engineering materials,
this study attempted three different SCB specimen geometries: a constant normalized notch
length (a/r) of 0.33 with three different notch inclination angles of 0o, 45o, and 50o. To simulate
the mode-I fracture, the specimen with the 0o inclination angle was tested by placing metallic
rollers separated by a distance of 122 mm (14 mm from the edges of the specimen), providing a
span ratio (s/r) of 0.8. To achieve fracture other than the pure mode-I, span ratios (s/r) from 0.4
to 0.8 for two different inclination angles ( = 45o and 50o) were attempted. It is important to
note that the specimen geometries and testing configurations in this study were arbitrary based
on previous studies [20-24] of concrete and rock materials. The testing configurations selected
were evaluated as to whether they are truly appropriate to characterize the mode-I, mode-II, and
mixed-mode fracture behavior of asphaltic materials, which is described in later sections of this
report.
Figure 3.2 presents the fabrication process of the SCB test specimens and resulting
specimens ready to be loaded. In the preparation of the SCB test specimens, a Superpave
gyratory compactor was used to produce tall compacted FAM samples, which were 150 mm in
diameter and 175 mm high. Five slices (each with a diameter of 150 mm and a height of 25 mm)
were then obtained after removing the top and the bottom parts of each tall sample. Each slice
was then cut into halves to yield SCB specimens with a notch 2.5 mm wide and 25 mm deep to
yield the normalized notch length (a/r) of 0.33. Multiple SCB specimens were prepared to
complete at least two or three replicates for each testing condition. Special care was taken when

10
the initial notch was produced because the geometry and the quality of the notch tip may
significantly affect the fracture behavior of SCB specimens. Before testing, the individual SCB
specimens were placed inside the environmental chamber of a mechanical testing machine for
temperature equilibration, with the target test temperature 21oC. Following the temperature-
conditioning step, the SCB test was performed with a monotonic displacement rate of 10
mm/min. applied to the top center line of the specimens. The reaction force at the loading point
was monitored by the data acquisition system installed in the mechanical testing machine.
Compaction of FAM Mixture
Slicing of FAM Sample
Installation of SCB Specimen
(a) vertical notch (b) inclined notch
Preparation of SCB Testing Specimens
SCB Fracture Test with DIC System
Analysis of DIC Results
Figure 3.2 Illustration of specimen preparation and testing process
As shown in figure 3.2, in the present study, the digital image correlation (DIC) system
was integrated with the fracture test to more accurately identify the mode-dependent fracture

11
characteristics. The DIC is an easy-to-use, noncontact technique. It can identify complex
material behavior of a specimen, such as the time-varying local fracture process, which is the
focus in this study. Two pairs of dot gauges were attached to the surface of the specimens to
capture the opening displacements (denoted as notch tip opening displacements [NTODs]) and
the shearing displacements (denoted as notch tip shearing displacements [NTSDs]) at the tip of
the initial notch. These displacements are particularly important because they are used to
compute the mode-specific fracture energies that are used to check whether the selected test
configurations are appropriate to characterize the different modes of fracture (mode-I, mode-II,
and mixed-mode). The DIC recognizes the surface structure of the specimen in digital video
images and allocates coordinates to the image pixels. The first image represents the undeformed
state, and further images are recorded during the deformation of the specimen. Then, the DIC
compares the digital images and calculates the relative displacement between the dot gauges,
yielding the NTODs and NTSDs. A one megapixel Photron camera was used to capture images
and ARAMIS, a commercial package for the DIC analysis, was adopted in this study.
12
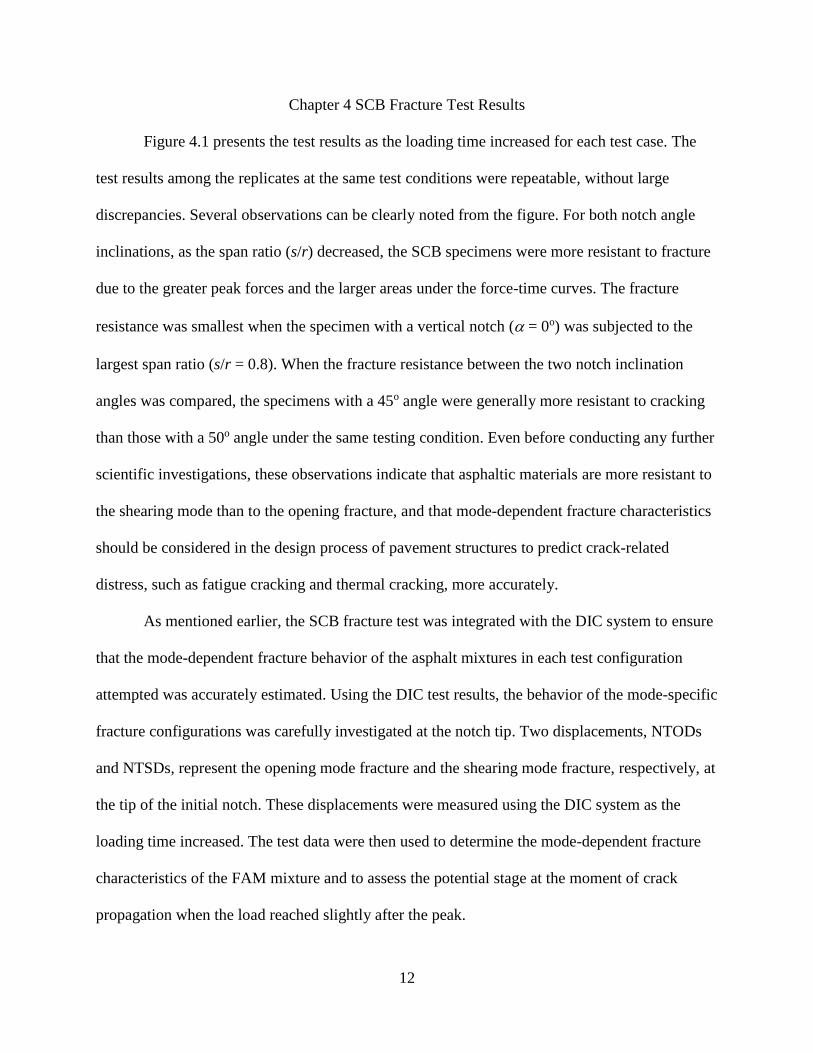
Chapter 4 SCB Fracture Test Results
Figure 4.1 presents the test results as the loading time increased for each test case. The
test results among the replicates at the same test conditions were repeatable, without large
discrepancies. Several observations can be clearly noted from the figure. For both notch angle
inclinations, as the span ratio (s/r) decreased, the SCB specimens were more resistant to fracture
due to the greater peak forces and the larger areas under the force-time curves. The fracture
resistance was smallest when the specimen with a vertical notch ( = 0o) was subjected to the
largest span ratio (s/r = 0.8). When the fracture resistance between the two notch inclination
angles was compared, the specimens with a 45o angle were generally more resistant to cracking
than those with a 50o angle under the same testing condition. Even before conducting any further
scientific investigations, these observations indicate that asphaltic materials are more resistant to
the shearing mode than to the opening fracture, and that mode-dependent fracture characteristics
should be considered in the design process of pavement structures to predict crack-related
distress, such as fatigue cracking and thermal cracking, more accurately.
As mentioned earlier, the SCB fracture test was integrated with the DIC system to ensure
that the mode-dependent fracture behavior of the asphalt mixtures in each test configuration
attempted was accurately estimated. Using the DIC test results, the behavior of the mode-specific
fracture configurations was carefully investigated at the notch tip. Two displacements, NTODs
and NTSDs, represent the opening mode fracture and the shearing mode fracture, respectively, at
the tip of the initial notch. These displacements were measured using the DIC system as the
loading time increased. The test data were then used to determine the mode-dependent fracture
characteristics of the FAM mixture and to assess the potential stage at the moment of crack
propagation when the load reached slightly after the peak.

13
(a) s/r = 0.8, = 0o
(b) s/r = 0.4 ~ 0.8, = 45o
(c) s/r = 0.4 ~ 0.8, = 50o
Figure 4.1 SCB fracture test results: (a) s/r = 0.8, = 0o; (b) s/r = 0.4 - 0.8, = 45o; (c) s/r = 0.4
- 0.8, = 50o

14
Figure 4.2 presents the two displacements (NTODs and NTSDs) and their corresponding
loads monitored for each test case. As expected, the specimens with the 0o inclined notch showed
the most significant changes in the NTODs at the notch tip with insignificant changes in the
NTSDs, indicating that the opening displacements primarily occurred at the moment of crack
development. However, when the notch was not vertical (see the example at 45o in fig. 4.2),
NTSDs and NTODs appeared, and the magnitude of the NTSDs became greater as the span ratio
(s/r) decreased. When the span ratio was the smallest (i.e., 0.4), the SCB specimens showed clear
shearing displacements at the moment of crack propagation, whereas the opening displacements
were insignificant. Another observation from the test results is that the NTODs began rising
immediately only when = 0o case. When the notch inclination angle was 45o, both NTODs and
NTSDs only appeared to rise when fracture is imminent.
It should be noted that figure 4.2 only presents the DIC results of the 45o case. However,
the DIC analysis results for the 50o case were very similar to those shown in figure 4.2. The
limited data and the results of the DIC analysis suggest that the SCB test configuration attempted
in this study is generally appropriate for differentiating the mode-dependent fracture behavior of
asphaltic materials. As previously verified for rock and concrete materials [20-24], SCB
geometry with a normalized notch length (a/r) of 0.33, a notch inclination angle of 0o, and a span
ratio of 0.80 is valid for characterizing mode-I fracture, and a SCB specimen with a normalized
notch length (a/r) of 0.33 and notch inclination angles of 45-50o is primarily subjected to
shearing fracture behavior when a span ratio of 0.40 is applied. Between the two cases, mixed-
mode fracture occurs, and the level of each mode is controlled by loading configurations such as
the span ratio.

15
0.0
0.5
1.0
1.5
2.0
2.5
3.0
3.5
4.0
0
2
4
6
8
10
0 5 10 15 20
Fo
rc
e (
kN
)
Dis
pla
ce
me
nt
(mm
)
Time (sec)
NTSD
NTOD
Force
0.0
0.5
1.0
1.5
2.0
2.5
3.0
3.5
4.0
0
2
4
6
8
10
0 5 10 15 20
Fo
rc
e (
kN
)
Dis
pla
ce
me
nt
(mm
)
Time (sec)
NTSD
NTOD
Force
(a) s/r = 0.8, = 0o (b) s/r = 0.8, = 45o
0.0
0.5
1.0
1.5
2.0
2.5
3.0
3.5
4.0
0
2
4
6
8
10
0 5 10 15 20
Fo
rc
e (
kN
)
Dis
pla
ce
me
nt
(mm
)
Time (sec)
NTSD
NTOD
Force
0.0
0.5
1.0
1.5
2.0
2.5
3.0
3.5
4.0
0
2
4
6
8
10
0 5 10 15 20
Fo
rc
e (
kN
)
Dis
pla
ce
me
nt
(mm
)
Time (sec)
NTSD
NTOD
Force
(c) s/r = 0.6, = 45o (d) s/r = 0.5, = 45o
0.0
0.5
1.0
1.5
2.0
2.5
3.0
3.5
4.0
0
2
4
6
8
10
0 5 10 15 20
Fo
rc
e (
kN
)
Dis
pla
ce
me
nt
(mm
)
Time (sec)
NTSD
NTOD
Force
(e) s/r = 0.4, = 45o
Figure 4.2 DIC analysis results (NTODs and NTSDs from each test case)

16
Chapter 5 Fracture Property Characterization
Using the SCB test results, the fracture properties can be characterized. Among several
methods [3, 4, 27-29] available to characterize the fracture properties, this study attempted two
approaches: one is based on the use of force-displacement curves and the other is by modeling
the SCB fracture tests with cohesive zone elements. The first approach makes it relatively simple
to characterize the fracture resistance by merely calculating an area under the force-displacement
curve up to peak force. The second approach, extended finite element modeling of the SCB tests
with cohesive zones, were conducted to determine the fracture properties that are locally
associated to initiate and propagate cracks through the specimens.
5.1 Fracture Characterization with Force-Displacement Curves
Figure 5.1 presents the SCB test results with the DIC measurements by plotting the
average values of the reaction forces and the opening/shearing displacements. It should be noted
that figure 5.1 does not present the results of the 45o case; however the analysis results for the
45o case were very similar to those for the 50o case shown in figure 4.2.
The figure confirms that the SCB testing attempted in this study by varying the
orientation of the initial notch and the loading configuration can differentiate the mode-specific
fracture characteristics of asphalt mixtures. The SCB geometry with the notch inclination angle
of 0o was primarily subjected to the normal opening mode (mode-I) fracture; whereas the SCB
geometry with the notch inclination angle of 45-50o was primarily subjected to shear-mode
(mode-II) fracture when the span ratio of 0.40 was applied. Varying the span ratio from 0.40 to
0.80 with the notch inclination angle of 45-50o led to mixed-mode fracture, and the span ratio
affected the level of individual fracture mode (i.e., as the span ratio decreased, the mode-II
fracture was more dominant).

17
0.0
0.5
1.0
1.5
2.0
2.5
3.0
3.5
0 1 2 3
Fo
rc
e (
kN
)
Displacement (mm)
Force-NTOD
0.0
0.5
1.0
1.5
2.0
2.5
3.0
3.5
0 1 2 3
Fo
rc
e (
kN
)
Displacement (mm)
Force-NTSD
Force-NTOD
(a) s/r = 0.8, = 0o (b) s/r = 0.8, = 50o
0.0
0.5
1.0
1.5
2.0
2.5
3.0
3.5
0 1 2 3
Fo
rc
e (
kN
)
Displacement (mm)
Force-NTSD
Force-NTOD
0.0
0.5
1.0
1.5
2.0
2.5
3.0
3.5
0 1 2 3
Fo
rc
e (
kN
)
Displacement (mm)
Force-NTSD
Force-NTOD
(c) s/r = 0.6, = 50o (d) s/r = 0.5, = 50o
0.0
0.5
1.0
1.5
2.0
2.5
3.0
3.5
0 1 2 3
Fo
rc
e (
kN
)
Displacement (mm)
Force-NTSD
(e) s/r = 0.4, = 50o
Figure 5.1 Force-NTOD and force-NTSD curves

18
To quantify the mode-dependent fracture resistance, the mechanical energy required for
crack propagation (Wcp) was calculated for each test case. Among the several methods available
in the literature to calculate the fracture resistance, this method adopted a simple way by
calculating the area under the force-displacement curves (force-NTODs and force-NTSDs) up to
peak force. It should be noted that the fracture resistance, Wcp, obtained from the approach
described herein is limited to characterizing the true fracture properties of the material because it
only represents materials’ resistance to fracture before crack propagation. Moreover, force-
displacement curves are global measurements, which are dependent on the choice of
displacement measurements, the geometry of the test specimen, and the applied boundary
conditions. In addition, the viscoelastic nature of the asphaltic material creates a further
complication when identifying fracture properties at intermediate testing conditions. Therefore,
fracture characteristics should be examined locally at the tip of fracture process zone, not by
global force measurements. Regardless of the several technical issues that could somewhat
mislead the true fracture properties, the mechanical energy required for crack propagation was
utilized herein for practical reasons. It implies that the fracture characteristics herein were
incorporated with the SCB-DIC results without relying on any further mechanical analyses
and/or advanced modeling, such as the XFEM with cohesive zone fracture that is presented in
the next section.
Table 5.1 presents Wcp value of each case. The coefficient of variation (COV) values of
each case were also investigated and resulted in a range between 4.2% and 27.6%. The
variability observed in this study seems satisfactory according to a study by Marasteanu et al.
[31], where the variability of 25% was reported as repeatable. The mechanical energy, Wcp-I,
indicates the mode-I fracture resistance obtained from the force-NTOD curve, and Wcp-II

19
indicates the mode-II fracture resistance obtained from the force-NTSD curve. As expected and
clearly seen from the table, the fracture resistance values obtained from the force-NTSD curve
increased as the span ratio decreased.
Table 5.1 Average Wcp value (J) of each test case
Notch Angle s/r Wcp-I Wcp-II Wcp-T Wcp-II / Wcp-T
= 0o 0.8 0.17 - 0.17 0.00
= 45o
0.8 0.29 0.24 0.53 0.45
0.6 0.33 0.40 0.73 0.55
0.5 0.20 0.53 0.73 0.73
0.4 - 0.84 0.84 1.00
= 50o
0.8 0.26 0.30 0.56 0.54
0.6 0.34 0.62 0.96 0.64
0.5 0.20 0.72 0.92 0.78
0.4 - 1.01 1.01 1.00
The total fracture resistance (Wcp-T) was then defined as the sum of Wcp-I and Wcp-II in this
study. As shown in table 5.1, the Wcp-T values for the 45° inclined notch case were lower, but not
significantly different compared to the Wcp-T values for the 50° inclined notch case. This implies
that the two notch angles attempted in this study did not significantly influence the total fracture
resistance, although the notch angles affected the load-displacement responses of the asphaltic
materials including the peak force and the softening behavior, as presented in figure 4.1.
However, more extensive testing and data analyses at different notch angles are needed to
confirm this observation.
Based on the test results, the mode-dependent fracture characteristics account for the
variation in the fracture resistance of asphaltic materials. Figure 5.2 presents the total mechanical

20
energy required for crack propagation as a function of the mixed-mode ratios (Wcp-II / Wcp-T)
obtained from the SCB tests. The data were then fitted to a simple power relationship as follows:
Wcp-T = 0.161 + 0.802 (Wcp-II / Wcp-T)0.71 (5.1)
Figure 5.2 Mixed-mode fracture characteristics for asphalt mixture in this study
As illustrated in figure 5.2 and indicated from the equation 1, the total fracture resistance
at either zero or the unity value of the mixed-mode ratio represents the pure mode-I and mode-II
fracture condition, respectively. Consequently, the required mechanical energies to develop
either the pure opening mode or the pure shearing mode fracture can be estimated from the
power law by simply taking the two extreme values: 0.161 J for mode-I fracture condition and

21
0.963 J for mode-II fracture condition. The fracture resistance for the mode-II condition was
approximately six times greater than the fracture resistance for the mode-I condition.
5.2 Fracture Characterization with XFEM Modeling
To determine the mode-specific fracture properties of FAM mixtures, the SCB test results
were then integrated with numerical model simulations. The integrated approach between test
results and numerical modeling can identify unknown fracture characteristics by targeting good
agreements between laboratory test results and numerical simulations equipped with a fracture
model, i.e., the mode-dependent cohesive zone model in this study. Several recent relevant
studies [15, 30-33] have taken this approach to determine the fracture properties of asphaltic
materials at different conditions. For this particular study, the XFEM with a cohesive zone was
used for the fracture characterization. The XFEM is exceptionally feasible for modeling arbitrary
crack growth, which is the case in this study where fracture paths are expected to be random in
the semicircular specimen when the fracture is associated with mixed-mode. The use of
conventional FEM with cohesive zones presents an inherent drawback in simulating random
crack growths, because cracks can generally develop only along a predefined path in the finite
element mesh. Therefore, the mode-II or mixed-mode fracture in the SCB geometry could be
significantly misled by the mesh structure if the conventional FEM with cohesive zone fracture
were to be adopted.
Figure 5.3 exemplifies XFEM meshes (vertical notch and inclined notch with 50o)
used for this study after completing the mesh convergence analysis. The specimens were
discretized with four-node bilinear plane stress elements (CPS4) implemented in a commercial
finite element program, ABAQUS [34], which is the numerical tool for modeling the SCB tests
in the present study. As also seen in figure5.3, the graded mesh was constructed by refining only

22
around the potential crack growth region, whereas in the area of low stress gradients, large
elements were used to reduce computational time.
(a) XFEM mesh with a vertical notch (0o)
(b) XFEM mesh with an inclined notch (50o)
Figure 5.3 XFEM meshes constructed after mesh convergence analysis
Figure 5.4 illustrates the mixed-mode cohesive zone fracture model incorporated into the
XFEM simulation. Currently, the mixture was modeled as an isotropic and elastic material
subjected to mode-dependent fracture. Therefore, the two linear elastic properties (i.e., Young’s

23
modulus E and Poisson’s ratio υ) and the three fracture properties (i.e., cohesive zone strength
Tmax and cohesive zone fracture energies , ), represented by a linearly decaying cohesive
zone model [35], were necessary as model inputs.
P
a
2s
α
Mode I
Mode II
maxT
Tn
n
n
1.0
1.0
Area = I
maxT
Tt
t
t
1.0
1.0
Area = II
-1.0
-1.0
Isotropic Elastic:
Young’s Modulus,
Poisson’s Ratio
Cohesive
Zone
Figure 5.4 Illustration of the SCB specimen with cohesive zone fracture
In this study, it was assumed that, among the listed mechanical properties, Poisson’s ratio
was not affected by fracture modes and therefore maintained a constant value of 0.3. The elastic
modulus of the mixture was determined by taking only the elastic components in the generalized
Maxwell model, which is a linear viscoelastic mechanical analog. The elastic components were
used in the present study to reasonably estimate the Young’s modulus of FAM, because the
current XFEM in ABAQUS was not feasible for modeling viscoelastic materials with fracture.
The other three cohesive zone fracture parameters (Tmax, , and ) were then determined for

24
each case via a calibration process by reaching a good agreement between the simulation and test
results. The cohesive zone strength (Tmax) could readily be determined by calibrating the peak
force between the model simulation and testing, and the cohesive zone fracture energies were
determined by calibrating the softening behavior of the force-time curves between the model and
testing.
In order to account for the variation of fracture energy due to the level of fracture mode,
the mixed-mode criterion proposed by Benzeggagh and Kenane [36] was used in this study (B-K
criterion). This criterion is expressed as a function of mode-I and mode-II fracture energy and a
parameter n:
n
T
IIICIICICC
(5.2)
IIIT (5.3)
In the B-K fracture criterion, IC and IIC are fracture energies for mode-I and mode-II,
respectively, and the parameter n determines the shape of the mixed-mode fracture trend. As
figure 5.5 illustrates, the critical fracture energy at either zero or unity of the mixed-mode ratio
(II/T) represents pure mode-I and mode-II, respectively. When n -value is greater than unity
(for example n = 3 in the figure), the critical fracture energy grows at an increasing rate as the
mixed-mode ratio increases; however, for n values smaller than unity (such as n = 0.35 in the
figure), the critical fracture energy evolves with a decreasing rate as the level of mode-II fracture
increases in the overall fracture process. At the sufficiently high and low n-value (1010 and 10-10

25
in the figure), the fracture behavior is mainly governed by pure mode-I and mode-II,
respectively.
Figure 5.5 B-K mixed-mode fracture criterion
Model simulations with the B-K fracture criterion were first conducted for mode-I and
mode-II cases. Cohesive zone fracture properties were determined through the calibration
process until a good agreement was achieved between experimental results and numerical
simulations of SCB testing. As mentioned earlier, extremely high and low n-value in the B-K
fracture criterion was used to characterize fracture properties at the pure mode-I and mode-II,
respectively. Figure 5.6 compares the SCB test results (averages of replicates) with the XFEM
model simulations after the model calibration process was completed. For the mode-I case,
almost identical results between the model simulation and testing were found, and relatively
good agreements were obtained for the mode-II case with some mismatches that might be due to

26
the combined effects of the model limitations: linear elastic, isotropic, two-dimensional, etc.
Resulting fracture properties (Tmax, IC and IIC) are shown in the figure. It can be noted that the
mode-II fracture energy is about three times greater than mode-I fracture energy, which implies
that asphalt mixtures are approximately three times more resistant to the shearing mode fracture
than to the opening mode failure.
Figure 5.6 SCB test results vs. XFEM model simulation results for mode-I and mode-II
After the material properties at mode-I and mode-II fracture condition were determined,
the B-K model parameter n could be identified with mixed-mode fracture data. To this end, a
series of simulations at the three other testing configuration (s/r = 0.5, 0.6 and 0.8) conducted
with the two different notch inclination angles (45 o and 50o) were repeated by changing the n-
value until deviations between the SCB test results and model simulations were minimized. To
achieve the calibration process with a validation purpose, the n-value was first obtained from the
data set at the inclination angle of 50o, and the n-value found was then applied to the test results

27
at the inclination angle of 45o. Figure 5.7 illustrates comparison plots between test results
(average of three replicates) and the XFEM model simulations at the two different notch angles.
0
1
2
3
4
5
0 5 10 15 20
Fo
rce
(k
N)
Time (sec)
s/r=0.5_test result
s/r=0.6_test result
s/r=0.8_test result
s/r=0.5_model simulation
s/r=0.6_model simulation
s/r=0.8_model simulation
(a) Model predictions vs. test results at the notch angle of 50o
0
1
2
3
4
5
0 5 10 15 20
Fo
rce
(k
N)
Time (sec)
s/r=0.5_test result
s/r=0.6_test result
s/r=0.8_test result
s/r=0.5_model simulation
s/r=0.6_model simulation
s/r=0.8_model simulation
(b) Model predictions vs. test results at the notch angle of 45o
Figure 5.7 SCB test results vs. XFEM model simulation results for mixed-model

28
Model simulations generally traced the test results with some mismatches particularly
after peak loads. However, considering the aforementioned model limitations (such as linear
elastic, isotropic, and two-dimensional) at the current stage of modeling efforts, the deviations
between the model predictions and test results would be insignificant and can be reduced by
incorporating other modeling features such as material viscoelasticity.
Figure 5.8 presents resulting mode-dependent fracture characteristics of the FAM
mixture. The B-K criterion is also shown in the figure. The n-value determined herein was 0.35.
It can be observed from the figure that the critical fracture energy of the FAM mixture tends to
increase somewhat sharply at the beginning stage of mixed mode ratio and then gradually
saturates. This implies that fracture resistance of asphalt mixtures is greater to and more sensitive
with shearing.
Figure 5.8 Mixed mode fracture criterion of the FAM mixture

29
The observation in figure 5.8 is in fact quite similar to the finding in figure 5.2. In figure
5.2, the mixed-mode fracture with the SCB test results was experimentally characterized by
simply calculating the area under the load-displacement curves up to peak force. The resulting
fracture criterion could relate the total mechanical energy required for crack propagation as a
function of the mixed-mode ratios in a simple power relationship as the B-K relation shown in
figure 5.8. The n-value obtained from the experimental characterization was also less than unity.
The validity of the model simulation is further illustrated in figure 5.9. It compares crack
paths at different mixed-mode conditions between laboratory tests and model simulations. The
crack paths were reasonably affected by the test configurations, and the simulation results closely
match the realistic crack pattern. A reasonable match between the test results and the numerical
simulations implies that the resulting model parameters (i.e., cohesive zone fracture properties
and the B-K mixed-mode fracture criterion) were properly defined.
Test-modeling results presented in this study are limited, and several technical limitations
exist at this stage. As noted, only one asphalt mixture in the form of FAM was subjected to a
loading rate of 10 mm/min. at an intermediate temperature condition of 21oC in this study. The
numerical model assumed the FAM as elastic with damage only by the mode-dependent fracture.
A wide range of testing temperatures and loading rates for different types of asphalt mixtures
needs to be considered to confirm the observations and findings, because asphalt mixtures are
temperature- and rate-dependent viscoelastic materials. Despite the limitations here and the
challenges facing future studies, the integrated experimental-numerical approach in this study
provided significant insights on the subject of asphalt fracture in pavements. As shown here, the
fracture of asphalt mixtures is highly mode related, and the fracture resistance between the
fracture modes is very different. The findings of this study clearly indicate that the mode-
sensitive nature of the fracture characteristics needs to be considered when pursuing a more

30
accurate design of pavement structures with which multi-axial deformation is usually associated
due to the complicated pavement structural geometry and the various traffic loading conditions.

31
(a) s/r = 0.5
(b) s/r = 0.6
(c) s/r = 0.8
Figure 5.9 Crack path comparison between SCB tests and XFEM simulations

32
Chapter 6 Summary and Conclusions
This study investigated mixed-mode fracture characteristics of asphalt materials. SCB
fracture tests with different notch geometries and loading configurations were incorporated with
the results of DIC analysis to characterize the mode-dependent fracture behavior of a FAM
mixture subjected to a 10 mm/min. loading rate and an intermediate temperature condition of
21oC. SCB fracture tests were then integrated with the XFEM technique with the mode-
dependent cohesive zone fracture concept. Based on the test results and the data analyses, the
following conclusions can be drawn:
The SCB fracture test with FAM mixtures presented reasonable and relatively
repeatable results. In addition, by varying the notch geometries and loading
configurations, the SCB test was generally appropriate for differentiating mode-I,
mixed-mode, and mode-II fracture conditions of asphalt mixtures;
The SCB geometry with the notch inclination angle of 0o and the span ratio of 0.80
was characterized by mode-I fracture, and the SCB geometry with the notch
inclination angle of 45-50o was primarily subjected to mode-II fracture behavior
when the span ratio of 0.40 was applied. Between the two cases, mixed-mode fracture
occurred, and the level of each mode was controlled by the span ratio;
The numerical modeling approach based on the XFEM technique incorporated with
the cohesive zone fracture was successful for the characterization of mode-dependent
asphaltic fracture by integrating the model predictions with the SCB test results;
The test and model simulation results indicated that fracture toughness of mode-II is
quite different from mode-I fracture toughness. Furthermore, the critical fracture

33
energy of the mixture tended to increase somewhat sharply at the beginning stage of
mixed mode ratio and then gradually saturated;
The findings and observations from this study provides significant insight into
pavement design and asphaltic materials. The mixed-mode fracture phenomenon
identified herein can potentially be used in the future in mechanistic pavement design
with which multi-axial damage is usually associated in order to better address crack-
associated distresses such as fatigue cracking; and
The observations from this study may not be directly applied to other mixtures at
different conditions, since asphalt mixtures are highly rate- and temperature-
dependent viscoelastic. To confirm the results and findings obtained in this study,
future studies should conduct additional tests and analyses at different testing
temperatures and loading rates with various different mixtures.

34
References
[1] Hoare, T. R., and Hesp, S. A. M. Low-Temperature fracture testing of asphalt binders:
regular and modified systems. Transportation Research Record, 1728, 2000, 36-42.
[2] Marasteanu, M. O., Dai, S. T., Labuz, J. F., and Li, X. Determining the low-temperature
fracture toughness of asphalt mixtures. Transportation Research Record, 1789, 2002,
191-199.
[3] Wagoner, M. P., Buttlar, W. G., Paulino, G. H. Development of a single-edge notched
beam test for asphalt concrete mixtures. Journal of Testing and Evaluation, 33(6), 2005,
452-460.
[4] Wagoner, M. P., Buttlar, W. G., Paulino, G. H. Disk-shaped compact tension test for
asphalt concrete fracture. Society for Experimental Mechanics, 45(3), 2005, 270-277.
[5] Wagoner, M. P., Buttlar, W. G., Paulino, G. H., Blankenship, P. Laboratory testing suite
for characterization of asphalt concrete mixtures obtained from field cores. Journal of the
Association of Asphalt Paving Technologists, 75, 2006, 815-852.
[6] Seo, Y. G. A Comprehensive study of crack growth in asphalt concrete using fracture
mechanics. Ph.D. Dissertation, Civil Engineering, North Carolina State University, 2003.
[7] Molenaar, A. A. A., Scarpas, A., Liu, X., Erkens, S. M. J. G. Semicircular bending test:
simple but useful? Journal of the Association of Asphalt Paving Technologists, 71, 2002,
795-815.
[8] Li, X. and Marasteanu, M. O. Evaluation of the low temperature fracture resistance of
asphalt mixtures using the semicircular bend test. Journal of the Association of Asphalt
Paving Technologists, 73, 2004, 401-426.

35
[9] Li, X. and Marasteanu, M. O. Investigation of low temperature cracking in asphalt
mixtures by acoustic emission. International Journal of Road Materials and Pavement
Design, 7(4), 2006, 491-512.
[10] Wu, Z., Mohammad, L. N., Wang, L. B., and Mull, M. A. Fracture resistance
characterization of Superpave mixtures using the semi-circular bending test. Journal of
ASTM International, 2(3), 2005, 324-332.
[11] Elseifi, M. A., Mohammad, L. N., and Cooper III, S. B. Laboratory evaluation of asphalt
mixtures containing sustainable technologies, Journal of the Association of Asphalt
Paving Technologists, 80, 2011, 227-254.
[12] Braham, A. F. Fracture characteristics of asphalt concrete in mode I, mode II, and mixed-
mode. Ph.D. Dissertation, University of Illinois, Urbana, Illinois, 2008.
[13] Song, S. H., Paulino, G. H., and Buttlar, W. G. Simulation of crack propagation in asphalt
concrete using an intrinsic cohesive zone model. Journal of Engineering Mechanics, 132,
2006, 1215-1223.
[14] Kim, H. and Buttlar, W. G. Discrete fracture modeling of asphalt concrete. International
Journal of Solids and Structures, 46, 2009, 2593-2604.
[15] Aragão, F. T. S. and Kim, Y. Mode I fracture characterization of bituminous paving
mixtures at intermediate service temperatures. Experimental Mechanics, 52(9), 2012,
1423-1434.
[16] Kim, Y. and Aragão, F. T. S. Microstructure modeling of rate-dependent fracture
behavior in bituminous paving mixtures. Finite Elements in Analysis and Design, 63,
2013, 23-32.

36
[17] Jeng, Y. S. and Perng, J. D. Analysis of crack propagation in asphalt concrete using
cohesive crack model. Transportation Research Record, 1317, 1991, 90-99.
[18] Jeng, Y. S., Liaw, C., and Liu, P. Analysis of crack resistance of asphalt concrete
overlays – a fracture mechanics approach. Transportation Research Record, 1388, 1993,
160-166.
[19] Belytschko, T. and Black, T. Elastic crack growth in finite elements with minimal
remeshing. International Journal for Numerical Methods in Engineering, 45, 1999, 601-
620.
[20] Lim, I. L., Johnston, I. W., Choi, S. K., and Boland, J. N. Fracture testing of soft rock
with semicircular specimens under three-point bending, part 2 – mixed-mode.
International Journal of Rock Mechanics and Mining Science, 31(3), 1994, 199-212.
[21] Reinhardt, H. W. and Xu, S. A practical testing approach to determine mode II fracture
energy G11f for concrete. International Journal of Fracture, 105, 2000, 107-125.
[22] Chang, S., Lee, C., and, Jeon, S. Measurement of rock fracture toughness under modes I
and II and mixed-mode conditions by using disc-type specimens. Engineering Geology,
66, 2002, 79-97.
[23] Rao, Q., Sun, Z., Stephansson, O., Li, C., and Stillborg, B. Shear fracture (mode II) of
brittle rock. International Journal of Rock Mechanics and Mining Sciences, 40, 2003,
355-375.
[24] Ayatollahi, M. R. and Aliha, M. R. M. A wide range data for crack tip parameters in two
disc-type specimens under mixed mode loading. Composite Materials Science, 38, 2007,
131-150.

37
[25] Chong, K. P. and Kuruppu, M. D. New specimen for fracture toughness determination for
rock and other materials. International Journal of Fracture, 26, 1984, 59-62.
[26] Lim, I. L., Johnston, I. W., and Choi, S. K. Stress intensity factors for semicircular
specimens under three-point bending. Engineering Fracture Mechanics, 43, 1993, 363-
382.
[27] Song, S. H., Wagoner, M. P., and Paulino, G. H. δ25 crack opening displacement
parameter in cohesive zone models: experiments and simulations in asphalt concrete.
Fatigue and Fracture of Engineering Materials and Structures, 31, 2008, 850-856.
[28] Aragão, F. T. S. Computational microstructure modeling of asphalt mixtures subjected to
rate-dependent fracture. Ph.D. Dissertation, University of Nebraska, Lincoln, Nebraska,
2011.
[29] Marasteanu, M. O., Zofka, A., Turos, M., Li, X., Velasques, R., Li, X., Buttlar, W.,
Paulino, G., Braham, A., Dave, E., Ojo, J., Bahia, H., Williams, C., Bausano, J., Gallistel,
A., and McGraw, L. Investigation of low temperature cracking in asphalt pavements:
national pooled fund study 776, Final Report No. MN/RC 2007-43, Minnesota
Department of Transportation, 2007.
[30] Song, S. H., Paulino, G. H., and Buttlar, W. G. A bilinear cohesive zone model tailored
for fracture of asphalt concrete considering viscoelastic bulk material. Engineering
Fracture Mechanics, 73, 2006, 2829-2848.
[31] Kim, H. Buttlar, W. G. and Wagoner, M. P. Micromechanical fracture modeling of
asphalt concrete using a single-edge notched beam test. Materials and Structures, 42,
2009, 677-689.

38
[32] Ban, H., Kim, Y., and Pinto, I. Integrated experimental-numerical approach for
estimating material-specific moisture damage characteristics of binder-aggregate
interface. Transportation Research Record, 2209, 2011, 9-17.
[33] Ban, H. and Kim, Y. Integrated experimental-numerical approach to model progressive
moisture damage behavior of bituminous paving mixtures. Canadian Journal of Civil
Engineering, 39, 2012, 323-333.
[34] Hibbitt, Karlsson, Sorensen, Inc. ABAQUS/Standard user's manual, v. 6.10. Pawtucket,
Rhode Island, 2010.
[35] Ortiz, M. and Pandolfi, A. Finite-deformation irreversible cohesive elements for three-
dimensional crack propagation analysis. International Journal for Numerical Methods in
Engineering, 44(9), 1267-1282.
[36] Benzeggagh, M. L. and Kenane, M. Measurement of mixed-mode delamination fracture
toughness of unidirectional glass/epoxy composites with mixed-mode bending apparatus.
Computer Science and Technology, 56, 1996, 439-449.


