Report for the SIX MONTHS ENDED - Maha Energy
35
Report for the SIX MONTHS ENDED 30 JUNE 2018 (org number: 559018-9543)
Transcript of Report for the SIX MONTHS ENDED - Maha Energy

Report for the
SIX MONTHS ENDED 30 JUNE 2018 (org number: 559018-9543)

2
Highlights (all amounts are in US dollars unless otherwise noted) Second Quarter 2018
• Daily oil & gas production for the second quarter averaged 1,429 BOEPD (Q2 2017: 259 BOEPD). Planned production shutdowns at the Tartaruga field due to well workover operations reduced second quarter production compared to first quarter of 2018.
• Revenue of USD 7.9 million (Q2 2017: USD 1.0 million) • EBITDA of USD 4.0 million (Q2 2017: USD -1.0 million) • Net result for the period of USD 1.9 million (Q2 2017: USD -3.6 million) • Earnings per share of USD 0.02 (Q2 2017: USD -0.04) • Operating netback of USD 5.1 million or USD 39.22 per barrel (Q2 2017: USD 0.2 million or USD 11.76 per barrel) • Following the quarter end, the Company recompleted the GTE-3 well. The Sergi formation has, on its own, initially
tested at 960 BOPD, 218 BWPD and 261 MSCFPD of gas with the assistance of the newly acquired jet pump and has now been placed on production.
Financial Summary
(TUSD, unless otherwise noted)
Q2 2018
Q1 2018
Q4 2017(1)
Q3 2017
Q2 2017
H1 2018
H1 2017
FY 2017
Net Daily Production (BOEPD) 1,429 1,762 1,597 1,671 259 1,595 187 917
Revenue 7,859 8,629 6,939 6,173 1,043 16,488 1,492 14,604 EBITDA 3,960 4,566 2,930 2,259 (967) 8,526 (1,976) 3,213 Net result for the period 1,859 2,306 2,482(2) (402) (3,626) 4,165 (4,875) (2,849) Earnings per share (USD) 0.02 0.02 0.03 (0.00) (0.04) 0.04 (0.06) (0.03)
Cash and equivalents 20,914 22,779 18,729 18,372 13,324 20,914 13,324 18,729
1 Q4 2017 figures include previously disclosed changes to the 2017 Fourth Quarter Report in April 30, 2018 press release 2 Includes positive adjustment of TUSD 1,423 in relation to FY 2017. Result for the Q4 2017 period before adjustment was $1,059 and Earnings per share of 0.01.

3
Definitions
Abbreviations Oil related terms and measurements CAD Canadian Dollar BOE or boe Barrels of Oil Equivalents SEK Swedish Krona BBL or bbl Barrel BRL Brazilian Real BOEPD Barrels of Oil Equivalents Per Day USD US Dollar BOPD Barrels of Oil Per Day TSEK Thousand SEK Mbbl Thousand barrels TUSD Thousand USD Mboe Thousand barrels of oil equivalents MSEK Million SEK Mboepd Thousand barrels of oil equivalents per day MUSD Million USD Mbopd Thousand barrels of oil per day MCF Thousand Cubic Feet MSCFPD Thousand Standard Cubic Feet per day MMSCF Million Standard Cubic Feet MMSCFPD Million Standard Cubic Feet Per Day BWPD Barrels of Water Per Day Gas to oil conversion 6,000 cubic feet = 1 barrel of oil equivalent

4
Letter to shareholders Dear Friends and Fellow Shareholders of Maha Energy AB, It is noteworthy Maha’s acquisition of the Tie and Tartaruga producing oil fields in Brazil is well timed with the ongoing recovery and stabilization of world oil markets. Globally:
“2017 was the third consecutive year of decline in global energy investment with energy efficiency the lone sector of growth” (*) writes the International Energy Agency (IEA) in the World Energy Investment Report for 2018 that was released in July, 2018. The report goes on:
“Oil and gas companies are doing more with less ...
Following the peaks in oil and gas upstream investment reached in 2014, investment collapsed abruptly as a result of lower prices. 2017 investment rebounded by 2% in real terms, and we estimate the same level of growth for 2018.
The oil and gas industry has been traditionally characterized by long-lead time projects with predictable production profiles. Yet as a result of the shale revolution in the United States this trend is changing and the industry is re-thinking the way they choose, execute and manages projects. Furthermore, investment in conventional assets (responsible for the bulk of supply) remains focused on expansion of existing projects rather than developing new sources of production.”
Source : World Energy Investment Report for 2018, International Energy Agency, pg 79, July 2018.
The report shows that after the recent downturn, capital investment in the upstream oil and gas sector bottomed out in 2016. In 2017 there was a slight (2%) increase in capital spending – but annual spending is still 40% less than what it was in 2014. At the peak in 2014, annual capital expenditures in the oil and gas sector were almost USD 800 billion. In 2017, capital spending was USD 440 billion, up modestly from USD 425 billion in 2016.
It is 4 years since world oil price fell from USD 110/bbl to a low of USD 26/bbl. The evidence would suggest it is now safe to assume that the sector has stabilized; Oil prices are up and stable; capital investment has stabilized; the US rig count is stable. Demand, on the other hand, continues its’ relentless upward march with the world poised to

5
breach a 100 million barrel/day of consumption this year notwithstanding efforts towards electric vehicles and efficiencies. Demand has increased, on average, about 1.5% per year since 1980. Rising consumption, the shift away from investment in long-term projects and the USD 1 trillion reduction in upstream investments from 2015-2017 raises serious questions about the industry’s ability to adequately supply the world’s future oil & gas requirements. The threat of new sanctions on Russia and Iran will also, in all likelihood, affect supply.
These observations should be cause for concern. I encourage everyone to read the report – it is full of interesting analysis and facts, including the rise of Electric Vehicles (EV’s) and the corresponding massive demand for mobility as China, India and Africa continue to modernize their economies.
That said I remain bullish on the oil price and I think Maha’s timing is near perfect. The work in Brazil will increase production just as price fully recovers. There is a lot going on, the most exciting of which are Maha’s two announced drilling projects in Brazil.
The first - the 107D sidetrack will be the first horizontal well drilled at Tartaruga. It should spud any day. The Penedo sandstone target is an excellent candidate for this type of technology. The aim is to drill a 500 meter horizontal production hole into a zone that has produced over 650,000 barrels of oil with hardly any water. We are confident the outcome will be oil - drilling will tell how much.
The second - a vertical production well (the Attic Well) is planned to be drilled on the crest of the Tie structure. The structure is a 3-way fault bounded structure that extends across multiple reservoirs. Both the Agua Grande and the Sergi reservoirs are known to be oil bearing and the structurally high well location is expected to access previously unproduced oil and gas from both reservoirs. Both zones are expected to be free flowing and will not initially require artificial lift .The Attic well is now anticipated to be spudded in October. The Attic Well will also explore the previously undrilled Boipeba structure, which could contain oil.
Financially, the second quarter was healthy for Maha despite the planned production shutdowns at the Tartaruga field. Higher oil prices and more production at the Tie field contributed to good consistent results for Maha.
Operationally, while work at Tartaruga did run into some problems because the work over unit hired was too small to pull an (unexpected) stuck existing completion string, the plan is to move the contracted drilling rig across the Tartaruga license area to the 7TTG well to finish the recompletion after the 107D sidetrack is finished.
At the Tie Field there is excellent response to the water flood project started in October last year. The Agua Grande zone remains free flowing with very little water and the gas oil rate has returned to normal. While the Sergi zone has started to experience some water influx which could lead to an accelerated decline, the introduction of the newly purchased (and delivered) jet pump at GTE4 will increase production from both zones and prevent the decline in the Sergi zone.
We thank you for your continued support. “Jonas Lindvall” Managing Director (*) World Energy Investment 2018, International Energy Agency (IEA) 17 July, 2018. (https://webstore.iea.org/world-energy-investment-2018)

6
Financial Report for the Second Quarter ended June 30, 2018 OPERATIONAL AND FINANCIAL REVIEW Maha Energy AB (org number: 559018-9543) (“Maha” or the “Company”) is an independent, Swedish-based, international oil and gas exploration and enhanced oil recovery production company with operations focused on Brazil and USA. The head office is located at Biblioteksgatan 1, 4th floor, 111 46 Stockholm, Sweden. The Company maintains a technical support office at Suite 1140, 10201 Southport Road SW, Calgary, Alberta, Canada T2W 4X9. The Company has an office in Rio de Janeiro, Brazil and operations offices in Salvador, Brazil and in Newcastle, Wyoming, USA. Strategy
The Company’s business activities include the exploration for and development and production of hydrocarbons. The Company’s core expertise is in primary, secondary and enhanced oil and gas recovery technologies and, as such, its business strategy is to target and develop underperforming hydrocarbon assets. By focusing on assets with proven hydrocarbon presence and applying modern and tailored technology solutions to recover the hydrocarbons in place, the Company’s primary risk is not uncertainty in reservoir content but in the fluid extraction. Assets
Country Concession
name Maha Working
Interest (%) Status Area (acres)
BOEPD (3) Partner
USA LAK Ranch 99% Pre-Production 6,475
34 SEC (1%)
Brazil Tartaruga 75% Producing 13,201 41 Petrobras (25%)
Brazil Tie 100% Producing 1,511 1,354
Brazil REC-T 155 100% Exploration 4,276 -
Brazil REC-T 129 100% Exploration 7,241 -
Brazil REC-T 142 100% Exploration 6,856 -
Brazil REC-T 224 100% Exploration 7,192 -
Brazil REC-T 117 100% Exploration 6,795 -
Brazil REC-T 118 100% Exploration 7,734 -
Brazil Tie Field On July 1, 2017, Maha completed the corporate acquisition of Gran Tierra Energy Inc.’s Brazilian operations. Following this transaction, Maha owns and operates, through a wholly-owned subsidiary, the 100% working interests in six onshore concession agreements located in the Reconcavo Basin of Brazil. One of the concessions includes the oil producing Tie Field consisting of two (2) dually completed wells (GTE-3 and GTE-4) and one water injection well (ALV-2). The 380 API oil production is from two, separate, sandstone units called the Agua Grande and Sergi formations.
3 As per the current quarter reported net production volumes. 1BBL = 6000SCF of gas. Approximately 90% of Maha’s oil equivalent production is crude oil.

7
Plans are far advanced to increase production from the Tie field through implementation of artificial lift systems and the drilling of an additional production well during the third quarter of 2018. In line with the increase in oil production, the Tie oil and gas handling facilities will require upgrading. To that end, the Company is working on a three-pronged approach to rapidly monetize production from the Tie field. First, well productivity will be increased through artificial lift and the drilling of additional production wells along with water flooding, second, the production facilities will be upgraded to double the current handling capacity at the Tie gathering station, and third, off-take agreements are being implemented to allow for the additional oil and associated gas to be sold on the local market. The Tie field does not have ready access to oil or gas pipeline outlets, hence the oil and parts of the associated gas are trucked from the field. Average production from the Tie Field during the second quarter of 2018 was 1,244 BOPD and 659 MSCFPD of gas.
GTE-3 Well During July 2018, the Company recompleted the Sergi and Agua Grande zones in the GTE-3 well. The Sergi formation has, on its own, initially tested at 960 BOPD, 218 BWPD and 261 MSCFPD of gas with the assistance of the newly acquired jet pump and is now on production. The purpose-built jet pump separator arrived on site at the beginning of August and the Agua Grande formation is planned to be tested once the new separator is hooked up and commissioned. This work is currently ongoing. Tartaruga Block In January 2017, Maha completed the purchase of an operated legal and beneficial 75% working interest in the Tartaruga development block, located in the Sergipe Alagoas Basin onshore Brazil. The Tartaruga oil field is located in the northern half of the 13,201 acre (53.4 km2) Tartaruga Block and produces 41° API oil from two deviated wells drilled into the early Cretaceous Penedo Formation. The Company plans for a significant work program during 2018 which will include the re-entry and recompletion of the 7TTG producing well along with the re-entry and horizontal drilling of the 107D well. A six week delay in mobilizing the drilling unit to the site has resulted in an equivalent delay in the planned commencement of the 107D sidetrack. This work is now scheduled to be completed during the third quarter of 2018. As stated in prior reports, the multiple stacked Penedo sandstone are likely to respond well to horizontal drilling and hydraulic stimulation. To that end, work planned for Tartaruga includes both hydraulic stimulation of the existing 7TTG well and the horizontal side-tracking of the 107D well. In both cases, the very productive Penedo 1 sandstone layer will be targeted. In the 7TTG well the Penedo 1 sandstone has never been produced. In the 107D well, a horizontal well will be drilled from the existing well location by re-entering the existing wellbore. The work planned for both producing wells are expected to significantly increase productivity of the Tartaruga Field. Associated gas is used as fuel gas for the production plant and any excess gas is flared. Plans are underway to implement a gas electrification project whereby associated gas is turned into electricity and sold to the local market. As both wells on the Tartaruga field is located on a production pad with only 7 meter distance between wellheads, both wells are required to be closed in during all well operations on Tartaruga. Average net production from the Tartaruga Field during the second quarter of 2018 was down to 41 BOPD, as a consequence of the ongoing and planned work to increase production.
107D Sidetrack The drilling rig passed its pre-acceptance test on June 30 and after a lengthy mobilization period, the drilling unit is now rigged up, commissioned and is undertaking preparation work for the 107D sidetrack initiation. The sidetrack is expected to take 45 days to drill and complete.

8
7TTG Workover The 7TTG Workover had to be suspended in June due to stuck tubing which will require a bigger rig. The rig was demobilized and the workover postponed until after the 107D well has been sidetracked as greater pulling capacity rig is required to free the pipe. This larger rig will move across and complete the 7TTG workover upon completion of the 107D well. Upon completion of the work at Tartaruga, a rig will be moved to the Tie Field where it will drill the Attic Well. USA The Company owns and operates a 99% working interest in the LAK Ranch oil field, located on the eastern edge of the multi-billion barrel Powder River Basin in Wyoming, USA. The crude oil density produced from the LAK area is 19° API. Since the purchase of this field in 2013, the Company has been evaluating different oil recovery mechanisms and is currently working towards a staged full field development using a hot water injection scheme. Multiple attempts have been made on the field since its discovery in the 1960’s, including cyclic steam, steam assisted gravity drainage and solvent injection. Maha has determined through drilling results, core analysis, and computer aided modelling, core tests and field pilot tests that a simple water flood using hot water produces the best economic results. Hence, as at June 30, 2018, the LAK Ranch asset is still considered to be in the pre-production stage and is currently undergoing delineation and pre-development work. As such royalties and operating costs, net of revenues, since the commencement of operations have been capitalized as part of exploration and evaluation costs. During the second quarter of 2018, the Company generated revenue from LAK Ranch of TUSD 170, on average sales volume of 34 bopd, compared with TUSD 105 of revenue during the second quarter of 2017 from on average sales volume of 29 bopd. During the second quarter of 2018, preparations were started for the contracting and permitting for completing Phase 3 of the phased development plan. To conclude Phase 3, the Company will drill 6 more hot water injector wells and an additional 2 horizontal production wells. The plan is to commence drilling operations during the third quarter of 2018.
Production
Q2 2018 Q2 2017 H1 2018 H1 2017 Full Year
2017 Delivered Oil (Barrels)4 120,077 23,569 262,587 33,886 310,479 Delivered Gas (MSCF) 59,937 - 156,219 - 144,602 Delivered Oil & Gas (BOE)5 130,067 23,569 288,624 33,886 334,579 Daily Volume (BOEPD) 1,429 259 1,595 187 917
Production volumes shown are working interest volumes before royalties. Average production daily volumes increased significantly by 450% for the second quarter 2018 as compared to the second quarter 2017 due to the acquired assets in Tie Field. Second quarter and first half of 2017 includes the production from the Tartaruga Block which was acquired on January 1, 2017. Approximately 90% of Maha’s oil equivalent production is crude oil. Due to the preparation work in relation to the capital projects in the Tartaruga field, production was shut in for the majority of the second quarter of 2018.
4 Includes LAK Ranch Oil delivered during the period 5 BOE is Barrels of Oil Equivalent and takes into account gas delivered and sold. 1 bbl = 6,000 SCF of gas
9
Revenue
(TUSD, unless otherwise noted) Q2 2018 Q2 2017 H1 2018 H1 2017 Full Year
2017 Oil and Gas revenue 7,859 1,043 16,488 1,492 14,604 Sales volume (BOE) 129,308 20,963 287,538 28,343 325,320 Oil realized price (USD/bbl) 65.60 49.76 62.65 52.63 47.94 Gas realized price (USD/MSCF) 0.99 - 1.04 - 1.22 Equivalent oil realized price (USD/Boe) 60.78 49.76 57.34 52.63 44.89 Reference price – Brent (USD/bbl) 74.95 49.55 70.99 51.57 54.74
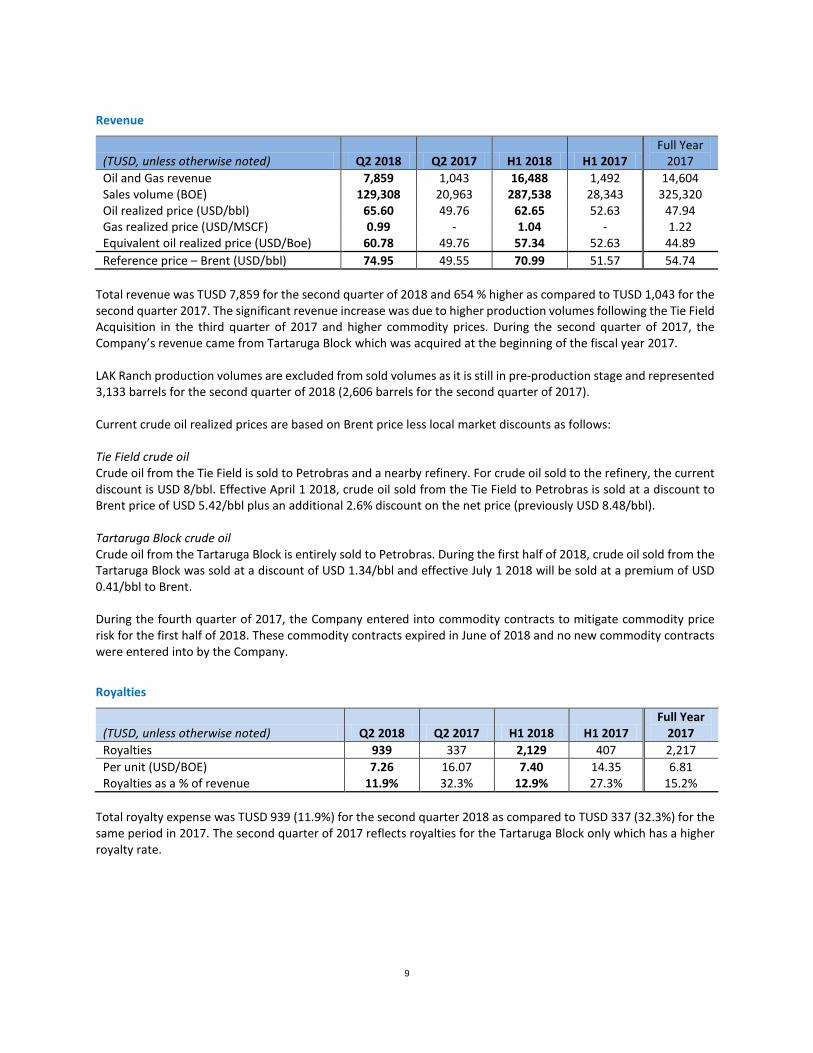
Total revenue was TUSD 7,859 for the second quarter of 2018 and 654 % higher as compared to TUSD 1,043 for the second quarter 2017. The significant revenue increase was due to higher production volumes following the Tie Field Acquisition in the third quarter of 2017 and higher commodity prices. During the second quarter of 2017, the Company’s revenue came from Tartaruga Block which was acquired at the beginning of the fiscal year 2017. LAK Ranch production volumes are excluded from sold volumes as it is still in pre-production stage and represented 3,133 barrels for the second quarter of 2018 (2,606 barrels for the second quarter of 2017). Current crude oil realized prices are based on Brent price less local market discounts as follows: Tie Field crude oil Crude oil from the Tie Field is sold to Petrobras and a nearby refinery. For crude oil sold to the refinery, the current discount is USD 8/bbl. Effective April 1 2018, crude oil sold from the Tie Field to Petrobras is sold at a discount to Brent price of USD 5.42/bbl plus an additional 2.6% discount on the net price (previously USD 8.48/bbl). Tartaruga Block crude oil Crude oil from the Tartaruga Block is entirely sold to Petrobras. During the first half of 2018, crude oil sold from the Tartaruga Block was sold at a discount of USD 1.34/bbl and effective July 1 2018 will be sold at a premium of USD 0.41/bbl to Brent. During the fourth quarter of 2017, the Company entered into commodity contracts to mitigate commodity price risk for the first half of 2018. These commodity contracts expired in June of 2018 and no new commodity contracts were entered into by the Company.
Royalties
(TUSD, unless otherwise noted) Q2 2018 Q2 2017 H1 2018 H1 2017 Full Year
2017 Royalties 939 337 2,129 407 2,217 Per unit (USD/BOE) 7.26 16.07 7.40 14.35 6.81 Royalties as a % of revenue 11.9% 32.3% 12.9% 27.3% 15.2%
Total royalty expense was TUSD 939 (11.9%) for the second quarter 2018 as compared to TUSD 337 (32.3%) for the same period in 2017. The second quarter of 2017 reflects royalties for the Tartaruga Block only which has a higher royalty rate.

10
Production and operating costs
(TUSD, unless otherwise noted) Q2 2018 Q2 2017 H1 2018 H1 2017 Full Year
2017 Production costs 1,654 459 2,975 847 3,069 Transportation costs 195 - 456 - 623 Total Production and operating costs 1,849 459 3,431 847 3,692 Per unit (USD/BOE) 14.30 21.93 11.93 29.89 11.35
Production costs declined on a per BOE basis as a result of lower per barrel costs from the Tie Field operation acquired during the third quarter of 2017 and higher production volumes in the second quarter of 2018 as compared to the second quarter of 2017. On a per BOE basis, second quarter of 2018 is higher against 2018 year-to-date as a result of lower fixed cost absorption from lower production volumes from the Tartaruga Block.
Netback
(TUSD, unless otherwise noted) Q2 2018 Q2 2017 H1 2018 H1 2017 Full Year
2017 Operating Netback 5,071 247 10,928 238 8,695 Netback (USD/BOE) 39.22 11.76 38.01 8.39 26.73
Netback is calculated as revenue less royalties, production and operating costs. LAK Ranch is still in pre-production stage therefore royalties and operating costs, net of revenues, are being capitalized as part of exploration and evaluation costs and are not included in the Company’s netback.
General and Administration expenses (“G&A”)
(TUSD, unless otherwise noted) Q2 2018 Q2 2017 H1 2018 H1 2017 Full Year
2017 G&A 1,017 1,230 2,215 2,228 5,257 G&A (USD/BOE) 7.87 58.67 7.70 78.61 16.16
Lower G&A expenses of TUSD 1,017 for the second quarter 2018 versus the comparable period is starting to show results of the Company’s ongoing review of its G&A expenses and implemented measures towards increasing synergies and efficiencies following the Tie Field and the Tartaruga Block acquisitions during 2017. As a result of higher capital activity in 2018 there has also been higher G&A capitalized amounts than in the comparable period.
Depletion, depreciation and amortization (“DD&A”)
(TUSD, unless otherwise noted) Q2 2018 Q2 2017 H1 2018 H1 2017 Full Year
2017 DD&A 724 515 1,588 728 2,091 DD&A (USD/boe) 5.60 24.57 5.52 25.69 6.43
The depletion rate is calculated on proved and probable oil and natural gas reserves, taking into account the future development costs to produce the reserves. Depletion expense is computed on a unit-of-production basis. The depletion rate will fluctuate on each re-measurement period based on the amount and type of capital spending and the amount of reserves added.
11
Depletion for the second quarter 2018 amounted to TUSD 724 (Q2 2017: TUSD 515) at an average rate of USD 5.60 per BOE (Q2 2017: USD 24.57 per BOE). Depletion expense, on a per BOE basis, has been reduced significantly due to the increase in volume from the Tie Field Acquisition in the third quarter of 2017, as well as a larger capital asset base being depleted as a result of the acquisitions. In addition, the Company’s depletion rate on a USD/BOE basis was significantly reduced in the fourth quarter of 2017 when it recorded an increase to its oil and gas reserves.
Net financial items
Net finance expense amounted to USD 1.2 million and USD 0.5 million for the second quarter of 2018 and the comparative period of 2017, respectively. The main reason for the increase is interest expense of USD 1.0 million on the Senior Secured Bond issued on May 29, 2017 and accretion of the bond payable discount of TUSD 263 for the second quarter of 2018. Accretion of the discount rate on the decommissioning liabilities provision amounted to TUSD 27. Included in Finance costs are foreign currency exchange related to financing costs and foreign currency risk management contracts.
Share data
As at June 30, 2018 the Company had 98,670,574 shares outstanding of which 89,661,129 were class A shares and 8,209,445 were class B shares. In addition, there were 800,000 convertible class C2 shares, after giving effect to the forfeiture of 300,000 options and cancellation of 257,789 options for which the corresponding C2 shares are in the process of being formally cancelled. In the event that the existing Maha (Canada) stock options and warrants are exercised these convertible class C2 shares will be redeemed and exchanged for class A shares.
• During the first quarter of 2018 a total of 2,074,717 of Maha-A TO warrants were exercised prior to their
expiration on January 15, 2017 at the pre-determined strike price of SEK 6.40 per share representing approximately one third of all of the A warrants outstanding. Accordingly, 2,074,717 A Warrants were cancelled and the same number of new shares of class A issued. The remainder of the Maha-A TO warrants are now expired. The total proceeds from this transaction was SEK 13.3 million before issuance costs.
• During the second quarter of 2018 a total of 640,211 shares were issued upon conversion of C2 shares. A total of 898,000 options expired at the end of March 2018, of which 640,211 were converted and remainder are in the process of being cancelled.
Liquidity and capital resources
As at June 30, 2018, the Company had current assets of $27.0 million comprised primarily of cash and cash equivalents, accounts receivable and prepaid expenses and deposits. The Company had current liabilities of $6.4 million resulting in net working capital of $20.6 million (December 31, 2017 – $17.5 million).
Financial Risks
The Company is in the oil exploration and development business and is exposed to a number of risks and uncertainties inherent to the oil industry. This activity is capital intensive at all stages and subject to fluctuations in oil prices, market sentiment, currencies, inflation and other risks. The Company has cash in hand and expects to generate cash flow from operations to fund its development and operating activities. Material increases or decreases in the Company’s liquidity may be substantially determined by the success or failure of its development activities, as well as its continued ability to raise capital or debt. Additional information on financial risks identified by the Company are presented in note 12 to the Financial Statements.

12
Legal matters
Following the Tie Field Acquisition effective July 1, 2017, the Company inherited, through the acquisition of Gran Tierra Energy Brazil Ltda., a number of disclosed pre-existing legal matters concerning labor, regulatory and operations, each of which are considered routine, non-material and consistent with doing business in Brazil. Provisions for lawsuits have, in consultation with the Company’s local legal counsel, been recorded under accrued liabilities and provisions.
Health, Safety and the Environmental
At Maha, Health, Safety and the Environment is a key component of its management systems. Maha Energy strives to provide a safe and healthy work environment for all employees, contractors and suppliers. This means the safety of life, limb, environment and property always comes second. The Company actively monitors all operational sites and proactively encourages everyone to be mindful of all the Company’s HSE Values. This is achieved through education, enforcement and reporting. Everyone working or visiting our sites have the right to stop work at any time to prevent potential HSE incidents occurring. Maha’s HSE Values set the tone for how we approach each other and the environment. Additional information on environmental, decommissioning and abandonment obligations in relation to oil and gas leases is presented in note 9 to the Financial Statements.
Corporate Governance and Sustainability
Part of contributing to society and being a good global citizen must entail doing ‘what is right’, in addition to adhering to laws and regulations. One of the ways we ensure sustainability is to maximize recovery from existing energy sources and in order to do so effectively it is important to minimize scope changes. If we can prevent costly and impactful changes in development plans, we contribute to sustainability. Another way to contribute to a sustainable planet, is to ensure all resources are used. We therefore recycle produced water at our LAK Ranch facility which not only reduces having to find water from another source, but also reduces waste water treatment requirements. In Brazil, we are reducing the release of natural gas by using the waste gas from oil production to generate electricity. Maha does not tolerate any form of corrupt practices and have in place Corporate Governance Policies that clearly define how we must do business. The best way to prevent corruption is through transparency — transparency is one of our core values. The Company has established Codes of Business Conduct and Anti-Corruption policies in place for all its employees, contractors and workers. More information on Corporate Governance can be found in Maha’s Corporate Governance Report in the 2017 Annual Report.
Seasonal Effects
Maha Energy has no significant seasonal variations.
Parent Company
Business activities for Maha Energy AB focuses on: a) management and stewardship of all Group affiliates, subsidiaries and foreign operations; b) management of publicly listed Swedish entity; c) fundraising as required for acquisitions and Group business growth; and d) business development. The Parent Company has no employees. Last year’s activities focused on the corporate acquisitions by the Group of the Brazilian operations of Grand Tierra Energy Inc. in Bahia, Brazil and the Tartaruga Field in Sergipe, Brazil (the ‘’Acquisitions”) and the funding of the Acquisitions through a Directed Share Issue, a Rights Offering and a Bond financing.

13
The net result for the Parent Company for the second quarter 2018 amounted to TSEK -18,038 (Q2 2017: TSEK -20,473). The result includes general and administrative expenses of TSEK 1,219 (Q2 2017: TSEK 5,813) and net finance costs of TSEK 20,232 (Q2 2017: 4,065).
Related Party Transactions
The Company did not enter into any transaction with related parties during the second quarter of 2018.
Subsequent Events
There are no subsequent events to report.
Approved by the Board _``Jonas Lindvall``____________________ Jonas Lindvall, Director _``Wayne Thomson``____________________ Wayne Thomson, Director

14
Maha Energy AB Consolidated Statement of Operations (TUSD) Note Q2 2018 Q2 2017 H1 2018 H1 2017 Revenue Oil sales 5 7,859 1,043 16,488 1,492 Royalties (939) (337) (2,129) (407) 6,920 706 14,359 1,085 Expenses Production and operating (1,849) (459) (3,431) (847) General and administration (1,017) (1,230) (2,215) (2,228) Stock-based compensation (82) 16 (113) 14 Depletion, depreciation and amortization 8 (724) (515) (1,588) (728) Financial Instruments 12 (12) - (74) - Foreign currency exchange gain (loss) 1 (1,291) 97 (1,302)
(3,683) (3,479) (7,324) (5,091)
Operating result 3,237 (2,773) 7,035 (4,006)
Net finance costs 6 (1,158) (534) (2,457) (550) Transaction costs - (319) - (319) Result before tax 2,079 (3,626) 4,578 (4,875)
Income tax (220) - (413) - Net result from continuing operations 1,859 (3,626) 4,165 (4,875)
Discontinued operations Loss on disposition – Canadian assets - - - (54)
Net result for the period 1,859 (3,626) 4,165 (4,929)
Earnings per share basic From continuing operations 0.02 (0.04) 0.04 (0.06) From discontinued operations - - - -
Earnings per share fully diluted
From continuing operations 0.02 - 0.04 - From discontinued operations - - - -
Weighted average number of shares:
Before dilution 97,650,057 83,372,085 97,175,412 77,999,910 After dilution 97,834,378 83,372,085 97,296,552 77,999,910

15
Maha Energy AB Consolidated Statement of Comprehensive Result (TUSD) Note Q2 2018 Q2 2017 H1 2018 H1 2017
Net Result for the period 1,859 (3,626) 4,165 (4,929)
Exchange differences on translation of foreign operations
2
(7,094) 1,272 (5,894) 1,362
Comprehensive result for the period (5,235) (2,354) (1,729) (3,567)

16
Maha Energy AB Consolidated Balance Sheet (Thousands of US dollars) Note June 30, 2018 December 31, 2017 Assets Non-Current assets Exploration and evaluation assets 7 17,797 17,789 Property, plant and equipment 8 49,274 47,278 Performance bonds and others 177 176 67,248 65,243 Current assets Financial Instruments 12 2 141 Crude Oil Inventory 200 314 Prepaid expenses and deposits 459 753 Accounts receivable 12 2,700 2,229 Restricted cash 16 2,729 3,037 Cash and cash equivalents 20,914 18,729 27,004 25,203 Total Assets 94,252 90,446 Shareholders’ Equity and Liabilities Shareholders’ Equity 10 48,212 48,201 Non-Current liabilities Bond payable 11 30,422 32,678 Decommissioning provision 9 1,554 1,849 Other long term liabilities and provisions 3,16 7,641 - 39,617 34,527 Current liabilities Accounts payable 3,789 3,502 Accrued liabilities and other 2,634 4,216 6,423 7,718 Total liabilities 46,040 42,245 Total liabilities and shareholders’ equity 94,252 90,446

17
Maha Energy AB Consolidated Statement of Cash Flows (TUSD) Note Q2 2018 Q2 2017 H1 2018 H1 2017 Cash flow from operations Net result from continuing operations 1,859 (3,626) 4,165 (4,875) Add back: Stock based compensation 82 (16) 113 (14) Depletion, depreciation and amortization 8 724 515 1,588 728 Accretion of decommissioning provision 9 27 10 51 19 Accretion of bond payable 11 263 65 541 65 Interest expense 6 1,036 - 2,145 Financial instruments 12 39 - 137 - Unrealized foreign exchange amounts 776 1,535 1,592 1,568 Interest paid (2,057) - (2,057) Interest received 186 - 330 Cash tax paid (220) - (413) Changes in non-cash working capital 14 461 3,774 (1,669) 4,083 Cash flow from operations 3,176 2,257 6,523 1,574 Investing activities Corporate acquisition – Tartaruga 3 - - - (350) Corporate acquisition – Tie Field 3 - (40,169) - (43,669) Proceeds on sale of Canadian assets - 111 - 111 Additions to property, plant and equipment 8 (2,516) (2) (3,034) (615) Additions of exploration and evaluation assets 7 30 (59) (8) (405) Purchase of performance bonds - - - (25) Cash flow from investment activities (2,486) (40,119) (3,042) (44,953) Financing activity activities Issue of shares, net of share issue costs 10 (71) 6,852 1,525 16,487 Issue of bonds, net of financing costs 11 - 32,734 - 32,734 Exercise of stock options 10 102 - 102 Cash flow from financing activities 31 39,586 1,627 49,221 Foreign exchange on cash and cash equivalent (2586) 639 (2,923) 724 Change in cash and cash equivalents (1,865) 2,363 2,185 6,566
Cash and cash equivalents, beginning of period
22,779 10,961 18,729 6,758 Cash and cash equivalents, end of period 20,914 13,324 20,914 13,324
18
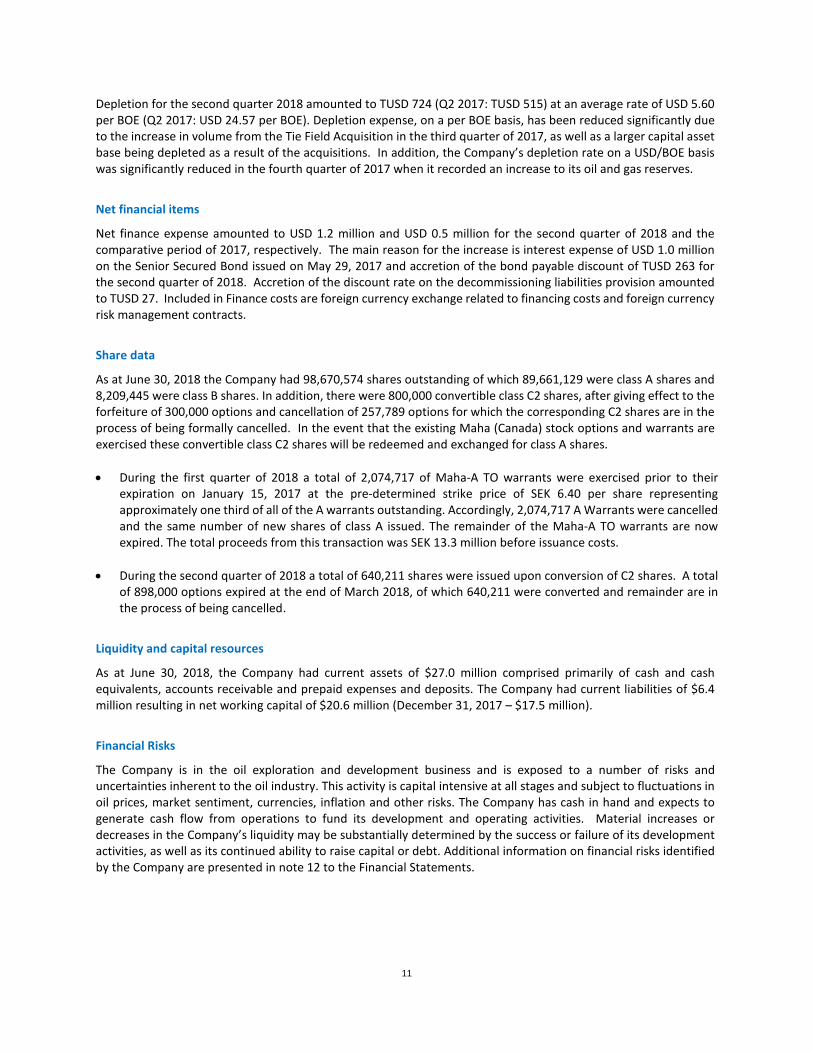
Maha Energy AB Consolidated Statement of Changes in Equity
(TUSD) Share Capital Contributed
Surplus Other
Reserves Retained Earnings
Total Shareholders’
Equity Balance at January 1, 2017 87 40,567 (738) (8,780) 31,136 Comprehensive result Result for the period - - - (2,850) (2,850) Currency translation difference - - (621) - (621) Total comprehensive result - - (621) (2,850) (3,471) Transactions with owners Share issuance 32 20,644 - - 20,676 Share issue cost - (2,680) - - (2,680) Fair market value of warrants issued - 2,211 - - 2,211 Reduction of capital (2) 2 - - - Stock based compensation - 37 - - 37 Exercise of warrants - 3 - - 3 Exercise of stock options - 289 - - 289 Total transactions with owners 30 20,506 - - 20,536 Balance at December 31, 2017 117 61,073 (1,359) (11,630) 48,201 Comprehensive result Result for the period - - - 4,165 4,165 Currency translation difference - - (5,894) - (5,894) Total comprehensive result - - (5,894) 4,165 (1,729) Transactions with owners Share issue cost - (60) - - (60) Stock based compensation - 113 - - 113 Exercise of warrants and options 3 1,684 - - 1,687 Total transactions with owners 3 1,737 - - 1,740 Balance at June 30, 2018 120 62,810 (7,253) (7,465) 48,212

19
Parent Company Statement of Operations (Expressed in thousands of Swedish Krona) Q2 2018 Q2 2017 H1 2018 H1 2017 Revenue - - - - Expenses General and administrative (1,219) (5,813) (1,787) (6,695) Stock-based compensation 10 (694) - (944) Financial instruments 12 (116) - (618) Foreign currency exchange gain(loss) 4,223 (10,595) 5,445 (10,462) Operating result 2,194 (16,408) 2,096 (17,157) Net finance costs (20,232) (4,065) (22,627) (4,089) Result before tax (18,038) (20,473) (20,531) (21,246) Income tax - - - - Net Result for the period (18,038) (20,473) (20,531) (21,246)
Parent Company Balance Sheet (Thousands of Swedish Krona) June 30, 2018 December 31, 2017 Assets Non-current assets Investment in subsidiaries 183,640 183,640 Loans to subsidiaries 472,461 408,226 656,101 591,866 Current assets Loans to subsidiaries - 22,407 Financial Instruments - 620 Accounts receivable and other 632 230 Cash and cash equivalents 60,054 103,294 60,686 126,551 Total Assets 716,787 718,417 Shareholders’ Equity and Liabilities Shareholders’ Equity 440,631 446,562 Non-current liabilities Bond Payable 271,960 267,423 Current liabilities Accounts payable and accrued liabilities 4,196 4,432 Total liabilities 276,156 271,855 Total Equity and Liabilities 716,787 718,417

20
Parent Company Statement of Changes in Equity
Restricted
equity Unrestricted equity
(Thousands of Swedish Krona) Share capital Contributed
surplus Retained Earnings Total Equity
Balance at January 1, 2017 804 288,227 (1,634) 287,397 Share issuance 284 183,111 - 183,395 Share issue costs - (23,708) - (23,708) FMV of warrants issued - 19,610 - 19,610 Reduction in capital (20) 20 - - Stock based compensation - 416 - 416 Exercise of warrants and stock options - 2,869 - 2,869 Result for the period - - (23,417) (23,417) Balance at December 31, 2017 1,068 470,545 (25,051) 446,562 Share issue costs - (504) - (504) Stock based compensation - 944 - 944 Exercise of warrants and stock options 23 14,137 - 14,160 Result for the period - - (20,531) (20,531) Balance at June 30, 2018 1,091 485,122 (45,582) 440,631

21
Notes to the Consolidated Financial Statements 1. Corporate information
Maha Energy AB (“Maha (Sweden)” or “the Company”) Organization Number 559018-9543 and its subsidiaries (together “Maha” or “the Group”) are engaged in the acquisition, exploration and development of oil and gas properties. The Company has operations in Brazil and the United States. The Company sold its Canadian producing assets effective January 1, 2017. The results from the Canadian Assets sale are reported as discontinued operations. The head office is located at Biblioteksgatan 1, 4th floor, 111 46 Stockholm, Sweden. The Company’s subsidiary, Maha Energy Inc., maintains its technical office at Suite 1140, 10201 Southport Road SW, Calgary, Alberta, Canada T2W 4X9. The Company has an office in Rio de Janeiro, Brazil and operations offices in Newcastle, Wyoming, USA and Salvador, Brazil. Maha (Sweden) was incorporated on June 16, 2015 under the Swedish Companies Act and was registered by the Swedish Companies Registration Office on July 1, 2015. Maha Energy Inc. (“Maha (Canada)”), was incorporated on January 23, 2013 pursuant to the Alberta Business Corporations Act. Maha (Canada) began its operations on February 1, 2013.
2. Basis of presentation
The consolidated financial statements have been prepared in accordance with International Accounting Standard (IAS) 34, Interim Financial Reporting, the IFRS adopted by the EU and the Swedish Annual Accounts Act. The financial reporting of the Parent Company (Maha Energy AB) has been prepared in accordance with accounting principles generally accepted in Sweden, with the Swedish Financial Reporting Board recommendation, RFR2, reporting for legal entities and the Swedish Annual Accounts Act. These condensed interim Financial Statements are stated in thousands of US dollars (USD), unless otherwise noted, and have been prepared on a historical cost basis, except for certain financial instruments which are stated at fair value. The accounting principles as described in the Annual Report 2017 have been used in the preparation of this report. New and Revised Accounting Standards
IFRS 9; “Financial Instruments” addresses the classification, measurement and recognition of financial assets and financial liabilities. The standard replaces the guidance in IAS 39 that relates to the classification and measurement of financial instruments. IFRS 9 retains but simplifies the mixed measurement model and establishes six primary measurement categories for financial assets. The standard is effective for annual periods beginning on or after January 1, 2018. The Company has elected not to adopt the standard early. The Company has assessed the impact of this standard and has concluded that the standard will not have significant impact on the financial statements. IFRS 15; “Revenue from contracts with customers” deals with revenue recognition and establishes principles for reporting the nature, amount, timing, and uncertainty of revenue and cash flows arising from an entity’s contracts with customers. The standard replaces IAS 11 and IAS 18 and is effective for annual periods beginning on or after January 1, 2018. Early adoption is permitted. The application of IFRS 15 did not have an impact on the Company’s consolidated financial position, results of operations or cash flows but does require enhanced disclosures about the Company's revenue transactions. Oil sales revenue, derived from crude oil production in Brazil, is recognized when the performance obligations are satisfied and revenue can be reliably measured. IFRS 16; “Leases” was issued in January 2016 and replaces IAS 17. The standard introduces a single lessee accounting model for leases with required recognition of assets and liabilities for most leases. The standard is effective for fiscal
22
year beginning on or after January 1, 2019 with early adoption permitted if the Company is also applying IFRS 15. Interpretation of this standard is currently in progress. Going Concern
The Company prepared these Financial Statements on a going concern basis, which contemplates the realization of assets and liabilities in the normal course of business as they become due. Presentation and Functional Currency
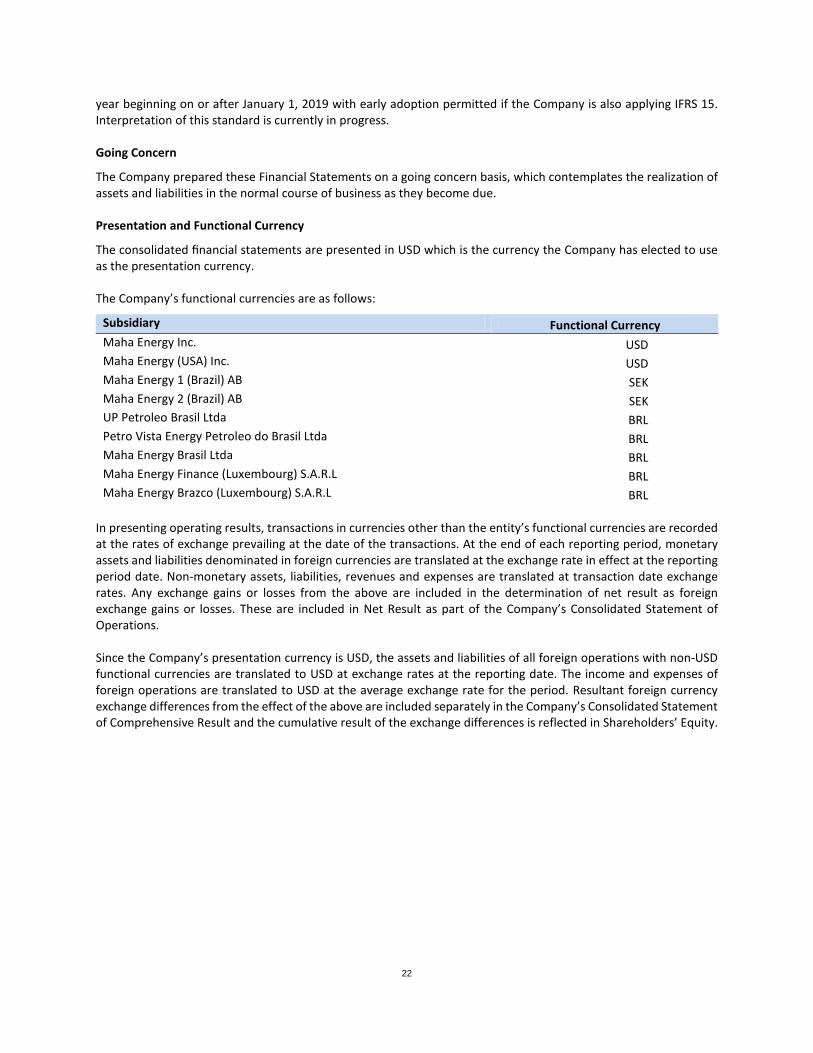
The consolidated financial statements are presented in USD which is the currency the Company has elected to use as the presentation currency. The Company’s functional currencies are as follows:
Subsidiary Functional Currency Maha Energy Inc. USD Maha Energy (USA) Inc. USD Maha Energy 1 (Brazil) AB SEK Maha Energy 2 (Brazil) AB SEK UP Petroleo Brasil Ltda BRL Petro Vista Energy Petroleo do Brasil Ltda BRL Maha Energy Brasil Ltda BRL Maha Energy Finance (Luxembourg) S.A.R.L BRL Maha Energy Brazco (Luxembourg) S.A.R.L BRL
In presenting operating results, transactions in currencies other than the entity’s functional currencies are recorded at the rates of exchange prevailing at the date of the transactions. At the end of each reporting period, monetary assets and liabilities denominated in foreign currencies are translated at the exchange rate in effect at the reporting period date. Non-monetary assets, liabilities, revenues and expenses are translated at transaction date exchange rates. Any exchange gains or losses from the above are included in the determination of net result as foreign exchange gains or losses. These are included in Net Result as part of the Company’s Consolidated Statement of Operations. Since the Company’s presentation currency is USD, the assets and liabilities of all foreign operations with non-USD functional currencies are translated to USD at exchange rates at the reporting date. The income and expenses of foreign operations are translated to USD at the average exchange rate for the period. Resultant foreign currency exchange differences from the effect of the above are included separately in the Company’s Consolidated Statement of Comprehensive Result and the cumulative result of the exchange differences is reflected in Shareholders’ Equity.

23
3. Corporate Acquisition
Gran Tierra Acquisition – Brazil Operations
On July 1, 2017, Maha acquired the Brazilian business unit of Gran Tierra Energy Inc. (“Tie Field Acquisition”) through the purchase of all of the shares and outstanding intercompany debt of Gran Tierra Finance (Luxembourg) S.Á.R.L., including assumed liabilities involved with the going-concern operations for the total cash consideration of $36.5 million and the assumption of approximately $11 million in Government Guarantees and Letters of Credit. The Tie Field Acquisition was accounted for as a business combination in accordance with IFRS 3, Business Combinations, using the acquisition method of accounting whereby identifiable assets acquired and liabilities assumed were recorded at fair value. The purchase price allocation is preliminary and the amounts assigned to the assets and liabilities acquired are subject to adjustments. Fair value estimates were made based on significant unobservable (Level 3) inputs and based on the best information available at the time. The following table shows the allocation of the consideration based on the fair value of the assets and liabilities acquired: (TUSD) Cash Consideration 36,520 Cash 3,432 Accounts receivable 598 Inventory and materials 63 Prepaid and others 195 Property, plant and equipment 45,513 Accounts payable and accrued liabilities (4,735) Taxes payable (184) Decommissioning provision (978) Other long term liabilities and provisions (7,384) Net assets acquired 36,520 Consideration, net of cash acquired 33,088 During the second quarter of 2018, further information was obtained on the acquired contingent liabilities, which allowed to reach a more reliable estimate. As a result, management has determined that the fair values of the assumed liabilities to be $1.4 million higher than preliminarily estimated in the third quarter of 2017 and a $6.3 million long term provision recorded in the second quarter of 2018 with a corresponding $7.1 million increase in the fair value of property, plant and equipment. In accordance with IFRS, these changes were accounted for in the current quarter without retrospective revisions of prior periods. The allocation of the consideration is incomplete and is subject to change. Management is continuing to review and assess information to accurately determine the acquisition date fair value of the assets and liabilities acquired. During the measurement period, the Company will continue to obtain information to assist in finalizing the fair value of net assets acquired, which may differ materially from the above preliminary estimates.

24
4. Segment Information
The Company operates in Canada, Sweden, Brazil and the United States of America. Operating segments are based on a geographic perspective and reported in a manner consistent with the internal reporting provided to the executive management. The following tables present the operating result for each segment from continuing operations. Revenue and income relate to external (non-intra group) transactions.
(TUSD) Canada US Brazil Sweden Total Statement of Operations: June 30, 2018 Revenue - - 16,488 - 16,488 Royalties - - 2,129 - 2,129 Production and operating - - 3,431 - 3,431 General and administration 1,172 84 746 213 2,215 Stock-based compensation - - - 113 113 Depletion, depreciation and amortization 5 22 1,561 - 1,588 Financial Instruments - - - 74 74 Foreign currency exchange loss (gain) (72) - (27) 2 (97) Operating results (1,105) (106) 8,648 (402) 7,035 Non-current assets 21 20,324 46,903 - 67,248 Total assets 3,356 20,660 63,437 6,799 94,252 (TUSD) Canada US Brazil Sweden Total June 30, 2017 Statement of Operations: Revenue - - 1,492 - 1.492 Royalties - - 407 - 407 Production and operating - - 847 - 847 General and administration 1,221 267 193 547 2,228 Stock-based compensation (14) - - - (14) Depletion, depreciation and amortization 1 28 699 - 728 Financial Instruments - - - - - Foreign currency exchange loss (gain) 74 - 3 1,225 1,302 Operating results (1,282) (295) (657) (1,772) (4,006) Non-current assets 9 19,147 7,033 43,669 69,858 Total assets 479 19,463 7,373 58,340 85,655
All oil and gas revenue is derived entirely from Brazilian operations. Revenue, operating expenses and depletion therefore only relate to Brazil. Revenues from transactions with the Company’s largest customer exceed 10% of revenue.

25
5. Revenue
The Company’s oil sales revenues are derived from two major customers, under contracts based on floating prices, the Brent oil benchmark adjusted for contracted discounts. The discount applied to the average Brent price is a fixed cost per barrel as per the contracts. As at June 30, 2018, accounts receivable included $1.8 million of accrued sales revenue which related to the second quarter of 2018 production. Revenue is measured at the consideration specified in the contracts and represents amounts receivable net of discounts and sales taxes. Performance obligations associated with the sale of crude oil are satisfied when control of the product is transferred to the customer. This occurs when the oil is physically transferred to the delivery point agreed with the customer and the customer obtains legal title. 6. Finance Costs
(TUSD) Q2 2018 Q2 2017 H1 2018 H1 2017 Interest on bond payable 1,035 338 2,145 338 Accretion of bond payable (note 11) 263 65 541 65 Accretion of decommissioning provision 27 10 51 19 Foreign currency exchange losses (1) - - - Risk management contracts 27 - 64 - Interest income and other (193) 121 (344) 128 1,158 534 2,457 550
7. Exploration and evaluation assets (E&E)
(TUSD) Balance, December 31, 2016 17,174 Expenditures in the period 954 Incidental result from sale of crude oil (339) Balance, December 31, 2017 17,789 Expenditures in the period 234 Incidental result from sale of crude oil (227) Balance, June 31, 2018 17,797
As at June 31, 2018, the LAK Ranch Project had not established both technical feasibility and commercial viability and therefore remains classified as an E&E asset. Expenditures, net of revenues, for the LAK Ranch Project have been capitalized as E&E.

26
8. Property, Plant and Equipment (PP&E)
(TUSD) Oil and gas properties Equipment and
Other Total Cost Balance at December 31, 2016 2,935 1,663 4,598
Sale of Canadian assets (2,976) - (2,976) Tartaruga Acquisition 7,142 226 7,368 Tie Field Acquisition 38,194 271 38,465 Additions 2,077 64 2,141 Currency translation adjustment (136) (73) (209)
Balance at December 31, 2017 47,236 2,151 49,387 Tie Field Acquisition 7,048 - 7,048 Additions 3,045 865 3,910 Currency translation adjustment (7,825) (60) (7,885)
Balance at June 30, 2018 49,504 2,956 52,460 Accumulated depletion and depreciation Balance at December 31, 2016 (2,111) (174) (2,285)
Sale of Canadian assets 2,111 - 2,111 Depletion, depreciation and amortization (1,867) (136) (2,003) Currency translation adjustment 60 8 68
Balance at December 31, 2017 (1,807) (302) (2,109) Depletion, depreciation and amortization (1,245) (76) (1,321) Currency translation adjustment 229 15 244
Balance at June 30, 2018 (2,823) (363) (3,186) Carrying amount December 31,2017 45,429 1,849 47,278 June 30, 2018 46,681 2,593 49,274
9. Decommissioning provision
The decommissioning provision were estimated based on the net ownership interest of wells and facilities, management’s estimate of costs to abandon and reclaim those wells and facilities, and the potential future timing of the costs to be incurred. The following table presents the reconciliation of the opening and closing decommissioning provision:
(TUSD) Balance at December 31, 2016 829
Liability on assets acquired through acquisition 1,179 Liability on Canadian assets sold (265) Change in estimate 40 Accretion expense 75 Foreign exchange movement (9)
Balance at December 31, 2017 1,849 Accretion expense 51 Foreign exchange movement (346)
Balance at June 30, 2018 1,554

27
10. Share Capital
Number of Shares by Class Shares outstanding A B C1 C2 Total Balance at December 31, 2016 56,522,199 12,140,795 - 2,648,000 71,310,994 Conversion of convertible B shares 2,957,174 (2,957,174) - - - Exercise of Maha (Canada) options 650,000 - - (650,000) - Exercise of warrants 4,000 - - - 4,000 Forfeiture of options - - - (300,000) (300,000) Issuance of shares 25,838,652 - - - 25,838,652 Balance at December 31, 2017 85,972,025 9,183,621 - 1,698,000 96,853,646 Exercise of warrants 2,074,717 - - - 2,074,717 Conversion of convertible B shares 974,176 (974,176) - - - Exercise of Maha (Canada) options 640,211 - - (640,211) - Cancelled options - - - (257,789) (257,789) Balance at June 30, 2018 89,661,129 8,209,445 - 800,000 98,670,574 During the first quarter of 2018, a total of 2,074,717 of Maha-A TO warrants were exercised prior to their expiration on January 15, 2017 at the pre-determined strike price of SEK 6.40 per share representing approximately one third of all of the A warrants outstanding. Accordingly, 2,074,717 A Warrants were cancelled and the same number of new shares of class A issued. The remainder of the Maha-A TO warrants are now expired. The total proceeds from this transaction was SEK 13.3 million before issuance costs. During the first quarter of 2018, a total of 898,000 C2 options were exercised prior to the expiration, of which 640,211 Class A shares were registered and issued during the second quarter and remainder of the 257,789 options were cancelled. As at June 30, 2018, these options are in the process of being cancelled. At June 30, 2018 proceeds of approximately TUSD 21 are outstanding and are included in accounts receivable. Subsequent to June 30, 2018, a portion of the outstanding amount was collected by the Company. Maha AB share purchase warrants outstanding
As part of the IPO Financing, the Company issued common share purchase warrants, each convertible into one class A share of Maha Energy AB, upon payment of the exercise price. The warrants have an exercise price of SEK 6.40 (USD 0.78) and expire on January 15, 2018. During the second quarter of 2018, 2,074,717 of these warrants were exercised prior to the expiration date. As part of the Bonds financing (note 11), the Company issued 13,350,000 common share purchase warrants, each convertible into one Class A share of Maha Energy AB, upon payment of the exercise price. The warrants have an exercise price of SEK 7.45 (USD 0.83) and expire on May 29, 2021. The following warrants are outstanding at June 30, 2018: Number of Warrants Exercise Price # USD Balance, December 31, 2016 6,204,963 0.78
Exercised (4,000) 0.78 Issued 13,350,000 0.91
Balance, December 31, 2017 19,550,963 0.87 Exercised 2,074,717 0.72 Expired (4,126,246) 0.72
Balance, June 30, 2018 13,350,000 0.94

28
Maha Energy Inc. stock options
Maha (Canada) has a stock option plan which allows for the grant of stock options, at exercise prices equal to or close to market price, in a total amount of up to 10% of the number of common shares issued. All of the options have a four to five-year term.
Number of Exercise Remaining Expiration date Options Vested Price Life # # $ Years December 31, 2018 400,000 400,000 0.75 0.50 December 31, 2018 350,000 350,000 1.25 0.50 December 31, 2020 50,000 33,333 1.25 2.50 Total outstanding 800,000 783,333 1.00 0.41
The following stock options are outstanding at June 30, 2018:
Number of Exercise Options Price
# $ Balance, December 31, 2016 2,648,000 0.70
Exercised (650,000) 0.45 Forfeited (300,000) 1.25
Balance, December 31, 2017 1,698,000 0.71 Exercised (898,000) 0.45 Balance, June 30, 2018 800,000 1.00
During the quarter 898,000 of these options outstanding were exercised by the Company’s management for which 640,211 Maha Class-A shares were issued and remainder of the options are in the process to be cancelled. Warrant Incentive Program
The Company has an incentive program as part of the remuneration package for management and employees. Warrants were issued in second quarter of 2017 and 2018 respectively, following a decision and approval at the respective Annual General Meeting. No warrants were vested, expired or exercised during the second quarter of 2018.
Number of warrants Warrants incentive programme Exercise period
Subscription price, SEK
1 Jan 2018
Issued 2018
Expired 2018
Exercised 2018
30 June 2018
2017 incentive programme
1 June 2020 – 31 December 2020 7.00 750,000 - - 750,000
2018 incentive programme
1 May 2021 – 30 November 2021 9.20 750,000 - - 750,000
Total 750,000 750,000 - - 1,500,000 Each warrant shall entitle the warrant holder to subscribe for one new Share in the Company at the subscription price per share. The fair value of the warrants granted under the warrant incentive program has been estimated on the grant date using the Black & Scholes model. Weighted average assumptions and resultant fair values are as follows:

29
2018 2017 Incentive Programme Incentive programme Risk free interest rate (%) (0.17) (0.4) Expected term (years) 3.58 3.58 Expected volatility (%) 47 58 Forfeiture rate (%) 5.0 5.0 Weighted average fair value (SEK) 2.88 2.64
Total share based compensation expense for the second quarter is TUSD 82 (Q2 2017 – (16)) and TUSD 113 for H1 2018 (H1 2017 – (14)) for the six months ended June 30, 2018. As the subscription price of the 2017 incentive program is below the average share price during the second quarter 2018 and six months ended June 30, 2018, the dilution effects of the warrants of this tranche is included in the weighted average number of shares after dilution.
11. Bond payable
On May 29, 2017 the Company issued 3,000 senior secured bonds (the “Bonds”), with a par value of SEK 100,000 per bond and 13,350,000 warrants to acquire Class A shares of Maha (the "Warrants") were issued for gross proceeds of SEK 300,000 thousand (TUSD 34,505). The net proceeds from the bond issue were primarily used for the purpose of completing the acquisition of Gran Tierra Energy Inc.’s Brazilian business. The Bonds bear interest at a rate of 12% per annum calculated using a 360-day twelve months, are payable semi-annually and mature on May 29, 2021. The Company may redeem all of the Bonds prior to maturity or repurchase any Bonds. Each warrant is exercisable into one Class A share of Maha at a price of SEK 7.45 per Warrant and expires on the maturity date of the Bond (see note 11). The fair value allocated to the Bonds of SEK 279,000 thousand (TUSD 32,090) was determined using the effective rate method by which future payments of interest and principal have been discounted using a rate of interest that would be reflective of a similar financing without a warrant issue (14.5%). The Company also recorded issue costs of SEK 16,613 thousand against the initial value of the Bond. The fair value allocated to the Warrants of SEK 21,000 thousand (TUSD 2,415) was determined to the difference between the gross proceeds and the fair value of the debt. The value of the Warrants is recorded in contributed surplus. Issue costs of USD 154 were recognized against the initial value of the Warrants. The initial value of the Bond will accrete up to its principal amount over the term of the Bonds. For the second quarter of 2018 Maha recognized TUSD 1,109 of interest and TUSD 279 of accretion related to the Bonds.
TUSD TSEK Principal amount of Bonds 34,505 300,000 Value allocated to Warrants (2,415) (21,000) Fair value of Bonds at date of issue 32,090 279,000 Issue costs (1,881) (16,613) Net Bond at date of issue 30,209 262,387 Accretion of bond liability 607 5,036 Effect of currency translation 1,862 - Balance at December 31, 2017 32,678 267,423 Accretion of bond liability 541 4,537 Effect of currency translation (2,797) - Balance at June 30, 2018 30,422 271,960

30
The Bonds have the following maintenance covenants at each quarter end and on a rolling 12 months basis:
i) Net Interest Bearing Debt to EBITDA is not greater than 3.00 (Leverage test); ii) Interest Coverage Ratio exceeds 2.25; and iii) Cash and cash equivalents exceeds USD $5 million
The second test date for the Leverage test and Minimum Cash test shall be as at June 30, 2018 and the first test date for the Interest Coverage Ratio will be June 30, 2018. As at the last reference date of March 31, 2018 the Company is compliant with all bond covenants. The terms of the Bonds contain provisions which limit the Company’s ability to make certain payments and distributions, incur additional indebtedness, make certain disposals of or provide security over its assets and engage in mergers or demergers. Further information on Bonds terms and conditions is available on the Company’s website.
12. Financial instruments and risk management
The fair values of cash and cash equivalents, restricted cash, accounts receivables and accounts payable and accrued liabilities and deposits on acquisitions approximate their carrying amount due to the short-term maturity of these financial instruments. For financial instruments measured at fair value in the balance sheet, the following fair value measurement hierarchy is used: • Level 1: based on quoted prices in active markets; • Level 2: based on inputs other than quoted prices as within level 1, that are either directly or indirectly
observable; • Level 3: based on inputs which are not based on observable market data.
Based on this hierarchy, financial instruments measured at fair value can be detailed as follows:
(TUSD) Level 1 Level 2 Level 3 June 30, 2018 Derivative instruments – current - 2 - December 31, 2017 Derivative instruments – current - 141 -
There were no transfers between the levels. The outstanding derivative instruments can be specified as follows:
(TUSD) June 30, 2018 December 31, 2017 Brent crude oil sales price derivatives - 76 Foreign currency option 2 65 2 141
Risks Associated with Financial Assets and Liabilities
The Company thoroughly examines the various risks to which it is exposed and assesses the impact and likelihood of those risks. The Company’s risk management policies are established to identify and analyze the risks faced by the Company, to set appropriate risk limits and to monitor market conditions and the Company’s activities. The Board of Directors has overall responsibility for establishment and oversight of the Company’s risk management.

31
The types of risk exposures and the objectives and policies for managing these risks exposures is described below:
a) Currency risk Foreign currency risk is the risk that the fair value or future cash flows of a financial instrument will fluctuate as a result of changes in foreign currency exchange rates. All of the Company’s oil sales are denominated in Brazilian Reals (BRL) based on a USD oil price and all operational, administrative and capital activities related to the Brazil properties are transacted primarily in BRL. In Sweden the Company’s expenditures and bond liability are in Swedish Krona (SEK). To minimize foreign currency risk, the Company’s cash balances are held primarily in SEK within Sweden and USD within Canada. In Canada, USD funds are converted to CAD on an as-needed basis. Management funds Brazil projects with the cash generated in Brazil to minimize the foreign currency risk. On November 22, 2017, the Company purchased currency options to hedge SEK denominated interest payments during 2018 on its Bonds as follows:
Expiry Type Strike Price Amount (TSEK) Premium (USD) 22 May 2018 Buy USDPUT:SEKCALL SEK 7.8 18,000 18,000 20 Nov 2018 Buy USDPUT:SEKCALL SEK 7.8 18,000 43,500
For the second quarter of 2018, the Company recorded a realized loss of TUSD 18 and an unrealized loss of TUSD 46 on the foreign exchange contracts (Q2 2017 - nil).
b) Credit risk
Credit risk is the risk of an unexpected loss if a customer or third party to a financial instrument fails to meet its contractual obligations. The Company’s cash and cash equivalents are primarily held at large Canadian, Brazilian and Swedish financial institutions in non-interest-bearing accounts.
The Company’s accounts receivable is composed of:
TUSD June 30, 2018 December 31, 2017 Oil and gas sales (Brazil) 1,845 1,167 Sale of Canadian assets 291 425 Tax credits and other receivables 564 637
2,700 2,229 The majority of the Company’s oil and gas sales receivables are with the Brazilian national oil company and a small independent refinery called DAX oil. Under the credit agreement with Dax Oil oil sales are prepaid and are considered to be relatively low risk.
c) Liquidity risk
Liquidity risk is the risk that the Company will not be able to meet its financial obligations as they fall due. By operating in several countries, the Company is exposed to currency fluctuations. Income is and will also most likely be denominated in foreign currencies, BRL in particular. Furthermore, the Company has since inception been equity and debt financed through share and bond issues, and also financed by asset divestment. Additional capital could be needed to finance the Company’s future operations and/or for acquisition of additional licenses. The main risk is that this need could occur during less favorable market conditions. The Company continuously ensures that sufficient cash balances are maintained in order to cover day to day operations. Management relies on cash forecasting to assess the Company’s cash position based on expected future cash flows. Accounts payable relating to oil and gas interests, and current interest on the bonds are due within the current operating period. The Bonds have interest payable of SEK 18 million semi-annually on May 29 and November 29 until the maturity date of May 29, 2021. In addition, principal payment is also due on the maturity date of the Bonds. The Company may redeem all of the Bonds prior to maturity or repurchase any Bonds (see note 11).
32
The Company has current assets of $27 million as at June 30, 2018 which is considered sufficient to settle the current liabilities of $6.4 million as at June 30, 2018.
d) Interest Rate Risk Interest rate risk is the risk that the fair value or future cash flows of a financial instrument will fluctuate due to changes in market interest rates. The risk that the Company will realize a loss as a result of a decline in the fair value of the short-term investments included in cash and cash equivalents is minimal. The Company has fixed interest on bond payable (note 11) therefore is not exposed to interest rate risk.
e) Price risk
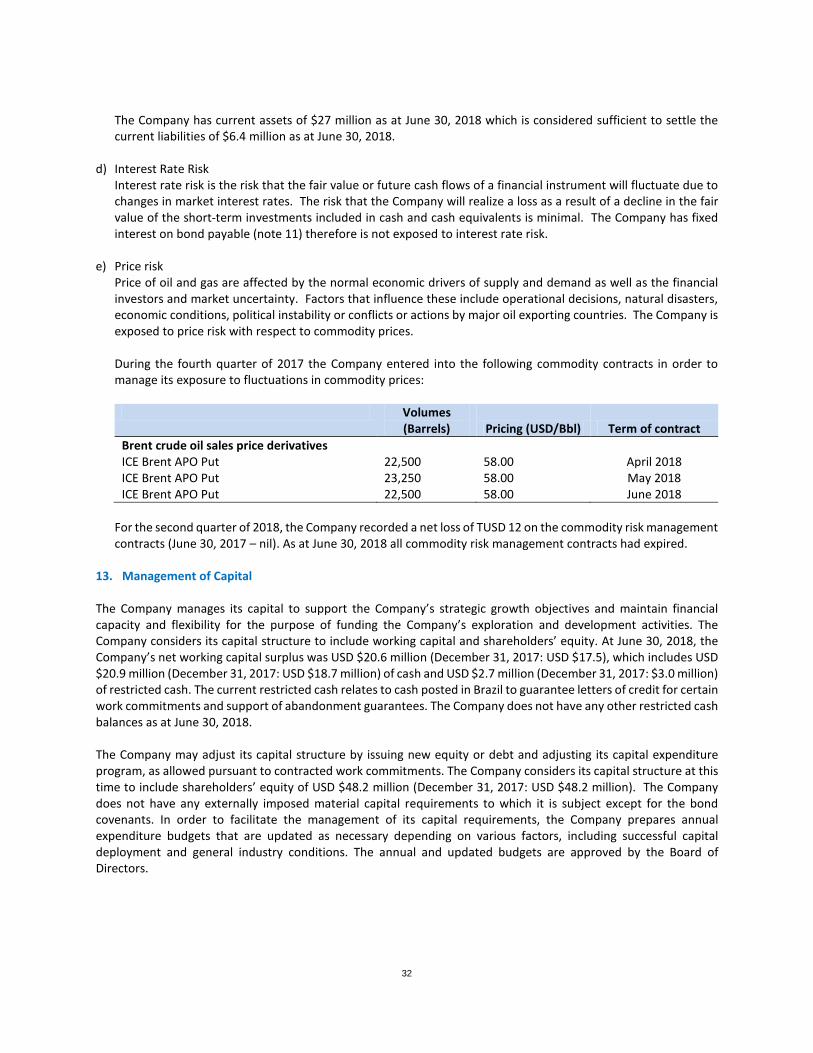
Price of oil and gas are affected by the normal economic drivers of supply and demand as well as the financial investors and market uncertainty. Factors that influence these include operational decisions, natural disasters, economic conditions, political instability or conflicts or actions by major oil exporting countries. The Company is exposed to price risk with respect to commodity prices. During the fourth quarter of 2017 the Company entered into the following commodity contracts in order to manage its exposure to fluctuations in commodity prices:
Volumes
(Barrels) Pricing (USD/Bbl) Term of contract Brent crude oil sales price derivatives ICE Brent APO Put 22,500 58.00 April 2018 ICE Brent APO Put 23,250 58.00 May 2018 ICE Brent APO Put 22,500 58.00 June 2018
For the second quarter of 2018, the Company recorded a net loss of TUSD 12 on the commodity risk management contracts (June 30, 2017 – nil). As at June 30, 2018 all commodity risk management contracts had expired.
13. Management of Capital The Company manages its capital to support the Company’s strategic growth objectives and maintain financial capacity and flexibility for the purpose of funding the Company’s exploration and development activities. The Company considers its capital structure to include working capital and shareholders’ equity. At June 30, 2018, the Company’s net working capital surplus was USD $20.6 million (December 31, 2017: USD $17.5), which includes USD $20.9 million (December 31, 2017: USD $18.7 million) of cash and USD $2.7 million (December 31, 2017: $3.0 million) of restricted cash. The current restricted cash relates to cash posted in Brazil to guarantee letters of credit for certain work commitments and support of abandonment guarantees. The Company does not have any other restricted cash balances as at June 30, 2018. The Company may adjust its capital structure by issuing new equity or debt and adjusting its capital expenditure program, as allowed pursuant to contracted work commitments. The Company considers its capital structure at this time to include shareholders’ equity of USD $48.2 million (December 31, 2017: USD $48.2 million). The Company does not have any externally imposed material capital requirements to which it is subject except for the bond covenants. In order to facilitate the management of its capital requirements, the Company prepares annual expenditure budgets that are updated as necessary depending on various factors, including successful capital deployment and general industry conditions. The annual and updated budgets are approved by the Board of Directors.
33
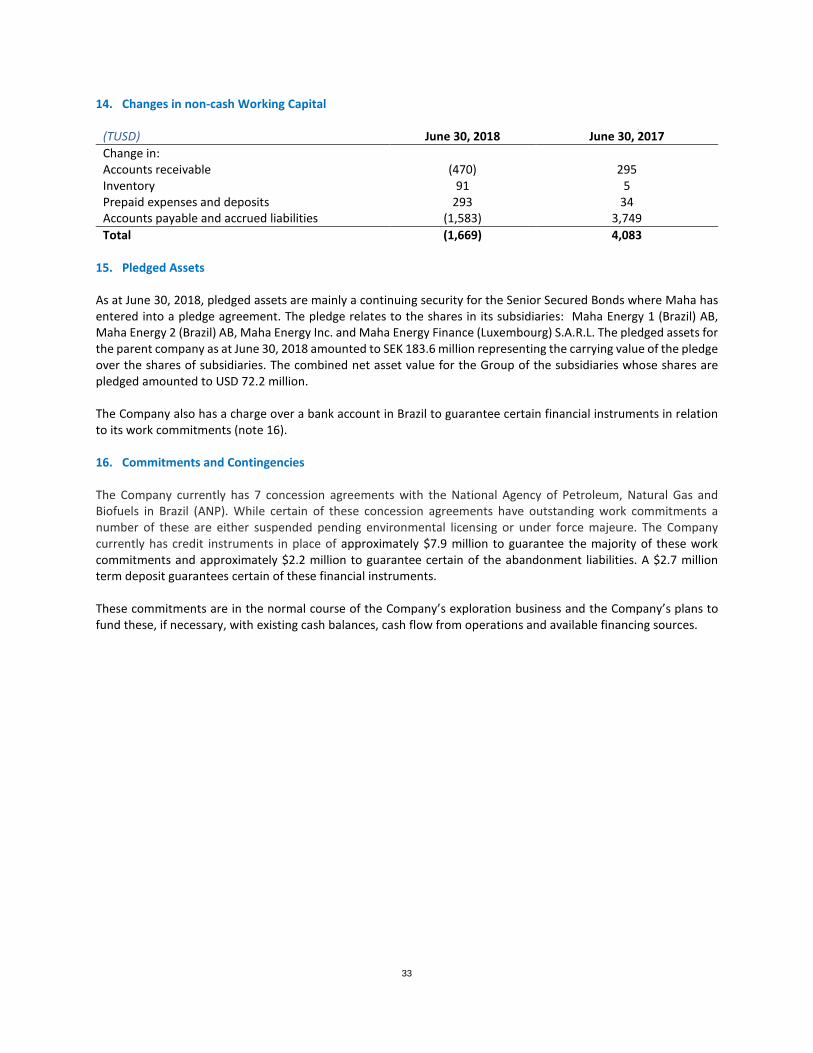
14. Changes in non-cash Working Capital
(TUSD) June 30, 2018 June 30, 2017 Change in: Accounts receivable (470) 295 Inventory 91 5 Prepaid expenses and deposits 293 34 Accounts payable and accrued liabilities (1,583) 3,749 Total (1,669) 4,083
15. Pledged Assets
As at June 30, 2018, pledged assets are mainly a continuing security for the Senior Secured Bonds where Maha has entered into a pledge agreement. The pledge relates to the shares in its subsidiaries: Maha Energy 1 (Brazil) AB, Maha Energy 2 (Brazil) AB, Maha Energy Inc. and Maha Energy Finance (Luxembourg) S.A.R.L. The pledged assets for the parent company as at June 30, 2018 amounted to SEK 183.6 million representing the carrying value of the pledge over the shares of subsidiaries. The combined net asset value for the Group of the subsidiaries whose shares are pledged amounted to USD 72.2 million. The Company also has a charge over a bank account in Brazil to guarantee certain financial instruments in relation to its work commitments (note 16). 16. Commitments and Contingencies
The Company currently has 7 concession agreements with the National Agency of Petroleum, Natural Gas and Biofuels in Brazil (ANP). While certain of these concession agreements have outstanding work commitments a number of these are either suspended pending environmental licensing or under force majeure. The Company currently has credit instruments in place of approximately $7.9 million to guarantee the majority of these work commitments and approximately $2.2 million to guarantee certain of the abandonment liabilities. A $2.7 million term deposit guarantees certain of these financial instruments. These commitments are in the normal course of the Company’s exploration business and the Company’s plans to fund these, if necessary, with existing cash balances, cash flow from operations and available financing sources.

34
Relevant reconciliation of Alternative Performance Measures: Operating Netback
Operating netback is calculated on a per-boe basis and is defined as revenue (excluding processing income) less royalties, transportation costs and operating expenses, as shown below:
(TUSD) Q2 2018 Q2 2017 H1 2018 H1 2017 Revenue 7,859 1,043 16,488 1,492 Royalties (939) (337) (2,129) (407) Operating Expenses (1,654) (459) (2,975) (847) Transportation costs (195) - (456) - Operating netback 5,071 247 10,928 238
EBITDA
Earnings before interest, taxes, depreciation and amortization (EBITDA) is used as a measure of the financial performance of the Company and is calculated as shown below:
(TUSD) Q2 2018 Q2 2017 H1 2018 H1 2017 Operating results 3,237 (2,773) 7,035 (4,006) Depletion, depreciation and amortization 724 515 1,588 728 Foreign currency exchange loss / (gain) (1) 1,291 (97) 1,302 EBITDA in TUSD 3,960 (967) 8,526 (1,976)
The financial information relating to the six-month period ended 30 June 2018 has not been subject to review by the auditors of the Company.

35
Financial calendar 2018 Third Quarter Report: 29 November 2018 2018 Fourth Quarter and Year End Report: 28 February 2019 2018 Annual Report: 30 April, 2019 2019 First Quarter Report: 29 May 2019 Contact information For further information please contact: Jonas Lindvall (CEO) Tel: +1 403 454 7560 Email: [email protected] Ron Panchuk (CCO) Tel: +1 403 454 7560 Email: [email protected] Andres Modarelli (CFO) Tel: +1 403 454 7560 Email: [email protected]
Maha Energy AB Head Office
Biblioteksgatan 1, 4th Floor 111 46 Stockholm, Sweden
(08) 611 05 11 Maha Energy AB Technical Office
Suite 1140, 10201 Southport Road SW Calgary, Alberta T2W 4X9 403-454-7560


![Luzhou 9MFY13 Presentation.ppt [Repaired]luzhou.listedcompany.com/newsroom/20131112_173859_L46_4288… · FY: Year ended December 31 1Q: Three months ended March 31 2Q:Three months](https://static.fdocuments.us/doc/165x107/5f50d0ed9f531e5913404436/luzhou-9mfy13-repairedluzhoulistedcompanycomnewsroom20131112173859l464288.jpg)

![Three months ended December 31, Year ended December 31, … · 2016-01-27 · Three months ended December 31, Year ended December 31, 2015 2014 Change ~¦u]oo]}v 2015 2014 Change](https://static.fdocuments.us/doc/165x107/5f05bacd7e708231d41469d5/three-months-ended-december-31-year-ended-december-31-2016-01-27-three-months.jpg)