Report for Q4 2011 - Alfa Laval EBITA margin 17.0% Adjusted EBITA margin 17.0% vvss 18.6%...
40
Transcript of Report for Q4 2011 - Alfa Laval EBITA margin 17.0% Adjusted EBITA margin 17.0% vvss 18.6%...


Report for Q4 2011Report for Q4 2011
Mr. Lars RenströmMr. Lars RenströmPresident and CEOPresident and CEOAlfa Laval GroupAlfa Laval Group
-- Orders received and marginsOrders received and margins
-- HighlightsHighlights
-- Development per segmentDevelopment per segment
-- Geographical developmentGeographical development
-- Financials Financials
-- OutlookOutlook

Key figuresKey figures
�� Orders received rose 6% to SEK 6,774 million.Orders received rose 6% to SEK 6,774 million.
�� Net sales increased 14% to SEK 8,149 million.Net sales increased 14% to SEK 8,149 million.
�� Adjusted EBITA up 4% at SEK 1,387 million. Adjusted EBITA up 4% at SEK 1,387 million.
�� Adjusted EBITA margin 17.0% Adjusted EBITA margin 17.0% vsvs 18.6%18.6%
-- Negative currency effect SEK 80 million.Negative currency effect SEK 80 million.
October October –– December 2011December 2011
www.alfalaval.com© Alfa Laval Slide 3
-- Negative currency effect SEK 80 million.Negative currency effect SEK 80 million.
�� Orders received rose 20% to SEK 28,671 million.Orders received rose 20% to SEK 28,671 million.
�� Net sales increased 16% to SEK 28,652 million.Net sales increased 16% to SEK 28,652 million.
�� Adjusted EBITA up 13% at SEK 5,287 million. Adjusted EBITA up 13% at SEK 5,287 million.
�� Adjusted EBITA margin 18.5 % Adjusted EBITA margin 18.5 % vsvs 18.9%18.9%
-- Negative currency effect SEK 468 million.Negative currency effect SEK 468 million.
January January –– December 2011December 2011
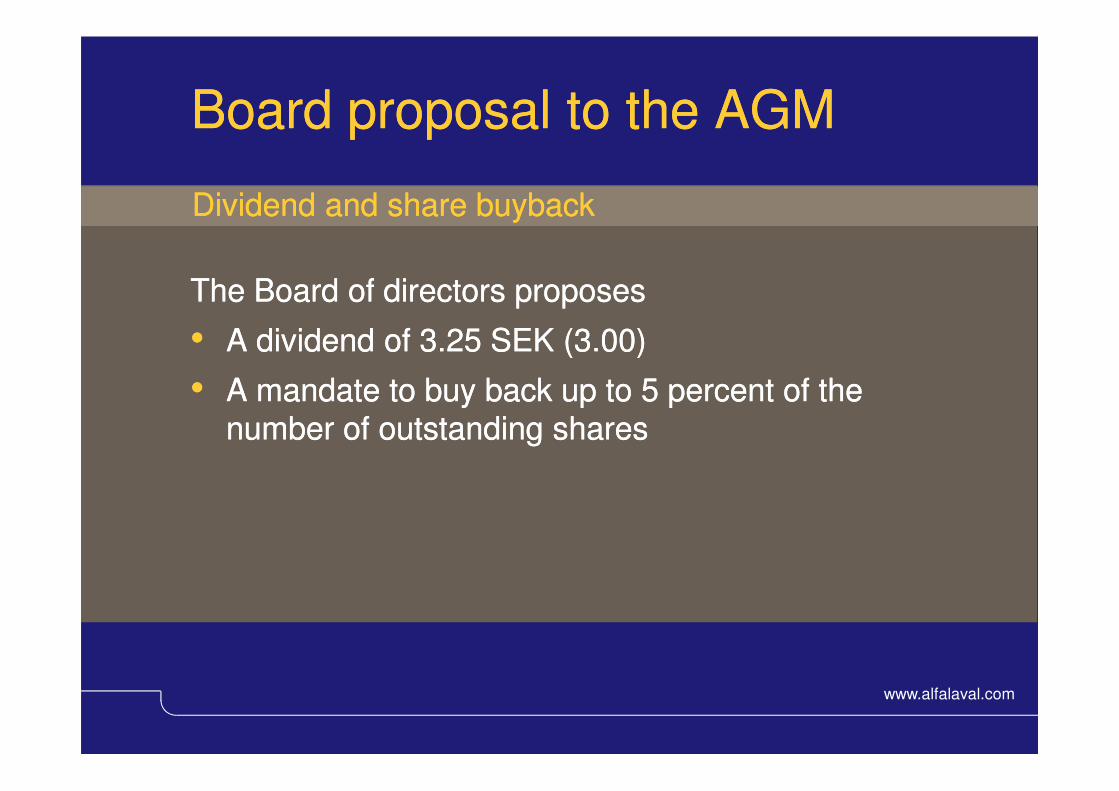
Board proposal to the AGMBoard proposal to the AGM
The Board of directors proposesThe Board of directors proposes
•• A dividend of 3.25 SEK (3.00)A dividend of 3.25 SEK (3.00)
•• A mandate to buy back up to 5 percent of the A mandate to buy back up to 5 percent of the
Dividend and share buybackDividend and share buyback
www.alfalaval.com© Alfa Laval Slide 4
•• A mandate to buy back up to 5 percent of the A mandate to buy back up to 5 percent of the number of outstanding sharesnumber of outstanding shares

16 000
20 000
24 000
28 000
32 000
4 000
5 000
6 000
7 000
8 000
SEK millionSEK million
Orders receivedOrders received
SEK million R 12SEK million R 12
www.alfalaval.com© Alfa Laval Slide 5
0
4 000
8 000
12 000
16 000
0
1 000
2 000
3 000
4 000
= rolling twelve months value= rolling twelve months value
= order intake per quarter= order intake per quarter
Q109
Q109
Q410
Q410
Q111
Q111
Q311
Q311
Q411
Q411
Q407
Q407
Q108
Q108
Q208
Q208
+9%
+9%
0%
0%
+9%
+9%
+8%
+8%
= % development at constant rates by = % development at constant rates by quarter, year on yearquarter, year on year
+xx%+xx%
--3%
3%
Q308
Q308
Q408
Q408
--15%
15%
--32%
32%
Q209
Q209
--37%
37%
Q309
Q309
--30%
30%
Q409
Q409
--9%
9%
--6%
6%
Q110
Q110
Q210
Q210
+25%
+25%
Q310
Q310
+23%
+23%
+23%
+23%
+ 3
2%
+ 3
2%
Q211
Q211
+38%
+38%
+ 3
7%
+ 3
7%

Order analysisOrder analysis
Q4 2010 Q4 2010 (SEK (SEK mlnmln)) Q3 2011Q3 2011
Structural change, %Structural change, %
Currency effects,%Currency effects,%
Organic development, %Organic development, %
6,3796,379
Q4 2011 versus Q4 2010 and versus Q3 2011Q4 2011 versus Q4 2010 and versus Q3 2011
+ + 10.8 10.8
-- 2.52.5
-- 2.12.1
8,0188,018
--
+ 0.6+ 0.6
-- 16.116.1
www.alfalaval.com© Alfa Laval Slide 6
Organic development, %Organic development, %
Total, %Total, %
Q4 2011 Q4 2011 (SEK (SEK mlnmln)) Q4 2011Q4 20116,7746,774
-- 2.12.1
+ 6.2+ 6.2
6,7746,774
-- 16.116.1
--15.515.5

15,0
18,0
21,0
24,0
1 125
1 350
1 575
1 800
SEK millions and in percent of salesSEK millions and in percent of sales
Adjusted EBITA / margin *Adjusted EBITA / margin *
www.alfalaval.com© Alfa Laval Slide 7
0,0
3,0
6,0
9,0
12,0
0
225
450
675
900
* Adjusted EBITA * Adjusted EBITA –– ”Earnings before interests, taxes, amortization of goodwill and step up values and comparison distortion item”Earnings before interests, taxes, amortization of goodwill and step up values and comparison distortion items.”s.”
Q211Q211Q109Q109 Q409Q409 Q110Q110 Q210Q210 Q310Q310 Q410Q410 Q111Q111 Q311Q311 Q411Q411Q408Q408 Q209Q209 Q309Q309
Report for Q4 2011Report for Q4 2011
Mr. Lars RenströmMr. Lars RenströmPresident and CEOPresident and CEOAlfa Laval GroupAlfa Laval Group
-- Orders received and marginsOrders received and margins
-- HighlightsHighlights
-- Development per segmentDevelopment per segment
-- Geographical developmentGeographical development
-- Financials Financials
-- OutlookOutlook

Highlights during the quarterHighlights during the quarter
�� Order from edible oil company in Indonesia. Order from edible oil company in Indonesia. The order includes engineering as well as equipment to a company The order includes engineering as well as equipment to a company
producing edible oil. The value is approximately SEK 85 million and producing edible oil. The value is approximately SEK 85 million and
delivery is scheduled for 2012.delivery is scheduled for 2012.
Total large ordersTotal large orders SEK 220 SEK 220 MlnMln (310 (310 MlnMln))
www.alfalaval.com© Alfa Laval Slide 9
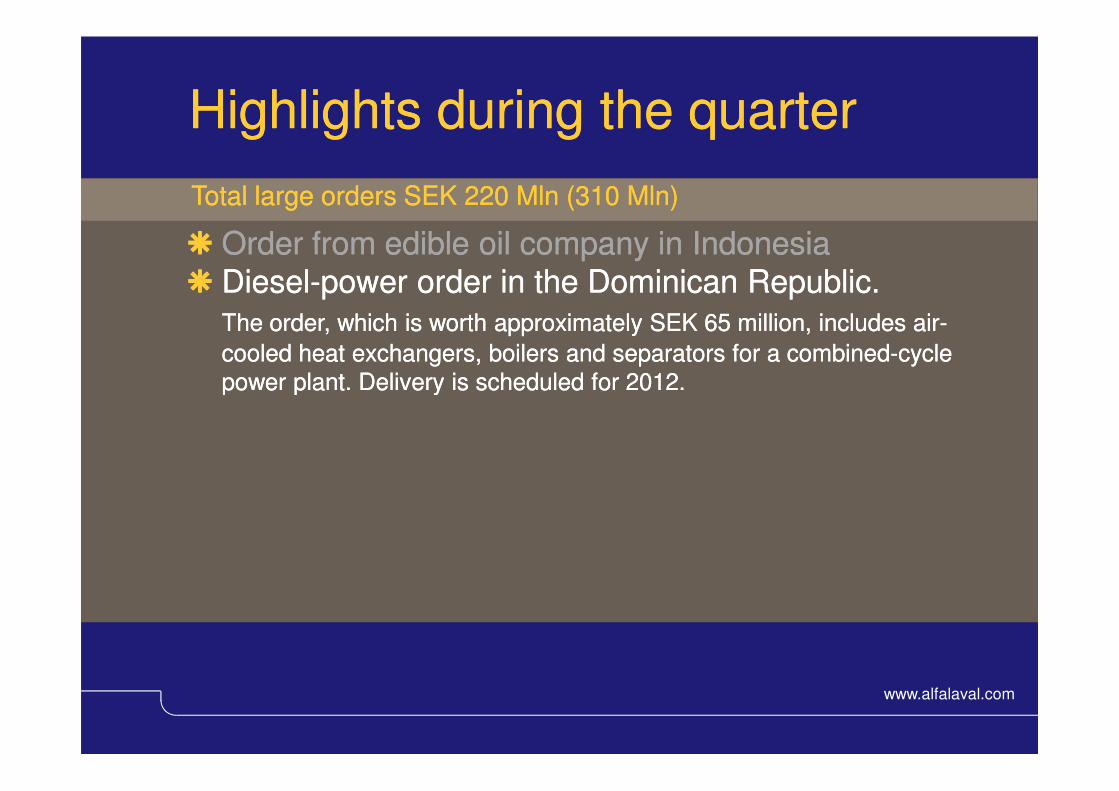
Highlights during the quarterHighlights during the quarter
�� Order from edible oil company in IndonesiaOrder from edible oil company in Indonesia�� DieselDiesel--power order in the Dominican Republic.power order in the Dominican Republic.
The order, which is worth approximately SEK 65 million, includes airThe order, which is worth approximately SEK 65 million, includes air--
cooled heat exchangers, boilers and separators for a combinedcooled heat exchangers, boilers and separators for a combined--cycle cycle
power plant. Delivery is scheduled for 2012.power plant. Delivery is scheduled for 2012.
Total large ordersTotal large orders SEK 220 SEK 220 MlnMln (310 (310 MlnMln))
www.alfalaval.com© Alfa Laval Slide 10

Highlights during the quarterHighlights during the quarter
�� Order from edible oil company in IndonesiaOrder from edible oil company in Indonesia�� DieselDiesel--power order in the Dominican Republic.power order in the Dominican Republic.�� EnergyEnergy--efficiency order from Russian refinery.efficiency order from Russian refinery.
Alfa Laval will supply compact heat exchangers that will reuse heat in the Alfa Laval will supply compact heat exchangers that will reuse heat in the
refinery process for preheating crude oil, resulting in a energyrefinery process for preheating crude oil, resulting in a energy--efficient efficient
Total large ordersTotal large orders SEK 220 SEK 220 MlnMln (310 (310 MlnMln))
www.alfalaval.com© Alfa Laval Slide 11
refinery process for preheating crude oil, resulting in a energyrefinery process for preheating crude oil, resulting in a energy--efficient efficient solution. The value is approximately SEK 70 million and delivery is solution. The value is approximately SEK 70 million and delivery is scheduled for 2012.scheduled for 2012.
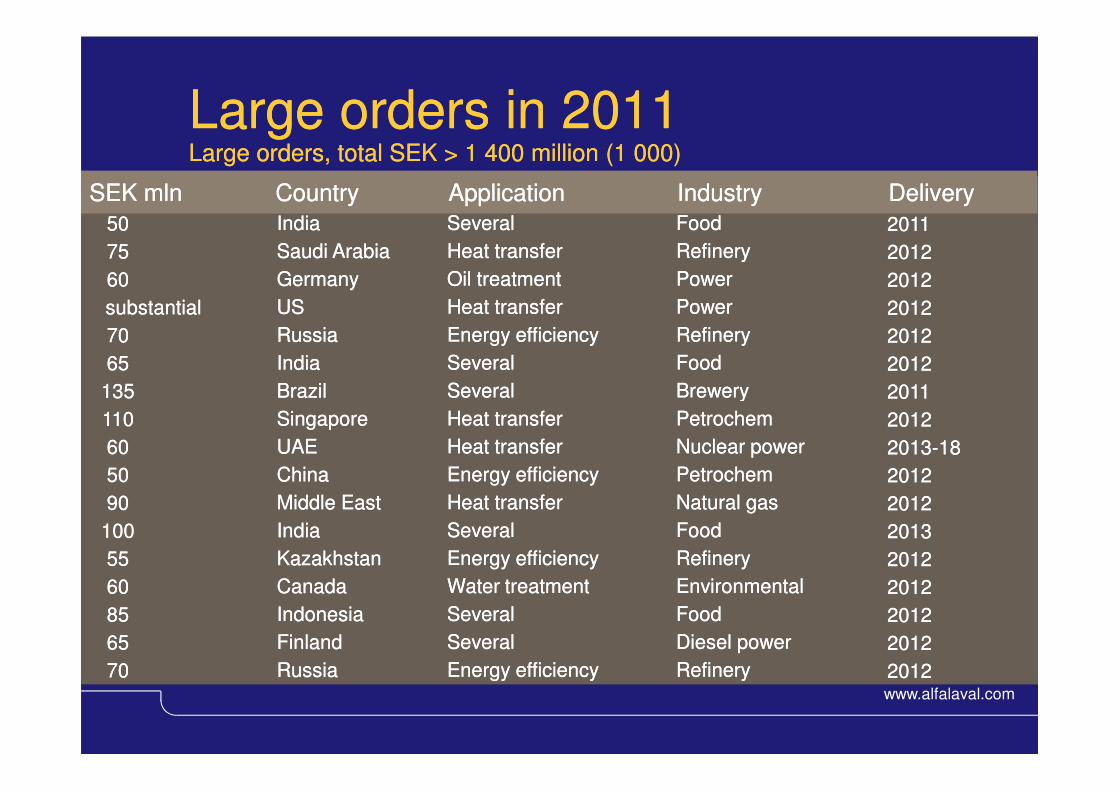
Large orders in 2011Large orders in 2011
SEK SEK mlnmln CountryCountry ApplicationApplication Industry Industry DeliveryDelivery
Large orders, total SEK > 1 400 million (1 000) Large orders, total SEK > 1 400 million (1 000)
IndiaIndia
Saudi ArabiaSaudi Arabia
GermanyGermany
USUS
RussiaRussia
IndiaIndia
BrazilBrazil
5050
7575
6060
substantialsubstantial
7070
6565
135135
FoodFood
RefineryRefinery
PowerPower
PowerPower
RefineryRefinery
FoodFood
BreweryBrewery
20112011
20122012
20122012
20122012
20122012
20122012
20112011
SeveralSeveral
Heat transferHeat transfer
Oil treatmentOil treatment
Heat transferHeat transfer
Energy efficiencyEnergy efficiency
SeveralSeveral
SeveralSeveral
www.alfalaval.com© Alfa Laval Slide 12
BrazilBrazil
Singapore Singapore
UAEUAE
ChinaChina
Middle EastMiddle East
IndiaIndia
KazakhstanKazakhstan
CanadaCanada
IndonesiaIndonesia
FinlandFinland
RussiaRussia
135135
110110
6060
5050
9090
100100
5555
6060
8585
6565
7070
BreweryBrewery
PetrochemPetrochem
Nuclear powerNuclear power
PetrochemPetrochem
Natural gasNatural gas
FoodFood
RefineryRefinery
EnvironmentalEnvironmental
FoodFood
Diesel powerDiesel power
RefineryRefinery
20112011
20122012
20132013--1818
20122012
20122012
20132013
20122012
20122012
20122012
20122012
2012 2012
SeveralSeveral
Heat transferHeat transfer
Heat transferHeat transfer
Energy efficiencyEnergy efficiency
Heat transferHeat transfer
SeveralSeveral
Energy efficiencyEnergy efficiency
Water treatmentWater treatment
SeveralSeveral
SeveralSeveral
Energy efficiencyEnergy efficiency

Top 10 marketsTop 10 marketsOrder intake 2011 YTDOrder intake 2011 YTD
Mid Europe
Korea, South
Nordic
China
United States
(8)(8)
www.alfalaval.com© Alfa Laval Slide 13
0 1000 2000 3000 4000
Japan
India
Brazil
Russia
Adriatic
SEK at prevailing ratesSEK at prevailing rates
(10)(10)
(5)(5)

Report for Q4 2011Report for Q4 2011
Mr. Lars RenströmMr. Lars RenströmPresident and CEOPresident and CEOAlfa Laval GroupAlfa Laval Group
-- Orders received and marginsOrders received and margins
-- HighlightsHighlights
-- Development per segmentDevelopment per segment
-- Geographical developmentGeographical development
-- Financials Financials
-- OutlookOutlook

Orders received by customer segmentOrders received by customer segment
Industrial Industrial EquipmentEquipment
Marine & DieselMarine & Diesel
Process IndustryProcess Industry
Energy Energy
& & EnvironmentEnvironment
October October –– December 2011, December 2011, at at constant constant rates and like for likerates and like for like
−−−− ++++
++++−−−−
−−−−
www.alfalaval.com© Alfa Laval Slide 15
SanitarySanitary
OEMOEMFoodFood
Parts & ServiceParts & Service−−−−
−−−−
====
−−−−

Orders received by customer segmentOrders received by customer segmentProcess Technology Division Process Technology Division Q4, sequential development Q4, sequential development at at constant ratesconstant rates
��Stable development for Stable development for base business and Parts & base business and Parts & Service.Service.
��Energy down due to nonEnergy down due to non--repeat large orders. repeat large orders. Environment lifted by Environment lifted by strong development for strong development for base business.base business.
��Food down. Still, continued Food down. Still, continued
Process IndustryProcess Industry
Energy Energy
& & EnvironmentEnvironment
FoodFood
−−−−
−−−−
−−−−
www.alfalaval.com
Slide 16
© Alfa Laval
��Food down. Still, continued Food down. Still, continued growth for vegetable oil in growth for vegetable oil in Asia.Asia.
FoodFood
Parts & ServiceParts & Service
−−−−
====
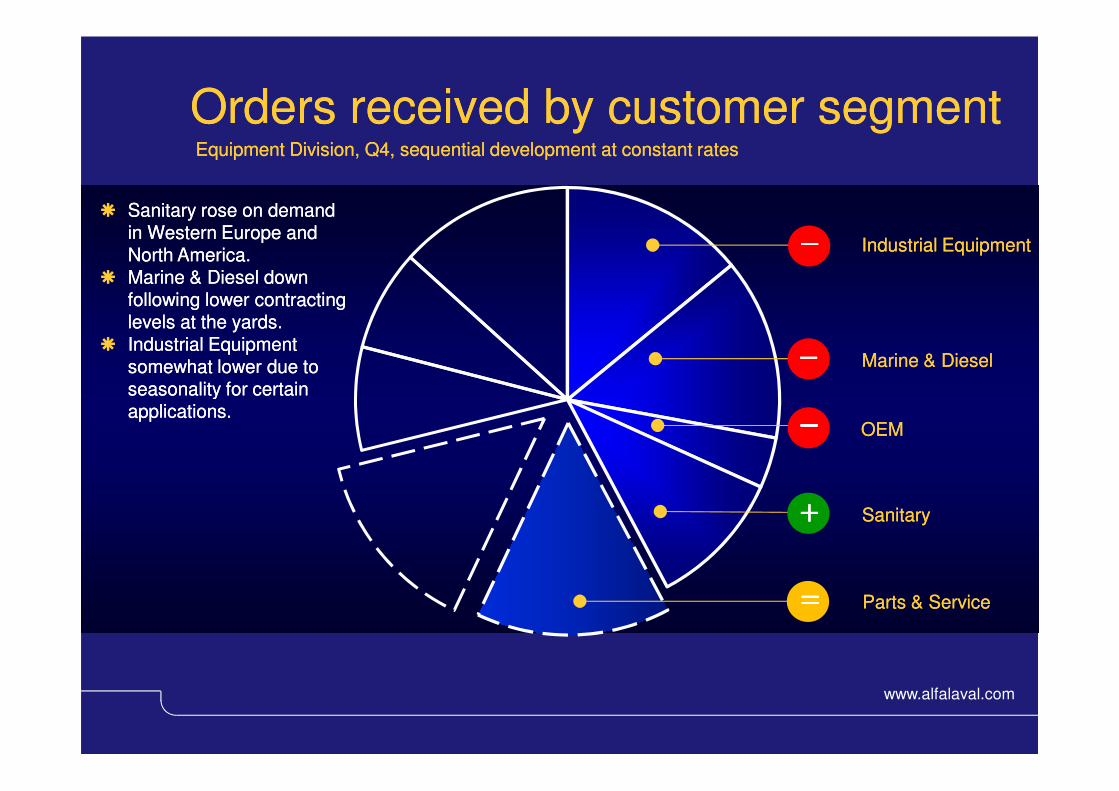
Orders received by customer segmentOrders received by customer segmentEquipment Division, Equipment Division, Q4, sequential development Q4, sequential development at at constant ratesconstant rates
�� Sanitary rose on demand Sanitary rose on demand in Western Europe and in Western Europe and North America.North America.
�� Marine & Diesel down Marine & Diesel down following lower contracting following lower contracting levels at the yards.levels at the yards.
�� Industrial Equipment Industrial Equipment somewhat lower due to somewhat lower due to seasonality for certain seasonality for certain
Marine & DieselMarine & Diesel
−−−−
−−−−
Industrial EquipmentIndustrial Equipment
www.alfalaval.com© Alfa Laval Slide 17
seasonality for certain seasonality for certain applications.applications.
Parts & ServiceParts & Service====
SanitarySanitary
OEMOEM
++++
−−−−−−−−

Orders received by customer segmentOrders received by customer segment
Industrial Industrial EquipmentEquipment
Marine & DieselMarine & Diesel
Process IndustryProcess Industry
Energy Energy
& & EnvironmentEnvironment
January January –– December 2011, December 2011, at constant at constant rates and like for likerates and like for like
++++ ++++
++++++++
++++
www.alfalaval.com© Alfa Laval Slide 18
SanitarySanitary
OEMOEMFoodFood
Parts & ServiceParts & Service++++
====
++++
++++
Report Q4 2011Report Q4 2011
Mr. Lars RenströmMr. Lars RenströmPresident and CEOPresident and CEOAlfa Laval GroupAlfa Laval Group
-- Orders received and marginsOrders received and margins
-- HighlightsHighlights
-- Development per segmentDevelopment per segment
-- Geographical developmentGeographical development
-- Financials Financials
-- OutlookOutlook
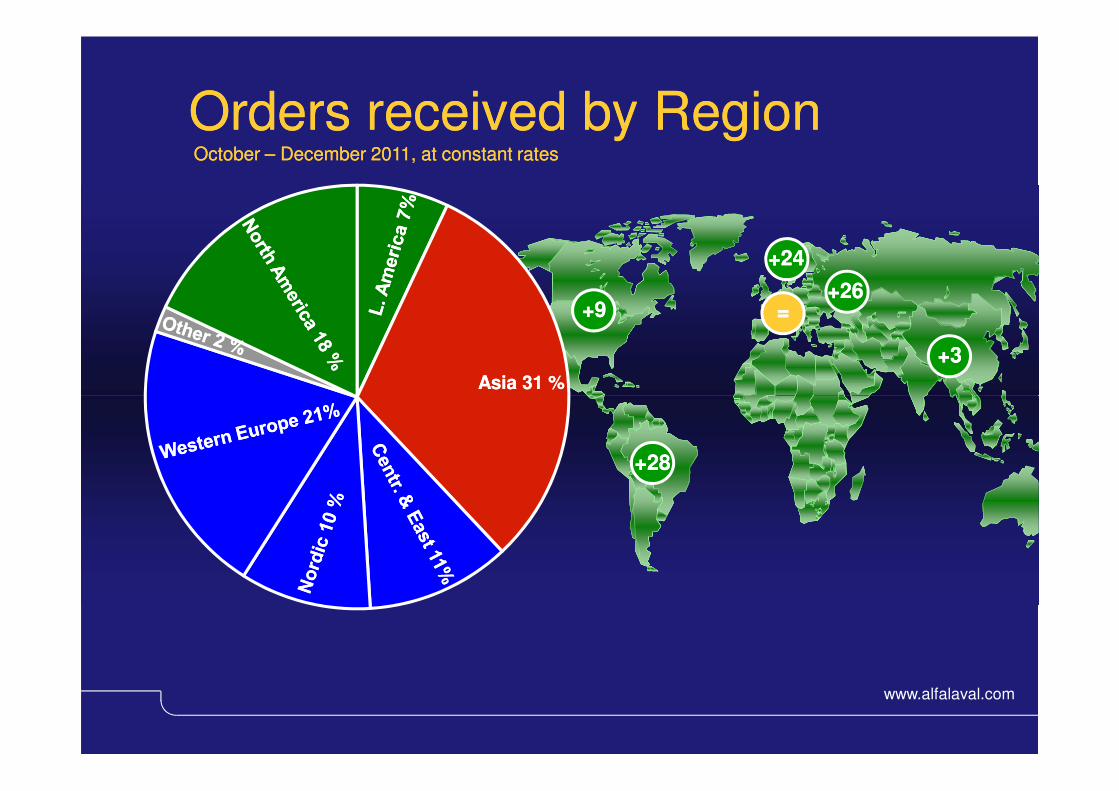
Orders received by RegionOrders received by Region
Asia Asia 31 31 %%
October October –– December 2011, December 2011, at constant ratesat constant rates
+26+26+9+9
+24+24
+3+3
www.alfalaval.com© Alfa Laval Slide 20
+28+28
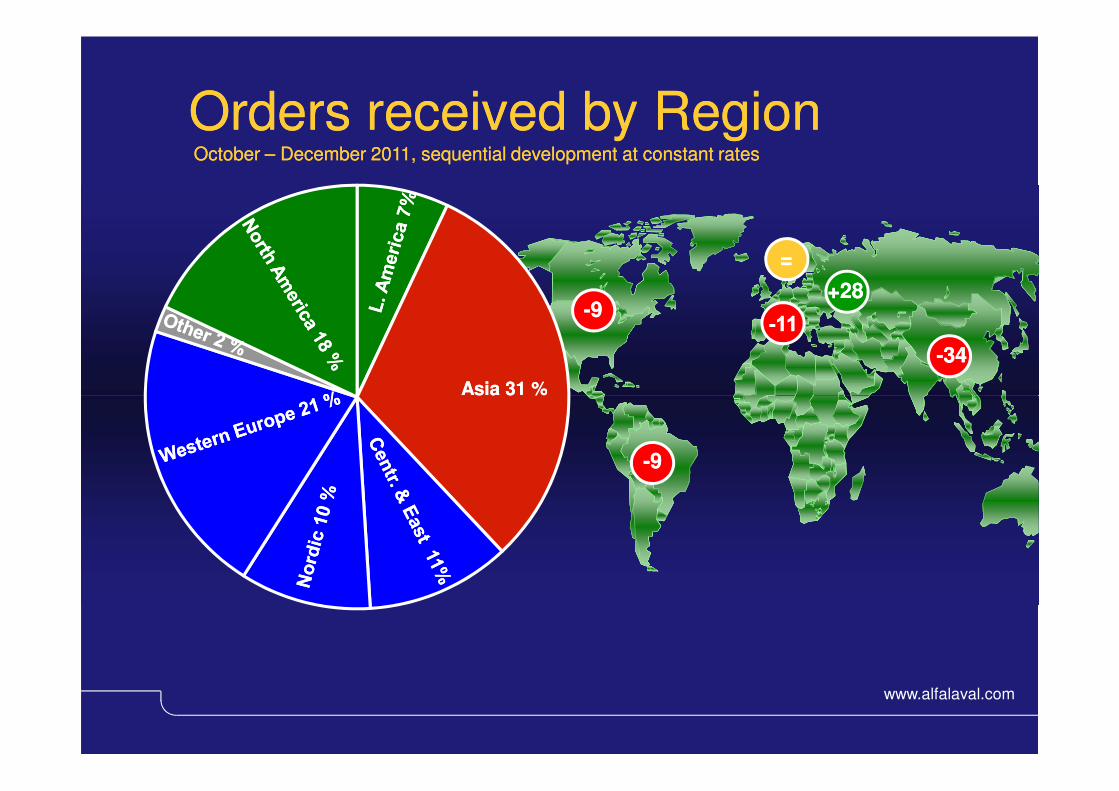
Orders received by RegionOrders received by Region
Asia Asia 31 31 %%
October October –– December 2011, sequential development December 2011, sequential development at at constant ratesconstant rates
+28+28--99
==
--3434
www.alfalaval.com© Alfa Laval Slide 21
Asia Asia 31 31 %%
--99

North America North America
� Order intake down, affected by
non-repeat large orders.
Highlights AmericasHighlights AmericasOctober October –– December 2011, sequentially, December 2011, sequentially, at at constant ratesconstant rates
--99
www.alfalaval.com© Alfa Laval Slide 22
� Base business was unchanged.
Latin Latin America America
�� Order intake somewhat lower due to Order intake somewhat lower due to
nonnon--repeats in Process Technology repeats in Process Technology
division.division.
�� Energy & Environment still showed Energy & Environment still showed
good growth, as did the Equipment good growth, as did the Equipment
Division.Division.
--99
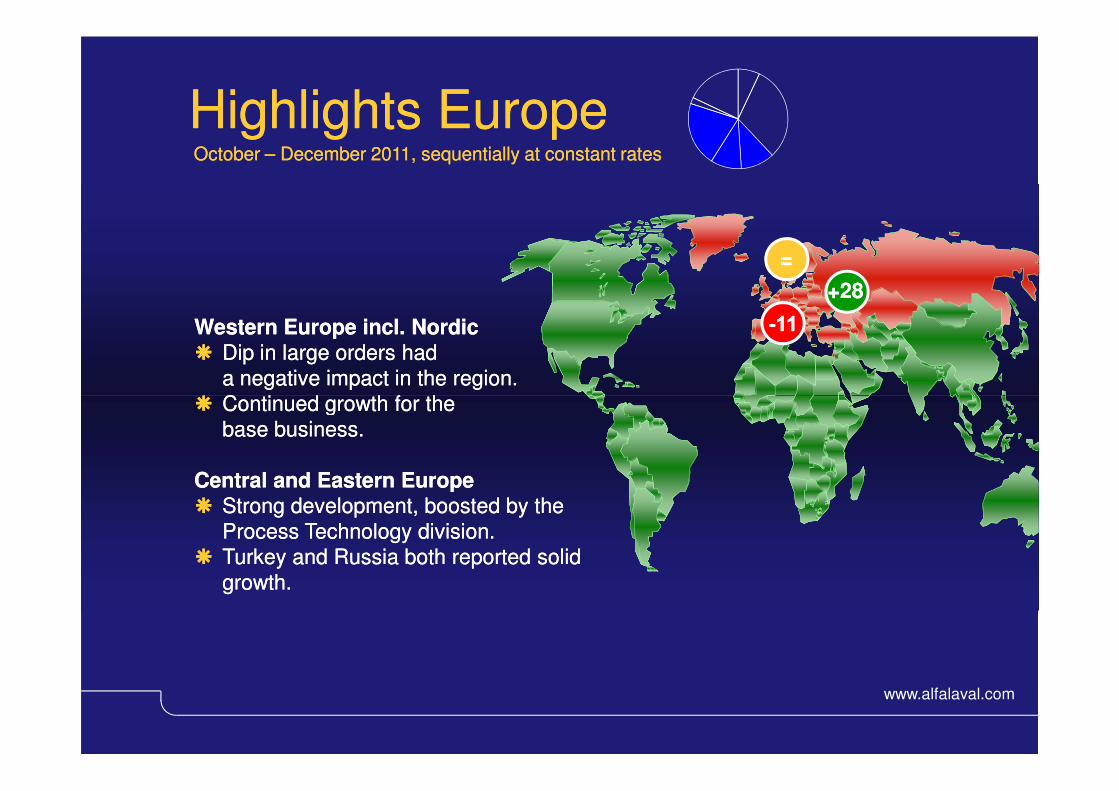
Highlights EuropeHighlights Europe
Western Europe incl. NordicWestern Europe incl. Nordic
�� Dip in large orders had Dip in large orders had
a negative impact in the region.a negative impact in the region.
�� Continued growth for the Continued growth for the
October October –– December 2011, sequentially December 2011, sequentially at at constant ratesconstant rates
+28+28
==
www.alfalaval.com© Alfa Laval Slide 23
�� Continued growth for the Continued growth for the
base business.base business.
Central Central and Eastern Europe and Eastern Europe
�� Strong development, boosted by the Strong development, boosted by the
Process Technology division. Process Technology division.
�� Turkey and Russia both reported solid Turkey and Russia both reported solid
growth.growth.

Highlights AsiaHighlights Asia
Asia Asia
�� Orders dropped due to a decline Orders dropped due to a decline
in Marine & Diesel and also nonin Marine & Diesel and also non--
repeat large orders in Process repeat large orders in Process
October October –– December 2011, sequentially, December 2011, sequentially, at at constant ratesconstant rates
--3434
www.alfalaval.com© Alfa Laval Slide 24
repeat large orders in Process repeat large orders in Process
Technology.Technology.
�� WaitWait--andand--see mode for projects see mode for projects
in India and China.in India and China.

Orders received by RegionOrders received by Region
Asia Asia 35 35 %%
JanuaryJanuary–– December 2011, December 2011, at constant ratesat constant rates
+36+36+19+19
+24+24
+39+39
www.alfalaval.com© Alfa Laval Slide 25
Asia Asia 35 35 %%
+39+39

Report for Q4 2011Report for Q4 2011
Mr. Thomas ThuressonMr. Thomas ThuressonCFOCFOAlfa Laval GroupAlfa Laval Group
-- Orders received and marginsOrders received and margins
-- HighlightsHighlights
-- Development per segmentDevelopment per segment
-- Geographical developmentGeographical development
-- Financials Financials
-- OutlookOutlook

HighlightsHighlights
Order intake Order intake
Net salesNet sales
6,7746,774
8,1498,149
SEK millionsSEK millions OctoberOctober –– December 2011December 2011
www.alfalaval.com© Alfa Laval Slide 27
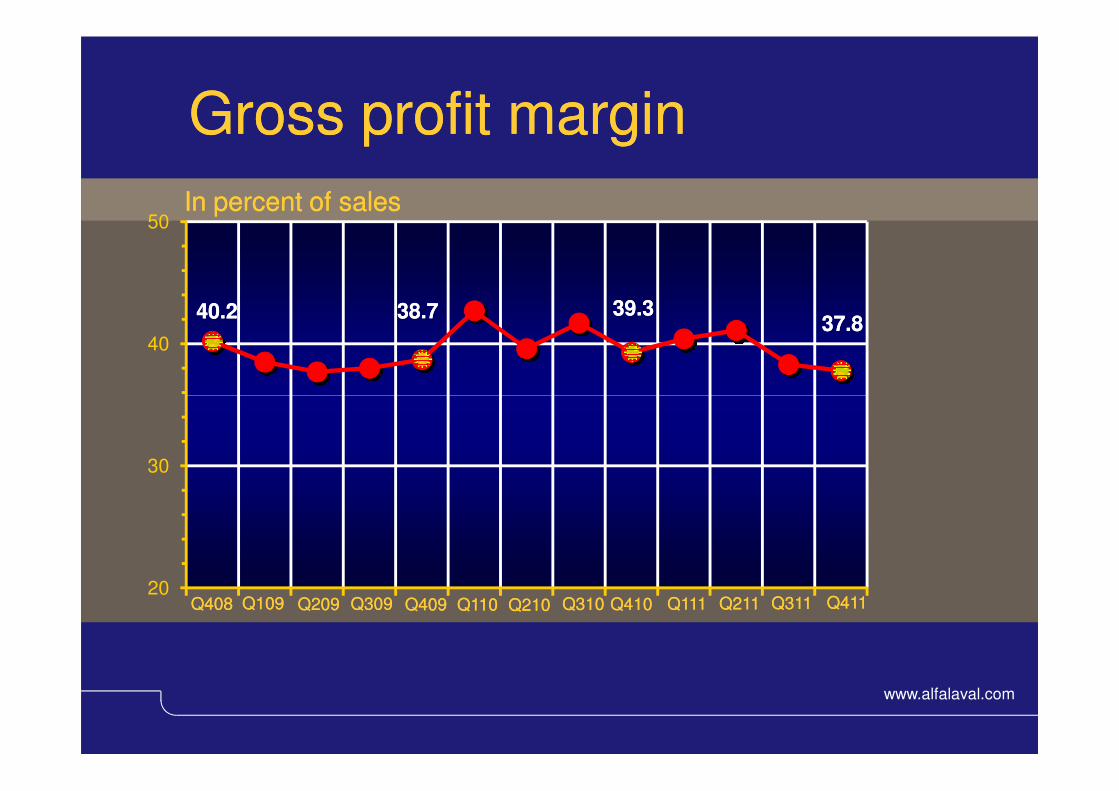
Gross profit marginGross profit margin
40
50In percent of salesIn percent of sales
37.837.839.339.338.738.740.240.2
www.alfalaval.com© Alfa Laval
20
30
Q109Q109 Q309Q309 Q409Q409 Q110Q110 Q210Q210 Q310Q310 Q410Q410 Q111Q111 Q211Q211 Q311Q311 Q411Q411Q408Q408 Q209Q209

HighlightsHighlights
Order intake Order intake Net salesNet salesAdjusted EBITAAdjusted EBITA
Adjusted EBITAAdjusted EBITA--marginmargin
Structural cost for savings measuresStructural cost for savings measuresProfit before taxProfit before tax
SEK millionsSEK millions OctoberOctober –– December 2011December 2011
6,7746,774
8,149 8,149
1,3871,387
17.0%17.0%
--9090
1,3811,381
www.alfalaval.com© Alfa Laval Slide 29
Profit before taxProfit before tax 1,3811,381

Earnings per shareEarnings per share
EarningsEarnings
Earnings, excluding Earnings, excluding stepstep--upup
20112011
7.687.68
8.428.42
20102010
7.347.34
8.028.02
Jan Jan –– Dec Dec 20112011
2.212.21
2.432.43
20102010
2.142.14
2.322.32
Oct Oct –– DecDec
www.alfalaval.com© Alfa Laval Slide 30

HighlightsHighlights
Order intake Order intake
Net salesNet sales
Adjusted EBITAAdjusted EBITA
Adjusted EBITAAdjusted EBITA--marginmargin
Profit before taxProfit before tax
SEK millionsSEK millions Oct Oct –– Dec 2011Dec 2011
6,7746,774
8,1498,149
1,3871,387
17.0% 17.0%
1,381 1,381
www.alfalaval.com© Alfa Laval Slide 31
Profit before taxProfit before tax
Cash flow from operating activitiesCash flow from operating activities
ROCEROCE
ROEROE
1,381 1,381
1,2911,291
31.3%31.3%
22.9%22.9%

Cash flow fromCash flow from
-- operating activitiesoperating activities
-- investing activitiesinvesting activities
Financial Financial net paidnet paid
DividendsDividends
CashCash--flow statement flow statement
SEK millionsSEK millions
Jan Jan –– Dec Dec
20112011
Jan Jan –– DecDec
20102010
+3,429+3,429
-- 5,4975,497
+ 105+ 105
--1,2581,258
+4,098+4,098
-- 1,4171,417
-- 8484
--1,0551,055
www.alfalaval.com© Alfa Laval Slide 32
DividendsDividends
TotalTotal
Pro Forma Pro Forma Free cashFree cash--flowflow****Incl. operating activities, capital expenditure and financial net paid.Incl. operating activities, capital expenditure and financial net paid.
--1,2581,258
2,9792,979
--1,0551,055
3,5853,585
--3,2213,221 --1,5421,542
4Q Pro 4Q Pro Forma Forma Free cashFree cash--flow*flow* 983983 805805
Process to delist Alfa Laval India Ltd.Process to delist Alfa Laval India Ltd.
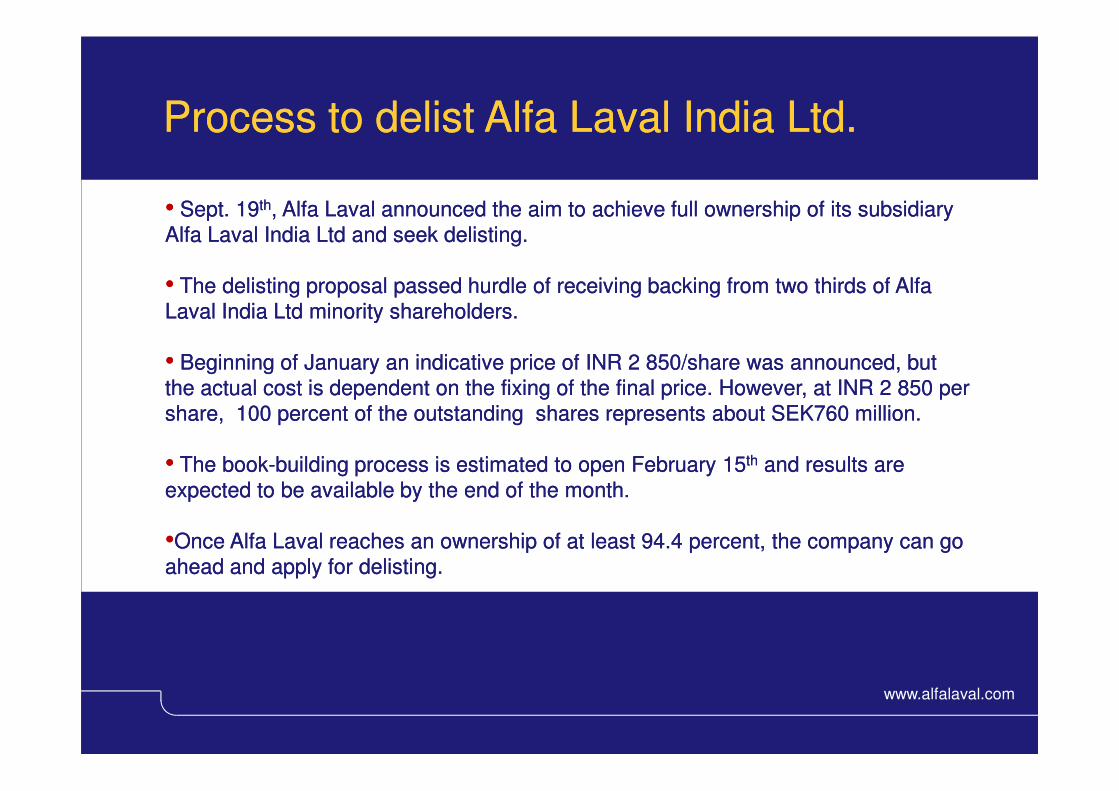
•• Sept. 19Sept. 19thth, Alfa Laval announced the aim to achieve full ownership of its subsidiary , Alfa Laval announced the aim to achieve full ownership of its subsidiary
Alfa Laval India Ltd and seek delisting.Alfa Laval India Ltd and seek delisting.
•• The delisting proposal passed hurdle of receiving backing from two thirds of Alfa The delisting proposal passed hurdle of receiving backing from two thirds of Alfa
Laval India Ltd minority shareholders.Laval India Ltd minority shareholders.
•• Beginning of January an indicative price of INR 2 850/share was announced, but Beginning of January an indicative price of INR 2 850/share was announced, but
the actual cost is dependent on the fixing of the final price. However, at INR 2 850 per the actual cost is dependent on the fixing of the final price. However, at INR 2 850 per
www.alfalaval.com
the actual cost is dependent on the fixing of the final price. However, at INR 2 850 per the actual cost is dependent on the fixing of the final price. However, at INR 2 850 per
share, 100 percent of the outstanding shares represents about SEK760 million.share, 100 percent of the outstanding shares represents about SEK760 million.
•• The bookThe book--building process is estimated to open February 15building process is estimated to open February 15thth and results are and results are
expected to be available by the end of the month.expected to be available by the end of the month.
••Once Alfa Laval reaches an ownership of at least 94.4 percent, the company can go Once Alfa Laval reaches an ownership of at least 94.4 percent, the company can go
ahead and apply for delisting. ahead and apply for delisting. ��

((AmountsAmounts in SEK m)in SEK m) Process Process
Technology*Technology*
EquipmentEquipment Marine & Marine &
Diesel*Diesel*
Alfa Laval Alfa Laval
GroupGroup
Orders ReceivedOrders Received 12,73812,738 9,5089,508 6,4236,423 28,67128,671
Order BacklogOrder Backlog 6,8896,889 1,3851,385 5,4625,462 13,73613,736
Net InvoicingNet Invoicing 12,16012,160 9,4479,447 7,0437,043 28,65228,652
Alfa Laval GroupAlfa Laval GroupPerformance by Division Performance by Division -- JanuaryJanuary -- December December 2011 2011
www.alfalaval.com
Net InvoicingNet Invoicing 12,16012,160 9,4479,447 7,0437,043 28,65228,652
Operating Operating IncomeIncome / /
EBITEBIT
2,5162,516 1,2781,278 1,7081,708 4,6914,691
-- In % of salesIn % of sales 20.720.7 13.513.5 24.324.3 16.416.4
© Alfa Laval Slide 34
*) *) InclIncl. Aalborg from May 1st. Aalborg from May 1st
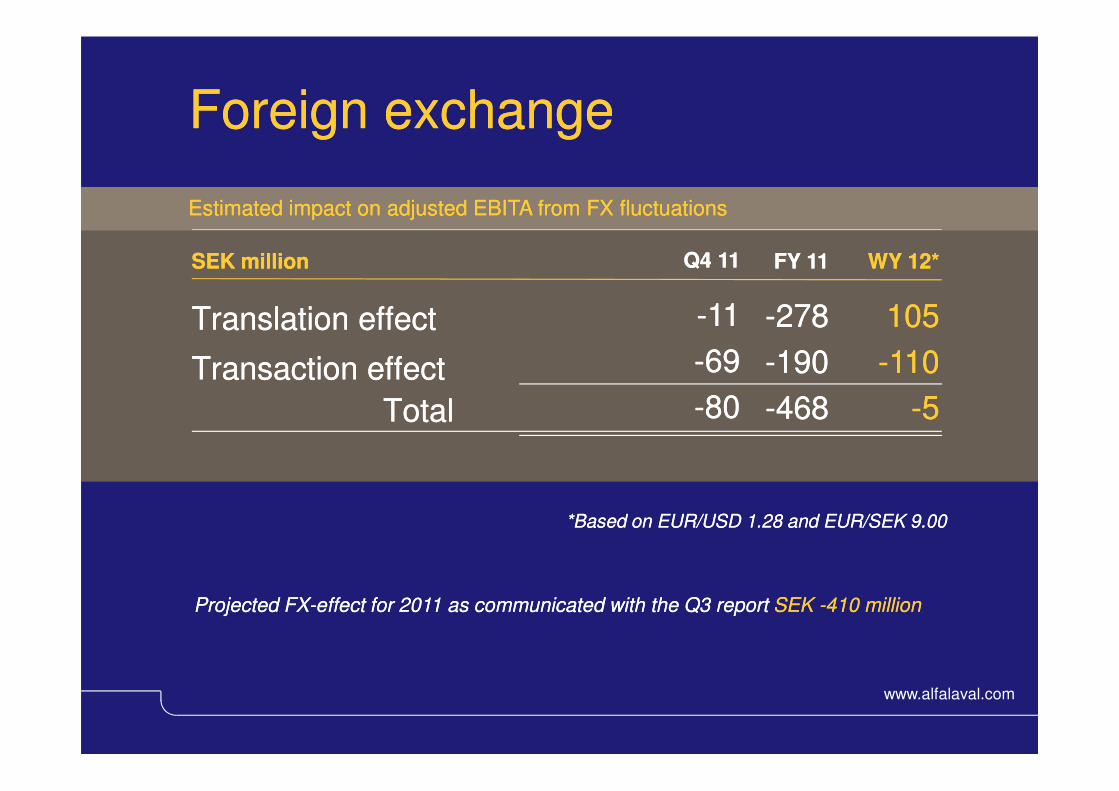
Foreign exchangeForeign exchange
SEK millionSEK million
Translation effectTranslation effect
Transaction effectTransaction effect
TotalTotal
Estimated impact on adjusted EBITA from FX fluctuationsEstimated impact on adjusted EBITA from FX fluctuations
WY WY 12*12*
105105
--110110
--55
FY 11FY 11
--278278
--190190
--468468
Q4 11Q4 11
--1111
--6969
--8080
www.alfalaval.com© Alfa Laval Slide 35
TotalTotal
*Based on EUR/USD 1.28 and EUR/SEK 9.00*Based on EUR/USD 1.28 and EUR/SEK 9.00
--55--468468--8080
Projected FXProjected FX--effect for 2011 as communicated with the Q3 report effect for 2011 as communicated with the Q3 report SEK SEK --410 million 410 million

Order backlog as per Dec. 31
SEK millionsSEK millions
10000
12000
14000
16000
11,90611,906
2,2692,269
2,4462,446
1,9791,979
11,55211,552
13,73613,736
www.alfalaval.com© Alfa Laval Slide 36
For delivery For delivery in 2012in 2012
0
2000
4000
6000
8000
For delivery For delivery later than 2012later than 2012
9,5739,5739,6379,637 11,29011,290
20092009 20102010 20112011
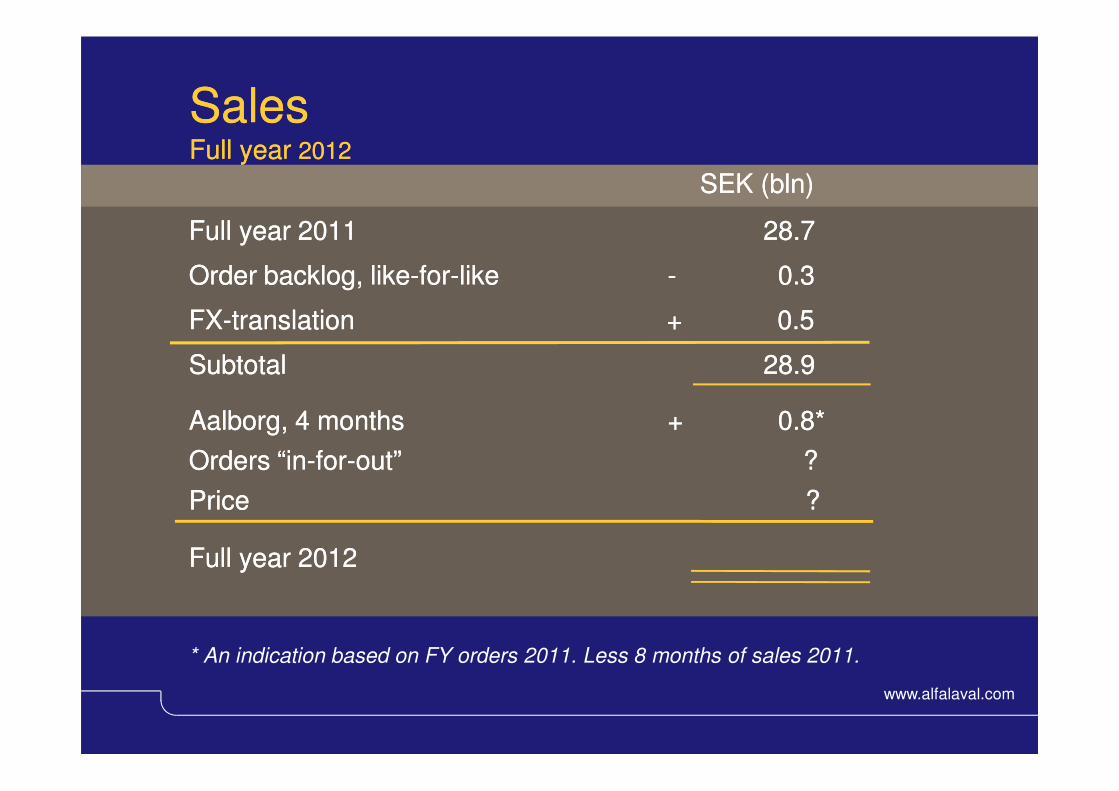
SalesSalesFull year Full year 20122012
SEK (SEK (blnbln))
Full year 2011Full year 2011 28.728.7
Order backlog, likeOrder backlog, like--forfor--likelike -- 0.30.3
FXFX--translation translation + 0.5+ 0.5
SubtotalSubtotal 28.928.9
www.alfalaval.com
Aalborg, 4 monthsAalborg, 4 months ++ 0.8*0.8*
Orders “inOrders “in--forfor--out” ?out” ?
Price ?Price ?
Full year 2012Full year 2012
* An indication based on FY orders 2011. Less 8 months of sales 2011.

Report for Q4 2011Report for Q4 2011
Mr. Lars RenströmMr. Lars RenströmPresident and CEOPresident and CEOAlfa Laval GroupAlfa Laval Group
-- Orders received and operating margin Orders received and operating margin
-- HighlightsHighlights
-- Development per segmentDevelopment per segment
-- Geographical developmentGeographical development
-- Financials Financials
-- OutlookOutlook

Outlook for the first quarterOutlook for the first quarter
“We expect that demand during “We expect that demand during
the first quarter 2012 will be in the first quarter 2012 will be in
line with, or somewhat higher line with, or somewhat higher
www.alfalaval.com© Alfa Laval Slide 39
line with, or somewhat higher line with, or somewhat higher
than, the fourth quarter 2011.” than, the fourth quarter 2011.”

www.alfalaval.com© Alfa Laval Slide 40