Report for Information Chief Executive Officer’s Report...
68
Report for Information Chief Executive Officer’s Report – May 2018 Update Date: May 8, 2018 To: TTC Board From: Chief Executive Officer Summary The Chief Executive Officer’s Report is submitted each month to the TTC Board, for information. Copies of the report are also forwarded to each City of Toronto Councillor, the City Deputy Manager, and the City Chief Financial Officer, for information. The report is also available on the TTC’s website. Financial Summary Each monthly Chief Executive Officer’s Report includes a variety of financial details on TTC budgets and projects. These details are provided for information only, there are no financial impacts associated with the Board’s receipt of this report. Equity/Accessibility Matters The TTC strives to deliver a reliable, safe, clean, and welcoming transit experience for all of its customers, and is committed to making its transit system barrier free and accessible to all. This is at the forefront of TTC’s new Corporate Plan 2018-2022. The TTC strongly believes all customers should enjoy the freedom, independence, and flexibility to travel anywhere on its transit system. The TTC measures, for greater accountability, its progress towards achieving its desired outcomes for a more inclusive and accessible transit system that meets the needs of all its customers. This progress includes the TTC’s Easier Access Program, which is on track to making all subway stations accessible by 2025. It also includes the launch of the Family of Services pilot and improved customer service through better on-time service delivery with improved shared rides, and same day bookings to accommodate Family of Service Trips. These initiatives outlined in this report and in TTC’s Multi-Year Accessibility Plan will help TTC achieve its vision of a seamless, barrier free transit system that makes Toronto proud.
Transcript of Report for Information Chief Executive Officer’s Report...
Report for Information
Chief Executive Officer’s Report – May 2018 Update Date: May 8, 2018 To: TTC Board From: Chief Executive Officer
Summary The Chief Executive Officer’s Report is submitted each month to the TTC Board, for information. Copies of the report are also forwarded to each City of Toronto Councillor, the City Deputy Manager, and the City Chief Financial Officer, for information. The report is also available on the TTC’s website.
Financial Summary Each monthly Chief Executive Officer’s Report includes a variety of financial details on TTC budgets and projects. These details are provided for information only, there are no financial impacts associated with the Board’s receipt of this report.
Equity/Accessibility Matters The TTC strives to deliver a reliable, safe, clean, and welcoming transit experience for all of its customers, and is committed to making its transit system barrier free and accessible to all. This is at the forefront of TTC’s new Corporate Plan 2018-2022. The TTC strongly believes all customers should enjoy the freedom, independence, and flexibility to travel anywhere on its transit system. The TTC measures, for greater accountability, its progress towards achieving its desired outcomes for a more inclusive and accessible transit system that meets the needs of all its customers. This progress includes the TTC’s Easier Access Program, which is on track to making all subway stations accessible by 2025. It also includes the launch of the Family of Services pilot and improved customer service through better on-time service delivery with improved shared rides, and same day bookings to accommodate Family of Service Trips. These initiatives outlined in this report and in TTC’s Multi-Year Accessibility Plan will help TTC achieve its vision of a seamless, barrier free transit system that makes Toronto proud.

Toronto Transit Commission CEO’s Report – May 2018 Update
Decision History The Chief Executive Officer’s Report, which was created in 2012 to better reflect the Chief Executive Officer’s goal to completely modernize the TTC from top to bottom, was transformed to be more closely aligned with the TTC’s seven strategic objectives – safety, customer, people, assets, growth, financial sustainability, and reputation. In 2018, with the launch of the new Corporate Plan, this report will undergo progressive changes to align and reflect our reporting metrics to the TTC’s continued transformation.
Issue Background For each strategic objective, updates of current and emerging issues and multi-year performance are now provided, along with a refreshed performance dashboard that reports on the customer experience. This information is intended to keep the reader completely up-to-date on the various initiatives underway at the TTC that, taken together, will help the TTC achieve its vision of a transit system that makes Toronto proud.
Contact Lito Romano, Manager, CEO Business Support & Council Relations (Acting) 416-397-8699 [email protected]
Signature
Richard J. Leary Chief Executive Officer (Acting)
Attachments Attachment 1 - Chief Executive Officer’s Report – May 2018

TTC performance scorecard 2
CEO’s commentary and 6 current issues
Critical paths 8
Performance Updates: Safety & Security 14 Customer 18 People 47 Assets 50
Toronto Transit CommissionCEO’s ReportMay 2018


Toronto Transit CommissionCEO’s ReportMay 2018

2 Toronto Transit Commission | CEO’s Report | May 2018
TTC performance scorecard
Key Performance Indicator Description Latest Measure Current Target Current Status
Ongoing Trend Page
Safety and Security
Lost Time Injuries Injuries per 100 Employees Mar 2018 4.33 3.81* 14
Customer Injury Incidents Injury Incidents per 1M Boardings Mar 2018 1.03 1.18* 15
Offences against Customers Offences per 1M Boardings Mar 2018 0.61 1.00 16
Offences against Staff Offences per 100 Employees Mar 2018 4.38 4.63* 17
Customer: Ridership TTC Ridership Mar 2018 50.7M 52.0M 18
TTC Ridership 2018 y-t-d to Mar 139.4M 143.3M NA 18
PRESTO Ridership Mar 2018 12.2M 12.2M 19
PRESTO Ridership 2018 y-t-d to Mar 32.3M 29.9M NA 19
Wheel-Trans Ridership Mar 2018 401K 455K 20
Wheel-Trans Ridership 2018 y-t-d to Mar 1,082K 1,236K NA 20
Customer: Satisfaction Customer Satisfaction Score Q1 2018 79% 79% 21
Ongoing trend indicatorsFavourable Mixed Unfavourable * Represents current 12-month average of actual results
3Toronto Transit Commission | CEO’s Report | May 2018
Ongoing trend indicatorsFavourable Mixed Unfavourable * Represents current 12-month average of actual results
Key Performance Indicator Description Latest Measure Current Target Current Status
Ongoing Trend Page
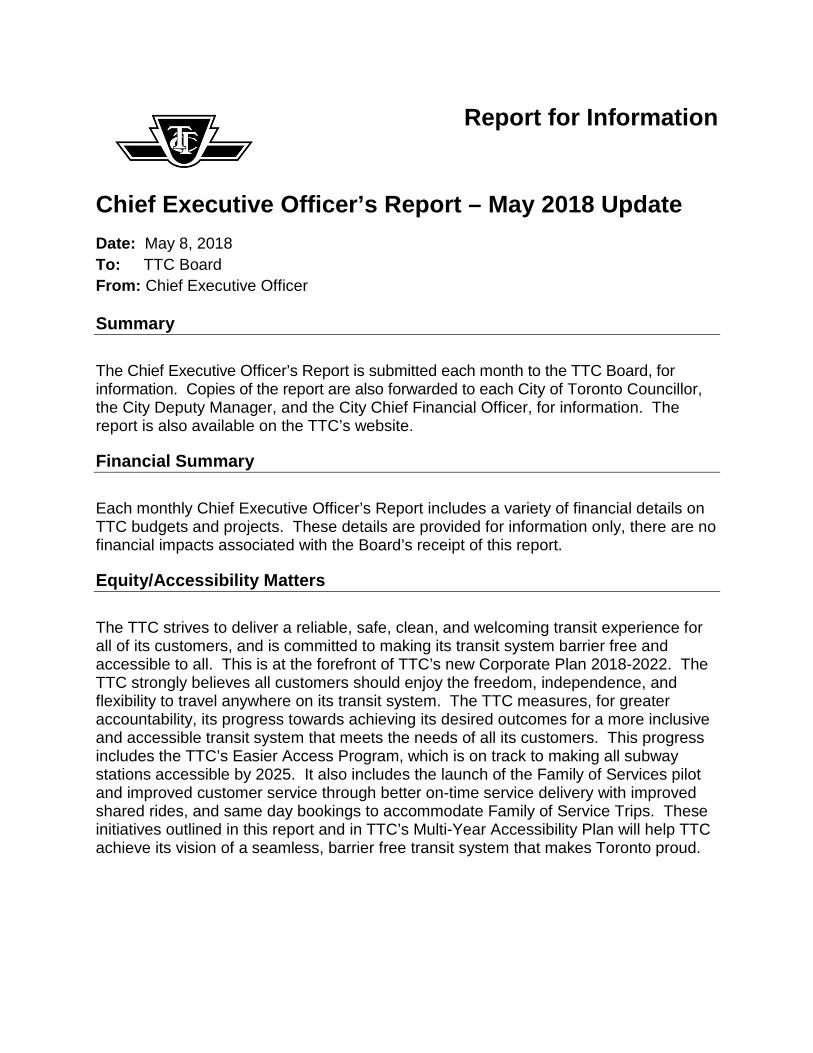
Customer: Environment
Station Cleanliness Audit Score Q1 2018 74% 75% 22
Streetcar Cleanliness Audit Score Q1 2018 88.6% 90% 23
Bus Cleanliness Audit Score Q1 2018 86.4% 90% 24
Subway Cleanliness Audit Score Q1 2018 90.7% 90% 25
Customer: Service Performance
Subway
Line 1 Yonge-University Delay Incidents Mar 2018 745 448 26
Delay Minutes Mar 2018 2,282 913 27
Capacity Delivered in Peak Mar 2018 91.6% 96% 28
Line 2 Bloor-Danforth Delay Incidents Mar 2018 692 399 29
Delay Minutes Mar 2018 1,597 835 30
Capacity Delivered in Peak Mar 2018 95.3% 96% 31
Line 3 Scarborough Delay Incidents Mar 2018 43 39 32
Delay Minutes Mar 2018 301 232 33
Capacity Delivered in Peak Mar 2018 97.6% 98% 34

4 Toronto Transit Commission | CEO’s Report | May 2018
Key Performance Indicator Description Latest Measure Current Target Current Status
Ongoing Trend Page
Line 4 Sheppard Delay Incidents Mar 2018 50 32 35
Delay Minutes Mar 2018 151 78 36
Capacity Delivered in Peak Mar 2018 100% 98% 37
Streetcar On-Time Departure Mar 2018 51.2% 90% 38
Short Turns Mar 2018 931 1,074 39
Bus On-Time Departure Mar 2018 82.6% 90% 40
Short Turns Mar 2018 1,221 1,590 41
Wheel-Trans % Within 10 Minutes of Schedule Mar 2018 85.1% 90% 42
Customer: Amount of Service
Streetcar Weekly Service Hours Feb 2018 18.7K 18.7K 43
Bus Weekly Service Hours Feb 2018 143.2K 145.8K 44
Subway Weekly Service Hours Feb 2018 10.9K 10.8K 45
Operator Efficiency Crewing Efficiency Mar 2018 86.83% 87.15% 46
People
Employee Absence Absenteeism Rate Mar 2018 6.65% 7.42%* 47
Ongoing trend indicatorsFavourable Mixed Unfavourable * Represents current 12-month average of actual results
5Toronto Transit Commission | CEO’s Report | May 2018
Key Performance Indicator Description Latest Measure Current Target Current Status
Ongoing Trend Page
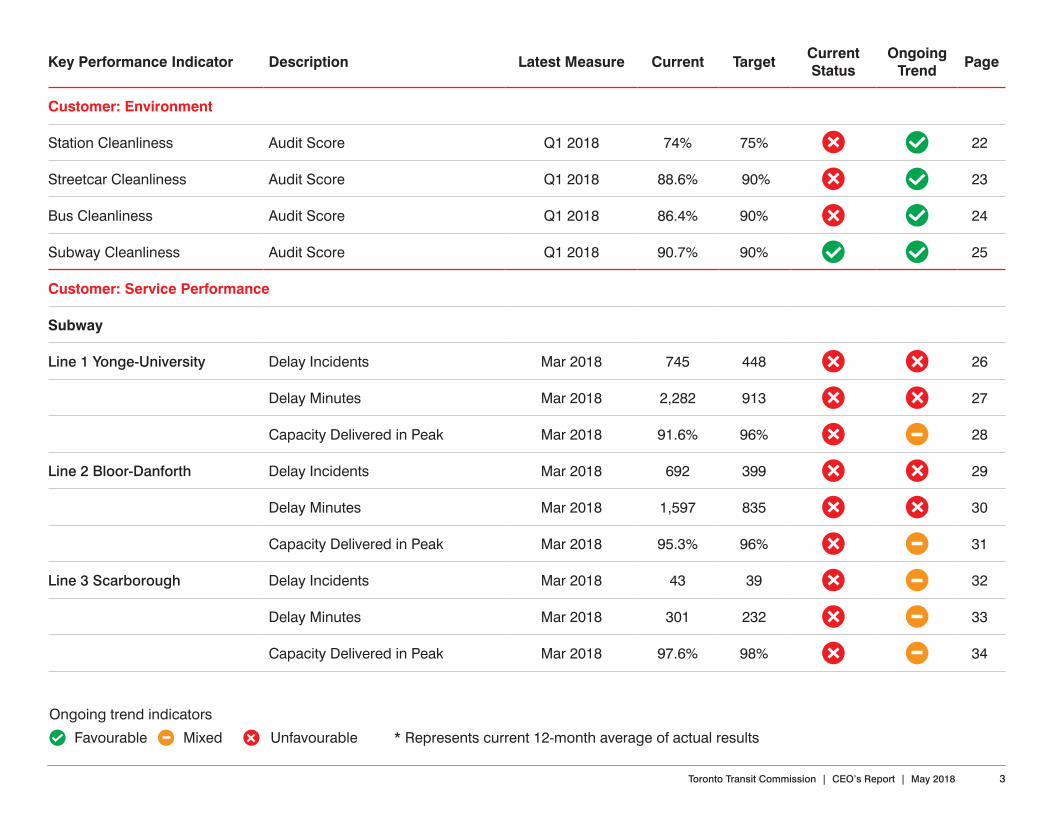
Assets: Vehicle Reliability
Subway
T1 Mean Distance Between Failures Mar 2018 451,501km
300,000km 50
TR Mean Distance Between Failures Mar 2018 407,535km
600,000km 51
Streetcar
CLRV Mean Distance Between Failures Mar 2018 5,638 km 6,000 km 52
ALRV Mean Distance Between Failures Mar 2018 2,357 km 6,000 km 53
LFLRV Mean Distance Between Failures Mar 2018 14,777km
35,000 km 54
Bus Mean Distance Between Failures Mar 2018 20,000km
12,000km 56
Wheel-Trans Mean Distance Between Failures Mar 2018 12,678km
12,000km 58
Assets: Equipment Availability
Elevators Percent Available Mar 2018 98.8% 98% 59
Escalators Percent Available Mar 2018 97.3% 97% 60
Fare Gates Percent Available Mar 2018 96.3% 99.5% 61
Ongoing trend indicatorsFavourable Mixed Unfavourable * Represents current 12-month average of actual results
6 Toronto Transit Commission | CEO’s Report | May 2018
General OverviewThe CEO’s Report we present each Board meeting continues to evolve from month-to-month. For example, “Delivery of Major Projects” has been folded into Critical Paths. Please note, that it has only been three weeks since we last met, so certain KPIs are not yet available. Nevertheless, we’ll continue to ensure this report is as timely and transparent as possible, and one that reflects the service delivered, not just the service planned.
On April 23, the city, as you all know, experienced an unthinkable horror on our streets. Many TTC employees work near North York Centre. We will be forever grateful that no TTC employee was injured on this tragic day. Some, however, did witness this act. All supports were made available to TTC employees on the day of the event, and in the days following this tragedy.
Our Special Constables were some of the first responders who were first on the scene, performing CPR and giving first aid to victims. They also assisted police, ensuring a very large crime scene remained secure. The entire TTC team, in fact, stepped up, as we always do under trying circumstances. Stations staff were in place to assist customers during the subway closure north of Sheppard Station, and Bus Transportation swung into action, providing shuttles to get our customers up to Finch or down to Sheppard.
On the weekend of April 14 and 15, as well as the Monday morning on April 16, the city was hit with severe weather in the form of ice pellets, freezing rain, heavy rain and high winds. The TTC was well-prepared on all fronts, particularly on streetcars. The streetcar network is the most vulnerable asset for extreme weather, including
extreme cold and ice. Staff actively monitored weather forecasts and put in place a plan to mitigate, impacts to service before the storm hit.
On streetcars, we applied an anti-freeze agent to the overhead network to keep ice free from the wires. We did the same to all switches across the network, as well as running “storm cars” on all track. A storm car is just a regular streetcar that is used to run across switches, to keep them active during a storm.
TTC staff were at the city’s Emergency Operations Centre throughout the weekend, ensuring information was shared with our partners in City Transportation, and first responders. Priority for salting, for example, was given to hills where we know buses have difficulty in heavy snow or ice. I’d like to take the opportunity here
CEO’s commentary andcurrent issues

7Toronto Transit Commission | CEO’s Report | May 2018
Performance in March is below target, which is good news. Some short turns will still occur, but limiting them through better route management and using “run-as-directed” vehicles to slot into gaps is key.
The number of short turns in March 2018 was 1,221. For March 2017, it was 1,717. Six routes (60 Steeles West, 34 Eglinton, 52 Lawrence West, 75 Sherbourne, 89 Weston and 63 Ossington) were responsible for 50% of short turns by buses.
Richard J. LearyChief Executive Officer (Acting)Toronto Transit Commission
to thank all TTC staff for their hard work and dedication to keeping this city moving.
This summer, as in most summers, will see a significant amount of construction in the city, including on streetcar routes. As such, those routes will see buses as a replacement. At Main Street Station, realignment of track and repaving is scheduled for May 2018. At the Gerrard and Parliament Sts intersection special track work replacement will occur. Broadview Ave will see significant work at intersections and on what is called tangent track – straight track along the route. Dundas St and Broadview Ave intersection work is scheduled for June, and Gerrard St and Broadview Ave intersection work is scheduled for July.
I won’t repeat here what’s in the rest of this report, except to remind you, and point to, the work we’ve been doing to tackle the one thing that frustrates customers more than anything: short turns on buses and streetcars.

8 Toronto Transit Commission | CEO’s Report | May 2018
Critical Paths
Critical Path 1: Financial Sustainability
SAPThe Senior Director of SAP Program Delivery continues to drive progress on the TTC’s SAP program with a focus on the following key activities to ensure the delivery of Wave 1 in the latter half of 2018: • Optimizing the project schedule
to maximize resource capacity, especially for those who are supporting both the project and critical business areas.
• Preparing for the second test cycle in May with TTC staff leading the planning and execution of this testing.
• Implementing tight controls for change requests and issues management to maintain project schedule delivery.
• Conducting SAP Quality Assurance Solution audits to ensure leading practices are adhered to for critical SAP integrated areas.
• Completed the initial TTC/City SAP Collaboration Committee meeting with future meetings to be scheduled to determine SAP collaboration activities.
The project team will provide an update to the Board in June on SAP program progress, schedule and budget.
Critical Path 2: PeopleThe TTC, CUPE Local 5089 and IAMAW Lodge 235 have negotiated and ratified new collective agreements for four-year terms. These agreements reflect the changing business needs of the TTC, while also providing fair and affordable compensation
and benefit improvements for employees.
With respect to negotiations with the Amalgamated Transit Union Local 113, the TTC has applied to the Ministry of Labour for a conciliator, in an effort to obtain the assistance of a third-party in securing a negotiated collective agreement with ATU Local 113.
In the event the conciliator is unable to assist the parties in reaching a collective agreement, the Ministry of Labour will issue a No-Board report, which will allow the parties to proceed to interest arbitration.
The TTC was declared an essential service in 2011 and workers cannot strike and the TTC cannot lockout workers.

9Toronto Transit Commission | CEO’s Report | May 2018
Critical Path 3: Growth and Assets
New StreetcarsThe target for new streetcar deliveries in Q2 2018 is 16 approved for shipping and 16 approved for service. As of April 13, 2018, the project team approved one to be shipped off the production line and two to enter into service.
Recent Progress:While challenges remain, the TTC and Bombardier have been working together to systematically identify, plan corrective action, and bring closure to the remaining issues that affect production and service reliability.
In April 2018, the project team was further strengthened with the secondment of engineering and quality assurance resources from the Toronto Rocket project. The staff’s familiarity with rail vehicle procurement and Bombardier operations have helped address the root causes of persistent design and quality issues.
Immediate Next Steps: • At the June Board meeting,
the TTC will consider the procurement of additional streetcars to meet customer demand.
• Bombardier to begin production at their Kingston plant in October. This has added some confidence that they will meet the original commitment of delivering 204 new streetcars by the end of Q4 2019.
Scarborough Subway ExtensionThere is no change from the last report. Work continues to progress design towards Stage Gate 3. At this time, the project will provide initial cost inputs from the TTC team (includes detailed costs for the Scarborough Centre Station, tunnel, Kennedy Station, systems, property and utilities). Continued work is underway by the Chief Project Manager with key stakeholders within the TTC
2013 2014 2015 2016 2017 2018 2019
Actual 0 3 14 30 57 68* TBD
vs 2012 Original Schedule
7 37 73 109 148 184 204
Actual 68* TBD
vs 2018 Latest Schedule 121 204
Cumulative No. of New Streetcars Entered into Service(Actual vs Original Schedule and Actual vs Latest Schedule)
Q1 Q2 Q3 Q4 Total
Actual 11* TBD TBD TBD TBD
vs 2018 Latest Schedule 12 16 15 21 64
*As of April 13, 2018
10 Toronto Transit Commission | CEO’s Report | May 2018
and the City to define the activities, approval process and timelines to arrive at the final Class 3 Cost Estimate, Level 3 Project Schedule,
and associated Risk Analysis. As requested by City Council, a report will be presented at the first opportunity to the Executive
Committee, TTC Board and City Council, which is expected to be Q1 2019.
Critical Path 4: Make Taking Public Transit Seamless
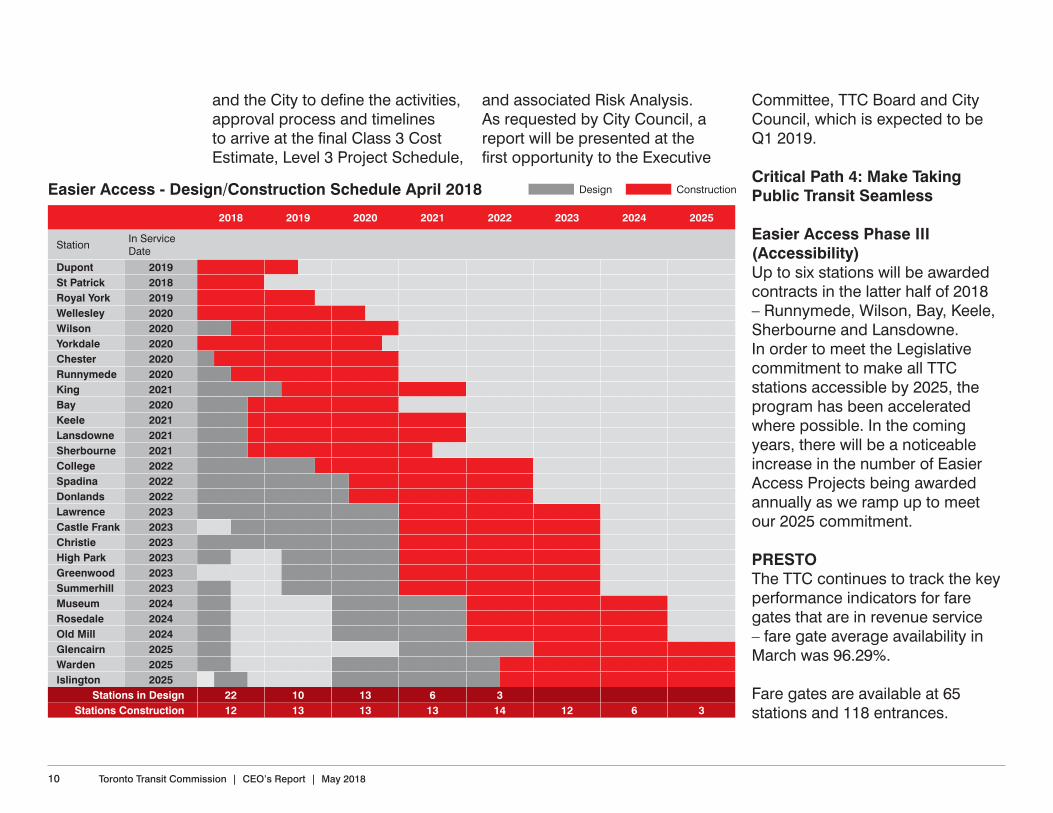
Easier Access Phase III (Accessibility)Up to six stations will be awarded contracts in the latter half of 2018 – Runnymede, Wilson, Bay, Keele, Sherbourne and Lansdowne. In order to meet the Legislative commitment to make all TTC stations accessible by 2025, the program has been accelerated where possible. In the coming years, there will be a noticeable increase in the number of Easier Access Projects being awarded annually as we ramp up to meet our 2025 commitment.
PRESTOThe TTC continues to track the key performance indicators for fare gates that are in revenue service – fare gate average availability in March was 96.29%.
Fare gates are available at 65 stations and 118 entrances.
Easier Access - Design/Construction Schedule April 2018
2018 2019 2020 2021 2022 2023 2024 2025
Station In Service Date
Dupont 2019St Patrick 2018Royal York 2019Wellesley 2020Wilson 2020Yorkdale 2020Chester 2020Runnymede 2020King 2021Bay 2020Keele 2021Lansdowne 2021Sherbourne 2021College 2022Spadina 2022Donlands 2022Lawrence 2023Castle Frank 2023Christie 2023High Park 2023Greenwood 2023Summerhill 2023Museum 2024Rosedale 2024Old Mill 2024Glencairn 2025Warden 2025Islington 2025
Stations in Design 22 10 13 6 3Stations Construction 12 13 13 13 14 12 6 3
Design Construction

11Toronto Transit Commission | CEO’s Report | May 2018
Construction continues on the remaining stations and entrances with expected completion this summer, with the exceptions being Commerce Court entrance at King Station, and the main entrance at Yorkdale Station, as these entrances are tied to additional work or projects.
The TTC is working closely with PRESTO to complete the rollout schedule confirming the delivery of the remaining PRESTO products required to enable full PRESTO adoption. Once the rollout schedule is finalized, the TTC and PRESTO will finalize the joint plan to increase card adoption, promote the fare options available on PRESTO, and lay out the activities and timeline to transition and retire TTC legacy fare media products. The TTC continues to work closely with Metrolinx to finalize the PRESTO schedule for functionality and adoption. By August 26, 2018 the two-hour transfer will be available to customers. A comprehensive PRESTO update, including the revised schedule and plan, will be provided at the June Board meeting.
King Street Transit PilotThe TTC continues to provide additional vehicles in support of the King Street Transit Pilot aimed at improving transit reliability, speed and capacity. We have directed as many new accessible streetcars to the King Street Transit Pilot as possible. Each delivery of a new accessible streetcar replaces a legacy streetcar.
As of April, the TTC is providing 33 streetcars for the 504 King route,
10 of which are new, accessible streetcars.
Critical Path 5: Partnerships
Battery Electric BusesDuring the week of April 16, TTC front line employees, management, as well as the Mayor, TTC Chair and Commissioners, had a first look at three different all-electric long-range buses (eBuses) from manufactures BYD, New Flyer, and Proterra. The eBus project
First look at future eBus vehicles

12 Toronto Transit Commission | CEO’s Report | May 2018
team, Toronto Hydro and the bus manufactures were on hand to address questions and learn from operators, maintainers, technical support staff, trainers and ACAT as to what needs to be considered or addressed in this and future procurements.
During the week of April 9, the TTC and Toronto Hydro formalized their partnership through a non-binding Memorandum of Understanding, the basis of which is an agreement to share both the costs and benefits of the TTC’s bus fleet electrification plan.
Immediate Next Steps: • Complete commercial and
technical negotiations and award contracts to eBus manufactures
• Issue design-build contract, administered by Toronto Hydro, to upgrade the garage electrical systems at Arrow Road, Mount Dennis, and Eglinton Garages
• Detailed design of electrical upgrades
• Pre-production design review meetings with each of the eBus manufacturers
2018 2019 2020
Q1 Q2 Q3 Q4 Q1 Q2 Q3 Q4 Q1 Q2 Q3 Q4
Clean Diesel Bus
Actual 40*
vs Scheduled 40* 78 104 89
Cumulative Actual 40*
vs Cumulative Scheduled 40* 118 222 311 311 311 311 311 311 311 311 311
Hybrid Electric
Bus
Actual
vs Scheduled 1 53 115 85
Cumulative Actual
vs Cumulative Scheduled 0* 0 1 54 169 169 169 169 254 254 254 254
Battery Electric
Bus (eBus)
Actual
vs Scheduled 10 20 10** 20**
Cumulative Actual
vs Cumulative Scheduled 0* 0 0 10 30 30 30 40** 60** 60** 60** 60**
TotalTotal Actual 40*
vs Total Cumulative Schedule 60* 176 242 375 510 510 510 520 625 625 625 625
* As of April 13, 2018** Additional 30 eBus procurement is pending approval at May 2018 Boarding Meeting
2018 - 2020 Bus Procurements

13Toronto Transit Commission | CEO’s Report | May 2018
• Quality assurance reviews of production facilities
• Detailed modelling of the entire bus network by our partners at the Canadian Urban Transit Research and Innovation Consortium
• Advancing the project plan along with partners at the National Research Council for the head-to-head evaluation.
Cornerstone: Safety The TTC initiated a Subway Air Quality Study in 2017, which is still underway.
The first round of air sampling has been completed and focused on positions that involve employees who spend the greatest amount of time in the subway during revenue service.
Based on the interim sampling results, the subway air quality continues to be deemed safe for employees, and is not expected to affect the health of employees in the work positions assessed who do not have pre-existing serious respiratory conditions. Formal reports have been issued to affected work locations. Further sampling will be conducted throughout 2018 followed by final reports.

14 Toronto Transit Commission | CEO’s Report | May 2018
1
2
3
4
5
6
12014
2 3 4 5 6 7 8 9 101112 12015
2 3 4 5 6 7 8 9 101112 12016
2 3 4 5 6 7 8 9 101112 12017
2 3 4 5 6 7 8 9 101112 12018
2 3 4 5 6 7 8 9 101112
Inju
ries
per 1
00 E
mpl
oyee
s
Actual 12-Month Average
ResultsThe lost-time injury rate (LTIR) for March 2018 was 4.33 injuries per 100 employees.
AnalysisThe 12-month average LTIR to the end of March 2018 was 3.81 injuries per 100 employees. The LTIR for the current period was 14% higher than the 12-month average LTIR. This increase was mainly attributed to the increase in Acute Emotional Event and Assault injuries in this period. The 12-month average line shows the movement of the LTIR from 2014 to 2018. An upward movement can be observed since December 2015.
Action PlanFurther analysis by injury type reveals that musculoskeletal/ergonomic type (MSD) injuries (e.g. overexertion, reach/bend/twist, repetition) represent the highest injury event and account for 24% of all lost-time injuries. The new Ergonomic Musculoskeletal Disorder (MSD) Prevention Program, focused on preventing such injuries and resolving ergonomic concerns, will be implemented from April 2018 through to the end of 2019. Implementation of the program will include communication, training, and MSD hazard assessments.
Lost-time Injuries
Safety and Security
15Toronto Transit Commission | CEO’s Report | May 2018
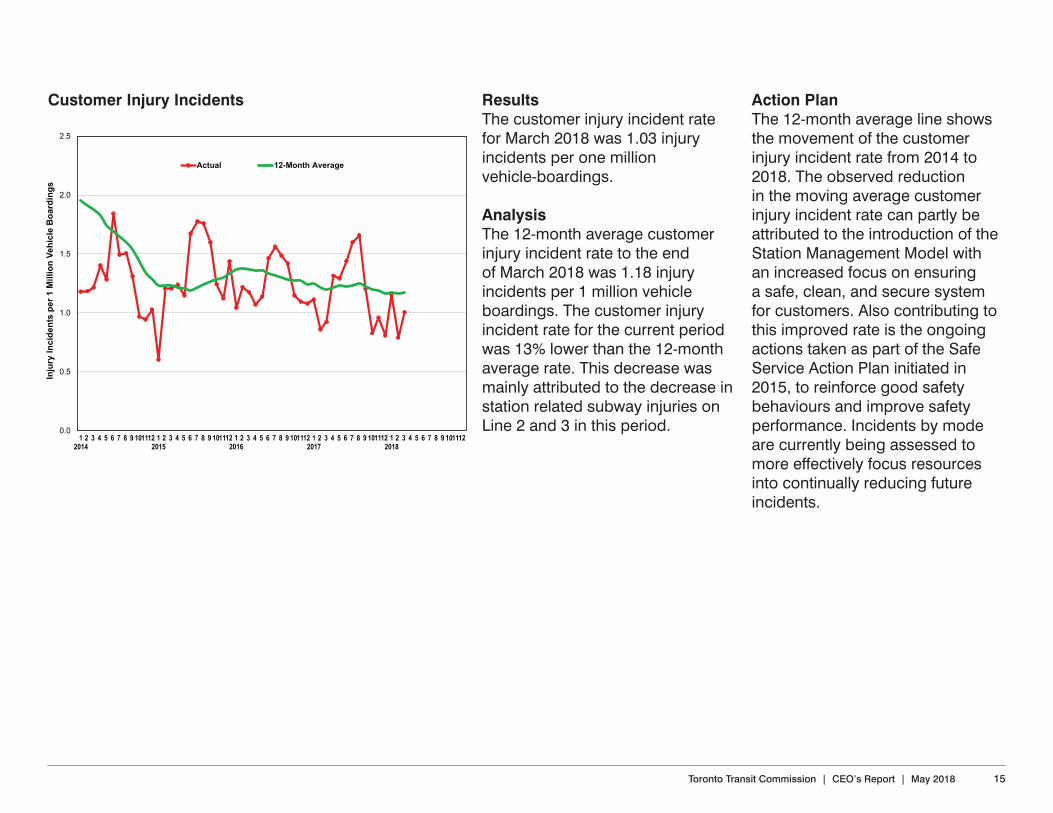
ResultsThe customer injury incident rate for March 2018 was 1.03 injury incidents per one million vehicle-boardings.
AnalysisThe 12-month average customer injury incident rate to the end of March 2018 was 1.18 injury incidents per 1 million vehicle boardings. The customer injury incident rate for the current period was 13% lower than the 12-month average rate. This decrease was mainly attributed to the decrease in station related subway injuries on Line 2 and 3 in this period.
Action PlanThe 12-month average line shows the movement of the customer injury incident rate from 2014 to 2018. The observed reduction in the moving average customer injury incident rate can partly be attributed to the introduction of the Station Management Model with an increased focus on ensuring a safe, clean, and secure system for customers. Also contributing to this improved rate is the ongoing actions taken as part of the Safe Service Action Plan initiated in 2015, to reinforce good safety behaviours and improve safety performance. Incidents by mode are currently being assessed to more effectively focus resources into continually reducing future incidents.
Customer Injury Incidents
0.0
0.5
1.0
1.5
2.0
2.5
12014
2 3 4 5 6 7 8 9 101112 12015
2 3 4 5 6 7 8 9 101112 12016
2 3 4 5 6 7 8 9 101112 12017
2 3 4 5 6 7 8 9 101112 12018
2 3 4 5 6 7 8 9 101112
Inju
ry In
cide
nts
per 1
Mill
ion
Vehi
cle
Boa
rdin
gs
Actual 12-Month Average

16 Toronto Transit Commission | CEO’s Report | May 2018
0.0
0.2
0.4
0.6
0.8
1.0
1.2
Jan Feb Mar Apr May Jun Jul Aug Sep Oct Nov Dec
Offe
nces
per
1 M
illio
n Ve
hicl
e B
oard
ings
2018 Actual 2018 Target2017 Trend 2016 Trend2015 Trend 2014 Trend
ResultsTotal offences against customers decreased in March to 0.61 offences per one million vehicle boardings. The moving annual rate of offences against customers to March 2018 was 0.62, which was 13% higher than the corresponding moving annual rate of 0.55 to March 2017.
AnalysisThe rate of offences in March was lower than those seen in the preceding three months, but was 9% above the corresponding rate for March 2017. The ongoing trend remains mixed.
Action PlanTwelve new Transit Enforcement Special Constables were sworn in at the end of March and have been deployed into the field, answering calls for service and providing a proactive presence across all modes. Transit Enforcement Special Constables were also assigned to provide additional support at designated stations in the month, in response to specific concerns.
Offences Against Customers
17Toronto Transit Commission | CEO’s Report | May 2018
0.0
1.5
3.0
4.5
6.0
7.5
12014
2 3 4 5 6 7 8 9 101112 12015
2 3 4 5 6 7 8 9 101112 12016
2 3 4 5 6 7 8 9 101112 12017
2 3 4 5 6 7 8 9 101112 12018
2 3 4 5 6 7 8 9 101112
Offe
nces
per
100
Em
ploy
ees
(Ann
ualiz
ed)
Actual 12-Month Average
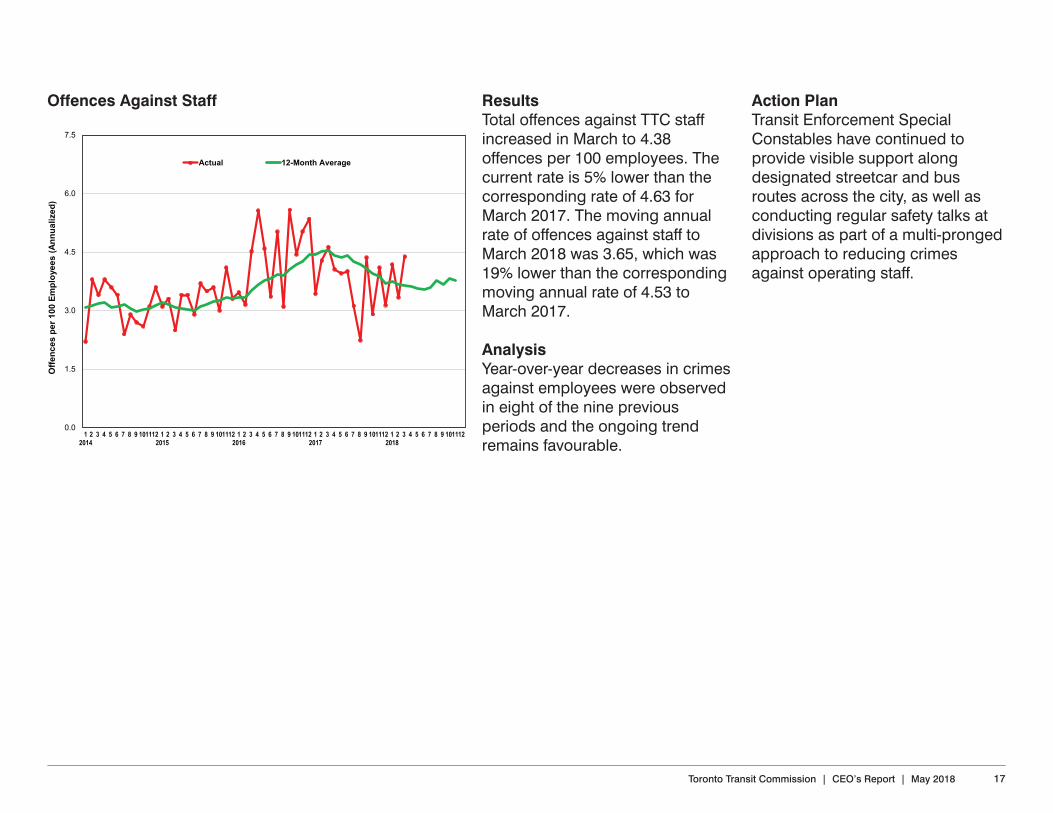
ResultsTotal offences against TTC staff increased in March to 4.38 offences per 100 employees. The current rate is 5% lower than the corresponding rate of 4.63 for March 2017. The moving annual rate of offences against staff to March 2018 was 3.65, which was 19% lower than the corresponding moving annual rate of 4.53 to March 2017.
AnalysisYear-over-year decreases in crimes against employees were observed in eight of the nine previous periods and the ongoing trend remains favourable.
Action PlanTransit Enforcement Special Constables have continued to provide visible support along designated streetcar and bus routes across the city, as well as conducting regular safety talks at divisions as part of a multi-pronged approach to reducing crimes against operating staff.
Offences Against Staff

18 Toronto Transit Commission | CEO’s Report | May 2018
Customer: Ridership RidershipRidership in March 2018 was 50.7 million, which was 1.3 million (2.5%) below the budget of 52.0 million. In terms of year-over-year growth, March’s ridership of 50.7 million was 0.2 million (0.4%) below the comparable period in 2017. Year-to-date to the end of March 2018, ridership was 3.9 million (2.7%) below budget and 1.8 million (1.2%) below the comparable period in 2017.
AnalysisThe sluggish ridership results to-date in 2018 are partially attributable to the frequency of severe cold weather. To the end of March, Toronto Public Health issued 19 Extreme Cold Weather Alerts (forecasted temperatures of -15C or colder) compared with 17 to the same point in 2017. Another factor continuing to impact ridership is the ongoing decrease in Metropass sales. There were 60,000 (-7%) fewer passes sold from January to March in 2018
compared with the corresponding months in 2017. Some of these lost sales have likely been offset by an increase in PRESTO epurse transactions; however, Metropasses currently generate about 46% of total ridership; therefore, declining sales will have a significant impact on overall ridership trends.
Action PlanRidership flat-lined since 2014 in part due to slowing employment growth, city growth, traffic and congestion, changes in customer mobility and the growth in digital ride-hailing services.
To re-establish sustained ridership growth, a new Ridership Growth Strategy is being rolled out in 2018.
Research is also underway to analyze the changes in monthly Metropass sales and corresponding ridership impact. Results of this analysis will help develop future action plans.
Customer
TTC Ridership
9.0
9.5
10.0
10.5
11.0
11.5
12.0
Jan Feb Mar Apr May Jun Jul Aug Sep Oct Nov Dec
Aver
age
Wee
kly
Rid
ersh
ip (M
illio
ns)
2018 Actual 2018 Budget2017 Actual 2016 Actual2015 Actual 2014 Actual

19Toronto Transit Commission | CEO’s Report | May 2018
0.0
2.0
4.0
6.0
8.0
10.0
Jan Feb Mar Apr May Jun Jul Aug Sep Oct Nov Dec
Aver
age
Wee
kly
Rid
ersh
ip (M
illio
ns)
2018 Actual 2018 Budget
2017 Actual 2016 Actual
2015 Actual 2014 Actual
Results Ridership using the PRESTO Farecard (epurse balance, period pass) in March totalled 12.2 million, which virtually met the budget (-46K). In terms of year-over-year growth, PRESTO ridership in March totalled 12.2 million and was 5.9M (94%) above the ridership of 6.3 million for the comparable period in 2017. Year-to-date to the end of March 2018, ridership was 2.4 million (8%) above budget and 17.2 million (114%) above the comparable period in 2017.
Analysis The PRESTO component of total TTC ridership continues to grow. The PRESTO adoption rate increased from 23.2% to 24.0% in March 2018.
The 2018 PRESTO ridership budget was calendarized in late 2017 and the sharp increase in September 2018 arises from the then anticipated discontinuation of the sale of legacy monthly passes, tokens and tickets. However, this may shift as the TTC finalizes the key deliverables for 2018 by PRESTO.
Action PlanThe PRESTO adoption rate is expected to accelerate throughout 2018 in conjunction with the phasing-out of legacy fare media and the commensurate uptake of PRESTO-based fare media. The TTC will continue to work with PRESTO staff on enabling functionality to support the elimination of legacy fare media. Note:Ridership on PRESTO is included in TTC ridership totals.
PRESTO Ridership

20 Toronto Transit Commission | CEO’s Report | May 2018
ResultsRidership in March 2018 was 401K, which was 54K (12%) below the budget of 455K. In terms of year-over-year growth, March’s ridership of 401K was 7K (2%) below the ridership of 408K for the comparable period in 2017.
Year-to-date to the end of March 2018, ridership was 154K (12%) below budget but 65K (6%) above the comparable period in 2017.
AnalysisWheel-Trans has not experienced a drop in ridership in the past four years but has not achieved the typical March bump up as in previous years. Some of the drop can be attributed to poor weather which has a greater impact on Wheel-Trans customers however, applications for new Wheel-Trans eligibility has not slowed. In order to most efficiently schedule trips, Wheel-Trans service planning has delayed confirmation of precise trip times to one day prior to the trip. Staff has noticed a corresponding increase in cancellations and same-day cancellations indicating customers are selecting alternative methods of travel including the TTC conventional system.
Action PlanWith the launch of the Family of Service Pilot in May 2017 and the Wheel-Trans Transformation Program in general, many changes are being initiated which will create an impact on Wheel-Trans KPIs. Further analysis continues to be conducted to determine the impacts on customers as well as on Wheel-Trans services.
Wheel-Trans Ridership
40
55
70
85
100
115
Jan Feb Mar Apr May Jun Jul Aug Sep Oct Nov Dec
Aver
age
Wee
kly
Rid
ersh
ip (T
hous
ands
)
2018 Actual 2018 Budget
2017 Actual 2016 Actual
2015 Actual 2014 Actual
Wheel-Trans customers have been encouraged to travel on the conventional system where possible, should the trip match their ability and the accessibility of the system along their required route. The introduction of a more flexible cancellation policy enables customers to wait until nearer the time of departure to determine if they feel able to travel on the conventional system. The benefit of more same-day booking opportunity is more consistent with the freedom and flexibility of using the conventional system. Wheel-Trans continues to closely monitor its KPIs and the resulting impacts. Note:Wheel-Trans ridership is not included in TTC ridership totals.
.

21Toronto Transit Commission | CEO’s Report | May 2018
Customer: Satisfaction
ResultsNearly eight in ten customers have high perceptions of overall customer satisfaction in Q1 2018 (79%); similar perceptions to last quarter and a year ago. Looking at the monthly scores, satisfaction remained consistent from last year this time.
The areas of highest customer satisfaction (≥80%) for all three modes included: trip duration, helpfulness of TTC staff/operators,
appearance of TTC staff/operators, and the quality of stop announcements.
AnalysisTwo-fifths (40%) of customers believe that the TTC has improved over the last two years, similar to last quarter (37%) but significantly higher than in Q1 2017 (29%). This trend is consistent across subway/bus/streetcar users and across frequent/occasional users. Pride in the TTC and what it means for Toronto has decreased wave to wave but is consistent year to year (Q1 2017: 71%; Q4 2017: 75%; Q1 2018: 69%). Customers also agree that the TTC is a reliable way to travel around the City (77%) and that it provides them with the flexibility they need to travel around the city (81%). Perceptions of value for money remain consistent wave to wave with just over two-thirds indicating they received excellent/good value for money on their last trip (Q1 2017: 63%; Q4 2017: 65%; Q1 2018: 63%).
Customer Satisfaction Score
65
70
75
80
85
1st Quarter 2nd Quarter 3rd Quarter 4th Quarter
Cus
tom
er S
atis
fact
ion
Scor
e (%
)
2018 Actual 2017 Actual 2016 Actual2015 Actual 2014 Actual
Action PlanPerceptions of capacity and overcrowding will improve with the service improvements recommended in the report to the Board this month on capacity improvements for both Line 1 subway service and bus service.
As the network continues to improve, mitigate any pain points by communicating solutions to customers and offering messaging that diffuses situations surrounding delays, confusion and crowding.
The congruence between awareness of service improvements and consistently high levels of customer satisfaction suggests customers are recognizing recent efforts. Maintaining this trend will contribute to incremental ridership growth.

22 Toronto Transit Commission | CEO’s Report | May 2018
Customer: EnvironmentResultsThe average station score missed target is registering at 74.01%. The average score is down slightly from Q4 2017, but was higher than what is traditionally seen in the first quarter. TYSSE stations were excluded due to ongoing construction.
AnalysisInclement weather during the winter months traditionally has a direct impact on the audit scores, compounded by the fact that inclement weather prevents Janitors from being able to address detail-oriented work in the stations.
With the start-up of annual projects, the audit scores are expected to rise throughout the remainder of 2018.
Action PlanNew methods and processes continue to be investigated/considered. One process being explored is to increase the number of heavy cleaning crews to increase the frequency of heavy cleaning activities in stations. The goal is to reduce the current four-week cycle to a two-week cycle. The proposed plan involves converting some Maintenance Servicepersons to Heavy-Clean Servicepersons, which would be a cost neutral improvement.
Station Cleanliness
68
71
74
77
80
1st Qtr 2nd Qtr 3rd Qtr 4th Qtr
Cle
anlin
ess
Audi
t Sco
re (%
)
2018 Actual 2018 Target2017 Actual 2016 Actual2015 Actual 2014 Actual

23Toronto Transit Commission | CEO’s Report | May 2018
ResultsThe audit score for streetcar clean-liness for Q1 2018 was 88.6%. This score is an increase from both Q1 2017 (same period last year) and Q4 2017 (previous period). Overall performance on cleanliness, however, remained below the target of 90%.
AnalysisPoor weather conditions in January impacted the overall Q1 quarterly cleanliness. Exterior washes were not completed regularly since they were not performed in tempera-tures below -10 C. Although the floors were washed regularly, accu-mulation of salt and sand deposits contributed to overall rating.
Action PlanIn addition to investigate methods to wash vehicles in all weather conditions, staff will investigate additional procedures to remove deposits that have accumulated on the flooring. The warmer weather and absence of salt and sand on the roads will also contribute to increase in cleanliness.
Vehicle Cleanliness - Streetcar
84
86
88
90
92
1st Quarter 2nd Quarter 3rd Quarter 4th Quarter
Cle
anlin
ess
Audi
t Sco
re (%
)
2018 Actual 2018 Target
2017 Actual
24 Toronto Transit Commission | CEO’s Report | May 2018
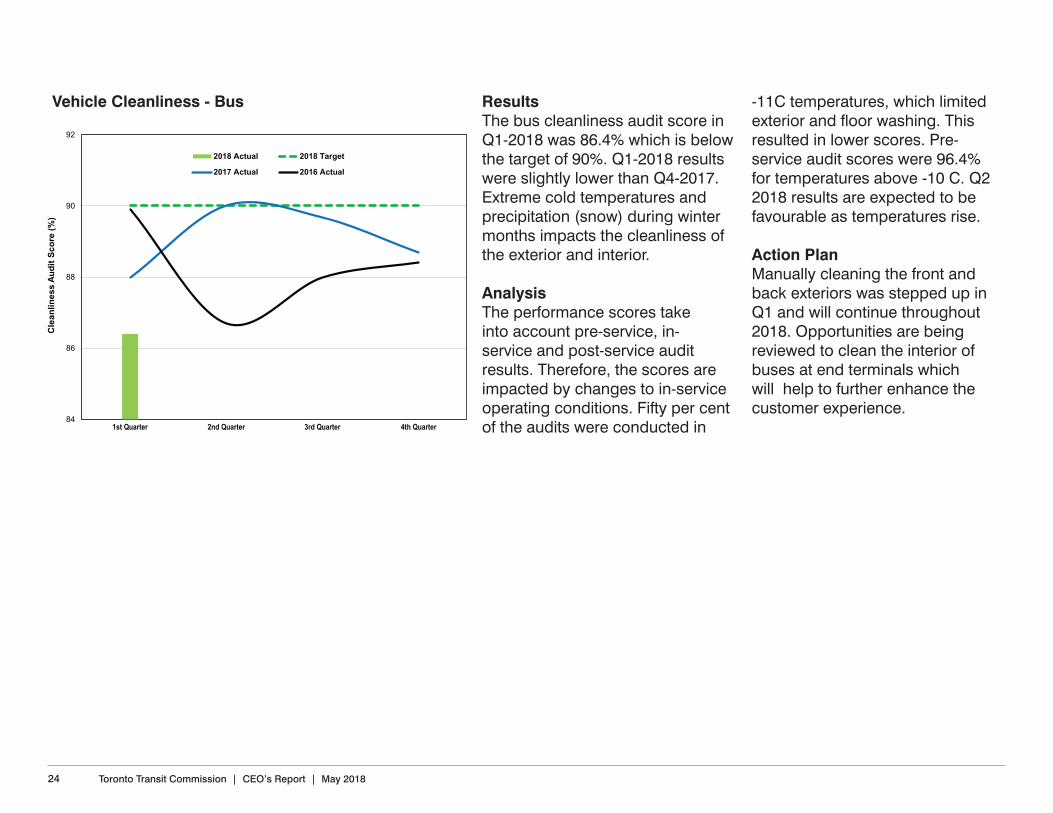
ResultsThe bus cleanliness audit score in Q1-2018 was 86.4% which is below the target of 90%. Q1-2018 results were slightly lower than Q4-2017. Extreme cold temperatures and precipitation (snow) during winter months impacts the cleanliness of the exterior and interior.
AnalysisThe performance scores take into account pre-service, in-service and post-service audit results. Therefore, the scores are impacted by changes to in-service operating conditions. Fifty per cent of the audits were conducted in
-11C temperatures, which limited exterior and floor washing. This resulted in lower scores. Pre-service audit scores were 96.4% for temperatures above -10 C. Q2 2018 results are expected to be favourable as temperatures rise.
Action PlanManually cleaning the front and back exteriors was stepped up in Q1 and will continue throughout 2018. Opportunities are being reviewed to clean the interior of buses at end terminals which will help to further enhance the customer experience.
Vehicle Cleanliness - Bus
84
86
88
90
92
1st Quarter 2nd Quarter 3rd Quarter 4th Quarter
Cle
anlin
ess
Audi
t Sco
re (%
)
2018 Actual 2018 Target
2017 Actual 2016 Actual

25Toronto Transit Commission | CEO’s Report | May 2018
ResultsThe average rating of 90.7% in Q1-2018 is above the target of 90.0%. Subway recorded a score of greater than 90% in six consecutive quarters.
AnalysisFloors and exterior cleanliness appeared as an area where further improvement can be made. Inclement weather prohibited the exterior wash program and resulted in lower than expected scores.
Action PlanOn Line 1, exterior washes were affected due to facility constraints at Wilson and construction at Davisville Carhouse. Currently, floors are washed every 14 days during the floor wash cycle. Exterior vehicle cleanliness is an area where further improvements can be made on all lines when weather conditions are more favourable. Note:The target for this measure has been changed to 90% in Q4-2017, which is more reflective of the ongoing level of performance and is consistent with the targets for Bus and Streetcar.
Vehicle Cleanliness - Subway
85
87
89
91
93
95
1st Quarter 2nd Quarter 3rd Quarter 4th Quarter
Cle
anlin
ess
Audi
t Sco
re (%
)
2018 Actual 2018 Target 2017 Actual 2016 Actual

26 Toronto Transit Commission | CEO’s Report | May 2018
Customer: Service performanceResultsThe number of delay incidents increased by 9.9% as compared to February, to 745 from 678.
AnalysisThe most significant increase of incidents is attributable to passenger-related events. Overall, passenger incidents increased by 24% and accounted for 50% of incidents in March.
While the number of incidents increased, the average number per day is similar to those registered in February, at 24 per day.
Action PlanThe subway schedule changes in April and May are expected to reduce the number of incidents.
Note:The 2018 target is based on a 40% or more reduction in delay incidents from the 2014 monthly average baseline.
Line 1: Delay IncidentsSubway
0
250
500
750
1,000
1,250
Jan Feb Mar Apr May Jun Jul Aug Sep Oct Nov Dec
Num
ber o
f Del
ay In
cide
nts
2018 Actual 2018 Target2017 Trend 2016 Trend2015 Trend 2014 Trend

27Toronto Transit Commission | CEO’s Report | May 2018
ResultsThe number of delay minutes increased in March to 2282. This was an increase of 27.8% compared to January.
AnalysisThere were three events on Line 1 that accounted for 20% of the total delay minutes; two security related incidents that required station evacuation and one personal injury at track level incident. These three incidents are all categorized in the passenger-related area, adding to the 1282 minutes of overall passenger incidents incurred during March.
In March, the Infrastructure and Rail Vehicle teams experienced an increase in delay minutes as a result of a third-party construction incident. This incident led to a smoke/fire event and an extensive clean-up of both wayside and vehicles.
Action PlanTechnical delays related to equipment such as ATC, decreased from February to March. In an effort to decrease these types of events further, a new pre-check inspection is being added to trains as they run-out in the morning. This additional check will virtually eliminate the risk of a train entering service with a known issue that is associated to ATC migration from the legacy system to the new area.
Note: The 2018 target is based on a 40% or more reduction in delay minutes from the 2014 monthly average baseline.
Line 1: Delay Minutes
0
500
1,000
1,500
2,000
2,500
Jan Feb Mar Apr May Jun Jul Aug Sep Oct Nov Dec
Num
ber o
f Del
ay M
inut
es
2018 Actual 2018 Target2017 Trend 2016 Trend2015 Trend 2014 Trend

28 Toronto Transit Commission | CEO’s Report | May 2018
ResultsDespite an increase in incidents and minutes, the peak capacity delivered on Line 1 improved again over February and is the best since July 2017.
AnalysisIn February, two additional trains were added to the morning peak service. In the early stages, the positioning and timing of the deployment of these trains had to be adjusted in coordination with Stations staff. This process is now well-established and requires little adjustment.
Action PlanThe schedule will commence in April and more significant adjustments will take place in May. These permanent changes should continue to improve the capacity levels moving forward.
Line 1: Capacity Delivered In Peak
80
84
88
92
96
100
Jan Feb Mar Apr May Jun Jul Aug Sep Oct Nov Dec
Cap
acity
Del
iver
ed (%
)
2018 Actual 2018 Target2017 Trend 2016 Trend2015 Trend
29Toronto Transit Commission | CEO’s Report | May 2018
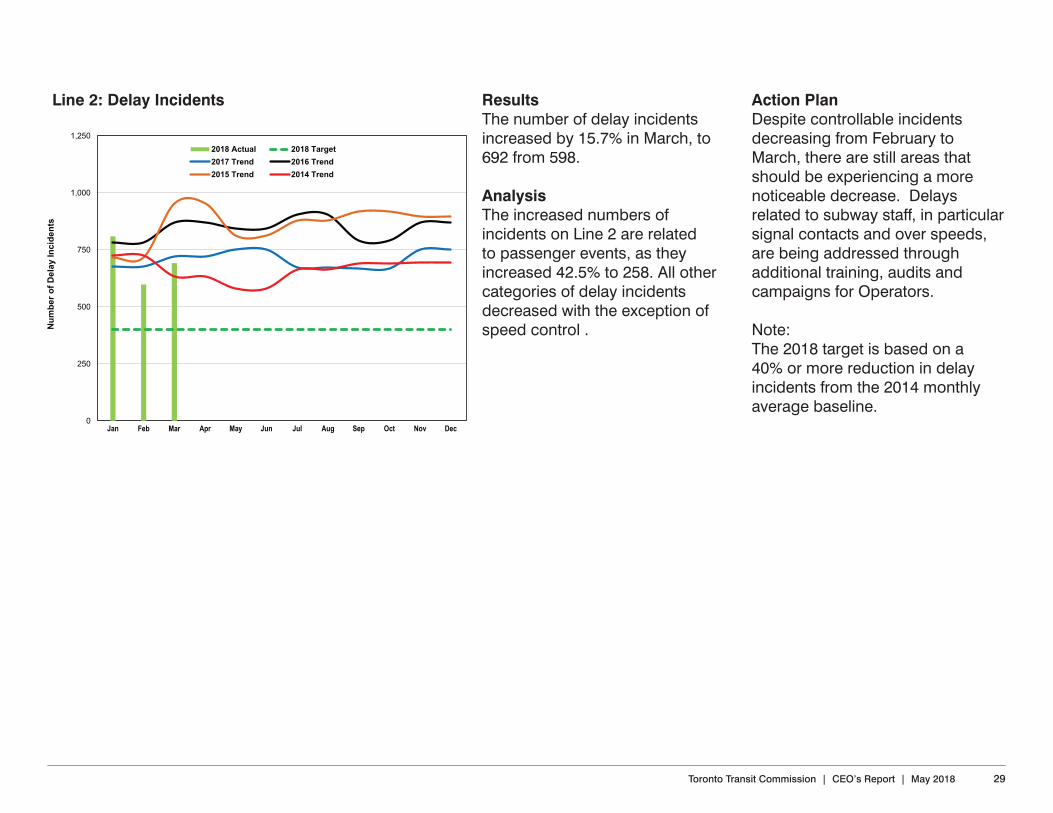
ResultsThe number of delay incidents increased by 15.7% in March, to 692 from 598.
AnalysisThe increased numbers of incidents on Line 2 are related to passenger events, as they increased 42.5% to 258. All other categories of delay incidents decreased with the exception of speed control .
Action PlanDespite controllable incidents decreasing from February to March, there are still areas that should be experiencing a more noticeable decrease. Delays related to subway staff, in particular signal contacts and over speeds, are being addressed through additional training, audits and campaigns for Operators. Note:The 2018 target is based on a 40% or more reduction in delay incidents from the 2014 monthly average baseline.
Line 2: Delay Incidents
0
250
500
750
1,000
1,250
Jan Feb Mar Apr May Jun Jul Aug Sep Oct Nov Dec
Num
ber o
f Del
ay In
cide
nts
2018 Actual 2018 Target2017 Trend 2016 Trend2015 Trend 2014 Trend

30 Toronto Transit Commission | CEO’s Report | May 2018
ResultsThe number of delay minutes increased in March to 1597 minutes or 13.7% higher than February.
AnalysisPassenger related events contributed 65% of the overall minutes generated in March. 30% of these events are related to three singular events. One of the security incidents that impacted Line 1 for 195 minutes, also had the same impact on Line 2.
Action PlanCompared to February, March experienced an increase of smoke/fire events on Line 2. The spring season will allow for additional corridor maintenance including removal of debris that has collected over the winter months. Note:The 2018 target is based on a 40% or more reduction in delay minutes from the 2014 monthly average baseline.
Line 2: Delay Minutes
0
500
1,000
1,500
2,000
2,500
Jan Feb Mar Apr May Jun Jul Aug Sep Oct Nov Dec
Num
ber o
f Del
ay M
inut
es
2018 Actual 2018 Target2017 Trend 2016 Trend2015 Trend 2014 Trend

31Toronto Transit Commission | CEO’s Report | May 2018
ResultsThe peak capacity delivered on Line 2 decreased slightly to 95.3 in March from 96.5 in February. These results are still positive and are less than a point away from the target of 96.
AnalysisIncreased staffing during the peak post periods has aided in faster response to commonly occurring incidents such as emergency alarm activations for medicals or disruptive people. This has a positive impact on keeping trains moving with a consistent headway.
Action PlanMorning and afternoon peak periods will continue to have additional resources to minimize disruption and enhance safety on both lines.
Note:Capacity delivered is the actual train count divided by the scheduled train count for each hour at sampled locations. Data are based on weekday service from Monday to Friday.
Line 2: Capacity Delivered In Peak
80
84
88
92
96
100
Jan Feb Mar Apr May Jun Jul Aug Sep Oct Nov Dec
Cap
acity
Del
iver
ed (%
)
2018 Actual 2018 Target2017 Trend 2016 Trend2015 Trend

32 Toronto Transit Commission | CEO’s Report | May 2018
ResultsLine 3 delay incidents experienced a drop of 55.3%, to 43 in March from 92 in February. This improvement trend is almost at the target of 43, an achievement that hasn’t occurred since October 2017.
AnalysisThe Scarborough Line is significantly impacted by weather, and the reduction in extreme temperatures and precipitation resulted in a 95.7% drop in weather related delays. There were minimal door delays or timeouts.
Line 3: Delay Incidents Action PlanThe Rail Vehicle team continues to refurbish and improve the reliability of this aging fleet. More precise adjustments to the vehicles during specific weather, in both the winter and summer months will ensure performance continues to improve.
Note:The 2018 target is based on a 40% or more reduction in delay incidents from the 2014 monthly average baseline.
0
30
60
90
120
150
Jan Feb Mar Apr May Jun Jul Aug Sep Oct Nov Dec
Num
ber o
f Del
ay In
cide
nts
2018 Actual 2018 Target2017 Trend 2016 Trend2015 Trend 2014 Trend

33Toronto Transit Commission | CEO’s Report | May 2018
ResultsThe delay minutes on Line 3 decreased along with the number of incidents, to 301 from 563, a reduction of 46.5%.
AnalysisThe improvement in weather as well as the elimination of smoke/fire events on the line this month aided in the reduction of minutes. The target of 231 minutes would have been achieved had there not been two subway infrastructure problems that jointly caused 108 minutes in delays.
Action Plan Subway Infrastructure had the first Line 3 construction closure of the year in March and has two more scheduled in 2018 for required maintenance. In the meantime, on-going preventative maintenance, including regular nightly planned work will aid in reducing delay minutes like those experienced this month.
Note:The 2018 target is based on a 40% or more reduction in delay minutes from the 2014 monthly average baseline.
Line 3: Delay Minutes
0
300
600
900
1,200
1,500
Jan Feb Mar Apr May Jun Jul Aug Sep Oct Nov Dec
Num
ber o
f Del
ay M
inut
es
2018 Actual 2018 Target2017 Trend 2016 Trend2015 Trend 2014 Trend

34 Toronto Transit Commission | CEO’s Report | May 2018
ResultsThe peak capacity delivered on Line 3 in the morning and afternoon peak service was on par with the previous month and just shy of the 98% target.
AnalysisAn incident related to subway infrastructure occurred that impacted morning service for 70 minutes. This one significant delay accounts for the reason the target was missed.
Line 3: Capacity Delivered In Peak Action PlanContinued preventative maintenance of the trains and infrastructure as well as improving weather conditions will help meet the target in the coming months.
Note:Capacity delivered is the actual train count divided by the scheduled train count for each hour at sampled locations. Data are based on weekday service from Monday to Friday.
80
84
88
92
96
100
Jan Feb Mar Apr May Jun Jul Aug Sep Oct Nov Dec
Cap
acity
Del
iver
ed (%
)
2018 Actual 2018 Target2017 Trend 2016 Trend2015 Trend

35Toronto Transit Commission | CEO’s Report | May 2018
ResultsThe number of delay incidents experienced on Line 4 remains low, with 1.6 per day, or 50 for the month. This is an increase from February.
AnalysisThe only notable difference on Line 4 this month is related to speed control issues, which increased to 21 in March from nine in February. Eight of these incidents are related to equipment on the trains, but all repairs have been made and improvements should be experienced in the coming months.
Action PlanRegular maintenance of the four-car units on Line 4 is contributing to keeping incidents to levels within the threshold. Additional customer staffing can be allocated to this line and this may address customer issues before they become an incident.
Note:The 2018 target is based on a 40% or more reduction in delay incidents from the 2014 monthly average baseline.
Line 4: Delay Incidents
0
30
60
90
120
150
Jan Feb Mar Apr May Jun Jul Aug Sep Oct Nov Dec
Num
ber o
f Del
ay In
cide
nts
2018 Actual 2018 Target2017 Trend 2016 Trend2015 Trend 2014 Trend

36 Toronto Transit Commission | CEO’s Report | May 2018
ResultsThe number of delay minutes increased in March to 151. This was an increase of 19.8% compared to February.
AnalysisThere was a 263% increase in passenger delays on Line 4. This increase is solely related to a suspicious package that was reported and resulted in a 93 minute delay while the police investigated and cleared the scene.
Action Plan With the exception of the single, anomalous incident, delay minutes on Line 4 would have achieved target in this period. Continued high levels of reliability with infrastructure and rolling stock will result in achievement of target in coming months.
Note:The 2018 target is based on a 40% or more reduction in delay minutes from the 2014 monthly average baseline.
Line 4: Delay Minutes
0
100
200
300
400
500
Jan Feb Mar Apr May Jun Jul Aug Sep Oct Nov Dec
Num
ber o
f Del
ay M
inut
es
2018 Actual 2018 Target2017 Trend 2016 Trend2015 Trend 2014 Trend
37Toronto Transit Commission | CEO’s Report | May 2018
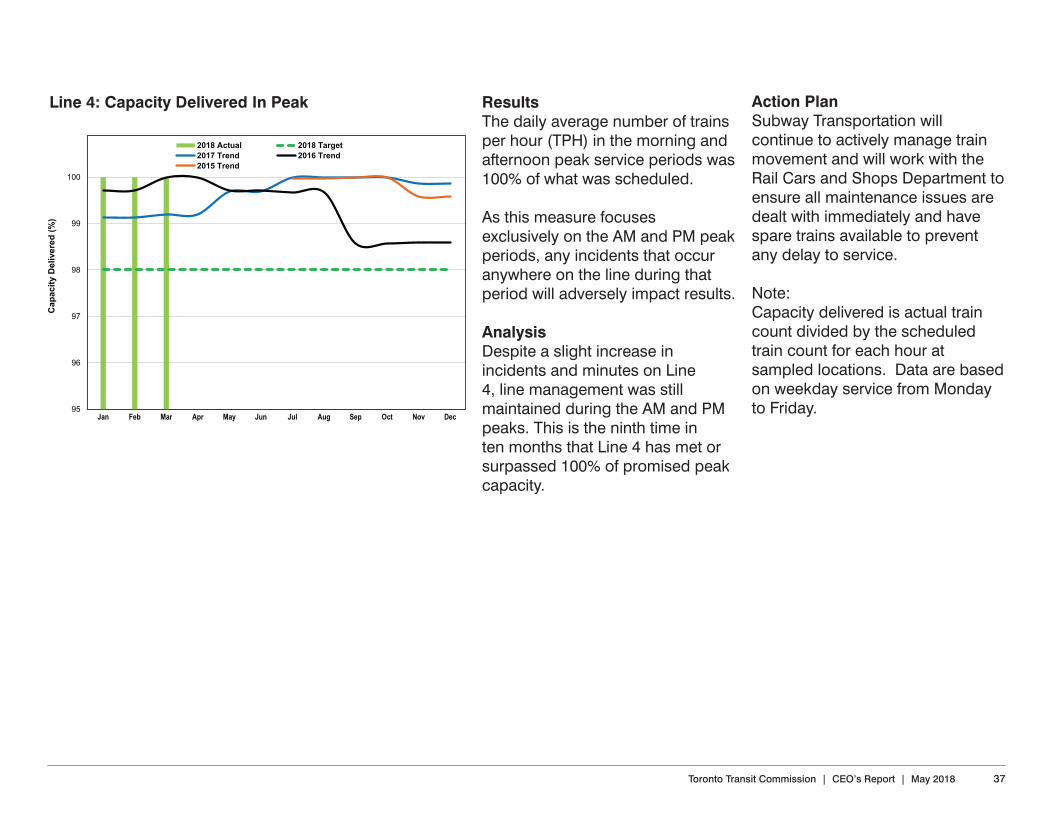
ResultsThe daily average number of trains per hour (TPH) in the morning and afternoon peak service periods was 100% of what was scheduled. As this measure focuses exclusively on the AM and PM peak periods, any incidents that occur anywhere on the line during that period will adversely impact results.
AnalysisDespite a slight increase in incidents and minutes on Line 4, line management was still maintained during the AM and PM peaks. This is the ninth time in ten months that Line 4 has met or surpassed 100% of promised peak capacity.
Line 4: Capacity Delivered In Peak Action PlanSubway Transportation will continue to actively manage train movement and will work with the Rail Cars and Shops Department to ensure all maintenance issues are dealt with immediately and have spare trains available to prevent any delay to service.
Note:Capacity delivered is actual train count divided by the scheduled train count for each hour at sampled locations. Data are based on weekday service from Monday to Friday.95
96
97
98
99
100
Jan Feb Mar Apr May Jun Jul Aug Sep Oct Nov Dec
Cap
acity
Del
iver
ed (%
)
2018 Actual 2018 Target2017 Trend 2016 Trend2015 Trend

38 Toronto Transit Commission | CEO’s Report | May 2018
25
40
55
70
85
100
Jan Feb Mar Apr May Jun Jul Aug Sep Oct Nov Dec
On-
Tim
e D
epar
ture
s (%
)
2018 Actual 2018 Target2017 Actual 2016 Actual2015 Actual
ResultsOn-Time Performance (OTP) was higher than last month, but well below that for the same period last year.
AnalysisThe current period has remained below 2016 and 2017 OTP achievements due to the aging legacy fleet, which is now more susceptible to colder climates and further reductions in the spare ratio. The TTC is still experiencing a slightly slower average speed of the new streetcar fleet, partially due to operators becoming accustomed to the new vehicles, as the new accessible streetcars are deployed on more routes. A total of 56 new vehicles operated during this period, increasing the capacity on 504 and 512 routes.
Action Plan A work plan was developed, recommending schedule changes to numerous routes. In particular, routes with new accessible streetcars will be updated to reflect the operational requirements of the new vehicles. The work plan is in place and results are projected to improve by the September Service Board Period. It is expected that On-Time Departures will remain unfavourable to target and, trend “mixed” until that time.
Note:This KPI measures adherence to scheduled (59 seconds early to five minutes late) departure times from end terminals.
On-Time PerformanceStreetcar

39Toronto Transit Commission | CEO’s Report | May 2018
ResultsShort turns for the period decreased (favourable) compared to last period and close to the same period last year.
AnalysisShort turns are maintaining target levels for March. This period continued to experience challenges with events related to weather and downtown core traffic congestion due to the Gardiner Expressway overflow. These issues negatively impacted our route performance.
Action PlanWith streetcar peak vehicle service now at 150, from 160, and the ongoing focus on our September 2018 work plan to improve OTP, short turn figures will remain below our target.
Note:Data is based on all seven days of service from Sunday to Saturday.
Streetcar - Short Turns
0
3,000
6,000
9,000
12,000
15,000
Jan Feb Mar Apr May Jun Jul Aug Sep Oct Nov Dec
Num
ber o
f Sho
rt T
urns
2018 Actual 2018 Target2017 Actual 2016 Actual2015 Actual 2014 Actual
40 Toronto Transit Commission | CEO’s Report | May 2018
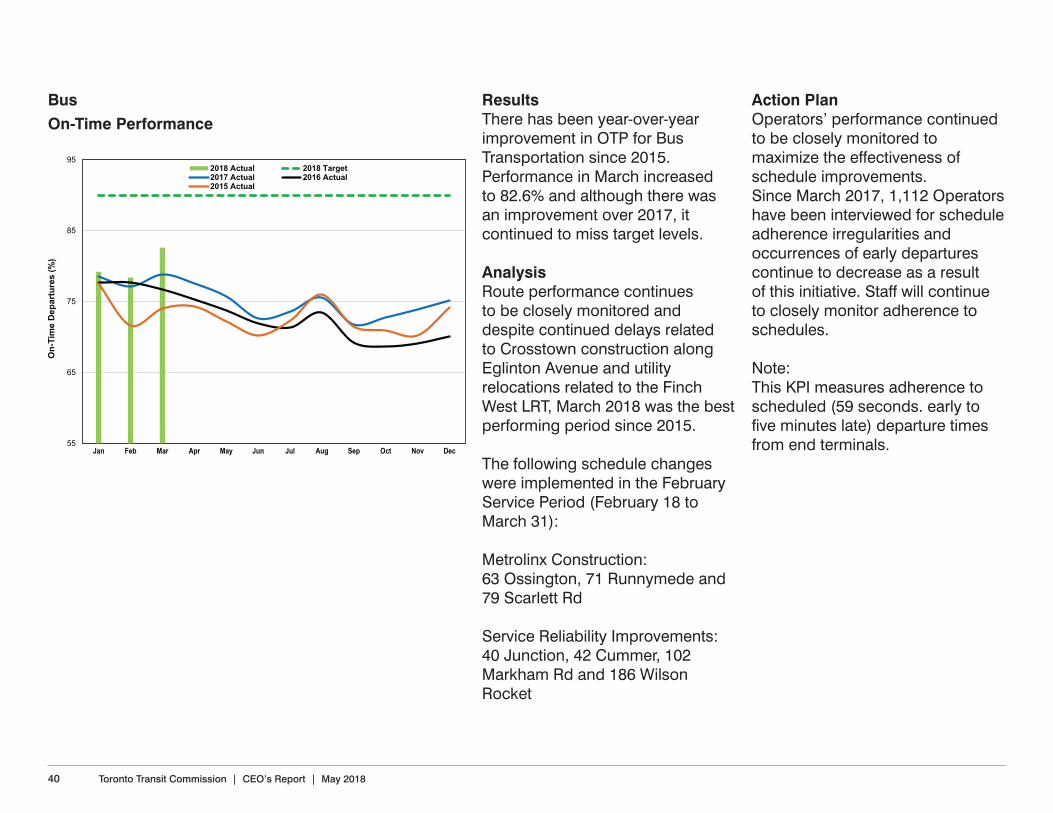
ResultsThere has been year-over-year improvement in OTP for Bus Transportation since 2015. Performance in March increased to 82.6% and although there was an improvement over 2017, it continued to miss target levels.
AnalysisRoute performance continues to be closely monitored and despite continued delays related to Crosstown construction along Eglinton Avenue and utility relocations related to the Finch West LRT, March 2018 was the best performing period since 2015.
The following schedule changes were implemented in the February Service Period (February 18 to March 31):
Metrolinx Construction:63 Ossington, 71 Runnymede and 79 Scarlett Rd
Service Reliability Improvements:40 Junction, 42 Cummer, 102 Markham Rd and 186 Wilson Rocket
Action Plan Operators’ performance continued to be closely monitored to maximize the effectiveness of schedule improvements. Since March 2017, 1,112 Operators have been interviewed for schedule adherence irregularities and occurrences of early departures continue to decrease as a result of this initiative. Staff will continue to closely monitor adherence to schedules.
Note:This KPI measures adherence to scheduled (59 seconds. early to five minutes late) departure times from end terminals.
On-Time PerformanceBus
55
65
75
85
95
Jan Feb Mar Apr May Jun Jul Aug Sep Oct Nov Dec
On-
Tim
e D
epar
ture
s (%
)
2018 Actual 2018 Target2017 Actual 2016 Actual2015 Actual

41Toronto Transit Commission | CEO’s Report | May 2018
ResultsThis multi-year view illustrates continuous reductions in the number of short turns from 2014 to today, resulting in a greatly improved customer experience.
AnalysisPerformance in March remained well below the threshold (favourable). The number of short turns in March decreased to 1,221 as compared to 1,717 in the same period last year. Six routes (60 Steeles West, 34 Eglinton East, 52 Lawrence West, 75 Sherbourne, 89 Weston and 63 Ossington) were responsible for 50% of short turns in Bus Transportation.
Bus - Short Turns Action PlanFocused attention on high incident routes, schedule improvements and increased utilization of run-as-directed (RAD) bus deployments has reduced the need for service adjustments.
Note:Data is based on all seven days of service from Sunday to Saturday.
0
2,500
5,000
7,500
10,000
12,500
Jan Feb Mar Apr May Jun Jul Aug Sep Oct Nov Dec
Num
ber o
f Sho
rt T
urns
2018 Actual 2018 Target2017 Actual 2016 Actual2015 Actual 2014 Actual

42 Toronto Transit Commission | CEO’s Report | May 2018
ResultsOn-Time Performance (OTP) in March increased by 0.8% to 85.1% from February. This represents a 6.7% decline from the same period in 2017.
AnalysisThis KPI was improving. However, computer system delays in processing service adjustments during peak travel periods contributed to the OTP results that were forecast to be slightly higher for March.
Action PlanOn March 10, 2018, a scheduling system upgrade was implemented to improve Passengers Per Hour (PPH) levels on Wheel-Trans buses. Wheel-Trans expects that this upgrade, along with increased monitoring by supervisory staff will improve bus productivity, shared riding, move shorter trips to Wheel-Trans buses, and allow for same-day bookings to accommodate Family of Service trips. As mentioned in the previous CEO’s Report, this KPI is stricter compared to other paratransit operations and will be reviewed following consultation with the Advisory Committee on Accessible Transit (ACAT).
On-Time PerformanceWheel-Trans
80
83
86
89
92
95
Jan Feb Mar Apr May Jun Jul Aug Sep Oct Nov Dec
With
in 1
0 M
inut
es o
f Sch
edul
e (%
)
2018 Actual 2018 Target2017 Actual 2016 Actual2015 Actual 2014 Actual

43Toronto Transit Commission | CEO’s Report | May 2018
15,000
17,000
19,000
21,000
23,000
25,000
Num
ber o
f Veh
icle
Hou
rs O
pera
ted
Board Period
Actual Scheduled Budget
Customer: Amount of serviceResultsIn the February 2018 Service Period, 18,737 streetcar weekly hours were budgeted for service while 16,914 streetcar weekly hours were scheduled to operate which represents a variance of -9.73%.
This is a result of the streetcar fleet shortage. Streetcars have been removed from 505 Dundas and 506 Carlton routes and replaced with bus service.
Of the 16,914 streetcar weekly hours scheduled to operate,
16,949 streetcar weekly hours were actually delivered which represents a variance of 0.21%.
AnalysisThis is a result of the streetcar fleet shortage. Streetcars have been removed from 505 Dundas and 506 Carlton routes and replaced with bus service.
Action PlanStaff continue to monitor the Bombardier delivery schedule. Bombardier met its Q1 target for 2018.
Streetcar - Weekly Service Hours
Date Budgeted Streetcars for AM Peak Service
Scheduled Streetcars for AM Peak Service
June 2016 170 167
October 2016 202 179
January 2017 189 169
April 2017 190 170
July 2017 200 156
November 2017 200 166

44 Toronto Transit Commission | CEO’s Report | May 2018
130,000
135,000
140,000
145,000
150,000
155,000
Num
ber o
f Veh
icle
Hou
rs O
pera
ted
Board Period
Actual Scheduled Budget
ResultsIn the February 2018 Service Period, 145,817 bus weekly hours were budgeted for service while 148,250 bus weekly hours were scheduled to operate which represents a 1.67% variance.
Of the 148,250 bus weekly hours scheduled to operate, 143,213 weekly hours were actually delivered which represents a variance of -3.4%.
Bus - Weekly Service Hours AnalysisThis is a result of the streetcar fleet shortage. Buses are replacing streetcars on 505 Dundas and 506 Carlton.
Action PlanStaff continue to monitor the Bombardier delivery schedule. As more new streetcars are delivered, it is anticipated that buses will be removed from streetcar routes.

45Toronto Transit Commission | CEO’s Report | May 2018
7,000
8,000
9,000
10,000
11,000
12,000
Num
ber o
f Veh
icle
Hou
rs O
pera
ted
Board Period
Actual Scheduled Budget
ResultsIn the February 2018 Service Period, 10,800 subway weekly hours were budgeted for service while 10,777 subway weekly hours were scheduled to operate which represents a -0.21% variance. Of the 10,777 subway weekly hours scheduled to operate, 10,878 weekly hours were actually delivered which represents a variance of 0.94%.
Subway - Weekly Service Hours AnalysisThe scheduled and delivered subway weekly hours for February remain on budget.
Action PlanMaintain current strategy

46 Toronto Transit Commission | CEO’s Report | May 2018
ResultsOperator crewing efficiency decreased in May to 86.87%; performance remained below target.
AnalysisCrewing efficiency has been below target due to the large number of buses replacing streetcars, resulting in longer driving distances to streetcar routes from bus divisions. Also contributing to the drop in efficiency is the closure of Roncesvalles Division for track replacement. This required longer travel times for streetcars to reach their designated routes.
Operator Crewing Efficiency
86.7
86.9
87.1
87.3
87.5
87.7
Jan Feb Mar Apr May Jun Jul Aug Sep Oct Nov Dec
Cre
win
g Ef
ficie
ncy
(%)
2018 Actual 2018 Target2017 Trend 2016 Trend2015 Trend 2014 Trend
Action PlanStaff will review the process for dispatching buses. Efforts will focus on dispatching buses from divisions that are closer to streetcar routes that are being served. It’s anticipated that efficiencies will not reach targets until additional accessible streetcars are delivered by Bombardier. Note:Crewing efficiency is defined as the ratio of scheduled hours to pay hours.

47Toronto Transit Commission | CEO’s Report | May 2018
PeopleResultsThe absenteeism rate in March 2018 decreased to 6.65%.
AnalysisThe absenteeism rate for March dropped .77% from the 12 month average, from 7.42% to 6.65%; almost a full percentage point from the actual rate in February. Although the ongoing trend is unfavourable, efforts are in place to reduce these levels further. Action PlanStaff continues to manage absence with a focus on reducing the number of complex absence cases and the duration of these
Employee Absence absences. Through data anlytics, focus will be placed on determining the root cause of absence and the increasing absence rate for the TTC. Opportunities to continue efforts in management of absences will be sought through ongoing collective bargaining, and staff is monitoring the anticipated impacts of Bill 148 on the organization’s attendance levels. At the Group Level, in the Service Delivery Group, an attendance management project team was established in 2017 to focus on employees with concerning absence levels.
5
6
7
8
9
10
12014
2 3 4 5 6 7 8 9 101112 12015
2 3 4 5 6 7 8 9 101112 12016
2 3 4 5 6 7 8 9 101112 12017
2 3 4 5 6 7 8 9 101112 12018
2 3 4 5 6 7 8 9 101112
Abse
ntee
ism
Rat
e (%
)
Actual 12-Month Average

48 Toronto Transit Commission | CEO’s Report | May 2018
Random Testing Summary – Unionized Employees
Test Category 2018 2017 Total* %
Compliant tests 573 1381 1954 98.1%
Non-Compliant (drug, alcohol, refusal) 9 29 38 1.9%
Total 582 1410 1992 100%
Random Testing Summary – Staff (non-unionized) Employees
Test Category 2018 2017 Total* %
Compliant 119 270 389 99.2%
Non-Compliant (drug, alcohol, refusal) 0 3 3 0.8%
Total 119 273 392 100%
Fitness For Duty Update
Total number of employees who were non-compliant or refused to test under the random program:Data are from May 8, 2017 to April 13, 2018.
* Currently 32 drug results have yet to be reported as they are still at the lab undergoing analysis or have been cancelled.
* Currently 4 drug results have yet to be reported and are either at the lab undergoing analysis or have been cancelled.

49Toronto Transit Commission | CEO’s Report | May 2018
Fitness For Duty Update
Total number of employees who were non-compliant or refused to test under the random program:Data are from May 8, 2017 to April 13, 2018.
Non-Compliance by Substance
Substance Type 2018 2017 Total Percentage
Oxycodone 0 1 1 2.4%
Opiates 0 2 2 4.9%
Marijuana 6 15 21 51.2%
Cocaine 4 6 10 24.4%
Amphetamines 0 1 1 2.4%
Alcohol 1 5 6 14.6%
Total* 11 30 41 100.0%
This chart is updated quarterly. This information is up to date as of April 13, 2018. Next update will be July, 2018. * 3 Drug results have came back positive for two substances
Non-Compliance Breakdown
Category 2018 2017
Drug Non-compliant results 8 24
Alcohol non-compliant results 1 5
Refusals 0 3
Total 41 9 32
Other Policy Violations
Alcohol non-compliant for 0.02 - 0.039 2
3 safety sensitive flags 3
50 Toronto Transit Commission | CEO’s Report | May 2018
Assets
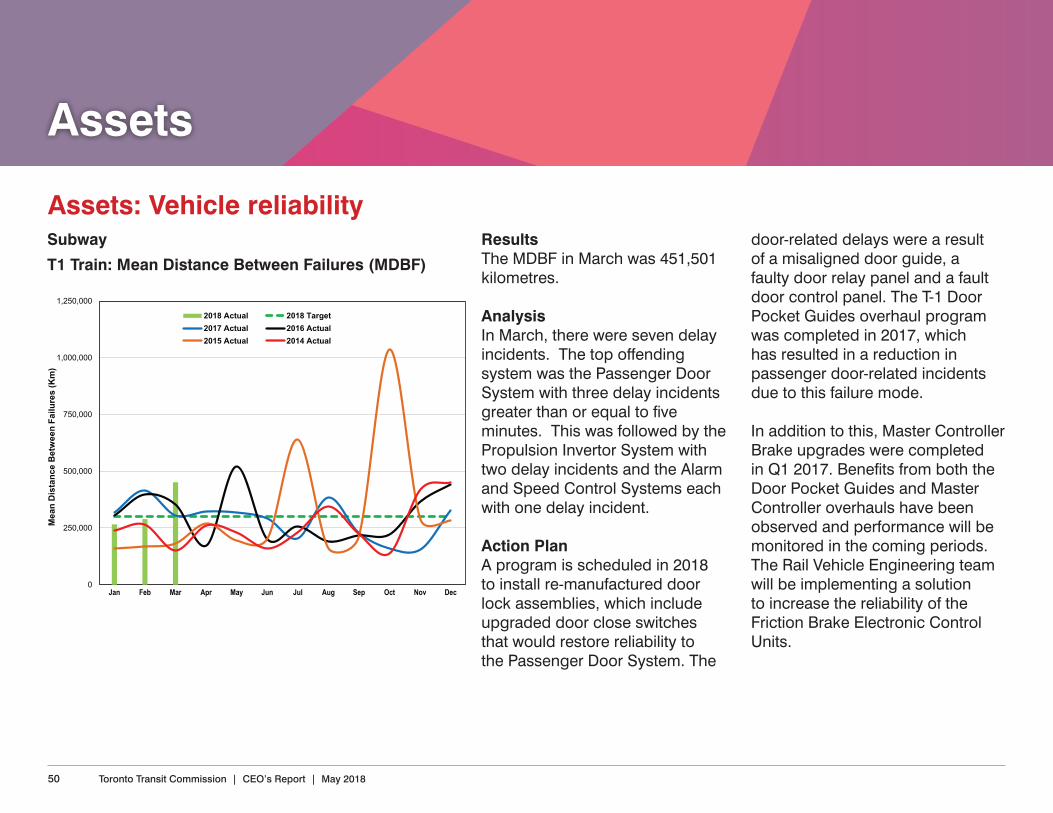
ResultsThe MDBF in March was 451,501 kilometres.
AnalysisIn March, there were seven delay incidents. The top offending system was the Passenger Door System with three delay incidents greater than or equal to five minutes. This was followed by the Propulsion Invertor System with two delay incidents and the Alarm and Speed Control Systems each with one delay incident.
Action PlanA program is scheduled in 2018 to install re-manufactured door lock assemblies, which include upgraded door close switches that would restore reliability to the Passenger Door System. The
door-related delays were a result of a misaligned door guide, a faulty door relay panel and a fault door control panel. The T-1 Door Pocket Guides overhaul program was completed in 2017, which has resulted in a reduction in passenger door-related incidents due to this failure mode.
In addition to this, Master Controller Brake upgrades were completed in Q1 2017. Benefits from both the Door Pocket Guides and Master Controller overhauls have been observed and performance will be monitored in the coming periods. The Rail Vehicle Engineering team will be implementing a solution to increase the reliability of the Friction Brake Electronic Control Units.
SubwayT1 Train: Mean Distance Between Failures (MDBF)
Assets: Vehicle reliability
0
250,000
500,000
750,000
1,000,000
1,250,000
Jan Feb Mar Apr May Jun Jul Aug Sep Oct Nov Dec
Mea
n D
ista
nce
Bet
wee
n Fa
ilure
s (K
m)
2018 Actual 2018 Target2017 Actual 2016 Actual2015 Actual 2014 Actual

51Toronto Transit Commission | CEO’s Report | May 2018
ResultsThe MDBF in March is 407,535 kilometres.
AnalysisIn March there were 12 delay incidents. The top offending system was the Passenger Door System with seven delay incidents each greater than or equal to five minutes. This was followed by the Brakes and Body Systems with two delay incidents each. The traction motor system experienced one delay incident.
Action PlanThe passenger door related incidents were a result of two malfunctioning door locking mechanisms, two malfunctioning door closure units (DCU), a close switch, door guide and a malfunctioning door electronic closure unit (DECU). Monitoring and corrective actions for these failure modes are in process.
The two Brake related incidents were a result of a faulty valves. Monitoring and corrective actions for these failure modes are in progress.
In addition, the Passenger Door System has received numerous modifications to the control units; fleet retrofits of the new modifications are in progress. The Carhouse and RAMS (Reliability, Availability, Maintainability, Safety) technical staff are closely monitoring door failures while the Equipment Control Desk and Transit Control are working towards ensuring that the incident recovery times are returned to average levels (below the five-minute threshold).
The brake system continues to receive numerous modifications/improvements to the electronic controls; fleet retrofits of the new modifications and validation testing of the proposed upgrades are in progress, with anticipated improvements in future periods.
TR Train: Mean Distance Between Failures (MDBF)
0
500,000
1,000,000
1,500,000
2,000,000
2,500,000
Jan Feb Mar Apr May Jun Jul Aug Sep Oct Nov Dec
Mea
n D
ista
nce
Bet
wee
n Fa
ilure
s (K
m)
2018 Actual 2018 Target2017 Actual 2016 Actual2015 Actual 2014 Actual

52 Toronto Transit Commission | CEO’s Report | May 2018
0
2,000
4,000
6,000
8,000
10,000
Jan Feb Mar Apr May Jun Jul Aug Sep Oct Nov Dec
Mea
n D
ista
nce
Bet
wee
n Fa
ilure
s (K
m)
2018 Actual 2018 Target2017 Actual 2016 Actual2015 Actual 2014 Actual
ResultsThe Mean Distance Between Failure (MBDF) for March was 5,638 kilometres. This is an increase of 1,527 kilometres from March 2017. The period-to-period comparison from February 2018 to March 2018 also increased by 2,878 kilometres.
The year-over-year and the period-to-period trend is positive, however the MDBF still remains below the target of 6,000 kilometres.
AnalysisImproving weather conditions and continued focus on maintenance activities (State of Good Repair Programs and accelerated decommissioning of poor performing vehicles) contributed to the improved reliability results in March.
Action PlanStaff will continue with existing maintenance and fleet management plans that include the SOGR programs and decommissioning of vehicles. As of April 2018, 68 of the original 196 CLRV have been decommissioned from service.
StreetcarCLRV Streetcar: Mean Distance Between Failures (MDBF)

53Toronto Transit Commission | CEO’s Report | May 2018
ResultsThe Mean Distance Between Failure (MBDF) of the ALRV Fleet for March was 2,357 kilometres. This is an increase of 53 kilometres when compared to March 2017.
The period-to-period comparison also resulted in a favourable trend with an increase of 1,083 kilometres from February 2018. The ALRV fleet, however, continues to have an overall reliability below the target of 6,000 kilometres.
AnalysisThe increase in MDBF in March can be attributed to improved weather conditions and similar maintenance initiatives that are being applied to the CLRV Fleet.
Action PlanStaff will continue with existing maintenance plans and initiatives that include the SOGR programs and decommissioning of vehicles.
ALRV Streetcar: Mean Distance Between Failures (MDBF)
0
1,500
3,000
4,500
6,000
7,500
Jan Feb Mar Apr May Jun Jul Aug Sep Oct Nov Dec
Mea
n D
ista
nce
Bet
wee
n Fa
ilure
s (K
m)
2018 Actual 2018 Target2017 Actual 2016 Actual2015 Actual 2014 Actual

54 Toronto Transit Commission | CEO’s Report | May 2018
ResultsThe Mean Distance Between Failure (MBDF) for the LFLRV Fleet in March was 14,777 kilometres. This is an increase when compared to March 2017, but is a decrease when compared to the previous month of February 2018. Although the overall MDBF remains below the 35,000kilometres target, the 12-month moving annual trend continues to be positive.
AnalysisThe number of door related failures increased in March which caused the reliability to decrease.
Action PlanStaff continue to work with Bombardier and its suppliers to resolve technical and design issues on the vehicles.
LFLRV Streetcar: Mean Distance Between Failures (MDBF)
0
10,000
20,000
30,000
40,000
Jan Feb Mar Apr May Jun Jul Aug Sep Oct Nov Dec
Mea
n D
ista
nce
Bet
wee
n Fa
ilure
s (K
m)
2018 Actual 2018 Target2017 Actual 2016 Actual

55Toronto Transit Commission | CEO’s Report | May 2018
ResultThe target for the maximum number of Road Calls and Change Offs (RCCOs) is 1.5% of peak daily service. In March, the peak daily service was 150 streetcars. The
Streetcar: Road Calls & Change Offs (RCCO’s)
0
10
20
30
40
50
60
Jan
Feb
Mar Apr
May Jun
July
Aug
Sep
t
Oct
Nov
Dec
CH
AN
GE
OFF
-A
M /
PM
2015 2016 2017 2018 average number of RCCOs was 8.8 vehicles per day which equated to 5.9% of peak daily service. While the percentage of RCCO in March did not meet the target, there was an improvement from February 2018 when the average number of RCCO per day was 14.6 vehicles.
AnalysisThe decrease in streetcar change offs in March was a result of improving weather conditions and various maintenance and fleet management initiatives. These include the State of Good Repair maintenance programs, the continued decommissioning of worst performers in the ALRV and CLRV fleets, and the addition of new accessible streetcars. Action PlanStaff will continue with existing maintenance and fleet management plans to improve overall fleet reliability. In turn, this will help reduce the number of RCCO that impact customer travels.

56 Toronto Transit Commission | CEO’s Report | May 2018
ResultsThe March 2018 Mean Distance Between Failure (MDBF) of 20,000 kilometres has exceeded the target of 12,000 kilometres and is well above the March 2017 average of 16,107 kilometres.
AnalysisBus Maintenance received 342 new Nova buses in 2017 and 40 new Nova buses in Q1-2018 which has contributed to the consistent increase in MDBF. Efforts to reduce repeater Road Call Change-Off’s (RCCO) contribute to the increase in MDBF. A favourable MDBF score is expected to remain throughout 2018.
Action PlanOngoing Scheduled Maintenance Programs:• Cooling System - Nova
articulated buses at Wilson Garage to address high failure with coolant leaks.
• Heating Systems – Orion VII 1274CD at Queensway Garage to correct high level of no heat conditions.
• State of Good Repair – Ongoing at all locations.
• Roof Repair – All Orion VII buses to address water egress caused by environmental/sun damage to roof and antenna seals.
• Spring Checks – From March to May on all buses to prepare the air conditioning systems for warmer weather.
Bus: Mean Distance Between Failures (MDBF)
0
5,000
10,000
15,000
20,000
Jan Feb Mar Apr May Jun Jul Aug Sep Oct Nov Dec
Mea
n D
ista
nce
Bet
wee
n Fa
ilure
s (K
m)
2018 Actual 2018 Target2017 Trend 2016 Trend2015 Trend 2014 TrendCapped Distance

57Toronto Transit Commission | CEO’s Report | May 2018
ResultThe average number of change offs in March 2018 was 25.3 per day. This is a decrease from February 2018 where the average number of change offs per day was 33.6 per day. Incremental improvement can be seen over the period 2014 to 2018, resulting in a higher level of equipment availability.
AnalysisWith peak revenue service at 1,600 buses per day, including Run As Directed (RAD) buses in March 2018, the average number of change offs per day equates to 1.58% of service. The decrease in bus change offs in March 2018 is a result of improved reliability and the addition of new Nova buses entering revenue service. Action PlanVehicle change offs are directly related to the overall fleet reliability. Maintenance initiatives, decommissioning of the Orion VII 7400-7882 bus fleet and receipt of new Nova buses to improve vehicle reliability is supporting a reduction in the number of change offs.
Bus: Road Calls and Change Offs (RCCO’s)
0
20
40
60
80
100
120
140
160
180
200
Jan
Feb
Mar Apr
May Jun
July
Aug
Sep
t
Oct
Nov
Dec
Cha
nge
Off
AM/P
M
Target of 1 1/2% of in-service buses - 1560
Target 2014 2015 2016 2017 2018

58 Toronto Transit Commission | CEO’s Report | May 2018
ResultsThe March 2018 Mean Distance Between Failure (MDBF) of 12,678 kilometers is marginally above target but slightly below March 2017 performance. Above-target MDBF is expected throughout 2018.
Analysis20 new RAM ProMaster buses were in service as of the end of March 2018. Drive-line failures contribute to 20% of chargeable road calls for the Friendly bus fleet, review is ongoing. Ramp handles and engine problems continue to influence MDBF negatively.
Action PlanNewly engineered ramp handles are expected in April. Diesel particulate filter replacements continue to help reduce the number of emission failures. Spring checks will be completed between March and May to prepare the air conditioning systems for warmer weather. Improved planning of differential overhaul has been initiated to reduce vehicle out-of-service time. The remaining 60 ProMaster buses are scheduled to start arriving in April and delivery is expected to be completed by the end of the year.
Wheel-Trans: Mean Distance Between Failures (MDBF)
2,000
5,000
8,000
11,000
14,000
17,000
Jan Feb Mar Apr May Jun Jul Aug Sep Oct Nov Dec
Mea
n D
ista
nce
Bet
wee
n Fa
ilure
s (K
m)
2018 Actual 2018 Target2017 Actual 2016 Actual2015 Actual 2014 Actual

59Toronto Transit Commission | CEO’s Report | May 2018
Assets: Equipment availabilityResultsPerformance was improved in March and achieved the target.
AnalysisElevator maintenance was completed as planned and scheduled. During the month of March, Elevating Device Services (EDS) has seen a decrease is overall system related emergency calls and a decrease in corrective maintenance downtime.
Action PlanContinue performing preventative maintenance to meet reliability and availability targets.
Elevators
95
96
97
98
99
100
Jan Feb Mar Apr May Jun Jul Aug Sep Oct Nov Dec
Avai
labi
lity
(%)
2018 Actual 2018 Target2017 Actual 2016 Actual2015 Actual 2014 Actual

60 Toronto Transit Commission | CEO’s Report | May 2018
ResultsThe availability level surpassed the target of 97% in March.
AnalysisMaintenance activities were completed as planned and scheduled.
Action PlanContinue performing preventative maintenance to meet reliability and availability targets.
Escalators
95
96
97
98
99
100
Jan Feb Mar Apr May Jun Jul Aug Sep Oct Nov Dec
Avai
labi
lity
(%)
2018 Actual 2018 Target2017 Actual 2016 Actual2015 Actual 2014 Actual
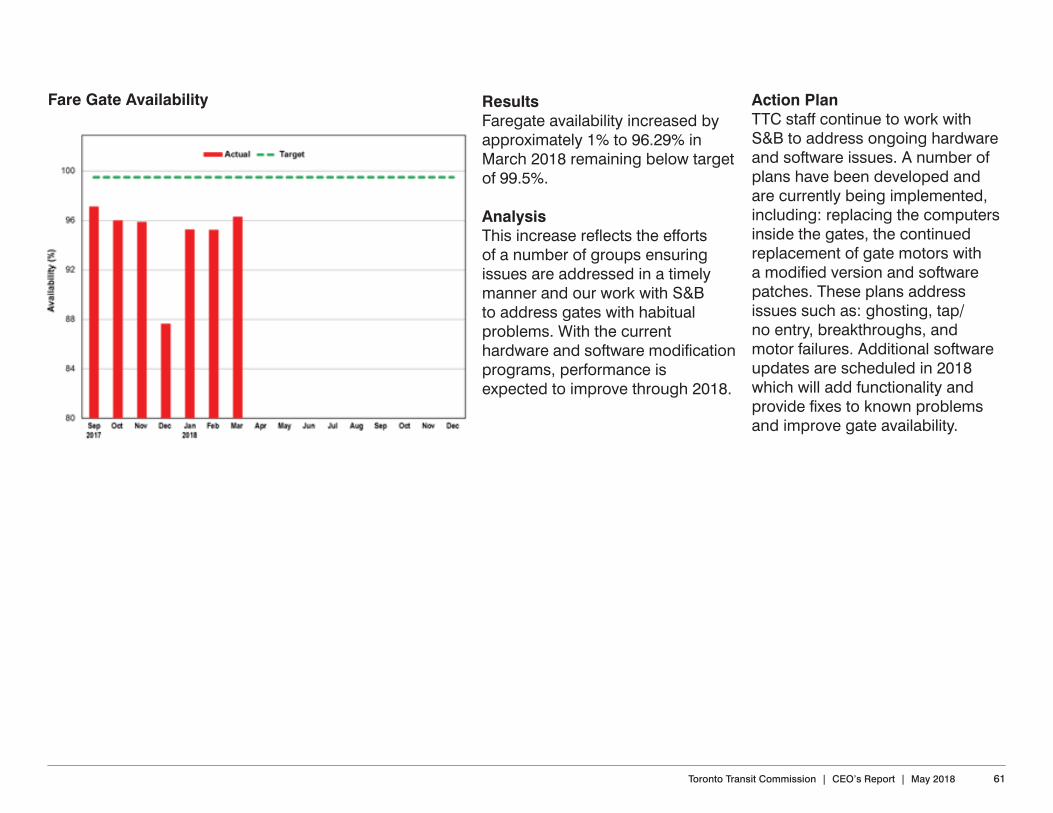
61Toronto Transit Commission | CEO’s Report | May 2018
Fare Gate Availability ResultsFaregate availability increased by approximately 1% to 96.29% in March 2018 remaining below target of 99.5%.
AnalysisThis increase reflects the efforts of a number of groups ensuring issues are addressed in a timely manner and our work with S&B to address gates with habitual problems. With the current hardware and software modification programs, performance is expected to improve through 2018.
Action PlanTTC staff continue to work with S&B to address ongoing hardware and software issues. A number of plans have been developed and are currently being implemented, including: replacing the computers inside the gates, the continued replacement of gate motors with a modified version and software patches. These plans address issues such as: ghosting, tap/no entry, breakthroughs, and motor failures. Additional software updates are scheduled in 2018 which will add functionality and provide fixes to known problems and improve gate availability.

62 Toronto Transit Commission | CEO’s Report | May 2018
For further information on TTC performance, projects and service, please see www.ttc.ca

63Toronto Transit Commission | CEO’s Report | May 2018

64 Toronto Transit Commission | CEO’s Report | May 2018