Report for 2018/2019 State of Photographic Education – A ......Thank you for taking the time to...
72
Report for 2018/2019 State of Photographic Education – A Joint Partnership of the Society for Photographic Education (SPE) and the American Society of Media Photographers (ASMP)
Transcript of Report for 2018/2019 State of Photographic Education – A ......Thank you for taking the time to...

Report for 2018/2019 State of Photographic Education – A Joint Partnership of the Society for Photographic Education (SPE) and the American Society of Media Photographers (ASMP)

The Society for Photographic Education is pleased to announce the availability of data collected from the 2018-2019 State of Photographic Education Survey.
With leadership provided from the Development Committee of the Society for Photographic Education (SPE), and through a joint partnership of SPE and the American Society of Media Photographers (ASMP), we are pleased to make available to our members and partners the findings of this important survey concerning the state of photographic education today.
By creating and distributing the survey, and sharing the data with you, we can all get a better understanding of the state of photographic education, and its current trends and needs. As an important benefit of SPE membership, our goal is to provide you with this data as an ongoing, valuable resource for the evaluation of your own educational program, and to help you effectively plan for—and meet the challenges of—the future.
As the leading forum for fostering understanding of photography in all its forms and related media, the publication of survey data is another example of how SPE engages its worldwide membership and affiliated communities through a range of supportive activities and platforms including conferences, events, and publications.
James Wyman, Executive Director Society for Photographic Education

American Society of Media Photographers (ASMP) is happy to join with The Society for Photographic Education (SPE) in announcing the results of a comprehensive survey looking at the State of Photographic Education based on data offered by respondents from both organizations.
Through our partnership with SPE’s Development Committee, we are pleased to make available the findings from the 2018-2019 State of Photographic Education Survey. In working with SPE, ASMP felt it essential to contribute to the effort so we could expand participation and share the knowledge gained from the effort as widely as possible.
We believe in the power of education and the work of educators to continue to shape the next generation of our community. It is essential that those who are teaching be able to see clearly what is wanted and needed by students, and also to have a clear view of the educational systems supporting student development. Producing the survey and sharing the data widely, enables us to provide benchmarks that can help guide the evolution of educational institutions, and teaching methods.
ASMP is proud to join SPE in having a passion for effective photographic education so the fruits of knowledge, wisdom, and inspiration can be shared to benefit our community as well as the larger world. We believe that photographers can literally change how people see the world and that photography can expand horizons and build connections between people. Having a strong, rich educational process available is vital for those aspiring to become photographers so they can benefit society in this way. We hope publication of the survey data sparks a useful exchange of information on how best to accomplish photographic education as we move into the next decade and beyond.
Thomas R. Kennedy, Executive Director American Society of Media Photographers

A Note from the Authors This survey, or ones very similar to it, have been conducted a couple of other times in the last 20 years. We have never gotten a greater response than we did this one. We want to thank the nearly 750 respondents of this survey. Thank you for taking the time to complete the survey and trusting us enough to share your information with us.
There is a lot of information and data contained within the results. Not all of it will be applicable to each of you. We hope that you find value within the data; information that you can use to measure how you, your students, and your program compare. We know of several situations in the past where instructors have used some of the information within these surveys to go to administrators to push for change. Perhaps it may help you identify ways you or your institution can improve photo education to better serve your students and community.
The results of this survey must be viewed in relationship to the population participating. In previous years this survey was written, produced, and intended for college level photography programs/instructors. This time around we strived to expand our reach and opened up the survey to photography instructors at all levels including more commercial programs, K-12, and workshop instructors. However, the results remain heavily skewed toward the fine art college photography level. We updated the survey from previous years to add and try to adapt questions to be more inclusive and applicable to these additional educators. In hindsight, we should have done more to do so. In future versions we plan on having representatives from these groups included in the writing of the survey.
We also want to thank the SPE and ASMP organizations and their leadership for their involvement in the survey. Specifically from SPE we would like to thank James Wyman, Claude Baillargeon, Therese Mulligan and Elizabeth Allen for their input. From ASMP we would like to thank Tom Kennedy and Luke Copping for their's as well. Thank you for your input and for seeing the importance and value in collecting this information. Also thank you for your passion and dedication to photography and the field of photo education.
We have both been life long photographers. For much of our professional careers we have also been active and heavily involved within photo education. It has been an honor to serve this community of dedicated artists and professionals. It has been incredibly wonderful getting to know a great many of you and being allowed to work with your students. Thank you!
Sincerely,
William (Bill) Gratton [email protected]
Joe Lavine [email protected]

Analysis and Summary of Survey Results
Within this survey’s results is a lot of data and information that may be culled. A previous version of this survey was last completed in 2012—with results released in 2013. Having this previous information allows us to identify trends and changes within the field. In the next few pages we will try to identify some of what we thought to be important and interesting trends and changes.
Respondents/Instructors: Females continue to be an expanding demographic within the field. This year women made up 46% of the respondents; up from 27% previously. The male representative went from 73% in 2012 to 52% of respondents in 2018.
It appears to be a more “experienced” or aging population as 41% of the respondents have been in education for more than 20 years.
The vast majority of respondents are professional educators with little to no experience outside of academia. 50% claimed to have fewer than 5 years experience outside of academia. Another 24% had fewer than 10 years.
61% of respondents have an MFA. This is up from 46% in the previous survey.
As one might suspect, fewer instructors subscribe to magazines/publications. Nonetheless, publications still appear a meaningful means of communication. 68% of respondents claim to subscribe to magazines/publications—down from 82%.
Programs & Institutions: Photo programs seem to be getting smaller. 46% of respondents indicated having fewer than 50 undergrads in their program, as opposed to 26% in 2012. The number of bigger programs has certainly shrunk. In 2012, 27% of the respondents indicated that their program had 101-250 students. This is down to 17% in 2018. A similar decline exists in programs with between 500 and 1000 undergrads.
In 2018, nearly 76% of respondents described their programs as being fine art. This is up from 62% in 2012. In 2018, only 39% described their program as being commercial, down from 57% in 2012.
Surprisingly, there does not appear to be any growth in online photographic classes. With 25% of respondents indicating that their program offers online photo classes in 2012, and 24% in 2018. Only 16% of the responding educators indicate that they teach online classes.

In the previous survey, results had indicated an increase on the reliance of adjunct faculty persons. This seems to have leveled-off or maybe even decreased slightly. In 2018, 57% of respondents indicated that their program had between 1 and 5 adjuncts teaching, compared to 55% previously; although it should be noted that adjuncts seem to teach many classes. 30% of adjuncts indicate that they teach 6 or more classes. Another 24% indicate that they teach 4-5 classes.
Photography programs have increased their online presence. 65% of respondents indicated that their departments have their own website or blog. This is up from 18% in 2012.
Enrollment Trends: In general, it appears that enrollments in photo programs are trending downward over the last 5 years. 46% of respondents indicate that they have seen a decline in enrollment of some sort, with 26% indicating a slight decrease, 16% a large decrease, and 3.5% indicating a decrease greater than 50%. However, the decrease seems to have slowed or plateaued. Approximately 44% of respondents indicated that in the last 12 months their enrollment has remained about the same. 33% report an increase, and 23% indicated a decrease.
Curriculum Trends: 50% of respondents indicated that their students receive any video/film production training as part of their required curriculum. Nearly the same number also provided video/ film editing classes. What has changed significantly are the editing tools used. In 2018, Adobe Premiere (87%) and Final Cut (27%) were the top programs taught. In 2012, Final Cut (67%) and iMovie (34%) were the most used editing programs.
31% of the respondents indicated they provide any audio training to their students.
Exhibition prints remain the predominant form of portfolios for graduating students. 84% indicated a printed portfolio was required or suggested. 49% indicated that a bound portfolio or book was required or recommended. 27% of respondents required students to have a website before graduating (virtually unchanged from 2012). Only 13% indicate requiring or recommending a portfolio on a mobile platform (phone or tablet).
Students are having to take few business or marketing classes. Approximately 60% of the respondents indicate that their students are not required to take any such classes. This is up from 46% in 2012. 23% indicate that the students had to take one such class.16% indicate that students had to take 2 or more. All of these numbers are down significantly from 2012.

Equipment and Technology: There has been little to no change in the balance of digital vs. analog technology; and there doesn’t seem to be any indication that this will change anytime soon. 75% of schools indicate that they use both analog and digital technology. 24% indicate that they are entirely digital. When asked where they expect the technology to be in 5 years, only 27% indicate that they expect to be all digital. When they were asked the same question in 2012, 36% indicated they expected to be all digital.
64% of respondents indicated that students are required to provide some equipment—with digital and film cameras and computers leading the way.
92% of respondents indicate that the school does check-out equipment for students to use.
78% indicate that their students still shoot film.
28% indicate that 100% (or nearly) of the students output is digital. 40% of respondents indicate that more than 75% of the students output is digital.
36% indicated that their school has invested in 3D printing technology. Another 5% indicated that they were planning on doing so this year.
Computers are being updated less frequently. In 2012, 56% of schools indicate that computers were upgraded every three years. This number fell to 40% in 2018 with many of those whom used to update from every 3 years to doing so every 5 years.
Industry Support/Involvement: 52% of the respondents indicate that their programs do not participate with any professional photographic organization. 35% indicated that they are involved with SPE. 13% indicate being involved with ASMP and 20% indicate being involved with other professional photography organizations.
22% indicate that they receive some level of sponsorship or support from any photographic industry manufacturers such as providing guest speakers, presentations, funding, or equipment loans. The top five companies indicated as providing support were: Canon (69%), Profoto (31%), Adobe (27%), PhaseOne (27%), and Nikon (25%).

Survey Biases: The results of this survey must be viewed in relationship to the population participating. Members of the Society for Photographic Education (SPE) made up 61% of the respondents. While many of these members of SPE are also members of other professional associations, the vast majority of their voices skew the results towards a more fine art-centric view of photographic education since that is among the major interest areas of SPE members.
By comparison, 16% of the respondents were members of ASMP and just under 10% of respondents were also members of other professional associations—American Photographic Artists, Professional Photographers of America, National Press Photographers, and Wedding and Portrait Photographers International.
None of the questions were required. Educators were able to respond only to those questions that were applicable to them or those areas with which they were familiar.
It should be noted that compared to years past, there are fewer commercially oriented programs. A great many of the private for-profit schools (such as Brooks, most of the Art Institutes of America, and others) have closed or gone out of business. Many of these schools were more commercially based programs. Also, only approximately 20% of the respondents were from the community college level. This is well below their actual percentage within post-secondary education. As such, the results will tend to under report technical and vocational curricula. It also must be assumed, that the loose definitions of what constitutes training for commercial photography may have biased some of the responses in areas concerning curricula.
Having defined these biases that we perceive in the survey, it must be said that the trends shown in this report are valid if skewed to a more senior collegiate and fine arts view of photographic education.

1. Your gender
Per
cent
Female Male Non-binary/thirdgender
Prefer to self-describe --Write in
Prefer not to say0
10
20
30
40
50
60

3. Your highest degree achieved?
Per
cent
Doctora
te
Master o
f Fine A
rts
Master o
f Scie
nce o
r Maste
r of A
rts
Master o
f Pro
fess
ional Stu
dy
Bachelor o
f Fine A
rts
Bachelor o
f Scie
nce o
r Bach
elor of A
rts
Associa
te D
egree
Certifica
te
No post-
seco
ndary degre
eOth
er0
20
40
60
80
Value Percent Responses
Doctorate 4.8% 31
Master of Fine Arts 60 .8% 396
Master of Science or Master of Arts 10 .4% 68
Master of Professional Study 3.1% 20
Bachelor of Fine Arts 7.7% 50
Bachelor of Science or Bachelor of Arts 8.3% 54
Associate Deg ree 2.0 % 13
Certificate 0 .3% 2
No post-secondary deg ree 0 .8% 5
Other 1.8% 12
T o ta ls : 6 51

4. What is your academic rank/assignment?
Per
cent
Adjunct instr
uctor
Adjunct administ
ratio
n and
teach
ing
Administra
tion o
nly
Community e
ducatio
n
Full-tim
e fixed-le
ngth co
ntract
Full-tim
e teach
ing with
staff
resp
onsibilit
ies
Graduate
teach
ing or r
esearch
ass
istant
High school in
structo
r/educa
tor
Lecture
r
Staff
support
only
Tenured
Tenured tr
ack
Other -
- Write
in
0
10
20
30

5. If adjunct, what number of courses are taught per year?
19% 1-219% 1-2
26% 2-426% 2-4
24% 4-524% 4-5
30% 6+30% 6+
Value Percent Responses
1-2 19.3% 23
2-4 26.1% 31
4-5 24.4% 29
6+ 30 .3% 36
T o ta ls : 119

6. Non-T eaching Expectations -- (Check all that apply).
Per
cent
Research
Publishing
Exhibitio
n servi
ce to
the co
mmunity
Service
to th
e insti
tutio
n
Service
to th
e community
Service
to th
e pro
fess
ion
Recruitm
ent
None
0
20
40
60
80
Value Percent Responses
Research 48.2% 30 2
Publishing 38.8% 243
Exhibition service to the community 45.0 % 282
Service to the institution 64.9% 40 7
Service to the community 54.2% 340
Service to the profession 50 .6% 317
Recruitment 40 .7% 255
None 13.6% 85

7. Your total years in teaching, staff and/or administrating in education
Percent
less than 3 yrs
3-5 yrs
5-10 yrs
11-15 yrs
15-20 yrs
20-25 yrs
More than 25 yrs
0 5 10 15 20 25 30
Value Percent Responses
less than 3 yrs 4.9% 32
3-5 yrs 6.6% 43
5-10 yrs 15.4% 10 0
11-15 yrs 16.2% 10 5
15-20 yrs 16.0 % 10 4
20 -25 yrs 14.6% 95
More than 25 yrs 26.3% 171
T o ta ls : 6 50

8. T o which level do you teach? (Check all that apply).
Per
cent
College --
graduate
leve
l
only
College --
underg
raduate
leve
l only
College --
both
gra
duate a
nd underg
raduate
Continuing e
ducatio
nK-1
2
Works
hops
Other -
- Write
in
0
10
20
30
40
50
60
Value Percent Responses
Colleg e -- g raduate level only 1.4% 9
Colleg e -- underg raduate level only 55.0 % 355
Colleg e -- both g raduate and underg raduate 27.6% 178
Continuing education 13.2% 85
K-12 15.2% 98
Workshops 26.4% 170
Other -- Write in 6.7% 43

9. Prior to becoming a photographic educator, how many years experience did youhave working in a non-academic photographic environment?
50% 0-5 years50% 0-5 years
24% 6-10 years24% 6-10 years
14% 11-20 years14% 11-20 years
13% 20+ years13% 20+ years
Value Percent Responses
0 -5 years 49.9% 322
6-10 years 23.6% 152
11-20 years 13.5% 87
20 + years 13.0 % 84
T o ta ls : 6 45

10. How would you best describe your program? (Check all that apply).
Per
cent
Fine art
Commercial (p
roduct,
edito
rial, p
ortrait,
wedding,
other)
Photo jo
urnalis
m/communica
tions
Moving o
r tim
e-base
d media (f
ilm, v
ideo, VR)
History
of photo
graphy /
art
history
Art educa
tion
Other -
- Write
in
0
20
40
60
80
Value Percent Responses
Fine art 75.8% 489
Commercial (product, editorial, portrait, wedding , other) 38.9% 251
Photo journalism/communications 24.5% 158
Moving or time-based media (film, video, VR) 17.1% 110
History of photog raphy / art history 25.0 % 161
Art education 14.1% 91
Other -- Write in 10 .2% 66

11. T o which educational or professional organizations are you a member? (Check allthat apply).
Per
cent
None
American P
hotogra
phic Artis
ts (A
PA)
American S
ociety
of Media P
hotogra
phers (A
SMP)
College A
rt Ass
ociatio
n (CAA)
National A
rt Educa
tion A
ssocia
tion (N
AEA)
National P
ress
Photo
graphers
Associa
tion (N
PPA)
Profe
ssional P
hotogra
phers of A
merica (P
PA)
Society
for P
hotogra
phic Educa
tion (S
PE)
Wedding &
Portr
ait Photo
graphers
Inte
rnatio
nal (WPPI)
Other -
- Write
in
0
50
25
75
Value Percent Responses
None 16.3% 10 3
American Photog raphic Artists (APA) 3.7% 23
American Society of Media Photog raphers (ASMP) 16.8% 10 6
Colleg e Art Association (CAA) 16.0 % 10 1
National Art Education Association (NAEA) 4.1% 26
National Press Photog raphers Association (NPPA) 3.7% 23
Professional Photog raphers of America (PPA) 5.4% 34
Society for Photog raphic Education (SPE) 61.6% 388
Wedding & Portrait Photog raphers International (WPPI) 0 .6% 4
Other -- Write in 21.6% 136
Other -- Write in 6.8% 43

12. Do you regularly read or subscribe to any photography publications/magazines?
29% Yes29% Yes
32% No32% No
39% If yes, please list yourfavorites:39% If yes, please list yourfavorites:
Value Percent Responses
Yes 28.6% 182
No 32.3% 20 6
If yes, please list your favorites: 39.1% 249
T o ta ls : 6 37

13. What photog raphy related websites do you visit most often, or direct yourstudents to as resources?Please list your top five to ten sites on separate lines.


15. What best describes your type of institution? (Check all that apply).
Per
cent
Public co
llege/u
niversi
ty
Private
non-p
rofit
colle
ge/unive
rsity
Private
for-p
rofit
colle
ge/unive
rsity
Public ju
nior or c
ommunity co
llege
For-pro
fit junior c
ollege
Public h
igh school
Private
high sc
hool
Continuing e
ducatio
n/community
learn
ing cente
r
Works
hops
On-line e
ducatio
nal site
Other -
- Write
in
0
20
40
60
Value Percent Responses
Public colleg e/university 40 .6% 239
Private non-profit colleg e/university 21.8% 128
Private for-profit colleg e/university 6.8% 40
Public junior or community colleg e 19.6% 115
For-profit junior colleg e 0 .5% 3
Public hig h school 8.8% 52
Private hig h school 3.2% 19
Continuing education/community learning center 5.4% 32
Workshops 10 .7% 63
On-line educational site 1.5% 9
Other -- Write in 5.8% 34

16. What is the department or school type where imaging education is taught in yourinstitution? (Check all that apply).
Per
cent
Fine Arts
Photogra
phy or I
maging
Technology
Communicatio
ns
Applied A
rts
Occupatio
ns
Journ
alism
Humanities
Other -
- Write
in
0
20
40
60
80
Value Percent Responses
Fine Arts 63.1% 367
Photog raphy or Imag ing 36.1% 210
T echnolog y 10 .3% 60
Communications 16.2% 94
Applied Arts 11.2% 65
Occupations 2.6% 15
Journalism 10 .1% 59
Humanities 7.7% 45
Other -- Write in 12.7% 74

17. What degrees are offered at your institution? (Check all that apply).
Per
cent
Certifica
tes
Associa
tes
Bachelors
Master o
f Pro
fess
ional Stu
dy
Masters
of Arts
or S
cience
Master o
f Fine A
rt
Doctora
te (P
hD or E
dD)
Other -
- Write
inNone
0
20
40
60
80
Value Percent Responses
Certificates 26.7% 155
Associates 33.6% 195
Bachelors 61.6% 357
Master of Professional Study 7.1% 41
Masters of Arts or Science 19.3% 112
Master of Fine Art 32.9% 191
Doctorate (PhD or EdD) 16.6% 96
Other -- Write in 9.0 % 52
None 9.3% 54

18. What are the options for studying photography or imaging at your institution?
Per
cent
A major e
mphasis fo
r a
term
inal degre
e
(docto
rate
or M
FA)
A non-te
rminal g
raduate
degre
e
(MA, M
S, oth
er)
A major f
or a b
achelors
degree
An emphasis
in a
bach
elors degre
e (ie B
FA or B
A --
communica
tion w
ith e
mphasis in
photo
graphy)
A major f
or an a
ssocia
tes d
egree
An emphasis
in a
n ass
ociate
s degre
e (ie fin
e art
with e
mphasis in
photo
graphy)
A minor
As exe
cutiv
e/inte
rest
course
s only
As on-lin
e educa
tion w
ith a
vaila
ble aca
demic cre
dit
As on-lin
e educa
tion w
ithout a
vaila
ble aca
demic cre
dit
Continuing e
ducatio
n
Elective
only
0
40
Value Percent Responses
A major emphasis for a terminal deg ree (doctorate or MFA) 24.7% 141
A non-terminal g raduate deg ree (MA, MS, other) 7.2% 41
A major for a bachelors deg ree 33.7% 192
An emphasis in a bachelors deg ree (ie BFA or BA -- communication
with emphasis in photog raphy)
38.6% 220
A major for an associates deg ree 20 .0 % 114
An emphasis in an associates deg ree (ie fine art with emphasis in
photog raphy)
12.5% 71
A minor 30 .2% 172
As executive/interest courses only 6.3% 36
As on-line education with available academic credit 5.3% 30
As on-line education without available academic credit 1.6% 9
Continuing education 16.7% 95
Elective only 20 .5% 117

19. How many full-time instructors teach photography/imaging at your institution?
9% 09% 0
70% 1-370% 1-3
15% 4-615% 4-6
4% 7-104% 7-10
1% 10-201% 10-20
2% 20+2% 20+
Value Percent Responses
0 9.0 % 52
1-3 69.9% 40 4
4-6 14.5% 84
7-10 3.8% 22
10 -20 1.0 % 6
20 + 1.7% 10
T o ta ls : 57 8

20. How many part-time or adjunct instructors teach photography/imaging at yourinstitution?
26% 026% 0
57% 1-557% 1-5
10% 6-1010% 6-10
4% 11-204% 11-20
4% 20+4% 20+
Value Percent Responses
0 25.7% 147
1-5 56.7% 324
6-10 9.5% 54
11-20 4.4% 25
20 + 3.7% 21
T o ta ls : 57 1

21. Does your program offer night classes?
56% Yes56% Yes
44% No44% No
Value Percent Responses
Yes 56.1% 323
No 43.9% 253
T o ta ls : 57 6

22. Does your program offer classes on weekends?
18% Yes18% Yes
83% No83% No
Value Percent Responses
Yes 17.5% 10 0
No 82.5% 472
T o ta ls : 57 2

23. Does your program offer any on-line photography classes?
24% Yes24% Yes
76% No76% No
Value Percent Responses
Yes 24.4% 140
No 75.6% 434
T o ta ls : 57 4

24. If yes, what on-line photography classes do they offer?
Per
cent
Technique/P
roce
sses
Studio/C
ritique
Software
History
of Photo
graphy
Aesthetic
sOth
er
Other -
- Write
in
0
10
20
30
40
50
60
70
Value Percent Responses
T echnique/Processes 61.3% 84
Studio/Critique 40 .1% 55
Software 35.0 % 48
History of Photog raphy 45.3% 62
Aesthetics 27.7% 38
Other 5.1% 7
Other -- Write in 19.7% 27
Other -- Write in 0 .7% 1

25. Can on-line photographic courses apply toward degreeattainment/requirement?
32% Yes32% Yes
68% No68% No
Value Percent Responses
Yes 31.7% 168
No 68.3% 362
T o ta ls : 530

26. If yes, how much of your program’s student body is involved in on-line study?
77% Less than 20%77% Less than 20%
15% 21% - 50%15% 21% - 50%
9% More than 50%9% More than 50%
Value Percent Responses
Less than 20 % 76.7% 122
21% - 50 % 14.5% 23
More than 50 % 8.8% 14
T o ta ls : 159

27. If no, does your school offer other types of classes on-line?
62% Yes62% Yes
22% No22% No
16% I don't know16% I don't know
Value Percent Responses
Yes 62.2% 312
No 22.3% 112
I don't know 15.5% 78
T o ta ls : 50 2

28. Does your institution normally offer funding for educators to attend off-sitelearning?
41% Yes41% Yes
27% No27% No
33% Sometimes33% Sometimes
Value Percent Responses
Yes 41.1% 234
No 26.5% 151
Sometimes 32.5% 185
T o ta ls : 57 0

29. Does your institution normally offer funding for you to attend educationalconferences (such as Society for Photographic Education)?
36% Yes36% Yes
23% No23% No
27% Sometimes27% Sometimes
15% Only when presenting15% Only when presenting
Value Percent Responses
Yes 35.6% 20 5
No 22.6% 130
Sometimes 27.1% 156
Only when presenting 14.8% 85
T o ta ls : 57 6

30. Does your institution normally offer funding for you to attend photo-relatedtrade shows or industry events (such as Professional Photographers Association,Wedding & Portrait Photographers International)?
17% Yes17% Yes
58% No58% No
24% Sometimes24% Sometimes
Value Percent Responses
Yes 17.4% 99
No 58.2% 332
Sometimes 24.4% 139
T o ta ls : 57 0

31. Who controls budgets for your photo/imaging program?
Per
cent
Our Department Finance orComptrollers Office
College AcademicAdministrator (ie
Provost)
CorporateHeadquarters
Other0
10
20
30
40
50
60
Value Percent Responses
Our Department 59.4% 337
Finance or Comptrollers Office 7.2% 41
Colleg e Academic Administrator (ie Provost) 19.8% 112
Corporate Headquarters 1.8% 10
Other 11.8% 67
T o ta ls : 56 7

33. Approximate student to teacher ratio in your program. Please enter the avg # ofstudents per faculty person.

35. How many undergraduate students (majors & minors) are enrolled on campus inyour program?
26% 1-2526% 1-25
21% 26-5021% 26-50
15% 51-10015% 51-100
9% 101-1509% 101-150
5% 151-2005% 151-200
3% 201-2503% 201-250
3% 251-3003% 251-300
4% 301-3504% 301-350
1% 351-4001% 351-400
1% 401-4501% 401-450
1% 451-5001% 451-500
3% 501-1,0003% 501-1,000
7% 1,000+7% 1,000+

36. How many on-line undergraduate students (majors & minors) are enrolled inyour program?
83% None --we don't offer an on-line program83% None --we don't offer an on-line program
7% 1-257% 1-25
3% 26-503% 26-50
1% 51-1001% 51-100
1% 101-1501% 101-150
2% 151-2002% 151-200
1% 201-2501% 201-250
1% 251-3001% 251-300
0% 301-3500% 301-350
1% 401-5001% 401-500
1% 501-1,0001% 501-1,000
1% 1,000+1% 1,000+

37. How many graduate students were enrolled in your on campus program thisyear?
71% 1-1071% 1-10
16% 11-2516% 11-25
7% 26-507% 26-50
5% 51-1005% 51-100
2% 100+2% 100+
Value Percent Responses
1-10 70 .5% 167
11-25 16.0 % 38
26-50 6.8% 16
51-10 0 4.6% 11
10 0 + 2.1% 5
T o ta ls : 237

38. How many graduate students are enrolled in your on-line program this year?
95% None --we don't offer an on-line graduate program95% None --we don't offer an on-line graduate program
2% 1-102% 1-10
1% 11-251% 11-25
1% 26-501% 26-50
0% 51-1000% 51-100
1% 101+1% 101+
Value Percent Responses
None -- we don't offer an on-line g raduate prog ram 95.1% 350
1-10 2.2% 8
11-25 0 .5% 2
26-50 0 .8% 3
51-10 0 0 .3% 1
10 1+ 1.1% 4
T o ta ls : 36 8

39. How many elective (non majors or minors) on campus students did your programteach this year?
55% 1-5055% 1-50
18% 51-10018% 51-100
19% 101-25019% 101-250
8% 251+8% 251+
Value Percent Responses
1-50 55.1% 20 4
51-10 0 18.4% 68
10 1-250 18.9% 70
251+ 7.6% 28
T o ta ls : 37 0

40. How many elective (non majors or minors) on-line students did your programteach this year?
22% 1-5022% 1-50
4% 51-1004% 51-100
6% 101-2506% 101-250
1% 251-5001% 251-500
0% 501-1,0000% 501-1,00067% None --we don't offer on-linephoto classes67% None --we don't offer on-linephoto classes
Value Percent Responses
1-50 22.1% 81
51-10 0 4.4% 16
10 1-250 5.5% 20
251-50 0 0 .5% 2
50 1-1,0 0 0 0 .3% 1
None -- we don't offer on-line photo classes 67.2% 246
T o ta ls : 36 6

41. In the last 12 months, enrollment in your program has
Per
cent
Largely increased(greater than 20%)
Increased (5% -20%)
Remained aboutthe same (+/- 5%)
Decreased (down5% - 20%)
Decreasedsignificantly
(greater than 20%)
0
10
20
30
40
50
Value Percent Responses
Larg ely increased (g reater than 20 %) 8.8% 39
Increased (5% - 20 %) 24.5% 10 9
Remained about the same (+/- 5%) 43.7% 194
Decreased (down 5% - 20 %) 20 .7% 92
Decreased sig nificantly (g reater than 20 %) 2.3% 10
T o ta ls : 444

42. Which answer most accurately describes what has happened to the enrollment inyour program over the last five years.
Per
cent
Decreasedmore than
50%
Decreasedsignificantly(down 25% -
50%)
Decreasedslightly (down15% - 25%)
Remainedabout the
same (+/- 10%)
Increasedmodestly (up15% - 25%)
Increasedsignificantly(up 26% -
50%)
Increasedmore than
50%
0
5
10
15
20
25
30
Value Percent Responses
Decreased more than 50 % 3.7% 16
Decreased sig nificantly (down 25% - 50 %) 15.5% 67
Decreased slig htly (down 15% - 25%) 25.6% 111
Remained about the same (+/- 10 %) 26.3% 114
Increased modestly (up 15% - 25%) 19.9% 86
Increased sig nificantly (up 26% - 50 %) 6.5% 28
Increased more than 50 % 2.5% 11
T o ta ls : 433

43. Has your program and/or curriculum been affected by the U.S. Department ofEducation's concept of "gainful employment?"
27% Yes27% Yes
74% No74% No
Value Percent Responses
Yes 26.5% 10 3
No 73.5% 285
T o ta ls : 38 8

45. What format of portfolio is required or suggested? (Check all that apply).
Value Percent Responses
Exhibition prints 84.3% 97
Bound or portfolio book 49.6% 57
DVD or appropriate media 24.3% 28
Video 15.7% 18
Website 30 .4% 35
Mobile platform (tablet/phone) 13.0 % 15
Other 8.7% 10

47. Are your students required to have their own website before graduating?
Value Percent Responses
Yes 27.7% 120
No 29.8% 129
No, but it is strong ly encourag ed 42.5% 184
T o ta ls : 433

50. Does your school actively participate with professional photographicassociations? (Please indicate which ones).
Value Percent Responses
None 52.3% 216
American Society of Media Photog raphers (ASMP) 12.8% 53
American Photog raphic Artists (APA) 3.1% 13
National Press Photog raphers Association (NPPA) 2.4% 10
Professional Photog raphers of America (PPA) 4.4% 18
Society for Photog raphic Education (SPE) 34.6% 143
Wedding & Portrait Photog raphers International (WPPI) 2.4% 10
Other -- Write in 7.3% 30
Other -- Write in 1.0 % 4

51. Would your school be interested in organizing a student chapter or have a moreactive on campus presence from professional photographic associations?
Value Percent Responses
Yes 52.4% 20 5
No 47.6% 186
T o ta ls : 39 1

53. Does your institution have a student photography club/group?
Value Percent Responses
Yes 48.6% 20 4
No 51.4% 216
T o ta ls : 420

56. Please indicate those manufacturers/distributors/companies from whom youcurrently receive support.
Value Percent Responses
Adobe 26.6% 21
Canon 59.5% 47
Epson 12.7% 10
Fuji 6.3% 5
Hahnemühle 22.8% 18
Ilford 8.9% 7
Manfrotto/Bog en 8.9% 7
Nikon 25.3% 20
Phase One 26.6% 21
Photo Video EDU 15.2% 12
Profoto 31.6% 25
Sig ma 15.2% 12
Sony 21.5% 17
T amron 16.5% 13
Other -- Write in 19.0 % 15
Other -- Write in 6.3% 5
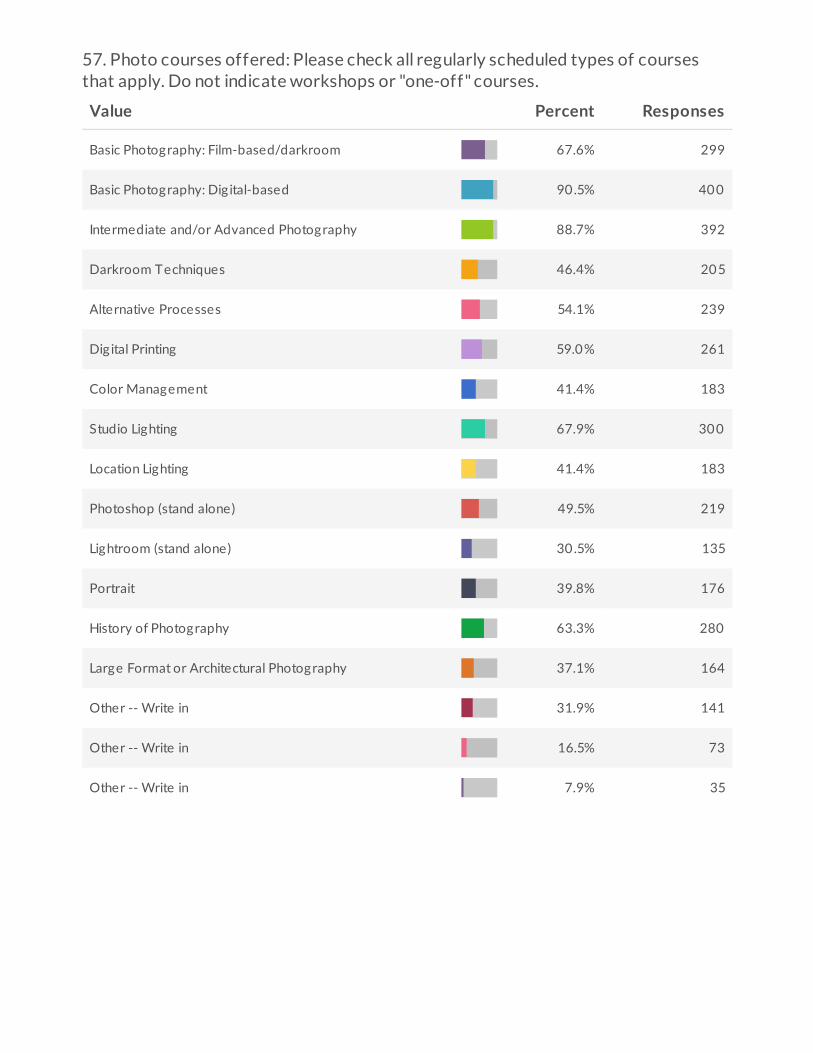
57. Photo courses offered: Please check all regularly scheduled types of coursesthat apply. Do not indicate workshops or "one-off" courses.
Value Percent Responses
Basic Photog raphy: Film-based/darkroom 67.6% 299
Basic Photog raphy: Dig ital-based 90 .5% 40 0
Intermediate and/or Advanced Photog raphy 88.7% 392
Darkroom T echniques 46.4% 20 5
Alternative Processes 54.1% 239
Dig ital Printing 59.0 % 261
Color Manag ement 41.4% 183
Studio Lig hting 67.9% 30 0
Location Lig hting 41.4% 183
Photoshop (stand alone) 49.5% 219
Lig htroom (stand alone) 30 .5% 135
Portrait 39.8% 176
History of Photog raphy 63.3% 280
Larg e Format or Architectural Photog raphy 37.1% 164
Other -- Write in 31.9% 141
Other -- Write in 16.5% 73
Other -- Write in 7.9% 35

58. Do your photo students receive any video/film production training as part oftheir required curriculum?
Value Percent Responses
Yes 49.8% 214
No 50 .2% 216
T o ta ls : 430

61. Do your photo students receive any audio recording/editing training as part oftheir required curriculum?
Value Percent Responses
Yes 30 .7% 130
No 69.3% 293
T o ta ls : 423

63. If yes, what equipment is required of the student?
Value Percent Responses
Film camera 43.4% 118
Dig ital camera 89.3% 243
Video-capable camera 15.4% 42
T ripod 33.8% 92
Lig ht meter 14.7% 40
Continuous lig hting equipment 2.6% 7
Speedlig ht 7.7% 21
Strobe/studio lig hting equipment 5.5% 15
Computer 34.2% 93
Color manag ement tools 7.0 % 19
Printer 3.3% 9
Other -- Write in 6.3% 17
Other -- Write in 0 .7% 2

64. Does your program check-out equipment to students?
Value Percent Responses
No 8.2% 36
Yes -- for on-campus use only 8.4% 37
Yes -- for one day only 18.0 % 79
Yes -- extended check-out 65.4% 287
T o ta ls : 439

67. What equipment/facilities are made available for student use? (Check all thatapply).
Value Percent Responses
Audio recording devices 44.1% 174
Color manag ement 41.8% 165
Computers 82.8% 327
Darkroom facilities/equipment 77.7% 30 7
Dig ital backs for medium/larg e format cameras 27.1% 10 7
Dig ital cameras 85.6% 338
Drones 14.2% 56
Film cameras 73.9% 292
Grip/studio g ear (ie: lig ht stands, booms, soft boxes, reflectors) 70 .9% 280
Hot lig hts/tung sten or daylig ht continuous lig hting equipment 75.9% 30 0
LED lig hting 42.5% 168
Lig ht meters 69.9% 276
Printers 78.2% 30 9
Scanners 78.5% 310
Speedlig hts/hot shoe mountable flashes 60 .3% 238
Studio space 73.2% 289
Studio strobe lig hting equipment 74.4% 294
Video cameras 40 .5% 160
Wireless remote camera/strobe trig g ers 55.7% 220
Other -- Write in 8.6% 34
Other -- Write in 2.8% 11

68. Do your students still shoot film?
Value Percent Responses
Yes 78.1% 339
No 21.9% 95
T o ta ls : 434

71. Are your print/output labs color-managed?
Value Percent Responses
I don't know 6.5% 28
Yes 49.8% 213
No 21.7% 93
Yes, but they could use some help 22.0 % 94
T o ta ls : 428

74. How often do you upgrade your computers?
Value Percent Responses
Less than every three years 7.9% 33
About every three years 40 .1% 168
About every five years 35.3% 148
When they can no long er be repaired 11.9% 50
Other -- Write in 4.8% 20
T o ta ls : 419

77. Do you use the internet to share or view your students’ work?
Value Percent Responses
Yes 76.8% 335
No 23.2% 10 1
T o ta ls : 436

79. If yes: (Check all that apply).
Value Percent Responses
Defined or dedicated major space(s) or building 52.2% 191
Classroom 89.9% 329
Black & white darkroom 80 .3% 294
Color darkroom 17.5% 64
Lig hting studio 78.1% 286
Finishing area 58.2% 213
Critique space 57.9% 212
Gallery/exhibitions space 53.0 % 194
Imag ing specific computer lab 69.9% 256
Dig ital printing area 74.3% 272
Other -- Write in 5.2% 19
Other -- Write in 0 .8% 3

81. Which social media sites do you use to communicate with current students?(Check all that apply).
Value Percent Responses
Facebook 78.8% 175
T witter 19.4% 43
Goog le+ 11.7% 26
Instag ram 64.0 % 142
Snapchat 3.2% 7
Other -- Write in 12.2% 27

84. Where will your department's technology be in 5 years?
Value Percent Responses
All dig ital 27.4% 116
Analog and dig ital 71.9% 30 5
Analog only 0 .7% 3
T o ta ls : 424

85. What courses do you anticipate adding within the next few years? (Check all thatapply).
Value Percent Responses
Additional advanced Photoshop/Lig htroom 30 .2% 97
Advanced commercial 15.6% 50
Advanced portrait 10 .0 % 32
Alternative process 16.5% 53
Audio recording /editing 10 .3% 33
Cell phone/tablet imag emaking 19.6% 63
Color manag ement and dig ital printing 13.4% 43
Dig ital asset manag ement 9.7% 31
Dig ital publishing /content for the web 13.1% 42
Documentary/photojournalism 15.9% 51
Drone photog raphy 26.8% 86
Fashion photog raphy 9.3% 30
Hig hDynamic Rang e (HDR) 4.0 % 13
History of photog raphy 15.0 % 48
Larg e format 9.0 % 29
Location lig hting 13.1% 42
Studio 11.8% 38
T raditional B & W 8.4% 27
Multimedia 18.7% 60
Photo/art related business/marketing 22.1% 71
Studio lig hting 15.3% 49
Video editing and production 23.7% 76

3D printing 14.6% 47
Other -- Write in 16.8% 54
Value Percent Responses

86. What are your plans for film/analog technology within the next three years?(Check all that apply).
Value Percent Responses
None -- We have previously eliminated all analog /film classes &
processing
24.5% 78
Eliminate all darkrooms 2.5% 8
Eliminate color darkrooms only 4.4% 14
Eliminate B&W darkrooms only 0 .6% 2
Add additional darkroom facilities 9.4% 30
Add analog /film classes 15.0 % 48
Eliminate all analog /film classes 0 .3% 1
Eliminate medium/larg e format classes 1.3% 4
Add medium/larg e format classes 8.2% 26
Acquire dig ital backs to make larg e format cameras dig ital 10 .0 % 32
Other -- Write in 42.9% 137

87. What are your most pressing equipment needs? (Check all that apply).
Value Percent Responses
Audio g ear 8.4% 32
Battery-powered lig hting 19.4% 74
Cameras 52.8% 20 1
Color manag ement tools (for monitor/printer/projector/camera
calibration)
16.8% 64
Computers 22.3% 85
Continuous lig hts 15.2% 58
Dedicated video cameras 16.5% 63
Grip g ear (such as lig ht stands, booms, reflectors, umbrellas, etc...) 15.2% 58
Lenses 36.0 % 137
Monitors 10 .2% 39
Printers 27.6% 10 5
Scanners 14.7% 56
Strobe/studio lig hting 25.2% 96
Video/motion accessories (such as jibs, sliders, focus pullers, and rig s) 16.8% 64
Other -- Write in 17.3% 66

88. What do you see as being the single biggest challenge today in serving yourphotography students?
Value Percent Responses
Keeping up-to-date with chang ing technolog y & techniques 14.6% 63
Cost of today’s tools and technolog y 17.9% 77
Cost of education 15.5% 67
Students’ ability to secure loans/funding for education 2.8% 12
Perception that everyone is now a photog rapher and the field doesn't
require any formal training
24.1% 10 4
Potential jobs (or lack thereof) after g raduation 17.4% 75
Other -- Write in 7.7% 33
T o ta ls : 431