REPORT DOCUMENTATION PAGE · REPORT DOCUMENTATION PAGE ... as the Medical Affirmative Claims (MAC)...
88
Transcript of REPORT DOCUMENTATION PAGE · REPORT DOCUMENTATION PAGE ... as the Medical Affirmative Claims (MAC)...


REPORT DOCUMENTATION PAGE Form Approved
OMB No. 0704-0188 Public reporting burden for this collection of information is estimated to average 1 hour per response, including the time for reviewing instructions, searching existing data sources, gathering and maintaining the data needed, and completing and reviewing this collection of information. Send comments regarding this burden estimate or any other aspect of this collection of information, including suggestions for reducing this burden to Department of Defense, Washington Headquarters Services, Directorate for Information Operations and Reports (0704-0188), 1215 Jefferson Davis Highway, Suite 1204, Arlington, VA 22202-4302. Respondents should be aware that notwithstanding any other provision of law, no person shall be subject to any penalty for failing to comply with a collection of information if it does not display a currently valid OMB control number. PLEASE DO NOT RETURN YOUR FORM TO THE ABOVE ADDRESS. 1. REPORT DATE (DD-MM-YYYY) 1-02-01-02-20062006
2. REPORT TYPE Epidmiology Final
3. DATES COVERED (From - To) 2004 1-08-2005 to 1-01-2006
4. TITLE AND SUBTITLE DoD Military Injury Prevention Priorities Working Group:
5a. CONTRACT NUMBER NA
Leading Injuries, Causes and Mitigation Recommendations
5b. GRANT NUMBER NA
5c. PROGRAM ELEMENT NUMBER NA
6. AUTHOR(S) Ruscio, Bruce, Jack Smith, Paul Amoroso, Jerry Anslinger, Steve Bullock, Bruce Burnham,
5d. PROJECT NUMBER NA
John Campbell, Michelle Chervak, Kurt Garbow, Richard Garver, Eugene Godwin, Michael Harvey, Tonie Hooper, Bruce Jones, Dan Reinhard, John Phillips, Chris Rennix, James
5e. TASK NUMBER NA
Riddle, John Scott, John Seibert, Randy Smith, Dana Thomas, Daniel Trone, Pam Webster, Timothy Wells, Robin Wilkening,
5f. WORK UNIT NUMBERNA
7. PERFORMING ORGANIZATION NAME(S) AND ADDRESS(ES)
8. PERFORMING ORGANIZATION REPORT NUMBER
Office of The Secretary of Defense, Health Affairs
9. SPONSORING / MONITORING AGENCY NAME(S) AND ADDRESS(ES) 10. SPONSOR/MONITOR’S ACRONYM(S) 11. SPONSOR/MONITOR’S REPORT NUMBER(S) 12. DISTRIBUTION / AVAILABILITY STATEMENT Approved for Public Release; Distribution is Unlimited
13. SUPPLEMENTARY NOTES
14. ABSTRACT
15. SUBJECT TERMS
16. SECURITY CLASSIFICATION OF:
17. LIMITATION OF ABSTRACT
18. NUMBER OF PAGES
19a. NAME OF RESPONSIBLE PERSON
a. REPORT
b. ABSTRACT
c. THIS PAGE
19b. TELEPHONE NUMBER (include area code)
Standard Form 298 (Rev. 8-98) Prescribed by ANSI Std. Z39.18

DMIPPWG White Paper: Military Injury Prevention Priorities
ii
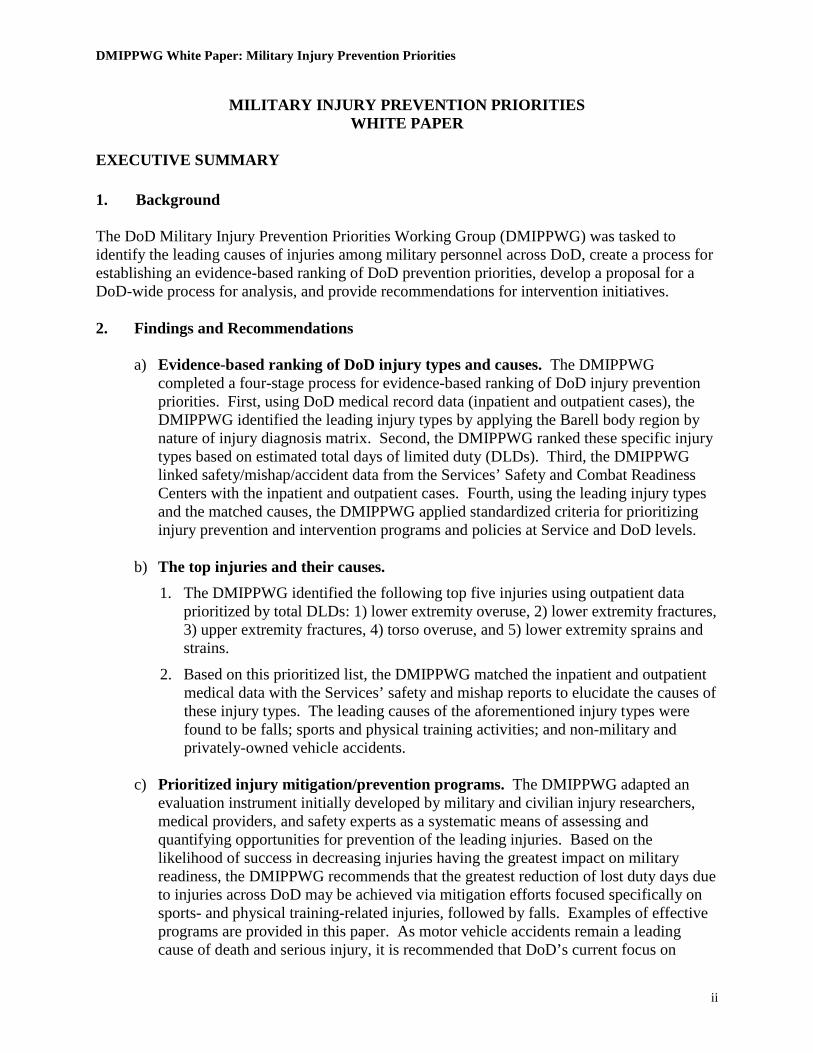
MILITARY INJURY PREVENTION PRIORITIES WHITE PAPER
EXECUTIVE SUMMARY 1. Background The DoD Military Injury Prevention Priorities Working Group (DMIPPWG) was tasked to identify the leading causes of injuries among military personnel across DoD, create a process for establishing an evidence-based ranking of DoD prevention priorities, develop a proposal for a DoD-wide process for analysis, and provide recommendations for intervention initiatives. 2. Findings and Recommendations
a) Evidence-based ranking of DoD injury types and causes. The DMIPPWG completed a four-stage process for evidence-based ranking of DoD injury prevention priorities. First, using DoD medical record data (inpatient and outpatient cases), the DMIPPWG identified the leading injury types by applying the Barell body region by nature of injury diagnosis matrix. Second, the DMIPPWG ranked these specific injury types based on estimated total days of limited duty (DLDs). Third, the DMIPPWG linked safety/mishap/accident data from the Services’ Safety and Combat Readiness Centers with the inpatient and outpatient cases. Fourth, using the leading injury types and the matched causes, the DMIPPWG applied standardized criteria for prioritizing injury prevention and intervention programs and policies at Service and DoD levels.
b) The top injuries and their causes.
1. The DMIPPWG identified the following top five injuries using outpatient data prioritized by total DLDs: 1) lower extremity overuse, 2) lower extremity fractures, 3) upper extremity fractures, 4) torso overuse, and 5) lower extremity sprains and strains.
2. Based on this prioritized list, the DMIPPWG matched the inpatient and outpatient medical data with the Services’ safety and mishap reports to elucidate the causes of these injury types. The leading causes of the aforementioned injury types were found to be falls; sports and physical training activities; and non-military and privately-owned vehicle accidents.
c) Prioritized injury mitigation/prevention programs. The DMIPPWG adapted an
evaluation instrument initially developed by military and civilian injury researchers, medical providers, and safety experts as a systematic means of assessing and quantifying opportunities for prevention of the leading injuries. Based on the likelihood of success in decreasing injuries having the greatest impact on military readiness, the DMIPPWG recommends that the greatest reduction of lost duty days due to injuries across DoD may be achieved via mitigation efforts focused specifically on sports- and physical training-related injuries, followed by falls. Examples of effective programs are provided in this paper. As motor vehicle accidents remain a leading cause of death and serious injury, it is recommended that DoD’s current focus on
DMIPPWG White Paper: Military Injury Prevention Priorities
iii
mitigating these accidents should be continued. As an existing task force is already developing a motor vehicle accident prevention program, however, the present group did not specifically focus on this injury cause.
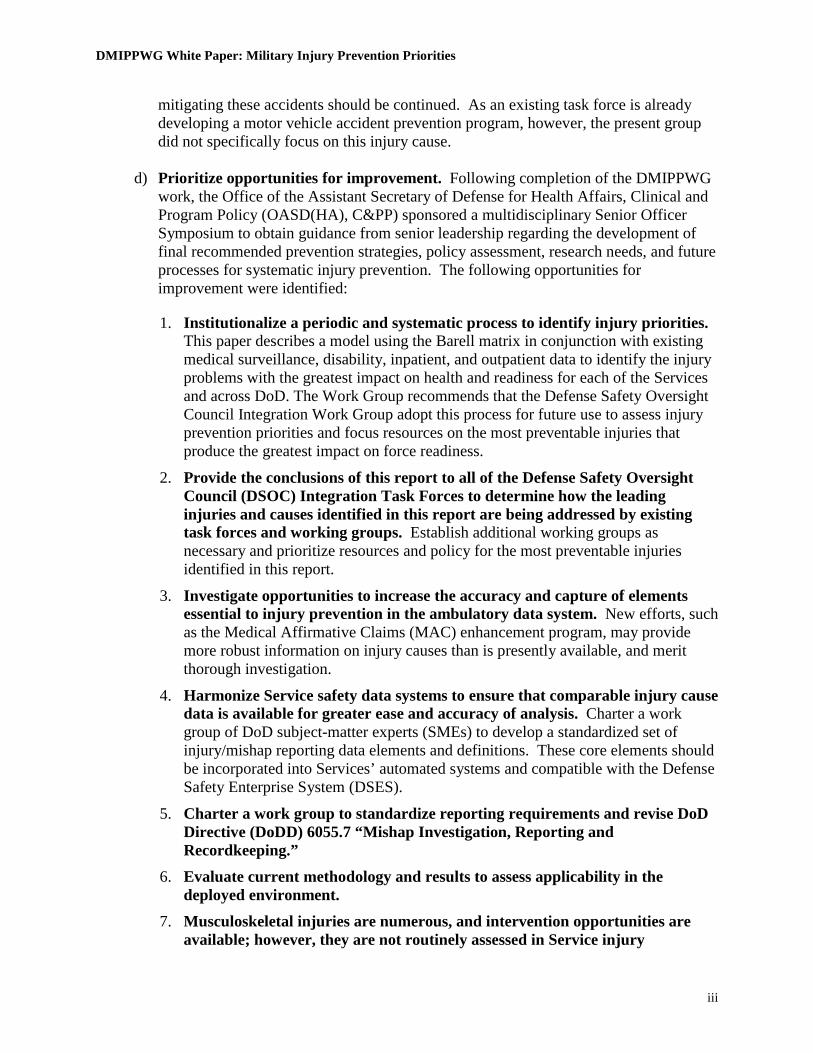
d) Prioritize opportunities for improvement. Following completion of the DMIPPWG
work, the Office of the Assistant Secretary of Defense for Health Affairs, Clinical and Program Policy (OASD(HA), C&PP) sponsored a multidisciplinary Senior Officer Symposium to obtain guidance from senior leadership regarding the development of final recommended prevention strategies, policy assessment, research needs, and future processes for systematic injury prevention. The following opportunities for improvement were identified:
1. Institutionalize a periodic and systematic process to identify injury priorities. This paper describes a model using the Barell matrix in conjunction with existing medical surveillance, disability, inpatient, and outpatient data to identify the injury problems with the greatest impact on health and readiness for each of the Services and across DoD. The Work Group recommends that the Defense Safety Oversight Council Integration Work Group adopt this process for future use to assess injury prevention priorities and focus resources on the most preventable injuries that produce the greatest impact on force readiness.
2. Provide the conclusions of this report to all of the Defense Safety Oversight Council (DSOC) Integration Task Forces to determine how the leading injuries and causes identified in this report are being addressed by existing task forces and working groups. Establish additional working groups as necessary and prioritize resources and policy for the most preventable injuries identified in this report.
3. Investigate opportunities to increase the accuracy and capture of elements essential to injury prevention in the ambulatory data system. New efforts, such as the Medical Affirmative Claims (MAC) enhancement program, may provide more robust information on injury causes than is presently available, and merit thorough investigation.
4. Harmonize Service safety data systems to ensure that comparable injury cause data is available for greater ease and accuracy of analysis. Charter a work group of DoD subject-matter experts (SMEs) to develop a standardized set of injury/mishap reporting data elements and definitions. These core elements should be incorporated into Services’ automated systems and compatible with the Defense Safety Enterprise System (DSES).
5. Charter a work group to standardize reporting requirements and revise DoD Directive (DoDD) 6055.7 “Mishap Investigation, Reporting and Recordkeeping.”
6. Evaluate current methodology and results to assess applicability in the deployed environment.
7. Musculoskeletal injuries are numerous, and intervention opportunities are available; however, they are not routinely assessed in Service injury

DMIPPWG White Paper: Military Injury Prevention Priorities
iv
programs. The evaluation of musculoskeletal injuries and their causes should be standardized and included into Service and DoD injury safety programs.
8. With the recent DoD policy requiring the ‘roll-up’ of the Medical Evaluation Board (MEB) and Physical Evaluation Board (PEB) in support of the DoD-Veterans Affairs Seamless Transition efforts, an opportunity exists to assess causes of disability and medical separation of injured Service members.
9. Use an existing or newly-formed venue to better coordinate evidence-based assessment of DoD injuries, causes and mitigation efforts, and to share valuable information throughout DoD. The effort should:
a) Have multidisciplinary (Safety, Epidemiology, Occupational Health, Behavioral Health, and Policy) membership;
b) Adopt the evidence-based process described in this report;
c) Enhance dissemination and sharing of effective interventions for reducing injuries; and
d) Periodically report progress to the DSOC.
3. Next Step Provide report to the DSOC and follow-up on recommendations in accordance with DSOC guidance and timelines. Lt Col Bruce Ruscio, USAF, BSC Chair, DoD Military Injury Prevention Priorities Work Group
DMIPPWG White Paper: Military Injury Prevention Priorities
v
MILITARY INJURY PREVENTION PRIORITIES WHITE PAPER
CONTENTS BACKGROUND.......................................................................................................................... 1
FINDINGS AND RECOMMENDATIONS.............................................................................. 7
A Process for Evidence-based Ranking of DoD Injury Types and Causes........................ 7
Fatalities.............................................................................................................................. 7
Hospitalization .................................................................................................................... 9
Ambulatory Visits .............................................................................................................. 12
Estimated Limited Duty Days Ranking ............................................................................. 13
Distribution of Injury-related Musculoskeletal Conditions .............................................. 15
Top Injuries and Their Causes ........................................................................................... 16
STANAG Coded Leading Injury Causes ........................................................................... 17
Medical-Safety Data Matching ......................................................................................... 19
Evidence-based Ranking of Injuries and Causes .............................................................. 20
A Process to Prioritize Injury Mitigation/Prevention Programs..................................... 23
Mitigation Prioritization ................................................................................................... 23
Service Mitigation Initiatives ............................................................................................ 25
Injury Research Efforts ..................................................................................................... 26
DISCUSSION/SUMMARY...................................................................................................... 28
PRIORITIZED OPPORTUNITIES FOR IMPROVEMENT .............................................. 30
REFERENCES.......................................................................................................................... 33

DMIPPWG White Paper: Military Injury Prevention Priorities
vi
Appendices
A. Secretary of Defense Memorandum on Military Injury Prevention Priorities....................A-1 B. DMIPPWG Meeting Agenda .............................................................................................. B-1
C. Senior Leadership Symposium Agenda & Participants ...................................................... C-1
D. Service Top Injury Causes of Hospitalization.....................................................................D-1
E. Service Matching Data ........................................................................................................ E-1
E.1 Army Matching Data................................................................................................. E-1
E.2 Air Force Matching Data........................................................................................... E-9
E.3 Navy Matching Data ............................................................................................... E-13
F. Injury Activities Associated with Medical Visits (Hospitalization and Outpatient)............F-1
G. DMIPPWG Injury Prioritization Criteria Worksheet..........................................................G-1
H. Service Data Call Responses...............................................................................................H-1
H.1 Army Injury Research Efforts ...................................................................................H-1
H.2 Air Force Injury Research Efforts.............................................................................H-3
H.3 Navy Injury Research Efforts....................................................................................H-4
H.4 Marine Corps Injury Research Efforts ......................................................................H-5
I. Military Training Task Force Recommendations ..................................................................I-1
DMIPPWG White Paper: Military Injury Prevention Priorities
Page 1
A PROCESS FOR ESTABLISHING MILITARY INJURY PREVENTION PRIORITIES
BACKGROUND The past decade has witnessed growing recognition that injuries are a leading cause of morbidity and mortality for the U.S. Military, eroding combat readiness more than any other single disease or health condition in this generally healthy and physically active population, which is relatively free of competing causes of death and severe illness. In the 1990s, medical and safety data revealed that across the Services accidental injuries caused (Atlas of Injuries in U.S. Armed Forces, Military Medicine, 1999):
• 47% (Air Force) to 57% (Marine Corps) of all deaths; • 22% (Air Force) to 63% (Navy and Marine Corps) of all disabilities; and • 22% (Air Force) to 31% (Marine Corps) of all hospitalizations.
Further, Service member injuries cost hundreds of millions of dollars annually, consuming Services’ resources and challenging operational effectiveness. To address the magnitude of the injury problem of the U.S. Military, in 2003 the Secretary of Defense mandated that rates of accidents and injuries must be significantly reduced and established the Defense Safety Oversight Council (DSOC) to provide governance on DoD-wide efforts to reduce preventable mishaps. Subsequently, the DSOC requested the establishment of the DoD Military Injury Prevention Priorities Working Group (DMIPPWG) (Appendix A) to outline a systematic, coordinated approach to injury prevention similar to the public health approach outlined in the Atlas of Injuries (Military Medicine, 1999). This white paper describes the DMIPPWG’s process for establishing an evidence-based ranking of DoD prevention priorities, presents a DoD-wide process for analysis, and provides recommendations for intervention initiatives. Public Health Process Injuries directly affect the health and readiness of individual Service members and the DoD at large. Only with a full appreciation of the extent of the injury problem can safety and injury prevention programs be effective in achieving improvements in military readiness and the quality of life for Service members. As such, the DMIPPWG supports a public health approach consisting of five core procedures progressing from assessment to intervention to policy development and assurance. Further, addressing injuries in DoD demands that organizations and individuals work in tandem. Towards that end, the DMIPPWG’s public health approach characterizes health objectives in a format that facilitates collaboration among diverse DoD agencies. The specific steps of the DMIPPWG’s public health approach include:

DMIPPWG White Paper: Military Injury Prevention Priorities
Page 2
1) What is/How big is the problem? (Surveillance answers if there is a problem and its magnitude.) The first step of the process is perhaps the most critical because surveillance helps determine whether a problem exists and the importance of the problem relative to other causes. Surveillance provides a mechanism for follow-up and monitoring of the impact of programs and policy changes. The DoD injury prevention programs remain focused on preventing the most visible, catastrophic injuries – those resulting in fatalities (primarily motor vehicle accidents and aviation-related deaths). These programs, however, fail to address many of the leading injury causes that result in disabilities and lost duty time.
2) What are causes of injury? (Epidemiology and research obtains critical evidence to determine injury etiology.)
Injuries may be the result of a single determining cause, or of very complex human behaviors or environmental conditions, with multiple interacting causes. Examples of injury risk factors include speeding in a vehicle or engaging in excessive physical exercise. Protective factors include safety belts, education and training, and personal protective equipment. While people who sustain an injury typically exhibit a combination of risk factors, one precipitating factor often leads to the person being injured.
3) Which prevention strategies work? (Intervention trials evaluate what works to prevent
the problem.)
Interventions attempt to influence some combination of psychological or behavioral states, physical environment, or cultural conditions. Comprehensive injury prevention programs addressing a variety of risk and protective factors have a greater likelihood of reducing injuries than interventions that address a single risk or protective factor. It is also important to test intervention methods to demonstrate that they are safe, feasible, and can be applied in other settings. Further, evaluation can maximize the success of the program prior to implementation by permitting revisions before the full effort goes forward. Collaboration between leaders and agencies may also increase program effectiveness.
4) What programs and policies are needed? (Appropriate programs and policies address
who needs to know and what needs to be done.)
To ensure success, it is critical to implement consistent programs and policies as designed and tested, guaranteeing that program principles remain intact. However, programs and policies should also be able to adapt to cultural needs as necessary. Even with sound implementation plans, unanticipated problems often arise. As such, evaluation must be incorporated into policies and programs from their planning stages. Another important consideration during policy and program development and implementation is communication between policymakers, leaders, program staff, Service members, and other stakeholders to ensure real injury prevention needs are addressed.

DMIPPWG White Paper: Military Injury Prevention Priorities
Page 3
5) How effective are our interventions? (Monitoring and evaluating answers the question, “Did it actually work?”)
Injury prevention efforts must assess the impact of interventions on the reduction of injuries. Towards that end, evaluation must be incorporated into any program from its inception. Evaluation involves setting realistic goals and objectives that are specific, measurable, attainable, relevant, and time-based, and monitoring progress towards those objectives. An ideal evidence-based intervention is one that has been evaluated and found to be safe, ethical, feasible, cost-effective, and efficacious. It is important to note that some programs that are presumed to prevent injuries, including some that have been widely implemented, have not yet been evaluated. Evaluation can help determine whether an injury prevention program strategy is appropriate for a given population, or how it should be modified to achieve maximum effectiveness.
Purpose The purpose of this white paper is to present a DoD-wide public health approach to the public health problem of injuries in the military. This paper describes: 1) an evidence-based ranking of the DoD leading injuries1, their causes, and injury prevention priorities; 2) a proposal for a DoD-wide process for analysis; and 3) recommendations for intervention initiatives. Working Group Methods The DMIPPWG was comprised of approximately 30 members representing the military Services in the areas of operations, safety, medicine, policy, and research. The DMIPPWG met virtually throughout the process via e-mail and weekly teleconferences. The DMIPPWG convened for one two-day meeting addressing data evaluation, prevention prioritization criteria development, and intervention recommendations (See Appendix B for meeting agenda). Additionally, Health Affairs convened a Senior Officer Symposium, which included medical and safety representatives, to address intervention recommendations (Appendix C). The DMIPPWG’s initial steps involved outlining a process to determine the leading injuries and their causes in the DoD. The DMIPPWG then conducted an inventory and characterization of available injury data and processes for data analysis. The DMIPPWG reviewed data on deaths and inpatient (hospitalization) and outpatient (ambulatory) care to demonstrate the relative importance of injuries as a health problem compared to disease conditions and to determine the trends and distributions of the types and causes of injuries. During this process, the group recognized the importance of categorizing specific musculoskeletal conditions as injuries. As a result, the group determined that these conditions required further evaluation and necessitated inclusion in the scope of this effort.
1 For the purpose of this effort an injury is any intentional or unintentional damage to the body resulting from acute or over exposure to thermal, mechanical, electrical, or chemical energy or from the absence of such essentials as heat or oxygen. Not included in this assessment are casualties incurred as the direct result of hostile action sustained in combat.

DMIPPWG White Paper: Military Injury Prevention Priorities
Page 4
The DMIPPWG decided to identify the top five injuries based on medical data by estimating the days of limited duty (DLDs) for injuries treated in outpatient clinics, aggregated by diagnosis (e.g. fracture, sprain), by body region per the Barell Matrix2. This medical data was evaluated and summarized in the same manner for all the Services. The initial focus on the medical data permitted the identification of leading types of injury with a robust data set of almost two million injury visits (affecting approximately 900,000 Service members) for CY 2004. The Service Safety and Combat Readiness Centers, however, receive significantly fewer accident reports than the number of medical visits—approximately 8,429 for the Navy, Air Force and Army, combined in CY 2004. While inpatient data has limited associated cause codes, outpatient data, which constitutes the overwhelming majority of all injury care data, is not cause-coded. Thus, the only way to begin to fully characterize the causes of injuries is by matching these two data sets with the Safety data. The Service representatives then merged the inpatient and outpatient medical data on the top injury types with safety data to determine the leading causes of the top five types of injury. After determining the top five injuries by estimated lost duty days and identifying the top causes of these injuries, the DMIPPWG proceeded to prioritize intervention recommendations. The DMIPPWG refined criteria for setting priorities, which had been developed during prior working group efforts and applied these rating criteria to rank injury problems to target prevention. This ranking evaluated the causes for each injury type and the potential for successful interventions resulting in measurable decreases in the occurrence of such injuries. A data call to the Service medical research activities also yielded a comprehensive listing of injury-related research being conducted across DoD. Finally, the Office of the Assistant Secretary of Defense for Health Affairs, Clinical and Program Policy (OASD(HA) C&PP) sponsored a half-day multidisciplinary Senior Officer Symposium. The purpose of the symposium was to obtain guidance from general-level officers regarding the development of final recommended prevention strategies, policy assessment, research needs, and future processes for systematic injury prevention. The symposium agenda and list of attendees are provided in Appendix C. Data Collected and Reviewed The DMIPPWG reviewed mortality data as the starting point for this effort. The Mortality Surveillance Division in the Office of the Armed Forces Medical Examiner (OAFME) provided the injury fatality information. This data includes baseline mortality information on military personnel and cause-specific mortality rates among Service personnel. Mortality information is collected from all four Service casualty offices, which use their own databases to document and provide casualty information as necessary. These casualty databases capture active duty deaths attributable to accidents, illnesses, suicides, homicides, and hostile actions. The Mortality Surveillance Division produces weekly reports to the Services and DoD leadership.
2 The Barell body region by nature of injury diagnosis matrix standardizes data selection and reports with a two-dimensional matrix that includes International Classification of Diseases, Ninth Revision, Clinical Modification (ICD-9-CM) codes, providing a standard format for reports of non-fatal injury data.
DMIPPWG White Paper: Military Injury Prevention Priorities
Page 5
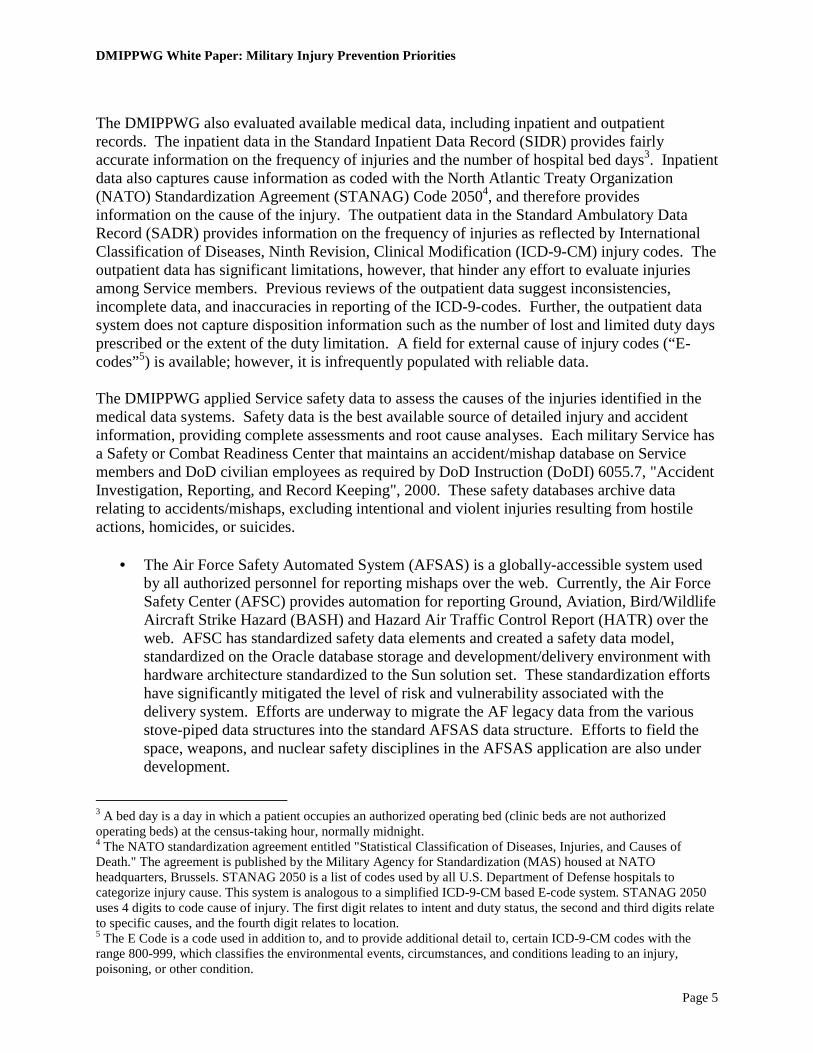
The DMIPPWG also evaluated available medical data, including inpatient and outpatient records. The inpatient data in the Standard Inpatient Data Record (SIDR) provides fairly accurate information on the frequency of injuries and the number of hospital bed days3. Inpatient data also captures cause information as coded with the North Atlantic Treaty Organization (NATO) Standardization Agreement (STANAG) Code 20504, and therefore provides information on the cause of the injury. The outpatient data in the Standard Ambulatory Data Record (SADR) provides information on the frequency of injuries as reflected by International Classification of Diseases, Ninth Revision, Clinical Modification (ICD-9-CM) injury codes. The outpatient data has significant limitations, however, that hinder any effort to evaluate injuries among Service members. Previous reviews of the outpatient data suggest inconsistencies, incomplete data, and inaccuracies in reporting of the ICD-9-codes. Further, the outpatient data system does not capture disposition information such as the number of lost and limited duty days prescribed or the extent of the duty limitation. A field for external cause of injury codes (“E-codes”5) is available; however, it is infrequently populated with reliable data. The DMIPPWG applied Service safety data to assess the causes of the injuries identified in the medical data systems. Safety data is the best available source of detailed injury and accident information, providing complete assessments and root cause analyses. Each military Service has a Safety or Combat Readiness Center that maintains an accident/mishap database on Service members and DoD civilian employees as required by DoD Instruction (DoDI) 6055.7, "Accident Investigation, Reporting, and Record Keeping", 2000. These safety databases archive data relating to accidents/mishaps, excluding intentional and violent injuries resulting from hostile actions, homicides, or suicides.
• The Air Force Safety Automated System (AFSAS) is a globally-accessible system used by all authorized personnel for reporting mishaps over the web. Currently, the Air Force Safety Center (AFSC) provides automation for reporting Ground, Aviation, Bird/Wildlife Aircraft Strike Hazard (BASH) and Hazard Air Traffic Control Report (HATR) over the web. AFSC has standardized safety data elements and created a safety data model, standardized on the Oracle database storage and development/delivery environment with hardware architecture standardized to the Sun solution set. These standardization efforts have significantly mitigated the level of risk and vulnerability associated with the delivery system. Efforts are underway to migrate the AF legacy data from the various stove-piped data structures into the standard AFSAS data structure. Efforts to field the space, weapons, and nuclear safety disciplines in the AFSAS application are also under development.
3 A bed day is a day in which a patient occupies an authorized operating bed (clinic beds are not authorized operating beds) at the census-taking hour, normally midnight. 4 The NATO standardization agreement entitled "Statistical Classification of Diseases, Injuries, and Causes of Death." The agreement is published by the Military Agency for Standardization (MAS) housed at NATO headquarters, Brussels. STANAG 2050 is a list of codes used by all U.S. Department of Defense hospitals to categorize injury cause. This system is analogous to a simplified ICD-9-CM based E-code system. STANAG 2050 uses 4 digits to code cause of injury. The first digit relates to intent and duty status, the second and third digits relate to specific causes, and the fourth digit relates to location. 5 The E Code is a code used in addition to, and to provide additional detail to, certain ICD-9-CM codes with the range 800-999, which classifies the environmental events, circumstances, and conditions leading to an injury, poisoning, or other condition.

DMIPPWG White Paper: Military Injury Prevention Priorities
Page 6
• The Army Safety Management Information System (ASMIS) is a database that provides critical information on accidents reported by field units from all over the world. Safety regulations and accident directives are also accessible. ASMIS’s capabilities include queries to: 1) define accident populations/profiles by age, grade, military occupation specialty (MOS), height, weight, etc.; and 2) identify top problem areas by dollar loss, fatalities, or frequency of occurrence. ASMIS provides support for DoD Human System Integration programs during all phases of system development and operation. Accident findings are in "field language", and must be translated into human performance terms. Output is used for definition and prioritization of critical human factors, war-fighting issues and needs. Users of this information include designers, trainers, researchers, safety professionals, manpower and personnel experts, and advanced technologists. ASMIS is fully-operable 24 hours per day.
• The Navy Web-Enabled Safety System (WESS) provides complete, on-line mishap
reporting and data retrieval for non-aviation mishaps. It simplifies field and fleet mishap- and hazard-reporting procedures as well as safety data analysis. WESS captures reports and identifies the “Who? What? When? Where? How? and Why?” of mishaps and hazards. It allows users to enter mishap and hazard notifications, route them through the proper releasing chain for validation, and electronically submit them to the Naval Safety Center. Upon receiving the data, the Naval Safety Center conducts a quality-assurance review that is stored in a consolidated database. WESS includes shore, afloat, ground, work-related illnesses and injuries, home and recreational, motor vehicle, diving, cargo air-drops, parachuting, combat zone, and aviation/non-aviation explosive mishaps.
• The Marine Corps uses the automated WESS system described above for mishap
reporting and data analysis.
• The Coast Guard Web-Enabled Electronic Mishap Reporting system (E-MISREP) enables field activities to easily report military/civilian injuries and property damage through the internet using the members’ email address to access the system. E-MISREP operates from a Microsoft SQL web-enabled system providing complete, on-line mishap reporting and data retrieval for non-aviation mishaps. The system will generate a message from the information entered into the database fields. E-MISREP has individual data entry screens for injury data, motor vehicle accidents, property damage, and command reviewer’s comments, and approval and release to the database administrator located at the Maintenance and Logistic Command Atlantic (MLCLANT) in Norfolk, Virginia. Upon receiving the data, MLCLANT conducts a quality-assurance review of the data prior to entry into the consolidated database. E-MISREP users also have access to various data reports, charts, graphs and an ad hoc query function derived from system data.
The Services’ mishap database systems may meet the individual Services’ needs in identification, recording, reporting, and analysis of serious injuries for prevention and mitigation efforts. These systems, however, have a number of limitations, including data definition inconsistencies and incompatibilities, which restrict the effectiveness of injury cause assessments and, consequently, intervention and prevention efforts. These limitations greatly hinder assessing causes across the DoD.
DMIPPWG White Paper: Military Injury Prevention Priorities
Page 7
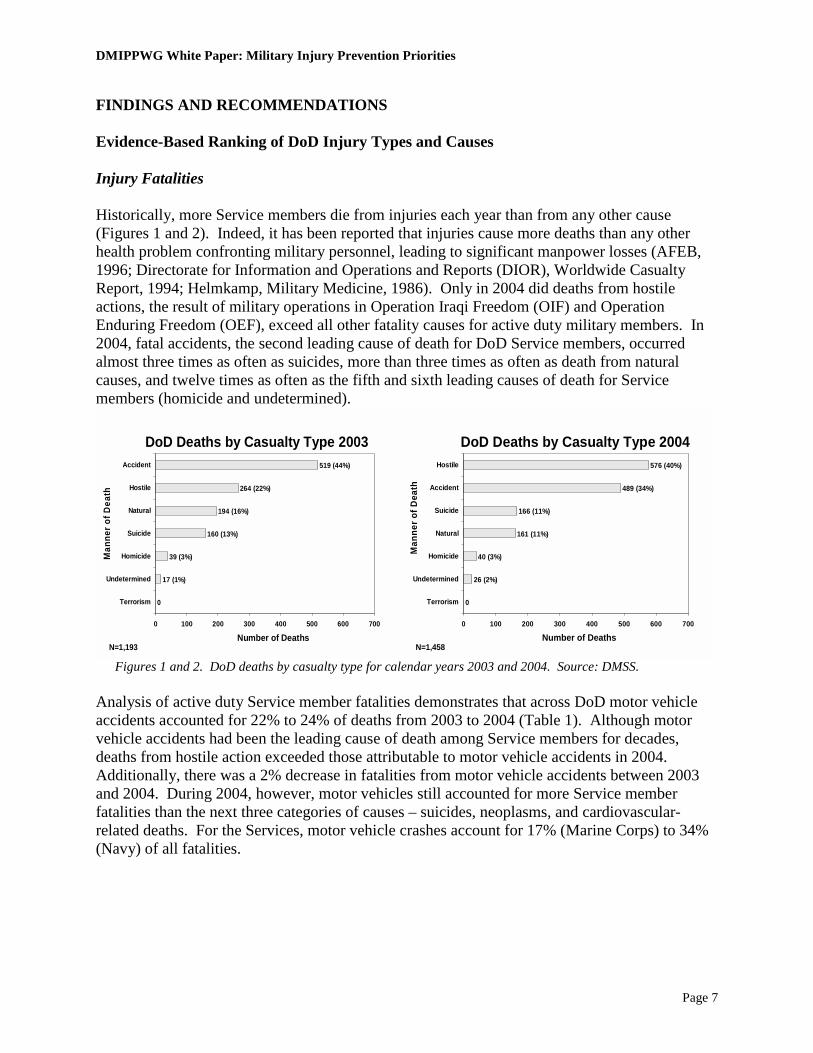
FINDINGS AND RECOMMENDATIONS Evidence-Based Ranking of DoD Injury Types and Causes Injury Fatalities Historically, more Service members die from injuries each year than from any other cause (Figures 1 and 2). Indeed, it has been reported that injuries cause more deaths than any other health problem confronting military personnel, leading to significant manpower losses (AFEB, 1996; Directorate for Information and Operations and Reports (DIOR), Worldwide Casualty Report, 1994; Helmkamp, Military Medicine, 1986). Only in 2004 did deaths from hostile actions, the result of military operations in Operation Iraqi Freedom (OIF) and Operation Enduring Freedom (OEF), exceed all other fatality causes for active duty military members. In 2004, fatal accidents, the second leading cause of death for DoD Service members, occurred almost three times as often as suicides, more than three times as often as death from natural causes, and twelve times as often as the fifth and sixth leading causes of death for Service members (homicide and undetermined).
DoD Deaths by Casualty Type 2003
Man
ner o
f Dea
th
Number of Deaths
0
17 (1%)
39 (3%)
160 (13%)
194 (16%)
264 (22%)
519 (44%)
0 100 200 300 400 500 600 700
Terrorism
Undetermined
Homicide
Suicide
Natural
Hostile
Accident
N=1,193
DoD Deaths by Casualty Type 2004
Man
ner o
f Dea
th
Number of Deaths
0
26 (2%)
40 (3%)
161 (11%)
166 (11%)
489 (34%)
576 (40%)
0 100 200 300 400 500 600 700
Terrorism
Undetermined
Homicide
Natural
Suicide
Accident
Hostile
N=1,458
Figures 1 and 2. DoD deaths by casualty type for calendar years 2003 and 2004. Source: DMSS. Analysis of active duty Service member fatalities demonstrates that across DoD motor vehicle accidents accounted for 22% to 24% of deaths from 2003 to 2004 (Table 1). Although motor vehicle accidents had been the leading cause of death among Service members for decades, deaths from hostile action exceeded those attributable to motor vehicle accidents in 2004. Additionally, there was a 2% decrease in fatalities from motor vehicle accidents between 2003 and 2004. During 2004, however, motor vehicles still accounted for more Service member fatalities than the next three categories of causes – suicides, neoplasms, and cardiovascular-related deaths. For the Services, motor vehicle crashes account for 17% (Marine Corps) to 34% (Navy) of all fatalities.

DMIPPWG White Paper: Military Injury Prevention Priorities
Page 8
Top DoD Medical Categories for Deaths, 2003-2004
7% 9410% 123Other2% (10)222% (10)20Drowning
22% (2)32224% (1)282Motor Vehicle
100%1432100%1174Total
2% (9)294% (8)42Drug/Alcohol2% (8)336% (6)66Aviation2% (7)353% (9)31Other Transport3% (6)404% (7)44Homicide3% (5)496% (5)66Diseases of Heart5% (4)666% (4)70Neoplasms
12% (3)16614% (3)165Suicide
40% (1)57623% (2)265Hostile% (Rank)N% (Rank)NManner
DoD 2004DoD 2003
Table 1. Leading Cause of Death for all Active Duty Service Members, 2003 and 2004. Source: DMSS. Table 2 displays the leading causes of death for the DoD, Army, Air Force, Navy, and Marine Corps, respectively, in 2004. From 2003 to 2004, motor vehicle crashes were the leading cause of death in the Navy and the second leading cause of death in the Army, Air Force and Marine Corps. The Service rankings of fatality causes have remained relatively constant over the past decade, except in 2004, when increases in deaths attributable to hostile action increased dramatically. Service differences in fatalities from hostile actions (ranked first for the Army and the Marine Corps and eighth for the Navy and the Air Force), however, are clearly evident, indicating, as expected, Army and Marine Corps efforts in OIF and OEF. Both fatal and non-fatal injuries constitute a public health problem for DoD. To implement successful injury prevention policies and programs, it is critical to adequately address both fatal and non-fatal injuries through comprehensive surveillance and analysis efforts. Mechanisms involved in non-fatal injuries requiring hospital care, however, differ from those for fatal injuries. For example, people who are injured by firearms or poisons/drugs are more likely to die than those who fall. While there may be few deaths attributable to falls, they do account for a significant proportion of inpatient or outpatient medical events resulting in serious injury, medical care costs, and lost duty time.
DMIPPWG White Paper: Military Injury Prevention Priorities
Page 9
100%
2%
2% (7)
1% (10)
3% (4)
2% (6)
1% (8)
1% (9)
2% (5)
7% (3)
17% (2)
64% (1)
% (Rank)
400
7
7
2
12
7
5
2
7
29
66
256
N
Marine Corps
100%
13%
2% (9)
4% (7)
1% (10)
5% (6)
6% (5)
6% (4)
9% (3)
17% (2)
34% (1)
3% (8)
% (Rank)
222
29
5
9
3
10
13
14
19
37
76
7
N
Navy
100%
10%
3% (5)
2% (9)
1% (10)
3% (7)
3% (6)
10% (4)
10% (3)
29% (1)
27% (2)
3% (8)
% (Rank)
156
15
5
3
2
4
5
15
15
46
42
4
N
Air Force
7%437% 94Other
1% (10)52% (10)22Drowning
21% (2)13822% (2)322Motor Vehicle
100%654100%1432Total
2% (8)152% (9)29Drug/Alcohol
2% (7)162% (8)33Aviation
2% (9)142% (7)35Other Transport
3% (6)173% (6)40Homicide
3% (5)183% (5)49Diseases of Heart
4% (4)255% (4)66Neoplasms
8% (3)5412% (3)166Suicide
47% (1)30940% (1)576Hostile
% (Rank)N% (Rank)NManner
ArmyDoD
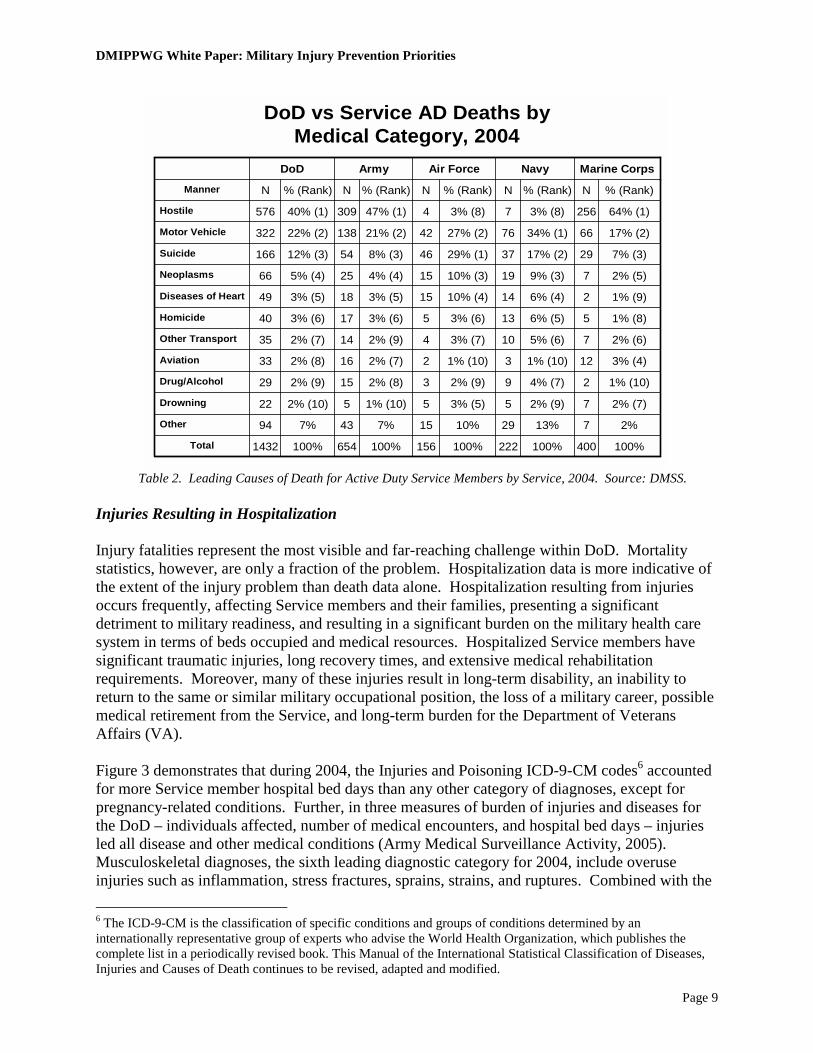
DoD vs Service AD Deaths by Medical Category, 2004
Table 2. Leading Causes of Death for Active Duty Service Members by Service, 2004. Source: DMSS.
Injuries Resulting in Hospitalization Injury fatalities represent the most visible and far-reaching challenge within DoD. Mortality statistics, however, are only a fraction of the problem. Hospitalization data is more indicative of the extent of the injury problem than death data alone. Hospitalization resulting from injuries occurs frequently, affecting Service members and their families, presenting a significant detriment to military readiness, and resulting in a significant burden on the military health care system in terms of beds occupied and medical resources. Hospitalized Service members have significant traumatic injuries, long recovery times, and extensive medical rehabilitation requirements. Moreover, many of these injuries result in long-term disability, an inability to return to the same or similar military occupational position, the loss of a military career, possible medical retirement from the Service, and long-term burden for the Department of Veterans Affairs (VA). Figure 3 demonstrates that during 2004, the Injuries and Poisoning ICD-9-CM codes6 accounted for more Service member hospital bed days than any other category of diagnoses, except for pregnancy-related conditions. Further, in three measures of burden of injuries and diseases for the DoD – individuals affected, number of medical encounters, and hospital bed days – injuries led all disease and other medical conditions (Army Medical Surveillance Activity, 2005). Musculoskeletal diagnoses, the sixth leading diagnostic category for 2004, include overuse injuries such as inflammation, stress fractures, sprains, strains, and ruptures. Combined with the 6 The ICD-9-CM is the classification of specific conditions and groups of conditions determined by an internationally representative group of experts who advise the World Health Organization, which publishes the complete list in a periodically revised book. This Manual of the International Statistical Classification of Diseases, Injuries and Causes of Death continues to be revised, adapted and modified.

DMIPPWG White Paper: Military Injury Prevention Priorities
Page 10
injury ICD-9-CM diagnosis categories, this information provides evidence of an even greater contribution of injuries to Service member morbidity compared to all other categories of diagnosis. Musculoskeletal injuries are discussed at length later in this paper.
Burden of Injuries and Diseases on US Armed Forces by ICD-9 Code Groups, 2004
0
2000
00
4000
00
6000
00
8000
00
10000
00
1200
000
14000
00
1600
000
1800
000
2000
000
Other
Genitourinary
Digestive
Resp Disease
Infect/parasite
Skin
Muskuloskeletal
Resp Infection
Sense organ
Mental
Signs/symptoms
Injury
Medical encounters
Individuals affected
Hospital bed days
Bur
den
of D
isea
se C
ateg
ory
Medical Encounters/ Individuals Affected
Medical Surveillance Monthly Report, 11(2):19, April 2005
Medical Encounters = Outpatient + Inpatient
Figure 3. The Burden of Injury and Disease on US Armed Forces in 2004. A review of the distribution of the DoD top five injuries (ICD-9-CM codes 800-999) for hospitalized personnel for 2004 is provided in Figure 4. Table 3 shows the distribution of the leading hospitalized injuries across the five military Services. Fractures were the leading type of injury resulting in hospitalization across DoD in 2004. The high frequency of lower extremity injuries is also apparent, comprising three of the top five most frequent injury types (i.e. fracture of the ankle, fracture of the tibia and fibula, and sprains and strains of the knee and leg) for all but the Marine Corps, where sprains and strains fall below the top five. Across the Services, fractures of the lower extremity (ankle and tibia and fibula) account for the first, second, or third leading injury types resulting in hospitalization.

DMIPPWG White Paper: Military Injury Prevention Priorities
Page 11
Distribution (%) of Top Five Injuries Resulting in Hospitalized Service Members, CY04 - DoD
Sprains and strains of knee and leg
15.0% (5)
Fracture of radius and ulna16.8% (4)
Fracture of face bones
19.6% (3)
Fracture of tibia and fibula
20.9% (2)
Fracture of ankle27.7% (1)
Figure 4. Distribution of the DoD top five injuries resulting in hospitalized Service members, CY04. Source: DMSS. While the top five injuries resulting in hospitalization are relatively consistent across the Services, variations are evident among the less common injury types (See Appendix D). For example, heat-related injuries (ICD-9-CM code 992) account for 6.9% (sixth) and 7.7% (seventh) of Army and Marine Corps injuries, respectively. By comparison, however, heat-related injuries account for only 1.5% (ninth) and 1.0% (eleventh) for the Air Force and Navy, respectively. Another notable difference is the open wound of hip and thigh, which constitutes the fifth most frequent injury resulting in hospitalization for the Marine Corps, but ranks tenth for the Air Force and Navy and eleventh for the Army. Although the primary goal of the DMIPPWG was to look at leading injuries across the DoD, Service differences in types of injury provides valuable information on the nature of injuries and prevention opportunities. Service differences in type and frequency may simply reflect differing missions. Alternatively, these differences may provide insight regarding how best to approach safety mitigation, through detailed characterization and comparison across the DoD. More comprehensive evaluation of these differences would further inform DoD prevention initiatives.
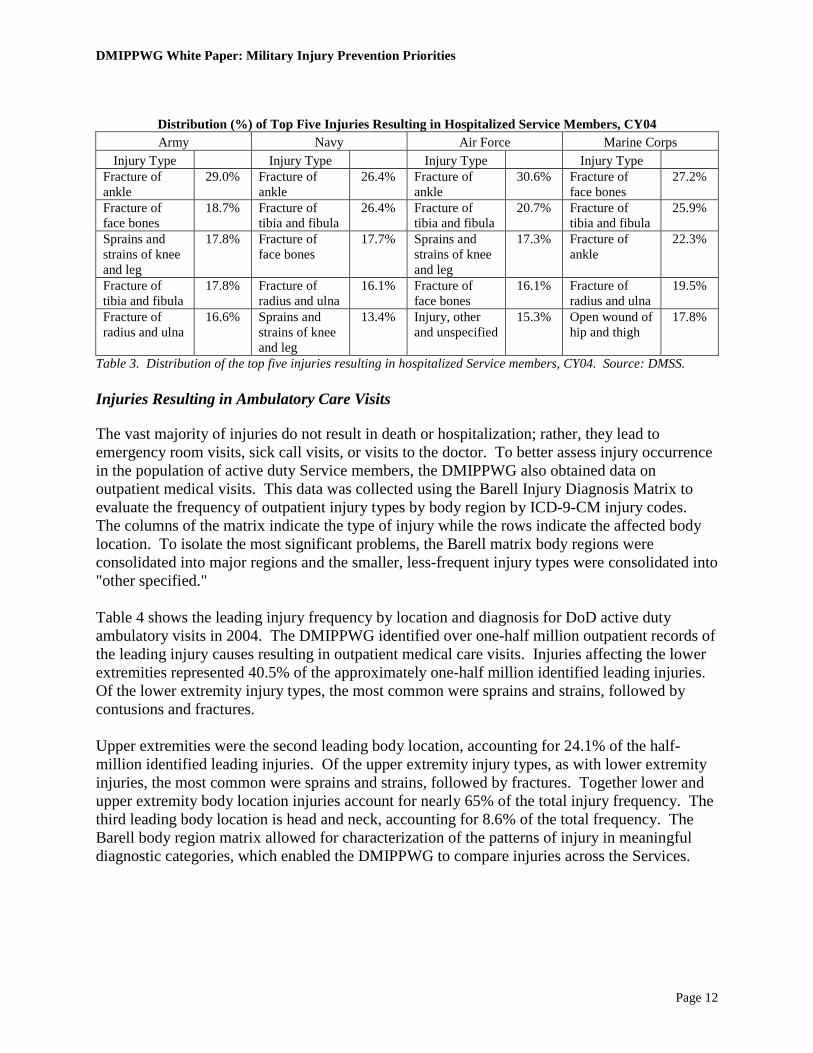
DMIPPWG White Paper: Military Injury Prevention Priorities
Page 12
Distribution (%) of Top Five Injuries Resulting in Hospitalized Service Members, CY04 Army Navy Air Force Marine Corps
Injury Type Injury Type Injury Type Injury Type Fracture of ankle
29.0% Fracture of ankle
26.4% Fracture of ankle
30.6% Fracture of face bones
27.2%
Fracture of face bones
18.7% Fracture of tibia and fibula
26.4% Fracture of tibia and fibula
20.7% Fracture of tibia and fibula
25.9%
Sprains and strains of knee and leg
17.8% Fracture of face bones
17.7% Sprains and strains of knee and leg
17.3% Fracture of ankle
22.3%
Fracture of tibia and fibula
17.8% Fracture of radius and ulna
16.1% Fracture of face bones
16.1% Fracture of radius and ulna
19.5%
Fracture of radius and ulna
16.6% Sprains and strains of knee and leg
13.4% Injury, other and unspecified
15.3% Open wound of hip and thigh
17.8%
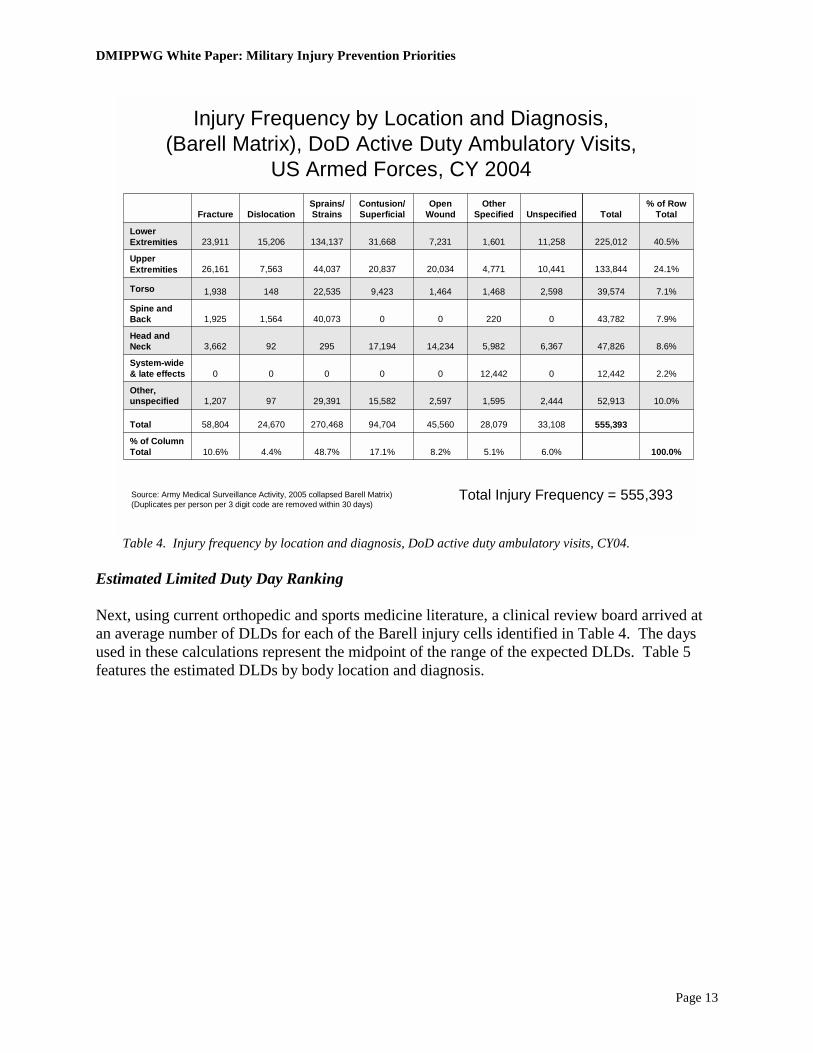
Table 3. Distribution of the top five injuries resulting in hospitalized Service members, CY04. Source: DMSS. Injuries Resulting in Ambulatory Care Visits The vast majority of injuries do not result in death or hospitalization; rather, they lead to emergency room visits, sick call visits, or visits to the doctor. To better assess injury occurrence in the population of active duty Service members, the DMIPPWG also obtained data on outpatient medical visits. This data was collected using the Barell Injury Diagnosis Matrix to evaluate the frequency of outpatient injury types by body region by ICD-9-CM injury codes. The columns of the matrix indicate the type of injury while the rows indicate the affected body location. To isolate the most significant problems, the Barell matrix body regions were consolidated into major regions and the smaller, less-frequent injury types were consolidated into "other specified." Table 4 shows the leading injury frequency by location and diagnosis for DoD active duty ambulatory visits in 2004. The DMIPPWG identified over one-half million outpatient records of the leading injury causes resulting in outpatient medical care visits. Injuries affecting the lower extremities represented 40.5% of the approximately one-half million identified leading injuries. Of the lower extremity injury types, the most common were sprains and strains, followed by contusions and fractures. Upper extremities were the second leading body location, accounting for 24.1% of the half-million identified leading injuries. Of the upper extremity injury types, as with lower extremity injuries, the most common were sprains and strains, followed by fractures. Together lower and upper extremity body location injuries account for nearly 65% of the total injury frequency. The third leading body location is head and neck, accounting for 8.6% of the total frequency. The Barell body region matrix allowed for characterization of the patterns of injury in meaningful diagnostic categories, which enabled the DMIPPWG to compare injuries across the Services.
DMIPPWG White Paper: Military Injury Prevention Priorities
Page 13
Injury Frequency by Location and Diagnosis, (Barell Matrix), DoD Active Duty Ambulatory Visits,
US Armed Forces, CY 2004
555,393
52,913
12,442
47,826
43,782
39,574
133,844
225,012
Total
100.0%6.0%5.1%8.2%17.1%48.7%4.4%10.6%% of Column Total
33,10828,07945,56094,704270,46824,67058,804Total
10.0%2,4441,5952,59715,58229,391971,207Other, unspecified
2.2%012,44200000System-wide & late effects
8.6%6,3675,98214,23417,194295923,662Head and Neck
7.9%02200040,0731,5641,925Spine and Back
7.1%2,5981,4681,4649,42322,5351481,938Torso
24.1%10,4414,77120,03420,83744,0377,56326,161Upper Extremities
40.5%11,2581,6017,23131,668134,13715,20623,911Lower Extremities
% of Row TotalUnspecified
Other Specified
Open Wound
Contusion/Superficial
Sprains/StrainsDislocationFracture
Total Injury Frequency = 555,393Source: Army Medical Surveillance Activity, 2005 collapsed Barell Matrix) (Duplicates per person per 3 digit code are removed within 30 days)
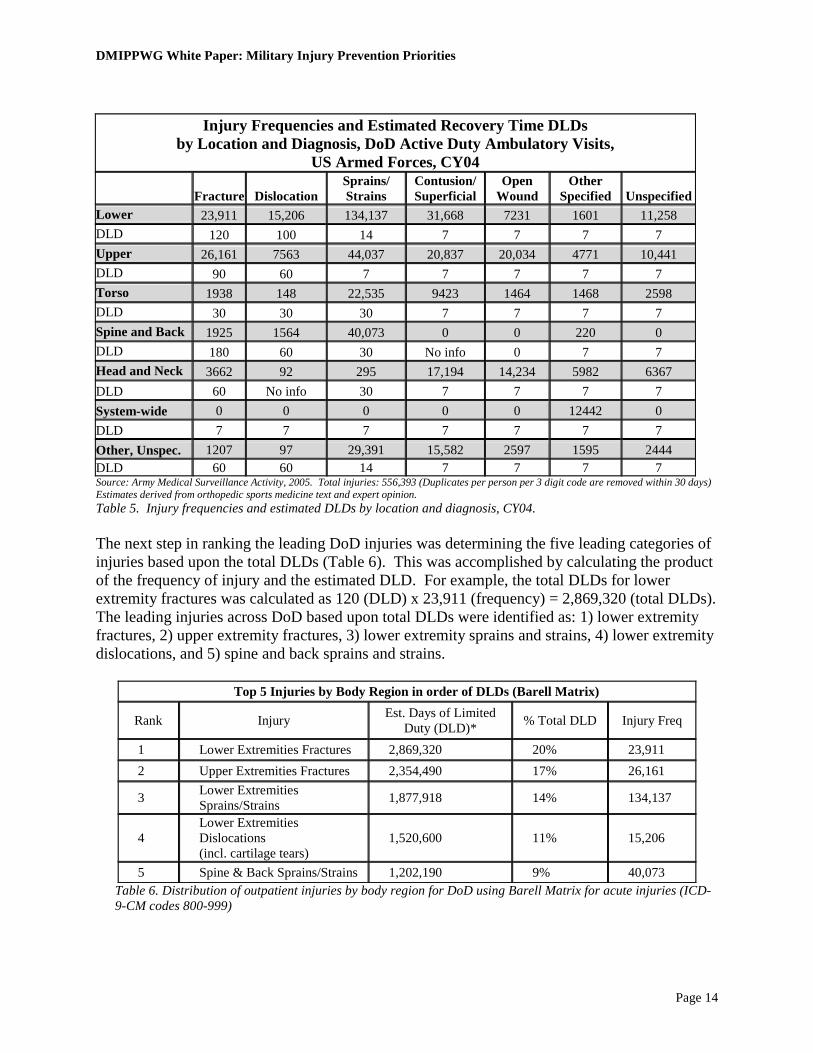
Table 4. Injury frequency by location and diagnosis, DoD active duty ambulatory visits, CY04. Estimated Limited Duty Day Ranking Next, using current orthopedic and sports medicine literature, a clinical review board arrived at an average number of DLDs for each of the Barell injury cells identified in Table 4. The days used in these calculations represent the midpoint of the range of the expected DLDs. Table 5 features the estimated DLDs by body location and diagnosis.
DMIPPWG White Paper: Military Injury Prevention Priorities
Page 14
Injury Frequencies and Estimated Recovery Time DLDs
by Location and Diagnosis, DoD Active Duty Ambulatory Visits, US Armed Forces, CY04
Fracture Dislocation Sprains/ Strains
Contusion/ Superficial
Open Wound
Other Specified Unspecified
Lower 23,911 15,206 134,137 31,668 7231 1601 11,258 DLD 120 100 14 7 7 7 7 Upper 26,161 7563 44,037 20,837 20,034 4771 10,441 DLD 90 60 7 7 7 7 7 Torso 1938 148 22,535 9423 1464 1468 2598 DLD 30 30 30 7 7 7 7 Spine and Back 1925 1564 40,073 0 0 220 0 DLD 180 60 30 No info 0 7 7 Head and Neck 3662 92 295 17,194 14,234 5982 6367 DLD 60 No info 30 7 7 7 7 System-wide 0 0 0 0 0 12442 0 DLD 7 7 7 7 7 7 7 Other, Unspec. 1207 97 29,391 15,582 2597 1595 2444 DLD 60 60 14 7 7 7 7 Source: Army Medical Surveillance Activity, 2005. Total injuries: 556,393 (Duplicates per person per 3 digit code are removed within 30 days) Estimates derived from orthopedic sports medicine text and expert opinion. Table 5. Injury frequencies and estimated DLDs by location and diagnosis, CY04. The next step in ranking the leading DoD injuries was determining the five leading categories of injuries based upon the total DLDs (Table 6). This was accomplished by calculating the product of the frequency of injury and the estimated DLD. For example, the total DLDs for lower extremity fractures was calculated as 120 (DLD) x 23,911 (frequency) = 2,869,320 (total DLDs). The leading injuries across DoD based upon total DLDs were identified as: 1) lower extremity fractures, 2) upper extremity fractures, 3) lower extremity sprains and strains, 4) lower extremity dislocations, and 5) spine and back sprains and strains.
Top 5 Injuries by Body Region in order of DLDs (Barell Matrix)
Rank Injury Est. Days of Limited Duty (DLD)* % Total DLD Injury Freq
1 Lower Extremities Fractures 2,869,320 20% 23,911 2 Upper Extremities Fractures 2,354,490 17% 26,161
3 Lower Extremities Sprains/Strains 1,877,918 14% 134,137
4 Lower Extremities Dislocations (incl. cartilage tears)
1,520,600 11% 15,206
5 Spine & Back Sprains/Strains 1,202,190 9% 40,073 Table 6. Distribution of outpatient injuries by body region for DoD using Barell Matrix for acute injuries (ICD-9-CM codes 800-999)
DMIPPWG White Paper: Military Injury Prevention Priorities
Page 15
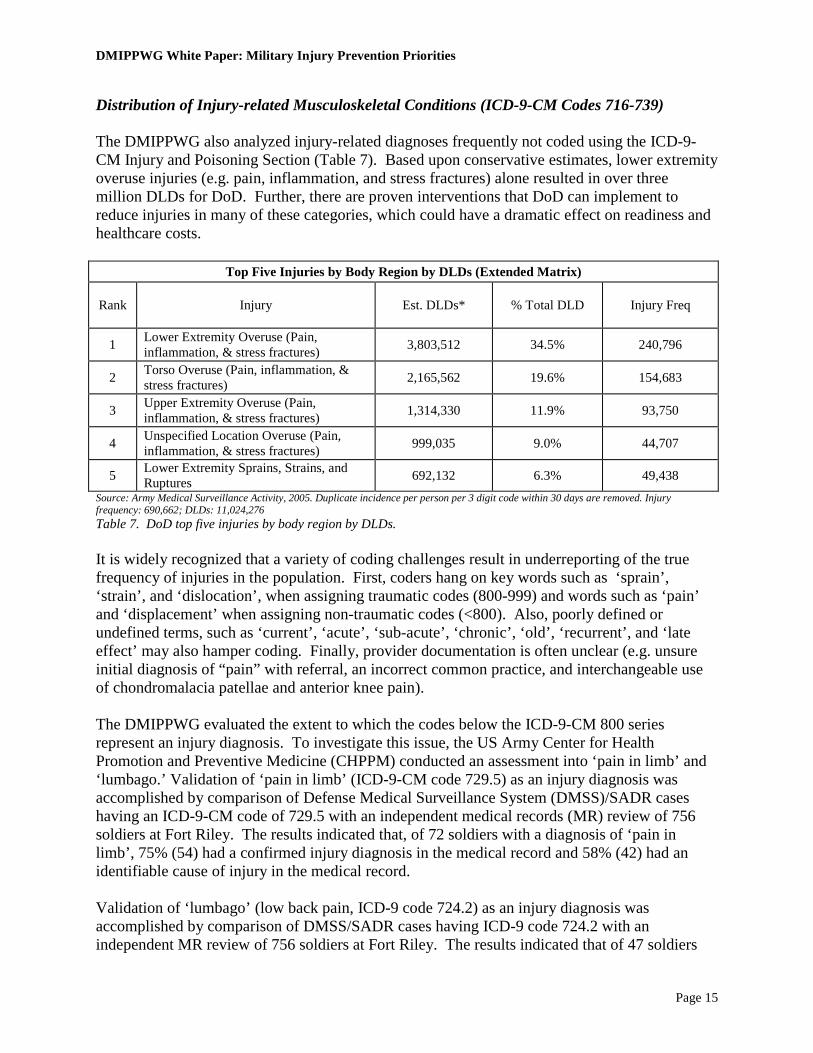
Distribution of Injury-related Musculoskeletal Conditions (ICD-9-CM Codes 716-739) The DMIPPWG also analyzed injury-related diagnoses frequently not coded using the ICD-9-CM Injury and Poisoning Section (Table 7). Based upon conservative estimates, lower extremity overuse injuries (e.g. pain, inflammation, and stress fractures) alone resulted in over three million DLDs for DoD. Further, there are proven interventions that DoD can implement to reduce injuries in many of these categories, which could have a dramatic effect on readiness and healthcare costs.
Top Five Injuries by Body Region by DLDs (Extended Matrix)
Rank Injury Est. DLDs* % Total DLD Injury Freq
1 Lower Extremity Overuse (Pain, inflammation, & stress fractures) 3,803,512 34.5% 240,796
2 Torso Overuse (Pain, inflammation, & stress fractures) 2,165,562 19.6% 154,683
3 Upper Extremity Overuse (Pain, inflammation, & stress fractures) 1,314,330 11.9% 93,750
4 Unspecified Location Overuse (Pain, inflammation, & stress fractures) 999,035 9.0% 44,707
5 Lower Extremity Sprains, Strains, and Ruptures 692,132 6.3% 49,438
Source: Army Medical Surveillance Activity, 2005. Duplicate incidence per person per 3 digit code within 30 days are removed. Injury frequency: 690,662; DLDs: 11,024,276 Table 7. DoD top five injuries by body region by DLDs. It is widely recognized that a variety of coding challenges result in underreporting of the true frequency of injuries in the population. First, coders hang on key words such as ‘sprain’, ‘strain’, and ‘dislocation’, when assigning traumatic codes (800-999) and words such as ‘pain’ and ‘displacement’ when assigning non-traumatic codes (<800). Also, poorly defined or undefined terms, such as ‘current’, ‘acute’, ‘sub-acute’, ‘chronic’, ‘old’, ‘recurrent’, and ‘late effect’ may also hamper coding. Finally, provider documentation is often unclear (e.g. unsure initial diagnosis of “pain” with referral, an incorrect common practice, and interchangeable use of chondromalacia patellae and anterior knee pain). The DMIPPWG evaluated the extent to which the codes below the ICD-9-CM 800 series represent an injury diagnosis. To investigate this issue, the US Army Center for Health Promotion and Preventive Medicine (CHPPM) conducted an assessment into ‘pain in limb’ and ‘lumbago.’ Validation of ‘pain in limb’ (ICD-9-CM code 729.5) as an injury diagnosis was accomplished by comparison of Defense Medical Surveillance System (DMSS)/SADR cases having an ICD-9-CM code of 729.5 with an independent medical records (MR) review of 756 soldiers at Fort Riley. The results indicated that, of 72 soldiers with a diagnosis of ‘pain in limb’, 75% (54) had a confirmed injury diagnosis in the medical record and 58% (42) had an identifiable cause of injury in the medical record. Validation of ‘lumbago’ (low back pain, ICD-9 code 724.2) as an injury diagnosis was accomplished by comparison of DMSS/SADR cases having ICD-9 code 724.2 with an independent MR review of 756 soldiers at Fort Riley. The results indicated that of 47 soldiers
DMIPPWG White Paper: Military Injury Prevention Priorities
Page 16
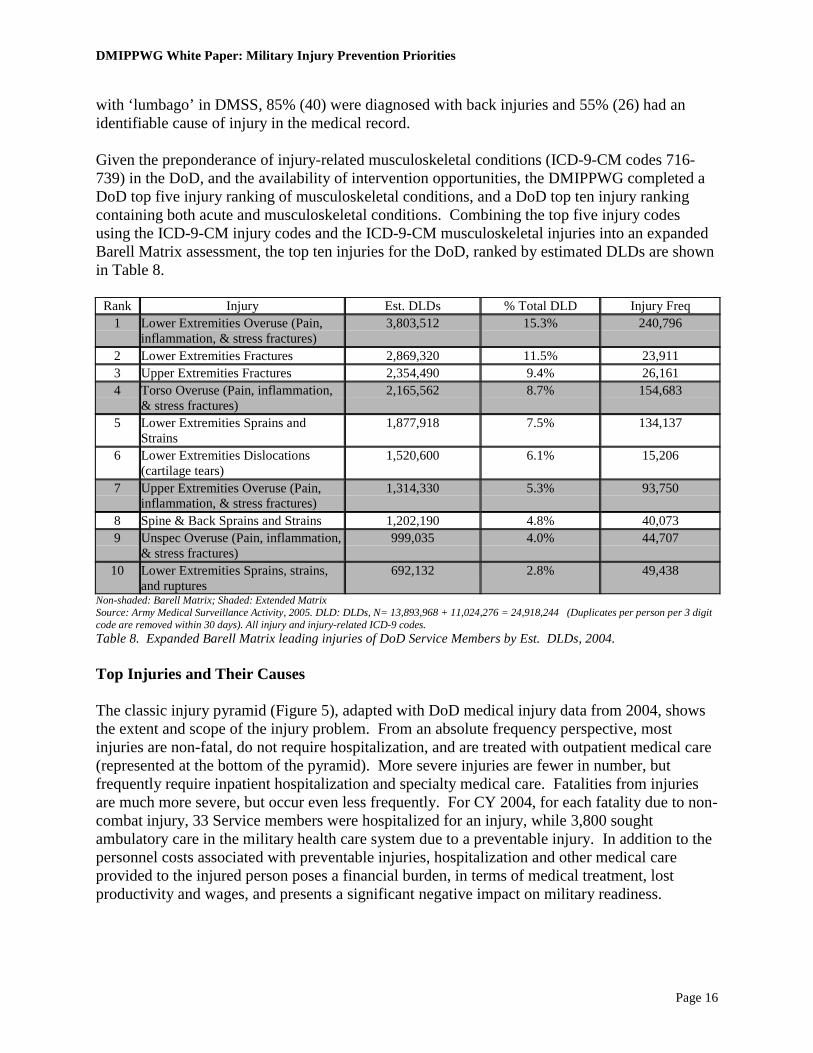
with ‘lumbago’ in DMSS, 85% (40) were diagnosed with back injuries and 55% (26) had an identifiable cause of injury in the medical record. Given the preponderance of injury-related musculoskeletal conditions (ICD-9-CM codes 716-739) in the DoD, and the availability of intervention opportunities, the DMIPPWG completed a DoD top five injury ranking of musculoskeletal conditions, and a DoD top ten injury ranking containing both acute and musculoskeletal conditions. Combining the top five injury codes using the ICD-9-CM injury codes and the ICD-9-CM musculoskeletal injuries into an expanded Barell Matrix assessment, the top ten injuries for the DoD, ranked by estimated DLDs are shown in Table 8.
Rank Injury Est. DLDs % Total DLD Injury Freq 1 Lower Extremities Overuse (Pain,
inflammation, & stress fractures) 3,803,512 15.3% 240,796
2 Lower Extremities Fractures 2,869,320 11.5% 23,911 3 Upper Extremities Fractures 2,354,490 9.4% 26,161 4 Torso Overuse (Pain, inflammation,
& stress fractures) 2,165,562 8.7% 154,683
5 Lower Extremities Sprains and Strains
1,877,918 7.5% 134,137
6 Lower Extremities Dislocations (cartilage tears)
1,520,600 6.1% 15,206
7 Upper Extremities Overuse (Pain, inflammation, & stress fractures)
1,314,330 5.3% 93,750
8 Spine & Back Sprains and Strains 1,202,190 4.8% 40,073 9 Unspec Overuse (Pain, inflammation,
& stress fractures) 999,035 4.0% 44,707
10 Lower Extremities Sprains, strains, and ruptures
692,132 2.8% 49,438
Non-shaded: Barell Matrix; Shaded: Extended Matrix Source: Army Medical Surveillance Activity, 2005. DLD: DLDs, N= 13,893,968 + 11,024,276 = 24,918,244 (Duplicates per person per 3 digit code are removed within 30 days). All injury and injury-related ICD-9 codes. Table 8. Expanded Barell Matrix leading injuries of DoD Service Members by Est. DLDs, 2004.
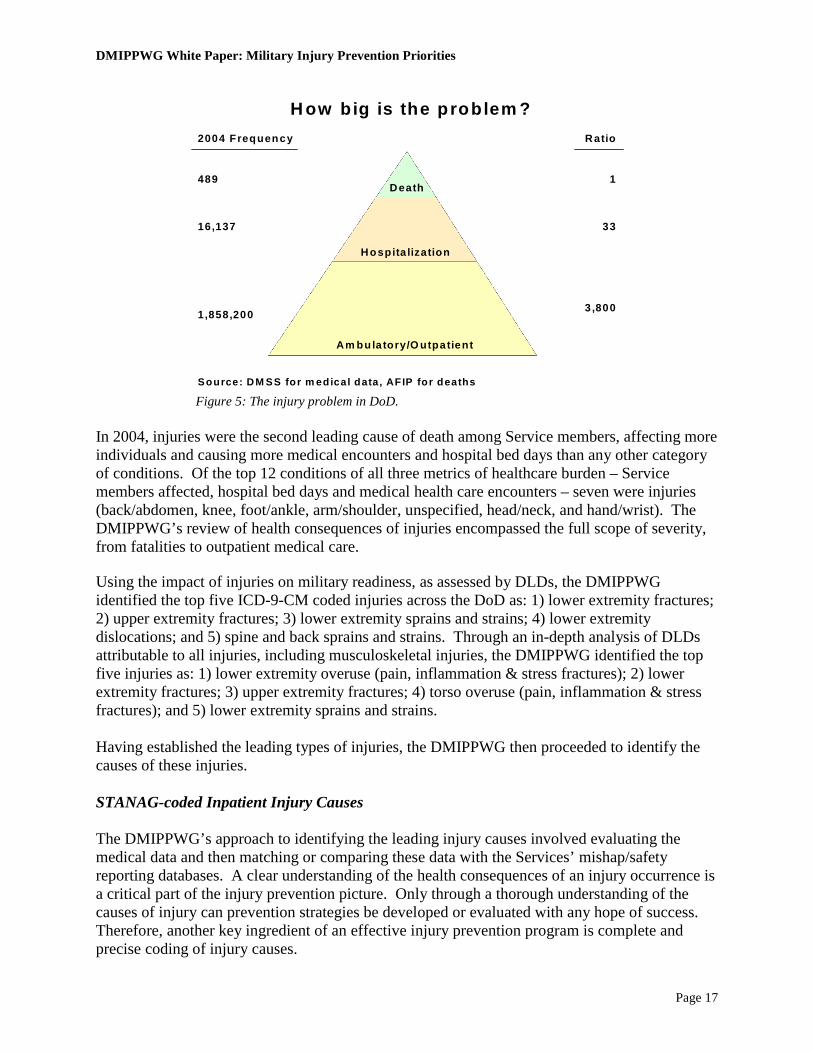
Top Injuries and Their Causes The classic injury pyramid (Figure 5), adapted with DoD medical injury data from 2004, shows the extent and scope of the injury problem. From an absolute frequency perspective, most injuries are non-fatal, do not require hospitalization, and are treated with outpatient medical care (represented at the bottom of the pyramid). More severe injuries are fewer in number, but frequently require inpatient hospitalization and specialty medical care. Fatalities from injuries are much more severe, but occur even less frequently. For CY 2004, for each fatality due to non-combat injury, 33 Service members were hospitalized for an injury, while 3,800 sought ambulatory care in the military health care system due to a preventable injury. In addition to the personnel costs associated with preventable injuries, hospitalization and other medical care provided to the injured person poses a financial burden, in terms of medical treatment, lost productivity and wages, and presents a significant negative impact on military readiness.
DMIPPWG White Paper: Military Injury Prevention Priorities
Page 17
Death
Hospita lization
Am bulatory/O utpatient
489
16,137
1,858,200
1
33
3 ,800
Source: DM SS for m edical data , AFIP for deaths
2004 Frequency Ratio
H ow big is the problem ?
Figure 5: The injury problem in DoD. In 2004, injuries were the second leading cause of death among Service members, affecting more individuals and causing more medical encounters and hospital bed days than any other category of conditions. Of the top 12 conditions of all three metrics of healthcare burden – Service members affected, hospital bed days and medical health care encounters – seven were injuries (back/abdomen, knee, foot/ankle, arm/shoulder, unspecified, head/neck, and hand/wrist). The DMIPPWG’s review of health consequences of injuries encompassed the full scope of severity, from fatalities to outpatient medical care. Using the impact of injuries on military readiness, as assessed by DLDs, the DMIPPWG identified the top five ICD-9-CM coded injuries across the DoD as: 1) lower extremity fractures; 2) upper extremity fractures; 3) lower extremity sprains and strains; 4) lower extremity dislocations; and 5) spine and back sprains and strains. Through an in-depth analysis of DLDs attributable to all injuries, including musculoskeletal injuries, the DMIPPWG identified the top five injuries as: 1) lower extremity overuse (pain, inflammation & stress fractures); 2) lower extremity fractures; 3) upper extremity fractures; 4) torso overuse (pain, inflammation & stress fractures); and 5) lower extremity sprains and strains. Having established the leading types of injuries, the DMIPPWG then proceeded to identify the causes of these injuries. STANAG-coded Inpatient Injury Causes The DMIPPWG’s approach to identifying the leading injury causes involved evaluating the medical data and then matching or comparing these data with the Services’ mishap/safety reporting databases. A clear understanding of the health consequences of an injury occurrence is a critical part of the injury prevention picture. Only through a thorough understanding of the causes of injury can prevention strategies be developed or evaluated with any hope of success. Therefore, another key ingredient of an effective injury prevention program is complete and precise coding of injury causes.

DMIPPWG White Paper: Military Injury Prevention Priorities
Page 18
DoD military treatment facilities (MTFs) use codes derived from the NATO STANAG 2050. The STANAG, “Statistical Classification of Disease, Injuries and Causes of Death”, was last promulgated in March 1989. The STANAG injury codes are used to identify the injury cause or activity at the time of the injury. An evaluation of the hospitalization injury STANAG cause code is beneficial in evaluating the leading cause of injuries among DoD Service members. The STANAG code system is simple, has a stable history of more than four decades, meets military needs specifically related to war-related injuries, and has relatively complete information about the cause of injuries (Amoroso et al., 2000). While satisfying the NATO aim to “standardize, for use of the NATO forces, the classification of diseases, injuries and causes of death”, the use of the STANAG cause coding to evaluate the leading causes of injury among military Service members has several weaknesses. First, the STANAG cause data, however accurate, is only captured on Service members hospitalized for their injuries. As discussed above, injuries resulting in hospitalization only account for a relatively small proportion of injuries among DoD personnel. Additionally, STANAG codes lack adequate specificity for non-war related injuries, have been reported to have a significant number of events coded as “other/unspecified/unknown,” have codes that are not mutually exclusive or exhaustive, and are not easily comparable to non-military injury data, which uses ICD coding. Despite its limitations, the STANAG-coded hospital data provides a source of potentially actionable injury information for DoD. This is especially true in deployment contexts and with injuries unique to the military. The STANAG coding system also includes an extensive array of sports coding injuries: 280 in total. The top 10 STANAG-coded causes of injuries resulting in hospitalization for DoD and Services are provided in Table 9. The most frequently reported causes of unintentional injuries were “falls and miscellaneous,” “land transport,” “complications of medical/surgical care,” and “guns, explosives, and related agents.” Falls accounted for the leading injury cause for the DoD and all Services except for the Marine Corps, for which they ranked second. The leading cause of injuries resulting in hospitalization for the Marine Corps in 2004 was guns and explosives. Caution must be applied in relying only on the STANAG cause codes for DoD leading injuries and their causes. First, the inherent weakness of missing and/or invalid codes is clearly evident. Missing and invalid codes represent the 15% of the DoD total of injury hospitalization for CY 2004. Additionally, while STANAG coding is comprehensive for sports-related injuries, other injury categories are more limited and may exhibit considerable overlap.

DMIPPWG White Paper: Military Injury Prevention Priorities
Page 19
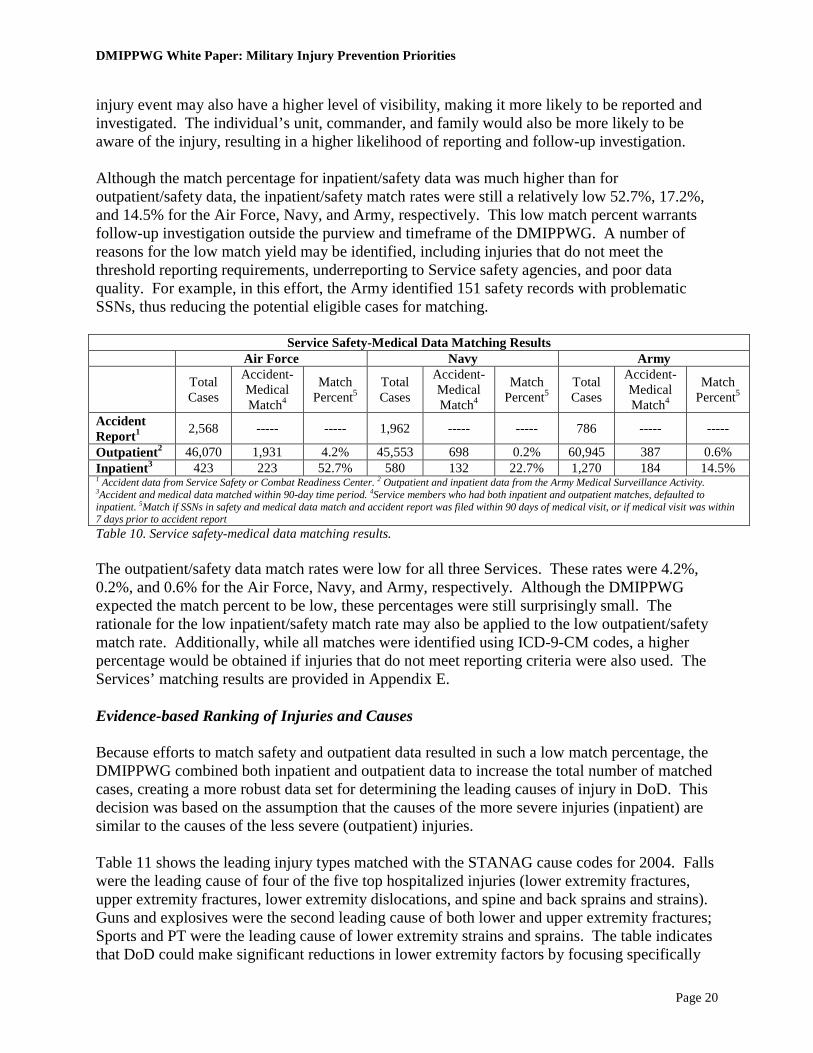
Table 9. DoD and Services top 10 causes of inpatient injury, by STANAG Coding, 2004. Data: AMSA. Medical-Safety Data Matching Because there is no single authoritative source of actionable injury or mishap information for DoD, the DMIPPWG developed a process that involved merging the Service safety/accident with medical data to identify the principal causes of the leading injury types receiving medical care (outpatient or inpatient). The first objective was to link CY 2004 safety/mishap/accident data from the Service safety and combat readiness centers with CY 2004 medical records data (outpatient and inpatient ICD-9-CM-coded injury cases) from the SIDR and SADR by Social Security Numbers (SSNs). The medical data were limited to the top five types of injuries (e.g. lower extremity fractures, upper extremity fractures, lower extremity sprains and strains, etc.). Specifically, the goal was to merge Service safety data with Service medical treatment data in order to determine the leading cross-cutting activities and causes associated with the top five types of injuries (e.g. lower extremity fractures, upper extremity fractures, lower extremity sprains and strains, etc.). The Service medical and safety subject-matter experts (SMEs) collaboratively conducted the data matching. The Marine Corps data was not matched due to lack of SSNs in the safety/mishap database for CY 2004. The Service data matching results are shown in Table 10. Consistent with expectations, the match rate between inpatient medical data and safety data was higher than the match rate of the outpatient and safety data. This may be attributed to the fact that injury hospitalizations frequently result in lost duty days and, therefore, trigger mandatory reporting. The hospitalizing
Injury Hospitalizations by Causal Agent, Active Duty US Armed Forces, CY04 DoD Army Navy Air Force Marine Corps
Cause N % N % N % N % N %
Unintentional Falls and misc. 1,988 17.6 1,187 20.7 303 16.4 227 15.7 271 12.0 Land transport 1,363 12.1 668 11.6 287 15.5 252 17.4 156 6.9 Complications of med/surg care 1,311 11.6 543 9.5 303 16.4 212 14.6 253 11.2 Guns, explosives (includes accidents during war) 1,043 9.2 574 10.0 27 1.5 11 0.8 431 19.1 Athletics 733 6.5 360 6.3 143 7.7 132 9.1 98 4.3 Poisons and fire 360 3.2 204 3.6 57 3.1 45 3.1 54 2.4 Machinery, tools 359 3.2 198 3.4 61 3.3 46 3.2 54 2.4 Environmental 267 2.4 174 3.0 20 1.1 15 1.0 58 2.6 Air transport 263 2.3 219 3.8 13 0.7 18 1.2 13 0.6 Water transport 33 0.3 7 0.1 19 1.0 2 0.1 5 0.2 Intentional Battle casualty 1,138 10.1 687 12.0 44 2.4 16 1.1 391 17.3 Self-inflicted 314 2.8 138 2.4 60 3.2 40 2.8 76 3.4 Non-battle, inflicted by other (e.g., assault) 414 3.7 254 4.4 35 1.9 28 1.9 97 4.3 Missing/invalid code 1,714 15.2 529 9.2 477 25.8 404 27.9 304 13.4 11,300 100.0 5,742 100.0 1,849 100.0 1,448 100.0 2,261 100.0
DMIPPWG White Paper: Military Injury Prevention Priorities
Page 20
injury event may also have a higher level of visibility, making it more likely to be reported and investigated. The individual’s unit, commander, and family would also be more likely to be aware of the injury, resulting in a higher likelihood of reporting and follow-up investigation. Although the match percentage for inpatient/safety data was much higher than for outpatient/safety data, the inpatient/safety match rates were still a relatively low 52.7%, 17.2%, and 14.5% for the Air Force, Navy, and Army, respectively. This low match percent warrants follow-up investigation outside the purview and timeframe of the DMIPPWG. A number of reasons for the low match yield may be identified, including injuries that do not meet the threshold reporting requirements, underreporting to Service safety agencies, and poor data quality. For example, in this effort, the Army identified 151 safety records with problematic SSNs, thus reducing the potential eligible cases for matching.
Service Safety-Medical Data Matching Results Air Force Navy Army Total
Cases
Accident-Medical Match4
Match Percent5
Total Cases
Accident-Medical Match4
Match Percent5
Total Cases
Accident-Medical Match4
Match Percent5
Accident Report1 2,568 ----- ----- 1,962 ----- ----- 786 ----- -----
Outpatient2 46,070 1,931 4.2% 45,553 698 0.2% 60,945 387 0.6% Inpatient3 423 223 52.7% 580 132 22.7% 1,270 184 14.5% 1 Accident data from Service Safety or Combat Readiness Center. 2 Outpatient and inpatient data from the Army Medical Surveillance Activity. 3Accident and medical data matched within 90-day time period. 4Service members who had both inpatient and outpatient matches, defaulted to inpatient. 5Match if SSNs in safety and medical data match and accident report was filed within 90 days of medical visit, or if medical visit was within 7 days prior to accident report Table 10. Service safety-medical data matching results. The outpatient/safety data match rates were low for all three Services. These rates were 4.2%, 0.2%, and 0.6% for the Air Force, Navy, and Army, respectively. Although the DMIPPWG expected the match percent to be low, these percentages were still surprisingly small. The rationale for the low inpatient/safety match rate may also be applied to the low outpatient/safety match rate. Additionally, while all matches were identified using ICD-9-CM codes, a higher percentage would be obtained if injuries that do not meet reporting criteria were also used. The Services’ matching results are provided in Appendix E. Evidence-based Ranking of Injuries and Causes Because efforts to match safety and outpatient data resulted in such a low match percentage, the DMIPPWG combined both inpatient and outpatient data to increase the total number of matched cases, creating a more robust data set for determining the leading causes of injury in DoD. This decision was based on the assumption that the causes of the more severe injuries (inpatient) are similar to the causes of the less severe (outpatient) injuries. Table 11 shows the leading injury types matched with the STANAG cause codes for 2004. Falls were the leading cause of four of the five top hospitalized injuries (lower extremity fractures, upper extremity fractures, lower extremity dislocations, and spine and back sprains and strains). Guns and explosives were the second leading cause of both lower and upper extremity fractures; Sports and PT were the leading cause of lower extremity strains and sprains. The table indicates that DoD could make significant reductions in lower extremity factors by focusing specifically

DMIPPWG White Paper: Military Injury Prevention Priorities
Page 21
on four causes – falls, guns and explosives, parachuting, and motor vehicle accidents. Mitigation efforts to reduce lower extremity sprains and strains would need to focus on the three areas of sports and physical training; falls; and twists, turns, and slips to make the most significant reductions.
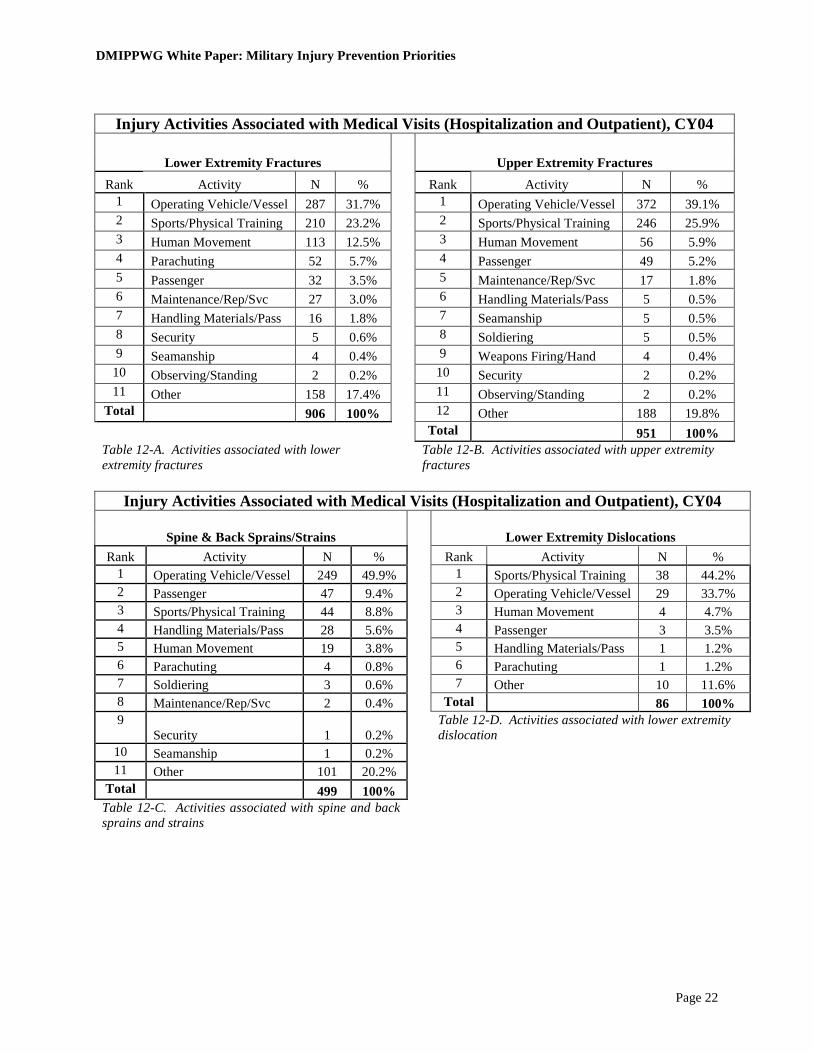
Table 11. DoD leading causes of injury resulting in hospitalization of Service members. Tables 12-A through 12-E show the leading causes of the top five DoD injury types associated with both outpatient and inpatient medical visits for CY 2004 (Service data is featured in Appendix F). Operating a motor vehicle or vessel is the leading activity associated with lower extremity fractures, upper extremity fractures and spine and back sprains and strains injury types, while sports and physical training leads other activities for lower extremity dislocations and lower extremity sprains and strains. Further, sports and physical training is the number one, two, or three activity associated with each of the five leading injury types for both inpatient and outpatient cases across DoD. Another activity frequently associated with injuries across the DoD is human movement, which is consistently the third leading activity associated with injury categories. Only for spine and back injuries does human movement fall to the fifth leading activity. There is a relative consistency in the coding of sports and physical activity as identified by STANAG cause-coding and the Service Safety and Combat Readiness Centers data matching results. Based on this assessment of the available information within the DoD, mitigation efforts focused on sports and physical training would have the greatest impact on military readiness.
DoD: Top 10 Causes1
for Leading Types of Injuries, CY04
1 Causes of injury from hospitalization STANAG codes, Defense Medical Surveillance Activity2
198 (12.6)0 0098100 Guns & Explosives
115 (7.3)0 5415244 Twist/turn/run/slip (w/o fall) 112 (7.1)4 103392 Parachuting
169 (10.7)4 876684 Non - military vehicle (POV)
124 (7.9)5 863471 Missing STANAG 1,574 (100.0)28 29172447736 Total
33 (2.1)1 53915 Other 2 28 (1.8)1 11916 Non - traffic accident (POV & mil.) 43 (2.7)2 111524 Military vehicle accident 46 (2.9)0 102718 Tools & Machinery
248 (15.8)1 128134066 Sports & PT 458 (29.1)10 7523144206 Falls
Total (% of total)
Spine&Back Sprain/Strain
LE Sprain/Strain
LE Dislocations
UE Fractures
LE Fractures
Other includes: Lift/push/pull, marching/drilling, air accident, water accident poisons, environment LE = Lower Extremity; UE = Upper Extremity
of Hospitalizations
DMIPPWG White Paper: Military Injury Prevention Priorities
Page 22
Injury Activities Associated with Medical Visits (Hospitalization and Outpatient), CY04
Lower Extremity Fractures Upper Extremity Fractures
Rank Activity N % Rank Activity N % 1 Operating Vehicle/Vessel 287 31.7% 1 Operating Vehicle/Vessel 372 39.1% 2 Sports/Physical Training 210 23.2% 2 Sports/Physical Training 246 25.9% 3 Human Movement 113 12.5% 3 Human Movement 56 5.9% 4 Parachuting 52 5.7% 4 Passenger 49 5.2% 5 Passenger 32 3.5% 5 Maintenance/Rep/Svc 17 1.8% 6 Maintenance/Rep/Svc 27 3.0% 6 Handling Materials/Pass 5 0.5% 7 Handling Materials/Pass 16 1.8% 7 Seamanship 5 0.5% 8 Security 5 0.6% 8 Soldiering 5 0.5% 9 Seamanship 4 0.4% 9 Weapons Firing/Hand 4 0.4%
10 Observing/Standing 2 0.2% 10 Security 2 0.2% 11 Other 158 17.4% 11 Observing/Standing 2 0.2%
Total 906 100% 12 Other 188 19.8% Total 951 100% Table 12-A. Activities associated with lower extremity fractures
Table 12-B. Activities associated with upper extremity fractures
Injury Activities Associated with Medical Visits (Hospitalization and Outpatient), CY04
Spine & Back Sprains/Strains Lower Extremity Dislocations
Rank Activity N % Rank Activity N % 1 Operating Vehicle/Vessel 249 49.9% 1 Sports/Physical Training 38 44.2% 2 Passenger 47 9.4% 2 Operating Vehicle/Vessel 29 33.7% 3 Sports/Physical Training 44 8.8% 3 Human Movement 4 4.7% 4 Handling Materials/Pass 28 5.6% 4 Passenger 3 3.5% 5 Human Movement 19 3.8% 5 Handling Materials/Pass 1 1.2% 6 Parachuting 4 0.8% 6 Parachuting 1 1.2% 7 Soldiering 3 0.6% 7 Other 10 11.6% 8 Maintenance/Rep/Svc 2 0.4% Total 86 100% 9
Security 1 0.2% Table 12-D. Activities associated with lower extremity dislocation
10 Seamanship 1 0.2% 11 Other 101 20.2%
Total 499 100% Table 12-C. Activities associated with spine and back sprains and strains

DMIPPWG White Paper: Military Injury Prevention Priorities
Page 23
Injury Activities Associated with Medical Visits
(Hospitalization and Outpatient), CY04
Lower Extremity Sprains/Strains Rank Activity N %
1 Sports/Physical Training 356 39.6% 2 Operating Vehicle/Vessel 182 20.3% 3 Human Movement 61 6.8% 4 Passenger 21 2.3% 5 Parachuting 15 1.7% 6 Maintenance/Rep/Svc 5 0.6% 7 Handling Materials/Pass 4 0.4% 8 Soldiering 3 0.3% 9 Security 2 0.2%
10 Weapons Firing/Hand 1 0.1% 11 Other 248 27.6%
Total 898 100% Table 12-E. Activities associated with lower extremity sprains and strains
Prioritized Injury Mitigation/Prevention Program and Policies Mitigation Prioritization The last task of the DMIPPWG was the recommendation of prioritized mitigation efforts. These recommendations fall into two categories: cause-specific program recommendations and DoD enterprise recommendations. Both types of recommendations are critical to further progress in injury mitigation. This section of the white paper discusses the DMIPPWG’s recommendations on specific injury cause mitigation. The DMIPPWG adopted US Army-developed criteria to evaluate and prioritize potential intervention opportunities. In the assessment process, evaluation questions are developed, with point values assigned for each response. The reviewer then evaluates each injury cause and potential intervention considering items such as magnitude of the problem, consistency with mission success, degree of concern with the problem, and proven prevention strategies. This systematic and rigorous process is aimed at determining the intervention uptake, adoption, and applicability; ease or difficulty of implementation, sustainability, complexity, needs for training and technical assistance; and compatibility with the DoD community and environments. The reviewer then sums the points assigned for each response. The highest possible score is 40. The prioritization criteria score sheet is featured in Appendix G. DMIPPWG representatives ranked the leading injuries from their Services’ perspectives. The individual scores were then summed, and an average score calculated. Table 13 shows the Service reviewers’ average scores and rankings of prevention priorities. Based on this prevention prioritization process, each Service identified a different number one priority. The Army ranked sports as their fourth prevention priority, and ranked physical training as the number one priority.

DMIPPWG White Paper: Military Injury Prevention Priorities
Page 24
Air Force Army Marine Corps Navy Injury Prevention Priorities
Avg Score
(max=40) Rank Avg Score
(max=40) Rank Avg
Score (max=40)
Rank
Avg Score
(max=40)
Rank
Physical Training and Sports* 29.2 2 PT - 34.0
Sports - 28.4 PT- 1
Sports - 4 28.5 2 27 2
Non-military vehicle accident (POV) 32.0 1 27.2 5 24.25 4 26 3
Falls 26.3 3 30.6 3 28 3 28 1 Twist/turn (w/o fall) 21.8 6 24.6 8 20.7 7 19.25 6 Non-traffic (POV & Mil) 20.3 7 19.4 10 17.75 8 19 7
Parachuting 20.2 8 31.8 2 Not ranked
Not ranked 16 8
Guns and Explosives 24.2 4 26.2 6 36.25 1 22.75 4 Military vehicle 23.0 5 26.2 6 23.5 5 Not
ranked Not
ranked Tools & Machines Not
ranked Not
ranked 21.0 9 21.5 6 21.75 5
* The Army Ranked Sports separate from Physical Training; the other Services provided a combined score Table 13. Prevention Priorities Recommended Interventions–Mean Scores and Rankings. The Services’ SMEs independently ranked sports and physical training as their second leading intervention priority. From a DoD perspective, resources, command emphasis, and close monitoring and evaluation may be leveraged towards a significant increase in the DoD force readiness posture. Data from successful intervention trials indicates that short-term success may be achieved by focusing on physical training, operational activity and training, and sports. This focus should yield a significant reduction in lower extremity fractures and other lower extremity injuries. Intervention trials have demonstrated that commanders at all levels should actively avoid combinations of physical and military training that exceed physiologic thresholds of overtraining, as this results in higher injury rates and does not improve fitness. A standardized, gradual, systematic progression of running distance and speed beginning with lower mileage and intensity could be employed, especially for those just starting or re-initiating a physical training program (e.g. new recruits, or Service members returning to physical training after a week of non-training). Physical training injury prevention programs should be structured to target those Service members at the highest risk of injury by ensuring that the running mileage is appropriate for their fitness level. Some long distance runs should be replaced with interval training that increases speed and stamina more rapidly than distance running, while limiting total miles run. The body’s need for a physiologic training overload should be balanced with the need for recovery and rebuilding by coordinating military and physical training. Lower intensity, task-specific, dynamic activities should be performed to warm-up prior to more intense physical training (e.g. walking and slow jogging in preparation for running). Research suggests that the gradual introduction of running and the reduction of running mileage can

DMIPPWG White Paper: Military Injury Prevention Priorities
Page 25
reduce injury incidence. A progressive unit-based running program that reduces the total amount of running and that systematically and progressively increases running mileage does not compromise necessary improvements in physical fitness. Incorporating additional body movement skills training and strength and agility conditioning in physical training sessions has also been demonstrated to reduce injury risk. Physical training should balance its emphasis on cardiovascular stamina with strength and agility by providing strength and agility conditioning on alternate days from running. This so-called “cross-training” is a standard training technique in the athletic world that permits more conditioning activity without overtraining one particular muscle group or system. Consistent adherence to a more balanced and standardized approach to physical training will also maximize PT time and develop the optimal combination of strength, coordination, agility, power, and stamina in future war fighters. Semi-rigid ankle braces should be made available for use by individuals at high risk for re-injury (i.e. those with history of previous ankle sprains) and for others during high-risk activities. One of the most significant risk factors for sustaining an ankle sprain injury of any grade is the existence of a similar type of sprain in the past medical history. In other words, once an individual has sustained an ankle sprain injury, the risks of re-injury to that same ankle are extremely high regardless of the mechanism of the initial injury. Individuals with a past history of moderate to severe ankle sprain should wear ankle braces when engaging in activities where ankle injuries are likely. Generally these activities include: training on uneven or unpredictable surfaces (e.g. rugged terrain, night ground operations, movement through heavy undergrowth, airborne operations, etc.) and sports or sport-like activities that require sudden changes in direction and that may involve collision or contact with opponents feet or a ball (e.g. obstacle course, basketball, volleyball, soccer, etc.). Service Mitigation Initiatives The Services, already aware of their leading injury challenges, have initiated a variety of Service-specific mitigation efforts. While not exhaustive, several of these efforts, which may have potential applicability across DoD with adequate funding and command support, are highlighted below. The Air Force has purchased $30K (Air Force-funded) in ankle braces to equip the male intramural basketball teams at Fairchild and Lackland AFBs (the bases with the highest rates of ankle injuries) to determine logistic issues prior to broader distribution. Ankle injuries, associated with basketball (26%), are the number one source of lost workdays for the Air Force. This effort was initiated 1 October 2005. In another effort focused on reducing ankle injuries, the Air Force has mandated breakaway bases at all Air Force softball fields. The Air Force has also initiated experimental use of special non-slip footwear for personnel working extreme surfaces in multiple locations as part of an effort targeting on-duty injuries. This mitigation program focuses on the reduction of fracture and trauma injuries from slips, trips, and falls attributable to walking on ice/slippery surfaces (78%). This trial will be conducted from November 2005 through February 2006.
The Marine Corps has initiated a Sports Medicine Injury Prevention (SMIP) program, which focuses on a musculoskeletal injury prevention, assessment, and treatment program using
DMIPPWG White Paper: Military Injury Prevention Priorities
Page 26
Certified Athletic Trainers (ATC) integrated into the recruit-training environment at the battalion level. The program was initiated at Parris Island in June 2003. A mitigation program addressing training injuries in the Marine Corps is the Physical Training Instructor Course. It is administered six times per year and targets drill instructors, who are pivotal in the running of physical training sessions during recruit training. This program addresses general injury prevention targeted at entry-level training.
The Navy initiated a Fitness Board of Advisors (FITBOA) in September 2005. This program was established by the Chief of Naval Personnel to develop and implement a Navy-wide physical fitness strategy and to recommend change management strategies to Navy leadership. The objective is the creation of a culture of fitness, focusing on safe and effective physical conditioning practices and injury prevention. Another Navy initiative is the establishment of Sports Medicine and Reconditioning Team (SMART) Centers. These centers seamlessly integrate medical and line initiatives in the Navy and Marine Corps. Both the Navy SMART Centers and the Marine Corps SMIP programs work collaboratively to strengthen Navy fleet operational support. The program specializes on musculoskeletal injury prevention and care.
The Army has initiated an Injury Education program developed by the Training and Doctrine Command (TRADOC) Surgeon's Office. This program focuses specifically on the prevention of physical training injuries. In addition, the TRADOC Standardized PT Program began in February 2004. This effort focuses on the reduction of Army overuse injuries. The Army has also implemented new surveillance efforts, including the Installation Injury Report (IIR), Training-Related Injury Report (TRIR) and Physical Training and Rehabilitation Program Surveillance System (PTRPSS). These surveillance efforts will increase the level of understanding of injury occurrence and mitigation efforts throughout the Army. These efforts are just a few of the possible high-yield intervention recommendations. Several of these (e.g. break away softball bases) could be evaluated for consideration across the DoD. The Services also have a number of other interventions in various stages of development and implementation. Support at the DoD level, including adequate funding and resources, could greatly enhance the effectiveness of these intervention programs. Injury Research Efforts
Prioritization and funding for injury research should focus on effective interventions, especially those with credible evidence of efficacy based on rigorous scientific study, and on the leading injury problems or causes.
The DMIPPWG conducted a data call requesting Service information on research efforts, including clinical studies focused on or related to injuries. The Service responses to this data call are located in Appendix H. Research is critical to any effective injury prevention effort, as research builds the scientific base for the prevention and control of injuries, disabilities, and deaths. In an environment of dwindling resources, ensuring a DoD research agenda priority to evaluate the most effective methods for translating research findings into public health programs and policies is essential to preserving the well being of Service members and achieving operational effectiveness.
DMIPPWG White Paper: Military Injury Prevention Priorities
Page 27
The purpose of evaluating the current injury research efforts was to identify potential gaps and opportunities for focused research on the top injuries and their causes as identified by the DMIPPWG’s efforts. The research ranged from basic-level research to epidemiological field assessments. The efforts cover a full range of injury-related research and included both hostile and non-hostile causes. The information provided by the Services on current injury research was compared with the top injuries identified in this effort. For DoD, 30 (13.9%) of the 216 total injury-related studies were identified as relevant to the DoD top five causes for leading types of injuries. The Services reported a wide range of research specifically focused on the top five causes of injuries in each Service identified by the DMIPPWG. The Army identified 14 efforts relevant to the top five causes for leading types of injuries for the Army. One of these research projects, entitled “Physical Training Interventions to Enhance Military Task Performance and Reduce Musculoskeletal Injuries,” evaluates the development of biomechanical- and physiology-based physical training and maintenance strategies to enhance military task performance and reduce physical training injuries. Another research project involved the development of innovative approaches to preventing stress fracture injuries in new recruits. The Air Force reported four research projects relevant to the top five causes of the leading injury types for the Air Force. One of the Air Force’s research projects is a retrospective epidemiological study evaluating disability within the Air Force Service members through the analyses of Defense Manpower Data Center (DMDC) and Military Health System (MHS) Mart (M2) data. This effort will focus on falls, twists/turns/runs/slips, and non-traffic motor-vehicle accidents, among others. A second research effort being conducted by the Air Force Research Laboratory (AFRL) is an epidemiology study entitled “Root Cause Analysis.” The goal of this effort is to describe the determinants of injuries resulting in a disability evaluation. The Navy responded with six efforts focused on the top five causes for leading types of injuries for the Navy. One of these is the “Development of a Safe and Effective Exercise Training Program for Navy Recruits,” which is evaluating the risk factors for stress fracture and chronic musculoskeletal injury among new recruits. A second is an effort focused on risk factors and interventions to reduce stress fractures and other musculoskeletal injuries among Basic Underwater Demolition/SEAL (BUD/S) trainees, which is looking at anatomical metrics and health behaviors risk factors associated with stress fractures. Another interesting research project is entitled “Risk Factors and Interventions to Reduce Stress Fracture and other Musculoskeletal Injury among Young Active Populations.” This effort will greatly help improve the basic knowledge of musculoskeletal injury prevention through the discovery of injury risk factors and successful injury reduction interventions in trainees. The Marine Corps provided information on six research efforts focused on the top five causes for their leading types of injuries. One of these efforts is an evaluation of all SMART Centers to determine the effect of SMART Centers on referral patterns and load demands at neighboring medical clinics, specifically focused on the number of DLDs of injured Marines and on re-injury rates for musculoskeletal injury. A second research project focuses on stress fracture reduction in male recruit training, specifically evaluating risk factors for stress fracture and chronic musculoskeletal injury. In parallel, the Marine Corps is evaluating first-term outcomes associated with lower extremity injury in female recruits. This project is a historical prospective study assessing the impact of lower extremity musculoskeletal injuries suffered during recruit

DMIPPWG White Paper: Military Injury Prevention Priorities
Page 28
training and of stress fractures on first-term enlistment hospitalizations and attrition of female recruits who have matriculated. DISCUSSION/SUMMARY
The DMIPPWG’s public health approach to answering the question, “What are the leading injuries and their causes in the DoD?”, provides further insight into the leading injury types and their causes among military Service members. Starting with the consideration of lethal injury, the group proceeded to set priorities for injury prevention efforts based upon both the scope and nature of inpatient and outpatient injuries. Using an estimated limited duty day calculation, the DMIPPWG established the net effect of each injury on military readiness as the metric in prioritizing injuries in the DoD.
While critically important, previous prevention efforts have narrowly targeted particular causes of injury with high lethality (e.g. Class A mishaps) to the exclusion of the more common, non-fatal injuries. The efforts of the DMIPPWG reveal that deaths are a relatively limited component of the overall injury problem across the DoD and provide a methodology and initial ranking of the severity of the non-fatal injuries and their causes among military personnel. Non-fatal injuries treated in MTFs result in substantial morbidity and significant costs in terms of hospitalization, short- and long-term health effects, and reduced military readiness. Hence, prevention efforts should focus not only on external causes of injury that are fatal, but also on those non-fatal injuries associated with particularly high medical readiness and health care costs. Towards this end, the DMIPPWG accomplished the following:
1. Organized a tri-Service multi-disciplinary epidemiology, safety, occupational medicine, and policy effort;
2. Conducted a comprehensive public health assessment – from deaths to outpatient visits – to
identify and characterize the scope of injury occurrence in DoD; 3. Developed a prioritization methodology comprised of public health, scientific, and military
specific components; 4. Assessed the full scope of injuries in the military population, including musculoskeletal
injuries; and 5. Developed DoD-level criteria and an evaluation process for prioritizing injury programs and
policies. The information presented here provides valuable information to focus DoD intervention efforts on factors leading to non-fatal injuries requiring medical treatment. This information has significant value when used for setting priorities to determine where limited resources should be allocated to reduce injuries and evaluate the impact of injuries on military Service members. Using available information from medical and Service safety databases and the Barell Injury Diagnosis Matrix, the DMIPPWG determined the top ten injuries across the DoD military Service member population, which accounted for approximately 24,918,244 DLDs, an indicator
DMIPPWG White Paper: Military Injury Prevention Priorities
Page 29
of and surrogate for costs to military readiness. The top ten injuries, ranked by the number of DLDs, were identified as: 1. Lower extremity overuse (pain, inflammation, and stress fractures); 2. Lower extremity fractures; 3. Upper extremity fracture; 4. Torso overuse (pain, inflammation, and stress fractures); 5. Lower extremity sprains and strains; 6. Lower extremity dislocations (cartilage tears); 7. Upper extremity overuse (pain, inflammation, and stress fractures); 8. Spine and back sprains and strains; 9. Unspecified overuse (pain, inflammation, and stress fractures); and 10. Lower extremity sprains, strains, and ruptures. Operating a motor vehicle or vessel was found to be the leading activity associated with lower extremity fractures, upper extremity fractures, and spine and back sprains and strains injury types, while sports and physical training lead all other activities for lower extremity dislocations and lower extremity sprains and strains. Further, sports/physical training was identified as the number one, two, or three activity associated with each of the five leading injury types for both inpatient and outpatient cases across DoD. Another activity frequently associated with injuries across DoD was human movement, which was consistently found to be the third leading activity associated with injury categories. Only for spine and back injuries did human movement fall to the fifth leading activity. Sports and physical training and falls were found to be primary causes of hospitalization for injuries. Based upon the aforementioned findings, the DMIPPWG recommends that the greatest impact on reducing injuries across the DoD may be achieved via efforts focused initially on mitigation of sports and physical training related injuries, and then on reducing falls. Examples of effective programs are provided earlier in the white paper. Additionally, the DMIPPWG endorses the recommendations of the Joint Services Physical Training Injury Prevention Work Group (Appendix I).
Several limitations must be considered in interpreting these findings. First, the study time period of one-year (CY 2004) provides a “snap shot” of injury occurrence in the DoD. This timeframe appears to be representative of the general injury trends; an analysis was not conducted, however, to assess these trends and validate this assumption. As the DoD operational tempo and population changes (e.g. increased activation of Guard and Reserve components), it is possible that injury frequency and type may also change. Second, the determination the leading injury causes was based on the relatively small proportion of the data for which there was a medical and safety data match. Although the present findings are consistent with prior, smaller efforts to assess causes, the sample may not be representative of the causes of the leading injuries in the DoD.
Finally, it is critically important to note that difficulties in data accessibility and quality presented a major challenge in developing this report; these shortcomings have been previously identified to the DSOC and leadership. Until these issues are addressed, knowledge of the true impact of future injury reduction efforts within DoD will be incomplete at best. Given the

DMIPPWG White Paper: Military Injury Prevention Priorities
Page 30
incomplete, independent, and immature nature of the existing data systems, there is an inherent degree of uncertainty in any assessment or measure of success or failure in mitigation strategies. Only through a robust military population-based surveillance program for fatal and non-fatal injuries and thorough investigation and documentation of non-fatal injuries will the military Service community adequately address the injury problem.
PRIORITIZED OPPORTUNITIES FOR IMPROVEMENT Data and Data System Issues 1. Harmonize Service Safety data systems to ensure comparable injury cause data for greater
ease and accuracy of analysis.
a. Charter a work group of DoD SMEs to develop a standardized set of injury/mishap reporting data elements and definitions. These core elements should be incorporated into Services automated systems and compatible with the Defense Safety Enterprise System (DSES).
b. Ensure any system or set of systems allows for the efficient capability to evaluate existing
personnel, medical, and safety surveillance data (e.g. deaths, disabilities, hospitalizations, outpatient visits, medical evacuations, safety/accident data, and other) to identify the injury problems with the greatest impact on health and readiness for each of the Services and across DoD.
2. Investigate opportunities to increase accuracy and capture of data elements essential to injury
prevention from medical data systems. New efforts such as the Medical Affirmative Claims (MAC) enhancement program may provide more robust capabilities than are currently available and should be thoroughly investigated.
3. Investigate opportunities to increase compliance with mishap reporting directives by linking
the medical treatment event with notification of the unit safety organization. Because mishap reporting will always provide the best injury cause information and medical treatment data provides the best injury type information, linking these two reporting events is vital to measuring the true impact of any intervention effort.
Process Recommendations
1. Institutionalize a periodic and systematic process to identify injury priorities described in this paper as a model using the Barell matrix in conjunction with existing medical surveillance, disability, inpatient, and outpatient to assess injury prevention priorities and focus resources on the most preventable injuries that produce the greatest impact on force readiness.
2. Evaluate injury- and safety-related programs, policies, and research agendas using criteria that prioritize the problem within DoD. These criteria should include the magnitude of the problem, the necessary infrastructure to support such a program, and the effect of the program on military readiness and the individual Service member.
DMIPPWG White Paper: Military Injury Prevention Priorities
Page 31
3. Prioritize injury prevention programs using a methodology similar to the approach outlined in this paper, which applies a set of criteria enabling an objective evaluation of proposed prevention initiatives based on factors that contribute to the eventual success or failure of programs.
4. Ensure intervention package materials can be used across DoD by addressing issues of
compatibility; ease or difficulty of use of materials; training, planning and implementation challenges; cost-benefit ratios; adaptability; and the effect on the military mission.
5. Charter a work group to standardize reporting requirements, and then to revise DoDD
6055.7, “Mishap Investigation, Reporting and Recordkeeping” to clarify reporting requirements.
6. Use an existing or newly-formed venue to better coordinate evidence-based assessment of
DoD injuries, causes and mitigation efforts, and to share valuable information throughout DoD. The effort should:
a. Have multidisciplinary (Safety, Epidemiology, Occupational Health, Behavioral Health, and Policy) membership;
b. Adopt the evidence-based process described in this report;
c. Enhance dissemination of effective interventions for reducing injuries; and
d. Periodically report to the DSOC.
7. Standardize the evaluation of musculoskeletal injuries and their causes as part of Service and DoD injury safety programs.
8. Develop and evaluate the usability of an intervention package for adopting effective interventions into public health practice and policy across the Services.
Intervention Recommendations 1. Evaluate environmental, behavioral, directive, or regulatory interventions to prevent injuries
related specifically to sports and physical training. 2. Endorse evidence-based recommendations from military systematic reviews for physical
training injury prevention, including: break-away bases for softball, mouth guards in high risk activities, parachute ankle braces, and ankle braces for sports such as basketball.
3. Provide resource and policy priority to the biggest, most preventable problems identified,
which include, but are not limited to, sports and physical training, falls, and non-military vehicle accidents.
4. Endorse the Military Training Task Force, Joint Services Physical Training Injury Prevention
Work Group, “Recommended Interventions and Program Elements To Reduce Physical Training-Related Injuries.”
DMIPPWG White Paper: Military Injury Prevention Priorities
Page 32
Research Recommendations 1. Target knowledge gaps in top injuries identified in this report for additional research. 2. Conduct targeted epidemiological research on falls and physical training in operational units. 3. Develop enhanced methods to obtain injury data for sports-, exercise-, and recreation-related
injuries. 4. Assess the impact of leading injuries as causes of disability and medical separation. 5. Evaluate current methodology and results to assess applicability in the deployed
environment.

DMIPPWG White Paper: Military Injury Prevention Priorities
Page 33
REFERENCES 1. Amoroso, PJ, Smith, GS, Bell, NS. Quality Assessment of Cause-of-Injury Coding in U.U.
Military Hospitals: NATO Standardization Agreement (STANAG) 2050. American Journal of Preventive Medicine. 2000;18(3S0.
2. Berwick, Donald. Disseminating innovations in health care. Journal of the American Medical
Association. 2003;289(15):1969-1975. 3. Claxton K, Cohen JT, Neumann PJ. When is evidence sufficient? Health Aff 2005; 24(1):93-
101. 4. Green, Lawrence. From research to "best practices" in other settings and populations.
American Journal of Health Behavior. 2001;25(3):165-178. 5. Jones BH, Amoroso PJ, Canham ML, et al. (eds). Atlas of Injuries in U.S. Armed Forces.
Milit Med 1999; 164(8):1-1 to 9-26. 6. Jones BH, Amoroso PJ (eds). Injuries in the U.S. Armed Forces. Am J Prev Med 2000;
18(3S):1-187. 7. Jones BH, et al Prevention of lower extremity stress fractures in athletes and soldiers: a
systematic review. Epidemiol Rev 2002; 24(2):228-247. 8. Pinfold, JV. Analysis of different communication channels for promoting hygiene behavior.
Health Education Research. 1999;14(5):629-639. (1,7) 9. Jones BH and MC Chervak (August 2005). White paper: A process for setting military
injury prevention priorities and making evidence-based recommendations for interventions. Military Training Task Force, Defense Safety Oversight Council, OSD(P&R).
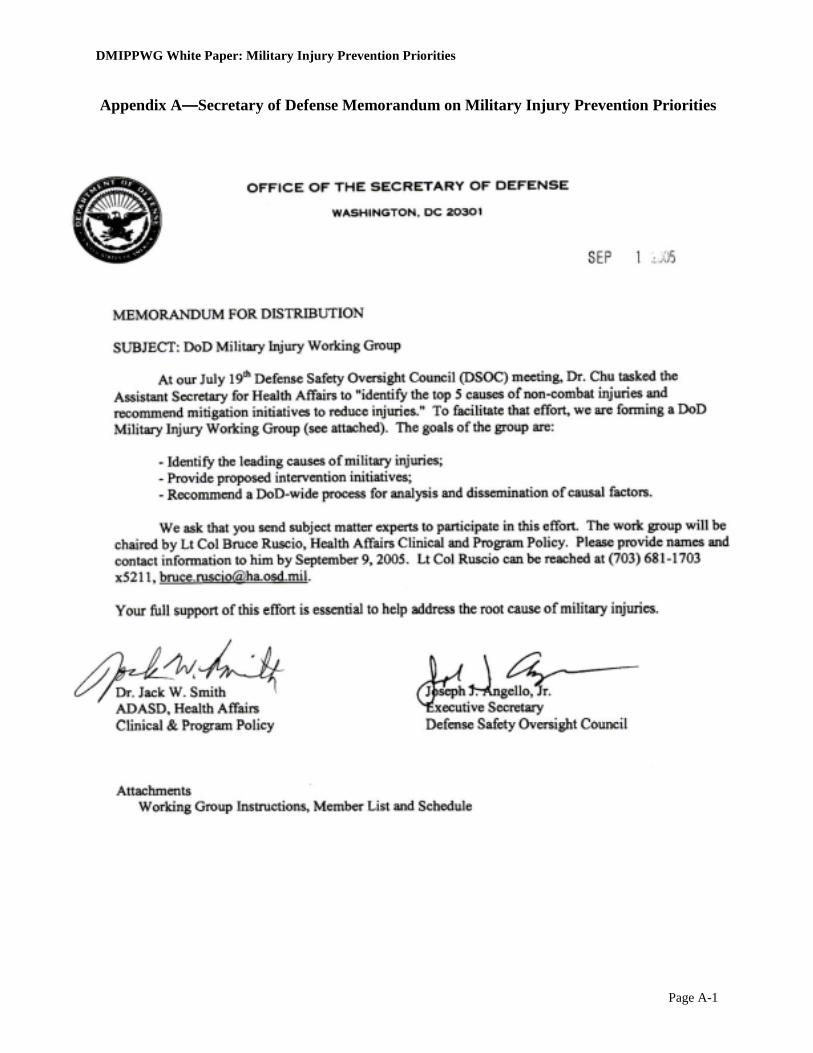
DMIPPWG White Paper: Military Injury Prevention Priorities
Page A-1
Appendix A—Secretary of Defense Memorandum on Military Injury Prevention Priorities

DMIPPWG White Paper: Military Injury Prevention Priorities
Page A-2

DMIPPWG White Paper: Military Injury Prevention Priorities
Page A-3
DMIPPWG White Paper: Military Injury Prevention Priorities
Page A-5
Name Organization
LtCol Bruce Ruscio* Health Affairs (Clinical & Program Policy)COL Paul Amoroso Army Research Institute of Environmental MedMr. Jerry Aslinger OUSD(P&R)RP&ALTC Steve Bullock USACHPPMLtCol Bruce Burnham HQ AF Safety CenterCOL John Campbell US Army Combat Readiness CenterMs. Michelle Chervak USACHPPMMr. Kurt Garbow ODASN(Safety)Mr. Richard Garver Defense Logistics AgencyCAPT Eugene Godwin Navy Medicine (BUMED)Mr. Donald Goodwin AFRL/HEPALtCol Michael Harvey Deployments and Operations Task ForceDr. Tonie Hooper Uniformed Services Univ of the Health SciencesDr. Bruce Jones USACHPPMCOL McKeon US Army Combat Readiness CenterMs. Nancy McWilliams Naval Safety Center
CDR Dexter Mills Naval Safety CenterCDR Jon Nelson ODASN(Safety)Mr. John Phillips HQ AF Safety CenterMr. Dan Reinhard OUSD(P&R)RP&ACAPT Chris Rennix Navy Environmental Health Center (NEHC)Mr. Bryan Richardson DoD Civilian Personnel Management ServiceCol James Riddle Air Force Research LaboratoryMr. John Scott Naval Safety CenterMr. John Seibert OSD (I&E)Maj Randy Smith J-4 HSSDLCDR Dana Thomas Coast GuardMr. Daniel Trone Naval Health Research Center, San DiegoMs. Pam Webster Naval Safety CenterLtCol Timothy Wells Air Force Research LaboratoryMaj Drew Widing Air Force Research LaboratoryCDR Robin Wilkening Navy Medicine HQ/BUMEDMr. Hew Wolfe Army (ASA (I&E))/DASA (ESOH)
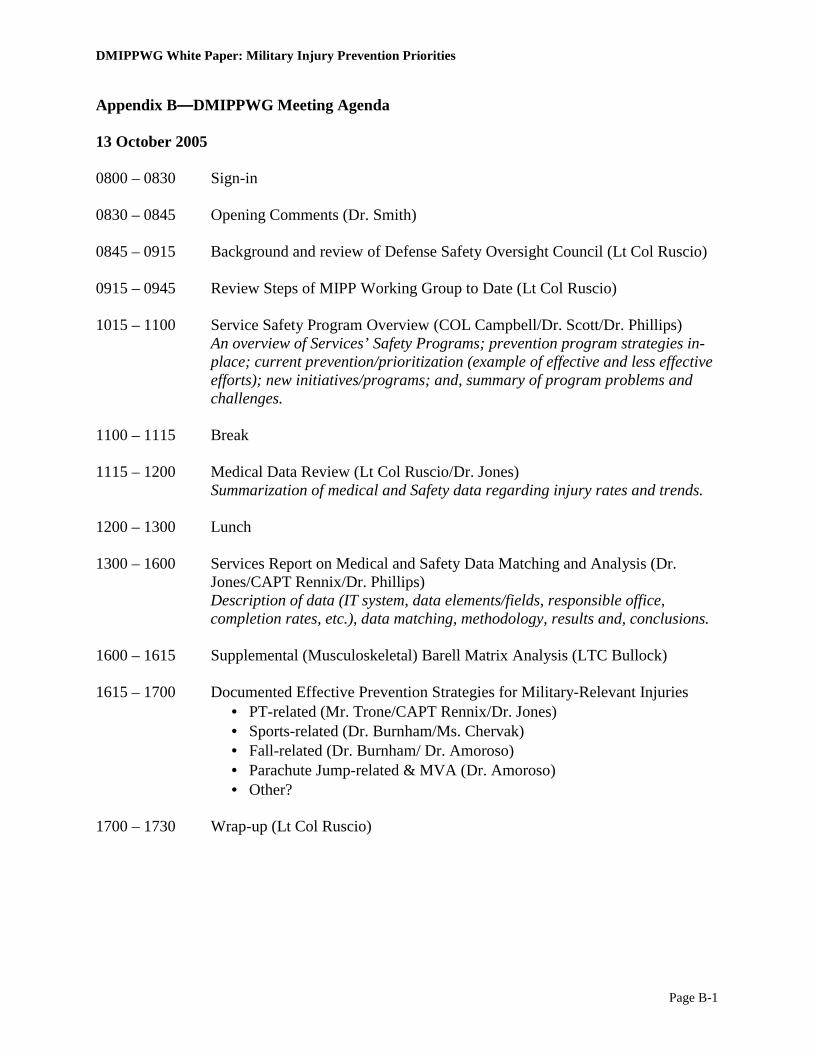
DMIPPWG White Paper: Military Injury Prevention Priorities
Page B-1
Appendix B—DMIPPWG Meeting Agenda 13 October 2005 0800 – 0830 Sign-in 0830 – 0845 Opening Comments (Dr. Smith) 0845 – 0915 Background and review of Defense Safety Oversight Council (Lt Col Ruscio) 0915 – 0945 Review Steps of MIPP Working Group to Date (Lt Col Ruscio) 1015 – 1100 Service Safety Program Overview (COL Campbell/Dr. Scott/Dr. Phillips)
An overview of Services’ Safety Programs; prevention program strategies in-place; current prevention/prioritization (example of effective and less effective efforts); new initiatives/programs; and, summary of program problems and challenges.
1100 – 1115 Break 1115 – 1200 Medical Data Review (Lt Col Ruscio/Dr. Jones)
Summarization of medical and Safety data regarding injury rates and trends. 1200 – 1300 Lunch 1300 – 1600 Services Report on Medical and Safety Data Matching and Analysis (Dr.
Jones/CAPT Rennix/Dr. Phillips) Description of data (IT system, data elements/fields, responsible office, completion rates, etc.), data matching, methodology, results and, conclusions.
1600 – 1615 Supplemental (Musculoskeletal) Barell Matrix Analysis (LTC Bullock) 1615 – 1700 Documented Effective Prevention Strategies for Military-Relevant Injuries
• PT-related (Mr. Trone/CAPT Rennix/Dr. Jones) • Sports-related (Dr. Burnham/Ms. Chervak) • Fall-related (Dr. Burnham/ Dr. Amoroso) • Parachute Jump-related & MVA (Dr. Amoroso) • Other?
1700 – 1730 Wrap-up (Lt Col Ruscio)

DMIPPWG White Paper: Military Injury Prevention Priorities
Page B-2
14 October 2005 0730-0800 Coffee 0800-0830 Draft Criteria to Determine Injury Prevention Priorities (Ms. Chervak) 0830-1000 Development of DoD Ranking Criteria (Group) 1000-1015 Break 1015-1100 Presentation/Discussion of Services’ Top Five Injuries & Services’ Top Five
Causes of Injuries (Dr. Jones/CAPT Rennix/Dr. Phillips) 1100-1200 Initial Prioritization of DoD Injuries (Group) 1200-1300 Lunch 1300-1400 Summary/Discussion of Prioritization Results (Lt Col Ruscio/Group) 1400 -1430 List Potential Mitigation/Prevention Opportunities (Group)
• Services’ Success programs • Commercial Off-The-Shelf Programs
1430-1530 Leadership in Injury Prevention (Lt Col Ruscio) 1530-1630 Next Steps (Lt Col Ruscio) 1630-1700 Wrap-Up
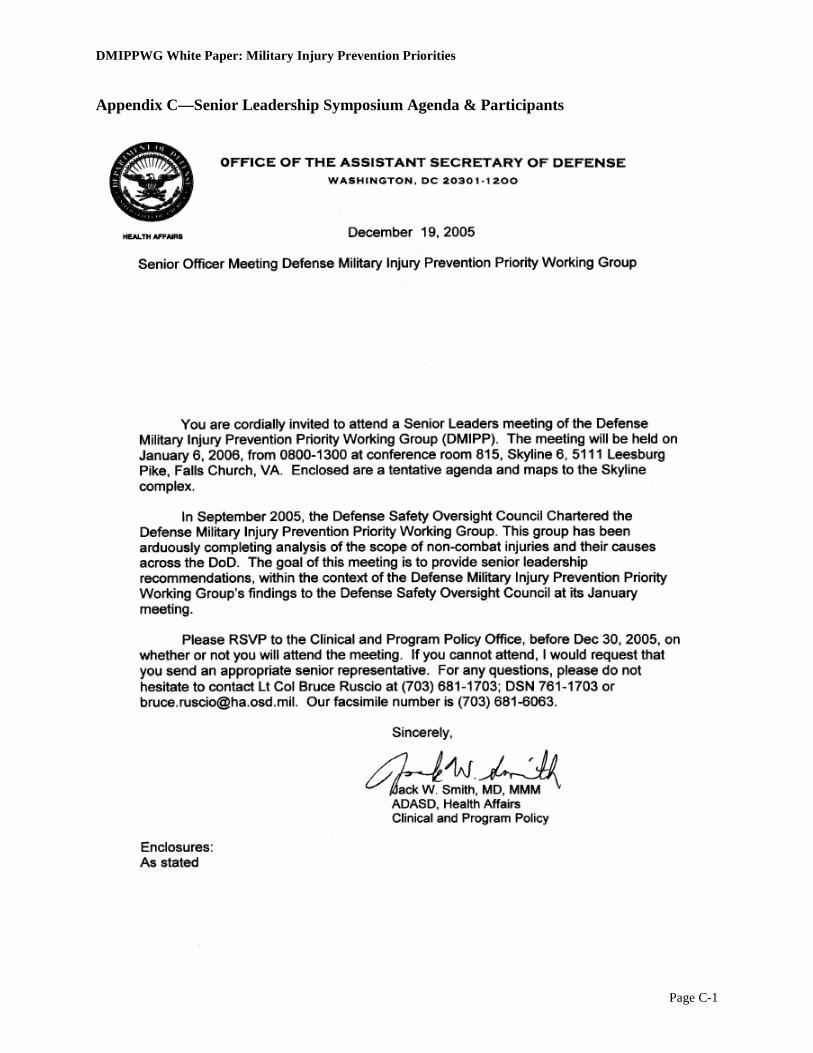
DMIPPWG White Paper: Military Injury Prevention Priorities
Page C-1
Appendix C—Senior Leadership Symposium Agenda & Participants

DMIPPWG White Paper: Military Injury Prevention Priorities
Page C-2
Conference Room 815, Skyline 6 Leesburg Pike
Falls Church, VA 22041
6 January 2006
0730 Coffee/Pastries
0800 Welcome/Opening Remarks/Introductions 0815 Overview of the finding of the Defense Medical Injury Prevention Priority Work Group 0900 MHS Injury Coding 0920 Defense Safety Enterprise System 0940 Current Policy and Execution of injury Reporting/Investigation 1000 BREAK 1015 Discussion--Opportunities for Improvement
Program Execution Policy Requirements
1100 Service Initiatives
1200 No Host WORKING LUNCH
Discussion of initiatives and Senior Leaders recommendations
1300 Adjourn
- AGENDA - Clinical and Program Policy
6 January 2006
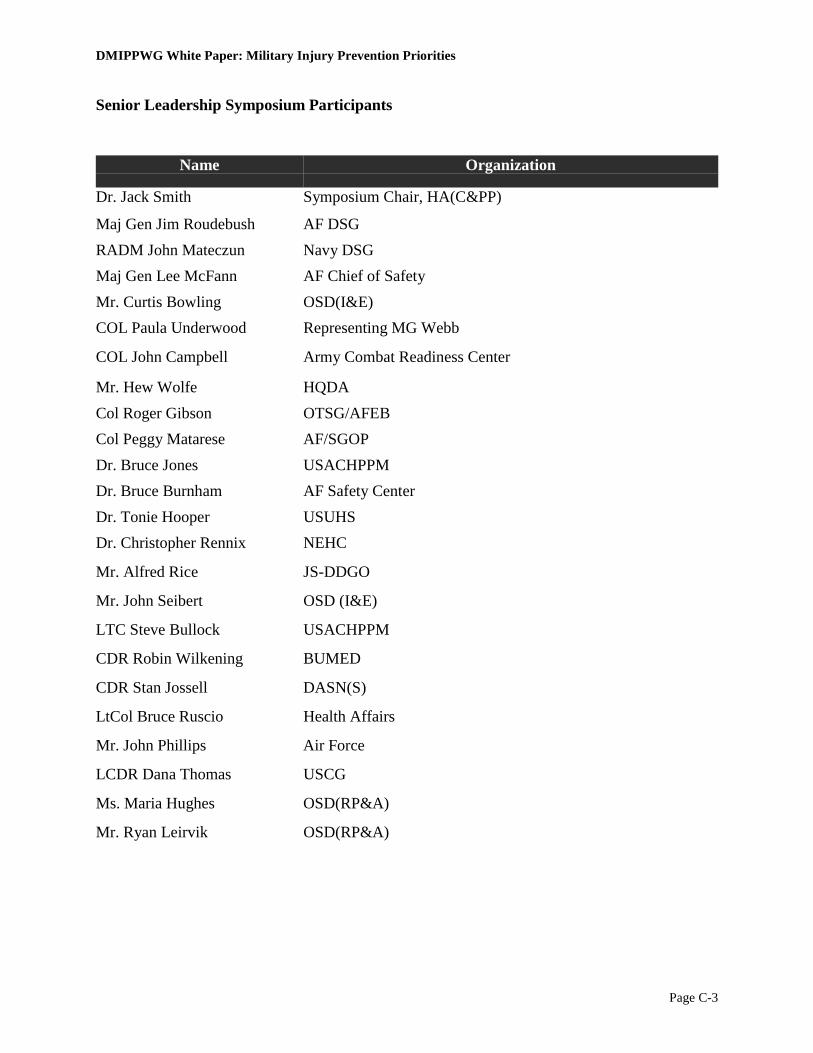
DMIPPWG White Paper: Military Injury Prevention Priorities
Page C-3
Senior Leadership Symposium Participants
Name Organization
Dr. Jack Smith Symposium Chair, HA(C&PP)
Maj Gen Jim Roudebush AF DSG RADM John Mateczun Navy DSG Maj Gen Lee McFann AF Chief of Safety Mr. Curtis Bowling OSD(I&E) COL Paula Underwood Representing MG Webb
COL John Campbell Army Combat Readiness Center
Mr. Hew Wolfe HQDA Col Roger Gibson OTSG/AFEB Col Peggy Matarese AF/SGOP Dr. Bruce Jones USACHPPM Dr. Bruce Burnham AF Safety Center Dr. Tonie Hooper USUHS Dr. Christopher Rennix NEHC
Mr. Alfred Rice JS-DDGO
Mr. John Seibert OSD (I&E)
LTC Steve Bullock USACHPPM
CDR Robin Wilkening BUMED
CDR Stan Jossell DASN(S)
LtCol Bruce Ruscio Health Affairs
Mr. John Phillips Air Force
LCDR Dana Thomas USCG
Ms. Maria Hughes OSD(RP&A)
Mr. Ryan Leirvik OSD(RP&A)
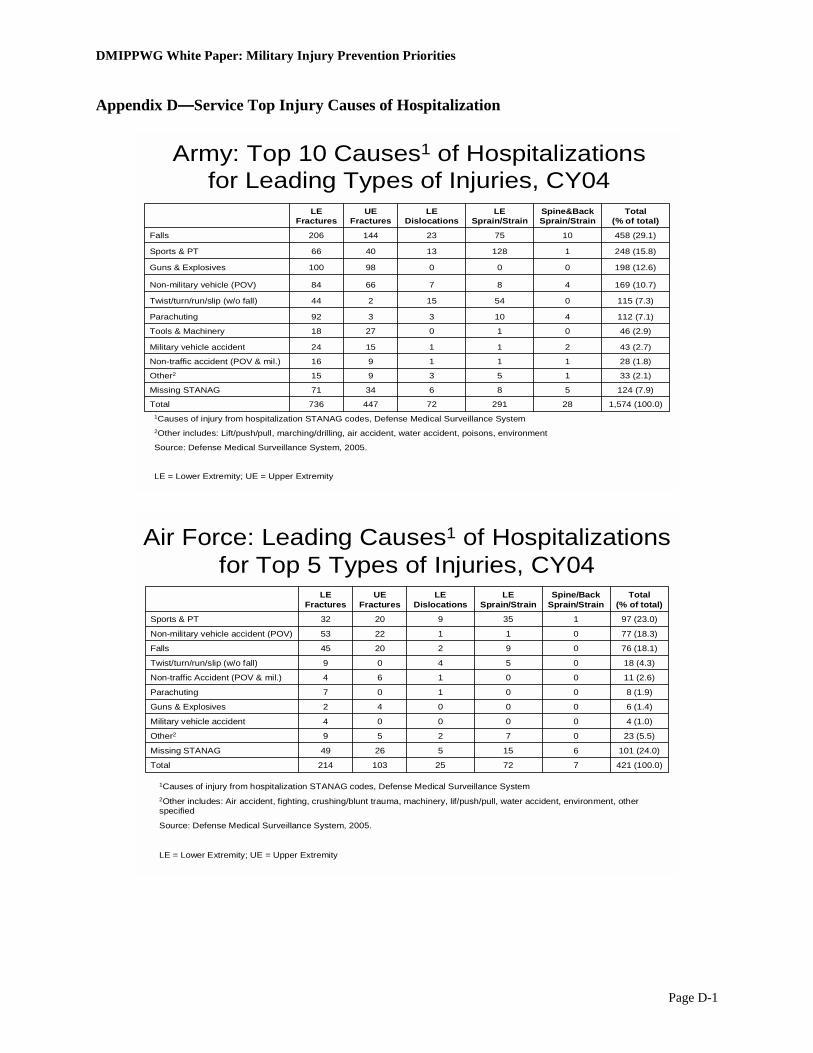
DMIPPWG White Paper: Military Injury Prevention Priorities
Page D-1
Appendix D—Service Top Injury Causes of Hospitalization
Army: Top 10 Causes1 of Hospitalizations for Leading Types of Injuries, CY04
1Causes of injury from hospitalization STANAG codes, Defense Medical Surveillance System2Other includes: Lift/push/pull, marching/drilling, air accident, water accident, poisons, environment
Source: Defense Medical Surveillance System, 2005.
LE = Lower Extremity; UE = Upper Extremity
198 (12.6)00098100Guns & Explosives
115 (7.3)05415244Twist/turn/run/slip (w/o fall)
112 (7.1)4103392Parachuting
169 (10.7)4876684Non-military vehicle (POV)
124 (7.9)5863471Missing STANAG
1,574 (100.0)2829172447736Total
33 (2.1)153915Other2
28 (1.8)111916Non-traffic accident (POV & mil.)
43 (2.7)2111524Military vehicle accident
46 (2.9)0102718Tools & Machinery
248 (15.8)1128134066Sports & PT
458 (29.1)107523144206Falls
Total (% of total)
Spine&BackSprain/Strain
LE Sprain/Strain
LE Dislocations
UE Fractures
LE Fractures
Air Force: Leading Causes1 of Hospitalizations for Top 5 Types of Injuries, CY04
1Causes of injury from hospitalization STANAG codes, Defense Medical Surveillance System2Other includes: Air accident, fighting, crushing/blunt trauma, machinery, lif/push/pull, water accident, environment, other specified
Source: Defense Medical Surveillance System, 2005.
LE = Lower Extremity; UE = Upper Extremity
421 (100.0)77225103214Total
101 (24.0)61552649Missing STANAG
23 (5.5)07259Other2
4 (1.0)00004Military vehicle accident
6 (1.4)00042Guns & Explosives
8 (1.9)00107Parachuting
11 (2.6)00164Non-traffic Accident (POV & mil.)
18 (4.3)05409Twist/turn/run/slip (w/o fall)
76 (18.1)0922045Falls
77 (18.3)0112253Non-military vehicle accident (POV)
97 (23.0)13592032Sports & PT
Total (% of total)
Spine/Back Sprain/Strain
LE Sprain/Strain
LE Dislocations
UE Fractures
LE Fractures

DMIPPWG White Paper: Military Injury Prevention Priorities
Page D-2
Navy: Top 10 Causes1 of Hospitalizations for Leading Types of Injuries, CY04
58068522303164Total
130 (22.4)4817641Missing
38 (6.6)1222112Other2
2 (0.3)01010Military vehicle
3 (0.5)00030Parachute accident
26 (4.5)0103130Twisting, turning, running, slipping w/out fall
15 (2.6)00087Non-traff (POV and MIL)
9 (1.6)00045Tools & Machinery
8 (1.4)00035Guns and Explosives
108 (18.6)1655442Non-milit vehicle (POV)
102 (17.6)0448419Sports and PT
139 (24.0)01437943Falls
Total(% of total)
Spine & BackSprain/Strain
LE Sprain/Strain
LE Dislocations
LE Fractures
UE Fractures
1Causes of injury from hospitalization STANAG codes, Defense Medical Surveillance System2Other includes: Lift/push/pull, marching/drilling, air accident, water accident, poisons, medical events, environment, enemy action
Source: Defense Medical Surveillance System, 2005.
UE = Upper Extremity; LE = Lower Extremity
Marine Corps: Top 10 Causes1 of Hospitalizations for Leading Types of Injuries, CY04
1Causes of injury from hospitalization STANAG codes, Defense Medical Surveillance System2Other includes: Lift/push/pull, marching/drilling, air accident, water accident, poisons, medical events, environment, enemy action
Source: Defense Medical Surveillance System, 2005.
UE = Upper Extremity; LE = Lower Extremity
58963415309225Total
78 (13.2)3435018Missing
120 (20.4)1215759Other
3 (0.5)00030Parachute accident
11 (1.9)00056Non-traff (POV and MIL)
14 (2.4)01049Tools & Machinery
16 (2.7)030103Twisting, turning, running, slipping w/out fall
40 (6.8)0432013Non-milit vehicle (POV)
20 (3.4)013115Military vehicle
84 (14.3)1834527Falls
55 (9.3)11123110Sports and PT
148 (25.1)0007375Guns and Explosives
Total(% of total)
Spine & BackSprain/Strain
LE Sprain/Strain
LE Dislocations
LE Fractures
UE Fractures
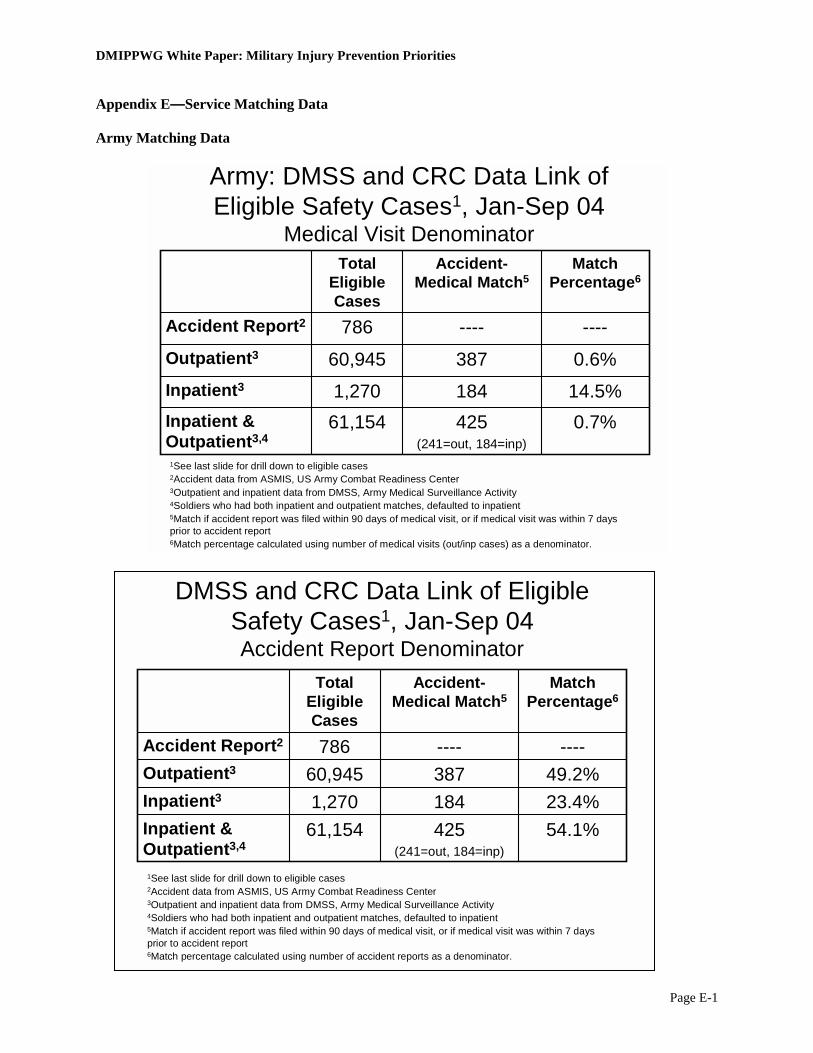
DMIPPWG White Paper: Military Injury Prevention Priorities
Page E-1
Appendix E—Service Matching Data Army Matching Data
Army: DMSS and CRC Data Link of Eligible Safety Cases1, Jan-Sep 04
Medical Visit Denominator
1See last slide for drill down to eligible cases2Accident data from ASMIS, US Army Combat Readiness Center3Outpatient and inpatient data from DMSS, Army Medical Surveillance Activity4Soldiers who had both inpatient and outpatient matches, defaulted to inpatient5Match if accident report was filed within 90 days of medical visit, or if medical visit was within 7 days prior to accident report 6Match percentage calculated using number of medical visits (out/inp cases) as a denominator.
0.7%14.5%
0.6%
----
Match Percentage6
1841,270Inpatient3
425(241=out, 184=inp)
61,154Inpatient & Outpatient3,4
38760,945Outpatient3
----786Accident Report2
Accident-Medical Match5
Total Eligible Cases
DMSS and CRC Data Link of Eligible Safety Cases1, Jan-Sep 04Accident Report Denominator
1See last slide for drill down to eligible cases2Accident data from ASMIS, US Army Combat Readiness Center3Outpatient and inpatient data from DMSS, Army Medical Surveillance Activity4Soldiers who had both inpatient and outpatient matches, defaulted to inpatient5Match if accident report was filed within 90 days of medical visit, or if medical visit was within 7 days prior to accident report 6Match percentage calculated using number of accident reports as a denominator.
54.1%23.4%49.2%
----
Match Percentage6
1841,270Inpatient3
425(241=out, 184=inp)
61,154Inpatient & Outpatient3,4
38760,945Outpatient3
----786Accident Report2
Accident-Medical Match5
Total Eligible Cases

DMIPPWG White Paper: Military Injury Prevention Priorities
Page E-2
Army: Top 10 Activities by Barell Group
4 (0.9)00004Bystanding/spectating24 (5.6)303612Other1
5 (1.2)00032Hobbies
15 (3.5)11328Handling materials/passengers
425 (100.0)43961117195Total
9 (2.1)00045Weapons firing
16 (3.8)30355Soldiering
16 (3.8)00367Maintenance/repair/service
38 (8.9)1041518Human movement73 (17.2)4115152Parachuting
79 (18.6)35181835Sports & PT146 (34.4)282125747MVA
N(% of total)
Spine&BackSprain/Strain
LE Dislocation
LE Sprain/Strain
UE Fracture
LE Fracture
1Other includes: Horseplay, security/law enforcement, Combat Soldiering, janitorial, supervisory, communications, office, fabricating, patient care, communications
LE = Lower Extremity; UE = Upper Extremity
Army: Injury Causes by Barell Group
4 (0.9)10003Unknown
4 (0.9)00112Rubbed/abraded
68 (16.0)5162036Struck by
86 (20.2)142123523Struck against
425 (100.0)43961117195Total
7 (1.6)20203External contact10 (2.4)21502Overexertion19 (4.5)91513Bodily reaction37 (8.7)1051912Thrown from
50 (11.8)2242319Caught in/under/between
51 (12.0)2261130Fell from same level
89 (20.9)5015762Fell from elevation
N(% of total)
Spine&BackSprain/Strain
LE Dislocation
LE Sprain/Strain
UE Fracture
LE Fracture
LE = Lower Extremity; UE = Upper Extremity
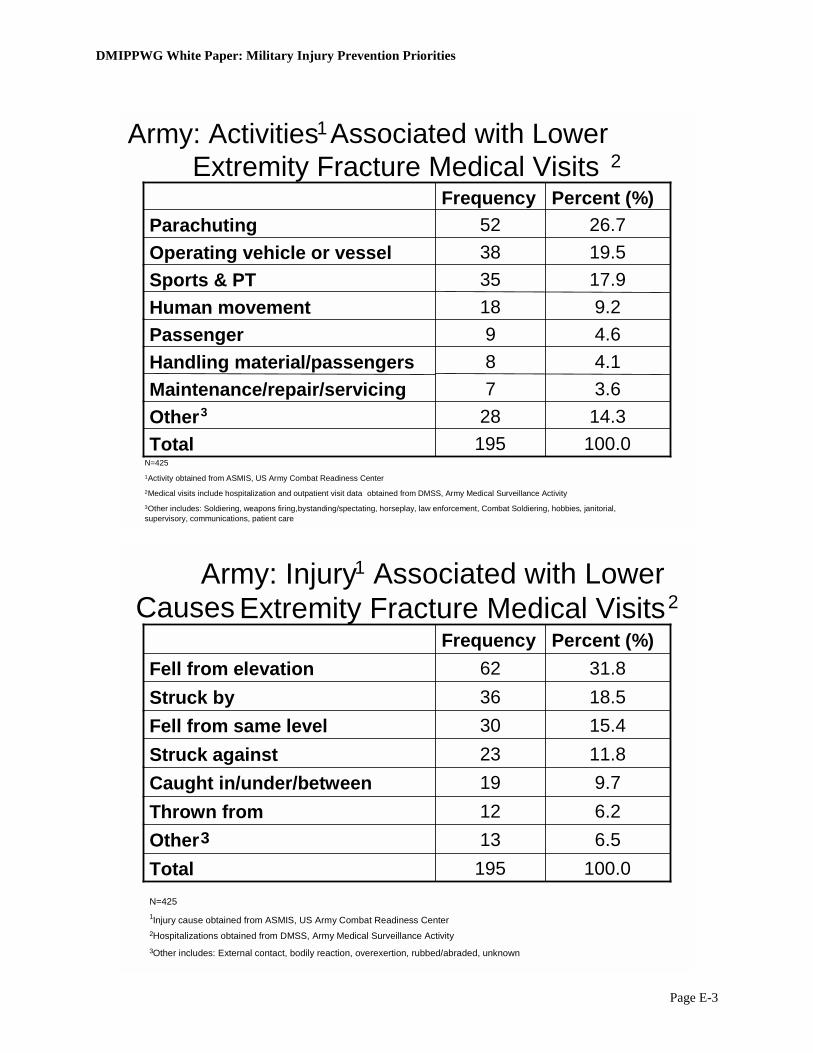
DMIPPWG White Paper: Military Injury Prevention Priorities
Page E-3
Army: Activities Associated with Lower Extremity Fracture Medical Visits 2
14.328Other3
3.67Maintenance/repair/servicing4.18Handling material/passengers
100.0195Total
4.69Passenger9.218Human movement
17.935Sports & PT
19.538Operating vehicle or vessel26.752Parachuting
Percent (%) Frequency
N=425 1 Activity obtained from ASMIS, US Army Combat Readiness Center2 Medical visits include hospitalization and outpatient visit data obtained from DMSS, Army Medical Surveillance Activity3 Other includes: Soldiering, weapons firing,bystanding/spectating, horseplay, law enforcement, Combat Soldiering, hobbies, janitorial, supervisory, communications, patient care
Army: Injury Causes
1 Associated with Lower
6.513Other36.212Thrown from
100.0195Total
9.719Caught in/under/between11.823Struck against15.430Fell from same level 18.536Struck by
31.862Fell from elevation
Percent (%) Frequency
N=425 1 Injury cause obtained from ASMIS, US Army Combat Readiness Center2 Hospitalizations obtained from DMSS, Army Medical Surveillance Activity3 Other includes: External contact, bodily reaction, overexertion, rubbed/abraded, unknown
2Extremity Fracture Medical Visits
1
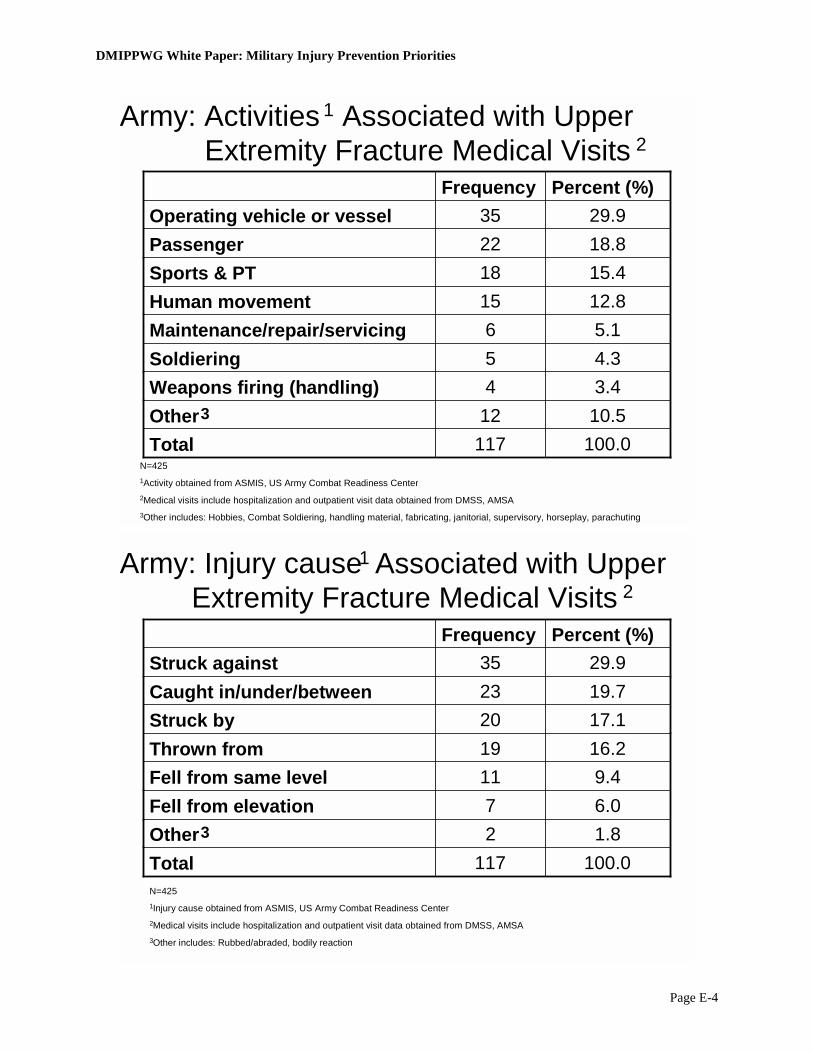
DMIPPWG White Paper: Military Injury Prevention Priorities
Page E-4
Army: Activities 1 Associated with Upper Extremity Fracture Medical Visits
5.16Maintenance/repair/servicing
10.512Other33.44Weapons firing (handling)
100.0117Total
4.35Soldiering
12.815Human movement 15.418Sports & PT
18.822Passenger29.935Operating vehicle or vessel
Percent (%) Frequency
N=425 1 Activity obtained from ASMIS, US Army Combat Readiness Center2 Medical visits include hospitalization and outpatient visit data obtained from DMSS, AMSA3 Other includes: Hobbies, Combat Soldiering, handling material, fabricating, janitorial, supervisory, horseplay, parachuting
Army: Injury cause 2
17.120Struck by
1.82Other3
100.0117Total
6.07Fell from elevation
9.411Fell from same level 16.219Thrown from
19.723Caught in/under/between29.935Struck against
Percent (%) Frequency
N=425 1 Injury cause obtained from ASMIS, US Army Combat Readiness Center2 Medical visits include hospitalization and outpatient visit data obtained from DMSS, AMSA3 Other includes: Rubbed/abraded, bodily reaction
Associated with Upper Extremity Fracture Medical Visits
1
2
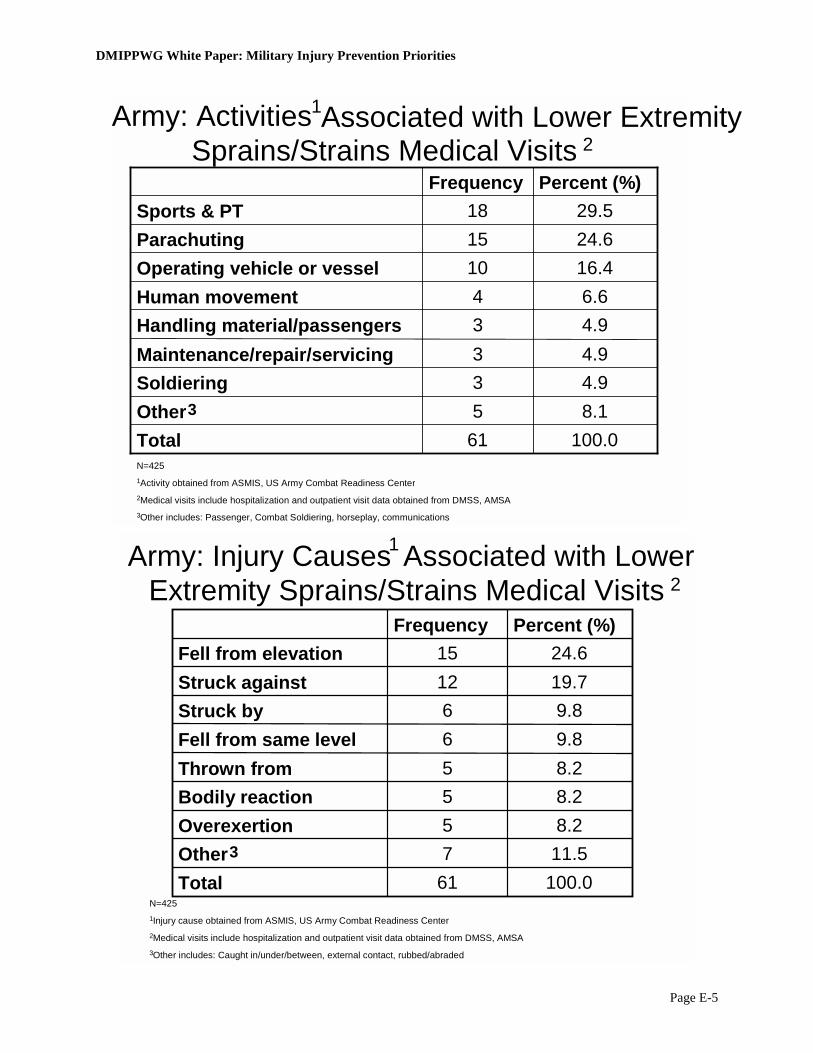
DMIPPWG White Paper: Military Injury Prevention Priorities
Page E-5
Army: Activities 2
4.93Maintenance/repair/servicing
8.15Other3
4.93Handling material/passengers6.64Human movement
4.93Soldiering
100.061Total
16.410Operating vehicle or vessel24.615Parachuting29.518Sports & PT
Percent (%) Frequency
N=425 1 Activity obtained from ASMIS, US Army Combat Readiness Center2 Medical visits include hospitalization and outpatient visit data obtained from DMSS, AMSA3 Other includes: Passenger, Combat Soldiering, horseplay, communications
Extremity Sprains/Strains Medical Visits
8.25Thrown from9.86Fell from same level9.86Struck by
11.57Other38.25Overexertion
100.061Total
8.25Bodily reaction
19.712Struck against24.615Fell from elevation
Percent (%) Frequency
N=425 1 Injury cause obtained from ASMIS, US Army Combat Readiness Center2 Medical visits include hospitalization and outpatient visit data obtained from DMSS, AMSA3 Other includes: Caught in/under/between, external contact, rubbed/abraded
Associated with Lower Extremity 1
Army: Injury Causes1 Associated with Lower 2
Sprains/Strains Medical Visits
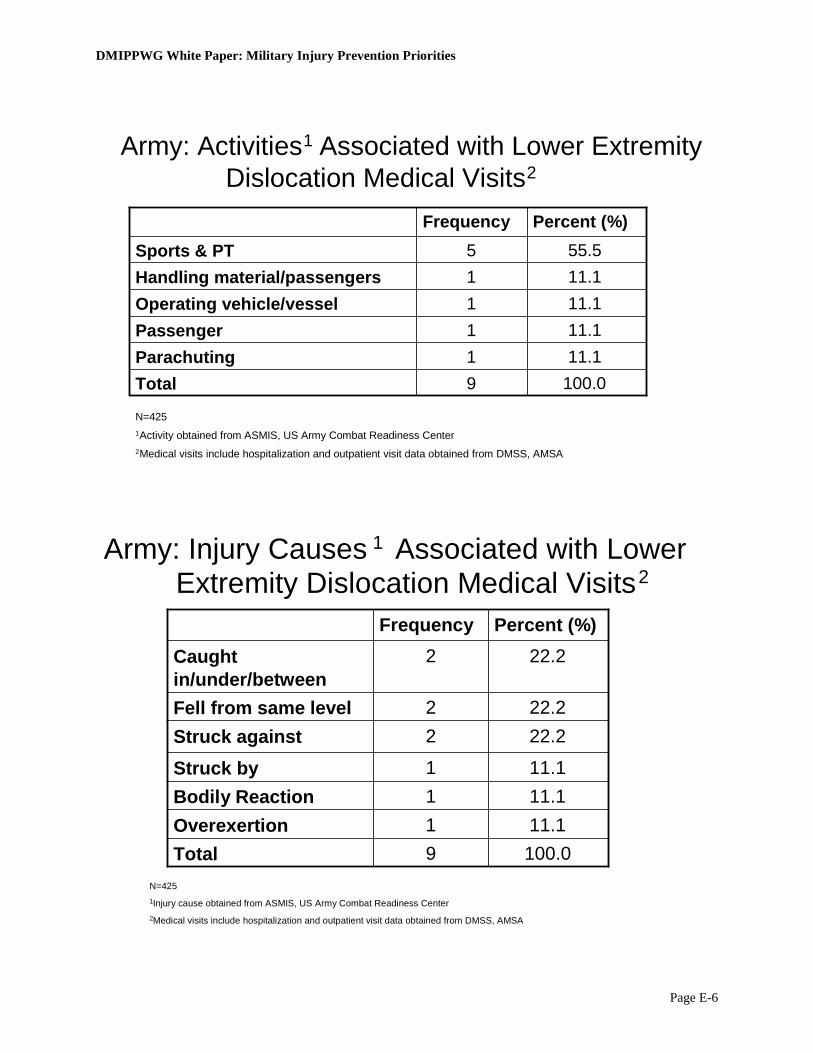
DMIPPWG White Paper: Military Injury Prevention Priorities
Page E-6
Army: Activities
Dislocation Medical Visits
11.1 1Passenger 11.1 1Parachuting
100.0 9Total
11.1 1Operating vehicle/vessel11.1 1Handling material/passengers55.5 5Sports & PT
Percent (%) Frequency
N=425 1 Activity obtained from ASMIS, US Army Combat Readiness Center2 Medical visits include hospitalization and outpatient visit data obtained from DMSS, AMSA
Extremity Dislocation Medical Visits
11.11Bodily Reaction
22.22Struck against22.22Fell from same level
100.09Total 11.11Overexertion
11.11Struck by
22.22Caught in/under/between
Percent (%) Frequency
N=425 1 Injury cause obtained from ASMIS, US Army Combat Readiness Center2 Medical visits include hospitalization and outpatient visit data obtained from DMSS, AMSA
1 Associated with Lower Extremity 2
Associated with Lower 1Army: Injury Causes 2
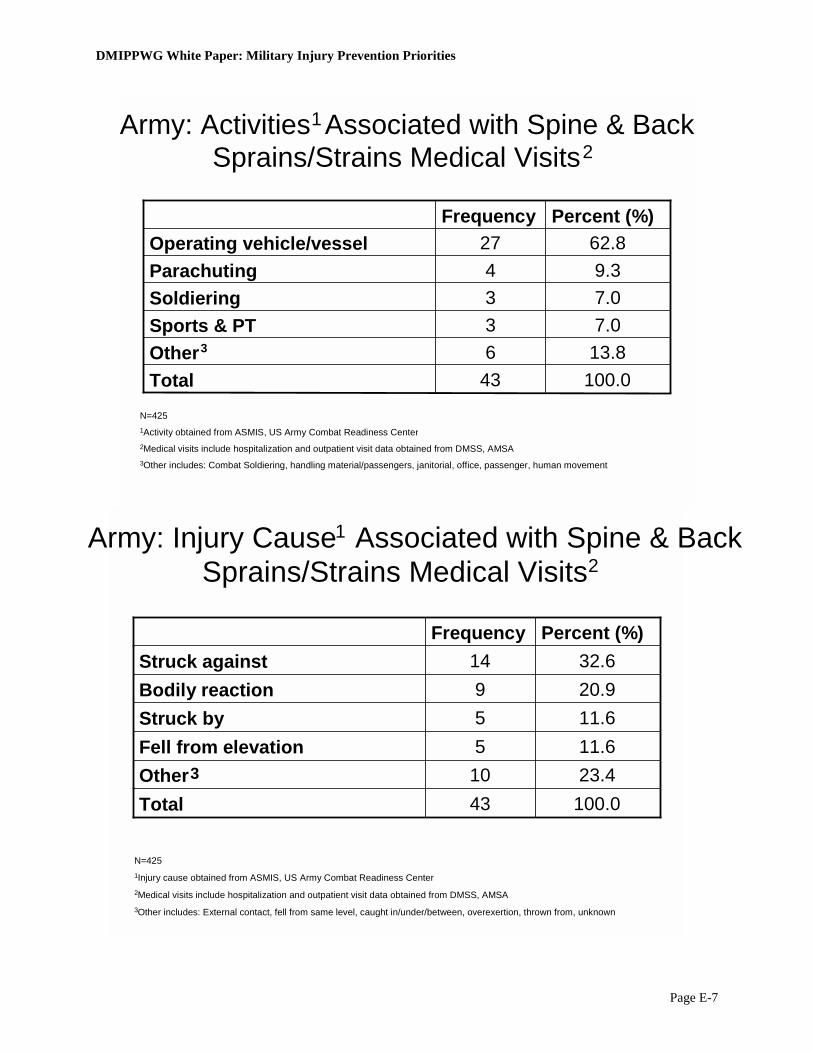
DMIPPWG White Paper: Military Injury Prevention Priorities
Page E-7
Sprains/Strains Medical Visits 2
13.86Other3
9.34Parachuting62.827Operating vehicle/vessel
100.043Total
7.03Sports & PT
7.03Soldiering
Percent (%) Frequency
N=425 1 Activity obtained from ASMIS, US Army Combat Readiness Center2 Medical visits include hospitalization and outpatient visit data obtained from DMSS, AMSA3 Other includes: Combat Soldiering, handling material/passengers, janitorial, office, passenger, human movement
Sprains/Strains Medical Visits
20.99Bodily reaction
32.614Struck against
11.65Fell from elevation
11.65Struck by
100.043Total 23.410Other3
Percent (%) Frequency
N=425 1 Injury cause obtained from ASMIS, US Army Combat Readiness Center2 Medical visits include hospitalization and outpatient visit data obtained from DMSS, AMSA3 Other includes: External contact, fell from same level, caught in/under/between, overexertion, thrown from, unknown
Associated with Spine & Back Army: Activities 1
Associated with Spine & Back 1Army: Injury Cause2
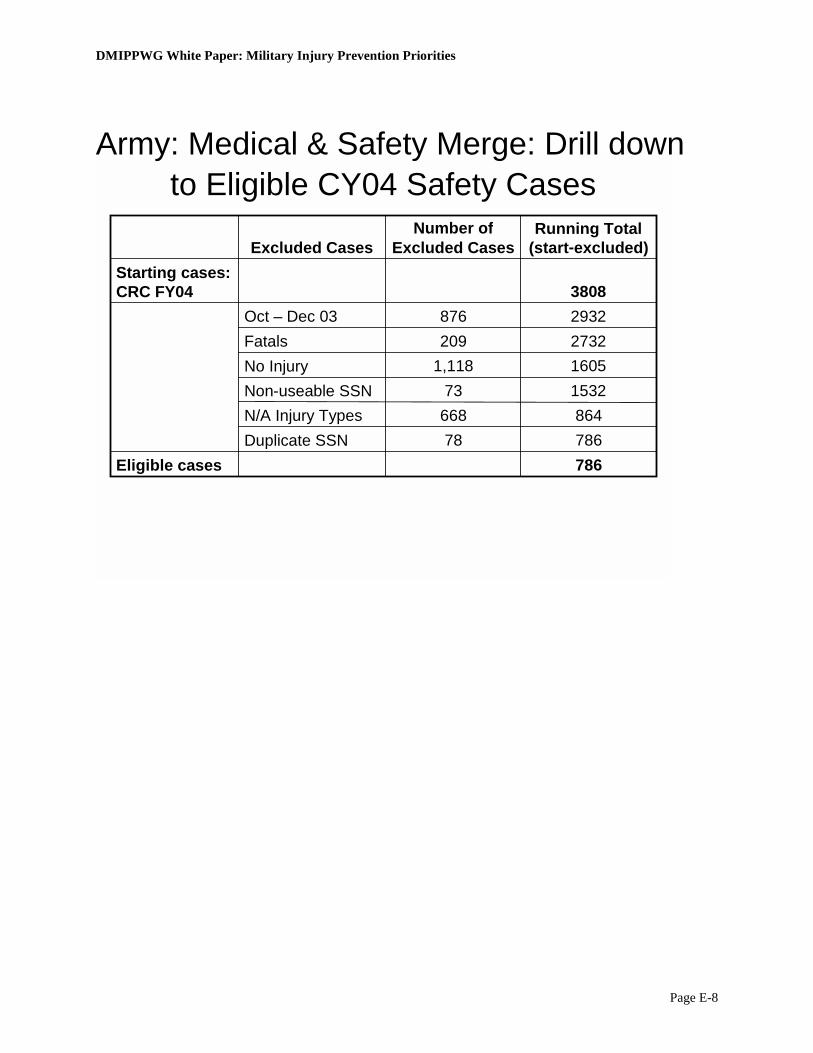
DMIPPWG White Paper: Military Injury Prevention Priorities
Page E-8
Army: Medical & Safety Merge: Drill down to Eligible CY04 Safety Cases
Eligible cases
Starting cases: CRC FY04
864668N/A Injury Types78
731,118209876
Number of Excluded Cases
786Duplicate SSN
1605 No Injury
786
1532 Non- useable SSN
2732 Fatals2932 Oct – Dec 033808
Running Total (start-excluded) Excluded Cases

DMIPPWG White Paper: Military Injury Prevention Priorities
Page E-9
Air Force Matching Data
DMSS (AF Medical) and AF Safety Center Data Match
Medical Visit Denominator
52.7%
4.2%
----
Match Percentage4
431
60,276
2,568
Total Cases
223423Inpatient2
1,93146,070Outpatient2
----2,568Accident Report1
Accident-Medical Match3
Unique SSNs
1Accident data from AF Safety Center2Outpatient and inpatient data from DMSS, Army Medical Surveillance Activity3Accident and medical data matched within a 90-day time period. 4Match percentage calculated using number of medical visits (outpatient/inpatient unique SSNs) as denominator.
DMSS (AF Medical) and AF Safety Center Data Match
Accident Report Denominator
8.7%
75.2%
----
Match Percentage4
431
60,276
2,568
Total Cases
223423Inpatient2
1,93146,070Outpatient2
----2,568Accident Report1
Accident-Medical Match3
Unique SSNs
1Accident data from AF Safety Center2Outpatient and inpatient data from DMSS, Army Medical Surveillance Activity3Accident and medical data matched within a 90-day time period. 4Match percentage calculated using number of accident reports (unique SSNs) as denominator.

DMIPPWG White Paper: Military Injury Prevention Priorities
Page E-10
Air Force Injury Causes* Associated with Lower Extremity Fracture Outpatient Visits**
282 Total00Missing
37.2105Other2.16Jumping2.57Softball2.88Soccer3.911Climbing4.312Trailriding4.613Football5.315Basketball5.716Riding In/On9.226Walking
22.363OperatingPercentFrequency
*Injury cause and obtained from AF Safety Center Center
**Frequency of Safety Reports matched with outpatient data obtained from DMSS, Army Medical Surveillance Activity
Air Force Injury Causes* Associated with Upper Extremity Fracture Outpatient Visits**
31.3157Other
502Total
00Missing
3.015Softball
3.015Motorcycle Race3.216Climbing3.216Bicycling4.221Snowboarding5.025Riding In/On5.628Basketball6.633Football, Flag/Touch9.447Trail Riding
25.7129OperatingPercentFrequency
*Injury cause obtained from AF Safety Center Center
** Frequency of Safety Reports matched with outpatient data obtained from DMSS, Army Medical Surveillance Activity
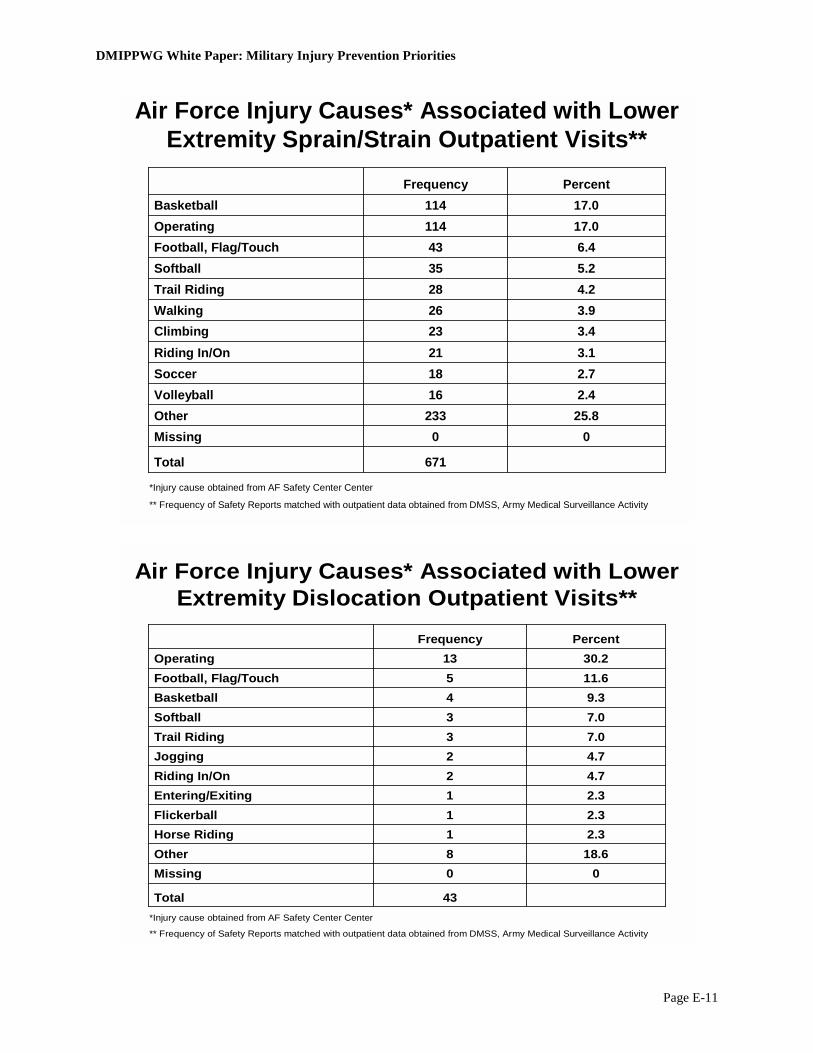
DMIPPWG White Paper: Military Injury Prevention Priorities
Page E-11
Air Force Injury Causes* Associated with Lower Extremity Sprain/Strain Outpatient Visits**
671Total
00Missing25.8233Other 2.416Volleyball2.718Soccer3.121Riding In/On3.423Climbing3.926Walking4.228Trail Riding5.235Softball6.443Football, Flag/Touch
17.0114Operating17.0114Basketball
PercentFrequency
*Injury cause obtained from AF Safety Center Center
** Frequency of Safety Reports matched with outpatient data obtained from DMSS, Army Medical Surveillance Activity
Air Force Injury Causes* Associated with Lower Extremity Dislocation Outpatient Visits**
00Missing
2.31Horse Riding
43Total
18.68Other
2.31Flickerball2.31Entering/Exiting4.72Riding In/On4.72Jogging7.03Trail Riding7.03Softball9.34Basketball
11.65Football, Flag/Touch30.213Operating
PercentFrequency
*Injury cause obtained from AF Safety Center Center
** Frequency of Safety Reports matched with outpatient data obtained from DMSS, Army Medical Surveillance Activity
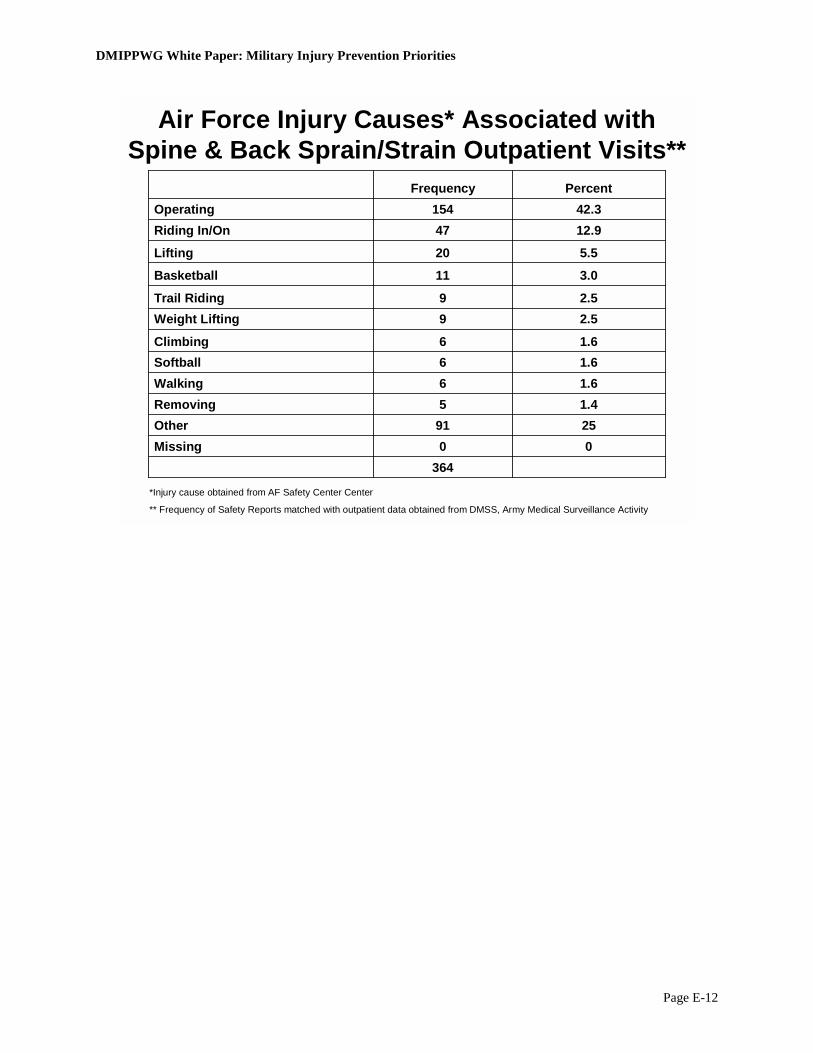
DMIPPWG White Paper: Military Injury Prevention Priorities
Page E-12
Air Force Injury Causes* Associated with Spine & Back Sprain/Strain Outpatient Visits**
1.45Removing
00Missing364
2591Other
1.66Walking1.66Softball1.66Climbing
2.59Weight Lifting2.59Trail Riding
3.011Basketball
5.520Lifting
12.947Riding In/On42.3154Operating
PercentFrequency
*Injury cause obtained from AF Safety Center Center
** Frequency of Safety Reports matched with outpatient data obtained from DMSS, Army Medical Surveillance Activity

DMIPPWG White Paper: Military Injury Prevention Priorities
Page E-13
Navy Matching Data
DMSS (Navy Medical) and Navy Safety Data
Medical Visit Denominator
17.2%
2.0%
----
Match Percentage4
100580580Inpatient2
90445,55346,086Outpatient2
----1,9622,053Accident Report1
Accident-Medical Match3
Unique SSNs
Total Cases
1Accident data from Navy Safety Center where there was at least 1 lost work day2Outpatient and inpatient data from DMSS, Army Medical Surveillance Activity3Accident and medical data matched within 90 day time period4Match percentage calculated using number of medical visits (outpatient/inpatient unique SSNs) as a denominator
DMSS (Navy Medical) and Navy Safety Data
Accident Report Denominator
5.1%
46.1%
----
Match Percentage4
100580580Inpatient2
90445,55346,086Outpatient2
----1,9622,053Accident Report1
Accident-Medical Match3
Unique SSNs
Total Cases
1Accident data from Navy Safety Center where there was at least 1 lost work day2Outpatient and inpatient data from DMSS, Army Medical Surveillance Activity3Accident and medical data matched within 90 day time period4Match percentage calculated using number of accident reports (unique SSNs) as a denominator

DMIPPWG White Paper: Military Injury Prevention Priorities
Page E-14
Total
Frequency Missing = 4
826 276 89151284 26Total
0.3%3 0 003 0 Cut/Lacerated
0.4%3 1 020 0 Rubbed or abraded
0.5%4 3 001 0 Conflict w/organism
2.2%17 1 294 1 Bodily Reaction
2.5%19 2 192 5 Repeated
2.7%22 6 286 0 Struck Against
3.8%34 24 0010 0 Caught in/under
4.9%40 7 4720 2 Other damaging cont
6.0%49 12 91214 2 Overexertion
6.4%51 19 2723 0 Struck By
9.9%81 24 91532 1 Fall/Jump from Elev
21.4% 176 56 3 55 56 6 Fall – same level
39.0%327 121 5727113 9 Motor Vehicle
Percent
UE Fractures
Spine & Back Sprains
LE Sprains/ Strains
LE Fractures
LE Dislocation
Injury Cause
INJURY CAUSES BY BARELL GROUP, NAVY, CY04*
Injury Causes Associated with Lower Extremity Dislocation Medical Visits, Navy, CY04*
26 Total
4.2% 1 Bodily Reaction
4.2% 1 Fall/Jump from Elev.
8.3% 2 Other damaging cont
8.3% 2 Overexertion
20.8% 5 Repeated Motion/Pre
25.0% 6 Fall on the same level
37.5% 9 Motor Vehicle
Percent Frequency Injury Cause
*Inpatient and outpatient LE = Lower Extremity; UE = Upper Extremity
*Inpatient and outpatient
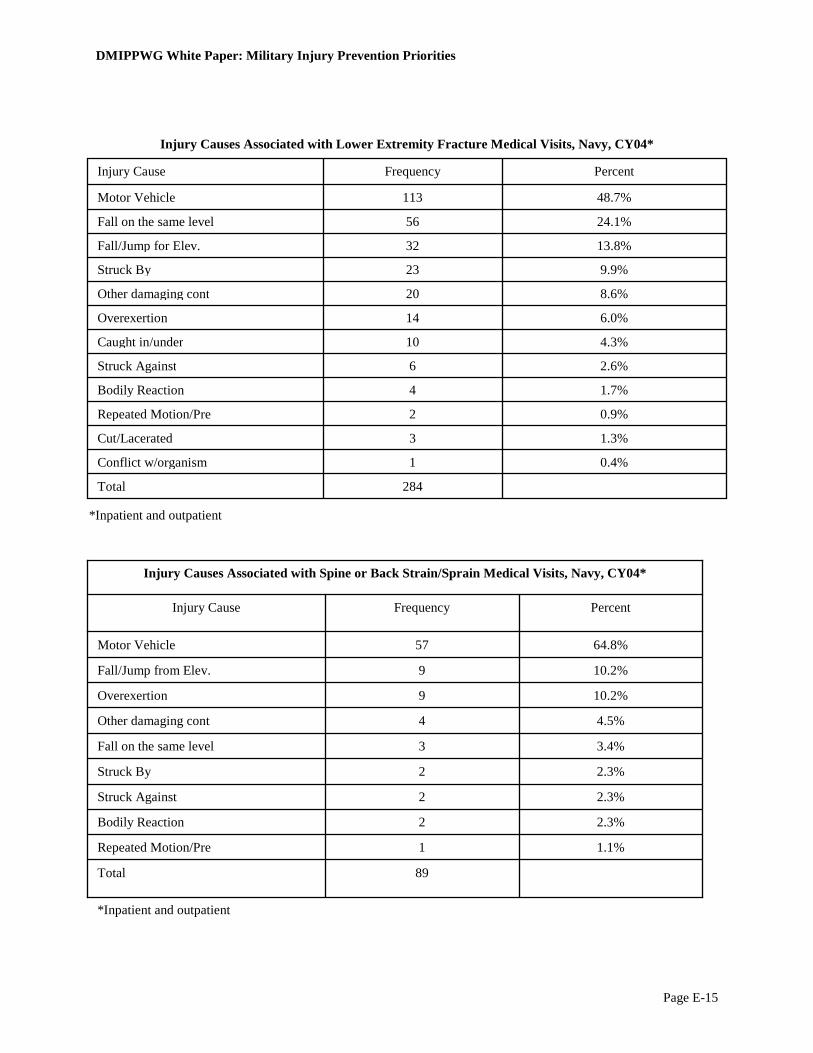
DMIPPWG White Paper: Military Injury Prevention Priorities
Page E-15
284Total
0.4% 1Conflict w/organism
1.3% 3Cut/Lacerated
0.9% 2Repeated Motion/Pre
1.7% 4Bodily Reaction
2.6% 6Struck Against
4.3% 10Caught in/under
6.0% 14Overexertion
8.6% 20Other damaging cont
9.9% 23Struck By
13.8% 32Fall/Jump for Elev.
24.1% 56Fall on the same level
48.7% 113Motor Vehicle
Percent Frequency Injury Cause
*Inpatient and outpatient
89 Total
1.1% 1 Repeated Motion/Pre
2.3% 2 Bodily Reaction
2.3% 2 Struck Against
2.3% 2 Struck By
3.4% 3 Fall on the same level
4.5% 4 Other damaging cont
10.2% 9 Overexertion
10.2% 9 Fall/Jump from Elev.
64.8% 57 Motor Vehicle
Percent Frequency Injury Cause
Injury Causes Associated with Spine or Back Strain/Sprain Medical Visits, Navy, CY04*
*Inpatient and outpatient
Injury Causes Associated with Lower Extremity Fracture Medical Visits, Navy, CY04*
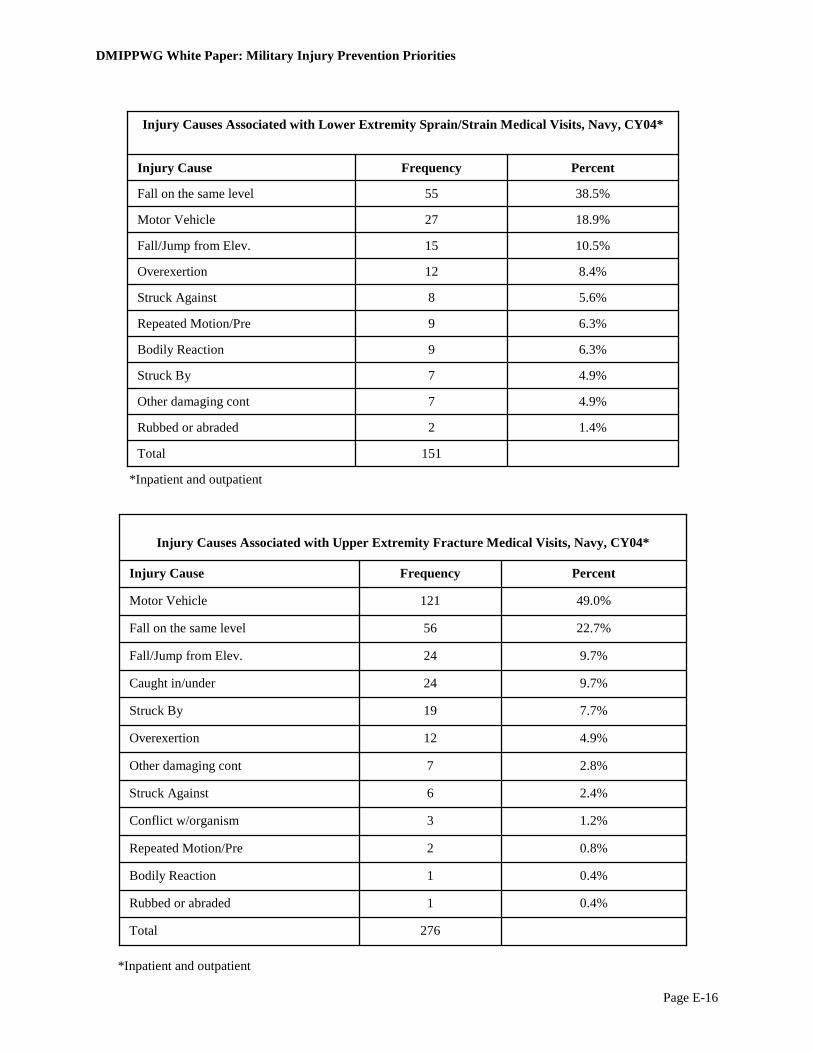
DMIPPWG White Paper: Military Injury Prevention Priorities
Page E-16
276 Total
0.4% 1 Rubbed or abraded
0.4% 1 Bodily Reaction
0.8% 2 Repeated Motion/Pre
1.2% 3 Conflict w/organism
2.4% 6 Struck Against
2.8% 7 Other damaging cont
4.9% 12 Overexertion
7.7% 19 Struck By
9.7% 24 Caught in/under
9.7% 24 Fall/Jump from Elev.
22.7% 56 Fall on the same level
49.0% 121 Motor Vehicle
Percent Frequency Injury Cause
Injury Causes Associated with Upper Extremity Fracture Medical Visits, Navy, CY04*
*Inpatient and outpatient
151 Total
1.4% 2 Rubbed or abraded
4.9% 7 Other damaging cont
4.9% 7 Struck By
6.3% 9 Bodily Reaction
6.3% 9 Repeated Motion/Pre
5.6% 8 Struck Against
8.4% 12 Overexertion
10.5% 15 Fall/Jump from Elev.
18.9% 27 Motor Vehicle
38.5% 55 Fall on the same level
Percent Frequency Injury Cause
Injury Causes Associated with Lower Extremity Sprain/Strain Medical Visits, Navy, CY04*
*Inpatient and outpatient
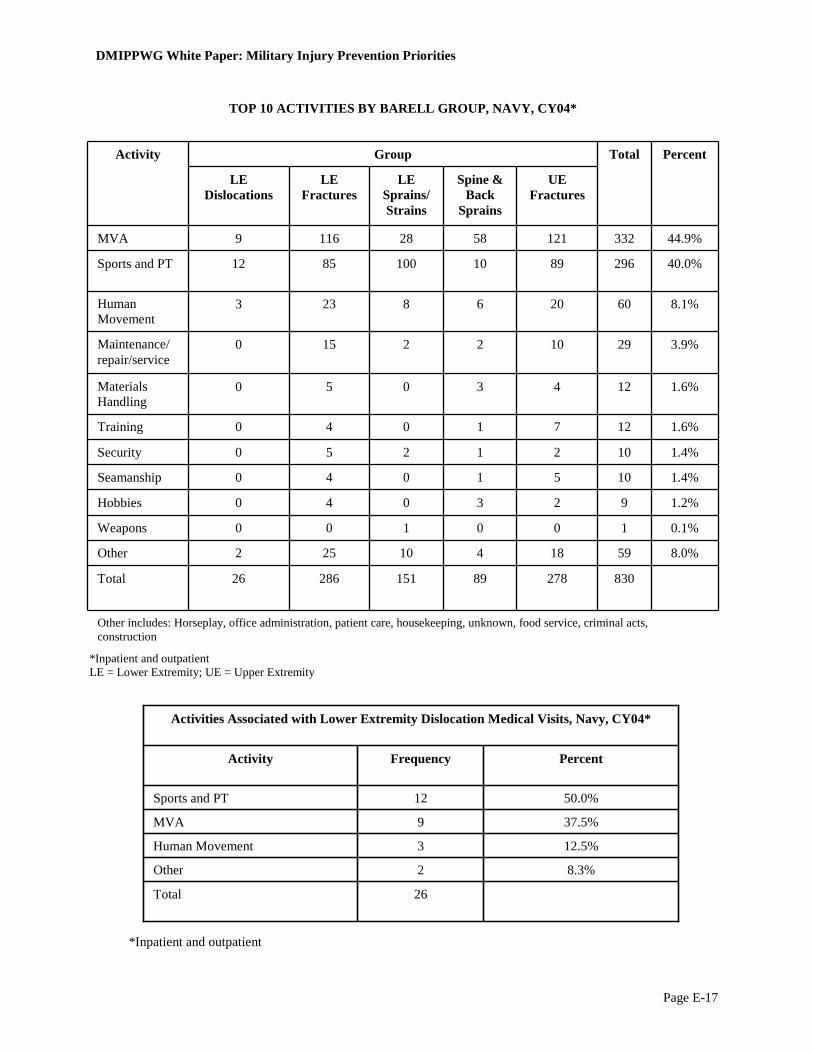
DMIPPWG White Paper: Military Injury Prevention Priorities
Page E-17
Other includes: Horseplay, office administration, patient care, housekeeping, unknown, food service, criminal acts, construction
830 278 89 151 286 26 Total
8.0% 59 18 4 10 25 2 Other
0.1% 1 0 0 1 0 0 Weapons
1.2% 9 2 3 0 4 0 Hobbies
1.4% 10 5 1 0 4 0 Seamanship
1.4% 10 2 1 2 5 0 Security
1.6% 12 7 1 0 4 0 Training
1.6% 12 4 3 0 5 0 Materials Handling
3.9% 29 10 2 2 15 0 Maintenance/ repair/service
8.1% 60 20 6 8 23 3 Human Movement
40.0% 296 89 10 100 85 12 Sports and PT
44.9% 332 121 58 28 116 9 MVA
UE Fractures
Spine & Back
Sprains
LE Sprains/Strains
LE Fractures
LE Dislocations
Percent Total Group Activity
TOP 10 ACTIVITIES BY BARELL GROUP, NAVY, CY04*
*Inpatient and outpatient LE = Lower Extremity; UE = Upper Extremity
*Inpatient and outpatient
26 Total
8.3% 2Other
12.5% 3Human Movement
37.5% 9MVA
50.0% 12Sports and PT
Percent Frequency Activity
Activities Associated with Lower Extremity Dislocation Medical Visits, Navy, CY04*
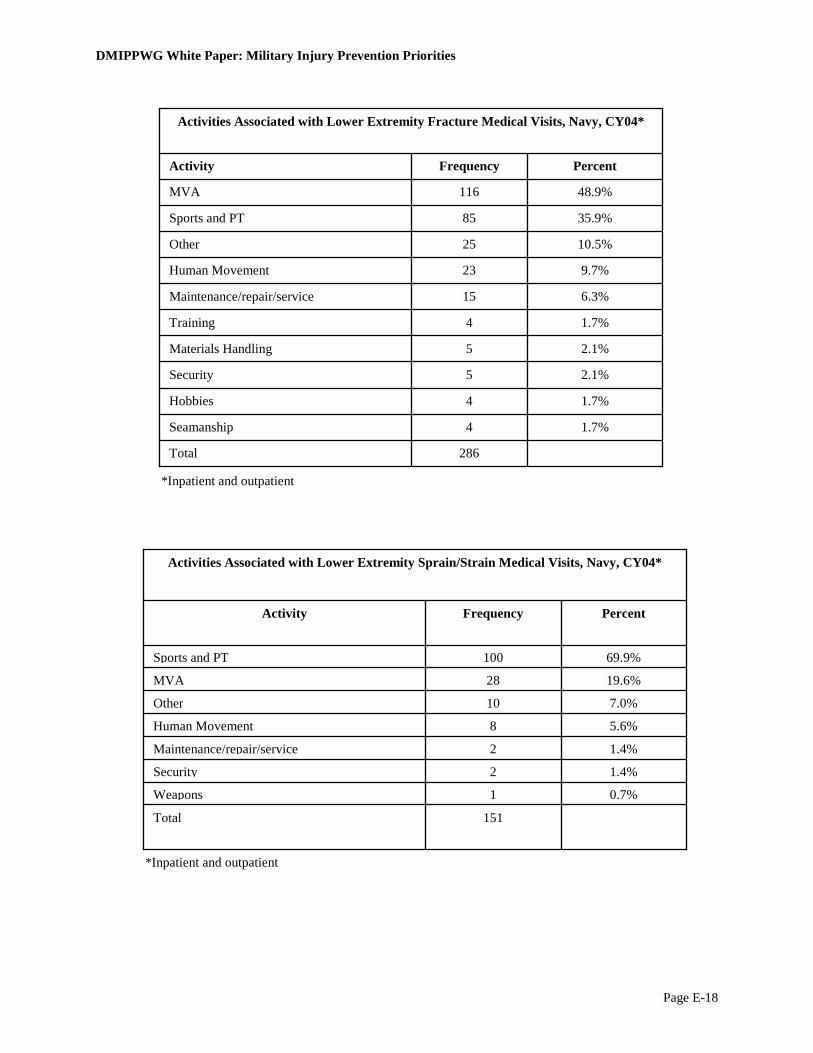
DMIPPWG White Paper: Military Injury Prevention Priorities
Page E-18
286 Total
1.7% 4 Seamanship
1.7% 4 Hobbies
2.1% 5 Security
2.1% 5 Materials Handling
1.7% 4 Training
6.3% 15 Maintenance/repair/service
9.7% 23 Human Movement
10.5% 25 Other
35.9% 85 Sports and PT
48.9% 116 MVA
Percent Frequency Activity
Activities Associated with Lower Extremity Fracture Medical Visits, Navy, CY04*
*Inpatient and outpatient
*Inpatient and outpatient
151 Total
0.7% 1Weapons
1.4% 2Security
1.4% 2Maintenance/repair/service
5.6% 8Human Movement
7.0% 10Other
19.6% 28MVA
69.9% 100Sports and PT
Percent Frequency Activity
Activities Associated with Lower Extremity Sprain/Strain Medical Visits, Navy, CY04*

DMIPPWG White Paper: Military Injury Prevention Priorities
Page E-19
89 Total
1.1% 1 Seamanship
1.1% 1 Security
1.1% 1 Training
2.3% 2 Maintenance/repair/service
3.4% 3 Hobbies
3.4% 3 Materials Handling
4.5% 4 Other
6.8% 6 Human Movement
11.4% 10 Sports and PT
65.9% 58 MVA
Percent Frequency Activity
Activities Associated with Spine and Back Sprain/Strain Medical Visits, Navy, CY04*
*Inpatient and outpatient
278 Total
0.8% 2 Hobbies
0.8% 2 Security
2.0% 5 Seamanship
1.6% 4 Materials Handling
2.8% 7 Training
4.0% 10 Maintenance/repair/service
7.2% 18 Other
8.0% 20 Human Movement
35.7% 89 Sports and PT
48.6% 121 MVA
Percent Frequency Activity
Activities Associated with Upper Extremity Fracture Medical Visits, Navy, CY04*
*Inpatient and outpatient

DMIPPWG White Paper: Military Injury Prevention Priorities
Page E-20
Medical and Safety Merge: Drill Down to Eligible Safety Cases, Navy, CY04*
830 Total number of Safety cases analyzed
830 169 Medical record not within 90 days of mishap date
999 992 No match with Medical (inpatient and outpatient)
1,991 4275 No Lost time
6,266 480 OCT-DEC 03
6,746 Starting Cases: NSC Data
Running Total Number of Excluded Cases
Excluded Cases
*Inpatient and outpatient
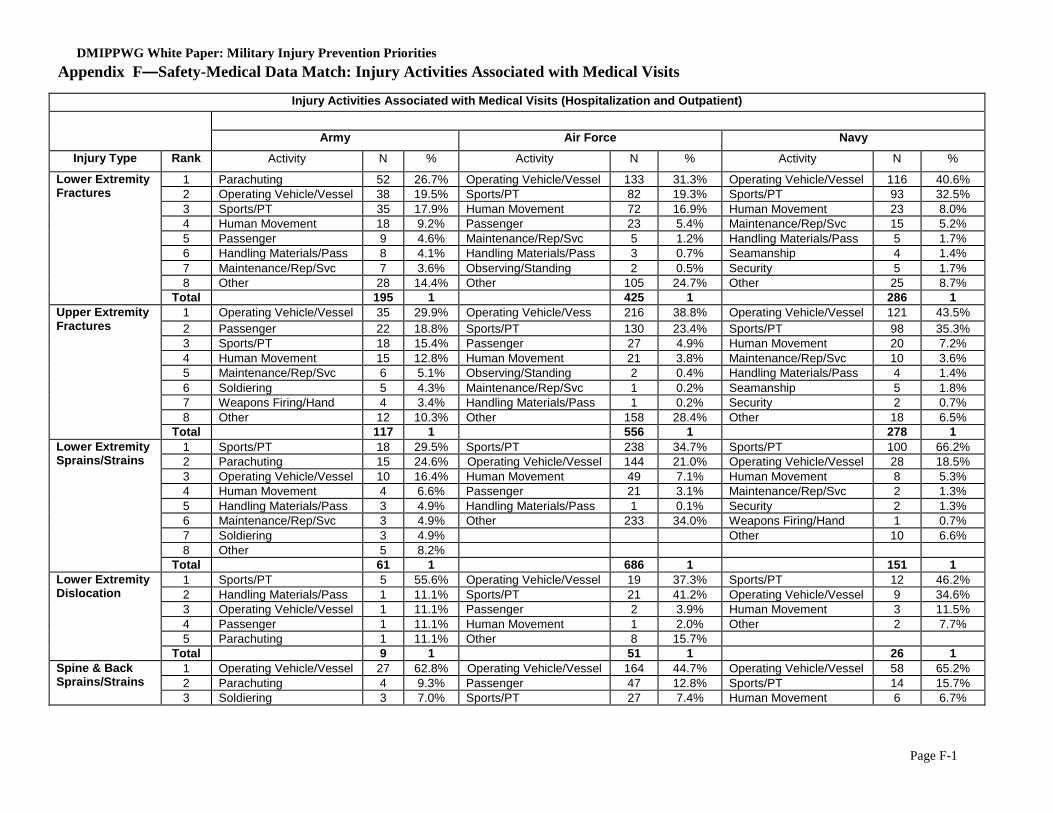
DMIPPWG White Paper: Military Injury Prevention Priorities
Page F-1
Injury Activities Associated with Medical Visits (Hospitalization and Outpatient)
Army Air Force Navy Injury Type Rank Activity N % Activity N % Activity N %
1 Parachuting 52 26.7% Operating Vehicle/Vessel 133 31.3% Operating Vehicle/Vessel 116 40.6% 2 Operating Vehicle/Vessel 38 19.5% Sports/PT 82 19.3% Sports/PT 93 32.5% 3 Sports/PT 35 17.9% Human Movement 72 16.9% Human Movement 23 8.0% 4 Human Movement 18 9.2% Passenger 23 5.4% Maintenance/Rep/Svc 15 5.2% 5 Passenger 9 4.6% Maintenance/Rep/Svc 5 1.2% Handling Materials/Pass 5 1.7% 6 Handling Materials/Pass 8 4.1% Handling Materials/Pass 3 0.7% Seamanship 4 1.4% 7 Maintenance/Rep/Svc 7 3.6% Observing/Standing 2 0.5% Security 5 1.7% 8 Other 28 14.4% Other 105 24.7% Other 25 8.7%
Lower Extremity Fractures
Total 195 1 425 1 286 1 1 Operating Vehicle/Vessel 35 29.9% Operating Vehicle/Vess 216 38.8% Operating Vehicle/Vessel 121 43.5% 2 Passenger 22 18.8% Sports/PT 130 23.4% Sports/PT 98 35.3% 3 Sports/PT 18 15.4% Passenger 27 4.9% Human Movement 20 7.2% 4 Human Movement 15 12.8% Human Movement 21 3.8% Maintenance/Rep/Svc 10 3.6% 5 Maintenance/Rep/Svc 6 5.1% Observing/Standing 2 0.4% Handling Materials/Pass 4 1.4% 6 Soldiering 5 4.3% Maintenance/Rep/Svc 1 0.2% Seamanship 5 1.8% 7 Weapons Firing/Hand 4 3.4% Handling Materials/Pass 1 0.2% Security 2 0.7% 8 Other 12 10.3% Other 158 28.4% Other 18 6.5%
Upper Extremity Fractures
Total 117 1 556 1 278 1 1 Sports/PT 18 29.5% Sports/PT 238 34.7% Sports/PT 100 66.2% 2 Parachuting 15 24.6% Operating Vehicle/Vessel 144 21.0% Operating Vehicle/Vessel 28 18.5% 3 Operating Vehicle/Vessel 10 16.4% Human Movement 49 7.1% Human Movement 8 5.3% 4 Human Movement 4 6.6% Passenger 21 3.1% Maintenance/Rep/Svc 2 1.3% 5 Handling Materials/Pass 3 4.9% Handling Materials/Pass 1 0.1% Security 2 1.3% 6 Maintenance/Rep/Svc 3 4.9% Other 233 34.0% Weapons Firing/Hand 1 0.7% 7 Soldiering 3 4.9% Other 10 6.6% 8 Other 5 8.2%
Lower Extremity Sprains/Strains
Total 61 1 686 1 151 1 1 Sports/PT 5 55.6% Operating Vehicle/Vessel 19 37.3% Sports/PT 12 46.2% 2 Handling Materials/Pass 1 11.1% Sports/PT 21 41.2% Operating Vehicle/Vessel 9 34.6% 3 Operating Vehicle/Vessel 1 11.1% Passenger 2 3.9% Human Movement 3 11.5% 4 Passenger 1 11.1% Human Movement 1 2.0% Other 2 7.7% 5 Parachuting 1 11.1% Other 8 15.7%
Lower Extremity Dislocation
Total 9 1 51 1 26 1 1 Operating Vehicle/Vessel 27 62.8% Operating Vehicle/Vessel 164 44.7% Operating Vehicle/Vessel 58 65.2% 2 Parachuting 4 9.3% Passenger 47 12.8% Sports/PT 14 15.7%
Spine & Back Sprains/Strains
3 Soldiering 3 7.0% Sports/PT 27 7.4% Human Movement 6 6.7%
Appendix F—Safety-Medical Data Match: Injury Activities Associated with Medical Visits
DMIPPWG White Paper: Military Injury Prevention Priorities
Page F-2
Injury Activities Associated with Medical Visits (Hospitalization and Outpatient)
Army Air Force Navy Injury Type Rank Activity N % Activity N % Activity N %
4 Sports/PT 3 7.0% Handling Materials/Pass 25 6.8% Handling Materials/Pass 3 3.4% 5 Other 6 14.0% Human Movement 13 3.5% Maintenance/Rep/Svc 2 2.2% 6 Other 91 24.8% Security 1 1.1% 7 Seamanship 1 1.1% 8 Other 4 4.5%
Total 43 1 367 1 89 1 Total Medical Visits 425 2085 830
Appendix F—Safety-Medical Data Match: Injury Activities Associated with Medical Visits
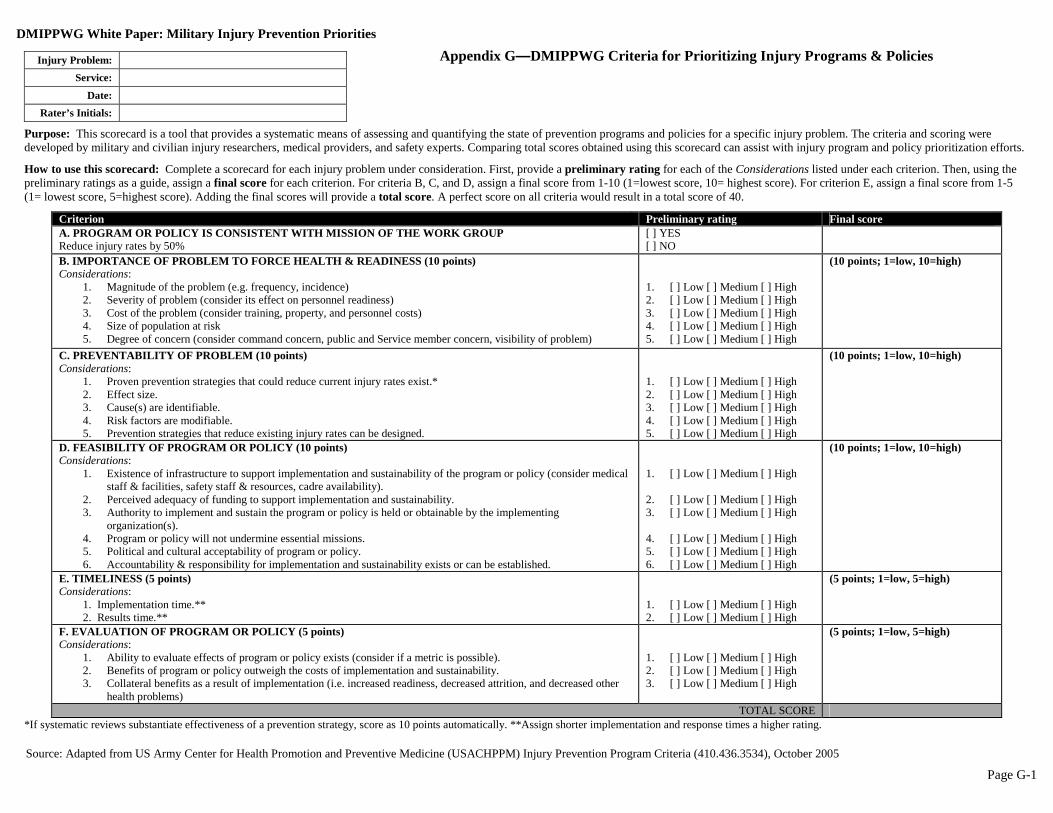
DMIPPWG White Paper: Military Injury Prevention Priorities
Page G-1
Appendix G—DMIPPWG Criteria for Prioritizing Injury Programs & Policies
Purpose: This scorecard is a tool that provides a systematic means of assessing and quantifying the state of prevention programs and policies for a specific injury problem. The criteria and scoring were developed by military and civilian injury researchers, medical providers, and safety experts. Comparing total scores obtained using this scorecard can assist with injury program and policy prioritization efforts.
How to use this scorecard: Complete a scorecard for each injury problem under consideration. First, provide a preliminary rating for each of the Considerations listed under each criterion. Then, using the preliminary ratings as a guide, assign a final score for each criterion. For criteria B, C, and D, assign a final score from 1-10 (1=lowest score, 10= highest score). For criterion E, assign a final score from 1-5 (1= lowest score, 5=highest score). Adding the final scores will provide a total score. A perfect score on all criteria would result in a total score of 40.
Criterion Preliminary rating Final score A. PROGRAM OR POLICY IS CONSISTENT WITH MISSION OF THE WORK GROUP Reduce injury rates by 50%
[ ] YES [ ] NO
B. IMPORTANCE OF PROBLEM TO FORCE HEALTH & READINESS (10 points) Considerations:
1. Magnitude of the problem (e.g. frequency, incidence) 2. Severity of problem (consider its effect on personnel readiness) 3. Cost of the problem (consider training, property, and personnel costs) 4. Size of population at risk 5. Degree of concern (consider command concern, public and Service member concern, visibility of problem)
1. [ ] Low [ ] Medium [ ] High 2. [ ] Low [ ] Medium [ ] High 3. [ ] Low [ ] Medium [ ] High 4. [ ] Low [ ] Medium [ ] High 5. [ ] Low [ ] Medium [ ] High
(10 points; 1=low, 10=high)
C. PREVENTABILITY OF PROBLEM (10 points) Considerations:
1. Proven prevention strategies that could reduce current injury rates exist.* 2. Effect size. 3. Cause(s) are identifiable. 4. Risk factors are modifiable. 5. Prevention strategies that reduce existing injury rates can be designed.
1. [ ] Low [ ] Medium [ ] High 2. [ ] Low [ ] Medium [ ] High 3. [ ] Low [ ] Medium [ ] High 4. [ ] Low [ ] Medium [ ] High 5. [ ] Low [ ] Medium [ ] High
(10 points; 1=low, 10=high)
D. FEASIBILITY OF PROGRAM OR POLICY (10 points) Considerations:
1. Existence of infrastructure to support implementation and sustainability of the program or policy (consider medical staff & facilities, safety staff & resources, cadre availability).
2. Perceived adequacy of funding to support implementation and sustainability. 3. Authority to implement and sustain the program or policy is held or obtainable by the implementing
organization(s). 4. Program or policy will not undermine essential missions. 5. Political and cultural acceptability of program or policy. 6. Accountability & responsibility for implementation and sustainability exists or can be established.
1. [ ] Low [ ] Medium [ ] High 2. [ ] Low [ ] Medium [ ] High 3. [ ] Low [ ] Medium [ ] High 4. [ ] Low [ ] Medium [ ] High 5. [ ] Low [ ] Medium [ ] High 6. [ ] Low [ ] Medium [ ] High
(10 points; 1=low, 10=high)
E. TIMELINESS (5 points) Considerations:
1. Implementation time.** 2. Results time.**
1. [ ] Low [ ] Medium [ ] High 2. [ ] Low [ ] Medium [ ] High
(5 points; 1=low, 5=high)
F. EVALUATION OF PROGRAM OR POLICY (5 points) Considerations:
1. Ability to evaluate effects of program or policy exists (consider if a metric is possible). 2. Benefits of program or policy outweigh the costs of implementation and sustainability. 3. Collateral benefits as a result of implementation (i.e. increased readiness, decreased attrition, and decreased other
health problems)
1. [ ] Low [ ] Medium [ ] High 2. [ ] Low [ ] Medium [ ] High 3. [ ] Low [ ] Medium [ ] High
(5 points; 1=low, 5=high)
TOTAL SCORE *If systematic reviews substantiate effectiveness of a prevention strategy, score as 10 points automatically. **Assign shorter implementation and response times a higher rating.
Injury Problem: Service:
Date: Rater’s Initials:
Source: Adapted from US Army Center for Health Promotion and Preventive Medicine (USACHPPM) Injury Prevention Program Criteria (410.436.3534), October 2005
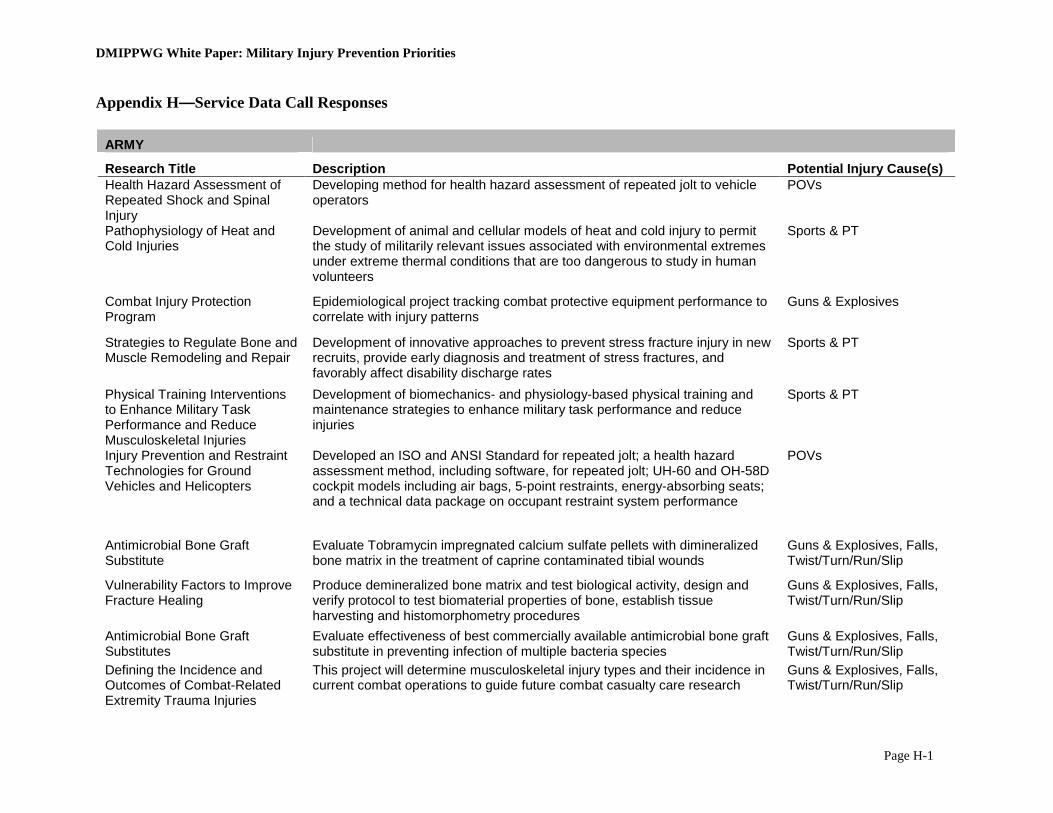
DMIPPWG White Paper: Military Injury Prevention Priorities
Page H-1
Appendix H—Service Data Call Responses
ARMY
Research Title Description Potential Injury Cause(s) Health Hazard Assessment of Repeated Shock and Spinal Injury
Developing method for health hazard assessment of repeated jolt to vehicle operators
POVs
Pathophysiology of Heat and Cold Injuries
Development of animal and cellular models of heat and cold injury to permit the study of militarily relevant issues associated with environmental extremes under extreme thermal conditions that are too dangerous to study in human volunteers
Sports & PT
Combat Injury Protection Program
Epidemiological project tracking combat protective equipment performance to correlate with injury patterns
Guns & Explosives
Strategies to Regulate Bone and Muscle Remodeling and Repair
Development of innovative approaches to prevent stress fracture injury in new recruits, provide early diagnosis and treatment of stress fractures, and favorably affect disability discharge rates
Sports & PT
Physical Training Interventions to Enhance Military Task Performance and Reduce Musculoskeletal Injuries
Development of biomechanics- and physiology-based physical training and maintenance strategies to enhance military task performance and reduce injuries
Sports & PT
Injury Prevention and Restraint Technologies for Ground Vehicles and Helicopters
Developed an ISO and ANSI Standard for repeated jolt; a health hazard assessment method, including software, for repeated jolt; UH-60 and OH-58D cockpit models including air bags, 5-point restraints, energy-absorbing seats; and a technical data package on occupant restraint system performance
POVs
Antimicrobial Bone Graft Substitute
Evaluate Tobramycin impregnated calcium sulfate pellets with dimineralized bone matrix in the treatment of caprine contaminated tibial wounds
Guns & Explosives, Falls, Twist/Turn/Run/Slip
Vulnerability Factors to Improve Fracture Healing
Produce demineralized bone matrix and test biological activity, design and verify protocol to test biomaterial properties of bone, establish tissue harvesting and histomorphometry procedures
Guns & Explosives, Falls, Twist/Turn/Run/Slip
Antimicrobial Bone Graft Substitutes
Evaluate effectiveness of best commercially available antimicrobial bone graft substitute in preventing infection of multiple bacteria species
Guns & Explosives, Falls, Twist/Turn/Run/Slip
Defining the Incidence and Outcomes of Combat-Related Extremity Trauma Injuries
This project will determine musculoskeletal injury types and their incidence in current combat operations to guide future combat casualty care research
Guns & Explosives, Falls, Twist/Turn/Run/Slip
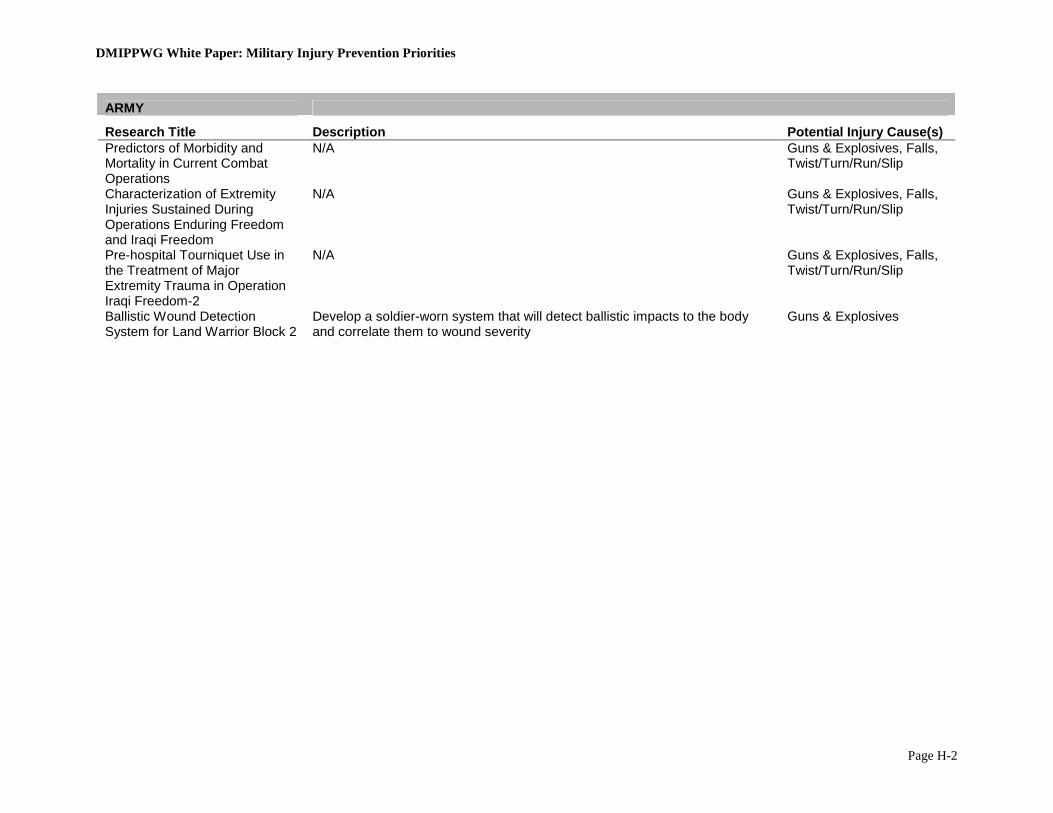
DMIPPWG White Paper: Military Injury Prevention Priorities
Page H-2
ARMY
Research Title Description Potential Injury Cause(s) Predictors of Morbidity and Mortality in Current Combat Operations
N/A Guns & Explosives, Falls, Twist/Turn/Run/Slip
Characterization of Extremity Injuries Sustained During Operations Enduring Freedom and Iraqi Freedom
N/A Guns & Explosives, Falls, Twist/Turn/Run/Slip
Pre-hospital Tourniquet Use in the Treatment of Major Extremity Trauma in Operation Iraqi Freedom-2
N/A Guns & Explosives, Falls, Twist/Turn/Run/Slip
Ballistic Wound Detection System for Land Warrior Block 2
Develop a soldier-worn system that will detect ballistic impacts to the body and correlate them to wound severity
Guns & Explosives
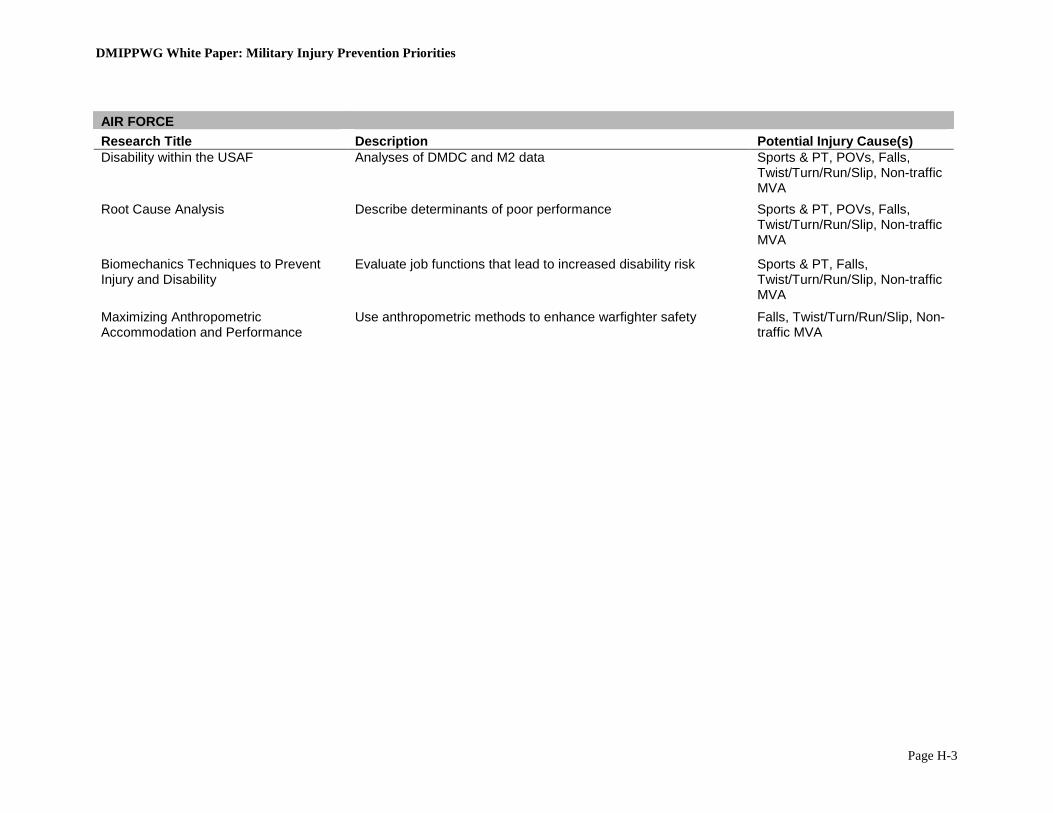
DMIPPWG White Paper: Military Injury Prevention Priorities
Page H-3
AIR FORCE Research Title Description Potential Injury Cause(s) Disability within the USAF Analyses of DMDC and M2 data Sports & PT, POVs, Falls,
Twist/Turn/Run/Slip, Non-traffic MVA
Root Cause Analysis Describe determinants of poor performance Sports & PT, POVs, Falls, Twist/Turn/Run/Slip, Non-traffic MVA
Biomechanics Techniques to Prevent Injury and Disability
Evaluate job functions that lead to increased disability risk Sports & PT, Falls, Twist/Turn/Run/Slip, Non-traffic MVA
Maximizing Anthropometric Accommodation and Performance
Use anthropometric methods to enhance warfighter safety Falls, Twist/Turn/Run/Slip, Non-traffic MVA
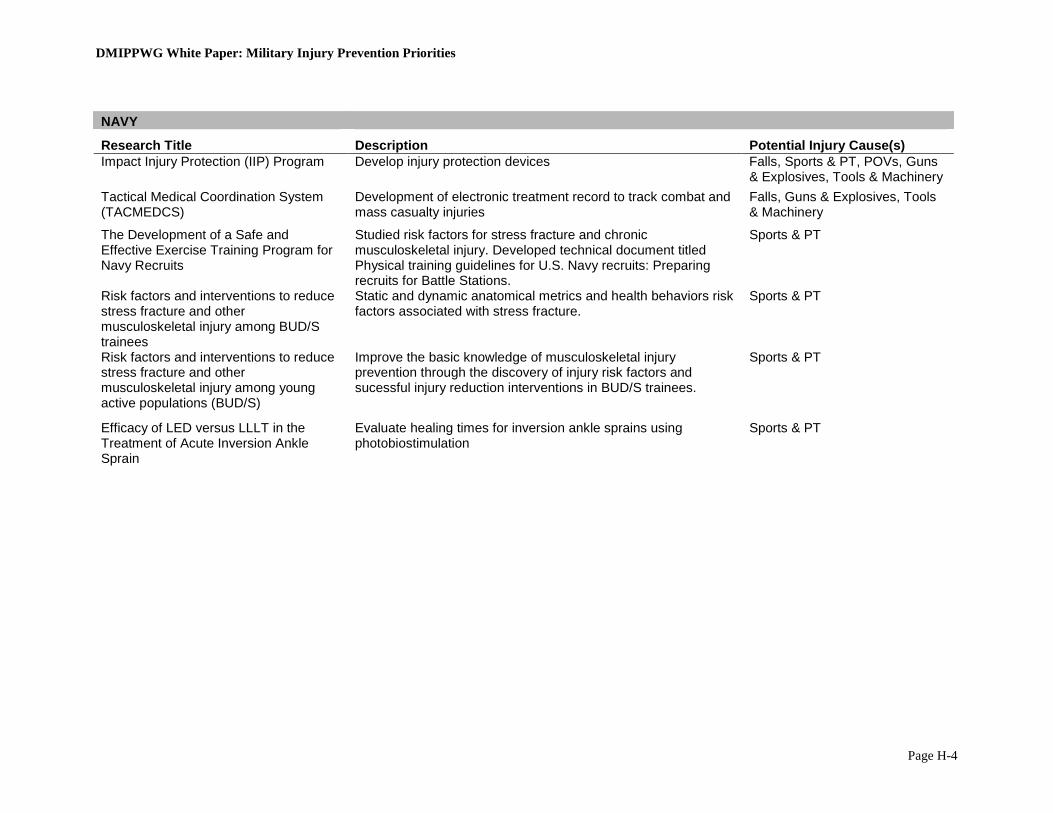
DMIPPWG White Paper: Military Injury Prevention Priorities
Page H-4
NAVY
Research Title Description Potential Injury Cause(s) Impact Injury Protection (IIP) Program Develop injury protection devices Falls, Sports & PT, POVs, Guns
& Explosives, Tools & Machinery Tactical Medical Coordination System (TACMEDCS)
Development of electronic treatment record to track combat and mass casualty injuries
Falls, Guns & Explosives, Tools & Machinery
The Development of a Safe and Effective Exercise Training Program for Navy Recruits
Studied risk factors for stress fracture and chronic musculoskeletal injury. Developed technical document titled Physical training guidelines for U.S. Navy recruits: Preparing recruits for Battle Stations.
Sports & PT
Risk factors and interventions to reduce stress fracture and other musculoskeletal injury among BUD/S trainees
Static and dynamic anatomical metrics and health behaviors risk factors associated with stress fracture.
Sports & PT
Risk factors and interventions to reduce stress fracture and other musculoskeletal injury among young active populations (BUD/S)
Improve the basic knowledge of musculoskeletal injury prevention through the discovery of injury risk factors and sucessful injury reduction interventions in BUD/S trainees.
Sports & PT
Efficacy of LED versus LLLT in the Treatment of Acute Inversion Ankle Sprain
Evaluate healing times for inversion ankle sprains using photobiostimulation
Sports & PT
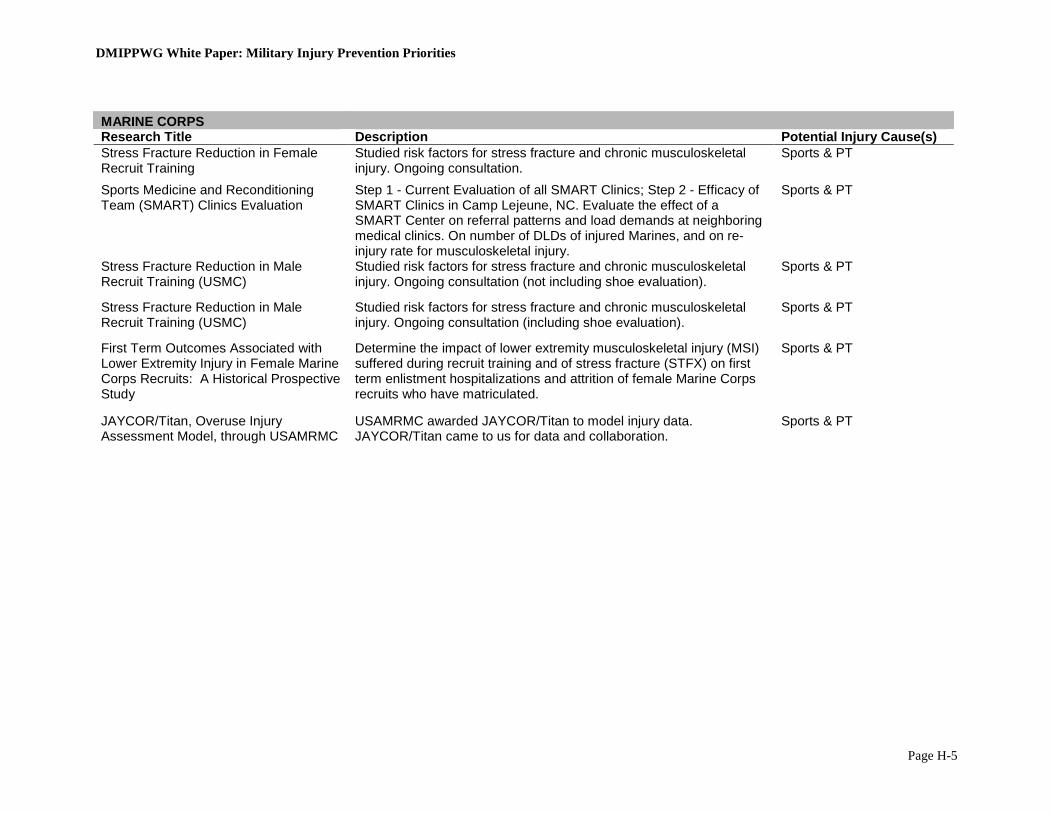
DMIPPWG White Paper: Military Injury Prevention Priorities
Page H-5
MARINE CORPS Research Title Description Potential Injury Cause(s) Stress Fracture Reduction in Female Recruit Training
Studied risk factors for stress fracture and chronic musculoskeletal injury. Ongoing consultation.
Sports & PT
Sports Medicine and Reconditioning Team (SMART) Clinics Evaluation
Step 1 - Current Evaluation of all SMART Clinics; Step 2 - Efficacy of SMART Clinics in Camp Lejeune, NC. Evaluate the effect of a SMART Center on referral patterns and load demands at neighboring medical clinics. On number of DLDs of injured Marines, and on re-injury rate for musculoskeletal injury.
Sports & PT
Stress Fracture Reduction in Male Recruit Training (USMC)
Studied risk factors for stress fracture and chronic musculoskeletal injury. Ongoing consultation (not including shoe evaluation).
Sports & PT
Stress Fracture Reduction in Male Recruit Training (USMC)
Studied risk factors for stress fracture and chronic musculoskeletal injury. Ongoing consultation (including shoe evaluation).
Sports & PT
First Term Outcomes Associated with Lower Extremity Injury in Female Marine Corps Recruits: A Historical Prospective Study
Determine the impact of lower extremity musculoskeletal injury (MSI) suffered during recruit training and of stress fracture (STFX) on first term enlistment hospitalizations and attrition of female Marine Corps recruits who have matriculated.
Sports & PT
JAYCOR/Titan, Overuse Injury Assessment Model, through USAMRMC
USAMRMC awarded JAYCOR/Titan to model injury data. JAYCOR/Titan came to us for data and collaboration.
Sports & PT

DMIPPWG White Paper: Military Injury Prevention Priorities
Page I-1
Appendix I—Military Training Task Force Recommendations
Military Training Task Force Joint Services Physical Training Injury Prevention Work Group
Recommended Interventions and Program Elements
To Reduce Physical Training-Related Injuries RECOMMENDATION 1 Prevent overtraining by de-emphasizing distance running during physical training. Overtraining (caused largely by excessive distance running) results in higher injury rates, lowered physical performance, decreased motivation, and increased fatigue and attrition. The Joint Services Physical Training Injury Prevention Work Group (JSPTIPWG) found strong evidence that physical training programs, especially in initial military training, that reduce distance running miles and incorporate the following related six elements prevent overtraining and reduce injury rates while maintaining or improving physical fitness:
(1) Commanders at all levels should actively avoid combinations of physical and military training that exceed physiologic thresholds of overtraining that result in higher injury rates and do not improve fitness. Commanders can monitor profile (limited duty excusals) rates and fitness test pass rates and run times to determine if their units are overtraining. Signs that a unit is overtraining include high or increasing lower body injury profile rates, decreased fitness test pass rates, and slower average run times. Other ways to achieve this objective include the following recommendations.
(2) Follow a standardized, gradual, systematic progression of running distance and speed
beginning with lower mileage and intensity, especially for those just starting a physical training program (e.g., new recruits, changing units, or returning to PT after time off for an injury or leave).
(3) Structure physical training injury prevention programs to target those servicemembers at
the highest risk of injury (those of average or below average fitness) by ensuring that the running mileage for the least fit servicemembers is appropriate for their fitness level. a. Use fitness test performance (run times) to place servicemembers in ability groups of
similar fitness levels that provide each servicemember with a more appropriate level of physiological stimulus to enhance fitness and minimize injury risk. (Running by time, not distance, allows the least fit to run shorter distances than the most fit, thus accommodating low and high fitness groups simultaneously).
b. Avoid remedial physical training programs that require the least fit servicemembers, especially recruits, to do more training than fit servicemembers since it significantly increases risk of overtraining and injury with little or no fitness improvement. (Gradual, progressive ability group training programs improve fitness with less risk of overtraining and injury.)
DMIPPWG White Paper: Military Injury Prevention Priorities
Page I-2
c. Limit formation running as it overtrains the least fit and provides an inadequate training effect for the most fit.
(4) Replace some distance runs with higher intensity, shorter distance runs (e.g., interval
training activities like repeated sprints, Fartlek training, and last-man-up, etc.) that increase speed and stamina more rapidly than distance running while limiting total miles run.
(5) Balance the body’s need for a physiologic training overload with the need for recovery
and rebuilding by coordinating military and physical training to: a. Avoid exhaustive military or physical training (e.g., obstacle courses, long road
marches with heavy loads, longer runs, maximal-effort physical fitness testing, etc.) on the same or successive days.
b. Allow adequate recovery time between administrations of maximal effort physical fitness tests (ideally 3-5 days for servicemembers in operational units) to prevent overtraining and increase the likelihood of improved physical performance.
c. Alternate training days that emphasize lower body weight-bearing physical activity with training days focused on upper body conditioning.
d. Minimize the accumulated weight-bearing stress on the lower body from marching/hiking, movements to training sites, drill and ceremony, obstacle courses, running, etc., by not over scheduling such activities on the same or successive days.
(6) Perform lower intensity, task-specific, dynamic activities to warm-up prior to more
intense physical training (e.g., walking and slow jogging in preparation for running). Since the scientific evidence is clear that pre-exercise stretching is not protective against injuries, one should not expect stretching exercises during warm-up to prevent physical training-related injuries.
Rationale Military research has demonstrated that during initial military training about 25 percent of men and about 50 percent of women incur one or more physical training-related injuries. About 80 percent of these injuries are in the lower extremities and are of the overuse type—a condition brought about by physical training volume overload (generally excessive running). Both civilian and military research shows that increasing running mileage increases the incidence of musculoskeletal injuries. A landmark physical training study demonstrates that there are thresholds of exercise above which increases in running duration and frequency dramatically increase risk of injury with little improvement on estimated 2-mile run times or maximal oxygen uptake (a measure of cardiovascular endurance that correlates with run-time performance). This study examined the effects of increasing duration and frequency of running on injury risks and run performance among previously sedentary young adult males.

DMIPPWG White Paper: Military Injury Prevention Priorities
Page I-3
Table 1 illustrates that running duration of 45 minutes versus 30 minutes increases the injury incidence (percent of subjects injured) by 125% (over 2 times) with only a 5% increase in maximal oxygen uptake (equivalent of an estimated 18 seconds faster on a 2-mile run). Table 2 indicates that a running frequency of 5 times per week versus 3 times per week increases the injury incidence by 225% (over 3 times) with only a 35% increase in maximal oxygen uptake (equivalent of an estimated 36 seconds faster on a 2-mile run). This study shows that there are physiological thresholds above which increases in exercise duration and frequency do not result in a commensurate increase in fitness, but do result in higher injury rates (particularly for people with average and below average fitness levels). The bottom line is that the amount of running can be dramatically reduced to prevent injuries without decreasing fitness levels. Table 1. Running duration, injuries, and cardiovascular endurance.*
Duration (min/day)
Injury Incidence (percent)
Change in CV Endurance (percent maximal oxygen uptake)
Estimated Change in 2-Mile Run Time
(minutes) 0 0 -.7 - :06
15 22 8.7 1:12 30 24 16.1 2:00 45 54 16.9 2:18
From 30 to 45 min/day 125% increase 5% greater :18 faster *Training: running 3 days/week, 85-90% MHR. Table 2. Running frequency, injuries, and cardiovascular endurance.*
Frequency (days/week)
Injury Incidence (percent)
Change in CV Endurance (percent maximal oxygen uptake)
Estimated Change in 2-Mile Run Time
(minutes) 0 0 -3.4 - :30 1 0 8.3 1:06 3 12 12.9 1:48 5 39 17.4 2:24
From 3 to 5 days/wk 225% increase 35% greater :36 faster *Training: running 30 min, 85-90% MHR. Military research also shows that the gradual introduction of running and the reduction of running mileage reduces injury incidence. A program that de-emphasizes distance runs but which systematically and progressively increases running mileage to a maintenance point reduces injury rates and fosters just as much improvement in physical fitness. The research is clear that performing LESS distance running does NOT adversely affect servicemember scores on standard Service-specific cardiorespiratory fitness testing while reducing injuries. Interval training is one of the best methods of reducing total running mileage while most efficiently increasing cardiovascular fitness. From a performance perspective, substantial evidence exists that interval training results in more rapid improvements in running speed and endurance than long-slow sustained running, and these improvements are achieved with many fewer total miles run. Military studies that have included interval training with reduced total
DMIPPWG White Paper: Military Injury Prevention Priorities
Page I-4
running mileage have shown fitness improvements as great as or greater than those with long-slow sustained running. Least fit servicemembers are two to three times more likely to be injured as their more fit counterparts, especially in the recruit training environment. In order to reduce injuries and attrition rates while maximizing physical performance requires that the core of any physical training program be targeted directly at these servicemembers of average and below average fitness levels. Servicemembers of below average fitness who overreach their physical capability have an increased risk of overtraining characterized by increased injuries, fatigue and depression and decreased motivation and physical performance. RECOMMENDATION 2 Increase exercises to improve body movement skills during physical training. The JSPTIPWG found good evidence that increasing the proportion of physical training time devoted to improvement of body movement skills reduces injuries. These body movement skills include agility, posture, stability, flexibility, balance, speed, power, reactive ability, and coordination. Focus must be on improving precision of movement during execution of these exercises. Rationale Including more body movement skills training and more strength and agility conditioning in physical training sessions reduces injury risk for several key reasons: (1) incorporating these activities into a finite training period reduces the trainees’ excessive exposure to running activities, thereby reducing lower body injury risk; (2) musculoskeletal stresses of training are more evenly distributed across the body by these type drills (unlike running, which focuses stress narrowly in the lower body), thereby reducing injury risk; and (3) strength and stabilization exercises directed at the body core (trunk) represent many of the same movements required during more complex combat activities and thereby increase the likelihood of improved military occupational task performance. Physical training should balance cardiovascular stamina with strength and agility by providing strength and agility conditioning on alternate days from cardiovascular training (i.e., running, marching/hiking, etc.). Varying conditioning is a standard training technique in the athletic world that permits more conditioning activity without overtraining one particular muscle group or system. Some examples where this kind of balanced training has proven successful in the military are Physical Readiness Training for Army initial entry training and the Marine Corps Recruit Training Program. Consistent adherence to the standardized approach to body movement skills physical training will maximize PT time and develop the optimal combination of strength, coordination, agility, power, and stamina in warfighters. RECOMMENDATION 3 Provide mouthguards for all individuals participating in high-risk activities.
DMIPPWG White Paper: Military Injury Prevention Priorities
Page I-5
The JSPTIPWG found good evidence that mouthguards reduce orofacial injuries when worn during activities with high orofacial injury risk (e.g., combatives, obstacle courses, rifle/bayonet training, etc., and contact sports such as basketball, football, etc.). Rationale Army Training and Doctrine Command posts where trainees wear mouthguards have reduced orofacial injuries by 68 percent. Also, civilian studies show that mouthguards result in large reductions in dental injuries in specific sports (e.g., football, rugby, basketball, and ice hockey). The Army has made mouthguard use a requirement by incorporating this intervention in AR 600-63; Army Health Promotion Program: “The Army Unit commanders will require and enforce mouthguard use during pugil stick training, bayonet/M16 training, obstacle/confidence course training, and hand-to-hand combat training. Commanders will require mouthguard use during PT or Unit sports activities that may involve injury to the face or mouth as a result of head-to-head contact, falls, tooth clenching or blows to the mouth.” The Army Center for Health Promotion and Preventive Medicine has designed a program review and Mouthguard Implementation Toolkit to facilitate implementation of this recommendation (see http://chppm-www.apgea.army.mil/dhpw/Wellness/mouthguard.aspx). RECOMMENDATION 4 Make semi-rigid ankle braces available for use by individuals at high risk for re-injury (i.e., those with history of previous ankle sprains) and for others during high-risk activities. The JSPTIPWG found strong evidence that semi-rigid ankle braces reduce re-injuries for individuals with previous moderate or severe ankle sprains and good evidence that semi-rigid ankle braces reduce ankle injuries when participating in high-risk physical activity such as airborne operations (parachuting), obstacle courses, basketball, volleyball, soccer, etc. Rationale One of the most significant risk factors for sustaining a new ankle sprain injury of any grade is a previous sprain of the same ankle. In other words, once one has sustained an ankle sprain injury, the risks of re-injury to that same ankle are extremely high regardless of the mechanism of the initial injury (e.g., sports, parachuting, stepping in a hole, etc.). This can be due to a loss of muscle and/or ligament strength, proprioception (joint position sense), muscle reaction time or, most likely, all of the above. Individuals with a past history of moderate to severe ankle sprain should wear ankle braces during activities where ankle injuries are likely (e.g., sports, obstacle courses, parachuting, etc.). Sufficient evidence exists to recommend semi-rigid ankle stirrup braces that allow plantarflexion and dorsiflexion (up and down) but limit inversion and eversion (turning the foot/ankle complex in and out) for others when engaged in activities where the risk of inverting or everting the ankle beyond its normal limits is high. Generally, these activities include training or landing on uneven or unpredictable surfaces (e.g., rugged terrain, night ground operations, movement through heavy undergrowth, airborne operations, etc.) and sports

DMIPPWG White Paper: Military Injury Prevention Priorities
Page I-6
or sport-like activities that require sudden changes in direction and that may involve collision or contact with opponents’ feet or a ball (e.g., obstacle course, basketball, volleyball, soccer, etc.). RECOMMENDATION 5 Provide nutritional supplementation (protein/carbohydrate snack and electrolyte fluids) within one hour after strenuous, prolonged, continuous physical activity of greater than one hour. The JSPTIPWG found sufficient evidence that supplementation of a carbohydrate-protein snack and balanced fluid replacement beverage within one hour after very strenuous, prolonged, continuous physical activity (e.g., prolonged road marching/hiking) reduces injury. Collateral benefits such as reduction of heat-related illness and enhanced physical performance can be expected. Rationale Research indicates that restoring energy balance and adequate muscle glycogen (carbohydrate stores in the muscle) decreases markers of muscle damage due to physical activity. Sustained physical activity and intermittent high intensity activity deplete the body’s glycogen stores and fatigue muscles, which then reduce their strength and ability to protect joints. Research shows a link between muscle glycogen depletion and markers of muscle damage, fatigue and musculoskeletal pain. Studies of active women also indicate a negative energy balance is a risk factor for stress fractures of the bone. Both civilian and military research have provided evidence that nutritional supplementation overcomes fatigue, minimizes muscle damage, and protects against heat injury. However, the timing of the nutritional intervention is critical. Specifically, research indicates that providing a combination of carbohydrates and protein within a 60-minute window immediately following very strenuous exercise initiates repair of muscles damaged during the activity and begins the replenishment of muscle glycogen stores. During this time, metabolic environment is optimized for rebuilding what was used or broken down during the exercise. If the nutrients are not provided until more than one hour afterwards, the metabolic environment is less well prepared to absorb the nutrients; thus minimizing recovery.
The ideal amount of nutritional supplementation needed to allow for the most rapid replenishment of muscle glycogen to protect against muscle damage and accelerate the recovery process is roughly 50 to 75 grams of carbohydrate and 12 to 18 grams of protein (1 gram of protein for every 4 grams of carbohydrate). ESSENTIAL PROGRAM ELEMENTS Injury Prevention Education The JSPTIPWG strongly recommends injury prevention education for all levels of leadership whether as a part of institutionalized continuing military education or web-based distance learning programs. The reduction of injuries is most likely to occur if all levels of leadership
DMIPPWG White Paper: Military Injury Prevention Priorities
Page I-7
(command and cadre) understand how servicemembers are injured and which interventions work to prevent them. Education is the first step in disseminating evidence-based interventions that can be implemented at the unit level and is the first component of any successful program that reduces injuries. Leadership Enforcement The JSPTIPWG strongly recommends military and civilian leadership enforcement of injury prevention policies and programs at all levels. The success of any program is directly related to the level of visible command support and involvement. The unit commander is the critical agent for injury prevention intervention. Effective command emphasis on injury prevention must be consistent, lasting, and based on evidence-based interventions and common sense to reduce exposure to injury risk during physical training, field exercises, and off-duty recreational activities. Surveillance The JSPTIPWG strongly recommends the Military Training Task Force (MTTF) support mandatory injury cause coding and automated physical profiling (documented nature of limited duty severity) in the outpatient electronic health record. To systematically analyze and prevent injuries throughout the DoD, routine medical surveillance of injury causes and severity is critical. Currently, cause coding for injury hospitalizations is fairly complete. However, the vast majority of injuries and injury-related musculoskeletal conditions (over 1.9 million annually across DoD resulting in an estimated 25 million days of limited duty) are treated on an outpatient basis, which is why it is so important to capture cause and severity data. (Severity and direct impact on physical readiness can be tracked and reported through the use of an automated physical profile which captures the number of days lost to ‘sick in quarters,’ the number of days of limited duty, and the degree of physical limitations due to injury.) The current and emerging electronic health record (Composite Health Care System and AHLTA) do not enforce the guidelines for recording and coding injury causation and severity (physical profiling) in the outpatient record. Additionally, department wide surveillance of physical fitness would also provide rich information since it is one of the primary risk factors for injury. Data on injury cause and severity, as well as physical fitness, would greatly facilitate the prioritization of resources, research, and the targeting of interventions to reduce injury rates, thereby improving physical readiness. Research and Program Evaluation The JSPTIPWG strongly recommends a greater investment of resources (DoD wide) to investigate promising interventions to reduce injuries. The sparse number of interventions that had enough scientific evidence to evaluate effectiveness for the leading health problem impacting on U.S. military force readiness today is a testament to the need for more research and program evaluation in this area of musculoskeletal injury prevention.

DMIPPWG White Paper: Military Injury Prevention Priorities
Page I-8
POCs: Joint Services Physical Training Injury Prevention Work Group Co-chairs: LTC Steven H. Bullock, USACHPPM, Health Promotion Policy Program Manager, 410-436-7007, [email protected] Dr. Bruce H. Jones, USACHPPM, Injury Program Manager, 410-436-1008, [email protected]
Scientific references for these recommendations are available upon request.

![RUNNING HEAD: Affirmative Meritocracy Affirmative ... · Affirmative Meritocracy 3 Affirmative Meritocracy “[A]ffirmative action has to be made consistent with our highest ideals](https://static.fdocuments.us/doc/165x107/6014d37ad021f81c1a51c696/running-head-affirmative-meritocracy-affirmative-affirmative-meritocracy-3.jpg)