Report Department of Health and NHS England · PDF fileImproving patient access to general...
50
Report by the Comptroller and Auditor General Department of Health and NHS England Improving patient access to general practice HC 913 SESSION 2016-17 11 JANUARY 2017
Transcript of Report Department of Health and NHS England · PDF fileImproving patient access to general...

Reportby the Comptroller and Auditor General
Department of Health and NHS England
Improving patient access to general practice
HC 913 SESSION 2016-17 11 JANUARY 2017

Our vision is to help the nation spend wisely.
Our public audit perspective helps Parliament hold government to account and improve public services.
The National Audit Office scrutinises public spending for Parliament and is independent of government. The Comptroller and Auditor General (C&AG), Sir Amyas Morse KCB, is an Officer of the House of Commons and leads the NAO, which employs some 785 people. The C&AG certifies the accounts of all government departments and many other public sector bodies. He has statutory authority to examine and report to Parliament on whether departments and the bodies they fund have used their resources efficiently, effectively, and with economy. Our studies evaluate the value for money of public spending, nationally and locally. Our recommendations and reports on good practice help government improve public services, and our work led to audited savings of £1.21 billion in 2015.

Report by the Comptroller and Auditor General
Ordered by the House of Commons to be printed on 9 January 2017
This report has been prepared under Section 6 of the National Audit Act 1983 for presentation to the House of Commons in accordance with Section 9 of the Act
Sir Amyas Morse KCB Comptroller and Auditor General National Audit Office
5 January 2017
HC 913 | £10.00
Department of Health and NHS England
Improving patient access to general practice

This report examines the structures and mechanisms that exist to improve patient access to general practice.
© National Audit Office 2017
The material featured in this document is subject to National Audit Office (NAO) copyright. The material may be copied or reproduced for non-commercial purposes only, namely reproduction for research, private study or for limited internal circulation within an organisation for the purpose of review.
Copying for non-commercial purposes is subject to the material being accompanied by a sufficient acknowledgement, reproduced accurately, and not being used in a misleading context. To reproduce NAO copyright material for any other use, you must contact [email protected]. Please tell us who you are, the organisation you represent (if any) and how and why you wish to use our material. Please include your full contact details: name, address, telephone number and email.
Please note that the material featured in this document may not be reproduced for commercial gain without the NAO’s express and direct permission and that the NAO reserves its right to pursue copyright infringement proceedings against individuals or companies who reproduce material for commercial gain without our permission.
Links to external websites were valid at the time of publication of this report. The National Audit Office is not responsible for the future validity of the links.
11350 01/17 NAO

The National Audit Office study team consisted of: Sergiu Cociu, William Palmer, Andy Serlin and David Xu, with assistance from Andrew Bax, Michael Burke and Farhan Khan, under the direction of Laura Brackwell and Jenny George.
This report can be found on the National Audit Office website at www.nao.org.uk
For further information about the National Audit Office please contact:
National Audit Office Press Office 157–197 Buckingham Palace Road Victoria London SW1W 9SP
Tel: 020 7798 7400
Enquiries: www.nao.org.uk/contact-us
Website: www.nao.org.uk
Twitter: @NAOorguk
Contents
Key facts 4
Summary 5
Part OneResponsibilities 11
Part TwoSupport 15
Part ThreeResources 27
Appendix OneOur audit approach 40
Appendix TwoOur evidence base 42
Appendix ThreeUpdate on our stocktake of access 45
4 Key facts Improving patient access to general practice
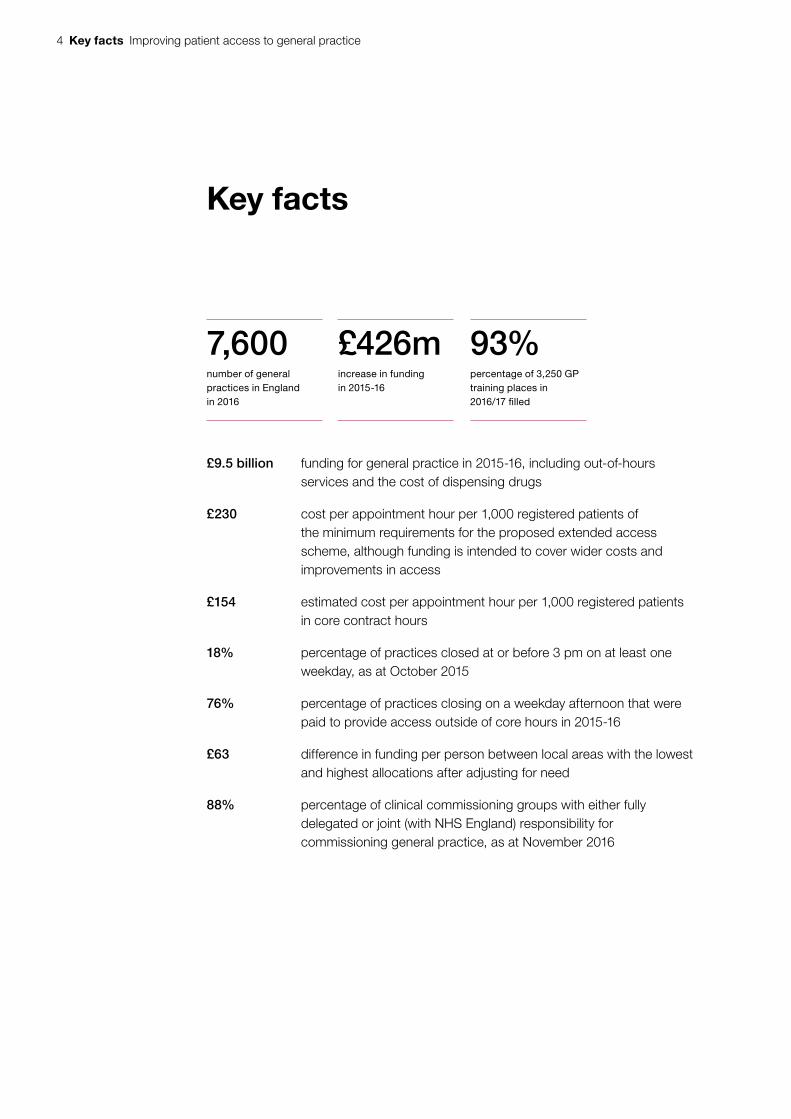
Key facts
7,600number of general practices in England in 2016
£426mincrease in funding in 2015-16
93%percentage of 3,250 GP training places in 2016/17 fi lled
£9.5 billion funding for general practice in 2015-16, including out-of-hours services and the cost of dispensing drugs
£230 cost per appointment hour per 1,000 registered patients of the minimum requirements for the proposed extended access scheme, although funding is intended to cover wider costs and improvements in access
£154 estimated cost per appointment hour per 1,000 registered patients in core contract hours
18% percentage of practices closed at or before 3 pm on at least one weekday, as at October 2015
76% percentage of practices closing on a weekday afternoon that were paid to provide access outside of core hours in 2015-16
£63 difference in funding per person between local areas with the lowest and highest allocations after adjusting for need
88% percentage of clinical commissioning groups with either fully delegated or joint (with NHS England) responsibility for commissioning general practice, as at November 2016

Improving patient access to general practice Summary 5
Summary
1 Most of the contact that people have with the NHS is with general practice, and this is the first step for most patients in diagnosing and treating health conditions. On 31 March 2016, there were around 42,000 doctors employed in some 7,600 general practices in England. General practitioners (GPs) work with nurses and other staff to treat and advise on a range of illnesses, manage patients’ conditions in the community and refer patients for hospital treatment or social care where appropriate. GPs are independent contractors. Practices are typically owned and managed by an individual GP or group of GPs. In 2015-16, £9.5 billion was spent on general practice, once the costs of out-of-hours services and dispensing drugs are included, an increase of £426 million from 2014-15.1
2 General practice plays a vital role in healthcare. We therefore decided to carry out a programme of work on access to these services. Our first report pulled together data from a number of sources to provide a stocktake of the current position on access, demand and capacity. It concluded that, while people’s experience of accessing general practice remained positive, patient satisfaction with access had declined gradually but consistently.2 This report examines how the Department of Health (the Department) and the NHS are implementing their objectives and tackling concerns about access. We set out our audit approach and evidence base in Appendices One and Two. The main body of the report starts with an overview of how access to general practice is currently managed (Part One) before covering the support given to general practice to improve access (Part Two) and availability of funding and staffing (Part Three).
Key findings
Setting objectives
3 The Department has recognised the importance of improving access and set some high-level objectives for this, although it has limited understanding of the pressures in general practice. The Department is ultimately accountable for securing value for money from spending on health services, including general practice. The Department has set objectives for NHS England around access to general practice. These currently include providing evening and weekend access for all patients and 5,000 extra doctors in general practice, both by 2020. However, as highlighted in our previous report, there are still limitations in data on the demand for, and capacity in, general practice. There are risks to both the levels of access and cost of services if there is insufficient assurance that funding and staff are being supplied in line with demand (paragraphs 1.3, 1.6, 2.3, 3.6, 3.12 to 3.14 and 3.18 and Figure 2).
1 Our first report (see footnote 2) calculated spending on general practice differently, excluding the costs of out-of-hours services, dispensing drugs and local authority investment in public health services in general practice. Calculated in this way, spending has increased £411 million to £8.2 billion in 2015-16.
2 Comptroller and Auditor General, Stocktake of access to general practice in England, Session 2015-16, HC 605, National Audit Office, November 2015.

6 Summary Improving patient access to general practice
4 The Department and NHS England have not fully considered the consequences and cost-effectiveness of their commitment to extend access. They have used pilots to understand the demand for, and provision of, extended hours, and have used these to refine their expectations. However, they have not yet fully assessed the cost-effectiveness of the approach and overall resources that will be required. If the additional funding is only used to meet the minimum additional capacity required by the new commitment, this would equate to £230 per appointment hour per 1,000 registered patients. In core contract hours the cost is an estimated £154. NHS England intends that the additional funding will be used to also cover transformation costs and wider improvements in access. However, it has not yet set out how it will assess whether local plans for spending the additional funding provide good value for money. We have not seen evidence that the Department and NHS England fully understand the effect of this commitment to extend hours on continuity of care or other arrangements for providing general medical services outside of core hours. In addition, there is a risk that commissioners may pay for access that is already provided by another service (paragraphs 2.5 to 2.9 and Figure 5).
Contractual arrangements
5 The main contract does not set absolute requirements on access to services including practice opening hours, but shorter opening hours are associated with poorer outcomes. Commissioners manage core general practice services through contracts; the most common is the national General Medical Services (GMS) contract. The GMS contract stipulates that ‘core hours’ are 8 am to 6.30 pm, Monday to Friday (equivalent to 52.5 hours per week). Practices do not necessarily have to be open throughout these core hours, but they must provide essential services at times to meet the reasonable needs of their patients. When they do close during core hours, the vast majority of practices report that services are covered by a local out-of-hours provider or neighbouring practice. We found variations in practices’ opening hours during this period. As at October 2015, some 46% of practices closed at some point during core hours. In particular, 18% closed at or before 3 pm on at least one weekday, despite three-quarters (76%) of these practices that closed receiving additional funding in 2015-16 to provide access outside of core hours. Our evidence suggests that the variation between practices cannot readily be explained by differences in their patients’ needs and shorter opening hours are associated with poorer outcomes. We found that patients registered to practices that are open for fewer than 45 hours per week attend accident and emergency (A&E) departments more often. Some commissioners are giving practices additional funding to be open throughout the core-hours period (paragraphs 1.2, 1.5, 2.2, 2.4 and 3.9).

Improving patient access to general practice Summary 7
6 Recognising that the traditional model of general practice is unlikely to be sufficient to deliver its objectives, NHS England is supporting the development of new ways of providing and commissioning services. NHS England’s objectives for general practice include extending access for patients at evenings and weekends; practices increasingly operating at a larger scale and collaboratively; and using a broader skill mix. The GMS contract sets few requirements on practices, such as sharing patient records between practices, that would help NHS England to achieve these intentions. Changes in the contract are negotiated annually between NHS Employers, on behalf of NHS England, and the British Medical Association. Practices hold their core contract ‘in perpetuity’, meaning there is no end date, which further limits the power of commissioners and strengthens practices’ contractual position. In April 2016, NHS England, alongside Health Education England and the Royal College of General Practitioners, published its General Practice Forward View which set out a range of intentions, including funding for pilots to test new ways of working.3 NHS England has also developed a ‘multispecialty community provider’ contract, which is designed to facilitate better collaboration across practices and services (paragraphs 1.5, 2.2, 2.7, 2.10, 2.17, 3.10 and 3.22 and Figure 2).
7 The new commissioning arrangements offer the opportunity of greater local understanding in the management of services. Until April 2015, NHS England commissioned all general practice services. However, 88% of clinical commissioning groups (184 of 209) have now taken on joint or full responsibility for commissioning these services. Due to their local presence, clinical commissioning groups should be better placed than NHS England to identify emerging problems with access. However, our evidence suggests some commissioners currently have a limited understanding of whether services are meeting people’s needs and have limited capacity to manage any significant service changes, such as a practice handing in notice on its contract. Commissioners also face a tension in managing performance, as using tools such as breach notices may risk damaging the relationship with the practice. We heard many examples of practices improving access or commissioners effectively supporting practices, but some commissioners struggle to find relevant examples that they can apply to their own circumstances. NHS England has limited assurance about the effectiveness of local commissioning, although it has given guidance and started collecting data on performance management (paragraphs 1.4, 2.3 and 2.11 to 2.15 and Figure 3).
3 NHS England, Health Education England and Royal College of General Practitioners, General Practice Forward View, April 2016.

8 Summary Improving patient access to general practice
Supplying staff
8 NHS England and Health Education England’s efforts to increase the GP workforce are at particular risk from falling retention and increases in part-time working. To provide good access practices need the right numbers of GPs, with inflows of GPs matching changes in demand and outflows. The time taken to train clinical staff, and increasing demand, mean supplying sufficient numbers is challenging. There are very limited data on these individual flows but the trend in the total number of GPs shows that since 2010 nearly as many GPs have left as have joined. NHS England and Health Education England, alongside the Royal College of General Practitioners and the British Medical Association, published a plan in January 2015 which set out new initiatives to improve GP recruitment, retention and return to practice. In April 2016, the General Practice Forward View included, for example, intentions for an international recruitment campaign. Against a target of 3,250 GP training places in 2016/17, Health Education England only filled 3,019 (93%) places, although this was an increase from 2,769 in 2015/16. In addition to this continued shortfall in training places, increased levels of part-time working and falling retention, which are not directly the responsibility of either organisation, suggest there may be difficulties in achieving the goal of 5,000 additional full-time equivalent doctors:
• As we previously reported, between 2005 and 2014 (the latest for which comparable data are available), the proportion of GPs aged between 55 and 64 that left approximately doubled. New pension arrangements may be encouraging GPs to retire early if they have maximised their pension fund before the age of 60.
• There are no reliable data on levels of part-time working over time, but female and salaried doctors – who are less likely to work full-time – are increasing as a proportion of the workforce. The latest available data on part-time working in new GPs suggest that there may be 1,900 fewer full-time equivalent GPs by 2020 than Health Education England had estimated there would be (paragraphs 3.12, 3.14 to 3.15 and 3.17 to 3.20 and Figure 12).
9 NHS England is supporting general practice to employ a wider staff mix to help improve access but the incentives for practices to employ staff cost-effectively are not yet aligned. In addition to 5,000 more doctors in general practice, it has committed to add at least 5,000 other staff to work in general practice by 2020-21. This includes 3,000 new practice-based mental health therapists, 1,500 clinical pharmacists and 1,000 physician associates, as set out in the General Practice Forward View. It is funding pilots to test new ways of working using these staff groups, and is also supporting the development of practice nurses, practice managers and receptionists. The central funding provided to practices for training and employing staff differs considerably by group. For example, while Health Education England pays the salaries of doctors training to become GPs, practice nurses are typically funded solely through practice income. As a result, practices are not incentivised to use the most cost-effective mix of skill. Managing the supply of different staff groups and providing practices with the evidence and incentives to change would help general practice to be efficient and to meet patient needs in the future (paragraphs 3.22 to 3.24 and Figure 2 and Figure 13).

Improving patient access to general practice Summary 9
Allocating funding
10 NHS England is reducing some inequalities in the funding of local areas. Funding should be allocated equitably according to need so that local areas and individual practices have an equal opportunity to provide good access. NHS England has sought to make allocations to local areas fairer by introducing a more up-to-date calculation of local needs in 2016-17. However, the allocations to local areas balance historical funding – and so financial stability – with relative patient need. As a result, at the extremes, if Islington was to have the same level of funding in 2016-17 as Knowsley, it would have an extra 47% (£63 per person) after adjusting for need. NHS England has committed to reduce this variation, with planned allocations for 2020-21 having almost half the variation (26%) between the extremes than now (paragraphs 3.3 to 3.4 and Figure 9).
11 NHS England is seeking to make funding to practices fairer but the underlying basis of the payments has not yet been updated as intended. NHS England is phasing out some payments, which are not based on the needs of the local population. For example, between 2014-15 and 2020-21 NHS England is phasing out the top-up payments – totalling £119 million in 2013-14 – given to some practices to ensure their funding did not decrease following the introduction of a new contract in 2004. NHS England is also redistributing the £235 million received by some practices commissioned through locally determined contracts that could not be linked to additional services. However, the funding formula used as the basis to allocate core funding to most practices may not reflect differences in workload across different populations and is out of date. In 2007 a working group recommended updating the formula although changes were not made (paragraphs 3.5 to 3.7).
Conclusion on value for money
12 The Department and NHS England have a high-level vision for access to general practice and have set some challenging objectives for achieving this. They have increased the funding available to general practice and NHS England has sought to make allocations to local areas fairer. However, they have not yet fully evaluated the cost-effectiveness of their commitments and are seeking to extend access despite failing to provide consistent value for money from existing services. The contractual requirements are limited and have not prevented wide variations in access, with evidence that those practices closing for extended periods during core hours may not be meeting the needs of their patients.
13 Limited levers to performance manage and difficulty in restructuring services leave commissioners in a weak contractual position. Instead, the Department and NHS England, along with Health Education England, have used a range of softer initiatives intended to incentivise and encourage practices to improve access and deliver better value for money. These measures include piloting new ways of working and seeking to increase staff capacity. But there are considerable limitations in the current mechanisms for delivering improvements – including a failure to attract and retain sufficient staff numbers and misaligned incentives for practices to employ staff cost-effectively. Without a more coordinated approach and stronger incentives to secure the desired results, the NHS is unlikely to get optimal value for money.

10 Summary Improving patient access to general practice
Recommendations
a NHS England and commissioners should fully consider the consequences of their plans to extend access. This assessment should cover the implications on continuity of care and existing arrangements for providing services outside core hours. NHS England and commissioners should also ensure that services provided outside of core hours are cost-effective and not paid for twice.
b NHS England should seek greater assurance that services in core hours meet the reasonable needs of patients. There are unexplained variations in practice opening hours. NHS England needs to assess and monitor what effect these variations have on patients and other health and care services.
c NHS England should explore how it can encourage GP practices to employ a wider mix of staff to improve access in a sustainable way. NHS England’s vision for general practice relies on greater use of staff other than GPs, such as clinical pharmacists and physician associates. NHS England, along with Health Education England, needs to consider the key barriers to developing a more cost-effective mix of skills and set out a plan to overcome them.
d NHS England should actively share examples of where commissioners or practices have successfully improved access or capacity in an effective and efficient manner. There is scope for better sharing of good practice to commissioners and practices. NHS England should ensure that information on these examples is more readily available for all to benefit from.
e The Department and NHS England should seek to improve the existing data from general practice to better understand the capacity of, pressures on, and demand for services. A cost-effective service will balance access with demand; however, some of the Department’s and NHS England’s objectives are based on a crude understanding of the level of demand and what influences it. They need to continue to address the shortcomings in data highlighted in our first report.

Improving patient access to general practice Part One 11
Part One
Responsibilities
1.1 Most of the contact that people have with the NHS is with general practice, and this is the first step for most patients in diagnosing and treating health conditions. General practitioners (GPs) work with nurses and other staff to treat and advise on a range of illnesses, manage patients’ conditions in the community and refer patients for hospital treatment or social care where appropriate. Our first report, published in November 2015, set out the importance of having good access. It also highlighted a number of concerns.4 We have not sought to undertake a comprehensive update on our first report; however, the latest data available against key indicators used is given in Appendix Three. This second report examines how the Department of Health (the Department) and NHS England are implementing their objectives and seeking to improve access. This part of the report outlines the organisations responsible for delivering and overseeing access, and the objectives that the Department and NHS England have set on access.
Accountability for general practice
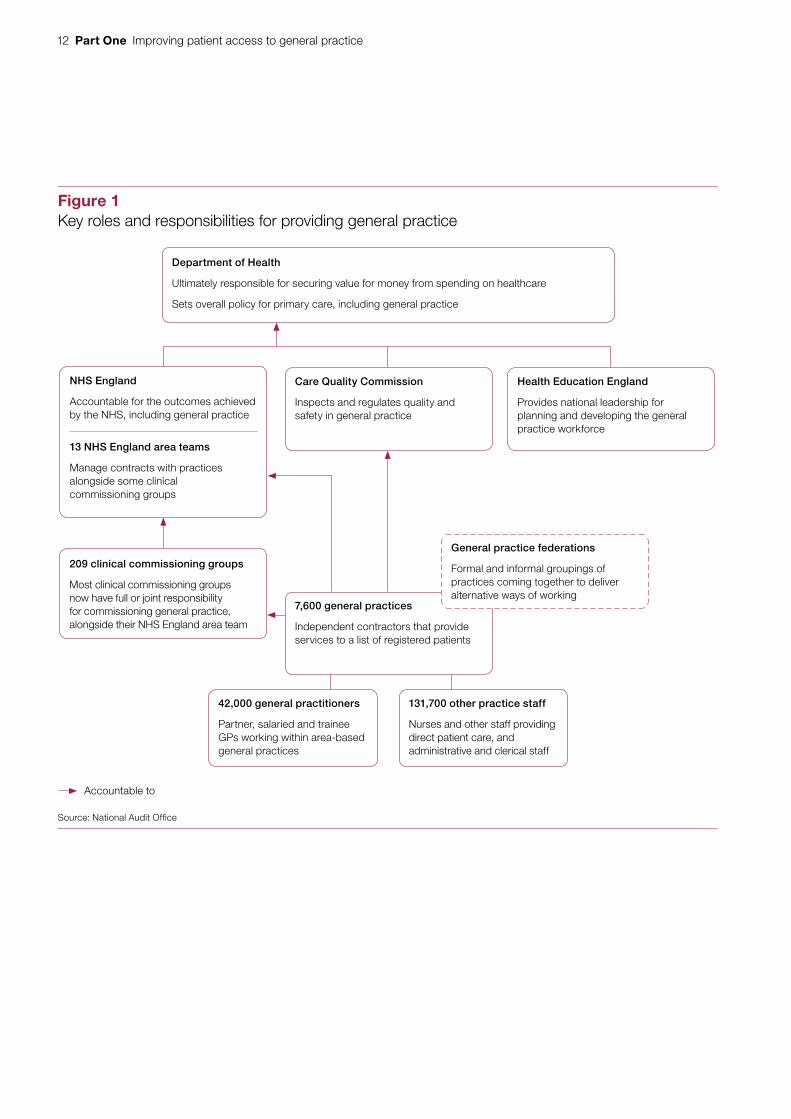
1.2 General practice involves a variety of bodies (Figure 1 overleaf). GPs themselves are independent contractors. Practices are typically owned and managed by an individual GP or group of GPs. On 31 March 2016, there were around 42,000 doctors employed in some 7,600 practices in England, with each practice providing care to an average of approximately 7,500 people. Practices are typically contracted to provide services between 8 am and 6.30 pm on Monday to Friday, although they can often tailor their opening hours to meet the reasonable needs of their patients. Some practices also remain responsible for out-of-hours care, although most have opted out of this. These services are often provided through separate contracts with other providers, although the out-of-hours providers frequently employ GPs based in practices that have opted out of such services.
4 Comptroller and Auditor General, Stocktake of access to general practice in England, Session 2015-16, HC 605, National Audit Office, November 2015.
12 Part One Improving patient access to general practice
Figure 1Key roles and responsibilities for providing general practice
Department of Health
Ultimately responsible for securing value for money from spending on healthcare
Sets overall policy for primary care, including general practice
Source: National Audit Offi ce
209 clinical commissioning groups
Most clinical commissioning groups now have full or joint responsibility for commissioning general practice, alongside their NHS England area team
42,000 general practitioners
Partner, salaried and trainee GPs working within area-based general practices
131,700 other practice staff
Nurses and other staff providing direct patient care, and administrative and clerical staff
Care Quality Commission
Inspects and regulates quality and safety in general practice
Health Education England
Provides national leadership for planning and developing the general practice workforce
NHS England
Accountable for the outcomes achieved by the NHS, including general practice
13 NHS England area teams
Manage contracts with practices alongside some clinical commissioning groups
Accountable to
7,600 general practices
Independent contractors that provide services to a list of registered patients
General practice federations
Formal and informal groupings of practices coming together to deliver alternative ways of working

Improving patient access to general practice Part One 13
1.3 As the steward of the health and care system, the Department is ultimately accountable for securing value for money from spending on health services, including general practice. The Health and Social Care Act 2012 shifted responsibility for commissioning general practice to a new organisation, NHS England. The Department sets objectives for NHS England through an annual mandate, and holds it to account for the outcomes the NHS achieves. The Department also sets objectives for Health Education England through an annual mandate and, among other things, holds it to account for ensuring that the future general practice workforce has the right numbers and the right skills.5
1.4 NHS England is responsible for the proper functioning of the system for commissioning general practice services. Until April 2015, it commissioned general practice services directly, with its area teams responsible for managing the contract with individual practices and reviewing their performance.6 However, NHS England is now delegating more responsibility to local clinical commissioning groups, with 88% (184 of 209) now having a greater role. More than half (114) of clinical commissioning groups have taken on fully delegated responsibility for commissioning general practice. A further one-third (70) have taken on joint commissioning responsibility with NHS England.7 NHS England approves clinical commissioning groups’ proposals for co-commissioning and retains its same overall accountability for commissioning general practice. It continues to commission general practice in the remaining areas of the country although it expects that all clinical commissioning groups will eventually take on fully delegated responsibility.
1.5 Core general practice services are commissioned through contracts with GP practices. Most practices hold either a General Medical Services (GMS) contract (64% of practices) or a Personal Medical Services (PMS) contract (32% of practices). The GMS contract, implemented in 2004, is a standard national contract with changes negotiated annually between NHS Employers, on behalf of NHS England, and the British Medical Association.8 The PMS contract is a local contract, agreed between NHS England and a practice. It is broadly based on the GMS contract, but allows variation in the range of services that may be provided, the financial arrangements for those services and who can hold the contract. GMS and some PMS contracts exist ‘in perpetuity’, meaning there is no end date. This provides stability for practices, but can cause problems for commissioners who may want to redesign services in a local area.
5 Key objectives, including those included in the mandates, are included in Figure 2.6 In October 2014 NHS England changed the structure of its local teams from 27 area teams to 13 local offices. For the
purposes of this report we have used the term ‘area team’ throughout.7 Clinical commissioning group responsibilities taken from NHS England’s website in January 2017.8 NHS Employers is a not-for-profit organisation which is part of the NHS Confederation. It aims to be the voice of
employers in the NHS.

14 Part One Improving patient access to general practice
1.6 The Department and NHS England have some general objectives that relate to general practice. For instance, the Department has mandated NHS England to: improve local and national health outcomes through better commissioning; help create the safest, highest-quality health and care service; and improve out-of-hospital care.9 The Department and NHS England have also set out specific objectives for access to general practice through a number of documents, dating back to 2014 (Figure 2).
9 Department of Health, The government’s mandate to NHS England for 2016-17, January 2016.
Figure 2Key objectives for access and capacity
Theme Objective Target date
Distribution of GP services General practice to operate at greater scale(ie practices covering larger populations) and in greater collaboration with other providers and professionals
Not given
Availability of appointments Same-day GP appointments for all patients aged 75 or over
2020
Convenience of services Evening and weekend access for all patients 2020
All patients can book appointments and order repeat prescriptions online
2015
Continuity of care All patients aged 75 or over to have a named GP 2014
All patients to have right to a specific, named GP 2016
Staffing and capacity A minimum of 3,250 trainees a year recruited to GP training programmes
2016
5,000 additional doctors in general practice 2020
A minimum of 5,000 other staff working in general practice
2020
Sources: Department of Health and NHS England documents

Improving patient access to general practice Part Two 15
Part Two
Support
2.1 This part examines the support that the Department of Health (the Department), its arm’s-length bodies and local commissioners give to general practice to improve access. It covers whether:
• the objectives for access to general practice, and their feasibility and value, are clear to GP practices;
• the implications of commitments to extend access are well-understood;
• commissioners have the right levers to support practices to improve, and sufficient oversight; and
• practices are given the support and advice to help them to improve access.
Clarity of objectives
Core hours
2.2 To date the General Medical Services (GMS) contract has not set absolute requirements on access to services. For example, it sets no targets for the number of consultations a practice should provide or how quickly it should consult a patient. This was intended to support local flexibility. The contract does set core hours of 8 am to 6.30 pm Monday to Friday (equivalent to 52.5 hours a week), and requires practices to provide routine services at times within this period “as are appropriate to meet the reasonable needs of its patients”.10 Practices must provide services in case of emergency across all core hours. In August 2016, we used an existing research community of doctors to survey 839 GPs. They were much more likely to agree than disagree that their commissioner had made clear the levels of access their practice was expected to provide during core hours. However, the small sample of Care Quality Commission (CQC) inspectors who responded to our survey in September and October 2016 generally thought that standards for access in core hours were not clear (Figure 3 overleaf).
10 NHS England, Standard General Medical Services Contract 2015/16, July 2015.

16 Part Two Improving patient access to general practice
Figure 3Views on how well commissioners set and review practices against standards of access
GPs’ views
Notes
1 Based on 839 responses from GPs and 75 responses from CQC inspectors of general practice.
2 Percentages may not sum to 100 due to rounding.
Source: National Audit Office surveys of GPs and Care Quality Commission inspectors of general practice
My commissioner makes clear what levelsof access my practice is expected to
provide during core hours
0 20 40 60 80 100
Percentage
Neither agree nor disagreeAgree or strongly agree
My commissioner knows if levels of accessare not meeting the reasonable needs of
patients during core hours in the local area
19.1 19.414.846.7
25.4 33.418.422.9
CQC inspectors’ views
There are clear standards on what level ofaccess is required from general practices
during core hours
0 20 40 60 80 100
Percentage
Commissioners know if services areplanned and delivered to meet the
needs of people
Commissioners know if people can accesscare and treatment in a timely way
17.8 1.460.320.5
28.2 11.346.514.1
25.4 9.954.99.9
Disagree or strongly disagree Don’t know/Not applicable

Improving patient access to general practice Part Two 17
2.3 The GMS contract allows commissioners and practices to define the reasonable needs of patients and tailor access accordingly. However, there is little information to define what these needs might be. At practice level, there seems to be a good understanding of demand; 82% of GPs and 76% of the CQC inspectors who responded to our survey felt practices have a good understanding of the demand for essential services during core hours. But at the commissioner level understanding is not so good. Those we spoke to felt they were lacking sufficient data on levels of demand and available capacity at different times throughout the week. Our surveys also suggested commissioners have a limited understanding of whether services are meeting needs. For example, 14% of inspectors reported they felt commissioners know if services are planned and delivered to meet the needs of people compared with 46% who did not (Figure 3). Some commissioners had adopted or developed audit tools to capture and track these data. NHS England plans to roll out a new tool in 2017-18 to measure activity and help match capacity to demand.
2.4 Our analysis of opening times suggests that practices have defined the reasonable needs of patients differently. As at October 2015, nearly half (46%) of practices closed at some point during core hours, and 14% opened for 45 core hours or less (equivalent to 9 am to 6 pm, Monday to Friday). Similarly, almost one-fifth (18%) closed at or before 3 pm during a weekday, despite three-quarters (76%) of these practices receiving additional funding in 2015-16 to provide access outside of core hours (averaging £8,224 per practice). Practices report a range of different arrangements for their patients when they are closed during core hours, including cover from the local out-of-hours provider or neighbouring practices and, in a few instances, calling NHS 111 or attending accident and emergency (A&E).11 NHS England has highlighted variability in provision of services in core hours as a particular area to focus on when reviewing clinical commissioning groups’ performance in managing delegated functions.12 We found that practices closing for extended periods may not be meeting the needs of their patients and, instead, may reflect historical patterns:
• On average, there were 22 more A&E attendances per 1,000 registered patients (8%) at practices open for 45 core hours or less per week, after adjusting for differences in patients’ age and sex.
• The extent to which practices close during the afternoon varies considerably by area. In 53 clinical commissioning groups no practices closed at or before 3 pm on a weekday compared to three-quarters (28 of 37) of practices in Waltham Forest. Practices in clinical commissioning groups with a higher level of unmet needs, as measured by early mortality, are more likely to have afternoon closures. We did not identify any clear correlation between closures in the afternoon and the number of GPs per patient.
11 NHS 111 is the non-emergency telephone service.12 NHS England, CCG Assurance: delegated functions self-certification 2015/16, July 2015.

18 Part Two Improving patient access to general practice
• We identified a link between closures and the size of a practice, with 46% of practices with fewer than 2,500 registered patients closing by 3 pm on a weekday, compared with less than 4% for practices with 10,000 or more patients.
• A quarter of GPs (27%) and CQC inspectors (25%) that responded to our surveys felt that practices were not effectively matching staffing levels to demand throughout the week.13
Extended hours
2.5 The 2015 Conservative Party election manifesto committed to ensuring that by 2020 everyone could see a GP seven days a week, from 8 am to 8 pm. Commissioners and practices have since been concerned about the additional staff and finances needed to provide this. As NHS England has worked through emerging evidence on what is needed and can be achieved, it has appeared to soften expectations, particularly on the requirements for weekend opening. However, the requirements have been reported inconsistently in public (Figure 4). Of the GPs we surveyed, 17% thought their commissioner had not made it clear how extended hours can be provided in the local area, compared with 45% who did. However, some of the commissioners we visited in July and August 2016 felt they still had to ensure 12-hour access seven days a week, contrary to NHS England’s direction at that time.
2.6 In September 2016, NHS England confirmed the requirements that clinical commissioning groups must meet for extended hours until 2020. It set the times of the week it expects services to be available for an additional 1.5 hours on every weekday evening after 6.30 pm, and on Saturdays and Sundays, to meet local population needs. NHS England also set the additional appointment capacity that should be available in each area (a minimum of 30 minutes per 1,000 patients), and how much additional funding each area would receive. NHS England does not envisage all practices having to meet these requirements individually; instead, clinical commissioning groups will be able to fund additional services to which individual practices can direct their patients during the extended hours period. We estimate that this intended minimum additional capacity equates to at least an extra 3.4% in appointments. NHS England expects that clinical commissioning groups will periodically review their local extended hours arrangements to ensure they meet demand for services.
13 Conversely, 50% of GPs and 37% of CQC inspectors that responded to our surveys felt practices were effectively matching staffing levels to demand throughout the week.

Improving patient access to general practice Part Two 19
Figure 4Timeline of commitments to extend access
Source: Department of Health, NHS England and Conservative Party documents
2013
2014
2015
2016
Oct 2013
Pilots to provide additional GP appointment time
Apr 2015
Everyone to see a GP 7 days a week, from 8 am to 8 pm
Feb 2016
Everyone should be able to see a GP 7 days a week from 8 am to 8 pm
Sep 2016
Access to appointments for an additional 1.5 hours on weekday evenings (after 6:30 pm), and on both Saturdays and Sundays to meet local population needs
Jan 2016
Access to evening/weekend routine GP appointments
Apr 2016
Sufficient routine appointments at evenings and weekends to meet locally determined demand
Sep 2014
Pilots to provide access from 8 am to 8 pm on weekdays (or equivalent) and improved access at weekends

20 Part Two Improving patient access to general practice
Implementation of extended access objective
2.7 Since April 2014, NHS England has committed £175 million to 57 GP Access Fund pilot sites, covering more than 18 million patients, to test alternative ways of improving access. This has included giving patients greater access at evenings and weekends through hubs that link up a number of local practices. NHS England has used an independent evaluation of these pilots to define the requirements for extended hours care. However, they have not yet fully assessed the cost-effectiveness of the commitments to extend access and overall resources that will be required. Our own analysis suggests that, unless clinical commissioning groups provide more than the minimum additional consultation capacity, such as wider improvements in access, the new requirements may prove expensive compared to existing services. The minimum additional capacity equates to £230 per appointment hour per 1,000 registered patients, compared with an estimated £154 in core contract hours. The existing enhanced service provided by individual practices costs £73 per appointment hour, although it is expected to only cover the cost of paying existing staff to work longer (Figure 5).14 NHS England intends that the additional funding is used to: provide extra capacity above the minimum requirement; improve access to a broader range of services; and cover any transformational costs.15 For example, to be eligible for the additional funding, it requires clinical commissioning groups to commission and demonstrate effective connection to other services, such as urgent care services. Commissioners were required to submit plans to NHS England by December 2016 to cover, for example, how access will be improved, however NHS England has not yet set out how it will assess whether the local plans for spending the additional funding provide good value for money.
2.8 Practices that currently extend their opening hours have different characteristics to those that do not, and it is not clear whether extended hours have been provided where there is greatest need. Our analysis suggests practices that either open longer during the week or open over the weekend tend to be larger practices and those with a higher proportion of clinical staff that are not GPs. They are more likely to be in less-deprived urban areas with a younger patient population, although in total little of the variation in opening hours can be explained by patient demographics. Patients from practices that are open longer during the week or at the weekend are generally less satisfied when trying to make an appointment.
2.9 Some of the arrangements and consequences of the new requirements for extended hours are unclear. Three particular areas that will be affected are out-of-hours services, existing extended hours arrangements, and continuity of care:
• In 2015-16, out-of-hours GP services cost £434 million. There is a clear overlap between the period covered by out-of-hours providers and the new requirements that NHS England is setting up (Figure 6 on page 22). Some commissioners told us that these two services often compete for the same staff. NHS England expects that this risk will be addressed through the development of more integrated, at scale, primary care services. Clinical commissioning groups are responsible for remodelling these services to ensure that they are aligned and that commissioners do not pay twice for the same service.
14 See paragraph 3.5 for more detail on enhanced services.15 NHS England expects the additional capacity to rise to 45 minutes per 1,000 patients although no timescale for this
has been given.

Improving patient access to general practice Part Two 21
• There is also overlap with the existing enhanced service to extend hours. Some practices are set to continue to be paid under this arrangement until at least March 2018. NHS England cannot remove the enhanced service as its future is subject to wider annual contract negotiations.
• Extending access at evenings and weekends may affect continuity of care. The ability to see the same GP is particularly valued by certain groups of patients, including those with a long-term health condition.16 NHS England expects that in future extending hours will free up capacity in core hours, resulting in improved continuity. However, as an indication of the possible tension, we found that between 2014-15 and 2015-16 patients from practices with longer opening hours during the week and those opening on the weekends reported that they were, on average, less likely to see their preferred GPs.
16 Comptroller and Auditor General, Stocktake of access to general practice in England, Session 2015-16, HC 605, National Audit Office, November 2015.
Figure 5Estimated average cost of appointment hours under core contract and extended hours arrangements
The new extended hours arrangements will cost twice as much as the existing enhanced service
Requirements Coverage Average weekly hours of
appointments per practice
Average annual cost per patient
Cost per appointment
hour per 1,000 registered patients
Core contract hours 52.5 hours across Monday to Friday 8 am to 6.30 pm (but can be reduced if suits patient needs)
All GMS practices 1071 £114 £1542
Extended hours access directed enhanced service
Additional 30 minutes per 1,000 patients
74% of practices 4 £1.90 £73
New extended hours commitment3
Additional 30 minutes (minimum) per 1,000 patients
Within each clinical commissioning group
Equivalent to at least 4
£6 Up to £230
Notes
1 Excludes an estimated sum of hours provided under the extended hours access enhanced service. Appointments provided outside of core hours and funded through other schemes may still be included.
2 Covers payments for essential and additional services, the quality and outcomes framework and enhanced services (except those known to be for extended hours access).
3 NHS England planning guidance suggests clinical commissioning groups will receive at least £6 per head. Payments above £6 per head could lead to a cost per appointment hour greater than £230.
Source: National Audit Offi ce analysis of NHS Digital data and NHS England planning guidance

22 Part Two Improving patient access to general practice
Supporting and incentivising practices
Using the GP contract to promote good access
2.10 NHS England does not believe that all the improvements to access it hopes to make can be achieved within a traditional model of general practice commissioning and delivery. The GP contract sets the framework for what a practice should provide, but NHS England told us that it is limited as a lever for bringing about improvements to access. Changes to the GMS contract are negotiated each year between NHS Employers (on behalf of NHS England) and the British Medical Association. In recent years, some contractual changes have been agreed to support the objectives for patient access. These include requirements on practices to inform patients about their named GP, to provide NHS England with data on evening and weekend access for their patients, and to ensure patients can book appointments and order repeat prescriptions online. However, the contract does not require practices to make any changes to support more effective working at scale, such as putting systems in place to share patient records with other practices.
Figure 6Hours covered by different services
Three different arrangements now provide services outside of core hours
Main type of service Total estimatedcost1
Period of access Delivery model
Core hours2 Routine and urgent £6.5bn 8 am to 6.30 pm, Monday to Friday
Provided by general practice
Extended hours access directed enhanced service
Routine £88m Hours outside of core-hours period, determined by each practice
Provided by individual practices that choose to provide service
New extended hours commitment
Routine £347m 6.30 pm to 8 pm Monday to Friday, and hours on Saturday and Sunday determined by each clinical commissioning group
Will vary, but likely to be provided by a hub of practices working together
Out-of-hours GP services
Urgent £434m Before 8 am and after 6.30 pm Monday to Friday, and all day Saturday and Sunday
Varies, but typically an alternative out-of-hours provider
Notes
1 Total estimated costs are for 2015-16 except for the new extended hours commitment, where we applied the £6 per head funding to 2016 population fi gures.
2 See Figure 5, note 2 for details on the calculation of the cost of core hours.
Source: National Audit Offi ce

Improving patient access to general practice Part Two 23
2.11 To ensure practices are meeting the terms of their contract, and to effectively support or sanction practices when access or capacity concerns arise, commissioners need to monitor and review a range of information. Commissioners told us that they use a variety of quantitative data as well as soft intelligence collected through complaints, visits to practices and discussions with other stakeholders. NHS England has produced a web tool that allows commissioners to assess and compare practice performance on a set of key measures. GPs had mixed views on whether commissioners deal with concerns about access in a fair way. Two-thirds (66%) of CQC inspectors who responded to our survey thought that commissioners did not take effective action to deal with concerns about access at individual practices (Figure 7). We heard that commissioners face a tension in managing performance, as using tools such as breach notices may risk damaging the relationship with the practice.
Figure 7Views about how well commissioners performance manage
GPs’ views
Notes
1 Based on 839 responses from GPs and 75 responses from CQC inspectors of general practice.
2 Percentages may not sum to 100 due to rounding.
Source: National Audit Office surveys of GPs and Care Quality Commission inspectors of general practice
My commissioner deals with concerns aboutaccess at individual practices in a fair way
0 20 40 60 80 100
Percentage
Neither agree nor disagreeAgree or strongly agree Disagree or strongly disagree Don’t know/Not applicable
29.8 37.915.117.2
CQC inspectors’ views
Commissioners take effective action to dealwith concerns about access at
individual practices
0 20 40
Percentage
0 20 40 60 80 100
Percentage
what is working well or is outstandingregarding access to general practice
where there are areas of concern or risk inaccess to general practice
60 80 100
17.1 11.465.75.7
18.9 70.310.8
24.0 54.721.3
NHS England area teams and clinical commissioning groups provide me with good information about:

24 Part Two Improving patient access to general practice
2.12 In January 2016, to support local commissioners and ensure a consistent approach, NHS England published a policy book for general practice. This built on guidance published in June 2013 and set out policies including dealing with contract breaches and terminations, and managing patient lists. Commissioners told us vagueness in the contract meant it was often difficult to establish a breach against the contract for poor access or low capacity. This was easier when the practice had closed for extended periods, thus failing to provide the required service. In total, commissioners issued 160 notices to practices in 2015 because of a breach against its contract, although NHS England has not collated data on the nature of these breaches.
2.13 The national NHS England team has a role to ensure that local commissioners effectively manage performance in general practice and that patients can access services. In June 2013, it published a framework for area teams to follow to assess and manage general practice. This framework stated that area teams must inform the national team when they issue contractual breach notices. However, an internal audit in June 2015 found that NHS England has no established governance structure or regular reporting of GP performance, breaches and terminations. In response, in January 2016 NHS England started collecting data from its area teams on measures of performance management, including contractual breach notices, disputes and practice closures. However, the data that NHS England has collected have to date been limited. For example, data collected on practice closures have not included instances where practices have temporarily suspended new patient registrations.
The implications of co-commissioning
2.14 The shift of responsibility for commissioning general practice from NHS England’s area teams to local clinical commissioning groups brings both opportunities and risks to its ability to manage performance of GP practices. This will have an impact on access to general practice given the key role commissioners play in ensuring access for patients.
• Clinical commissioning groups (covering an average 36 practices compared with 586 for area teams) have more regular contact with practices and a more detailed understanding of them. Because of their local presence, clinical commissioning groups should be better placed to identify and respond to concerns about access or capacity. Also, by controlling both primary and secondary care in their areas, clinical commissioning groups can join up commissioning and transformation plans to support a common local strategy.
• However, under the new arrangements clinical commissioning groups contract with, and manage the performance of, their own member practices. NHS England has recognised that delegating commissioning is likely to increase real and perceived conflicts of interest.17 It updated its statutory guidance on conflicts of interest in June 2016.
17 Comptroller and Auditor General, Managing conflicts of interest in NHS clinical commissioning groups, Session 2015-16, HC 419, National Audit Office, September 2015.

Improving patient access to general practice Part Two 25
2.15 Clinical commissioning groups have taken on additional responsibilities largely within their existing resources, although commissioners are concerned about a lack of capacity to deal with any significant access issue. NHS England intends clinical commissioning groups to take on the additional responsibilities within their existing resources, with no additional funding. However, we saw evidence of inconsistencies with at least one area team paying its clinical commissioning groups to help with transition costs. Area teams, who continue to commission services through direct and joint arrangements, told us they also have capacity pressures. Some commissioners were concerned that their limited capacity meant they could do little more than manage crises, such as a practice handing in notice on its contract. We heard that these crises were increasing in frequency as pressures mounted within general practice. Of the CQC inspectors we surveyed, only 8% felt commissioners supported practices effectively to maintain and improve access, compared with 48% who did not.
Other ways of supporting practices to improve access
2.16 In addition to attempting to improve capacity through increasing funding and staffing (see Part Three), commissioners have a range of other ways of helping practices, including identifying more efficient working practices, and sharing best practice. The commissioners we spoke to were more likely to support practices facing problems with access or capacity, instead of using the contract to enforce a minimum level of access. We heard many examples of commissioners supporting practices to improve access. Commissioners and practices depend on local contacts to discover what works best, but they can find it difficult to identify examples that are applicable to their own circumstances.

26 Part Two Improving patient access to general practice
2.17 In April 2016, NHS England, Health Education England and the Royal College of General Practitioners published the General Practice Forward View.18 This set out a range of measures to assist general practice, including funding for pilots to test new ways of working and developmental support for practices. To implement its objectives, NHS England expects practices to work at larger scale and covering a broader range of services to effectively manage demand. To support this, it is encouraging and developing a number of key changes:
• GP networks and federations. NHS England has encouraged and supported practices to form wider groupings to provide alternative ways of working and achieve economies of scale, working with the Royal College of General Practitioners and the Nuffield Trust. Data are limited on how these networks and federations have been developed, although by 2015 around three-quarters (73%) appear to have been part of a formal or informal collaboration.19
• New care models. Since March 2015, NHS England has been supporting a number of vanguard sites to improve and integrate services, based on five new models of care. The multispecialty community provider model expands general practice to offer a wider range of services and support than previously. It uses hubs of integrated teams typically serving at least 30,000 patients. NHS England expects that, by working on a larger scale, providers will employ a more diverse mix of skills to offer more appropriate, joined-up care.
• Sustainability and transformation plans. Since January 2016 local health and care systems have been putting together plans to transform services and make them sustainable over the next five years. Forty-four footprint areas, covering between one and 12 clinical commissioning groups each, will allocate a sustainability and transformation fund established by NHS England, totalling £12.6 billion between 2017-18 and 2020-21. NHS England intended that plans would involve the whole health and care system working better together. However, we heard concerns that general practice was not being sufficiently addressed in early discussions.
18 NHS England, Health Education England and Royal College of General Practitioners, General Practice Forward View, April 2016.
19 Nuffield Trust and Royal College of General Practitioners, Collaboration in general practice: surveys of GPs and CCGs, November 2015. Based on 982 responses to a survey of the Royal College’s members.

Improving patient access to general practice Part Three 27
Part Three
Resources
3.1 This part of the report examines the funding and staffing available in general practice. The relationship between access and either funding or staffing levels is complex. However, to meet the objectives for access to general practice consistently across the country, there will need to be a sufficient supply of staff and funding and mechanisms to ensure these are distributed according to need.
Funding
3.2 Since April 2013, NHS England has decided centrally how much of its budget it will allocate to primary care. Including the cost of out-of-hours services and dispensing drugs, £9.5 billion was spent on general practice in 2015-16, an increase of £426 million from 2014-15. As a proportion of total health spending, spending on general practice fell in three of the four years between 2010-11 and 2014-15. This proportion increased in 2015-16 and is set to increase further up to 2020-21 (Figure 8 overleaf). NHS England measures spending on general practice differently to this: as a proportion of NHS spending on front-line services, which excludes administrative costs. Using this figure, only available since 2013-14, general practice equated to 9.5% of spending in 2015-16.
Allocations to local areas
3.3 Each year, NHS England distributes its total budget for primary care, including general practice, to local commissioners. Before 2013, local commissioners decided themselves how much to spend on primary care, which resulted in wide variation between areas. Since 2013, NHS England has been seeking to reduce this variation and now calculates a ‘target funding allocation’ for each local commissioner, based on healthcare needs in each local area. NHS England updated the formula for 2016-17 to use a more detailed and up-to-date calculation of local needs. This followed a recommendation by the Committee of Public Accounts in January 2015 to review and update the formula.

28 Part Three Improving patient access to general practice
Figure 8Annual change in spending on general practice, 2010-11 to 2020-21
Spending (£bn) Proportion of total health spending (%)
Spending on general practice is set to increase faster than total health spending
Notes
1 Spending on general practice includes out-of-hours GP services, dispensing of drugs and local authority investment in public health servicesin general practice.
2 Total health spending taken as total departmental expenditure limit for the Department of Health. Responsibility for delivering particular serviceschanged in April 2013, meaning the proportions of total health spending shown before 2013-14 are not directly comparable to later years.
Source: National Audit Office analysis of Department of Health, NHS England and NHS Digital data
2010
-11
2011
-12
2012
-13
2013
-14
2014
-15
2015
-16
2016
-17
2017
-18
2018
-19
2019
-20
2020
-21
Actual/planned spending on 9.0 8.9 8.8 9.0 9.1 9.5 10.0 10.2 10.5 10.7 11.0 general practice at 2015-16 prices (£bn)
Spending on general practice as 8.31 8.16 8.04 8.04 7.97 8.06 8.39 8.47 8.74 8.83 9.02 proportion of total health spending (%)
0
2
4
6
8
10
12
14
0
2
4
6
8
10
12 16

Improving patient access to general practice Part Three 29
3.4 Each year, NHS England aims to move local areas from their current funding levels towards their target allocations. It does so slowly to prevent local health economies from being destabilised by significant changes. NHS England has been making progress:
• In 2016-17, 48 of 209 clinical commissioning groups will be 5% or more above their target; 53 will be 5% or more below their target. By 2020-21, 20 are expected to be 5% or more above and none will be 5% or more below (Figure 9).
• At the extremes, if Islington was to have the same level of funding in 2016-17 as Knowsley, it would have an extra 47% (or £63 per person) after adjusting for need; by 2020-21, the variation between these extremes will have fallen to 26%.
Figure 9Primary care allocations to clinical commissioning groups: distance from target
Primary care allocation, distance from target (%)
NHS England plans to move allocations of funding for primary care closer to target over the next five years
Note
1 Clinical commissioning groups are shown for both years ordered from greatest distance below target to greatest distance above target in 2016-17.
Source: National Audit Office analysis of NHS England published allocations
2016-17
2020-21
35
30
25
20
15
10
5
0
-5
-10
-15
-20
-25
-30
-35Clinical commissioning group

30 Part Three Improving patient access to general practice
Practice funding
3.5 Practices receive income from their commissioner through a number of funding streams. They receive most of their income based on the number and health needs of patients on their list. In 2015-16, this core contract funding made up 52% of total investment into general practice. Practices also receive payment for extra services such as childhood immunisations and providing additional appointments outside of core hours, to cover certain costs such as premises development and locum cover for maternity and paternity leave, and as incentives to provide high-quality care (Figure 10). General practice is typically not paid for additional activity (for example, by consultation), unlike for much of hospital care. As a result, practices’ funding does not necessarily reflect their workload and there may be an incentive for commissioners to reduce their costs by directing care from hospitals to primary care.
Figure 10Investment in general practice, 2015-16
Category of funding Description 2015-16
(£m)
Percentage of total
(%)
Core contract funding Contribution towards practices’ costs in delivering essential and additional services, including staff costs
4,887 52
Enhanced services Extra services that a practice can choose to provide, such as flu immunisations and extended hours
1,065 11
Premises Payments to cover certain premises costs, including rent and interest on mortgage repayments
889 9
Dispensing drugs Costs of dispensing medicines and reimbursement for any medicines dispensed
788 8
Quality and Outcomes Framework
A national scheme that pays practices for delivering against particular indicators of quality
685 7
Out-of-hours services Urgent GP services provided outside of core hours
434 5
Other payments Including, for example, payments for information technology
706 7
Total1 9,455 100
Note
1 Numbers may not sum to totals due to rounding.
Source: National Audit Offi ce analysis of NHS Digital data
Improving patient access to general practice Part Three 31
3.6 For most practices a calculation agreed between the Department of Health (the Department) and the British Medical Association in 2004, known as the Carr-Hill formula, is used to allocate the majority of core contract funding. The formula takes the number of patients on a practice’s registered list and adjusts for demographic characteristics and local costs. Much of the data used in the formula is out of date. For example, the estimated length of home visits is based on a survey from 1992-93. There are longstanding concerns over whether it appropriately reflects differences in workload across different practice populations. In 2007 a working group recommended updating the formula although changes were not made.20 NHS England has now agreed with the British Medical Association that they will not introduce an updated funding formula before April 2018. This is so NHS England can model the impact of any changes on practices and protect them from financial instability or uncertainty. As a result, some practices will continue to receive considerably more or less than their fair share. As an indication of scale, NHS England’s recent analysis suggests that, if the formula currently used for local area calculations was adopted for practice funding, around half of practices’ core allocations would change by at least 5%.21 The detail of the revised formula has not been agreed.
3.7 In the meantime, NHS England is seeking to move practice allocations towards the relative funding levels suggested by the existing formula. For example:
• between 2014-15 and 2020-21 it will phase out the minimum practice income guarantee. This is a top-up payment given to some practices holding a General Medical Services (GMS) contract, so their funding does not fall below what they were paid before they took a new contract in 2004. We recommended in 2008 that the Department should consider phasing it out.22 NHS England is redistributing the £119 million of funding each year across all GMS practices, equivalent to 3% of total payments to GMS practices in 2013-14;
• in 2014, NHS England reviewed what it was paying to approximately 2,700 practices that at that time held a Personal Medical Services (PMS) contract, to see if these contracts offered value for money compared with a standard GMS contract. NHS England identified £235 million that could not be linked to additional services, equivalent to 7% of total payments to PMS practices in 2013-14. As a result, local commissioners have redistributed these additional payments across other practices in their area; and
• NHS England is also phasing out payments to GPs that reward them for length of service. In 2013-14, GPs received £132 million in these seniority payments, but they will cease altogether in March 2020. NHS England is redistributing the money into core GMS funding.
20 British Medical Association, Focus on the global sum allocation formula (Carr-Hill Formula), July 2015.21 NHS England, Primary medical care – new workload formula for allocations to CCG area, April 2016.22 Comptroller and Auditor General, General Practice Services in England, Session 2007-08, HC 307, National Audit
Office, February 2008.

32 Part Three Improving patient access to general practice
Locally agreed additional funding
3.8 Commissioners can also give extra funding to provide an enhanced level of service. These enhanced services can either follow a national specification and payment structure, or be set locally by clinical commissioning groups. Of the £1.1 billion invested in enhanced services, some £483 million (5% of total spending) is spent on locally set services. Use of such payments varies considerably, with payments per patient in 2015-16, after adjusting for patient needs, ranging from at most £0.84 for the lowest 10% of clinical commissioning groups to at least £12.75 for the highest 10%. Variation persists once payments for directed and national enhanced services and other miscellaneous payments are included. This suggests that the variation is not caused solely by some clinical commissioning groups substituting national schemes for local alternatives. The variation does not appear to be linked to either commissioners’ relative funding level or changes in funding. Practices with an older and more deprived patient population or with higher rates of early mortality receive higher payments for local enhanced services although these demographic factors explain a very small proportion (3%) of the variation.23
3.9 We heard that some clinical commissioning groups are providing additional incentive payments to practices, in part, for remaining open throughout core hours. In some areas, these payments are part of a wider voluntary contract designed to improve and standardise access and quality across general practice. Our analysis suggests that, other things being equal, for those practices with a higher level of enhanced service funding, their patients:
• find it easier to get through to the practices over the phone and make an appointment with their GPs; and
• attend major A&Es at hospitals less often.24 An increase of some £1,700 in enhanced service funding is associated with one fewer major A&E attendance. On average, such A&E attendances cost around £150, and if the patient is then admitted to hospital it will cost an additional £1,700.25
3.10 Commissioners also support vulnerable practices through additional funding. NHS England is investing an additional £50 million between 2015-16 and 2019-20 to support practices to become more resilient, such as developing more effective ways of working. It has used a common framework to ensure that support goes to practices most in need. While it may be important to support practices so they can provide continuity of services, it may mask inefficiencies and make it difficult to assess whether overall funding is going where it is needed most. We heard that commissioners allocated funding after reviewing practices’ profits and resourcing. Only 18% of GPs we surveyed feel that additional funding for access is allocated in a fair way, compared with 28% who feel it is not.
23 By comparison, the same demographic factors explain 30% of variations in core contract funding.24 In this report we use the term “major A&E” to describe consultant-led services, in a hospital or a single-specialty unit,
with designated accommodation for the reception of A&E patients. It excludes minor injury units, walk-in centres and urgent care centres.
25 The association with patient satisfaction (first bullet) holds for both local and directed enhanced services. The association with A&E attendances (second bullet) is for total enhanced service funding.

Improving patient access to general practice Part Three 33
Staffing
3.11 General practice contracts typically do not specify staffing levels. Each practice must judge how many staff are needed to provide high-quality and safe care and is responsible for employing its own staff. However, the Department, NHS England and Health Education England all have a role in ensuring that there is an adequate supply of general practice staff.
3.12 The Department has set its arm’s-length bodies some challenging high-level targets on staffing levels in general practice. In particular, in June 2015 the government committed to providing an additional 5,000 doctors for general practice by 2020. The time taken to train clinical staff, as well as increasing demand, mean supplying sufficient numbers is challenging. In January 2015, NHS England and Health Education England, together with the British Medical Association and the Royal College of General Practitioners, published a workforce action plan, which includes measures to recruit and retain staff in general practice and to re-attract those who have left the sector.
Understanding demand
3.13 As we reported in our first report, because of a lack of reliable data on the number of consultations, the Department and NHS England do not know how many more GPs are required to meet demand.26 Since that report, the research commissioned by the Department and NHS England into consultation rates and patient experience was published. This research suggests a slightly slower growth in the number of consultations than other studies had estimated, although the duration of each consultation has increased (see Appendix Three, paragraph 2). However, the Department and NHS England have not yet used this evidence to update their modelling of demand. In addition, the Department and NHS England have only a limited understanding of what level of demand could be met through other routes such as direct access to physiotherapy or walk-in centres.
26 Comptroller and Auditor General, Stocktake of access to general practice in England, Session 2015-16, HC 605, National Audit Office, November 2015.

34 Part Three Improving patient access to general practice
3.14 Health Education England is responsible for providing leadership and oversight of workforce planning, education and training. As part of this, it models the supply of staff and whether this is likely to meet the demand forecast by NHS England and the Department. Health Education England and NHS England anticipate that demand and staffing projections being put into sustainability and transformation plans will help to refine its staffing models in the future. However, its current understanding is limited:
• Practices have a duty to support collective planning, although for the latest collection data were not collected from around 7% of practices, including some that refused to provide it. Data on the use of locum GPs are also not comprehensive (see paragraph 3.20).
• Health Education England does not routinely obtain workforce plans from practices and, as a result, it is unclear where there are vacancies.
• In 2015, NHS Digital changed how it collects data on staffing in general practice. The new data collected have highlighted inaccuracies in NHS Digital’s previous data that Health Education England had used to model the supply of GPs. In particular, the latest data suggest that newly qualified GPs participate at a lower rate (0.77 full-time equivalent schedules compared with 0.90 assumed in the model), equating to a fall in the estimated supply by 2020 of 1,900 full-time equivalent GPs.27
Training new GPs
3.15 Health Education England has made some progress in increasing the number of doctors training to become GPs but has not yet met its target of 3,250 new trainees a year. Health Education England is using several initiatives to increase the number of GPs, including a marketing campaign designed to recruit more newly trained doctors to general practice. The Department also announced in October 2016 that the number of undergraduate medical training posts would increase by a quarter to some 7,500 each year in 2018. Health Education England sets the number of training places available for different specialties, including in general practice, although doctors can choose which specialties to apply for. As we previously reported, Health Education England has not consistently adjusted training places in specialties where there are likely to be too few or too many places to meet demand.28 The Department and Health Education England do not set targets for medical schools for providing the required numbers of GP trainees. Recruitment numbers are being monitored closely by both Health Education England and the Department, but data suggest difficulties in achieving their objectives:
• 3,019 doctors have been recruited to start GP training in 2016/17. This is 250 doctors higher than the 2,769 doctors recruited in 2015/16 but still 7% (231 doctors) below the target.
• This follows a 13% (396 doctors) shortfall in 2014/15 and an 11% (348 doctors) shortfall in 2015/16.29
27 Newly qualified participation rate is estimated to be the rate among qualified GPs aged under 35, as at March 2016.28 Comptroller and Auditor General, Managing the supply of NHS clinical staff in England, Session 2015-16, HC 736,
National Audit Office, February 2016.29 Health Education England made available 3,117 training places in 2015/16 and 3,067 in 2014/15.

Improving patient access to general practice Part Three 35
3.16 Health Education England and NHS England have acted to address some of the regional variation in staffing. Our 2015 report found that general practice staff are not distributed across the country according to need, and that patients in those areas with fewer GPs and nurses report poorer access.30 Doctors are free to choose where they practice. However, the Department’s mandate for Health Education England requires it to understand geographical imbalances and take action to correct them. Many students take up work in the area where they trained, so it is important that the distribution of trainees reflects the relative workforce needs of each area. Health Education England and NHS England are supplementing the salaries of trainee GPs who agree to train and work in areas where it has previously been hard to recruit GPs. In addition, our analysis confirms that Health Education England has generally ensured more training posts in – and directed recent increases in training post numbers towards – its regions with lower numbers of GPs rather than where they are easiest to fill. Training places at the three regions with the lowest GP supply per head of population, once adjusted for needs, increased by 8% between 2014 and 2016, compared with 4% at the three regions with the highest GP supply.
Other initiatives to increase GP numbers
3.17 Progress on the workforce action plan initiatives to attract additional GPs has been mixed, although some are working to a longer timescale (Figure 11 overleaf). In our survey, nearly two-thirds (65%) of GPs rated support with maintaining or improving staff levels as poor. In 2015, NHS England tried to get GPs onto the Home Office’s list of occupations where there are not enough resident workers to fill vacancies. This measure would have made it easier to recruit from overseas, but was unsuccessful. In 2015, 387 doctors who trained for their first medical qualification outside the European Union joined the UK-wide GP register, which is more than 100 fewer than for any of the previous eight years for which data are available.31 In April 2016, the General Practice Forward View included intentions for an international recruitment campaign.
Retention and part-time working of GPs
3.18 There is a risk that the positive impact of supplying new staff will be cancelled out by falling retention. There are currently no reliable data on the overall recent trend in the number of doctors working in general practice. However, the available data indicate that nearly as many GPs have left as have joined since 2010. Health Education England’s modelling suggests that the impact of failing to improve retention is likely to be far greater than the impact of not meeting recruitment expectations. There are currently no accurate data on GPs permanently leaving the profession, although Health Education England has estimated the rate of GPs leaving to be 5.3% a year. If the actual rate is one percentage point either way from this estimate, the supply of GPs by 2020 would change by around 1,500.
30 See footnote 26.31 Data taken from General Medical Council General Practitioner register, with data given covering licensed doctors only.
The GP register was established in 2006, with 2007 therefore being the first year with data on new joiners.

36 Part Three Improving patient access to general practice
3.19 The proportion of GPs leaving the profession has been steadily rising, particularly of older GPs. Between 2005 and 2014 (the latest for which comparable data are available), the proportion of GPs aged between 55 and 64 that left approximately doubled.32 Organisations we spoke to said that pressures from higher workload and increased tax on pensions were among the reasons for this rise. The Committee of Public Accounts previously concluded that the new pension arrangements may be encouraging GPs to retire early if they have maximised their pension fund before the age of 60.33 Research commissioned by NHS England among GPs that had left or were considering leaving the profession found an increase or change in workload to be the overarching factor, with a changing relationship with patients and a feeling of being undervalued also highlighted.34 As employers, practices clearly influence staff retention and productivity, which affect the supply of staff. In January 2015, NHS England and Health Education England identified a number of initiatives to try to stem the flow of GPs leaving the profession.
32 See footnote 26.33 HC Committee of Public Accounts, Access to General Practice in England, Twenty-eighth Report of Session 2015-16,
HC 673, March 2016.34 Ipsos MORI, Looking to the future: the recruitment, retention and return of GPs, December 2015.
Figure 11Progress against GP workforce initiatives
Initiative Target Progress to date
Fellowships Roll out 250 post-certificate of completion of training fellowships by summer 2017 to offer wider and more varied training opportunities in areas with the lowest levels of GP recruitment
150 predicted by August 2017 based on current rates1
Overseas recruitment Attract up to 500 extra appropriately trained and qualified doctors from overseas by 2021
No data currently available
Returners Attract and retain at least 500 extra GPs back into general practice in England by 2021
131 in first nine months of 20162
£20,000 salary supplements Attract more than 100 trainees in summer 2016 to areas that have found it hardest to recruit into GP training
105 of 122 NHS England-funded posts filled in 2016
Notes
1 Health Education England’s projections.
2 Data on returners show the number of doctors re-registered to the GP register, or restoring their license.
Source: Health Education England, NHS England and General Medical Council

Improving patient access to general practice Part Three 37
3.20 A large number of GPs are choosing to work part-time. In March 2016, on average, a qualified GP was contracted to work the equivalent of 0.82 full-time schedules (after excluding locum GPs) compared with 0.95 for hospital consultants. This difference converts to more than 4,000 full-time equivalent GPs. While there are no reliable data on trends in GPs’ part-time working, the increase in the number of female and salaried doctors – both of which are more likely to work part-time – is likely to reduce overall participation levels (Figure 12). A small recent survey of doctors in GP training found only one in 10 of trainees surveyed intended to do full-time clinical work in general practice 10 years after qualifying, with half (49%) of trainees expecting to also be doing other work such as medical education or working in a hospital.35 Another influence on the participation rate is the use of locums. Data on their use within general practice are not comprehensive, although one source suggests that they account for around one-fifth of doctors working in general practice (approximately 12,000).36 The limited evidence available suggests they work fewer hours but account for an increasing proportion of the workforce.
35 The King’s Fund, Understanding pressures in general practice, May 2016. Sample of 318 trainees.36 Data from NHS England’s performer list, as at 23 November 2016.
Figure 12Trend in part-time working
Female and salaried GPs are increasing as a proportion of the workforce; both groupstypically work less than male and partner GPs
Proportion of workforce Level of participation
2005 2015 2015 Comparator
Female GPs 41% 52% 0.73 FTE 0.93 FTE(for male GPs)
Salaried GPs 10% 31% 0.68 FTE 0.89 FTE(for partner GPs)
Notes
1 Levels of participation are reported as full-time equivalence (FTE); a measure of part-time working, with1 being all staff working full-time.
2 Some of the proportions given are calculated by aggregating different categories. This may result in somedouble-counting, however the effect is unlikely to be signifi cant.
3 To ensure comparability across years, data exclude locum GPs. Data reported at 30 September each year.
Source: National Audit Offi ce analysis of NHS Digital data

38 Part Three Improving patient access to general practice
3.21 A key threat to retaining GPs is morale within the profession. A survey in 2015 asked GPs (or equivalent professionals) in 11 countries how stressful their jobs were. GPs in the United Kingdom were most negative: 20% were likely to say extremely stressful compared with an average across the countries of 8%.37 In April 2016, the General Practice Forward View set out a number of measures to better manage workload in general practice.38 These include additional funding to support patients to manage illnesses themselves, to support practices to be more resilient, and to train reception staff to steer patients to the most appropriate support, as well as work to reduce the administrative burden on practices. However, in our survey, 69% of GPs rated support with reducing burdens and releasing time as poor. Between July and October 2016, NHS England held a series of events for practices to hear how and when the plans in the General Practice Forward View would be implemented.
Supply of wider primary care workforce
3.22 GPs work within mixed teams of staff to provide services. Currently, around 28% of the general practice workforce are GPs. The remainder are practice nurses (13%), other staff providing direct patient care (8%), and administrative, clerical and other staff (52%). In the General Practice Forward View, NHS England, Health Education England and the Royal College of General Practitioners set out the objective to produce a minimum of 5,000 other staff to work in general practice by 2020-21 including an extra 3,000 mental health therapists, 1,500 clinical pharmacists and 1,000 physician associates. In addition, NHS England committed to fund a pilot for 470 clinical pharmacists from spring 2016. Using other clinical groups more can potentially improve cost-effectiveness.39 For example, we found that patients from practices with a higher proportion of clinical staff that are not GPs are less likely to attend major A&E departments.
3.23 The Department and its arm’s-length bodies have recently encouraged a different skill mix within general practice. The limited available data suggest that between 2010 and 2015, staff other than GPs working in general practice increased at twice the rate of GPs. NHS England is carrying out pilot studies to investigate whether different staffing models are effective and what support is required. The Department has started to collect additional data on the wider clinical workforce in primary care. The limited data currently available suggest nurses account for the same proportion of general practice staff as in 2009, despite recent increases in their numbers. Health Education England has sought to address a previous lack of training and support available to nurses, and has produced a strategy for developing the general practice nurse workforce. In addition, NHS England is providing funding to develop the skills of practice managers and receptionists. GPs we surveyed were nearly twice as likely to rate support with using a wider range of primary care staff as good (27%) than support with maintaining or improving staff levels (14%).
37 The Commonwealth Fund, 2015 International Survey of Primary Care Doctors, November 2015.38 NHS England, Health Education England and Royal College of General Practitioners, General Practice Forward View,
April 2016.39 Primary Care Foundation and NHS Alliance, Making Time in General Practice, October 2015.

Improving patient access to general practice Part Three 39
3.24 The incentives for practices to provide the most cost-effective care are unclear. The most cost-effective and achievable mix of staff will vary depending on local needs and workforce supply. However, our analysis suggests that the costs to providers of using different clinical groups are not always aligned with the costs to the taxpayer. This issue is because Health Education England pays the salaries of doctors training to become GPs but does not contribute to the costs of other staff once employed within general practice. As a result, a practice would typically cover most of the cost of employing a practice nurse (£38,000) but none of the cost of a doctor in training despite an annual cost of £80,000 to the taxpayer (Figure 13). Doctors training to become GPs require supervision and training. However, the clinical service contribution of doctors reaching the end of their training is likely to be substantial and the government count them towards its target of 5,000 additional doctors by 2020.40
40 Centre for Workforce Intelligence, In-depth review of the general practitioner workforce, July 2014.
Figure 13Estimated cost of employing general practice workforce, by staff group1
The cost to practices of employing different staff groups does not reflect their overall costto the taxpayer
Clinical group Average annual cost to the health system2
(£)
Average annual cost paid by a practice3
(£)
Qualified GP 124,000 115,000
Trainee GP4 80,000 0
Physician associate 48,000 45,000
Practice nurse5 41,000 38,000
Notes
1 All fi gures given per full-time equivalent. Numbers of staff rounded to nearest 10. Salaries and costs are indicative and are rounded to nearest £1,000.
2 Covers salary, employers’ National Insurance contributions and pension contributions and training costs. Training costs have been allocated across the average years in service. We assumed on average, GPs and physician associates will be in service for 26 full-time equivalent years and a practice nurse will be in service for 16 full-time equivalent years. Training costs include minimum grants and bursaries paid by Health Education England. The calculation assumes that 50% of the salary paid to trainee GPs (through host hospitals or GP practices) covers training costs and 50% is for the services they provide during training.
3 Covers salary, employers’ National Insurance contributions and pension contributions minus any contributions to host GP practices by Health Education England while in post. Reimbursement for the use of a practice car while in placement is not included.
4 Practices are fully reimbursed for the salary of trainee GPs. Individual practices can decide to pay any extra above the nationally set salaries. Cost of training for trainee GPs includes only training cost before the point of entry as a trainee GP.
5 The fi gures do not account for nurses paying their own tuition fees from 2017/18 onwards.
Source: National Audit Offi ce analysis of NHS Digital, Personal Social Services Research Unit data and otherdocuments published by various NHS bodies
40 Appendix One Improving patient access to general practice
Appendix One
Our audit approach
1 This report examines the structures and mechanisms that exist to improve patient access to general practice. We reviewed:
• the clarity of objectives for access made by the Department of Health (the Department) and NHS England;
• the assurance that commissioners take that general practice is meeting these objectives; and
• the support that the Department of Health and its arm’s-length bodies gives to general practice to meet these objectives.
2 In reviewing these issues, we applied an analytical framework with evaluative criteria that consider what arrangements would be optimal for improving access to general practice. By ‘optimal’ we mean the most desirable possible, while acknowledging expressed or implied restrictions or constraints. A constraint in this context is the funding settlement to NHS England.
3 Our audit approach is summarised in Figure 14. Our evidence base is described in Appendix Two.

Improving patient access to general practice Appendix One 41
Figure 14Our audit approach
Our evaluative criteria Do the Department and
NHS England have clear and shared objectives for access to general practice?
Are the Department and its arm’s-length bodies effectively supporting general practice to meet these objectives?
Do commissioners have assurance that general practice is meeting these objectives?
Our evidence
(see Appendix Two for details)
Visits to local commissioners.
Review of activity and workforce models.
Consultation with staff at the Department and NHS England.
Consultation with a range of stakeholder organisations.
Survey of GPs.
Analysis of data on payments to general practice.
Review of evidence on initiatives for access and capacity.
Consultation with a range of stakeholder organisations.
Visits to local commissioners.
Surveys of GPs and GP inspectors.
Analysis of data on access and capacity.
Consultation with a range of stakeholder organisations.
The Department and NHS England’s objectives
Good, fast access to general practice is important as it is often the first point of contact for people with health or wider concerns. General practice staff play a key role in detecting and treating health problems, managing patients’ conditions in the community and referring patients on to hospital treatment or social care where appropriate. Poor access to general practice can have a significant impact on patients’ health.
How this will be achieved NHS England contracts general practices to provide a range of services for their registered patients. The GP
contract stipulates core services that practices must provide, and core opening hours for practices to operate.
Improving access to general practice is a priority for the government. It has committed to recruit 5,000 extra doctors to general practice, and to ensure access to general practice during evenings and weekends, by 2020. The Department and NHS England have a range of initiatives to improve access to general practice, including the GP Access Fund, which has run pilot projects to extend opening hours and provide a more flexible service, and a 10-point general practice workforce action plan.
Our studyThe study examined whether the Department and NHS England are implementing their objectives for access to general practice effectively.
Our conclusionsThe Department and NHS England have a high-level vision for access to general practice and have set some challenging objectives for achieving this. They have increased the funding available to general practice and NHS England has sought to make allocations to local areas fairer. However, they have not yet fully evaluated the cost-effectiveness of their commitments and are seeking to extend access despite failing to provide consistent value for money from existing services. The contractual requirements are limited and have not prevented wide variations in access, with evidence that those practices closing for extended periods during core hours may not be meeting the needs of their patients.
Limited levers to performance manage and difficulty in restructuring services leave commissioners in a weak contractual position. Instead, the Department and NHS England, along with Health Education England, have used a range of softer initiatives intended to incentivise and encourage practices to improve access and deliver better value for money. These measures include piloting new ways of working and seeking to increase staff capacity. But there are considerable limitations in the current mechanisms for delivering improvements – including a failure to attract and retain sufficient staff numbers and misaligned incentives for practices to employ staff cost-effectively. Without a more coordinated approach and stronger incentives to secure the desired results, the NHS is unlikely to get optimal value for money.

42 Appendix Two Improving patient access to general practice
Appendix Two
Our evidence base
1 We reached our independent conclusions on whether the Department of Health (the Department) and NHS England were implementing their objectives for access to general practice effectively after analysing evidence that we collected between April and September 2016. Our audit approach is outlined in Appendix One.
2 We conducted nine case study visits to local commissioners:
• We visited three NHS England local area teams, as well as two clinical commissioning groups within each area team that had taken on some commissioning responsibility since April 2015.
• We selected our case study locations to reflect key factors including general practice performance and location.
• The case study visits consisted of interviews with key staff involved in the commissioning and contracting of general practice services. We also collected a range of supporting data and documentation from each commissioner.
• The case study visits were designed to assess similarities and differences in monitoring and managing access, to identify the challenges faced by local commissioners, and to assess the quality of support provided by national bodies.
3 We commissioned medeConnect to conduct a short survey about GPs’ expectations and experiences of commissioning. The survey was carried out in August 2016 using an existing research community of doctors, from which medeConnect recruited a regionally representative sample of 839 GPs. We used the survey to explore expectations about access, opinions on contract and performance management, and views on the support given to practices. In reporting the findings, we have calculated percentages as a proportion of total responses, including those that answered “Don’t know/Not applicable”.

Improving patient access to general practice Appendix Two 43
4 We surveyed GP inspectors in the Care Quality Commission about their experiences of commissioning in general practice. The survey was sent via email to approximately 190 inspectors in September 2016. We had responses from 75 inspectors, a response rate of 39%. We used the survey to capture inspectors’ views on the availability of information on access, the ability of practices to provide good access and the quality of monitoring and support provided by commissioners. Some inspectors did not answer every question. Non-responses have been excluded from the analysis; these non-responses were no more than seven for any question. We have included those that answered “Don’t know/Not applicable” when calculating percentages.
5 We analysed existing data on access and capacity. We looked at data from the GP Patient Survey for 2014-15 and 2015-16, data on opening times for October 2014 and October 2015, data on payments to general practice in 2014-15 and 2015-16, and data on staffing in general practice at September 2014 and September 2015. We used these to reveal numbers and regional variation in practices closing on weekday afternoons.
6 We carried out regression analyses to investigate key associations between opening times, funding and indicators of access, including patient experience and A&E attendances. In carrying out these analyses, we controlled for patient profiles at each practice, staffing levels and some practice and clinical commissioning group-level characteristics.
7 We reviewed the activity and workforce models developed by NHS England and Health Education England. We assessed the methods they use to calculate how many GPs and other staff the system will need going forward, and tested the assumptions these models used. This helped us assess the robustness of their workforce planning.
8 We reviewed the available evidence on how well NHS England and Health Education England had implemented their initiatives to improve access and capacity. These initiatives included the GP Access Fund, the Supporting Vulnerable Practices programme, and the Clinical Pharmacists in General Practice pilot. Where it was available, we assessed emerging evidence on the impact that these initiatives have had on access and capacity.
9 We spoke to a range of staff across the Department, NHS England and Health Education England. This was to understand how they had set objectives for access, how they were monitoring objectives and how they were supporting general practice to achieve these objectives. We spoke to representatives covering topics including contracting in general practice, the GP Access Fund, digital developments and workforce planning and development.

44 Appendix Two Improving patient access to general practice
10 We interviewed and/or consulted a range of stakeholders. This work was designed to obtain views on: commissioners’ oversight of access to general practice; the quality of support provided by the Department and its arm’s-length bodies; and the challenges in improving access. We consulted with the British Medical Association, Care England, the Care Quality Commission, Care UK, the National Association of Primary Care, NHS Clinical Commissioners, NHS Improvement, the Nuffield Trust, the Practice Management Network, the Royal College of General Practitioners, the Royal College of Nursing, and the Royal Pharmaceutical Society.
11 We spoke to academics and researchers working in this area. This work helped us to identify and understand key data and research. We spoke to the Department of Public Health and Primary Care at the University of Cambridge, the Health Foundation, the Manchester Centre for Health Economics, NHS Digital and the Nuffield Department of Primary Care Health Sciences.

Improving patient access to general practice Appendix Three 45
Appendix Three
Update on our stocktake of access
1 In our first report, we concluded that people’s experience of accessing general practice had remained positive, although patient satisfaction with access had declined gradually but consistently. Further, we noted considerable variation, with different patient and practice characteristics appearing to have a significant effect on patient experience. We have not sought to undertake a comprehensive update on our first report; however, the latest data available against key indicators used in that study suggest this situation remains (Figure 15 overleaf).
2 In our first report, we noted a lack of up-to-date data on the number of consultations in general practice. Since then, the National Institute for Health Research has published research suggesting that the number of consultations increased between 2007-08 and 2013-14 by 2.5% a year on average, a slightly slower rate than other studies had estimated. However, this study also estimated that the duration of each consultation had increased from 8.65 minutes to 9.22 minutes.

46 Appendix Three Improving patient access to general practice
Figure 15Updates on measures of access and capacity
Theme and measure 2011-12 2014-15 2015-16 Change since first
report
Availability of appointments
Patients reporting they were able to get an appointment to see or speak to someone
90.8 88.6 88.5 Stable
Patients reporting a good experience of making an appointment
79.1 73.3 73.4 Stable
Patients who said it was easy to get through to their GP practice on the telephone
80.9 73.3 72.9 Declined
Patients who said the receptionist was helpful 91.0 88.7 89.2 Improved
Convenience of services
Patients reporting that their surgery is open at convenient times
83.2 79.8 80.7 Improved
Weekend opening of practices – Saturdays/Sundays1
Data not available
21.5%/ 2.4%
21.5%/2.5%
Stable
Continuity of care
Patients receiving continuity of care 65.7 60.0 58.8 Declined
Staffing and capacity
GPs and practice nurses in employment (headcount)2
63,600 64,900 63,800 Reduced
Notes
1 Opening times as at October each year.
2 Staffi ng numbers as at 30 September each year. Excludes locum GPs as data not available for 2011 and 2014.
Source: National Audit Offi ce analysis of GP Patient Survey, NHS England data and NHS Digital data

This report has been printed on Evolution Digital Satin and contains material sourced from responsibly managed and sustainable forests certified in accordance with the FSC (Forest Stewardship Council).
The wood pulp is totally recyclable and acid-free. Our printers also have full ISO 14001 environmental accreditation, which ensures that they have effective procedures in place to manage waste and practices that may affect the environment.

£10.00
9 781786 040954
ISBN 978-1-78604-095-4
Design and Production by NAO External Relations DP Ref: 11350-001