Report and Recommendation for a Developer and Operator of ...
62
Report and Recommendation for a Developer and Operator of the Video Lottery Facility at Aqueduct Racetrack Prepared for Governor David A. Paterson New York State Division of the Lottery Evaluation Committee August 3, 2010
Transcript of Report and Recommendation for a Developer and Operator of ...
Report and Recommendation for a Developer and Operator of the Video Lottery Facility at
Aqueduct Racetrack
Prepared for Governor David A. Paterson
New York State Division of the Lottery Evaluation Committee
August 3, 2010

2
Summary Recommendation
The Division of the Lottery (the “Lottery”) recommends that the State of New York (the “State”) select Genting New York LLC (“Genting”) as the developer and operator of a video lottery facility at Aqueduct Racetrack. Genting meets or exceeds all the requirements for selection and offers an upfront licensing fee of $380 million. Genting and its related entities are qualified to receive Video Lottery licenses and have the financial wherewithal to meet the financial obligations of the project. Genting received a score of 95 out of 100 in our technical and financial evaluation.
Genting proposes a phased development process that will begin with the opening of a preliminary phase of the facility equipped with 1,600 video lottery terminals (“VLTs”) 6 months after approval, a second phase opening 6 months later with two gaming floors equipped with the full complement of 4,525 VLTs, a 2,100-space parking garage, and a new pedestrian bridge to the Aqueduct subway station, and a final phase with completion of abatement activities and construction of a new porte cochere.
Approval can be granted by the Governor’s signature, together with the signatures of the Temporary President of the Senate and the Speaker of the Assembly, on the required Memorandum of Understanding, which has already been signed on behalf of Genting.
Genting’s Qualifications
Genting New York LLC was organized in Delaware on December 22, 2008, and authorized to do business in New York on June 2, 2010. Genting is a wholly-owned subsidiary of Genting Malaysia Berhad, a publicly traded company listed on the Malaysian Stock Exchange under the symbol “GENM.” GENM has $1.6 billion in cash on hand and market capitalization of $5.25 billion. GENM is an affiliate of the Genting Group of Companies, a major multinational business organization active in a variety of businesses, including the operation of large scale integrated casino resorts under the Resorts World brand name in Malaysia, Singapore, the Philippines and the United Kingdom, with an operating history of over 45 years. The Genting Group is one of the largest and most valuable gaming companies in the world with over 45,000 employees and market capitalization of $28 billion. The group owns and operates Resorts World Genting, an integrated casino resort near Kuala Lumpur, the capital of Malaysia. Resorts World Genting attracts 20 million visitors a year and has been voted the world’s leading casino resort from 2005 to 2009. It has 6 hotels with a total of 10,000 rooms, a casino with 3,100 slot machines and 500 table games, indoor and outdoor theme parks with over 60 rides, a shopping mall with 170 retail and dining outlets, 150,000 square feet of convention facilities, and 3 performance venues with seating capacity of 9,100.
3
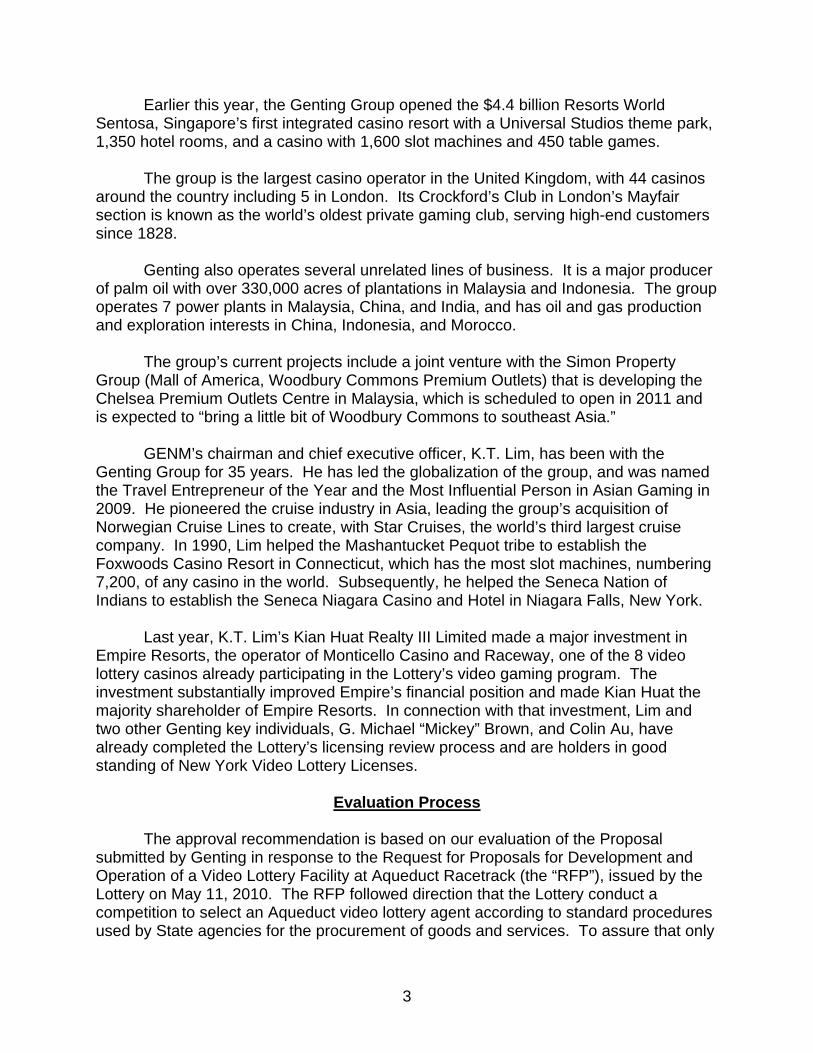
Earlier this year, the Genting Group opened the $4.4 billion Resorts World Sentosa, Singapore’s first integrated casino resort with a Universal Studios theme park, 1,350 hotel rooms, and a casino with 1,600 slot machines and 450 table games. The group is the largest casino operator in the United Kingdom, with 44 casinos around the country including 5 in London. Its Crockford’s Club in London’s Mayfair section is known as the world’s oldest private gaming club, serving high-end customers since 1828. Genting also operates several unrelated lines of business. It is a major producer of palm oil with over 330,000 acres of plantations in Malaysia and Indonesia. The group operates 7 power plants in Malaysia, China, and India, and has oil and gas production and exploration interests in China, Indonesia, and Morocco.
The group’s current projects include a joint venture with the Simon Property Group (Mall of America, Woodbury Commons Premium Outlets) that is developing the Chelsea Premium Outlets Centre in Malaysia, which is scheduled to open in 2011 and is expected to “bring a little bit of Woodbury Commons to southeast Asia.” GENM’s chairman and chief executive officer, K.T. Lim, has been with the Genting Group for 35 years. He has led the globalization of the group, and was named the Travel Entrepreneur of the Year and the Most Influential Person in Asian Gaming in 2009. He pioneered the cruise industry in Asia, leading the group’s acquisition of Norwegian Cruise Lines to create, with Star Cruises, the world’s third largest cruise company. In 1990, Lim helped the Mashantucket Pequot tribe to establish the Foxwoods Casino Resort in Connecticut, which has the most slot machines, numbering 7,200, of any casino in the world. Subsequently, he helped the Seneca Nation of Indians to establish the Seneca Niagara Casino and Hotel in Niagara Falls, New York. Last year, K.T. Lim’s Kian Huat Realty III Limited made a major investment in Empire Resorts, the operator of Monticello Casino and Raceway, one of the 8 video lottery casinos already participating in the Lottery’s video gaming program. The investment substantially improved Empire’s financial position and made Kian Huat the majority shareholder of Empire Resorts. In connection with that investment, Lim and two other Genting key individuals, G. Michael “Mickey” Brown, and Colin Au, have already completed the Lottery’s licensing review process and are holders in good standing of New York Video Lottery Licenses.
Evaluation Process
The approval recommendation is based on our evaluation of the Proposal submitted by Genting in response to the Request for Proposals for Development and Operation of a Video Lottery Facility at Aqueduct Racetrack (the “RFP”), issued by the Lottery on May 11, 2010. The RFP followed direction that the Lottery conduct a competition to select an Aqueduct video lottery agent according to standard procedures used by State agencies for the procurement of goods and services. To assure that only
4
entities likely to submit a Proposal would participate in the bidders conference, a $1 million entry fee (refundable to all but the selected Vendor) was required to enter the competition. The RFP was sent to vendors that had participated, or expressed interest in participating, in previous efforts to select an Aqueduct video lottery agent. The RFP was also announced in a news release that was widely reported in the news media, advertised in the New York State Contract Reporter, and published on the Lottery’s website.
As requested, we followed an expedited schedule to comply with the statutory
mandate to “use best efforts to ensure that the video lottery terminal facility at Aqueduct is opened as soon as is practicable” (Tax Law section 1612[e]):
RFP Issued May 11, 2010 First Round of Vendors’ Questions May 18, 2010 Lottery Responses to First Questions May 25, 2010 Entry Fee Due June 1, 2010 Mandatory Bidders Conference, with Q & A June 8, 2010 Second Round of Vendors’ Questions June 15, 2010 Lottery Responses to Second Questions June 22, 2010 Vendor Proposals Due June 29, 2010 Lottery Recommendation Announced August 3, 2010 Consistent with the New York State Constitution (Article 1, section 9), the RFP’s
requirements were based on the twin goals of generating lottery support for education and improving the ability of pari-mutuel betting on horse races to produce a reasonable revenue for the support of government, as originally authorized for the video lottery program by Chapter 383 of the Laws of 2001 and repeatedly reaffirmed by the Legislature (Chapter 85 of the Laws of 2002, Chapter 62 of the Laws of 2003, Chapter 63 of the Laws of 2003, Chapter 61 of the Laws of 2005, Chapter 18 of the Laws of 2008, Chapter 140 of the Laws of 2008, Chapter 57 of the Laws of 2009, Chapter 342 of the Laws of 2009, and Chapter 90 of the Laws of 2010).
Six entities* paid the required $1 million entry fee on June 1, 2010: Clairvest Group Delaware North & Saratoga Gaming and Raceway Empire City Casino – Yonkers Raceway Genting New York LLC Penn National Gaming SL Green Realty Corp. * A seventh entity, Peebles Corp., participated in the first round of Questions and Answers but did not submit an entry fee.
Two rounds of written questions and in-person inquiries at the mandatory bidders
conference produced over 220 questions and answers that clarified the RFP’s requirements and were published on the Lottery’s website. Many of the questions
5
addressed the requirement that each Proposal would have to include a signed MOU in the form prescribed by the RFP, as well as a signed Lease Agreement to rent the Aqueduct premises from the State and a Sublease Agreement to rent a portion of the premises to the New York Racing Association (“NYRA”) for horse racing and pari-mutuel wagering at Aqueduct. A number of suggestions raised by the questions were incorporated into the final form of the MOU published on June 22, 2010, but the Lottery’s answers to the questions explained that the lease documents could not be changed because they had already been ordered into effect by the United States Bankruptcy Court’s approval of the settlement of the NYRA bankruptcy case and the State’s implementation of the settlement by the enactment of Chapter 18 of the Laws of 2008.
The final form of the MOU retained the conditions established by the Governor
and the Legislature for the Aqueduct selection, requiring: (1) an upfront licensing fee of at least $300 million, (2) adherence to the construction “footprint” that previously produced a negative
declaration of significant environmental impact under the State Environmental Quality Review Act (“SEQRA”),
(3) a thorough review of all entities, investors, and principal and key individuals to
assure suitability for a video lottery license, and (4) final approval of the selected video lottery agent and its members by the
Governor, the Temporary President of the Senate, and the Speaker of the Assembly.
In addition, the enactment of Chapter 90 of the Laws of 2010 on May 25, 2010,
provided for an emergency financial aid program of $25 million or more to NYRA to assure continued horse racing and pari-mutuel wagering at Aqueduct, Belmont, and Saratoga. To reflect that emergency aid, the RFP was amended to require each Proposal to include signed agreements by the selected vendor to assume responsibility for lending up to $25 million to NYRA, and, if necessary beyond that amount, up to $2 million a month until the opening of the Aqueduct video lottery casino.
On June 8, 2010, and June 15, 2010, the Lottery conducted inspection tours of
the Aqueduct premises, with assistance from NYRA, to make all potential bidders familiar with the condition of the property.
Participation Declined: On June 28, 2010, Clairvest, and on June 29, 2010, Delaware North and Empire
City, informed the Lottery that they would not participate in the competition. Delaware North and Empire City publicly announced that they had decided against participating because the requirements were too difficult, especially the requirement of paying an
6
unconditional $300 million upfront licensing fee. Clairvest, as we learned the following day, continued in the process as a partner with SL Green. The Lottery returned the $1 million entry fees to each of those 3 Vendors.
Receipt of Proposals:
On June 29, 2010, Proposals were received from Genting, Penn National
Gaming, and a consortium consisting of SL Green, Hard Rock, and Clairvest. The sealed financial proposals were secured in the custody of the Lottery’s Internal Audit unit until the scoring of technical merits was completed. A preliminary review of all three Proposals determined that the Penn National and SL Green Proposals did not meet material requirements of the RFP (see Disqualifications, below). Therefore, the Evaluation Committee scored the technical merits of only the Genting Proposal.
Disqualifications: On July 6, 2010, the Lottery informed SL Green and Penn National that their
Proposals were disqualified from further consideration because they did not include signed copies of the MOU and other transaction documents in the forms required by the RFP. Both Proposals included alternative versions of the required agreements that included numerous material deviations from the RFP requirements. SL Green’s Proposal contained more than 175 proposed changes, including a refusal to provide interim financing to NYRA as required to implement Chapter 90 of the Laws of 2010. The $1 million entry fees were refunded to Penn National and SL Green. On August 2, 2010, the sealed financial proposals submitted by Penn National and SL Green were opened; Penn National had offered $325 million and SL Green had offered $300 million.
Litigation: Without notice to the State, Aqueduct Entertainment Company (“AEC”), a
successor to Aqueduct Entertainment Group, which the Lottery had previously determined was unsuitable to receive a video lottery license, obtained a temporary restraining order from the New York State Supreme Court in Schenectady County. The delivery of the order to the Lottery on July 14, 2010, halted the evaluation process until the next day, when the court approved a stipulation between AEC’s attorneys and the New York State Attorney General that allowed the evaluation to continue. On July 29, 2010, the court dismissed AEC’s suit and denied a request for an injunction to prevent the completion of the evaluation.
Protests: On July 15, 2010, SL Green protested the disqualification of its Proposal and
suggested that the Lottery should discontinue the evaluation process and begin a new competition based on an RFP “re-engineer[ed]” to satisfy the desire of SL Green for an MOU much more favorable to disqualified bidders. On August 2, 2010, Penn National protested the disqualification of its Proposal and adopted the contents of SL Green’s
7
protest. Both protesters requested debriefings, and SL Green requested an “expedited response” to its request for a copy of the Genting Proposal.
On August 3, 2010, the Lottery denied both protests and declined the protesters’
suggestion to begin a new competition. On the same date, the Lottery agreed to give debriefings to both protesters and promised to respond to SL Green’s request for the Genting Proposal as expeditiously as possible.
Clarifications:
Clarifications of Genting’s Proposal were sought from Genting as needed and are documented in the procurement record.
Evaluation Committee:
The evaluation was conducted by an Evaluation Committee consisting of 7 members:
Gordon Medenica, Chair Director, New York Lottery Gardner Gurney, Vice Chair Deputy Director, Director of Operations Bill Murray, Vice Chair Deputy Director, General Counsel Randall Lex Director, Sales and Marketing Jim Nielsen Director, Video Lottery Gaming Frank Roddy Director, Finance Steve Lowenstein Division of the Budget representative The Committee represents more than 175 years of combined experience in
business, government, and gaming. They were supported by several other individuals, state agencies and outside contractors.
Gail Thorpe and Debbie Martino of the Lottery’s Finance unit served as
Contracting Officer and alternate Contracting Officer for the evaluation. Jeffrey Allen, the Lottery’s Director of Licensing, supervised the background
investigations and licensing determinations. The New York State Office of General Services, which has supported the video
lottery gaming program since its inception, provided advice and support in the evaluation of environmental and construction matters.
NYRA provided the room for the Bidders Conference, hosted site tours at
Aqueduct, answered questions and gave other assistance as requested by the Lottery.
8
The Empire State Development Corporation, which will facilitate construction financing for the project, supplied important information and transaction documents to the process, as well as interim bridge financing to NYRA.
The New York State Division of Criminal Justice Services and the Federal
Bureau of Investigation provided fingerprint identification reviews and criminal history reports (which showed no adverse information).
KPMG conducted a detailed review and reported a positive opinion on Genting’s
financial ability to fulfill the commitments contained in the Proposal. Pinkerton Investigative Services conducted a detailed background review and
reported a positive opinion on Genting’s business reputation. KPMG’s and Pinkerton’s offices and affiliates in Malaysia and elsewhere added depth to the evaluation.
Evaluation Criteria:
Consensus scoring methodology was selected to score the technical proposal and was based on a pre-determined weighted scoring system. The weighted scoring system provides numerical scores that represent the Committee’s assessments of the technical merits of the Proposal.
Prior to receipt of the proposals an Evaluation Instrument was developed by the Contracting Officer for use by the Evaluation Committee. That document was used throughout the process and contains the worksheets used to record and calculate the scores. The Instrument is included with this report as Attachment 1.
Technical Criteria:
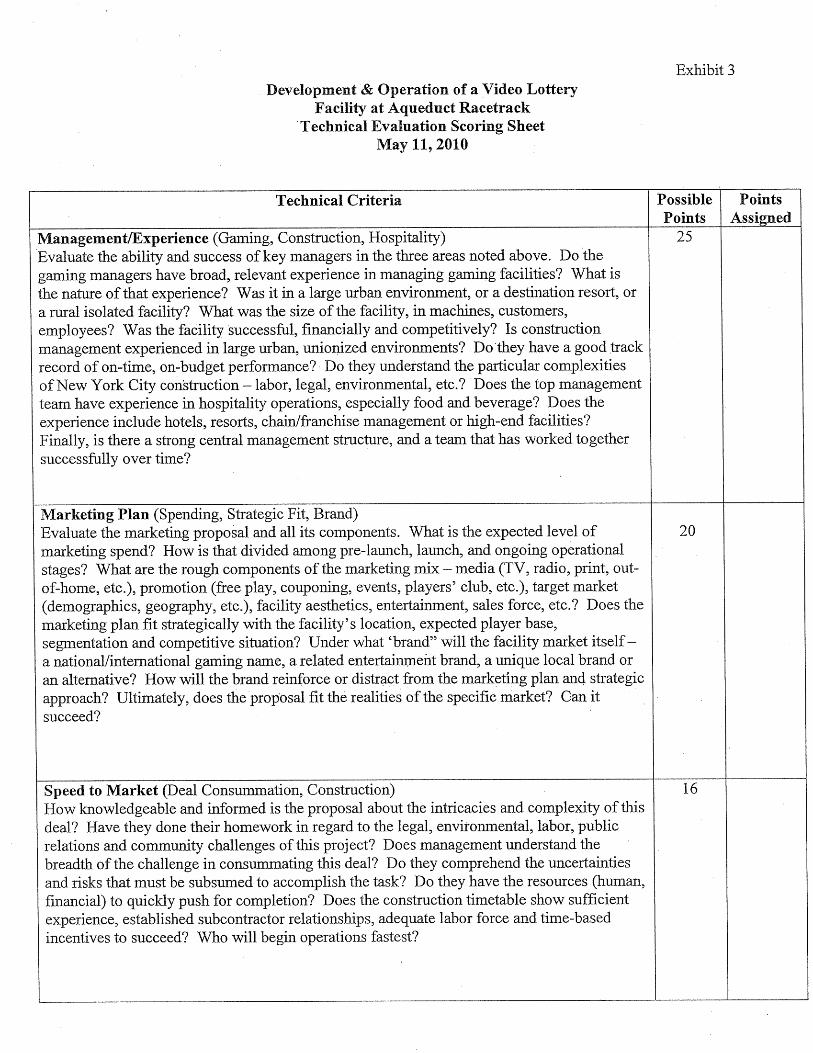
The technical portion of the evaluation was equal to 90% of the total points. The
following components, as reflected in Part 5 of the RFP, were evaluated to determine the technical merit of the Proposal:
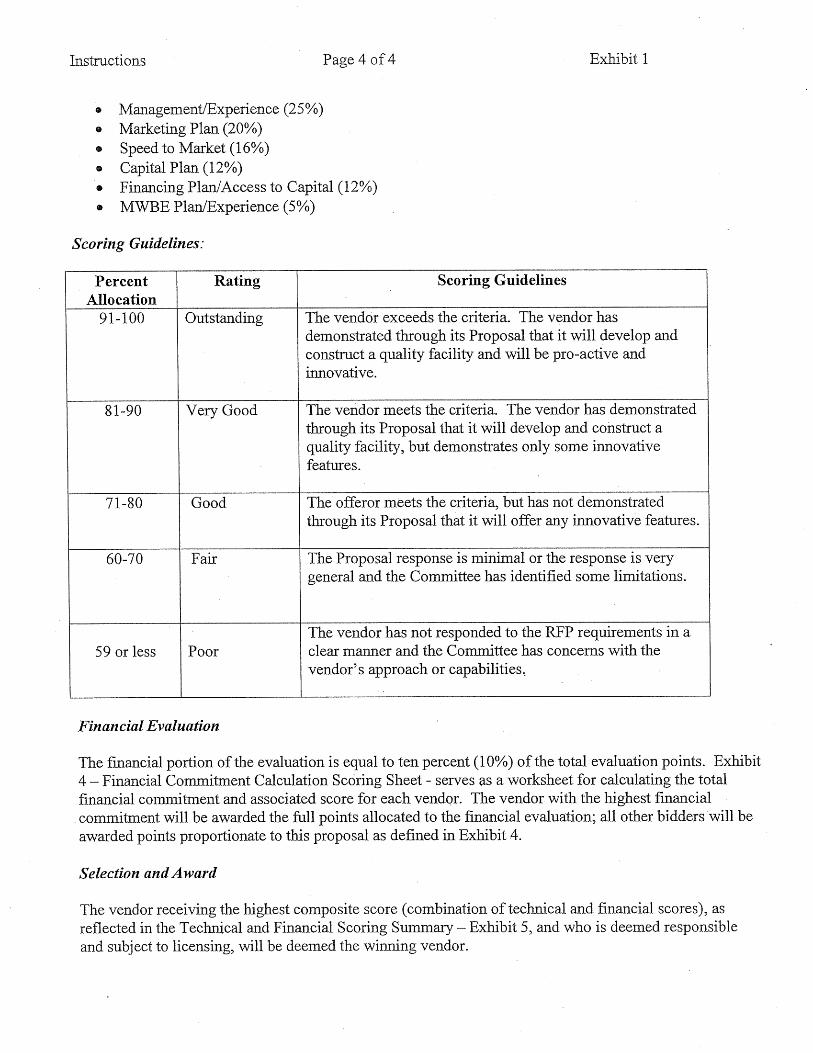
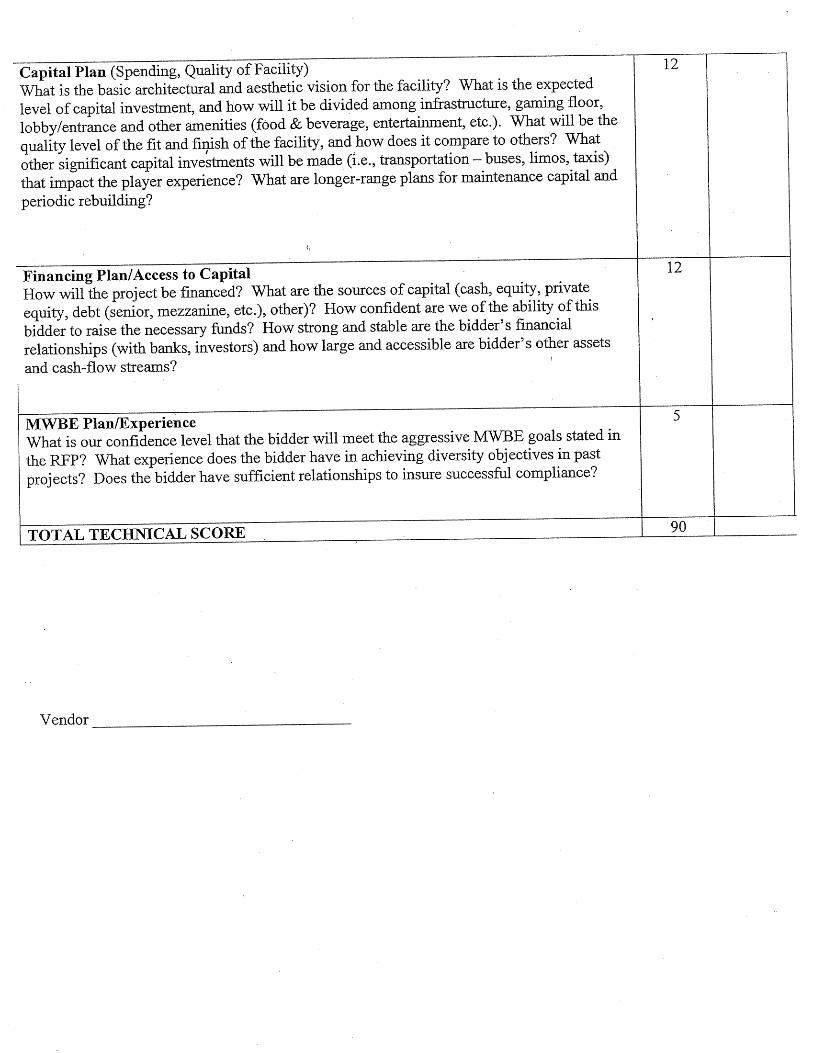
• Management/Experience (25 pts.) • Marketing Plan (20 pts.) • Speed to Market (16 pts.) • Capital Plan (12 pts.) • Financing Plan/Access to Capital (12 pts.) • MWBE Plan/Experience (5 pts.)
Financial Criteria:
The financial portion of the evaluation was equal to 10% of the total points. The
RFP required vendors to submit a License Fee of at least $300 million. Scores were then assigned according to a pre-determined formula in the Evaluation Instrument.

9
Technical Evaluation Scoring Summary - Genting Proposal
Management/Experience (25/25 pts)
Evaluation Scoring Guidance:
Management/Experience (Gaming, Construction, Hospitality) Evaluate the ability and success of key managers in the three areas noted above. Do the gaming managers have broad, relevant experience in managing gaming facilities? What is the nature of that experience? Was it in a large urban environment, or a destination resort, or a rural isolated facility? What was the size of the facility, in machines, customers, employees? Was the facility successful, financially and competitively? Is construction management experienced in large urban, unionized environments? Do they have a good track record of on-time, on-budget performance? Do they understand the particular complexities of New York City construction – labor, legal, environmental, etc.? Does the top management team have experience in hospitality operations, especially food and beverage? Does the experience include hotels, resorts, chain/franchise management or high-end facilities? Finally, is there a strong central management structure, and a team that has worked together successfully over time?
Scoring Narrative:
Genting submitted a well-considered, well-defined, and well-established
professional Proposal, which demonstrates Genting’s vast corporate experience and highly recognized management team. Genting has strong international sales and marketing presence and a high level of experience and quality in the casino gaming and leisure and travel industries. Genting has dedicated its top management teams to the Aqueduct project and has demonstrated through its Proposal that this team will be hands on. Genting has also secured the services of a highly reputable construction firm and architectural firm to develop the Aqueduct facility. Both of these companies are well respected in their fields and have directly relevant experience with New York casinos on which they have worked together. Through its commitment and attention to detail in its Proposal and in its choice of management and subcontractors, Genting has demonstrated its understanding of the clientele who will frequent the Aqueduct facility and what it will take to succeed in the development and operation of the facility.
• Genting has worldwide experience on expansive projects including leisure and
hospitality, plantations and property, and energy. The group is a leader in leisure and hospitality with demonstrated experience in construction and hospitality management and has the proven ability to work with partners on very large projects as demonstrated by the start-up success of Resorts World Sentosa in Singapore. Genting has demonstrated success in destination locales and New York City is an international destination.

10
• Genting’s senior management team consists of seasoned employees with varied backgrounds including project management in the leisure and travel industry, accounting, finance and strategic investments. Experience with the Genting Group for this team ranges from 10 to 35 years, which demonstrates Genting’s commitment to provide the most experienced staff for the Aqueduct project.
• Genting New York – Genting’s choices for the New York team include a number
of highly qualified executives, including as President, Michael Speller, and as Advisor, Mickey Brown, both of whom are recognized leaders of the gaming industry.
o Michael Speller, President – Mike Speller has experience in both
domestic and international gaming jurisdictions and has held leading positions in both Corporate and Native American gaming operations. Mr. Speller has senior management experience in the development and opening of new casinos and the management and operation of existing casinos. Until recently Mr. Speller was the President of Foxwoods Resort Casino & MGM at Foxwoods, the largest resort casino in the United States. In that position, Mr. Speller was responsible for all operational and strategic management of the facility. Mr. Speller’s other related experience includes Senior Vice President of Operations of Star Cruises, where he was responsible for the 1993 start up of the new company. He also worked with the Seneca Nation of Indians in Western New York from 2000 to 2007, both under Genting.
o Barry Hoffman, Director and General Counsel – Barry Hoffman has 10
years experience with the Genting Group in which he has provided legal, regulatory, project development and financing advice as external counsel and recently as a member of the senior management team responsible for Genting’s energy business. Barry’s experience also includes Managing Director of Business Development of a Fortune 500 energy resources company; advisor and counsel to corporate clients involved in complex project development, mergers, acquisitions, financings and cross-border investments.
o G. Michael Brown, Advisor – Mickey Brown is a leading expert in the
design, development, construction and operation of gaming enterprises. Among numerous successful projects, Mr. Brown is credited with the success of Foxwoods Resort and Casino during his term as President and CEO from 1993 through 1997, for the successful opening and expansion of the Seneca Niagara Casino in Niagara Falls, NY, while President and CEO, and for the development and opening of the Seneca Allegany Casino in 2004. Mr. Brown’s experience also includes counsel to tribal nations, foreign governments, and gaming operations; Director of the New Jersey Division of Gaming Enforcement; Deputy Attorney General, Chief
11
Trial attorney and Deputy Director of the New Jersey Division of Criminal Justice.
Mr. Brown is currently licensed by the Lottery and the New York State Racing and Wagering Board.
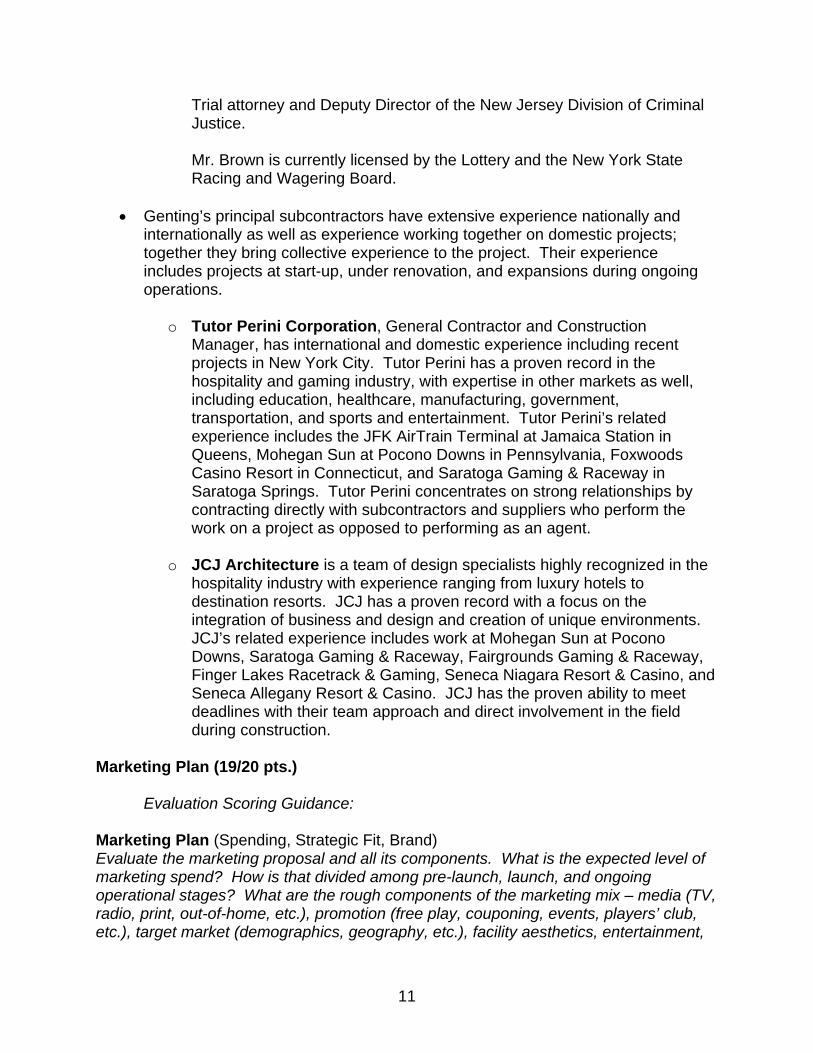
• Genting’s principal subcontractors have extensive experience nationally and
internationally as well as experience working together on domestic projects; together they bring collective experience to the project. Their experience includes projects at start-up, under renovation, and expansions during ongoing operations.
o Tutor Perini Corporation, General Contractor and Construction
Manager, has international and domestic experience including recent projects in New York City. Tutor Perini has a proven record in the hospitality and gaming industry, with expertise in other markets as well, including education, healthcare, manufacturing, government, transportation, and sports and entertainment. Tutor Perini’s related experience includes the JFK AirTrain Terminal at Jamaica Station in Queens, Mohegan Sun at Pocono Downs in Pennsylvania, Foxwoods Casino Resort in Connecticut, and Saratoga Gaming & Raceway in Saratoga Springs. Tutor Perini concentrates on strong relationships by contracting directly with subcontractors and suppliers who perform the work on a project as opposed to performing as an agent.
o JCJ Architecture is a team of design specialists highly recognized in the
hospitality industry with experience ranging from luxury hotels to destination resorts. JCJ has a proven record with a focus on the integration of business and design and creation of unique environments. JCJ’s related experience includes work at Mohegan Sun at Pocono Downs, Saratoga Gaming & Raceway, Fairgrounds Gaming & Raceway, Finger Lakes Racetrack & Gaming, Seneca Niagara Resort & Casino, and Seneca Allegany Resort & Casino. JCJ has the proven ability to meet deadlines with their team approach and direct involvement in the field during construction.
Marketing Plan (19/20 pts.)
Evaluation Scoring Guidance:
Marketing Plan (Spending, Strategic Fit, Brand) Evaluate the marketing proposal and all its components. What is the expected level of marketing spend? How is that divided among pre-launch, launch, and ongoing operational stages? What are the rough components of the marketing mix – media (TV, radio, print, out-of-home, etc.), promotion (free play, couponing, events, players’ club, etc.), target market (demographics, geography, etc.), facility aesthetics, entertainment,
12
sales force, etc.? Does the marketing plan fit strategically with the facility’s location, expected player base, segmentation and competitive situation? Under what ‘brand” will the facility market itself – a national/international gaming name, a related entertainment brand, a unique local brand or an alternative? How will the brand reinforce or distract from the marketing plan and strategic approach? Ultimately, does the proposal fit the realities of the specific market? Can it succeed?
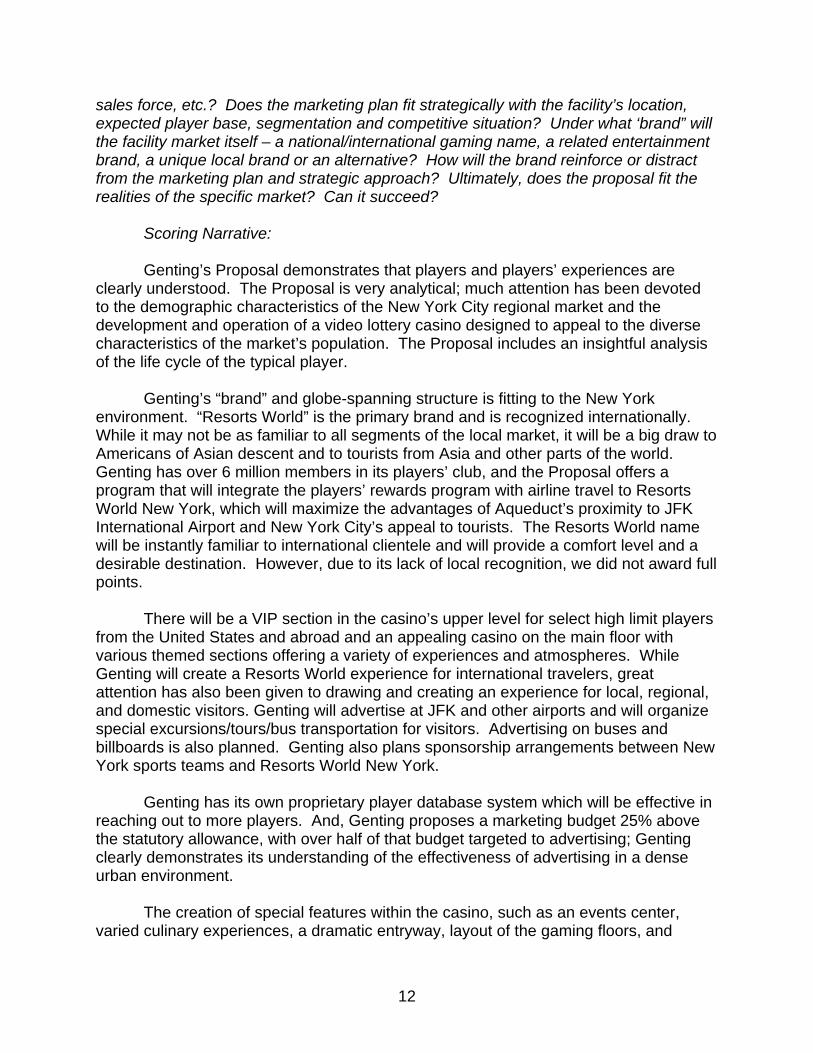
Scoring Narrative:
Genting’s Proposal demonstrates that players and players’ experiences are clearly understood. The Proposal is very analytical; much attention has been devoted to the demographic characteristics of the New York City regional market and the development and operation of a video lottery casino designed to appeal to the diverse characteristics of the market’s population. The Proposal includes an insightful analysis of the life cycle of the typical player.
Genting’s “brand” and globe-spanning structure is fitting to the New York environment. “Resorts World” is the primary brand and is recognized internationally. While it may not be as familiar to all segments of the local market, it will be a big draw to Americans of Asian descent and to tourists from Asia and other parts of the world. Genting has over 6 million members in its players’ club, and the Proposal offers a program that will integrate the players’ rewards program with airline travel to Resorts World New York, which will maximize the advantages of Aqueduct’s proximity to JFK International Airport and New York City’s appeal to tourists. The Resorts World name will be instantly familiar to international clientele and will provide a comfort level and a desirable destination. However, due to its lack of local recognition, we did not award full points.
There will be a VIP section in the casino’s upper level for select high limit players from the United States and abroad and an appealing casino on the main floor with various themed sections offering a variety of experiences and atmospheres. While Genting will create a Resorts World experience for international travelers, great attention has also been given to drawing and creating an experience for local, regional, and domestic visitors. Genting will advertise at JFK and other airports and will organize special excursions/tours/bus transportation for visitors. Advertising on buses and billboards is also planned. Genting also plans sponsorship arrangements between New York sports teams and Resorts World New York.
Genting has its own proprietary player database system which will be effective in reaching out to more players. And, Genting proposes a marketing budget 25% above the statutory allowance, with over half of that budget targeted to advertising; Genting clearly demonstrates its understanding of the effectiveness of advertising in a dense urban environment.
The creation of special features within the casino, such as an events center, varied culinary experiences, a dramatic entryway, layout of the gaming floors, and
13
dancing water shows all demonstrate a very customer-driven, well thought out plan that offers something for all players. Speed to Market (13/16 pts.)
Evaluation Scoring Guidance:
Speed to Market (Deal Consummation, Construction) How knowledgeable and informed is the proposal about the intricacies and complexity of this deal? Have they done their homework in regard to the legal, environmental, labor, public relations and community challenges of this project? Does management understand the breadth of the challenge in consummating this deal? Do they comprehend the uncertainties and risks that must be subsumed to accomplish the task? Do they have the resources (human, financial) to quickly push for completion? Does the construction timetable show sufficient experience, established subcontractor relationships, adequate labor force and time-based incentives to succeed? Who will begin operations fastest?
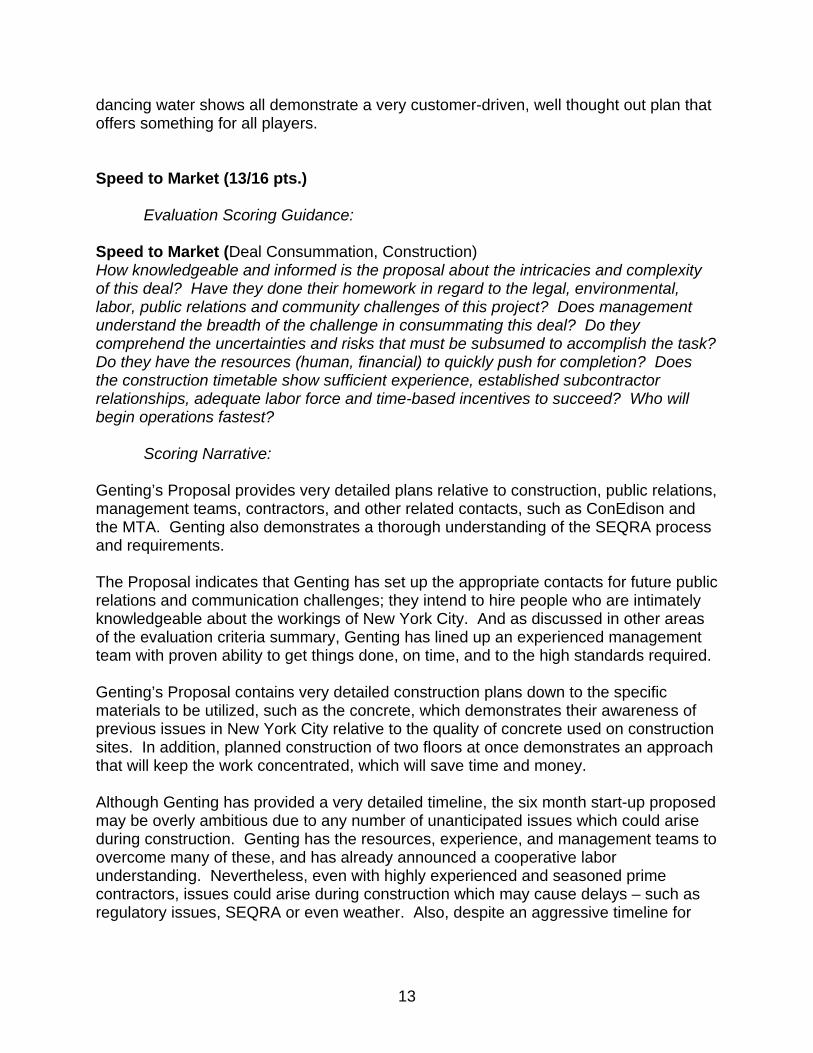
Scoring Narrative:
Genting’s Proposal provides very detailed plans relative to construction, public relations, management teams, contractors, and other related contacts, such as ConEdison and the MTA. Genting also demonstrates a thorough understanding of the SEQRA process and requirements. The Proposal indicates that Genting has set up the appropriate contacts for future public relations and communication challenges; they intend to hire people who are intimately knowledgeable about the workings of New York City. And as discussed in other areas of the evaluation criteria summary, Genting has lined up an experienced management team with proven ability to get things done, on time, and to the high standards required. Genting’s Proposal contains very detailed construction plans down to the specific materials to be utilized, such as the concrete, which demonstrates their awareness of previous issues in New York City relative to the quality of concrete used on construction sites. In addition, planned construction of two floors at once demonstrates an approach that will keep the work concentrated, which will save time and money. Although Genting has provided a very detailed timeline, the six month start-up proposed may be overly ambitious due to any number of unanticipated issues which could arise during construction. Genting has the resources, experience, and management teams to overcome many of these, and has already announced a cooperative labor understanding. Nevertheless, even with highly experienced and seasoned prime contractors, issues could arise during construction which may cause delays – such as regulatory issues, SEQRA or even weather. Also, despite an aggressive timeline for

14
start-up, the Proposal is unclear on time based incentives or bonus payments to contractors. For these several reasons, we awarded 13 of 16 points. Capital Plan (12/12 pts.)
Evaluation Scoring Guidance:
Capital Plan (Spending, Quality of Facility) What is the basic architectural and aesthetic vision for the facility? What is the expected level of capital investment, and how will it be divided among infrastructure, gaming floor, lobby/entrance and other amenities (food & beverage, entertainment, etc.). What will be the quality level of the fit and finish of the facility, and how does it compare to others? What other significant capital investments will be made (i.e., transportation – buses, limos, taxis) that impact the player experience? What are longer-range plans for maintenance capital and periodic rebuilding?
Scoring Narrative:
Genting’s Proposal demonstrates a commitment to a world class facility with a build quality equal to the best facilities while also incorporating many innovative ideas for utilizing the highlights of the current structure. Every attention to detail has been demonstrated from the design of grand entrances to maximizing the current historical structure. The initial $350 million capital investment offered in the Proposal demonstrates the quality of the build and the ongoing capital plan shows a commitment to the facility over the long term. Genting’s Proposal demonstrates a good overall vision, with impressive aesthetics, good traffic flow, and a high quality fit and finish which exceeds any prior facility plan. Genting’s vision for a quality facility and patron experience expands beyond the gaming floor; they have designed a plan in which the patrons will begin to feel the experience of the Aqueduct facility before they even reach the gaming floors. The “Aqueduct experience” will begin upon procession from the garage or the subway and will continue through the entrances and throughout the facility. Some of the innovative ideas include a welcoming experience at all entrances, not just the main entrance, thereby creating a good first impression no matter which entrance is used; outdoor screens and archways for cars; and ease of entry no matter what mode of transportation is used, with, for example, an entrance from each level of the parking garage, bus parking, and shuttles. Genting’s Proposal demonstrates a commitment to green space, integration of gaming and horseracing, and utilization of the current structure, thereby saving time and money while maintaining the history of the Aqueduct facility. Genting’s proposal for the Festival Commons is an innovative, environmentally sensitive part of the facility design which will allow direct access from the first floor of the casino to the outdoors, thereby integrating the casino experience with horseracing. Genting’s VIP lounge has been
15
designed to overlook the winner’s circle, which provides further integration between the casino and horseracing. Genting’s capital expenditure demonstrates a solid, long term commitment to maintaining the facility to a high standard. The projected capital expenditure of over $41 million for years 1 through 10 demonstrates planned improvements throughout the years without big refurbishments or rebuilds. Genting will also reinvest a minimum of 0.5% of gross gaming revenue for maintenance capital expense, which will be used for general maintenance, such as carpet replacement and normal wear and tear of areas throughout the facility. Financing Plan/Access to Capital (12/12 pts.)
Evaluation Scoring Guidance:
Financing Plan/Access to Capital How will the project be financed? What are the sources of capital (cash, equity, private equity, debt (senior, mezzanine, etc.), other)? How confident are we of the ability of this bidder to raise the necessary funds? How strong and stable are the bidder’s financial relationships (with banks, investors) and how large and accessible are bidder’s other assets and cash-flow streams?
Scoring Narrative:
KPMG’s assessment of Genting’s financial position shows an extremely strong company, with excellent cash flow, good operating results, a healthy balance sheet and significant growth opportunties. Genting is in strong financial condition with a high level of cash, little debt, and a proposed 100% equity financing of this project, with no borrowing. Analyst reports are positive on the company, although some suggested Genting had overpaid for some investments and acquisitions. Genting New York has a firm commitment from the parent company, Genting Malaysia Berhad, to provide funds for the Licensing Fee due to the State. We particularly noted that Genting has cash available of $1.6 billion at the parent company level and $5 billion at the holding company level. The full KPMG report is included as Attachment 2. MWBE/Equal Employment Opportunity/Affirmative Action (4/5 pts.)
Evaluation Scoring Guidance:
MWBE Plan/Experience What is our confidence level that the bidder will meet the aggressive MWBE goals stated in the RFP? What experience does the bidder have in achieving diversity objectives in past projects? Does the bidder have sufficient relationships to insure successful compliance?

16
Scoring Narrative:
Genting has a solid MWBE plan. Genting has made a commitment to meet and
exceed the goals established by the RFP and the Proposal demonstrates that commitment. The Proposal identifies the proposed MWBE subcontractors and includes an unusually high level of documentation of certified MWBE status. The selected subcontractors include Gedeon GRC Consulting, an engineering firm with experience on many projects for New York City, regional, and State agencies; Horton Lees Brogden Lighting Design, a highly experienced lighting designer with successful experience on casinos, airports, performing arts centers, universities, parks, and sports facilities; and Jem Associates, a food services consulting firms, with experience at casinos in Yonkers, Buffalo, Finger Lakes, Niagara Falls, Connecticut, Atlantic City, and many other locations. Genting also plans to hold job fairs and events and to advertise in hometown newspapers and magazines to recruit minority and female employees.
Because Aqueduct will be its first large scale project in the United States, Genting itself does not have prior experience with New York State’s MWBE program, leading us to award 4 out of 5 points for this category. However, the Proposal shows a clear understanding of the State’s MWBE participation requirements and includes detailed documentation demonstrating the impressive level of experience compiled by Genting’s development partners, Tutor Perini and JCJ Architects, with MWBE programs on very large projects that have met participation goals as high as 23% The Proposal demonstrates familiarity and expertise with the various planning and reporting needed to assure compliance with program requirements and success in achieving participation goals.
Genting’s Proposal also demonstrates a focus on the community. Genting is
committed to the preservation of the historic character of the Aqueduct racetrack and Genting has committed to providing 1% of its annual profits to create and fund a Queens Community Outreach Foundation.
References References were sought from sources with experience working with Genting (Asia and the New York management team) and the principle subcontractors - JCJ Architecture and Tutor Perini Corporation as follows.
o Genting – US management team: Mickey Brown and Mike Speller – references indicate that they have a record of successful and timely projects, have demonstrated good development and execution of a plan, and maintain a professional relationship throughout projects.
Genting – Asia – reference indicates a good customer knowledge base; careful and diligent market study; proven ability to meet or exceed project
17
expectations.
o JCJ: references indicate that this firm has high quality designs, is well organized, timely, and flexible to design changes during development. One reference addressed an issue which lent itself more to cultural/attitude differences than business relations and in the end when the issue was worked through they were satisfied with the end product, which was of high quality and timely.
o Tutor Perini: Tutor Perini’s work on the Jamaica AirTrain Station
construction project earned them the Project of the Year Award. Tutor Perini continues to obtain projects with the Port Authority, where they have a long term relationship due to their outstanding work performance. The reference contacted at the Port Authority was involved mainly in the MWBE program and reported that Tutor Perini did a good job managing the program and exceeded most of the participation goals. The reference contacted at the Saratoga Racecourse indicated that since the renovations were a fairly small project, Tutor Perini did not assign their “A Team” for the renovation of the grandstands and Player’s Club area; however, despite this, Tutor Perini had very good project management processes in place, did a good job managing the budget and timeline, and handled change orders well. The minor delays that did occur were due to circumstances outside of Tutor Perini’s control.
History
Our evaluation is the latest in a series of efforts to select an Aqueduct video
lottery agent. Video lottery gaming was authorized by the 2001 amendment of Tax Law section 1612 and the addition of Tax Law section 1617-a (collectively, the “Video Lottery Law”), which provided for the Lottery to operate a video lottery program at Aqueduct and other racetracks, with the operators of the racetracks eligible to serve as video lottery agents licensed by the Lottery.
In 2002, the New York Racing Association (“NYRA”), which then held the licensed franchise to conduct thoroughbred horse racing and pari-mutuel wagering at Aqueduct, Belmont, and Saratoga, engaged MGM Mirage (“MGM”) to assist NYRA in developing a plan to act as the Aqueduct video lottery agent. The MGM plan failed to advance when NYRA declared bankruptcy in 2006.
In 2006, the State Ad Hoc Committee on the Future of Racing recommended
that a new franchise be awarded to Excelsior Racing Associates (“Excelsior”) to conduct horse racing and pari-mutuel wagering at Aqueduct, Belmont, and Saratoga and to be eligible to become the Aqueduct video lottery agent, but the Excelsior recommendation was set aside in 2007 when Special Counsel Richard Rifkin was appointed chairman of a committee to conduct a new review process.
18
The Rifkin Committee’s work helped to produce a settlement of the NYRA bankruptcy that was implemented by 2008 legislation that awarded a new racing and pari-mutuel wagering franchise to NYRA but excluded NYRA from eligibility for selection as the Aqueduct video lottery agent and amended the Video Lottery Law to require the Aqueduct video lottery selection to be made pursuant to a Memorandum of Understanding (the “MOU”) among the Governor, the Temporary President of the Senate, and the Speaker of the Assembly. After a review of competing proposals submitted in early 2008, the Governor recommended selection of Delaware North Companies (“Delaware North”) as the Aqueduct video lottery agent, but Delaware North was unable to complete negotiations to finalize the MOU when the economic downturn made it impossible for Delaware North to gather the necessary financing to pay a promised $370 million licensing fee.
In 2009, the Governor solicited new proposals and early in 2010 recommended
selection of the Aqueduct Entertainment Group (“AEG”). During review of the AEG recommendation, the Speaker of the Assembly
requested that the State Inspector General (the “IG”) review “the process and procedures used by the NYS Division of the Lottery and other relevant state agencies involved in the evaluation of bids and in the making of recommendations for the selection” and “[i]nquire how the Division of the Lottery will assure” that the selected Aqueduct video lottery agent would meet four conditions recommended by the Speaker and approved by the Governor and the Temporary President of the Senate. An investigation was commenced, but the IG has not yet reported the results of that investigation. At the same time, a federal Grand Jury in Manhattan subpoenaed all records related to the selection of the Aqueduct video lottery operator, but the outcome of the Grand Jury investigation has not yet been announced.
The AEG recommendation was withdrawn when the Lottery reported that AEG
could not satisfy the State’s four conditions. The Lottery’s May 11, 2010, RFP incorporated those four conditions:
• An upfront licensing fee of at least $300 million must be paid by the selected vendor promptly after approval of the selection.
• The construction plan must be consistent with the plan originally developed
by NYRA and MGM, which was confined to minimal development outside the footprint of existing structures on the Aqueduct premises and resulted in a Negative Declaration of Significant Environmental Impact under the State Environmental Quality Review Act (“SEQRA”) that will allow development of the video lottery facility to proceed without extended environmental review.
• The selected video lottery agent and all investors (except for those with
minimal shares), associated entities and principal and key individuals must qualify for a video lottery license. All subcontractors are subject to Lottery
19
approval. Any conviction of a felony or any other criminal offense involving gaming violations, fraud, larceny of any sort, theft, misappropriation or conversion of funds, or tax evasion must be disclosed and may be cause for denial of a license.
• No changes in the Proposal, the MOU, or other required agreements will be
permitted without the approval of the Governor, the Temporary President of the Senate, and the Speaker of the Assembly.
Next Steps
To approve a contract award to Genting, the signatures of the Governor, the Temporary President of the Senate, and the Speaker of the Assembly must be added to the MOU already signed by Genting. Following those signatures, the form of the MOU must be approved by the Attorney General, and the MOU must be approved by the Comptroller and filed in his office. Thereafter, the signed and approved MOU will be delivered to Genting, and Genting will pay the upfront licensing fee to the State within ten business days. Construction of the Aqueduct video lottery casino will commence as soon as practicable after approval of the MOU and payment of the licensing fee, with the opening of the preliminary phase to be expected within six months after MOU approval.
Award – Best Value In accordance with Section 163(h) of the State Finance Law: “Best Value means
the basis for awarding contracts for services to the offerer which optimizes quality, cost and efficiency, among responsive and responsible offerers. Such basis shall reflect, wherever possible, objective and quantifiable analysis.”
As provided in the May 11, 2010, RFP, “In determination of award, the qualifications of the bidder, the conformity with the specifications of services to be supplied and the performance or completion terms will be considered. The Lottery’s recommendation to the Governor, the Temporary President of the Senate, and the Speaker of the Assembly will be based on “Best Value,” the evaluation method for awarding a license to the Vendor whose Proposal optimizes quality, cost, and efficiency among responsible offers. The determination will be based on a scoring of Technical and Financial Proposals as described in Part 5.”
20
Vendor Responsibility and Suitability for Video Lottery License
As required by State Finance Law section 163, the Lottery has determined that Genting is a responsible vendor that possesses the technical and financial resources needed to fulfill the requirements established by the law, the MOU, and the other agreements required by the RFP, as well the reputation for honesty and integrity necessary for a fiduciary agent of the State. The determination of responsibility also relied on the comprehensive background review the Lottery conducted to determine that Genting has demonstrated by clear and convincing evidence that it is a suitable candidate for the award of a video lottery agent license. The review considered the video lottery license applications submitted on behalf of Genting and its affiliated companies, and by the principal and key individuals who will be responsible for the Aqueduct video lottery casino. The review of the license applications included additional reviews of information acquired from other sources, including criminal history reports from the Division of Criminal Justice Services and the Federal Bureau of Investigation, background investigation reports compiled by Pinkerton Investigative Services, financial analyses by the Lottery’s own staff and KPMG, and gaming license status reports from regulatory authorities in Malaysia, Singapore, Western Australia, the Philippines, and the United Kingdom. None of those additional sources produced any negative information about Genting’s suitability. The Lottery consulted with the New York State Racing and Wagering Board (“RWB”) about RWB’s review of a complaint by the former CEO of Empire Resorts concerning the expiration of his employment contract and other matters following the acquisition of a controlling interest in Empire Resorts by Kian Huat Realty Trust III Limited, which is affiliated with Genting’s chairman, KT Lim. The complaint alleged that Empire Resorts allowed Mickey Brown and Colin Au, as representatives of Kian Huat Realty Trust III and KT Lim, to prematurely exercise control over Empire Resorts’ affairs before RWB had completed the approval of their licenses for racing and pari-mutuel wagering at Monticello Casino and Raceway. Based on that consultation, the Lottery concluded that the allegations relate to technical issues that are not of a significant nature. Therefore, RWB’s review does not reflect negatively on Genting’s suitability for a video lottery agent license.


New York Lottery –
Video Lottery Facility
at Aqueduct Racetrack
Financial Viability Analysis (“FVA”)August 2, 2010
1
Contents
Vendor FVA – Genting New York LLC 2
Financial viability analysis
−
GENM
• Overview 3
• Liquidity 5
• Credit profile 6
• Profitability 7
• Historical uses of cash and other items 8
−
GENT
• Overview 11
• Liquidity 13
• Credit profile 14
• Profitability 16
• Historical uses of cash and other items 17
Page
Appendices
−
Appendix 1: GENM –
Recent events 18
−
Appendix 2: GENM financial statements 19
−
Appendix 3: GENT financial statements 22
−
Appendix 4: GENM and GENT –
Illustrative financial capacity and Aqueduct financial requirement
25
−
Appendix 5: Benchmark composition 26
−
Appendix 6: Related party transactions 28
Page

2
Vendor FVA –
Genting
New York LLC
Genting
Malaysia Berhad
“GENM”Leisure & Hospitality, Gaming &
EntertainmentBursa, Malaysia: US$6.0 billion
Genting
Berhad
“GENT”Investment & Management Holding
CompanyBursa, Malaysia: US$8.1 billion
Extract of Genting
Group structure
Financial information
provided
Parent company
Ultimate parent
company
Genting
New York LLC
“GNY”Delaware
Genting
East Coast USA Inc.
Delaware
Genting
East Coast USA Limited
Isle of Man
Genting
(USA) Limited
Isle of Man
Genting
Worldwide Limited
Isle of Man
No financial
information has been
received
Proposed
Vendor
Intermediate
holding
companies
This FVA evaluates the Vendor’s ability to meet the financial obligations under the Memorandum of Understanding (MOU), focusing primarily on the licensing fee and secondly on the Vendor’s planned pre-opening capital and marketing commitments.
Genting New York, LLC was the only prospective Vendor to submit a bid that was not considered to be non-conforming to the terms of the MOU and the RFP.
Financial statements were submitted for GENM, a Malaysian company and its parent GENT, also a Malaysian company. No financial statements were submitted for GNY, the legal entity making the submission and signing the MOU. As a result, the evaluation of financial viability focuses on GENM and GENT, parent companies of the Vendor.
Genting stated that the GNY financial statements were not provided, “as it would have contained information relating to [the GNY] confidential bid amount that was submitted in a separate envelope…” This suggests that the financial position of GNY has been capitalized by the Genting Group to meet the financial needs under the MOU, however, this is only speculation and GNY cannot be evaluated.
Genting provided a copy of the Funding Agreement Letter between GENM to GENY via a “certified extract from the board resolution,”dated June 29, the date the MOU was due and submitted. GENM “agrees to make available to [GENY] the funds necessary to pay the License Fee (as defined in the RFP) in a timely manner.” Other than execution of the MOU by the State of New York, the authorizationdid not appear to contain stipulations, terms or limitations.
This FVA does not consider the governance and control over GENT,the ultimate parent company, and other similar considerations.
100%
100%
48.6%
3
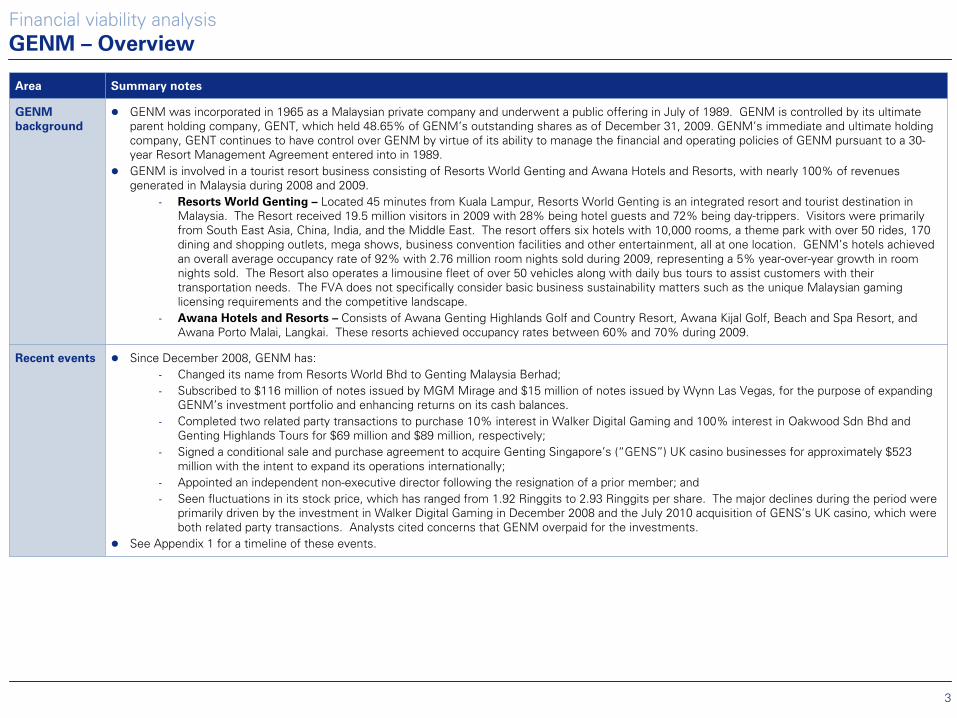
Area Summary notes
GENM
background
GENM was incorporated in 1965 as a Malaysian private company and underwent a public offering in July of 1989. GENM is controlled by its ultimate parent holding company, GENT, which held 48.65% of GENM’s outstanding shares as of December 31, 2009. GENM’s immediate and ultimate holding company, GENT continues to have control over GENM by virtue of its ability to manage the financial and operating policies of GENM pursuant to a 30-year Resort Management Agreement entered into in 1989.GENM is involved in a tourist resort business consisting of Resorts World Genting and Awana Hotels and Resorts, with nearly 100% of revenues generated in Malaysia during 2008 and 2009.
- Resorts World Genting
–
Located 45 minutes from Kuala Lampur, Resorts World Genting
is an integrated resort and tourist destination in Malaysia. The Resort received 19.5 million visitors in 2009 with 28% being hotel guests and 72% being day-trippers. Visitors were primarily from South East Asia, China, India, and the Middle East. The resort offers six hotels with 10,000 rooms, a theme park with over
50 rides, 170 dining and shopping outlets, mega shows, business convention facilities and other entertainment, all at one location. GENM’s
hotels achieved an overall average occupancy rate of 92% with 2.76 million room nights sold during 2009, representing a 5% year-over-year growth in room nights sold. The Resort also operates a limousine fleet of over
50 vehicles along with daily bus tours to assist customers with
their transportation needs. The FVA does not specifically consider basic business sustainability matters such as the unique Malaysian
gaming licensing requirements and the competitive landscape.
- Awana
Hotels and Resorts –
Consists of Awana
Genting
Highlands Golf and Country Resort, Awana
Kijal
Golf, Beach and Spa Resort, and Awana
Porto Malai, Langkai. These resorts achieved occupancy rates between 60% and 70% during 2009.
Recent events Since December 2008, GENM has:- Changed its name from Resorts World Bhd
to Genting
Malaysia Berhad;- Subscribed to $116 million of notes issued by MGM Mirage and $15
million of notes issued by Wynn Las Vegas, for the purpose of expanding GENM’s
investment portfolio and enhancing returns on its cash balances.- Completed two related party transactions to purchase 10% interest in Walker Digital Gaming and 100% interest in Oakwood Sdn
Bhd
and Genting
Highlands Tours for $69 million and $89 million, respectively;- Signed a conditional sale and purchase agreement to acquire Genting
Singapore’s (“GENS”) UK casino businesses for approximately $523 million with the intent to expand its operations internationally;
- Appointed an independent non-executive director following the resignation of a prior member; and- Seen fluctuations in its stock price, which has ranged from 1.92
Ringgits to 2.93 Ringgits per share. The major declines during
the period were primarily driven by the investment in Walker Digital Gaming in December 2008 and the July 2010 acquisition of GENS’s
UK casino, which were both related party transactions. Analysts cited concerns that GENM overpaid for the investments.
See Appendix 1 for a timeline of these events.
Financial viability analysis
GENM –
Overview
4
Area Summary notes
Recent analyst
comments
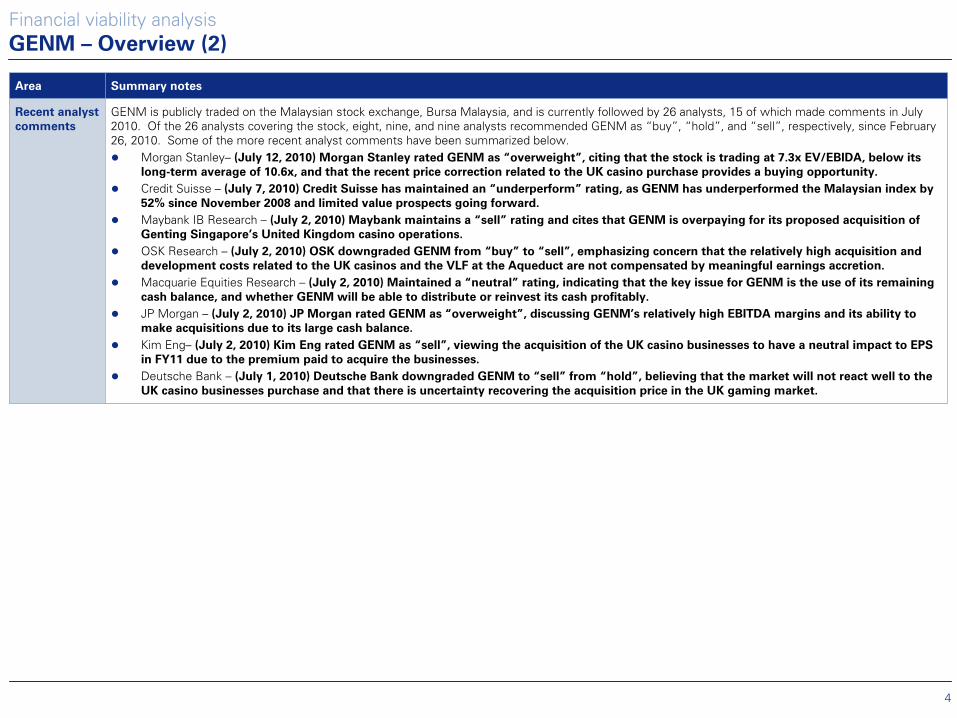
GENM is publicly traded on the Malaysian stock exchange, Bursa Malaysia, and is currently followed by 26 analysts, 15 of which made comments in July 2010. Of the 26 analysts covering the stock, eight, nine, and nine analysts recommended GENM as “buy”, “hold”, and “sell”, respectively, since February 26, 2010. Some of the more recent analyst comments have been summarized below.
Morgan Stanley– (July 12, 2010) Morgan Stanley rated GENM as “overweight”, citing that the stock is trading at 7.3x EV/EBIDA, below its
long-term average of 10.6x, and that the recent price correction related to the UK casino purchase provides a buying opportunity.
Credit Suisse – (July 7, 2010) Credit Suisse has maintained an “underperform” rating, as GENM has underperformed the Malaysian index by
52% since November 2008 and limited value prospects going forward.
Maybank IB Research – (July 2, 2010) Maybank maintains a “sell” rating and cites that GENM is overpaying for its proposed acquisition of
Genting Singapore’s United Kingdom casino operations.
OSK Research – (July 2, 2010) OSK downgraded GENM from “buy” to “sell”, emphasizing concern that the relatively high acquisition and
development costs related to the UK casinos and the VLF at the Aqueduct are not compensated by meaningful earnings accretion.
Macquarie Equities Research – (July 2, 2010) Maintained a “neutral” rating, indicating that the key issue for GENM is the use of its remaining
cash balance, and whether GENM will be able to distribute or reinvest its cash profitably.
JP Morgan – (July 2, 2010) JP Morgan rated GENM as “overweight”, discussing GENM’s relatively high EBITDA margins and its ability to
make acquisitions due to its large cash balance.
Kim Eng– (July 2, 2010) Kim Eng rated GENM as “sell”, viewing the acquisition of the UK casino businesses to have a neutral impact to EPS
in FY11 due to the premium paid to acquire the businesses.
Deutsche Bank – (July 1, 2010) Deutsche Bank downgraded GENM to “sell” from “hold”, believing that the market will not react well to the
UK casino businesses purchase and that there is uncertainty recovering the acquisition price in the UK gaming market.
Financial viability analysis
GENM –
Overview (2)

5
Liquidity metrics
Quarterly Benchmarks1
USD$m Q1-07 Q2-07 Q3-07 Q4-07 Q1-08 Q2-08 Q3-08 Q4-08 Q1-09 Q2-09 Q3-09 Q4-09 Q1-10 US Asia
Cash and cash equivalents 724 763 938 956 1,015 1,326 1,434 1,427 1,522 1,608 1,661 1,652 1,652 n.a. n.a.
Working capital balance 574 607 747 777 883 1,114 1,231 1,267 1,391 1,387 1,464 1,474 1,567 517 101
Current ratio 3.5 3.3 3.4 3.9 5.1 4.8 5.2 6.2 7.4 5.5 6.0 6.6 7.2 2.0 3.2
Cash as % of current assets 90.1% 87.1% 89.1% 91.7% 92.5% 94.0% 94.3% 94.5% 94.6% 94.8% 94.7% 95.2% 90.7% 47.3% 43.6%
Cash less total liabilities 166 262 543 598 707 934 1,047 1,083 1,204 1,193 1,263 1,275 1,286 (2,689) (534)
Financial viability analysis
GENM –
Liquidity
Notes:
n.a. = not availableAll figures represented in USD, which were converted consistently at a rate of 3.191 Malaysian Ringgits per USD (exchange rate as of July 8, 2010)1
Benchmark metrics calculated using the most recent annual audited financials for 16 US and Asian public gaming companies. See Appendix 5 for details.
Cash balance: As of March 31, 2010, GENM had cash and cash equivalents of $1.65 billion. However, on July 1, 2010, GENM announced the $523 million acquisition of Genting Singapore’s 100% equity interests in Nedby Limited, Palomino Star Limited, Palomino World Limited and Genting International Enterprises, which is expected to be completed in the second half of 2010. As the terms of the purchase are not provided, it is unclear how GENM plans to finance this transaction. Cash flows: GENM reported cash flows from operating activities of $537 million and $510 million during 2008 and 2009, respectively. The net increase in their cash and cash equivalents balance declined from $441 million during 2008 to $226 million during 2009, primarily due to less proceeds from the disposal of investments, cash used for the purchase of Oakwood and Genting Highlands, and the purchase of $65 million of MGM and Wynn notes. Working capital: Working capital has ranged from positive $574 million to $1.6 billion between Q1-07 to Q1-10. As of March 31, 2010, GENM had positive working capital of approximately $1.6 billion and a current ratio of 7.2x, higher than the US and Asia industry averages.Disclosures in the PwC audited financial statements: The audited financial statements do not disclose GENM’s access to a credit facility, any significant anticipated working capital needs, and noted that GENM does not trade in financial instruments and seeks to minimize the impacts of foreign currency exchange risk, interest rate risk, market risk, credit risk, and liquidity risk. In addition, the audited financial statements note that GENM’s cash flow is reviewed regularly to ensure that it is able to settle its commitments when they fall due.

6
Financial viability analysis
GENM –
Credit profile
Low existing indebtedness: Since 2007, GENM has not had any significant outstanding long-term debt. As of March 31, 2010, GENM did not report any liabilities associated with debt obligations. However, according to the Maybank IB Research, GENM will assume $130 million of debt as a result of the acquisition of the UK casinos from Genting Singapore.Other long-term liabilities: GENM’s other long term liabilities of $33 million as of March 31, 2010, relate to advance membership fees relating to fees received on sale of timeshare units by a subsidiary offering a timeshare ownership scheme. These fees are recognized as income over the next 24 years following commencement of membership. No S&P credit rating available – S&P does not currently cover GENM; however, S&P does provide coverage for GENM’s parent holding company, GENT. A summary of the GENT coverage is included on page 15 of the FVA.
7
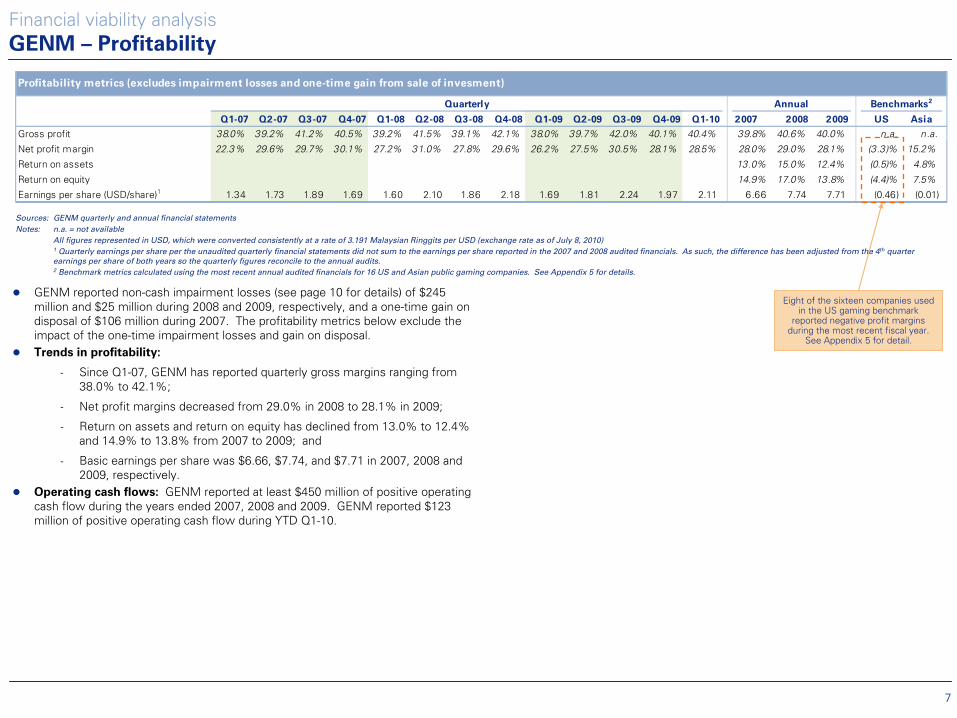
Profitability metrics (excludes impairment losses and one-time gain from sale of invesment)
Quarterly Annual Benchmarks2
Q1-07 Q2-07 Q3-07 Q4-07 Q1-08 Q2-08 Q3-08 Q4-08 Q1-09 Q2-09 Q3-09 Q4-09 Q1-10 2007 2008 2009 US Asia
Gross profit 38.0% 39.2% 41.2% 40.5% 39.2% 41.5% 39.1% 42.1% 38.0% 39.7% 42.0% 40.1% 40.4% 39.8% 40.6% 40.0% n.a. n.a.
Net profit margin 22.3% 29.6% 29.7% 30.1% 27.2% 31.0% 27.8% 29.6% 26.2% 27.5% 30.5% 28.1% 28.5% 28.0% 29.0% 28.1% (3.3)% 15.2%
Return on assets 13.0% 15.0% 12.4% (0.5)% 4.8%
Return on equity 14.9% 17.0% 13.8% (4.4)% 7.5%
Earnings per share (USD/share)1 1.34 1.73 1.89 1.69 1.60 2.10 1.86 2.18 1.69 1.81 2.24 1.97 2.11 6.66 7.74 7.71 (0.46) (0.01)
Financial viability analysis
GENM –
Profitability
Sources:
GENM quarterly and annual financial statementsNotes:
n.a. = not availableAll figures represented in USD, which were converted consistently at a rate of 3.191 Malaysian Ringgits per USD (exchange rate as of July 8, 2010)1
Quarterly earnings per share per the unaudited quarterly financial statements did not sum to the earnings per share reported in
the 2007 and 2008 audited financials. As such, the difference has been adjusted from the 4th
quarter earnings per share of both years so the quarterly figures reconcile to the annual audits. 2
Benchmark metrics calculated using the most recent annual audited financials for 16 US and Asian public gaming companies. See Appendix 5 for details.
GENM reported non-cash impairment losses (see page 10 for details) of $245 million and $25 million during 2008 and 2009, respectively, and a one-time gain on disposal of $106 million during 2007. The profitability metrics below exclude the impact of the one-time impairment losses and gain on disposal. Trends in profitability:
- Since Q1-07, GENM has reported quarterly gross margins ranging from 38.0% to 42.1%;
- Net profit margins decreased from 29.0% in 2008 to 28.1% in 2009;
- Return on assets and return on equity has declined from 13.0% to
12.4% and 14.9% to 13.8% from 2007 to 2009; and
- Basic earnings per share was $6.66, $7.74, and $7.71 in 2007, 2008 and 2009, respectively.
Operating cash flows: GENM reported at least $450 million of positive operating cash flow during the years ended 2007, 2008 and 2009. GENM reported $123 million of positive operating cash flow during YTD Q1-10.
Eight of the sixteen companies used in the US gaming benchmark
reported negative profit margins during the most recent fiscal year.
See Appendix 5 for detail.

8
Area Summary notes
Historical uses
of cash
During the course of 2007 to July 2010, GENM engaged in multiple
transactions with the intent to invest excess cash and increase
shareholder returns.
Acquisitions –
July 1, 2010
–
GENM entered into a conditional sale and purchase agreement with GENS, a subsidiary of GENT, to acquire its 100% equity interests in their UK casino businesses for approximately $523 million. The conditions of the agreement include the approval of shareholders
and banks, completion of due diligence, and regulatory approval. According to Maybank
IB Research, GENM will also acquire $130 million of outstanding
debt. The maturity profile of this outstanding debt has not been disclosed in GENM press release. In addition, the terms of the agreement were not
disclosed, including how GENM will finance the transaction. Assuming the transaction
is paid with 100% equity, this would reduce GENM’s
March 31, 2010 cash balance from $1.6 billion to approximately $1.1 billion. According to the press release, GENM’s
rationale for this investment was to expand internationally beyond Malaysia and leverage GENM’s
large Asian clientele, its international sales and marketing strategies, strong membership marketing and database management capabilities.
December 8, 2009
–
GENM entered into sale and purchase agreements with GENT to acquire the share capital of Oakwood Sdn
Bhd
and Genting
Highlands Tours and Promotion Sdn
Bhd
for a total cash consideration of $89 million. According to the audited financial statements, the payment was made on December 11, 2009, and there is no disclosure relating to any future required payments that would result in additional cash outflows. According to the press release, GENT’s
intent on the sale was to streamline the Malaysian property investment and management activities under GENM.
December 17, 2008
–
GENM completed its investment of $69 million in Walker Digital Gaming, a related party entity formerly owned by GENT. According to the press release, GENM’s
rationale for this purchase was to place WDG’s
electronic gaming tables in their casinos starting Q1-09.
Share repurchase plan – During 2007, GENM’s shareholders approved a plan to repurchase up to 10% of GENM’s outstanding shares. As of March 31, 2010, GENM purchased 207 million of its own shares, which represents approximately 4% of current outstanding shares, for a total consideration of $222 million. During 2009, GENM purchased 29 million ordinary shares for $25 million, which was financed with internally generated funds. GENM did not repurchase any of its own shares during the three months ended March 31, 2010.
Issuance of dividends – GENM issued dividends of $77 million, $88 million, and $94 million during 2007, 2008, and 2009, respectively. No dividend has been proposed or declared during YTD Mar-2010.
Purchase of Wynn Las Vegas notes – On October 21, 2009 GENM purchased $15 million of First Mortgage Notes due in 2017 issued by Wynn Las Vegas, LLC and Wynn Las Vegas Capital Corp secured by a first-priority lien on substantially all of the existing and future assets of the issuers, through a $500 million private placement. The notes are senior secured obligations of Wynn, guaranteed by certain Wynn Las Vegas, LLC subsidiaries, and have an equal right of payment with, or senior to, all existing or future indebtedness of Wynn and each of its guarantors. These securities are classified as non-current available for sale securities on GENM’s balance sheet. According to the press release, this was an opportunity for GENM to expand its investment portfolio and increase returns on cash balances.
Financial viability analysis
GENM –
Historical uses of cash and other items
Share repurchase plan
2007 2008 2009
YTD
Mar-10 Total
Total shares repurchased (millions) 121.1 57.0 29.1 - 207.2
Total paid ($m) 149.5 47.1 25.0 - 221.7
Sources:
Annual audited financial statements and March 31, 2010 unaudited
financial statements
9
Area Summary notes
Historical uses
of cash
(continued)
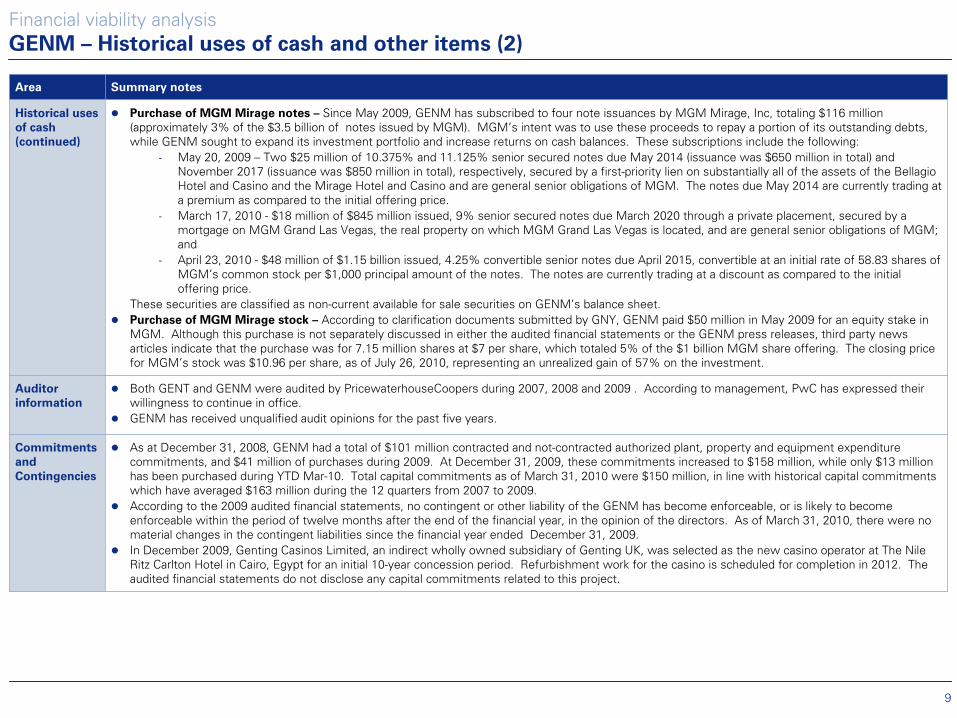
Purchase of MGM Mirage notes – Since May 2009, GENM has subscribed to four note issuances by MGM Mirage, Inc, totaling $116 million (approximately 3% of the $3.5 billion of notes issued by MGM). MGM’s intent was to use these proceeds to repay a portion of its outstanding debts, while GENM sought to expand its investment portfolio and increase returns on cash balances. These subscriptions include the following:
- May 20, 2009 –
Two $25 million of 10.375% and 11.125% senior secured notes due
May 2014 (issuance was $650 million in total) and November 2017 (issuance was $850 million in total), respectively, secured by a first-priority lien on substantially all of the assets of the Bellagio
Hotel and Casino and the Mirage Hotel and Casino and are general
senior obligations of MGM. The notes due May 2014 are currently trading at a premium as compared to the initial offering price.
- March 17, 2010 -
$18 million of $845 million issued, 9% senior secured notes due
March 2020 through a private placement, secured by a mortgage on MGM Grand Las Vegas, the real property on which MGM Grand Las Vegas is located, and are general senior obligations of MGM; and
- April 23, 2010 -
$48 million of $1.15 billion issued, 4.25% convertible senior notes due April 2015, convertible at an initial rate of 58.83 shares of MGM’s common stock per $1,000 principal amount of the notes. The notes are currently trading at a discount as compared to the initial offering price.
These securities are classified as non-current available for sale securities on GENM’s
balance sheet.Purchase of MGM Mirage stock – According to clarification documents submitted by GNY, GENM paid $50 million in May 2009 for an equity stake in MGM. Although this purchase is not separately discussed in either the audited financial statements or the GENM press releases, third party news articles indicate that the purchase was for 7.15 million shares at $7 per share, which totaled 5% of the $1 billion MGM share offering. The closing price for MGM’s stock was $10.96 per share, as of July 26, 2010, representing an unrealized gain of 57% on the investment.
Auditor
information
Both GENT and GENM were audited by PricewaterhouseCoopers during 2007, 2008 and 2009 . According to management, PwC has expressed their willingness to continue in office.GENM has received unqualified audit opinions for the past five years.
Commitments
and
Contingencies
As at December 31, 2008, GENM had a total of $101 million contracted and not-contracted authorized plant, property and equipment expenditure commitments, and $41 million of purchases during 2009. At December 31, 2009, these commitments increased to $158 million, while only $13 million has been purchased during YTD Mar-10. Total capital commitments as of March 31, 2010 were $150 million, in line with historical capital commitments which have averaged $163 million during the 12 quarters from 2007 to 2009. According to the 2009 audited financial statements, no contingent or other liability of the GENM has become enforceable, or is likely to become enforceable within the period of twelve months after the end of the financial year, in the opinion of the directors. As of March 31, 2010, there were no material changes in the contingent liabilities since the financial year ended December 31, 2009. In December 2009, Genting Casinos Limited, an indirect wholly owned subsidiary of Genting UK, was selected as the new casino operator at The Nile Ritz Carlton Hotel in Cairo, Egypt for an initial 10-year concession period. Refurbishment work for the casino is scheduled for completion in 2012. The audited financial statements do not disclose any capital commitments related to this project.
Financial viability analysis
GENM –
Historical uses of cash and other items (2)
10
Area Summary notes
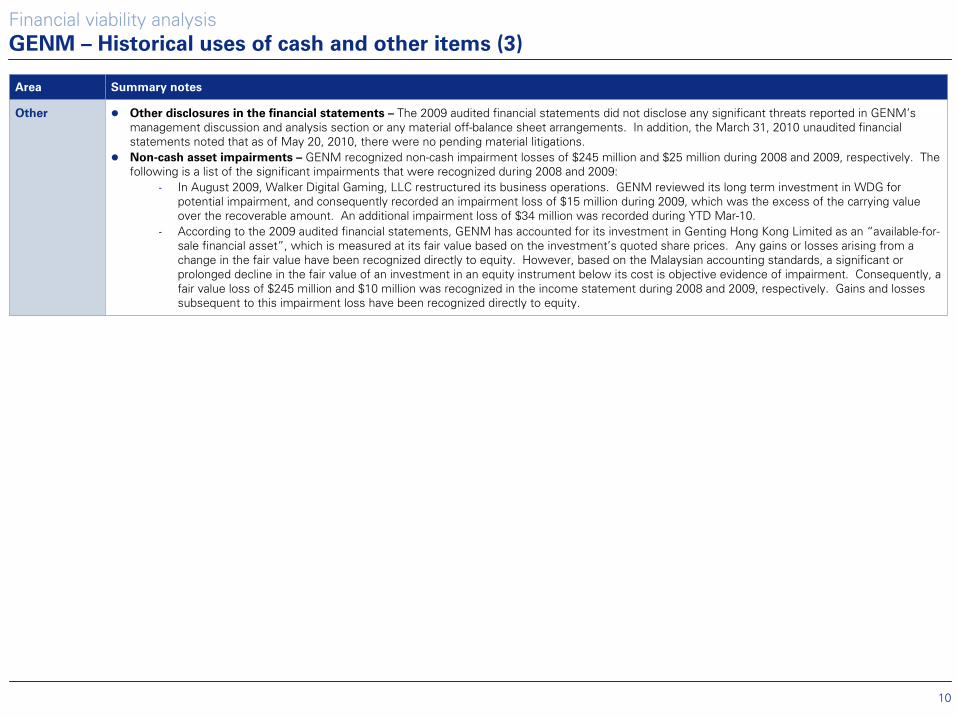
Other Other disclosures in the financial statements – The 2009 audited financial statements did not disclose any significant threats reported in GENM’smanagement discussion and analysis section or any material off-balance sheet arrangements. In addition, the March 31, 2010 unaudited financial statements noted that as of May 20, 2010, there were no pending material litigations. Non-cash asset impairments – GENM recognized non-cash impairment losses of $245 million and $25 million during 2008 and 2009, respectively. The following is a list of the significant impairments that were recognized during 2008 and 2009:
- In August 2009, Walker Digital Gaming, LLC restructured its business operations. GENM reviewed its long term investment in WDG for potential impairment, and consequently recorded an impairment loss of $15 million during 2009, which was the excess of the carrying value over the recoverable amount. An additional impairment loss of $34 million was recorded during YTD Mar-10.
- According to the 2009 audited financial statements, GENM has accounted for its investment in Genting
Hong Kong Limited as an “available-for-
sale financial asset”, which is measured at its fair value based on the investment’s quoted share prices. Any gains or losses arising from a change in the fair value have been recognized directly to equity. However, based on the Malaysian accounting standards, a significant or prolonged decline in the fair value of an investment in an equity instrument below its cost is objective evidence of impairment.
Consequently, a fair value loss of $245 million and $10 million was recognized in the income statement during 2008 and 2009, respectively. Gains and losses subsequent to this impairment loss have been recognized directly
to equity.
Financial viability analysis
GENM –
Historical uses of cash and other items (3)
11
Area Summary notes
GENT
background
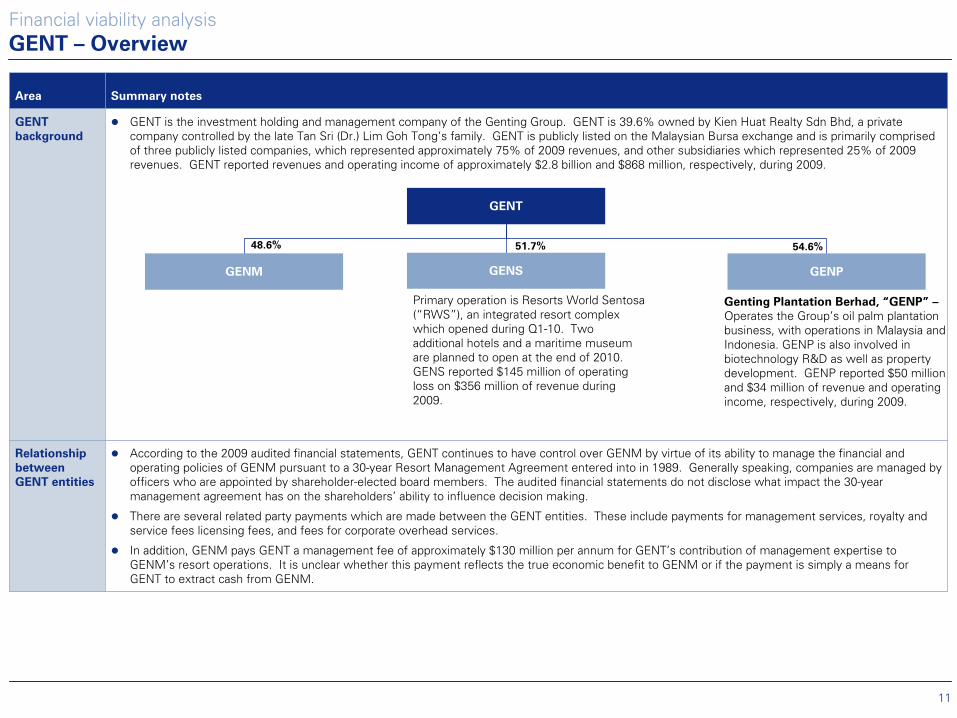
GENT is the investment holding and management company of the Genting Group. GENT is 39.6% owned by Kien Huat Realty Sdn Bhd, a private company controlled by the late Tan Sri (Dr.) Lim Goh Tong’s family. GENT is publicly listed on the Malaysian Bursa exchange and is primarily comprised of three publicly listed companies, which represented approximately 75% of 2009 revenues, and other subsidiaries which represented 25% of 2009 revenues. GENT reported revenues and operating income of approximately $2.8 billion and $868 million, respectively, during 2009.
Relationship
between
GENT entities
According to the 2009 audited financial statements, GENT continues to have control over GENM by virtue of its ability to manage the financial and operating policies of GENM pursuant to a 30-year Resort Management Agreement entered into in 1989. Generally speaking, companies are managed by officers who are appointed by shareholder-elected board members. The audited financial statements do not disclose what impact the 30-year management agreement has on the shareholders’ ability to influence decision making.
There are several related party payments which are made between the GENT entities. These include payments for management services, royalty and service fees licensing fees, and fees for corporate overhead services.
In addition, GENM pays GENT a management fee of approximately $130 million per annum for GENT’s contribution of management expertise to GENM’s resort operations. It is unclear whether this payment reflects the true economic benefit to GENM or if the payment is simply a means for GENT to extract cash from GENM.
Financial viability analysis
GENT –
Overview
GENT
GENSGENM GENP
Primary operation is Resorts World Sentosa
(“RWS”), an integrated resort complex which opened during Q1-10. Two additional hotels and a maritime museum are planned to open at the end of 2010.
GENS reported $145 million of operating loss on $356 million of revenue during 2009.
Genting
Plantation Berhad, “GENP”
–
Operates the Group’s oil palm plantation business, with operations in Malaysia and Indonesia.
GENP is also involved in biotechnology R&D as well as property development. GENP reported $50 million and $34 million of revenue and operating income, respectively, during 2009.
54.6%51.7%48.6%

12
Area Summary notes
Recent analyst
comments
GENT is publicly traded on the Malaysian stock exchange, Bursa Malaysia, and is currently followed by 22 analysts, of which 19, two, and one analysts recommended GENT as “buy”, “hold”, and “sell”, respectively. Some of the more recent analyst comments have been summarized below.
Deutsche Bank – (July 6, 2010) Deutsche Bank maintained a “buy” recommendation for GENT, however lowered its price target citing corporate governance risks and intensifying regional competition.
AmResearch – (June 10, 2010) AmResearch maintained a “buy” recommendation suggesting that GENT will benefit from the potential overseas expansion for GENM through the Aqueduct investment.
JP Morgan – (June 2, 2010) JP Morgan maintained an “overweight” recommendation, citing recent optimism that has been shown towards Malaysia for the expected increase in visitors in subsequent quarters and noting GENTS’s strong cash flows generation.
Maybank IB – (May 31, 2010) Maybank IB maintained a “buy” recommendation, expecting better quarters ahead as RWS ramps into full operations.OSK Research – (May 31, 2010) OSK Research maintained a “buy” recommendation due to GENS’s growth trajectory and the Group’s search for global
casino M&As.AFFiN IB – (May 31, 2010) AFFiN IB maintained a “buy” recommendation as a result of the positive start to 2010. CIMB - (May 31, 2010) CIMB maintained an “outperform” recommendation, as a result of GENT’s Q1-10 core earnings beating CIMB and consensus
estimates by 14%.Credit Suisse – (May 28, 2010) Credit Suisse maintained an “underperform” rating and lowered their FY10 estimate by 13%, primarily due to premium
valuations of GENT’s stock. Nomura – (May 27, 2010) Nomura maintained a “buy” recommendation and raised their target price by 5.9%, primarily due to recent earnings upgrades.
Financial viability analysis GENT –
Overview (2)
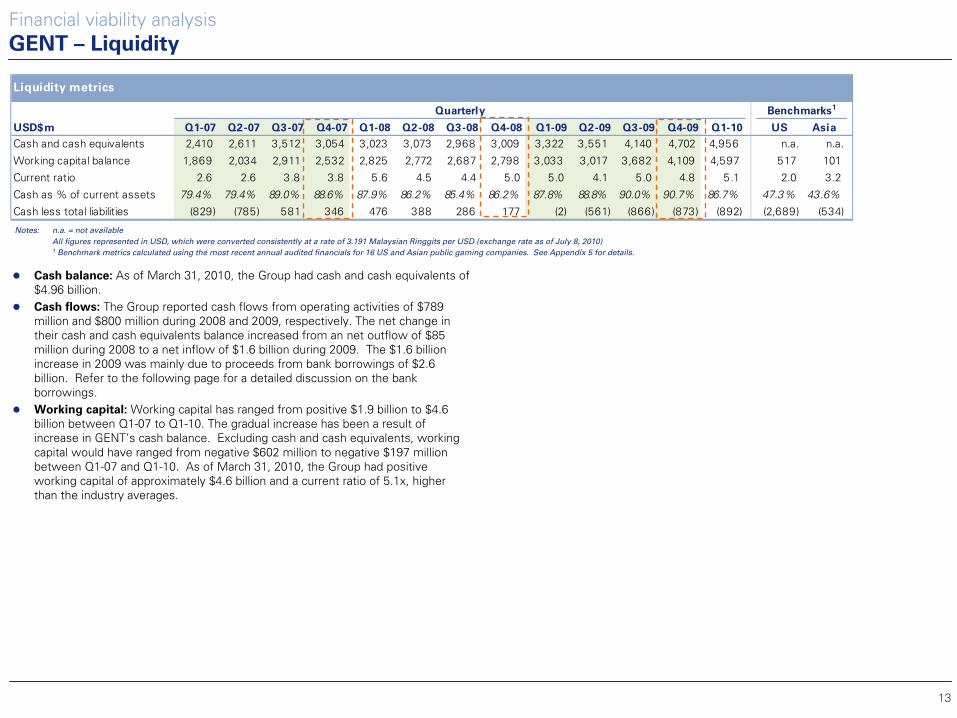
13
Liquidity metrics
Quarterly Benchmarks1
USD$m Q1-07 Q2-07 Q3-07 Q4-07 Q1-08 Q2-08 Q3-08 Q4-08 Q1-09 Q2-09 Q3-09 Q4-09 Q1-10 US Asia
Cash and cash equivalents 2,410 2,611 3,512 3,054 3,023 3,073 2,968 3,009 3,322 3,551 4,140 4,702 4,956 n.a. n.a.
Working capital balance 1,869 2,034 2,911 2,532 2,825 2,772 2,687 2,798 3,033 3,017 3,682 4,109 4,597 517 101
Current ratio 2.6 2.6 3.8 3.8 5.6 4.5 4.4 5.0 5.0 4.1 5.0 4.8 5.1 2.0 3.2
Cash as % of current assets 79.4% 79.4% 89.0% 88.6% 87.9% 86.2% 85.4% 86.2% 87.8% 88.8% 90.0% 90.7% 86.7% 47.3% 43.6%
Cash less total liabilities (829) (785) 581 346 476 388 286 177 (2) (561) (866) (873) (892) (2,689) (534)
Financial viability analysis
GENT –
Liquidity
Notes:
n.a. = not availableAll figures represented in USD, which were converted consistently at a rate of 3.191 Malaysian Ringgits per USD (exchange rate as of July 8, 2010)1
Benchmark metrics calculated using the most recent annual audited financials for 16 US and Asian public gaming companies. See Appendix 5 for details.
Cash balance: As of March 31, 2010, the Group had cash and cash equivalents of$4.96 billion. Cash flows: The Group reported cash flows from operating activities of $789 million and $800 million during 2008 and 2009, respectively. The net change in their cash and cash equivalents balance increased from an net outflow of $85 million during 2008 to a net inflow of $1.6 billion during 2009. The $1.6 billion increase in 2009 was mainly due to proceeds from bank borrowings of $2.6 billion. Refer to the following page for a detailed discussion on the bank borrowings. Working capital: Working capital has ranged from positive $1.9 billion to $4.6 billion between Q1-07 to Q1-10. The gradual increase has been a result of increase in GENT’s cash balance. Excluding cash and cash equivalents, working capital would have ranged from negative $602 million to negative $197 million between Q1-07 and Q1-10. As of March 31, 2010, the Group had positive working capital of approximately $4.6 billion and a current ratio of 5.1x, higher than the industry averages.
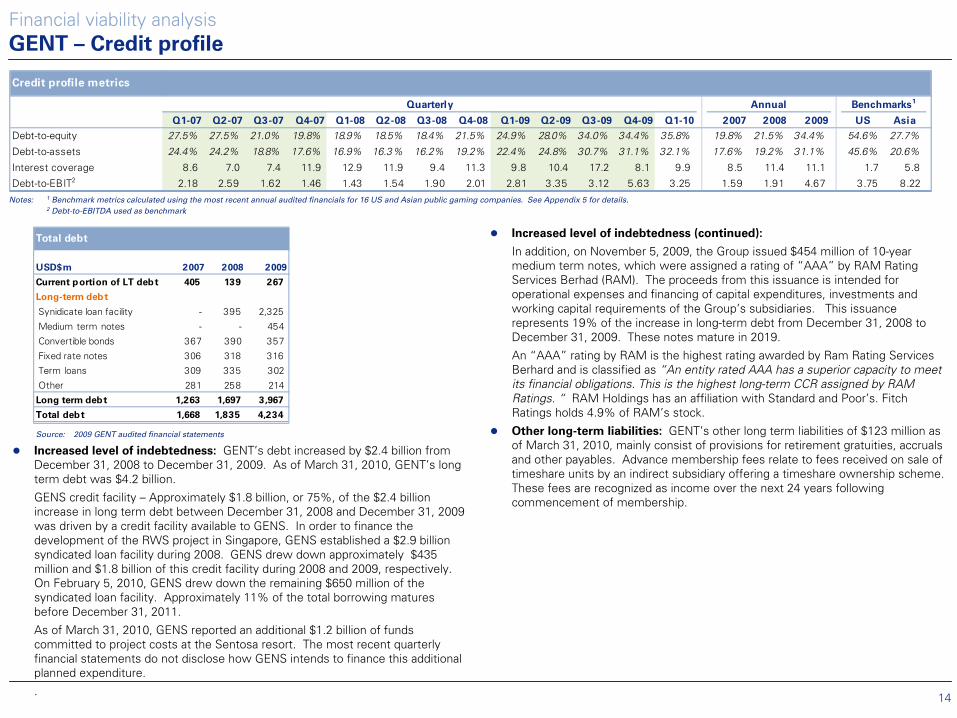
14
Credit profile metrics
Quarterly Annual Benchmarks1
Q1-07 Q2-07 Q3-07 Q4-07 Q1-08 Q2-08 Q3-08 Q4-08 Q1-09 Q2-09 Q3-09 Q4-09 Q1-10 2007 2008 2009 US Asia
Debt-to-equity 27.5% 27.5% 21.0% 19.8% 18.9% 18.5% 18.4% 21.5% 24.9% 28.0% 34.0% 34.4% 35.8% 19.8% 21.5% 34.4% 54.6% 27.7%
Debt-to-assets 24.4% 24.2% 18.8% 17.6% 16.9% 16.3% 16.2% 19.2% 22.4% 24.8% 30.7% 31.1% 32.1% 17.6% 19.2% 31.1% 45.6% 20.6%
Interest coverage 8.6 7.0 7.4 11.9 12.9 11.9 9.4 11.3 9.8 10.4 17.2 8.1 9.9 8.5 11.4 11.1 1.7 5.8
Debt-to-EBIT2 2.18 2.59 1.62 1.46 1.43 1.54 1.90 2.01 2.81 3.35 3.12 5.63 3.25 1.59 1.91 4.67 3.75 8.22
Financial viability analysis
GENT –
Credit profile
Increased level of indebtedness: GENT’s debt increased by $2.4 billion from December 31, 2008 to December 31, 2009. As of March 31, 2010, GENT’s long term debt was $4.2 billion.
GENS credit facility –
Approximately $1.8 billion, or 75%, of the $2.4 billion increase in long term debt between December 31, 2008 and December 31, 2009 was driven by a credit facility available to GENS. In order to finance the development of the RWS project in Singapore, GENS established a $2.9 billion syndicated loan facility during 2008. GENS drew down approximately $435 million and $1.8 billion of this credit facility during 2008 and
2009, respectively. On February 5, 2010, GENS drew down the remaining $650 million of the syndicated loan facility. Approximately 11% of the total borrowing matures before December 31, 2011.
As of March 31, 2010, GENS reported an additional $1.2 billion of funds committed to project costs at the Sentosa
resort. The most recent quarterly financial statements do not disclose how GENS intends to finance
this additional planned expenditure.
.
Notes:
1
Benchmark metrics calculated using the most recent annual audited financials for 16 US and Asian public gaming companies. See Appendix 5 for details.2
Debt-to-EBITDA used as benchmark
Increased level of indebtedness (continued):
In addition, on November 5, 2009, the Group issued $454 million of 10-year medium term notes, which were assigned a rating of “AAA”
by RAM Rating Services Berhad
(RAM). The proceeds from this issuance is intended for operational expenses and financing of capital expenditures, investments and working capital requirements of the Group’s subsidiaries. This issuance represents 19% of the increase in long-term debt from December 31, 2008 to December 31, 2009. These notes mature in 2019.
An “AAA”
rating by RAM is the highest rating awarded by Ram Rating Services Berhard
and is classified as “An entity rated AAA has a superior capacity to meet its financial obligations. This is the highest long-term CCR assigned by RAM Ratings. “
RAM Holdings has an affiliation with Standard and Poor’s. Fitch Ratings holds 4.9% of RAM’s
stock.
Other long-term liabilities: GENT’s other long term liabilities of $123 million as of March 31, 2010, mainly consist of provisions for retirement gratuities, accruals and other payables. Advance membership fees relate to fees received on sale of timeshare units by an indirect subsidiary offering a timeshare ownership scheme. These fees are recognized as income over the next 24 years following commencement of membership.
Total debt
USD$m 2007 2008 2009
Current portion of LT debt 405 139 267
Long-term debt
Synidicate loan facility - 395 2,325
Medium term notes - - 454
Convertible bonds 367 390 357
Fixed rate notes 306 318 316
Term loans 309 335 302
Other 281 258 214
Long term debt 1,263 1,697 3,967
Total debt 1,668 1,835 4,234
Source: 2009 GENT audited financial statements

15
BBB S&P credit rating – On December 19, 2007, Standard & Poor’s ratings services lowered its corporate credit rating on GENT to BBB from BBB+, due to its weakening financial profile from the increased debt required to fund the Sentosaintegrated resort project for GENS. S&P’s rationale for the BBB rating was driven by the GENT’s stable cash flows derived largely from its Malaysian gaming business, potentially strong cash flow generation from the new Sentosa integrated resort project steered by Genting Singapore, and strong liquidity position. S&P reported that upside potential for the rating is limited in the medium term and that the rating could be either raised or lowered based on the achieved cash flows from the Sentosa resort. S&P’s November 17, 2009 report maintained a BBB rating.
Higher risk Altman Z-score – The Altman Z-score is a predictive model created by Edward Altman in the 1960s. This model combines five different financial ratios to determine the likelihood of bankruptcy amongst companies. Scoring is on a scale which has an inverse relationship to the risk of potential bankruptcy. Companies with Z-scores above 3 are considered to be healthy, while scores between 1.8 and 3 lie in an area of higher risk of bankruptcy. When this calculation is applied to the Group as of March 31, 2010, it is in a higher risk area.
Financial viability analysis
GENT –
Credit profile (2)
Notes:
1
Benchmark metrics calculated using the most recent annual audited financials for 16 US and Asian public gaming companies. See Appendix 5 for details.
Altman Z-score calculation
As of Benchmarks1
31-Dec-07 31-Dec-08 31-Dec-09 31-Mar-10 US Asia
Z-score equation: Z = 1.2T1 + 1.4T2 + 3.3T3 + 0.6T4 + .999T5
T1 = Working capital / total assets 0.3 0.3 0.3 0.3 0.1 0.1
T2 = Retained earnings / total assets 0.4 0.4 0.3 0.3 0.2 0.4
T3 = EBIT/ total assets 0.1 0.1 0.1 0.0 0.1 0.2
T4 = Market value of equity / total liabilities 3.4 6.2 1.5 1.3 0.9 1.2
T5 = Sales/ total assets 0.3 0.3 0.2 0.1 0.6 0.5
Altman Z-score 3.6 5.3 2.1 1.8 2.0 2.4
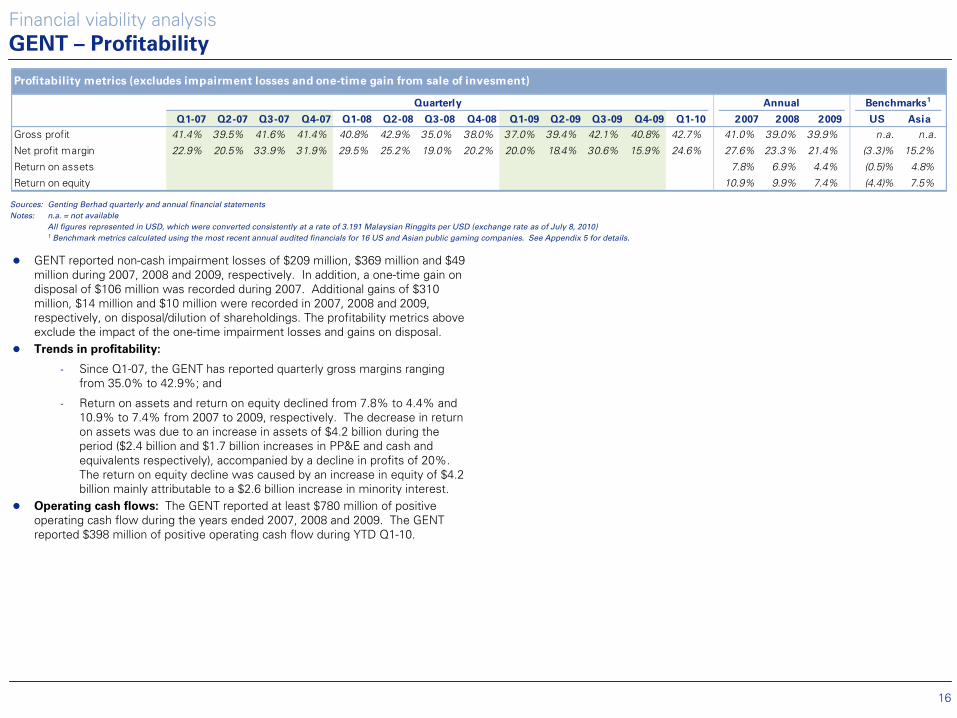
16
Profitability metrics (excludes impairment losses and one-time gain from sale of invesment)
Quarterly Annual Benchmarks1
Q1-07 Q2-07 Q3-07 Q4-07 Q1-08 Q2-08 Q3-08 Q4-08 Q1-09 Q2-09 Q3-09 Q4-09 Q1-10 2007 2008 2009 US Asia
Gross profit 41.4% 39.5% 41.6% 41.4% 40.8% 42.9% 35.0% 38.0% 37.0% 39.4% 42.1% 40.8% 42.7% 41.0% 39.0% 39.9% n.a. n.a.
Net profit margin 22.9% 20.5% 33.9% 31.9% 29.5% 25.2% 19.0% 20.2% 20.0% 18.4% 30.6% 15.9% 24.6% 27.6% 23.3% 21.4% (3.3)% 15.2%
Return on assets 7.8% 6.9% 4.4% (0.5)% 4.8%
Return on equity 10.9% 9.9% 7.4% (4.4)% 7.5%
Financial viability analysis
GENT –
Profitability
Sources:
Genting
Berhad
quarterly and annual financial statementsNotes:
n.a. = not availableAll figures represented in USD, which were converted consistently at a rate of 3.191 Malaysian Ringgits per USD (exchange rate as of July 8, 2010)1
Benchmark metrics calculated using the most recent annual audited financials for 16 US and Asian public gaming companies. See Appendix 5 for details.
GENT reported non-cash impairment losses of $209 million, $369 million and $49 million during 2007, 2008 and 2009, respectively. In addition, a one-time gain on disposal of $106 million was recorded during 2007. Additional gains of $310 million, $14 million and $10 million were recorded in 2007, 2008 and 2009, respectively, on disposal/dilution of shareholdings. The profitability metrics above exclude the impact of the one-time impairment losses and gains on disposal. Trends in profitability:
- Since Q1-07, the GENT has reported quarterly gross margins ranging from 35.0% to 42.9%; and
- Return on assets and return on equity declined from 7.8% to 4.4%
and 10.9% to 7.4% from 2007 to 2009, respectively. The decrease in return on assets was due to an increase in assets of $4.2 billion during the period ($2.4 billion and $1.7 billion increases in PP&E and cash
and equivalents respectively), accompanied by a decline in profits of 20%. The return on equity decline was caused by an increase in equity
of $4.2 billion mainly attributable to a $2.6 billion increase in minority interest.
Operating cash flows: The GENT reported at least $780 million of positive operating cash flow during the years ended 2007, 2008 and 2009. The GENT reported $398 million of positive operating cash flow during YTD Q1-10.
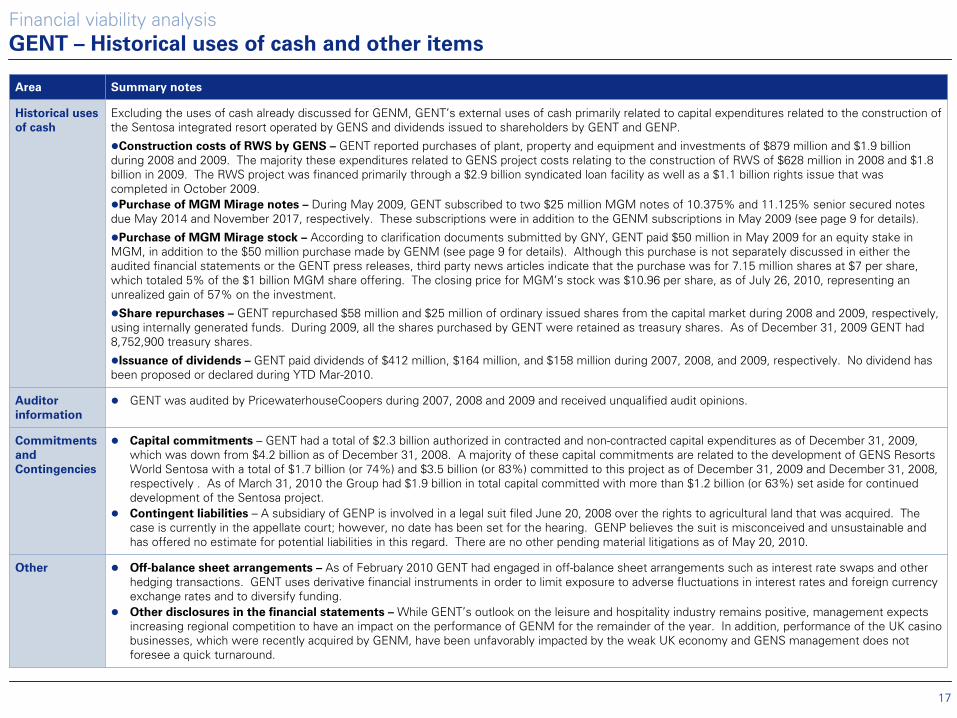
17
Area Summary notes
Historical uses
of cash
Excluding the uses of cash already discussed for GENM, GENT’s
external uses of cash primarily related to capital expenditures
related to the construction of the Sentosa
integrated resort operated by GENS and dividends issued to shareholders by GENT and GENP.
Construction costs of RWS by GENS – GENT reported purchases of plant, property and equipment and investments of $879 million and $1.9 billion during 2008 and 2009. The majority these expenditures related to GENS project costs relating to the construction of RWS of $628 million in 2008 and $1.8 billion in 2009. The RWS project was financed primarily through a $2.9 billion syndicated loan facility as well as a $1.1 billion rights issue that was completed in October 2009.
Purchase of MGM Mirage notes – During May 2009, GENT subscribed to two $25 million MGM notes of 10.375% and 11.125% senior secured notes due May 2014 and November 2017, respectively. These subscriptions were in addition to the GENM subscriptions in May 2009 (see page 9 for details).
Purchase of MGM Mirage stock – According to clarification documents submitted by GNY, GENT paid $50 million in May 2009 for an equity stake in MGM, in addition to the $50 million purchase made by GENM (see page 9 for details). Although this purchase is not separately discussed in either the audited financial statements or the GENT press releases, third party news articles indicate that the purchase was for 7.15 million shares at $7 per share, which totaled 5% of the $1 billion MGM share offering. The closing price for MGM’s stock was $10.96 per share, as of July 26, 2010, representing an unrealized gain of 57% on the investment.
Share repurchases – GENT repurchased $58 million and $25 million of ordinary issued shares from the capital market during 2008 and 2009, respectively, using internally generated funds. During 2009, all the shares purchased by GENT were retained as treasury shares. As of December 31, 2009 GENT had 8,752,900 treasury shares.
Issuance of dividends – GENT paid dividends of $412 million, $164 million, and $158 million during 2007, 2008, and 2009, respectively. No dividend has been proposed or declared during YTD Mar-2010.
Auditor
information
GENT was audited by PricewaterhouseCoopers during 2007, 2008 and 2009 and received unqualified audit opinions.
Commitments
and
Contingencies
Capital commitments – GENT had a total of $2.3 billion authorized in contracted and non-contracted capital expenditures as of December 31, 2009, which was down from $4.2 billion as of December 31, 2008. A majority of these capital commitments are related to the development of GENS Resorts World Sentosa with a total of $1.7 billion (or 74%) and $3.5 billion (or 83%) committed to this project as of December 31, 2009 and December 31, 2008, respectively . As of March 31, 2010 the Group had $1.9 billion in total capital committed with more than $1.2 billion (or 63%) set aside for continued development of the Sentosa project.Contingent liabilities – A subsidiary of GENP is involved in a legal suit filed June 20, 2008 over the rights to agricultural land that was acquired. The case is currently in the appellate court; however, no date has been set for the hearing. GENP believes the suit is misconceived and unsustainable and has offered no estimate for potential liabilities in this regard. There are no other pending material litigations as of May 20, 2010.
Other Off-balance sheet arrangements – As of February 2010 GENT had engaged in off-balance sheet arrangements such as interest rate swaps and otherhedging transactions. GENT uses derivative financial instruments in order to limit exposure to adverse fluctuations in interest rates and foreign currency exchange rates and to diversify funding.Other disclosures in the financial statements – While GENT’s outlook on the leisure and hospitality industry remains positive, management expects increasing regional competition to have an impact on the performance of GENM for the remainder of the year. In addition, performance of the UK casino businesses, which were recently acquired by GENM, have been unfavorably impacted by the weak UK economy and GENS management does not foresee a quick turnaround.
Financial viability analysis
GENT –
Historical uses of cash and other items
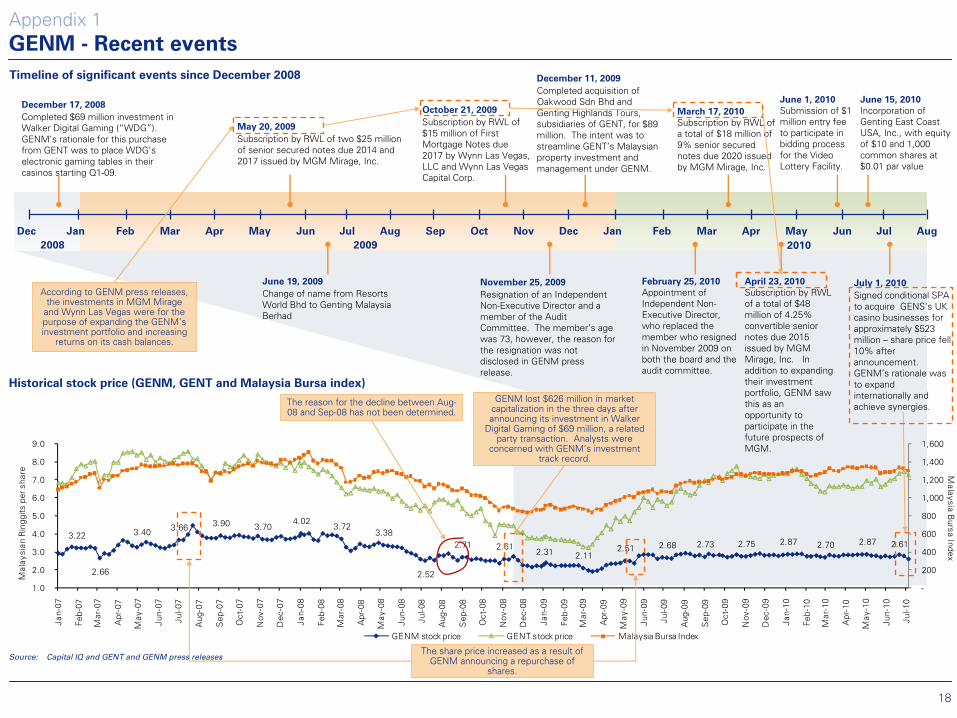
18
3.22
2.66
3.40 3.66 3.90 3.70 4.02
3.72 3.38
2.52
2.71 2.61 2.31 2.11
2.51 2.68 2.73 2.75 2.87 2.70 2.87 2.61
-
200
400
600
800
1,000
1,200
1,400
1,600
1.0
2.0
3.0
4.0
5.0
6.0
7.0
8.0
9.0
Jan-
07
Feb-
07
Mar
-07
Apr
-07
May
-07
Jun-
07
Jul-0
7
Aug
-07
Sep
-07
Oct
-07
Nov
-07
Dec
-07
Jan-
08
Feb-
08
Mar
-08
Apr
-08
May
-08
Jun-
08
Jul-0
8
Aug
-08
Sep
-08
Oct
-08
Nov
-08
Dec
-08
Jan-
09
Feb-
09
Mar
-09
Apr
-09
May
-09
Jun-
09
Jul-0
9
Aug
-09
Sep
-09
Oct
-09
Nov
-09
Dec
-09
Jan-
10
Feb-
10
Mar
-10
Apr
-10
May
-10
Jun-
10
Jul-1
0
Malaysia B
ursa IndexM
alay
sian
Rin
ggits
per
sha
re
GENM stock price GENT stock price Malaysia Bursa Index
Appendix 1
GENM -
Recent events
Dec Jan Feb Mar Apr Jun
June 19, 2009
Change of name from Resorts World Bhd
to Genting
Malaysia Berhad
November 25, 2009
Resignation of an Independent Non-Executive Director and a member of the Audit Committee. The member’s age was 73, however, the reason for the resignation was not disclosed in GENM press release.
December 17, 2008
Completed $69 million investment in Walker Digital Gaming (“WDG”). GENM’s
rationale for this purchase from GENT was to place WDG’s
electronic gaming tables in their casinos starting Q1-09.
May 20, 2009
Subscription by RWL of two $25 million of senior secured notes due 2014 and 2017 issued by MGM Mirage, Inc.
December 11, 2009
Completed acquisition of Oakwood Sdn
Bhd
and Genting
Highlands Tours, subsidiaries of GENT, for $89 million. The intent was to streamline GENT’s
Malaysian property investment and management under GENM.
May Jul Aug Sep Oct Nov Dec Jan Feb Mar Apr JunMay Jul Aug
October 21, 2009
Subscription by RWL of $15 million of First Mortgage Notes due 2017 by Wynn Las Vegas, LLC and Wynn Las Vegas Capital Corp.
April 23, 2010
Subscription by RWL of a total of $48 million of 4.25% convertible senior notes due 2015 issued by MGM Mirage, Inc. In addition to expanding their investment portfolio, GENM saw this as an opportunity to participate in the future prospects of MGM.
June 1, 2010
Submission of $1 million entry fee to participate in bidding process for the Video Lottery Facility.
February 25, 2010
Appointment of Independent Non-
Executive Director, who replaced the member who resigned in November 2009 on both the board and the audit committee.
March 17, 2010
Subscription by RWL of a total of $18 million of 9% senior secured notes due 2020 issued by MGM Mirage, Inc.
Historical stock price (GENM, GENT and Malaysia Bursa index)
Source:
Capital IQ and GENT and GENM press releases
June 15, 2010
Incorporation of Genting
East Coast USA, Inc., with equity of $10 and 1,000 common shares at $0.01 par value
July 1, 2010
Signed conditional SPA to acquire GENS’s
UK casino businesses for approximately $523 million –
share price fell 10% after announcement. GENM’s
rationale was to expand internationally and achieve synergies.
Timeline of significant events since December 2008
2008 2009 2010
GENM lost $626 million in market capitalization in the three days after announcing its investment in Walker
Digital Gaming of $69 million, a related party transaction. Analysts were
concerned with GENM’s
investment track record.
According to GENM press releases, the investments in MGM Mirage
and Wynn Las Vegas were for the purpose of expanding the GENM’s
investment portfolio and increasing returns on its cash balances.
The share price increased as a result of GENM announcing a repurchase of
shares.
The reason for the decline between Aug-
08 and Sep-08 has not been determined.
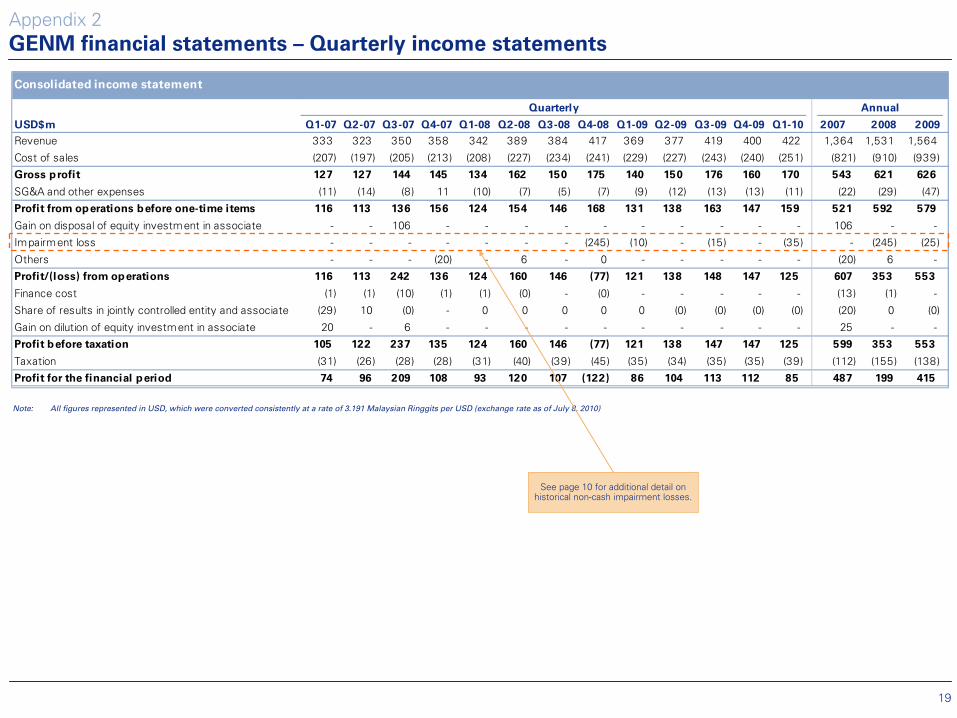
19
Consolidated income statement
Quarterly Annual
USD$m Q1-07 Q2-07 Q3-07 Q4-07 Q1-08 Q2-08 Q3-08 Q4-08 Q1-09 Q2-09 Q3-09 Q4-09 Q1-10 2007 2008 2009
Revenue 333 323 350 358 342 389 384 417 369 377 419 400 422 1,364 1,531 1,564
Cost of sales (207) (197) (205) (213) (208) (227) (234) (241) (229) (227) (243) (240) (251) (821) (910) (939)
Gross profit 127 127 144 145 134 162 150 175 140 150 176 160 170 543 621 626
SG&A and other expenses (11) (14) (8) 11 (10) (7) (5) (7) (9) (12) (13) (13) (11) (22) (29) (47)
Profit from operations before one-time items 116 113 136 156 124 154 146 168 131 138 163 147 159 521 592 579
Gain on disposal of equity investment in associate - - 106 - - - - - - - - - - 106 - -
Impairment loss - - - - - - - (245) (10) - (15) - (35) - (245) (25)
Others - - - (20) - 6 - 0 - - - - - (20) 6 -
Profit/(loss) from operations 116 113 242 136 124 160 146 (77) 121 138 148 147 125 607 353 553
Finance cost (1) (1) (10) (1) (1) (0) - (0) - - - - - (13) (1) -
Share of results in jointly controlled entity and associate (29) 10 (0) - 0 0 0 0 0 (0) (0) (0) (0) (20) 0 (0)
Gain on dilution of equity investment in associate 20 - 6 - - - - - - - - - - 25 - -
Profit before taxation 105 122 237 135 124 160 146 (77) 121 138 147 147 125 599 353 553
Taxation (31) (26) (28) (28) (31) (40) (39) (45) (35) (34) (35) (35) (39) (112) (155) (138)
Profit for the financial period 74 96 209 108 93 120 107 (122) 86 104 113 112 85 487 199 415
Appendix 2
GENM financial statements –
Quarterly income statements
Note:
All figures represented in USD, which were converted consistently at a rate of 3.191 Malaysian Ringgits per USD (exchange rate as of July 8, 2010)
See page 10 for additional detail on historical non-cash impairment losses.
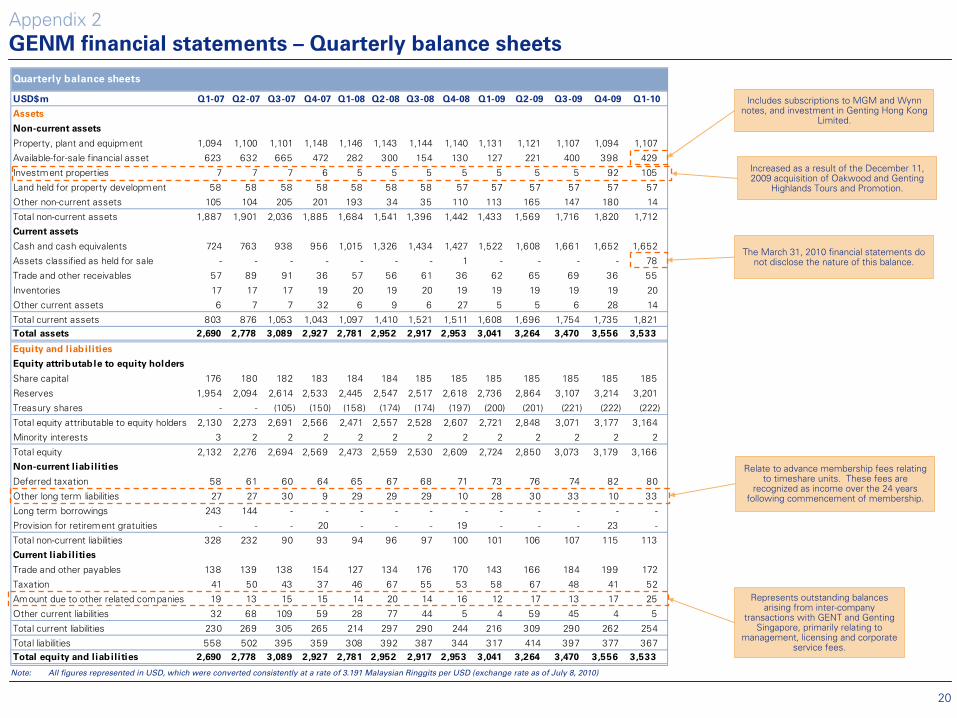
20
Appendix 2
GENM financial statements –
Quarterly balance sheets
Quarterly balance sheets
USD$m Q1-07 Q2-07 Q3-07 Q4-07 Q1-08 Q2-08 Q3-08 Q4-08 Q1-09 Q2-09 Q3-09 Q4-09 Q1-10
Assets
Non-current assets
Property, plant and equipment 1,094 1,100 1,101 1,148 1,146 1,143 1,144 1,140 1,131 1,121 1,107 1,094 1,107
Available-for-sale financial asset 623 632 665 472 282 300 154 130 127 221 400 398 429
Investment properties 7 7 7 6 5 5 5 5 5 5 5 92 105
Land held for property development 58 58 58 58 58 58 58 57 57 57 57 57 57
Other non-current assets 105 104 205 201 193 34 35 110 113 165 147 180 14
Total non-current assets 1,887 1,901 2,036 1,885 1,684 1,541 1,396 1,442 1,433 1,569 1,716 1,820 1,712
Current assets
Cash and cash equivalents 724 763 938 956 1,015 1,326 1,434 1,427 1,522 1,608 1,661 1,652 1,652
Assets classified as held for sale - - - - - - - 1 - - - - 78
Trade and other receivables 57 89 91 36 57 56 61 36 62 65 69 36 55
Inventories 17 17 17 19 20 19 20 19 19 19 19 19 20
Other current assets 6 7 7 32 6 9 6 27 5 5 6 28 14
Total current assets 803 876 1,053 1,043 1,097 1,410 1,521 1,511 1,608 1,696 1,754 1,735 1,821Total assets 2,690 2,778 3,089 2,927 2,781 2,952 2,917 2,953 3,041 3,264 3,470 3,556 3,533
Equity and liabilities
Equity attributable to equity holders
Share capital 176 180 182 183 184 184 185 185 185 185 185 185 185
Reserves 1,954 2,094 2,614 2,533 2,445 2,547 2,517 2,618 2,736 2,864 3,107 3,214 3,201
Treasury shares - - (105) (150) (158) (174) (174) (197) (200) (201) (221) (222) (222)
Total equity attributable to equity holders 2,130 2,273 2,691 2,566 2,471 2,557 2,528 2,607 2,721 2,848 3,071 3,177 3,164
Minority interests 3 2 2 2 2 2 2 2 2 2 2 2 2
Total equity 2,132 2,276 2,694 2,569 2,473 2,559 2,530 2,609 2,724 2,850 3,073 3,179 3,166
Non-current liabilities
Deferred taxation 58 61 60 64 65 67 68 71 73 76 74 82 80
Other long term liabilities 27 27 30 9 29 29 29 10 28 30 33 10 33
Long term borrowings 243 144 - - - - - - - - - - -
Provision for retirement gratuities - - - 20 - - - 19 - - - 23 -
Total non-current liabilities 328 232 90 93 94 96 97 100 101 106 107 115 113
Current liabilities
Trade and other payables 138 139 138 154 127 134 176 170 143 166 184 199 172
Taxation 41 50 43 37 46 67 55 53 58 67 48 41 52
Amount due to other related companies 19 13 15 15 14 20 14 16 12 17 13 17 25
Other current liabilities 32 68 109 59 28 77 44 5 4 59 45 4 5
Total current liabilities 230 269 305 265 214 297 290 244 216 309 290 262 254
Total liabilities 558 502 395 359 308 392 387 344 317 414 397 377 367Total equity and liabilities 2,690 2,778 3,089 2,927 2,781 2,952 2,917 2,953 3,041 3,264 3,470 3,556 3,533
Note:
All figures represented in USD, which were converted consistently at a rate of 3.191 Malaysian Ringgits per USD (exchange rate as of July 8, 2010)
Represents outstanding balances arising from inter-company
transactions with GENT and Genting
Singapore, primarily relating to management, licensing and corporate
service fees.
Relate to advance membership fees relating to timeshare units. These fees are
recognized as income over the 24 years following commencement of membership.
Increased as a result of the December 11, 2009 acquisition of Oakwood and Genting
Highlands Tours and Promotion.
Includes subscriptions to MGM and Wynn notes, and investment in Genting
Hong Kong Limited.
The March 31, 2010 financial statements do not disclose the nature of this balance.

21
Appendix 2
GENM financial statements –
Summary statements of cash flows
Summary statement of cash flows
USD$m 2007 2008 2009
YTD
Mar-10
Cash flows from operating activities
Profit before taxation 599 353 553 125
Adjustments for:
Taxation paid (96) (130) (147) (30)
Depreciation of property, plant and equipment 76 82 85 20
Impairment losses - 245 25 35
Interest income (27) (36) (24) (6)
Gain on disposal of equity investment in associate (106) - - -
Gain on dilution of equity investment in associate (25) - - -
Other 35 (7) (4) (2)
Total adjustments (141) 153 (65) 17
Changes in working capital (3) 31 22 (18)
Net cash flow from operating activities 455 537 510 123
Cash flows from investing activities
Purchase of investments (104) (80) (176) -
Proceeds from disposal of investments - 163 109 -
Acquisition of subsidiaries - - (88) -
Purchase of property, plant and equipment (129) (83) (41) (13)
Interest received 26 37 27 -
Other 369 1 3 (91)
Net cash flow from investing activities 163 38 (167) (104)
Cash flows from financing activities
Buy-back of shares (150) (47) (25) -
Dividends paid (77) (88) (94) -
Repayment of borrowings (39) - - -
Settlement of zero coupon convertible notes (24) - - -
Other 9 1 2 1
Net cash flow from financing activities (282) (134) (117) 1
Net increase in cash and cash equivalents 336 441 226 20
Cash and cash equivalents at beginning of the financial year 621 956 1,424 1,646
Effect of currency translation (0) 26 (4) (13)
Cash and cash equivalents at end of the financial year 956 1,424 1,646 1,652
Note:
1) All figures represented in USD, which were converted consistently at a rate of 3.191 Malaysian Ringgits per USD (exchange rate as of July 8, 2010)2) The difference in cash balances from the balance sheet are due to balances that were classified changes between the periods.
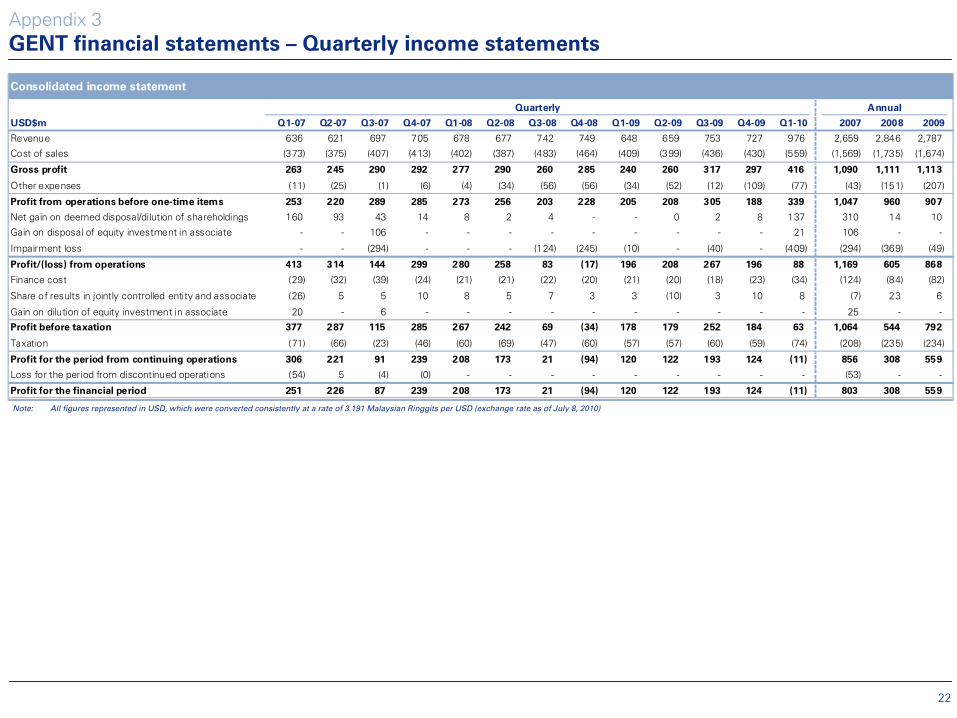
22
Appendix 3
GENT financial statements –
Quarterly income statements
Note:
All figures represented in USD, which were converted consistently at a rate of 3.191 Malaysian Ringgits per USD (exchange rate as of July 8, 2010)
Consolidated income statement
Quarterly Annual
USD$m Q1-07 Q2-07 Q3-07 Q4-07 Q1-08 Q2-08 Q3-08 Q4-08 Q1-09 Q2-09 Q3-09 Q4-09 Q1-10 2007 2008 2009
Revenue 636 621 697 705 678 677 742 749 648 659 753 727 976 2,659 2,846 2,787
Cost of sales (373) (375) (407) (413) (402) (387) (483) (464) (409) (399) (436) (430) (559) (1,569) (1,735) (1,674)
Gross profit 263 245 290 292 277 290 260 285 240 260 317 297 416 1,090 1,111 1,113
Other expenses (11) (25) (1) (6) (4) (34) (56) (56) (34) (52) (12) (109) (77) (43) (151) (207)
Profit from operations before one-time items 253 220 289 285 273 256 203 228 205 208 305 188 339 1,047 960 907
Net gain on deemed disposal/dilution of shareholdings 160 93 43 14 8 2 4 - - 0 2 8 137 310 14 10
Gain on disposal of equity investment in associate - - 106 - - - - - - - - - 21 106 - -
Impairment loss - - (294) - - - (124) (245) (10) - (40) - (409) (294) (369) (49)
Profit/(loss) from operations 413 314 144 299 280 258 83 (17) 196 208 267 196 88 1,169 605 868
Finance cost (29) (32) (39) (24) (21) (21) (22) (20) (21) (20) (18) (23) (34) (124) (84) (82)
Share of results in jointly controlled entity and associate (26) 5 5 10 8 5 7 3 3 (10) 3 10 8 (7) 23 6
Gain on dilution of equity investment in associate 20 - 6 - - - - - - - - - - 25 - -
Profit before taxation 377 287 115 285 267 242 69 (34) 178 179 252 184 63 1,064 544 792
Taxation (71) (66) (23) (46) (60) (69) (47) (60) (57) (57) (60) (59) (74) (208) (235) (234)
Profit for the period from continuing operations 306 221 91 239 208 173 21 (94) 120 122 193 124 (11) 856 308 559
Loss for the period from discontinued operations (54) 5 (4) (0) - - - - - - - - - (53) - -
Profit for the financial period 251 226 87 239 208 173 21 (94) 120 122 193 124 (11) 803 308 559
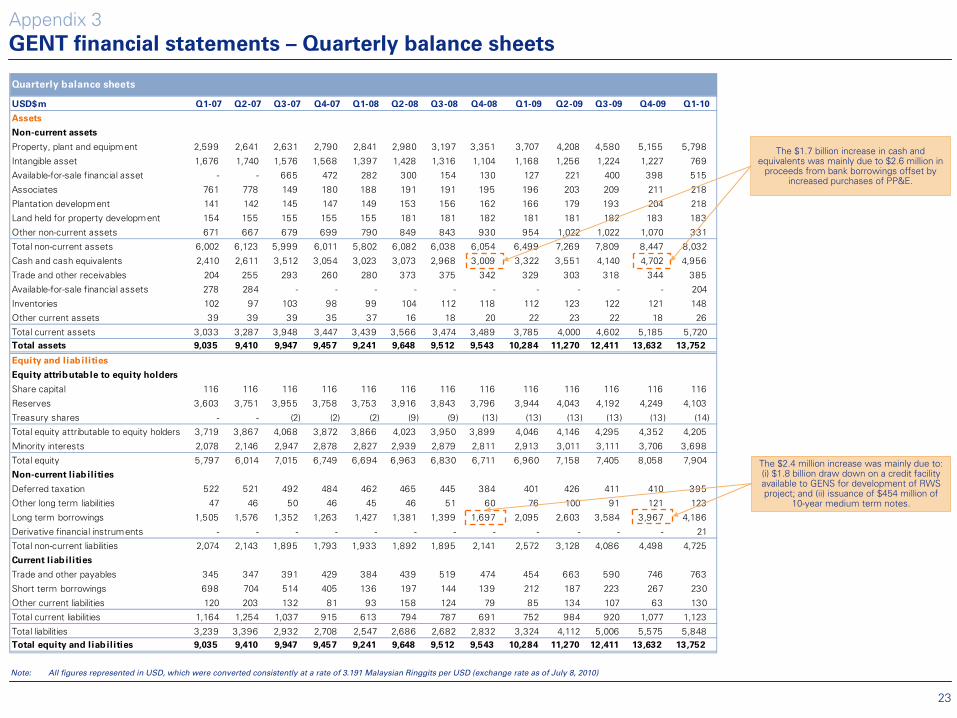
23
Quarterly balance sheets
USD$m Q1-07 Q2-07 Q3-07 Q4-07 Q1-08 Q2-08 Q3-08 Q4-08 Q1-09 Q2-09 Q3-09 Q4-09 Q1-10
Assets
Non-current assets
Property, plant and equipment 2,599 2,641 2,631 2,790 2,841 2,980 3,197 3,351 3,707 4,208 4,580 5,155 5,798
Intangible asset 1,676 1,740 1,576 1,568 1,397 1,428 1,316 1,104 1,168 1,256 1,224 1,227 769
Available-for-sale financial asset - - 665 472 282 300 154 130 127 221 400 398 515
Associates 761 778 149 180 188 191 191 195 196 203 209 211 218
Plantation development 141 142 145 147 149 153 156 162 166 179 193 204 218
Land held for property development 154 155 155 155 155 181 181 182 181 181 182 183 183
Other non-current assets 671 667 679 699 790 849 843 930 954 1,022 1,022 1,070 331
Total non-current assets 6,002 6,123 5,999 6,011 5,802 6,082 6,038 6,054 6,499 7,269 7,809 8,447 8,032
Cash and cash equivalents 2,410 2,611 3,512 3,054 3,023 3,073 2,968 3,009 3,322 3,551 4,140 4,702 4,956
Trade and other receivables 204 255 293 260 280 373 375 342 329 303 318 344 385
Available-for-sale financial assets 278 284 - - - - - - - - - - 204
Inventories 102 97 103 98 99 104 112 118 112 123 122 121 148
Other current assets 39 39 39 35 37 16 18 20 22 23 22 18 26
Total current assets 3,033 3,287 3,948 3,447 3,439 3,566 3,474 3,489 3,785 4,000 4,602 5,185 5,720Total assets 9,035 9,410 9,947 9,457 9,241 9,648 9,512 9,543 10,284 11,270 12,411 13,632 13,752
Equity and liabilities
Equity attributable to equity holders
Share capital 116 116 116 116 116 116 116 116 116 116 116 116 116
Reserves 3,603 3,751 3,955 3,758 3,753 3,916 3,843 3,796 3,944 4,043 4,192 4,249 4,103
Treasury shares - - (2) (2) (2) (9) (9) (13) (13) (13) (13) (13) (14)
Total equity attributable to equity holders 3,719 3,867 4,068 3,872 3,866 4,023 3,950 3,899 4,046 4,146 4,295 4,352 4,205
Minority interests 2,078 2,146 2,947 2,878 2,827 2,939 2,879 2,811 2,913 3,011 3,111 3,706 3,698
Total equity 5,797 6,014 7,015 6,749 6,694 6,963 6,830 6,711 6,960 7,158 7,405 8,058 7,904
Non-current liab ilities
Deferred taxation 522 521 492 484 462 465 445 384 401 426 411 410 395
Other long term liabilities 47 46 50 46 45 46 51 60 76 100 91 121 123
Long term borrowings 1,505 1,576 1,352 1,263 1,427 1,381 1,399 1,697 2,095 2,603 3,584 3,967 4,186
Derivative financial instruments - - - - - - - - - - - - 21
Total non-current liabilities 2,074 2,143 1,895 1,793 1,933 1,892 1,895 2,141 2,572 3,128 4,086 4,498 4,725
Current liabilities
Trade and other payables 345 347 391 429 384 439 519 474 454 663 590 746 763
Short term borrowings 698 704 514 405 136 197 144 139 212 187 223 267 230
Other current liabilities 120 203 132 81 93 158 124 79 85 134 107 63 130
Total current liabilities 1,164 1,254 1,037 915 613 794 787 691 752 984 920 1,077 1,123
Total liabilities 3,239 3,396 2,932 2,708 2,547 2,686 2,682 2,832 3,324 4,112 5,006 5,575 5,848Total equity and liab ilities 9,035 9,410 9,947 9,457 9,241 9,648 9,512 9,543 10,284 11,270 12,411 13,632 13,752
Appendix 3
GENT financial statements –
Quarterly balance sheets
Note:
All figures represented in USD, which were converted consistently at a rate of 3.191 Malaysian Ringgits per USD (exchange rate as of July 8, 2010)
The $2.4 million increase was mainly due to: (i) $1.8 billion draw down on a credit facility available to GENS for development of RWS project; and (ii) issuance of $454 million of
10-year medium term notes.
The $1.7 billion increase in cash and equivalents was mainly due to $2.6 million in
proceeds from bank borrowings offset by increased purchases of PP&E.
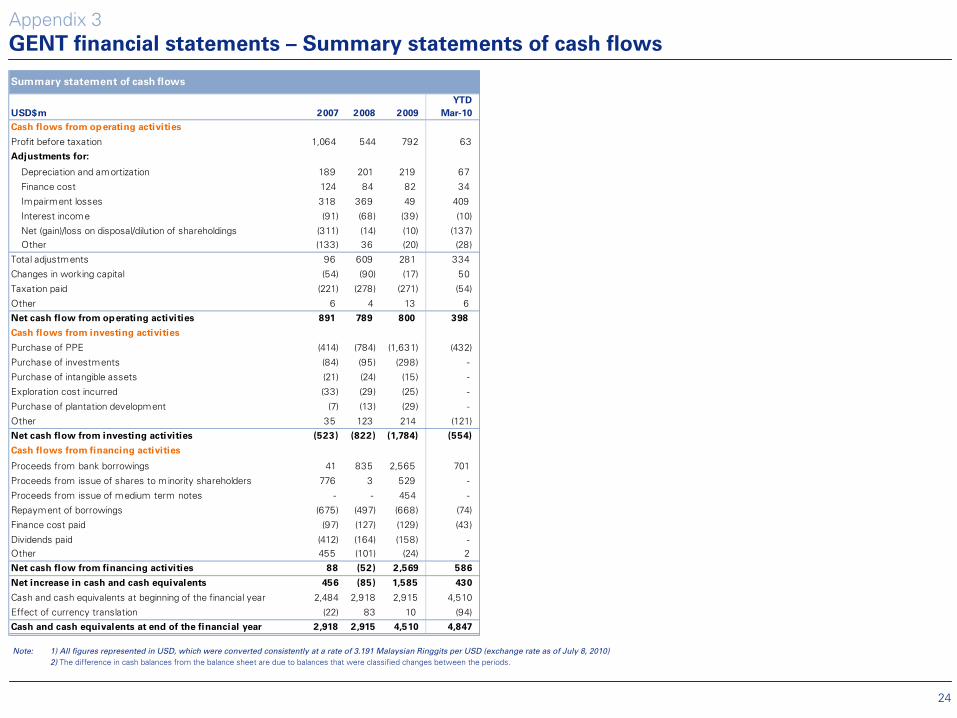
24
Summary statement of cash flows
USD$m 2007 2008 2009
YTD
Mar-10
Cash flows from operating activities
Profit before taxation 1,064 544 792 63
Adjustments for:
Depreciation and amortization 189 201 219 67
Finance cost 124 84 82 34
Impairment losses 318 369 49 409
Interest income (91) (68) (39) (10)
Net (gain)/loss on disposal/dilution of shareholdings (311) (14) (10) (137)Other (133) 36 (20) (28)
Total adjustments 96 609 281 334
Changes in working capital (54) (90) (17) 50
Taxation paid (221) (278) (271) (54)
Other 6 4 13 6
Net cash flow from operating activities 891 789 800 398
Cash flows from investing activities
Purchase of PPE (414) (784) (1,631) (432)
Purchase of investments (84) (95) (298) -
Purchase of intangible assets (21) (24) (15) -
Exploration cost incurred (33) (29) (25) -
Purchase of plantation development (7) (13) (29) -
Other 35 123 214 (121)
Net cash flow from investing activities (523) (822) (1,784) (554)
Cash flows from financing activities
Proceeds from bank borrowings 41 835 2,565 701
Proceeds from issue of shares to minority shareholders 776 3 529 -
Proceeds from issue of medium term notes - - 454 -
Repayment of borrowings (675) (497) (668) (74)
Finance cost paid (97) (127) (129) (43)
Dividends paid (412) (164) (158) -Other 455 (101) (24) 2
Net cash flow from financing activities 88 (52) 2,569 586
Net increase in cash and cash equivalents 456 (85) 1,585 430
Cash and cash equivalents at beginning of the financial year 2,484 2,918 2,915 4,510
Effect of currency translation (22) 83 10 (94)
Cash and cash equivalents at end of the financial year 2,918 2,915 4,510 4,847
Appendix 3
GENT financial statements –
Summary statements of cash flows
Note:
1) All figures represented in USD, which were converted consistently at a rate of 3.191 Malaysian Ringgits per USD (exchange rate as of July 8, 2010)2) The difference in cash balances from the balance sheet are due to balances that were classified changes between the periods.

25
Illustrative financial capacity and Aqueduct financial requirement - GENM
USD$m Notes
Pro forma cash position
GENM cash balance as of March 31, 2010 1,652.4
Less: consideration for UK casino acquisition (523.0) 1
Pro forma cash available 1,129.4 2
Per-opening cash requirements under MOU proposal by GNY
Potential upfront licensing fee 300.0 3
Phase 1 construction of casino 350.0 4
Less: cash received from ESDC construction grant (250.0)
Appropriation of funds to NYRA 25.0
Potential financial requirement 425.0
Pro forma cash available in excess of potential
financial requirement704.4 5
Illustrative financial capacity and Aqueduct financial requirement - GENT
USD$m Notes
Pro forma cash position
GENT cash balance as of March 31, 2010 4,956.4 6
Per-opening cash requirements under MOU proposal by GNY
Potential upfront licensing fee 300.0 3
Phase 1 construction of casino 350.0 4
Less: cash received from ESDC construction grant (250.0) Appropriation of funds to NYRA 25.0 Potential financial requirement 425.0
Pro forma cash available in excess of potential
financial requirement4,531.4 7
Appendix 4
GENM and GENT –
Illustrative financial capacity and Aqueduct financial requirement
Notes:
All figures represented in USD, which were converted consistently at a rate of 3.191 Malaysian Ringgits per USD (exchange rate as of July 8, 2010)
Notes:
1.
Consideration for July 1, 2010 UK casino acquisition from Genting
Singapore assumed to be made using 100% equity.
2.
Pro forma cash available based on the March 31, 2010 cash balance less the estimated cash paid related to the UK casino acquisition. However, this pro forma balance excludes all other sources and uses of cash subsequent to March 31, 2010, including purchase commitments reported in the audited financial
statements as the timing of these commitments is unknown.
3.
Potential upfront licensing fee assumes GNY proposes to pay $300
million using 100% equity.
4.
Phase 1 construction of casino estimate obtained from submitted Vendor documents. $25 million of the $350 million Phase 1 construction
costs relate to the construction of an additional 800 covered parking spaces, 500 outdoor VLT’s, and upgrade the MTA station, which must receive authorization from the Division of Lottery prior to construction.
5.
Pro forma cash available in excess of potential financial requirement excludes impact of all other sources and uses of cash subsequent to March
31, 2010, other than the acquisition of the UK casinos.
6.
This balance excludes all other sources and uses of cash subsequent to March 31, 2010, including purchase commitments reported in the audited financial statements as the timing of these commitments is unknown.
7.
Pro forma cash available in excess of potential financial requirement excludes impact of all other sources and uses of cash subsequent to March
31, 2010. Consideration should be given to the timing of the Group capital
commitments of $1.9 billion and interest payments related to the Group’s $4.2 billion in long-term debt.
Notes:
All figures represented in USD, which were converted consistently at a rate of 3.191 Malaysian Ringgits per USD (exchange rate as of July 8, 2010)

26
Benchmark - metrics
$m (except EPS)
# Country Company
Cash as %
of current
assets
Working
capital
Current
ratio
Cash
less
liabilities
Debt-to-
equity
Debt-to
assets
Interest
coverage
Debt-to-
EBITDA1
Return on
assets
Return on
equity
Operating
margin
Net profit
margin
Altman
Z-score
EPS
(basic)
1 Singapore Lasseters International 65.9% (2) 0.9 (68) 49.5% 38.6% n.m. 52.0 3.4% 8.6% 1.6% 7.2% 0.64 0.02 2 Hong Kong SJM Holdings Limited 77.6% 289 1.3 (886) 37.6% 22.0% 4.5 5.7 3.4% 9.3% 2.6% 2.3% 2.78 0.02 3 Macau Wynn Macau Ltd. (SEHK:1128) 89.4% 304 1.7 (841) 68.0% 51.4% 7.6 3.3 13.3% 54.9% 17.2% 14.7% 4.21 0.05 4 Hong Kong Galaxy Entertainment Group 76.8% (121) 0.8 (898) 40.9% 30.8% 9.9 4.2 6.1% 13.7% 11.3% 9.5% 2.12 0.04 5 Hong Kong Melco Crow n Entertainment 27.4% 216 n.m. (2,179) 40.2% 34.3% (8.5) n.m. (6.3)% (12.3)% (20.4)% (23.1)% 1.22 (0.21) 6 Malaysia Berjaya Land Bhd 10.2% 272 1.5 (1,131) 21.3% 17.8% 3.7 4.1 0.9% 1.4% 11.8% 2.4% 1.48 (0.02) 7 Malaysia Berjaya Sports Toto Bhd 9.7% 296 1.3 (1,932) 22.2% 17.1% 2.1 4.6 0.7% 1.1% 9.8% 1.7% 2.33 (0.00) 8 South Korea Kangw on Land Corp. 13.8% 0 2.2 (397) n.m. n.m. n.m. n.m. 16.3% 20.6% 38.5% 32.3% 6.28 0.00 9 Malaysia RGB International Bhd. 13.8% (42) 0.5 (88) 50.8% 33.2% (6.1) n.m. (14.6)% (45.4)% (32.9)% (38.0)% 0.02 (0.21) 10 South Korea Paradise Co., Ltd. 93.7% 89 2.5 66 n.m. n.m. 20.2 n.m. 6.2% 7.6% 8.3% 9.2% 3.93 0.32 11 Hong Kong Golden Resorts Group Ltd. 83.9% 118 21.4 98 0.0% 0.0% n.m. 0.0 7.1% 7.2% 11.6% 55.6% n.m. 0.00 12 Hong Kong Elixir Gaming Technologies, Inc. 29.3% 7 2.1 (11) 1.8% 1.2% n.m. n.m. n.m. n.m. n.m. n.m. n.m. (0.23) 13 Hong Kong Emperor Entertainment Hotel 64.5% 49 1.8 (40) n.m. n.m. 16.5 n.m. 17.3% 22.5% 29.5% 66.4% 2.49 0.06 14 Cambodia NagaCorp Ltd. (SEHK:3918) 22.2% 43 2.7 (10) 0.0% 0.0% n.m. 0.0 8.1% 8.9% 22.8% 21.6% n.m. 0.01 15 Hong Kong Amax Holdings Limited 11.0% 73 4.9 (125) 0.2% 0.2% 6.0 0.0 2.1% 2.9% 86.0% 18.9% 1.85 0.00 16 Hong Kong Neptune Group Limited 8.1% 32 2.0 (94) n.m. n.m. 8.0 n.m. 8.5% 12.2% 51.7% 47.0% 1.31 0.00
Average 43.6% 101 3.2 (534) 27.7% 20.6% 5.8 8.2 4.8% 7.5% 16.6% 15.2% 2.36 (0.01)
Select public gaming companies - financial data
$m (except EPS)
# Country Company
Cash and
equivalent1
Current
assets
Current
liab ilities
Total
assets
Total
liab ilities
Retained
earnings
Total
equity
Total LT
debt2 Revenue
Operating
income
Interest
expense
Net
income
1 Singapore Lasseters International 9 14 16 127 77 (6) 50 49 60 1 - 4 2 Hong Kong SJM Holdings Limited 1,025 1,321 1,032 3,007 1,911 445 1,096 662 4,421 115 25 102 3 Macau Wynn Macau Ltd. 681 762 457 2,007 1,521 237 485 1,032 1,812 311 41 266 4 Hong Kong Galaxy Entertainment Group 457 595 716 2,441 1,355 1,001 1,086 752 1,574 178 18 149 5 Hong Kong Melco Crow n Entertainment 213 775 559 4,900 2,391 (567) 2,509 1,683 1,333 (272) 32 (308) 6 Malaysia Berjaya Land Bhd 85 831 559 3,545 1,216 599 2,329 631 1,301 154 41 31 7 Malaysia Berjaya Sports Toto Bhd 142 1,463 1,167 5,206 2,074 168 3,131 893 1,987 195 91 34 8 South Korea Kangw on Land Corp. 0 1 0 1,909 397 1,427 1,512 - 965 372 - 312 9 Malaysia RGB International Bhd. 7 49 91 139 94 11 45 46 53 (18) 3 (20) 10 South Korea Paradise Co., Ltd. 140 150 61 406 75 263 331 - 273 23 1 25 11 Hong Kong Golden Resorts Group Ltd. 104 123 6 418 6 401 412 0 53 6 0 30 12 Hong Kong Elixir Gaming Technologies, 4 14 7 48 15 (645) 33 1 16 (28) 1 (26) 13 Hong Kong Emperor Entertainment Hotel 74 114 65 489 114 318 375 - 127 38 2 85 14 Cambodia NagaCorp Ltd. (SEHK:3918) 15 68 25 313 25 83 288 0 118 27 0 25 15 Hong Kong Amax Holdings Limited 10 92 19 479 136 340 344 1 54 46 8 10 16 Hong Kong Neptune Group Limited 5 64 32 328 99 47 229 - 60 31 4 28
Notes:
1
Operating income used as a proxy for EBITDA
Appendix 5
Benchmark composition –
Asian gaming companies
Notes:
1
Cash and cash equivalents include cash, marketable securities and short term investments 2 Total long term debt comprised of current and non-current portion of debt outstanding
The Asian benchmark is comprised of 16 Asian public gaming companies; the financial information presented below is as of each company’s most recent annual
audited financial statements. Financial statements reported in
local currencies were translated to US dollars using the exchange rate as of July 8, 2010.
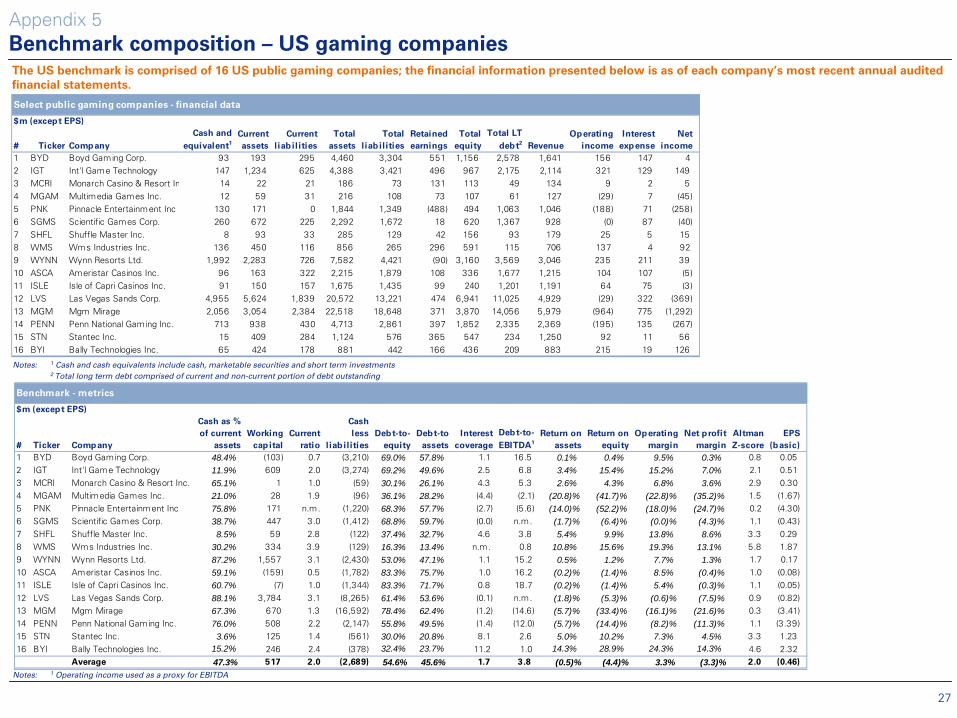
27
Benchmark - metrics
$m (except EPS)
# Ticker Company
Cash as %
of current
assets
Working
capital
Current
ratio
Cash
less
liabilities
Debt-to-
equity
Debt-to
assets
Interest
coverage
Debt-to-
EBITDA1
Return on
assets
Return on
equity
Operating
margin
Net profit
margin
Altman
Z-score
EPS
(basic)
1 BYD Boyd Gaming Corp. 48.4% (103) 0.7 (3,210) 69.0% 57.8% 1.1 16.5 0.1% 0.4% 9.5% 0.3% 0.8 0.05 2 IGT Int'l Game Technology 11.9% 609 2.0 (3,274) 69.2% 49.6% 2.5 6.8 3.4% 15.4% 15.2% 7.0% 2.1 0.51 3 MCRI Monarch Casino & Resort Inc. 65.1% 1 1.0 (59) 30.1% 26.1% 4.3 5.3 2.6% 4.3% 6.8% 3.6% 2.9 0.30 4 MGAM Multimedia Games Inc. 21.0% 28 1.9 (96) 36.1% 28.2% (4.4) (2.1) (20.8)% (41.7)% (22.8)% (35.2)% 1.5 (1.67) 5 PNK Pinnacle Entertainment Inc 75.8% 171 n.m. (1,220) 68.3% 57.7% (2.7) (5.6) (14.0)% (52.2)% (18.0)% (24.7)% 0.2 (4.30) 6 SGMS Scientific Games Corp. 38.7% 447 3.0 (1,412) 68.8% 59.7% (0.0) n.m. (1.7)% (6.4)% (0.0)% (4.3)% 1.1 (0.43) 7 SHFL Shuffle Master Inc. 8.5% 59 2.8 (122) 37.4% 32.7% 4.6 3.8 5.4% 9.9% 13.8% 8.6% 3.3 0.29 8 WMS Wms Industries Inc. 30.2% 334 3.9 (129) 16.3% 13.4% n.m. 0.8 10.8% 15.6% 19.3% 13.1% 5.8 1.87 9 WYNN Wynn Resorts Ltd. 87.2% 1,557 3.1 (2,430) 53.0% 47.1% 1.1 15.2 0.5% 1.2% 7.7% 1.3% 1.7 0.17 10 ASCA Ameristar Casinos Inc. 59.1% (159) 0.5 (1,782) 83.3% 75.7% 1.0 16.2 (0.2)% (1.4)% 8.5% (0.4)% 1.0 (0.08) 11 ISLE Isle of Capri Casinos Inc. 60.7% (7) 1.0 (1,344) 83.3% 71.7% 0.8 18.7 (0.2)% (1.4)% 5.4% (0.3)% 1.1 (0.05) 12 LVS Las Vegas Sands Corp. 88.1% 3,784 3.1 (8,265) 61.4% 53.6% (0.1) n.m. (1.8)% (5.3)% (0.6)% (7.5)% 0.9 (0.82) 13 MGM Mgm Mirage 67.3% 670 1.3 (16,592) 78.4% 62.4% (1.2) (14.6) (5.7)% (33.4)% (16.1)% (21.6)% 0.3 (3.41) 14 PENN Penn National Gaming Inc. 76.0% 508 2.2 (2,147) 55.8% 49.5% (1.4) (12.0) (5.7)% (14.4)% (8.2)% (11.3)% 1.1 (3.39) 15 STN Stantec Inc. 3.6% 125 1.4 (561) 30.0% 20.8% 8.1 2.6 5.0% 10.2% 7.3% 4.5% 3.3 1.23 16 BYI Bally Technologies Inc. 15.2% 246 2.4 (378) 32.4% 23.7% 11.2 1.0 14.3% 28.9% 24.3% 14.3% 4.6 2.32
Average 47.3% 517 2.0 (2,689) 54.6% 45.6% 1.7 3.8 (0.5)% (4.4)% 3.3% (3.3)% 2.0 (0.46)
Notes:
1
Operating income used as a proxy for EBITDA
Appendix 5
Benchmark composition –
US gaming companies
Select public gaming companies - financial data
$m (except EPS)
# Ticker Company
Cash and
equivalent1
Current
assets
Current
liabil ities
Total
assets
Total
liabilities
Retained
earnings
Total
equity
Total LT
debt2 Revenue
Operating
income
Interest
expense
Net
income
1 BYD Boyd Gaming Corp. 93 193 295 4,460 3,304 551 1,156 2,578 1,641 156 147 4 2 IGT Int'l Game Technology 147 1,234 625 4,388 3,421 496 967 2,175 2,114 321 129 149 3 MCRI Monarch Casino & Resort In 14 22 21 186 73 131 113 49 134 9 2 5 4 MGAM Multimedia Games Inc. 12 59 31 216 108 73 107 61 127 (29) 7 (45) 5 PNK Pinnacle Entertainment Inc 130 171 0 1,844 1,349 (488) 494 1,063 1,046 (188) 71 (258) 6 SGMS Scientific Games Corp. 260 672 225 2,292 1,672 18 620 1,367 928 (0) 87 (40) 7 SHFL Shuffle Master Inc. 8 93 33 285 129 42 156 93 179 25 5 15 8 WMS Wms Industries Inc. 136 450 116 856 265 296 591 115 706 137 4 92 9 WYNN Wynn Resorts Ltd. 1,992 2,283 726 7,582 4,421 (90) 3,160 3,569 3,046 235 211 39 10 ASCA Ameristar Casinos Inc. 96 163 322 2,215 1,879 108 336 1,677 1,215 104 107 (5) 11 ISLE Isle of Capri Casinos Inc. 91 150 157 1,675 1,435 99 240 1,201 1,191 64 75 (3) 12 LVS Las Vegas Sands Corp. 4,955 5,624 1,839 20,572 13,221 474 6,941 11,025 4,929 (29) 322 (369) 13 MGM Mgm Mirage 2,056 3,054 2,384 22,518 18,648 371 3,870 14,056 5,979 (964) 775 (1,292) 14 PENN Penn National Gaming Inc. 713 938 430 4,713 2,861 397 1,852 2,335 2,369 (195) 135 (267) 15 STN Stantec Inc. 15 409 284 1,124 576 365 547 234 1,250 92 11 56 16 BYI Bally Technologies Inc. 65 424 178 881 442 166 436 209 883 215 19 126
Notes:
1
Cash and cash equivalents include cash, marketable securities and short term investments 2 Total long term debt comprised of current and non-current portion of debt outstanding
The US benchmark is comprised of 16 US public gaming companies; the financial information presented below is as of each company’s most recent annual audited
financial statements.
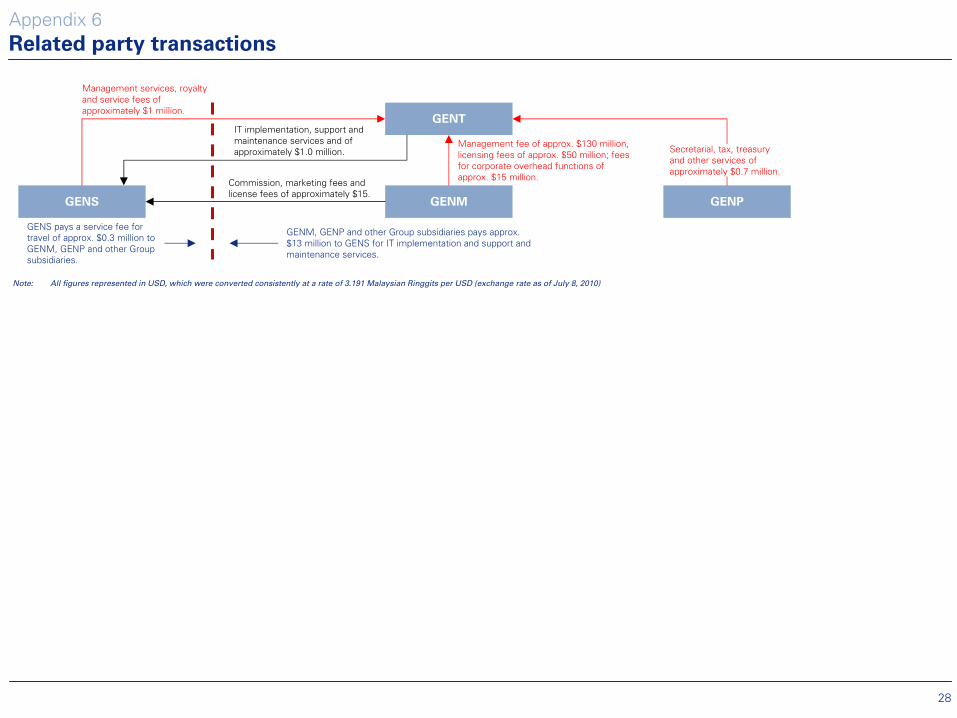
28
Appendix 6
Related party transactions
Note:
All figures represented in USD, which were converted consistently at a rate of 3.191 Malaysian Ringgits per USD (exchange rate as of July 8, 2010)
GENS
GENT
GENM GENP
GENS pays a service fee for travel of approx. $0.3 million to GENM, GENP and other Group subsidiaries.
GENM, GENP and other Group subsidiaries pays approx. $13 million to GENS for IT implementation and support and maintenance services.
Management services, royalty and service fees of approximately $1 million.
Management fee of approx. $130 million, licensing fees of approx. $50 million; fees for corporate overhead functions of approx. $15 million.
Secretarial, tax, treasury and other services of approximately $0.7 million.
IT implementation, support and maintenance services and of approximately $1.0 million.
Commission, marketing fees and license fees of approximately $15.