Report 3 - SINTEF · with the wide variety of aggregate and geological types found ... Experience...
38
Transcript of Report 3 - SINTEF · with the wide variety of aggregate and geological types found ... Experience...


Project funded by the European Community under the ‘Competitive and Sustainable Growth’ Programme (1998-2002)
Report 3.5
Field site tests established in the PARTNER project for evaluating the correlation
between laboratory tests and field performance
Copyright © PARTNER-project-GRD1-CT-2001-40103 All rights reserved

Copyright © PARTNER-project-GRD1-CT-2001-40103 All rights reserved
3
Preface This report is one of a series produced as output from PARTNER, a project funded by the European Community under the “Competitive and Sustainable Growth“ programme. The overall objective of this project is to provide the basis for a unified test procedure for evaluating the alkali reactivity of aggregates across the different European economic and geological regions. It will enable CEN TC-154, Aggregates, to fulfil the requirements of the Aggregates Mandate, M125, which identifies durability against alkalis as a necessary performance characteristic in the specification of aggregates for concrete (EN 12620) to meet the Essential Requirements of the CPD for Strength and Safety. The project will achieve this by:
• Evaluating the tests developed by RILEM, and some regional tests, for their suitability for use with the wide variety of aggregate and geological types found across Europe.
• Calibrating the results of these accelerated tests against behaviour in concrete in real structures and in field sites.
• Producing an “atlas” of the geology and petrography of European aggregates. • Educating European petrographers and testing organisations in the effective use of these
methods. • Making recommendations, based on the above work, to CEN for suitable CEN methods of test
and specifications to ensure durability against alkalis. The project has 24 Partners from 14 countries, covering most of Europe, from Iceland to Greece. Partners BRE ……………………………...……………………………………………………………….UK PC Laboratoriet A/S ....................................................................................................................... DK SINTEF ......................................................................................................................................... NO SP - Swedish National Testing and Research Institute .................................................................. SE RAMBOLL .................................................................................................................................... DK ISSeP – Institut Scientifique de Service Public.............................................................................. B LCPC Laboratory .......................................................................................................................... F VDZ – German Cement Works Association ................................................................................. D TITAN Cement Company, S.A...................................................................................................... EL LABEIN ......................................................................................................................................... ES CRIC – Centre National de Recherches Scientifiques et techniques pour L’Industrie Cimentière .................................................................................................................. B IMBiGS .......................................................................................................................................... PL NORCEM A.S................................................................................................................................ NO CESI ............................................................................................................................................... I VOZ – Austrian Cement Association............................................................................................. A IBRI – Icelandic Building Research Institute STATS............................................................................................................................................ UK NCC AB ......................................................................................................................................... SE DANISH TECHNOLOGICAL INSTITUTE ................................................................................ DK AIDICO.......................................................................................................................................... ES ANEFA........................................................................................................................................... ES Cemex............................................................................................................................................. ES HOLCIM ........................................................................................................................................ B Hönnun........................................................................................................................................... IS

Copyright © PARTNER-project-GRD1-CT-2001-40103 All rights reserved
4
List of available reports in the PARTNER project WP 2: Aggregates and structures (leader: RAMBÖLL) Report
no. Report title Author
2.1 State-of-the art report: Key parameters influencing the alkali aggregate reaction SBF52 A06018 / ISBN 82-14-04078-7 / 978-82-14-04078-7
Hönnun, RAMBÖLL,
SINTEF WP 3: Test methods (leader: SINTEF) Report
no. Report title Author
3.1
Experience from using petrographic analysis according to the RILEM AAR-1 method to assess alkali reactions in European aggregates SBF52 A06019 / ISBN 82-14-04079-5 / 978-82-14-04079-5
SINTEF
3.2 Experience from testing of the alkali reactivity of European aggregates according to the RILEM AAR-2 method SBF52 A06020 / ISBN 82-14-04080-9 / 978-82-14-04080-9
PC-lab
3.3 Experience from testing of the alkali reactivity of European aggregates according to several concrete prism test methods SBF52 A06021 / ISBN 82-14-04081-7 / 978- 82-14-04081-7
BRE
3.4 Experience from testing of the alkali reactivity of European aggregates according to two Danish laboratory test methods SBF52 A06022 / ISBN 82-14-04082-5 / 978- 82-14-04082-5
RAMBÖLL
3.5
Field site tests established in the PARTNER project for evaluating the correlation between laboratory tests and field performance SBF52 A06023 / ISBN 82-14-04083-3 / 978- 82-14-04083-3
VDZ
WP 4: Precision trials (leader: SP) Report
no. Report title Author
4.1 PRECISION TRIAL – Determination of repeatability and reproducibility of the amended RILEM methods SBF52 A06024 / ISBN 82-14-04084-1 / 978-82-14-04084-1
SP
WP 5: Dissemination (leader: PC-lab) Report
no. Report title Author
Final results and recommendations of the PARTNER project. Paper to be published at ICAAR 2008, Trondheim, Norway
BRE + several co-authors
Database / atlas of the alkali reactivity of European aggregates Published by Geological Survey of Belgium see www.aarig.org/webatlas/atlas.htm
PC-lab, ISSEP, Hönnun

Copyright © PARTNER-project-GRD1-CT-2001-40103 All rights reserved
5
Summary This report describes the results of tests carried out under Work Package 3.5 (Field Site Test). The field site test was aiming at providing a correlation between the behaviour of possibly alkali reactive aggregates in concrete stored under real climatic conditions and according to concrete and mortar tests procedures in the laboratory. Therefore the behaviour of a wide variety of aggregate and geological types found across Europe was accessed under different European climate conditions. The results were compared with the RILEM recommended methods AAR-2, AAR-3 and AAR-4. At the editorial deadline for this report in July 2006 the samples were exposed to the field site for approximately 2½ years. This time is to less for many dense aggregates to cause a deleterious ASR in concrete so that every conclusion made in this report has to be considered of preliminary character. To generate final results the work will be continued at least for 2½ years until the end of 2008. For testing two concrete cubes with 300 mm lateral length prepared with the aggregate under test were stored at 8 different field sites in Europe. The changes in dimension and possible cracking were assessed at periodic intervals. To promote any potential for ASR, the samples were made with relatively high cement content and high alkali Portland cement (RILEM reference cement). During the duration of the project only one aggregate (a silicified limestone) showed a distinct sign of a deleterious ASR. The reactivity of this aggregate was also confirmed by the RILEM recommended methods AAR-2, AAR-3 and AAR-4. After 2 ½ years of testing some samples with moderate to high reactive aggregates showed also some indications of a deleterious ASR. At this stage no apparent difference between different climates is obvious. Dry stored specimens were showing more signs of reaction than partly wet stored specimens.

Copyright © PARTNER-project-GRD1-CT-2001-40103 All rights reserved
6
Content 1 Introduction ........................................................................................................................................7 2 Method ...............................................................................................................................................7
2.1 Development ..............................................................................................................................7 2.2 Principle .....................................................................................................................................7
3 Work programme ...............................................................................................................................7 3.1 Materials.....................................................................................................................................7
3.1.1 Aggregates..........................................................................................................................7 3.1.2 Cement................................................................................................................................8 3.1.3 Admixtures .........................................................................................................................8
3.2 Concrete production ...................................................................................................................9 3.2.1 Concrete mixing and casting ..............................................................................................9 3.2.2 Preparation for measurement..............................................................................................9 3.2.3 Specimen storage..............................................................................................................10
3.3 Field site testing........................................................................................................................11 3.3.1 Field site selection ............................................................................................................11 3.3.2 Field site climate ..............................................................................................................12 3.3.3 Transport to field site .......................................................................................................13 3.3.4 Testing at field site ...........................................................................................................13
3.4 Data collection and compilation...............................................................................................14 4 Results ..............................................................................................................................................15
4.1 Fresh concrete properties..........................................................................................................15 4.2 Expansion and cracking............................................................................................................16
5 Discussion / interpretation................................................................................................................18 6 Comments on the method.................................................................................................................20 7 Conclusion........................................................................................................................................20 8 References ........................................................................................................................................20 Annexes Annex 1. Test procedure and notes for field site tests Annex 2. Petrographic composition and field performance of the aggregates tested Annex 3. The Köppen climate classification Annex 4. Photos of field sites Annex 5. Annual climate data

Copyright © PARTNER-project-GRD1-CT-2001-40103 All rights reserved
7
1 Introduction This report describes the current state of results of field site tests after 47 month of duration to assess the behaviour of a wide variety of aggregate and geological types found across Europe under different European climate conditions. The program is carried out under Work Package 3.5 in the PARTNER programme. Since work is still running and final results are even not be available within the duration of the project every conclusion made in this report has to be considered as preliminary statement. At the editorial deadline in July 2006 the samples were exposed to the field site for approximately 2½ years and will remain on the field site at least for 2½ years until the end of 2008. The aim of the field site tests was to provide a correlation between the behaviour of possibly alkali reactive aggregates in concrete stored under real climatic conditions and according to accelerated concrete test procedures. Since the focus of the whole work is to advance and establish predominantly, the RILEM test methods concrete compositions comparable to these methods were tested in these trials. Different climatic conditions representative for Europe are covered in order to take into account the influence of different environmental conditions in practice. The report is written by Eberhard Siebel, Jürgen Bokern and Ingmar Borchers, VDZ German Cement Works Association, Düsseldorf, Germany ([email protected]).
2 Method
2.1 Development The method has been developed during the PARTNER-project. It basis predominantly on the experience with field testing at BRE’s (United Kingdom) and VDZ’s (Germany) premises.
2.2 Principle Two concrete cubes with 300 mm lateral length prepared with the aggregate combination under test are stored under real climatic conditions after one day in the mould and 27 days further curing. Thereby one cube is stored in a plastic tray filled with water and one cube is stored in air. Measurements of changes in dimension are made at periodic intervals up to a concrete age of at least 5 years. Possible cracking has to be assessed also. To promote any potential for ASR, the prisms are made with relatively high cement content and high alkali Portland cement, preferable the RILEM reference cement. A detailed description is given in Annex 1.
3 Work programme
3.1 Materials
3.1.1 Aggregates Since the field site testing is very time consuming not every aggregate combination selected for laboratory testing could be included in the field site tests. Thus 13 aggregate combinations have been pre-selected with respect to mineralogical properties and alkali-reactivity (see table 1 and 2). Information on all aggregate combinations included in the PARTNER program, the origin, the petrographic composition and the field performance are summarized in Annex 2. In some cases the coarse fraction was tested in combination with non-reactive sand N3 from Norway.

Copyright © PARTNER-project-GRD1-CT-2001-40103 All rights reserved
8
Table 1: Aggregates tested in the field site Abbreviation Origin Aggregate Fraction
B1
Western Belgium Silicified limestone
C F
D2
Denmark Sea gravel semi-dense flint
F
F1
France (Seine Valley)
Gravel with flint
C
F2
France Non-reactive limestone
C F
G1
Germany (Upper Rhine Valley)
Gravel with siliceous limestone and chert
C
It2
Italy (Piemont region)
Gravel with quartzite and gneiss
C F
N1
Norway (middle)
Cataclasite
C
N2
Norway (south east)
Sandstone
C
N3 Norway
(south west) Non reactive gravel with granites and gneisses
F
N4
Norway (south east)
Gravel with sandstone and catacl. rocks
C F
S1
Sweden Gravel with porphyritic rhyolite
C F
UK1
United Kingdom Greywacke
C F
P1
Portugal Silicified limestone
C
F = fine aggregate, C = coarse aggregate Several aggregate producers throughout Europe supplied the necessary quantities of aggregates. The distribution of the aggregates was organized by one laboratory per country. These laboratories also determined the particle size distribution and water absorption. The density of the aggregates was measured in two conditions where the aggregate was water saturated and had a dry surface and also after drying at 100 °C. The results were available on the PARTNER-homepage (www.partner.eu.com) for the laboratories in charge of concrete production.
3.1.2 Cement The RILEM standard cement CEM I 42,5 R provided by Norcem was used for preparing the concrete. The total alkali content of the cement is 1.26 % by weight sodium equivalent, the density was 3.12 g/m³. Due to the high alkali content an addition of sodium hydroxide to the mixing water to reach the requested alkali content of (1.25 ± 0.05) % by weight sodium equivalent in the cement was not necessary. The cement content was 440 kg/m³.
3.1.3 Admixtures In case of inappropriate workability of the concrete (slump < 20 mm) a superplasticizer provided by Ramboll was added to the concrete.

Copyright © PARTNER-project-GRD1-CT-2001-40103 All rights reserved
9
3.2 Concrete production
3.2.1 Concrete mixing and casting Thirteen different aggregate combinations were tested parallel to the laboratory concrete tests RILEM AAR-3 [1] and AAR-4 [2]. In order to ensure the comparability of test results, the concrete specimens for the field tests were produced together with the correspondent concrete specimens for the RILEM methods. Consequently the aggregate processing and composition as well as the fresh concrete composition and production for the field tests were according to the requirements of the RILEM test methods. In the case the quantity of concrete was too big for one batch several batches of the same composition were produced. In order to guarantee equal concrete quality the slump, the air content and the fresh concrete density were determined for each batch. In accordance with the standard RILEM concrete test methods AAR-3 [1] and AAR-4 [2] the aggregate combination consist of one of the following: - the fine and coarse test aggregates; - the fine test aggregate combined with non-reactive coarse aggregate; - the coarse test aggregate combined with non-reactive fine aggregate. The aggregate fractions were combined in volume proportions of 30 % fines (0 to 4 mm) and 70 % coarse aggregates: 30 % 4 to 10 mm and 40 % 10 to 20 mm. The concrete specimens were produced in different laboratories from different countries (see table 2). Table 2: Concrete production sites (Country) and quantities Laboratory Aggregate combination Number of cubes Norway N2 C + NR (N3F) 4
Sweden N1 C + NR (N3F) S1 C + F
12 10
United Kingdom
B1 C + NR (N3F) D2 F + NR (F2C) F1 C + NR (N3F) UK1 C + F
10 10 4
10
Germany
B1 C + F F2 C + F G1 C + NR (N3F) N4 C + F
10 10 6 6
Italy It2 C + F P1 C + NR (N3F)
4 4
F = fine test aggregate (≤ 4 mm), C = coarse test aggregate (> 4 mm), NR = non-reactive fine or coarse aggregate After the concrete production two concrete cubes with 300 mm lateral length were casted and compacted in steel moulds at (20 ± 2) °C and (65 ± 5) % relative humidity. The concrete cubes were demoulded after 24 ± 0.5 hours and stored in a room at (20 ± 2) °C for 6 days. To avoid loss of water they were covered with moist fabric or stored at ≥ 95 % relative humidity. Afterwards the moist fabric were removed and the cubes were put in a room at (20 ± 2) °C and at (65 ± 5) % relative humidity for 21 days. After 28 days of curing reference studs were glued on the concrete surface or in the concrete.
3.2.2 Preparation for measurement To measure the change of dimension two pairs of reference discs were glued on the top surface and the two adjacent side faces. Figure 1 shows each position of the reference discs and the measuring directions.

Copyright © PARTNER-project-GRD1-CT-2001-40103 All rights reserved
10
200 mm
200 mm
200
mm
Water
200 mm
200
mm
Water
top surface side face No. 1 side face no. 2 (adjacent to side face No. 1)
Figure 1: Positions of reference discs on concrete cube surfaces
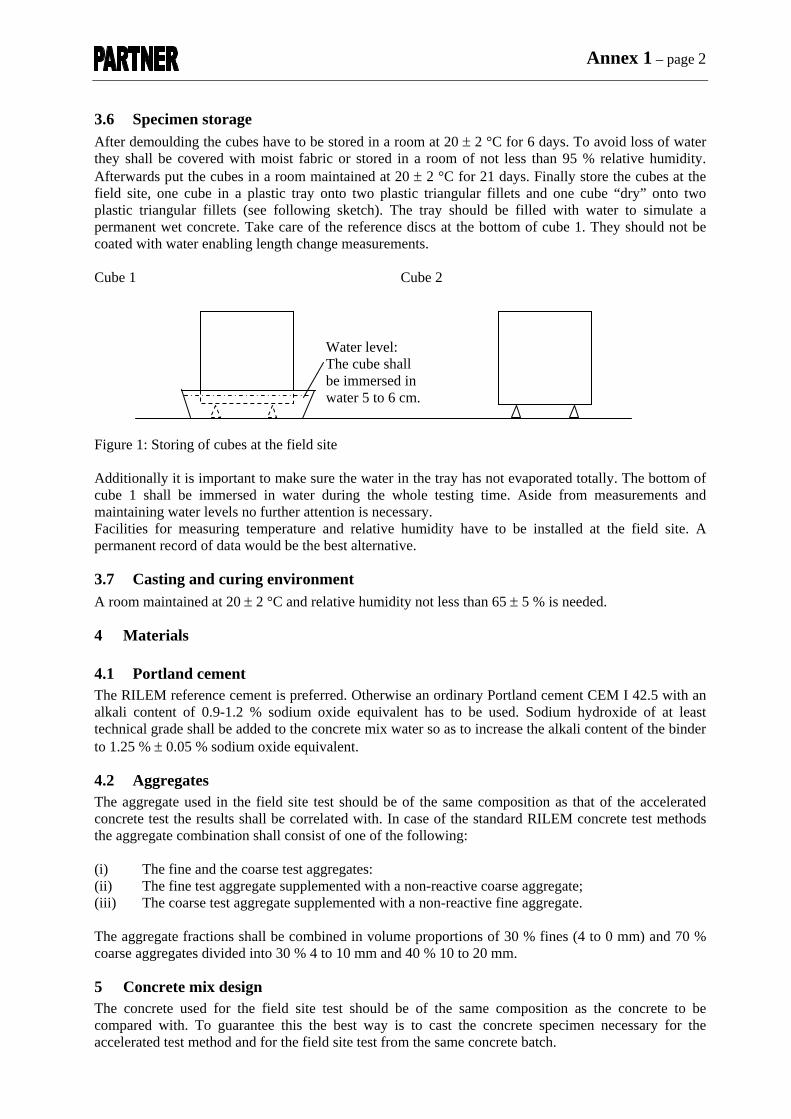
3.2.3 Specimen storage After 28 days the cubes were stored at the field site, one cube “wet” in a plastic tray on two plastic triangular fillets and one cube “dry” on two plastic triangular fillets in the air (see figure 2). The tray was filled with water to simulate a permanent wet concrete, so that the bottom of cube 1 was immersed 5 to 6 cm in water during the whole testing time. The reference discs at the bottom of cube 1 were always above water level enabling length change measurements.
Cube 1 Cube 2
Water level: The cubes are immersed in water 5 to 6 cm.
Figure 2: Storage of cubes at the field site If a cube had to be send to other field sites/laboratories, this was done after curing the cubes for 6 days in a room maintained at (20 ± 2) °C and at ≥ 95 % relative humidity. The cubes were transported on a wooden palette and covered with a plastic foil to avoid direct water contact during transport. The cubes should arrive at the test sites 26 days after casting. At the test sites the cubes were stored in room at (20 ± 2) °C until final preparation for measuring length changes. All cubes were stored in the same direction in relation to the compass rose (see figure 3). The edge of the cubes limiting both adjacent side faces prepared for measuring dimension changes are oriented to the west. The reason is to minimize deviations between the labs resulting from different exposure to direct solar radiation as it can be observed at affected structures.

Copyright © PARTNER-project-GRD1-CT-2001-40103 All rights reserved
11
Cube (top view)N
OW
S
Side faces with studs
Figure 3: Orientation of cubes
3.3 Field site testing
3.3.1 Field site selection The original goal for the selection of the field sites was to cover principally all climates in Europe, where ASR has caused damage to concrete structures. Even some specimens were stored beneath a highway in Sweden. The additional influence of alkali supply from outside under severe conditions could be studied. The final choice of sites and a brief description of their climate according to the classification by Köppen are summarized in table 3. Table 3: Field sites and climatic classification
Field site (Participant) Climate abbreviation Climate classification by Köppen
Trondheim, Norway Cfc, close to Dfb
Maritime temperate climate with moderate humidity and mild temperature, relatively cold summer
Brevik, Norway Dfb Boreal forest climate with moderate humidity, cold winter and relatively warm summer
Borås, Sweden Dfb Boreal forest climate with moderate humidity, cold winter and relatively warm summer
Highway between Boras and Gothenbourg, Sweden
Dfb Boreal forest climate with moderate humidity and relatively warm summer, additional alkali supply due to salting the highway
Watford, United Kingdom
Cfb Maritime temperate climate with moderate humidity and mild temperature
Düsseldorf, Germany Cfb Maritime temperate climate with moderate humidity and mild temperature
Milano, Italy Cfb, close to Cfa
Maritime temperate climate close to humid subtropical climate with moderate humidity and relatively warm to hot summer
Valencia-Paterna, Spain Csa Mediterranean climate with wet winter and dry summer The climate classification by Köppen is one of the most widely used climate classification systems. It is based on the concept that native vegetation is the best expression of climate, thus climate zone boundaries have been selected with vegetation distribution in mind. It combines average annual and monthly temperatures and precipitation, and the seasonality of precipitation. The Köppen climate classification scheme divides the climates into five main groups and several types and subtypes. Each particular climate type is represented by a 2 to 4 letter symbol. For further information see Annex 3.
Copyright © PARTNER-project-GRD1-CT-2001-40103 All rights reserved
12
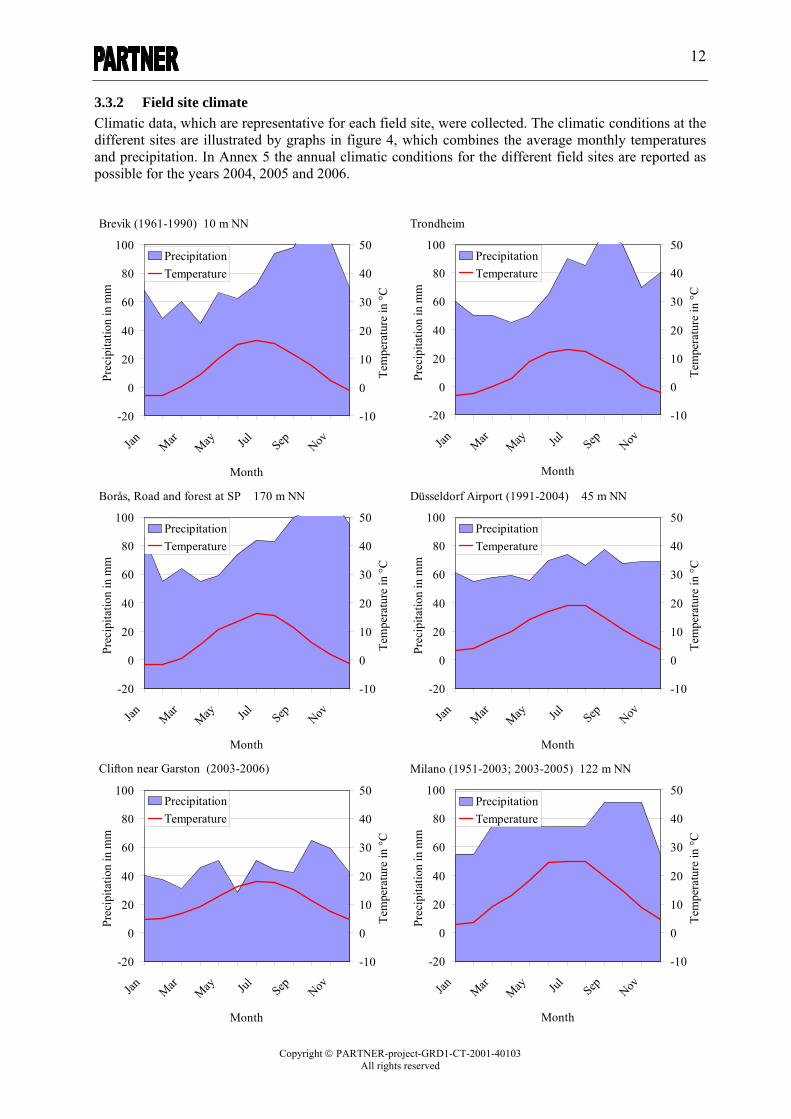
3.3.2 Field site climate Climatic data, which are representative for each field site, were collected. The climatic conditions at the different sites are illustrated by graphs in figure 4, which combines the average monthly temperatures and precipitation. In Annex 5 the annual climatic conditions for the different field sites are reported as possible for the years 2004, 2005 and 2006.
-20
0
20
40
60
80
100
Jan MarMay Jul Sep Nov
Month
Prec
ipita
tion
in m
m
-10
0
10
20
30
40
50
Tem
pera
ture
in °C
PrecipitationTemperature
Brevik (1961-1990) 10 m NN
-20
0
20
40
60
80
100
Jan MarMay Jul Sep Nov
Month
Prec
ipita
tion
in m
m-10
0
10
20
30
40
50
Tem
pera
ture
in °C
PrecipitationTemperature
Trondheim
-20
0
20
40
60
80
100
Jan MarMay Jul Sep Nov
Month
Prec
ipita
tion
in m
m
-10
0
10
20
30
40
50
Tem
pera
ture
in °C
PrecipitationTemperature
Borås, Road and forest at SP 170 m NN
-20
0
20
40
60
80
100
Jan MarMay Jul Sep Nov
Month
Prec
ipita
tion
in m
m
-10
0
10
20
30
40
50
Tem
pera
ture
in °C
PrecipitationTemperature
Düsseldorf Airport (1991-2004) 45 m NN
-20
0
20
40
60
80
100
Jan MarMay Jul Sep Nov
Month
Prec
ipita
tion
in m
m
-10
0
10
20
30
40
50
Tem
pera
ture
in °C
PrecipitationTemperature
Clifton near Garston (2003-2006)
-20
0
20
40
60
80
100
Jan MarMay Jul Sep Nov
Month
Prec
ipita
tion
in m
m
-10
0
10
20
30
40
50
Tem
pera
ture
in °C
PrecipitationTemperature
Milano (1951-2003; 2003-2005) 122 m NN

Copyright © PARTNER-project-GRD1-CT-2001-40103 All rights reserved
13
-20
0
20
40
60
80
100
Jan MarMay Jul Sep Nov
Month
Prec
ipita
tion
in m
m
-10
0
10
20
30
40
50
Tem
pera
ture
in °C
PrecipitationTemperature
Paterna - Valencia (1994-2003) 142 m NN
Figure 4: Average monthly temperatures and precipitation of different European destinations near the field sites with time of survey and height above sea level
3.3.3 Transport to field site The original plan was to produce all concretes until end of March 2004 and store them finally at field site until the end of April 2004. For most of the concretes this time schedule could be met. Only at one production site some cubes had to be produced later. Table 4 includes all the data about the production date and the final storage of the cubes. Table 4: Production and final storage of cubes
Selected types of agggregateBRE SINTEF NORCEM SP VDZ CESI AIDICO
Sample no. Details Combination GB N N S D I ESDate of prod. 27.01.04 27.01.04 27.01.04 27.01.04Date of storage 24.02.04 26.02.04 24.02.04 24.02.04Date of prod. 06.04.04 07.04.04 6+7.04.04 07.04.04 07.04.04Date of storage 17.05.04 18.05.04 14.05.04 14.05.04 17.05.04Date of prod. 02.03.04 02.03.04 03.03.04 04.03.04Date of storage 17.05.04 18.06.04 22.04.04 07.04.04Date of prod. 15.03.04 15.03.04Date of storage 17.05.04 14.05.04Date of prod. 29.01.04 29.01.04 29.01.04 29.01.04Date of storage 26.02.04 26.02.04 26.02.04 26.02.04Date of prod. 05.02.04 05.02.04 05.02.04Date of storage 04.03.04 04.03.04 04.03.04Date of prod. 18.02.04 18.02.04Date of storage 17.03.04 17.03.04Date of prod. 21.01.04 21.01.04 21.01.04 21.01.04 21.01.04Date of storage 18.02.04 18.02.04 18.02.04 18.02.04 18.02.04Date of prod. 28.01.04 28.01.04Date of storage 25.02.04 25.02.04Date of prod. 03.02.04 03.02.04 03.02.04Date of storage 02.03.04 02.03.04 02.03.04Date of prod. 11.11.03 11.11.03 11.11.03 11.11.03Date of storage 09.12.03 09.12.03 09.12.03 09.12.03Date of prod. 23.02.04 24.02.04 24/25.02.04 25.02.04Date of storage 17.05.04 18.06.04 22.04.04 06.04.04Date of prod. 23.02.04 23.02.04Date of storage 22.03.04 22.03.04Total no. of tests: 6 5 6 14 6 6 7
The concrete were produced together with the concrete for AAR-3 or ARR-4 testingsmall delay (within 1 month)big delay (2 to 4 month)
UK1 Greywacke
N1 Cataclasite
B1 Silicified limestone C+NR
F+NR
Laboratory/country
C+F
Task
N2 Sandstone
Non reactive limestone
G1 Gravel with siliceous limestone and chert
It2 Gravel with quartzite and gneiss
F2
P1 Silicified limestone
N4 Gravel with sst and catacl. rocks
S1 Gravel with porphyritic rhyolite
C+F
C+NR
B1 Silicified limestone
D2 Sea gravel semi-dense flint
F1 Gravel with flint
C+NR
C+NR
C+F
C+F
C+NR
C+F
C+NR
C+F
3.3.4 Testing at field site For detection of possible deterioration due to ASR the dimensions of the cubes at the top surface and two adjacent side faces and the crack width were determined periodically (first 2½ years every three month, afterwards every half year) – see figure 1. In Norway and Sweden it was not possible to measure

Copyright © PARTNER-project-GRD1-CT-2001-40103 All rights reserved
14
in the winter due to snow and frost. The increase in dimensions of the cubes was calculated for each period of measurement from the difference between the initial comparator measurement. Thereby it was differentiate between the diagonal dimensions on the surface, the horizontal dimensions and the vertical dimensions on the side faces. In total 100 cubes were produced for 50 tests at 8 different field sites. 7 aggregate combinations/ concretes are stored at least under 5 different environmental conditions. Thus the results of the laboratory tests can be compared with appropriate field experience representing Europe’s climatic conditions. The remaining 6 concretes are tested at least at 2 different sites.
3.4 Data collection and compilation Excel files for reporting the data were produced and were available at the PARTNER-homepage for all laboratories. At the production sites the fresh concrete data had been filled in the original file and saved according to an agreed filing system. Once a year the data were inquired and checked by the task-leader. In June 2005 a new “zero” measurement was necessary after one year of exposure because some laboratories had problems with the determination of dimension changes of the cubes or the use of the provided result files. Since the cubes are stored at the field sites only for 2½ years and expansion due to ASR hardly occurred, it was agreed that the field sites test will be continue at least until the beginning of 2009.

Copyright © PARTNER-project-GRD1-CT-2001-40103 All rights reserved
15
4 Results
4.1 Fresh concrete properties The fresh concrete properties of each batch used in the production of the blocks are compiled in table 5. The same concrete was used in the production of the laboratory concrete specimens. Additionally, if used, the quantity of superplasticizer is mentioned. Except for (N2 C+NR) no superplasticizer was used. Table 5: Fresh concrete properties
Aggregate combination/concrete Property [Unit] B1
C+ F
B1 C+ NR
D2 F+ NR
F1 C+ NR
F2 C+ F
G1 C+ NR
It2 C+ F
N1 C+ NR
N2 C+ NR
N4 C+ F
S1 C+ F
UK1C+ F
P1 C+ NR
Labora-tory VDZ BRE BRE BRE VDZ VDZ CESI SP Nor-
cem VDZ SP BRE CESI
No. of batches 2 10 5 2 2 2 4 2 4 2 2 4 4
Slump [cm]
5 5
6 7 7 6
n.d. n.d. 5
n.d. n.d. n.d.
12 12 12 12 n.d.
12 12
10 (s)13 (s)
5 12 (s)
16 n.d. 12
n.d.
9 10
6 6 5 6
13 (s) 16 (s)
13 15
5 4 4 5
n.d.
10 n.d. 10
n.d.
Air content [%]
0.9 0.8
0.4 0.4 0.4 0.4 n.d. n.d. 0.4 n.d. n.d. n.d.
0.3 0.3 0.3 0.3 n.d.
0.4 0.4
1.5 1.5
1.2 1.2
1.0 n.d. 1.0 n.d.
0.7 0.8
2.0 1.9 1.9 2.0
1.5 1.5
1.0 0.9
0.5 0.4 0.5 0.5
n.d.?
0.9 n.d. 0.9 n.d.
Density [t/m³]
2.35 2.34
2.39 2.39 2.38 2.38 n.d. n.d. 2.39 n.d. n.d. n.d.
2.41 2.41 2.41 2.41 n.d.
n.d.
2.30 2.31
2.34 2.34
2.35 2.33
2.39 n.d. 2.38 n.d.
2.39 2.38
2.3 2.3
2.34 2.33
2.34 2.35
2.34 2.33
2.42 2.42 2.40 2.40 n.d.
2.36 n.d. 2.36 n.d.
Super- plasti-cizer [kg/m³]
0 0
0 0 0 0
n.d. n.d 0
n.d. n.d. n.d.
0 0 0 0
n.d.
n.d.
0 0
0 0
0 0
0 0 0 0
0 0
0.62 0.62 0.62 0.62
0 0
0 0
0 0 0 0
n.d.
0 0 0 0
(s) = sheared off n.d. = not determined/reported to field test laboratory

Copyright © PARTNER-project-GRD1-CT-2001-40103 All rights reserved
16
4.2 Expansion and cracking At the editorial deadline in July 2006 the samples were exposed in the field site for approximately 2½ years. The current state of the maximum length change and the maximum crack width of the cubes are summarized for each aggregate combination/concrete and field site in table 6 for “wet” storage and table 7 for “dry” storage. After one year of exposure a new “zero” measurement was necessary because some laboratories had problems with the determination of dimension changes of the cubes or the use of the provided result files. Due to the different starting conditions compared to the previous testing in the first year expansion values in the range of ± 0.04 % should be reliable until expansion due to ASR occurs. Expansion due to ASR should be accompanied by characteristic cracking with crack width ≥ 0.20 mm and/or exudations on the surface of the cubes. Extensive expansion > 0.04 % which occurred since the new “zero” measurement in June 2005 and cracks ≥ 0.20 mm which occurred in 2½ years of testing are highlighted in table 6 (see orange values). The exceeding of the limits is an indication that a deleterious ASR took place. Probably a deleterious ASR has occurred in cubes B1(C+F) and B1(C+NR) independent of the type of storage. Some values of the concretes D2(F+NR), G1(C+NR), N1(C+NR) and N2(C+NR) are indicating that a deleterious ASR is possibly being to take place. At this time no further conclusion can be taken. The small cracks with a width of 0.05 mm that are visible at most cubes are presumably due to shrinkage. Different climatic conditions representative for Europe were covered in order to take into account the influence of different environmental conditions in practice. At this stage no influence of the environ-mental conditions is obvious. In the case of concrete B1(C+F) and B1(C+NR) no distinctions is visible. The dry stored specimens were showing more signs of reaction than partly wet stored specimens.

Copyright © PARTNER-project-GRD1-CT-2001-40103 All rights reserved
17
Table 6: Maximum values of expansion and crack width of cubes stored in water filled trays in the field site Water storage Laboratory/country
BRE SIN-
TEFNOR-CEM
SPForest
SP Road
VDZ CESI AIDI-CO
Sample no.
Details Combina-tion
Data GB N N S S D I ES
Cracks 0.30 0.10 0.10 0.25 0.05B1
Silicified limestone
C+F Exp. 0.064 0.038 0.022 0.135 0.077
Cracks n. d. 0.00 0.10 0.20 0.30B1
Silicified limestone
C+NR Exp. n. d. 0.024 0.072 0.132 0.057
Cracks n. d. 0.00 0.05 0.05 0.05D2
Sea gravel semi-dense flint
F+NR Exp. n. d. 0.000 0.011 0.005 0.110
Cracks n. d. 0.05 F1
Gravel with flint
C+NR Exp. n. d. 0.01
Exp. 0.00 0.05 0.05 0.05 0.00F2
Non-reactive limestone
C+F Cracks 0.022 0.004 0.005 0.006 0.011
Cracks 0.00 0.05 0.00 G1
Gravel with siliceous limestone and chert
C+NR Exp. 0.005 0.050 0.066
Cracks 0.00 0.05 It2
Gravel with quartzite and gneiss
C+F Exp. 0.014 0.017
Cracks n. d. 0.00 0.05 0.10 0.05 0.05N1
Cataclasite
C+NR Exp. n. d. 0.004 0.009 0.004 0.018 0.070
Cracks n. d. 0.20 N2
Sandstone
C+NR Exp. n. d. 0.012
Cracks 0.00 0.05 0.00 N4
Gravel with sandstone and catacl. rocks
C+F Exp. 0.012 0.005 0.017
Cracks 0.00 0.05 0.05 0.05 0.00S1
Gravel with porphyritic rhyolite
C+F Exp. 0.018 0.006 0.002 0.010 0.021
Cracks n. d. 0.00 0.05 0.05 0.00UK1
Greywacke
C+F Exp. n. d. 0.000 0.006 0.003 0.024
Cracks 0.05 0.00 P1
Silicified limestone
C+NR Exp. 0.005 0.016
Exp. = maximum expansion of cubes in % that occurred after the new “zero” measurement in June 2005 Cracks = maximum crack width of cubes in mm that occurred in 2½ years of testing n. d. = no data provided

Copyright © PARTNER-project-GRD1-CT-2001-40103 All rights reserved
18
Table 7: Maximum values of expansion and crack width of cubes stored “dry” in the field site Dry storage Laboratory/country
BRE SIN-
TEFNOR-CEM
SPForest
SP Road
VDZ CESI AIDI-CO
Sample no.
Details Combina-tion
Data GB N N S S D I ES
Cracks 0.30 0.10 0.10 0.30 0.25B1
Silicified limestone
C+F Exp. 0.082 0.066 0.045 0.152 0.083
Cracks n. d. 0.00 0.15 0.35 0.20B1
Silicified limestone
C+NR Exp. n. d. 0.021 0.116 0.210 0.117
Cracks n. d. 0.00 0.05 0.05 0.20D2
Sea gravel semi-dense flint
F+NR Exp. n. d. 0.000 0.012 0.007 0.113
Cracks n. d. 0.05 F1
Gravel with flint
C+NR Exp. n. d. 0.01
Exp. 0.00 0.05 0.05 0.05 0.00F2
Non-reactive limestone
C+F Cracks 0.017 0.001 0.004 0.007 0.017
Cracks 0.00 0.05 0.00 G1
Gravel with siliceous limestone and chert
C+NR Exp. 0.004 0.060 0.054
Cracks 0.00 0.0 It2
Gravel with quartzite and gneiss
C+F Exp. 0.016 0.017
Cracks n. d. 0.00 0.10 0.10 0.05 0.10N1
Cataclasite
C+NR Exp. n. d. 0.001 0.008 0.006 0.017 0.092
Cracks n. d. 0.20 N2
Sandstone
C+NR Exp. n. d. 0.002
Cracks 0.00 0.05 0.00 N4
Gravel with sandstone and catacl. rocks
C+F Exp. 0.018 0.005 0.013
Cracks 0.00 0.05 0.05 0.05 0.00S1
Gravel with porphyritic rhyolite
C+F Exp. 0.016 0.000 0.003 0.008 0.027
Cracks n. d. 0.00 0.05 0.05 0.00UK1
Greywacke
C+F Exp. n. d. 0.001 0.017 0.001 0.029
Cracks 0.05 0.00 P1
Silicified limestone
C+NR Exp. 0.011 0.013
Exp. = maximum expansion of cubes in % that occurred after the new “zero” measurement in June 2005 Cracks = maximum crack width of cubes in mm that occurred in 2½ years of testing n. d. = no data provided
5 Discussion / interpretation The field site tests should provide a correlation between the behaviour of possibly alkali reactive aggregates in concrete stored under real climatic conditions and according to accelerated concrete and mortar test procedures. Since the focus of the whole work is to advance and establish predominantly the RILEM test methods, concrete compositions comparable to these methods were tested in the field site. Table 8 summarizes final test results of different European aggregates according to RILEM AAR-2, AAR -3 and AAR -4 and under real climatic conditions. Additionally table 9 presents a brief outline of these test methods and their limits for expansion and crack width to evaluate the aggregates reactivity. The data for the classification of the aggregates reactivity according to table 9 were taken from the reports 3.3 [4] and 3.2 [5].
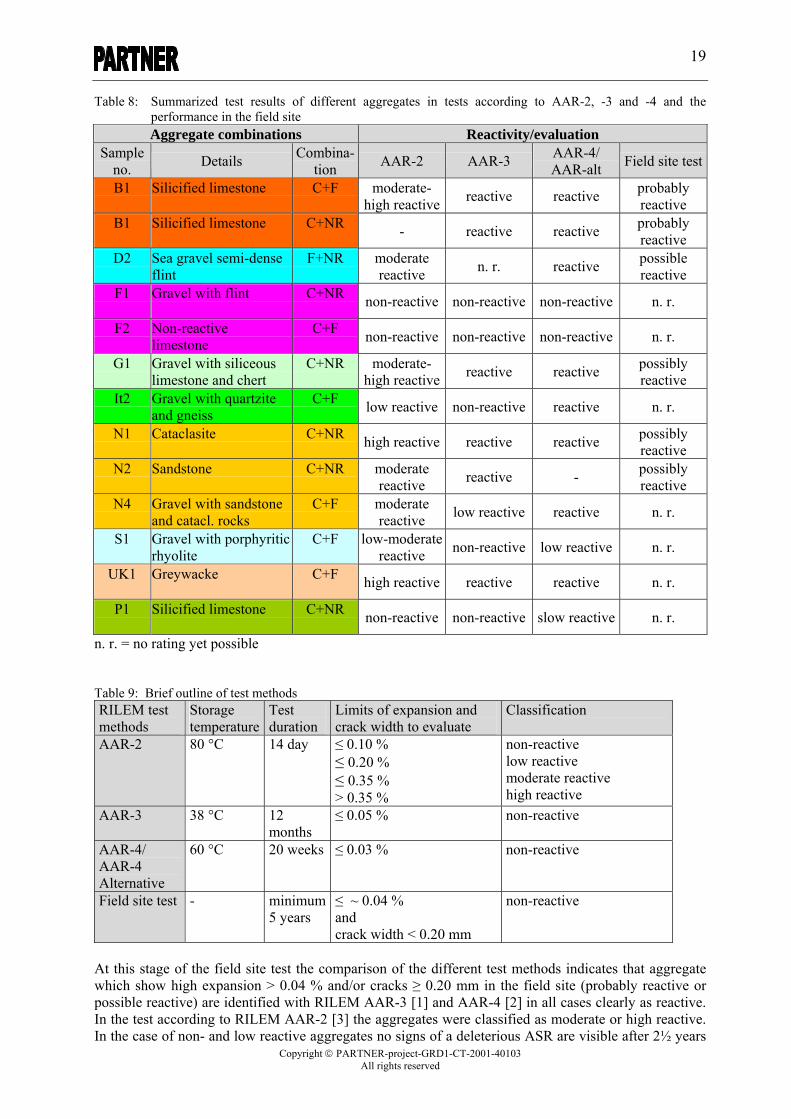
Copyright © PARTNER-project-GRD1-CT-2001-40103 All rights reserved
19
Table 8: Summarized test results of different aggregates in tests according to AAR-2, -3 and -4 and the performance in the field site Aggregate combinations Reactivity/evaluation
Sample no. Details Combina-
tion AAR-2 AAR-3 AAR-4/ AAR-alt Field site test
B1
Silicified limestone
C+F
moderate- high reactive reactive reactive probably
reactive B1
Silicified limestone
C+NR - reactive reactive probably
reactive D2
Sea gravel semi-dense flint
F+NR
moderate reactive n. r. reactive possible
reactive F1
Gravel with flint
C+NR non-reactive non-reactive non-reactive n. r.
F2
Non-reactive limestone
C+F non-reactive non-reactive non-reactive n. r.
G1
Gravel with siliceous limestone and chert
C+NR
moderate- high reactive reactive reactive possibly
reactive It2
Gravel with quartzite and gneiss
C+F low reactive non-reactive reactive n. r.
N1
Cataclasite
C+NR high reactive reactive reactive possibly
reactive N2
Sandstone
C+NR
moderate reactive reactive - possibly
reactive N4
Gravel with sandstone and catacl. rocks
C+F
moderate reactive low reactive reactive n. r.
S1
Gravel with porphyritic rhyolite
C+F
low-moderatereactive non-reactive low reactive n. r.
UK1
Greywacke
C+F high reactive reactive reactive n. r.
P1
Silicified limestone
C+NR non-reactive non-reactive slow reactive n. r.
n. r. = no rating yet possible Table 9: Brief outline of test methods RILEM test methods
Storage temperature
Test duration
Limits of expansion and crack width to evaluate
Classification
AAR-2 80 °C 14 day ≤ 0.10 % ≤ 0.20 % ≤ 0.35 % > 0.35 %
non-reactive low reactive moderate reactive high reactive
AAR-3 38 °C 12 months
≤ 0.05 % non-reactive
AAR-4/ AAR-4 Alternative
60 °C 20 weeks ≤ 0.03 % non-reactive
Field site test - minimum 5 years
≤ ~ 0.04 % and crack width < 0.20 mm
non-reactive
At this stage of the field site test the comparison of the different test methods indicates that aggregate which show high expansion > 0.04 % and/or cracks ≥ 0.20 mm in the field site (probably reactive or possible reactive) are identified with RILEM AAR-3 [1] and AAR-4 [2] in all cases clearly as reactive. In the test according to RILEM AAR-2 [3] the aggregates were classified as moderate or high reactive. In the case of non- and low reactive aggregates no signs of a deleterious ASR are visible after 2½ years

Copyright © PARTNER-project-GRD1-CT-2001-40103 All rights reserved
20
of outdoors exposure. Some of these aggregates tested in accordance to AAR-3 and AAR-4 were sometimes classified different by some laboratories and by the two test methods. The first written classification was found in more cases.
6 Comments on the method Due to the long duration of field site tests these methods are not suitable for testing in practical life and absolutely necessary to prove the reliability of accelerated test methods.
7 Conclusion This report describes the results of tests carried out under Work Package 3.5 (Field Site Test). In July 2006 the samples were exposed in the field sites for approximately 2½ years. This time is to short for many dense and low reactive aggregates to cause a deleterious ASR in concrete, so that every conclusion made in this report has to be considered of preliminary character. To provide a final correlation and evaluation the field site tests has to be continued at least for 2½ years until the end of 2008. Unfortunately problems with the determination of dimension changes of the cubes or the use of the provided result file occurred so that a new “zero” measurement after approximately 12 month was necessary. Due to that, length change and cracking should be both always taken into account when evaluating the reactivity and respectively the behaviour of the aggregates under real climate conditions. During the project duration only one aggregate (silicified limestone) showed a distinct sign of a deleterious ASR. The reactivity of this aggregate was also confirmed by the RILEM recommended methods AAR-2, AAR-3 and AAR-4. After 2 ½ years of testing some other samples with moderate to high reactive aggregates showed probably some small indications of a deleterious ASR. At this stage no influence of the environmental condition is obvious. Dry stored specimens were showing more signs of reaction than partly wet stored specimens.
8 References [1] RILEM TC 106-AAR: Alkali-aggregate reaction - Recommendations - B -TC106-3 (now AAR-3)
- Detection of potential alkali-reactivity of aggregates - Method for aggregate combinations using concrete prisms, Materials & Structures, 33, No 229, 290-293, 2000.
[2] RILEM Recommended Test Method TC-106-4 (now AAR-4): Detection of potential alkali-
reactivity of aggregates: Accelerated (60oC) concrete prism test, RILEM TC191-ARP Committee Draft to be published in Materials and Structures, 2006.
[3] RILEM Recommended Test Method AAR-1, Detection of Potential Alkali-Reactivity of Aggregates: Petrographic Method, Materials & Structures, 36, No 261, 2003, 480-496. [4] Nixon, P.; Lane, S.: Experience from testing the alkali reactivity of European aggregates
according to several concrete prism test methods. Report no 3.3, 2006. [5] Jensen, J.: Experience from testing of the alkali reactivity of European aggregates according to the
RILEM AAR-2 method. Report no 3.2, 2006

Annex 1 – page 1
Test procedure and notes for field site tests
1 Scope The field site test is aiming at providing a correlation between the behaviour of possibly alkali reactive aggregates in concrete stored under real climatic conditions and according to accelerated concrete tests of alkali reactivity in the laboratory, e.g. RILEM AAR-3 or AAR-4 test method.
2 Principle Two concrete cubes with 300 mm lateral length prepared with the aggregate under test are stored under real climatic conditions after one day in the mould and 27 days further curing. Thereby one cube is stored in a plastic tray filled with water and one cube in air. Measurements of changes in dimension are made at periodic intervals up to a concrete age of at least 5 years. Possible cracking has to be assessed also. To promote any potential for ASR, the prisms are made with a relatively high cement content and a high alkali Portland cement, preferable the RILEM reference cement.
3 Apparatus
3.1 Mould Two steel moulds suitable for casting concrete cubes with a lateral length of 300 mm shall be used where possible. If steel moulds are not available, moulds with non-hygroscopic surface are allowed.
3.2 Reference studs and glue As reference studs non-corroding metallic measuring discs or reference studs have to be glued on the concrete surface or in the concrete after 28 days curing before storing the cubes at the field site. Good experience has been made with ”Kugelplättchen” (disc diameter: 10 mm; integrated ball diameter: 1/16 inch). They can be ordered from: Fritz Staeger Measuring device for material testing Postbox 47 03 63 D-12312 Berlin A good glue named ”Schnellklebstoff X60” consisting of two components can be ordered from: Hottinger Baldwin Measurements HBM (www.hbm.com) Information, e.g. the nearest supplier or technical data, can be found at the mentioned website (search for “X60”)
3.3 Length comparator The length comparator should be such as to accommodate the shape of the reference studs glued on the cube. The standard gauge of the length comparator should be 200 mm wide. The gradation of comparator shall not be greater than 0.002 mm and the error throughout the range of traverse shall be no more than 0.005 mm.
3.4 Standard length gauge This shall consist of an Invar rod with ends machined to accommodate the reference studs.
3.5 Concrete mixing and casting equipment This shall be suitable for mixing batches and vibrating the concrete with a vibrator in the moulds or onto a vibrating table.
Annex 1 – page 2
3.6 Specimen storage After demoulding the cubes have to be stored in a room at 20 ± 2 °C for 6 days. To avoid loss of water they shall be covered with moist fabric or stored in a room of not less than 95 % relative humidity. Afterwards put the cubes in a room maintained at 20 ± 2 °C for 21 days. Finally store the cubes at the field site, one cube in a plastic tray onto two plastic triangular fillets and one cube “dry” onto two plastic triangular fillets (see following sketch). The tray should be filled with water to simulate a permanent wet concrete. Take care of the reference discs at the bottom of cube 1. They should not be coated with water enabling length change measurements. Cube 1 Cube 2
Figure 1: Storing of cubes at the field site
Water level: The cube shall be immersed in water 5 to 6 cm.
Additionally it is important to make sure the water in the tray has not evaporated totally. The bottom of cube 1 shall be immersed in water during the whole testing time. Aside from measurements and maintaining water levels no further attention is necessary. Facilities for measuring temperature and relative humidity have to be installed at the field site. A permanent record of data would be the best alternative.
3.7 Casting and curing environment A room maintained at 20 ± 2 °C and relative humidity not less than 65 ± 5 % is needed.
4 Materials
4.1 Portland cement The RILEM reference cement is preferred. Otherwise an ordinary Portland cement CEM I 42.5 with an alkali content of 0.9-1.2 % sodium oxide equivalent has to be used. Sodium hydroxide of at least technical grade shall be added to the concrete mix water so as to increase the alkali content of the binder to 1.25 % ± 0.05 % sodium oxide equivalent.
4.2 Aggregates The aggregate used in the field site test should be of the same composition as that of the accelerated concrete test the results shall be correlated with. In case of the standard RILEM concrete test methods the aggregate combination shall consist of one of the following: (i) The fine and the coarse test aggregates: (ii) The fine test aggregate supplemented with a non-reactive coarse aggregate; (iii) The coarse test aggregate supplemented with a non-reactive fine aggregate. The aggregate fractions shall be combined in volume proportions of 30 % fines (4 to 0 mm) and 70 % coarse aggregates divided into 30 % 4 to 10 mm and 40 % 10 to 20 mm.
5 Concrete mix design The concrete used for the field site test should be of the same composition as the concrete to be compared with. To guarantee this the best way is to cast the concrete specimen necessary for the accelerated test method and for the field site test from the same concrete batch.

Annex 1 – page 3
6 Preparation of test specimen If necessary, add the sodium hydroxide to the mixing water before mixing, ensuring all is dissolved before use. Cast two cubes with a lateral length of 300 mm, after casting compact the concrete with a vibrator in the mould or onto a vibrating table. Cure the concrete in the mould at 20 ± 2 °C and relative humidity of not less than 90 % under moist covers for 24 ± 0.5 hours.
7 Storage and Measurement Storage See paragraph 3.6. Preparation for measurement 28 days after casting the cubes have to be prepared for measuring dimension changes in a room maintained at 20 °C. Two pairs of reference discs have to be glued on the top surface and two adjacent side faces. The following sketch shows each position of the reference discs and the measuring directions. In order to avoid that the reference discs fall off the concrete has to be ”roughened”. This can be done using a hammer and a chisel.
d2 = 20
0 mm
d1 = 200 mm
h1 = 200 mm
v1 =
200
mm
immersion depth of the cube in water
h2 = 200 mm
v2 =
200
mm
immersion depth of the cube in water
top surface side face No. 1 side face no. 2 (adjacent to side face No. 1)
Figure 2: Positions of reference discs on concrete cube surfaces A further possibility is to drill holes into the cubes and glue the reference studs in it. The following sketch shows the principle.
Figure 3: Reference stud glued into the concrete (hole about 6 mm in diameter and 10 mm in depth)
Initial measurement After hardening of the glue, measure the initial distances (see figure 1) in a room maintained at 20°C. For each cube they should be documented as follows.
1) Diagonal dimension No. 1 on the top surface: Ld1/0 = 2) Diagonal dimension No. 2 on the top surface: Ld2/0 = 3) Vertical dimension side face No. 1: Lv1/0 = 4) Horizontal dimension side face No. 1: Lh1/0 = 5) Vertical dimension side face No. 2: Lv2/0 = 6) Horizontal dimension side face No. 2: Lh2/0 =
After the initial measurement the cubes have to be stored carefully in the final position at the field site.

Annex 1 – page 4
Standard length measurements The length measurements have to be repeated every three months in the first year and every 6 months in the following years. They have to be done at the field site. Measuring should not be undertaken during periods of extreme temperature (cold or hot). If possible it is preferred that measurements are undertaken at the same approximate time in the day, i.e. mid morning. Before measuring the reference discs have to be cleaned to guarantee precise accommodation to the measuring device. The figures have to be documented as follows.
1) Diagonal dimension No. 1 on the top surface: Ld1/t = 2) Diagonal dimension No. 2 on the top surface: Ld2/t = 3) Vertical dimension side face No. 1: Lv1/t = 4) Horizontal dimension side face No. 1: Lh1/t = 5) Vertical dimension side face No. 2: Lv2/t = 6) Horizontal dimension side face No. 2: Lh2/t =
Where t is the time in month the concrete cubes are stored outside. Also the occurrence of cracking and gel exudations shall be noted at every measuring date. If cracks are visible measure the crack width with a crack width gauge and document the figures (if appropriate, a photo should be taken and saved digitally). At last the temperature and the relative humidity have to be measured and reported.
8 Expression and reporting results Calculate the increase in dimensions of the cube for each period of measurement from the difference between the initial comparator measurement Lxx/0. Differentiate thereby between the diagonal dimensions on the surface, the horizontal dimensions and the vertical dimensions on the side faces as follows.
Firstly calculate the following mean values: Diagonal dimensions: Ldm/0 = (Ld1/0 + Ld2/0)/2 Ldm/t = (Ld1/t + Ld2/t)/2 Vertical dimensions: Lvm/0 = (Lv1/0 + Lv2/0)/2 Lvm/t = (Lv1/t + Lv2/t)/2 Horizontal dimensions: Lhm/0 = (Lh1/0 + Lh2/0)/2 Ldm/t = (Lh1/t + Lh2/t)/2
where m is a synonym for mean value and t the time in month the concrete cubes are stored outside.
Secondly calculate the change of dimensions in percent: Diagonal change: Ldt = ((Ldm/t - Ldm/0) / Ldm/0) * 100 Vertical change: Lvt = ((Lvm/t - Lvm/0) / Lvm/0) * 100 Horizontal change: Lht = ((Lhm/t – Lhm/0) / Lhm/0) * 100
where m is a synonym for mean value and t the time in month the concrete cubes are stored outside.
Finally report the values, increase and decrease, to the nearest 0.001 %. In order to make the cracking assessable give the cube marks according to the following table.
Stage of damage (Ct) Characteristic Crack width 0 no damage - 1 isolated fine cracks < 0.2 mm 2 single fairly coarse cracks 0.2 – 0.5 mm 3 several fairly coarse cracks 0.2 – 1.0 mm 4 severe cracking > 1 mm
Report the stage of damage as Ct = 1 for example, where t is the time in month the concrete cubes are stored outside. Also the measured climatic data, especially the temperature and the relative humidity, have to be reported. They are necessary to assess, whether upcoming expansion is caused by swelling or temperature changes or induced by ASR.

Annex 1 – page 5
Note – Field Site Test Method This note contains some of the key-elements, which have to be observed when performing this test. For further details consult the test-method (see www.partner.eu.com/index.htm). Outline In the PARTNER-project the field site tests are aiming at providing information on the correlation between the behaviour of aggregates or aggregate combinations in the RILEM concrete test methods and under real climatic conditions. The tests will be carried out in selected climatic zones through Europe. Cement The reference cement supplied by the project (Norcem) has to be used. The total alkali content of the cement is 1.26 % by mass of sodium equivalent, the density is 3.12 g/cm³. The cement content shall be 440 kg/m³. No addition of sodium hydroxide is required in this test programme. Aggregates The RILEM concrete test methods will be performed most frequently through the PARTNER-project. Therefore the aggregate combinations to be tested in the field site tests shall be composed of the same quantities of different aggregate fractions. The accurate quantities can be found in the test procedures regarding the RILEM concrete test methods. Since field site testing is very time consumable not every aggregate combination used in the project can be tested under real field site conditions. For this reason some aggregate combinations are preselected. The combinations under test are listed in the test programme table at the end of this document. Reference discs The labs responsible for performing the field site tests are in charge of providing the reference discs or reference studs. They should be of such a shape that good accommodation to the available measuring device is guaranteed through the test programme. Concrete mix design The concrete used for the field site tests shall be of the same composition as the concrete for the RILEM test methods (AAR-3, AAR-4 and AAR-4 alt.; marked with yellow in the testing plan for these three methods) Consequently the best method is to prepare the concrete for this test methods and the field site tests in one batch where ever possible. Thus the recommendations for concrete mix design and mixing of concrete for the RILEM concrete test methods are valid for the field site tests, too. Mix method and curing If the mixer capacity is to low at the lab concerned the whole concrete necessary for all specimens shall be produced in several batches with the same composition. The mixing time has to be the same for every batch in that case. Slump/flow, density and air content shall be determined for every batch. The results should be reported on the results sheet. After demoulding the reference number according to the guideline has to be written onto the cubes. For example, a plastic with the reference number written on it can be put in place after vibration and therefore fastened by the hydrated concrete. If cubes have to be send to other field sites/laboratories, this has to be done after curing the cubes for 6 days in a room maintained at 20 ± 2 °C and at least 95 % relative humidity. In doing so place the cubes on a wooden palette and cover them with a plastic foil to avoid direct water contact during transport. The cubes shall arrive at the foreseen test sites 26 days after casting the latest. Once there the cubes have to be stored in room maintained at 20 ± 2 °C until final preparation for measuring length changes 28 days after casting (see test procedure).

Annex 1 – page 6
The distribution plan for the cubes is included in the test programme table. The data concerning the fresh concrete properties (see result sheets) has to be distributed also to the different labs performing the field site tests. In order to compile and report the data the task leader will inquire the result sheets if necessary. The field site tests results have to be reported only at the end of the project. But the tests are planned to go on further so that additional reports might to be prepared after the PARTNER-project. Calculation of quantities Below an estimation of quantities for one 30-cm-cube can be found. These quantities are only to give a rough idea of what you have to handle. The definite quantities for concrete production have to be calculated with an calculation tool (Excel-sheet) prepared by the WP3-leader and using the aggregate properties determined by the aggregate suppliers. Both, the aggregate properties and the calculation tool can be found at the PARTNER-homepage. Concrete quantities which have to be considered are:
• Concrete for the cubes for field site testing according to the testing plan (27 l concrete for one cube)
• Concrete for specimen as described in the RILEM concrete test methods (yellow shaded fields at the test programme)
• Concrete for the determination of fresh concrete properties (slump/flow test, density and air content of the fresh concrete)
• Some concrete for safety (10 % safety should be enough) Quantities for one cube (27 l):
440 kg/m³ Cement = 11.9 kg (12 kg) 706 kg/m³ 20-10 mm aggregate = 19.1 kg (20 kg) 530 kg/m³ 10-4 mm aggregate = 14.3 kg (15 kg) 530 kg/m³ 4-0 mm aggregate = 14.3 kg (15 kg)
Test plan Normally two cubes per test have to be stored at the lab’s premises. In the case of SP sometimes four cubes have to be stored. Two cubes directly in Boras (cold and humid) and two cubes at the field site near the highway between Boras and Gothenbourg (cold, humid and alkalis from outside).
BRE SINTEF NORCEM SP VDZ CESI AIDICOSample no. Details Combination GB N N S D I ES
Casting X (10)Field site tests X (2) X (4) X (2) X (2)Casting X (10)Field site tests X (2) X (2) X (2) X (2) X (2)Casting X (10)Field site tests X (2) X (2) X (4) X (2)Casting X (4)Field site tests X (2) X (2)Casting X (10)Field site tests X (2) X (4) X (2) X (2)Casting X (6)Field site tests X (2) X (2) X (2)Casting X (4)Field site tests X (2) X (2)Casting X (12)Field site tests X (2) X (2) X (4) X (2) X (2)Casting X (4)Field site tests X (2) X (2)Casting X (6)Field site tests X (2) X (2) X (2)Casting X (10)Field site tests X (2) X (4) X (2) X (2)Casting X (10)Field site tests X (2) X (2) X (4) X (2)Casting X (4)Field site tests X (2) X (2)Total no. of tests 6 5 6 14 6 6 7 50
Field site testing The concrete shall be produced together with the concrete for ARP-3 or ARP-4 testingThe figures in brackets indicate the number of cubes to be casted or tested at the lab
C+F
C+F
C+NR
C+F
C+NR
C+F
C+F
C+NR
B1 Silicified limestone
D2 Sea gravel semi-dense flint
F1 Gravel with flint
C+NR
C+NR
P1 Silicified limestone
N4 Gravel with sst and catacl. rocks
S1 Gravel with porphyritic rhyolite
N2 Sandstone
Non reactive limestone
G1 Gravel with siliceous limestone and chert
It2 Gravel with quartzite and gneiss
F2
Laboratory/country
5
Selected types of agggregate
Task
C+F
No. of tests
5
5
3
2
6
5
B1 Silicified limestone C+NR
F+NR
2
5
2
UK1 Greywacke
N1 Cataclasite
2
3
5
Measurement of relative humidity (RH) The moisture content (RH) within the cubes should be measured in the end of the project period (autumn 2005). A procedure for these measurements will be prepared later in the project.

Annex 2 – page 1
Petrographic composition and field performance of the aggregates tested Aggregate
combination Origin Brief petrographic description Reported alkali reactivity
B1 (C+F) Western Belgium
Crushed silicified, dark-grey argillaceous limestone with fossil debris; reactive mineral is crypto-microcrystalline quartz with sometimes fibrous habit.
Aggregate has caused damage in several concrete structures such as bridges and water structures.
D1 (C+F) Denmark Glaciofluvial gravel containing white to creamy white opaline flint; reactive mineral is opal.
Aggregate has produced severe deterioration in all types of concrete structures (can be very quick under severe conditions, clear pessimum effect).
D2 (C+F) Denmark
Sea dredged, polymictic gravel originally derived from glaciofluvial sediments, main component of interest is partly porous dense chalcedonic flint, in smaller amounts pure porous chalcedonic flint is included; reactive mineral is chalcedony.
Dense porous flint is considered to be non reactive, porous flint to be reactive. Aggregate has produced severe deterioration in all types of concrete structures (normally after 10-15 years). Not as severe as D1.
D3 (F) Denmark No description available yet. No deterioration reported.
F1 (C) France (Seine Valley)
Polymictic river gravel, mainly composed of flint/cherts; reactive mineral is micro-cryptocrystalline quartz.
Is in France considered to be potentially reactive but with clear pessimum effect. No evidence of damage in structures.
F2 (C+F) France Fine grained limestone with some fossils; no reactive minerals. Non-reactive.
F3 (C+F) France (Rhine Valley)
Polymictic river gravel (partly crushed), mainly composed of quartzite, alkali reactive constituents are flint, greywacke and granitoids; reactive minerals are micro-cryptocrystalline quartz and strained, highly metamorphically sutured quartz.
No deterioration reported.
G1 (C)
Germany (Upper Rhine
Valley)
Partly crushed polymictic river gravel, considerable variation in constituent lithologies, aggregates of interest are silicified limestone and chert; reactive minerals are micro- to cryptocrystalline quartz and chalcedony.
Considered to be reactive, concrete pavements with this aggregate have been deteriorated due to ASR. (Damage observed after 10 years under very severe conditions).
G2 (C) Northern Germany
Polymictic gravel from glaciofluvial deposit, alkali reactive due to opaline sandstone (with tridymite/christobalite) and flint (with crypto-crystalline quartz and chalcedony).
Has produced severe deterioration, very quickly, in concrete structures. No damage observed after introduction of national regulations.
It 1 (C+F)
Italy (Marche region in central Italy)
Polymictic river gravel, containing mainly micritic limestone, but also silicified limestone, flint, chert and strained quartz; reactive minerals are micro- to cryptocrystalline quartz and strained, high metamorphically sutured quartz).
Quick reaction (5-10 years) observed in all types of concrete structures.

Annex 2 – page 2
Aggregate
combination Origin Brief petrographic description Reported alkali reactivity
It2 (C+F) Italy
(Piemont region)
Polymictic river gravel, aggregate of interest is fine grained quartzite with strained quartz; reactive mineral is strained highly metamorphically sutured quartz.
Considered to be reactive, slowly (one example is 50 years old water constructions).
N1 (C) Norway (middle)
Crushed cataclasite, homogeneous and fine-grained, feldspar particles lie scattered within a matrix of about 0.02 mm grain size; reactive mineral is crypto- to microcrystalline quartz.
Used as concrete material. Has caused severe damage in local areas (e.g. 11 years old airport pavement).
N2 (C) Norway (south east)
Crushed sandstone, homogeneous and fine grained, with a sediment grain size ranging between 0.05 and 0.5 mm. These variously sized particles are embedded in a fine grained matrix; reactive mineral is crypto- to microcrystalline quartz.
Used as concrete material. Has caused severe damage in local areas (damage observed in bridges and dams after 15 to 20 years).
N3 (C+F) Norway (south
western)
Natural gravel/sand from a glaciofluvial deposit, originally composed of Precambrian crystalline rocks, consists of granites and gneisses; no reactive constituents.
No damage reported.
N4 (C+F) Norway (south east)
Natural gravel/sand from a moraine deposit.; Sandstones, siltstones and cataclastic rocks are reactive rocks; reactive mineral is crypto- to microcrystalline quartz.
Used as concrete material. The coarse fraction has caused moderate damage, if the humidity and the alkali content are high (e.g. 20-25 years old constructions, mainly bridges).
N5 (C+F) Norway (south)
Sand and coarse gravel from a glaciofluvial deposit. Rhyolite and fine grained quartzite are reactive rocks; reactive mineral is microcrystalline-fine grained quartz.
Used as concrete material. The coarse fraction has caused moderate damage, if the humidity and the alkali content is high (e.g. 20-25 years old constructions, mainly bridges).
N6 (C+F) Norway (south)
Sand and coarse gravel from a glaciofluvial deposit. The reactive rocks are mainly argillaceous rocks and sandstones in addition to small amounts of hornfels, rhyolite and mylonite. Reactive mineral is crypto- to microcrystalline quartz.
Used as concrete material. The coarse fraction has caused moderate damage, if the humidity and the alkali content are high (e.g. 20-25 years old constructions, mainly bridges).
P1 (C) Portugal Crushed, poorly silicified limestone; reactive minerals could be micro- or cryptocrystalline quartz.
Similar limestone, probably with higher content of silica, has caused damage in several concrete structures like bridges and dams.
S1 (C+F) Sweden
Polymictic glaciofluvial gravel and sand, primarily composed of meta-rhyolite and granite, aggregates of interest are meta-rhyolite and greywacke; reactive minerals are micro- or cryptocrystalline quartz or chalcedonic quartz.
Similar aggregate used as concrete material has caused moderate damage. The source is variable in composition.
UK1 (C+F) United Kingdom
Crushed greywacke, poorly sorted; reactive minerals are micro- or cryptocrystalline quartz, possibly volcanic glass.
Concrete with this aggregate has demonstrated high damage at moderate to high alkali levels in many real structures (more than 20 years until observed damage).

Annex 2 – page 3
Aggregate
combination Origin Brief petrographic description Reported alkali reactivity
UK2 (C+F) United Kingdom
Polymictic mature river gravel and sand, composed primarily of metaquartzite, ortho-quartzite, quartz (vein) and chert, which is the reactive portion in the aggregate; reactive minerals are micro- or cryptocrystalline or chalcedonic quartz.
Both, fine and coarse constituents have demonstrated high reactivity at moderately high alkali levels in many real structures, mainly bridges (damage after 10 to 15 years).
E1 (F) Spain
Dolostone with prismatic dolomite chrystals cemented with calcite, also opal and clay are apparent in considerable amounts, reactive mineral is opal.
Serious damage (due to ASR?) reported in 30 years old precast element (big water pipe).
C = coarse aggregate (> 4 mm); F = fine aggregate (≤ 4 mm)

Annex 3 – page 1
The Köppen climate classification GROUP A: Tropical/Megathermal climates Tropical climates are characterized by constant high temperature (at sea level and low elevations) — all twelve months of the year have average temperatures of 18 °C or higher. GROUP B: Dry (Arid and semiarid) climates These climates are characterized by the fact that precipitation is less than potential evapotranspiration. GROUP C: Temperate/Mesothermal climates These climates have an average temperature above 10 °C in their warmest months, and a coldest month average between −3 °C and 18 °C. The second letter indicates the precipitation pattern:
o w indicates dry winters (driest winter month average precipitation less than one-tenth wettest summer month average precipitation; one variation also requires that the driest winter month have less than 30 mm average precipitation),
o s indicates dry summers (driest summer month less than 30 mm average precipitation and less than one-third wettest winter month precipitation) and
o f means significant precipitation in all seasons (neither above mentioned set of conditions fulfilled).
The third letter indicates the degree of summer heat: o a indicates warmest month average temperature above 22 °C, o b indicates warmest month average temperature below 22 °C, with at least 4 months averaging
above 10 °C, o c means 3 or fewer months with mean temperatures above 10 °C.
Group C climates are subdivided as follows:
o Mediterranean climates (Csa, Csb): These climates usually occur on the western sides of continents between the latitudes of 30° and 45° (though on the west coast of North America, they occur in small patches as far north as 48°). These climates are in the polar front region in winter, and thus have moderate temperatures and changeable, rainy weather. Summers are hot and dry, due to the domination of the subtropical high pressure systems, except in the immediate coastal areas, where summers are milder due to the nearby presence of cold ocean currents.
o Humid Subtropical climates (Cfa, Cwa): These climates usually occur in the interiors of continents, or on their east coasts, between the latitudes of 25° and 40°. Unlike the Mediterranean climates, the summers are humid due to unstable tropical air masses, or onshore Trade Winds.
o Maritime Temperate climates (Cfb, Cwb): Cfb climates usually occur on the western sides of continents between the latitudes of 45° and 55°; they are typically situated immediately poleward of the Mediterranean climates. In western Europe, this climate occur in coastal areas up to 62° latitude. These climates are dominated all year round by the polar front, leading to changeable, often overcast weather. Summers are cool due to cloud cover, but winters are milder than other climates in similar latitudes.
o Maritime Subarctic climates (Cfc): These climates occur poleward of the Maritime Temperate climates, and are confined either to narrow coastal strips on the western poleward margins of the continents, or, especially in the Northern Hemisphere, to islands off such coasts.

Annex 3 – page 2
GROUP D: Continental/microthermal climate These climates have an average temperature above 10 °C in their warmest months, and a coldest month average below −3 °C (or 0 °C in some versions). These usually occur in the interiors of continents, or on their east coasts, north of 40° North latitude. Group D climates do not exist at all in the Southern hemisphere due to the smaller land masses here.
o The second and third letters are used as for Group C climates, while a third letter of d indicates 3 or fewer months with mean temperatures above 10 °C and a coldest month temperature below −38 °C.
o Warm Summer Continental or Hemiboreal climates (Dfb, Dwb, Dsb): Dfb and Dwb climates are immediately north of Hot Summer Continental climates, generally in the high 40s in latitude, and also in central and eastern Europe, between the Maritime Temperate and Continental Subarctic climates, where it extends up to high 50s and even lowest 60 degrees latitude.
GROUP E: Polar climates These climates are characterized by average temperatures below 10 °C in all twelve months of the year.

Annex 4 – page 1
Photos of field sites VDZ, Düsseldorf, Germany
SP, Highway between Borås and Gothenbourg, Sweden

Annex 4 – page 2
SP, Forest Site, Sweden
SINTEF, Trondheim, Norway
AIDICO, Valencia-Paterna, Spain

Annex 4 – page 3
CESI, Milano, Italy
NORCEM, Brevik, Norway
BRE, Watford, England
missing

Annex 5 – page 1
Annual climate data Year 2004
-20
0
20
40
60
80
100
Jan MarMay Jul Sep Nov
Month
Prec
ipita
tion
in m
m
-10
0
10
20
30
40
50
Tem
pera
ture
in °C
PrecipitationTemperature
Brevik (2004) 10 m NN
-20
0
20
40
60
80
100
Jan MarMay Jul Sep Nov
MonthPr
ecip
itatio
n in
mm
-10
0
10
20
30
40
50
Tem
pera
ture
in °C
PrecipitationTemperature
Trondheim
-20
0
20
40
60
80
100
Jan MarMay Jul Sep Nov
Month
Prec
ipita
tion
in m
m
-10
0
10
20
30
40
50
Tem
pera
ture
in °C
PrecipitationTemperature
Milano (2004) 122 m NN
-20
0
20
40
60
80
100
Jan MarMay Jul Sep Nov
Month
Prec
ipita
tion
in m
m
-10
0
10
20
30
40
50
Tem
pera
ture
in °C
PrecipitationTemperature
Düsseldorf Airport (2004) 45 m NN
-20
0
20
40
60
80
100
Jan MarMay Jul Sep Nov
Month
Prec
ipita
tion
in m
m
-10
0
10
20
30
40
50
Tem
pera
ture
in °C
PrecipitationTemperature
Paterna - Valencia 142 m NN
-20
0
20
40
60
80
100
Jan MarMay Jul Sep Nov
Month
Prec
ipita
tion
in m
m
-10
0
10
20
30
40
50
Tem
pera
ture
in °C
PrecipitationTemperature
Clifton near Garston (2004)
Sweden, Boras is missing

Annex 5 – page 2
Year 2005
-20
0
20
40
60
80
100
Jan MarMay Jul Sep Nov
Month
Prec
ipita
tion
in m
m
-10
0
10
20
30
40
50
Tem
pera
ture
in °C
PrecipitationTemperature
Brevik (2005) 10 m NN
-20
0
20
40
60
80
100
Jan MarMay Jul Sep Nov
Month
Prec
ipita
tion
in m
m
-10
0
10
20
30
40
50
Tem
pera
ture
in °C
PrecipitationTemperature
Sep. to Dec. taken from average temperatur
Trondheim (2005)
-20
0
20
40
60
80
100
Jan MarMay Jul Sep Nov
Month
Prec
ipita
tion
in m
m
-10
0
10
20
30
40
50
Tem
pera
ture
in °C
PrecipitationTemperature
Milano (2005) 122 m NN
-20
0
20
40
60
80
100
Jan MarMay Jul Sep Nov
Month
Prec
ipita
tion
in m
m
-10
0
10
20
30
40
50
Tem
pera
ture
in °C
PrecipitationTemperature
Düsseldorf Airport (2005) 45 m NN
-20
0
20
40
60
80
100
Jan MarMay Jul Sep Nov
Month
Prec
ipita
tion
in m
m
-10
0
10
20
30
40
50
Tem
pera
ture
in °C
PrecipitationTemperature
Paterna - Valencia 142 m NN
-20
0
20
40
60
80
100
Jan MarMay Jul Sep Nov
Month
Prec
ipita
tion
in m
m
-10
0
10
20
30
40
50Te
mpe
ratu
re in
°C
PrecipitationTemperature
Clifton near Garston (2005)
Sweden, Boras is missing

Annex 5 – page 3
Year 2006
-20
0
20
40
60
80
100
Jan MarMay Jul Sep Nov
Month
Prec
ipita
tion
in m
m
-10
0
10
20
30
40
50
Tem
pera
ture
in °C
PrecipitationTemperature
Brevik (2006) 10 m NN
-20
0
20
40
60
80
100
Jan MarMay Jul Sep Nov
Month
Prec
ipita
tion
in m
m
-10
0
10
20
30
40
50
Tem
pera
ture
in °C
PrecipitationTemperature
Jan. to Mar. taken from average temperatur
Trondheim (2006)
-20
0
20
40
60
80
100
Jan MarMay Jul Sep Nov
Month
Prec
ipita
tion
in m
m
-10
0
10
20
30
40
50
Tem
pera
ture
in °C
PrecipitationTemperature
Milano (2006) 122 m NN
-20
0
20
40
60
80
100
Jan MarMay Jul Sep Nov
Month
Prec
ipita
tion
in m
m
-10
0
10
20
30
40
50
Tem
pera
ture
in °C
PrecipitationTemperature
Düsseldorf Airport (2006) 45 m NN
Spain, Valencia is missing
-20
0
20
40
60
80
100
Jan MarMay Jul Sep Nov
Month
Prec
ipita
tion
in m
m
-10
0
10
20
30
40
50Te
mpe
ratu
re in
°C
PrecipitationTemperature
Clifton near Watford (2006)
Sweden, Boras is missing