Exploring Indigenous Knowledge, Community Resilience and ...
EXPLORING THE DYNAMICS
OF RESILIENCE IN
AN ELEMENTARY SCHOOL
Saundra Murray Nettles
University of Maryland and Johns Hopkins University
and
Frances P. Robinson, Principal
Stanton Elementary School, Washington, D.C.
Report No. 26
October 1998
Published by the Center for Research on the Education of Students Placed At Risk (CRESPAR),
supported as a national research and development center by funds from the Office of Educational
Research and Improvement, U.S. Department of Education (R-117-D400005). The opinionsexpressed in this publication do not necessarily reflect the position or policy of OERI, and no official
endorsement should be inferred.

iii
The Center
Every child has the capacity to succeed in school and in life. Yet far too many
children, especially those from poor and minority families, are placed at risk by schoolpractices that are based on a sorting paradigm in which some students receive
high-expectations instruction while the rest are relegated to lower quality education andlower quality futures. The sorting perspective must be replaced by a “talent development”
model that asserts that all children are capable of succeeding in a rich and demandingcurriculum with appropriate assistance and support.
The mission of the Center for Research on the Education of Students Placed At Risk(CRESPAR) is to conduct the research, development, evaluation, and dissemination needed
to transform schooling for students placed at risk. The work of the Center is guided by threecentral themes — ensuring the success of all students at key development points, building
on students’ personal and cultural assets, and scaling up effective programs — andconducted through seven research and development programs and a program of institutional
activities.
CRESPAR is organized as a partnership of Johns Hopkins University and HowardUniversity, in collaboration with researchers at the University of California at Santa Barbara,
University of California at Los Angeles, University of Chicago, Manpower DemonstrationResearch Corporation, University of Memphis, Haskell Indian Nations University, and
University of Houston-Clear Lake.
CRESPAR is supported by the National Institute on the Education of At-Risk
Students (At-Risk Institute), one of five institutes created by the Educational Research,Development, Dissemination and Improvement Act of 1994 and located within the Office
of Educational Research and Improvement (OERI) at the U.S. Department of Education.The At-Risk Institute supports a range of research and development activities designed to
improve the education of students at risk of educational failure because of limited Englishproficiency, poverty, race, geographic location, or economic disadvantage.

v
Abstract
This report describes a framework for exploring the processes of resilience in
students at Stanton Elementary School, an urban public school in Washington, D.C.CRESPAR investigators invited Stanton to participate in a study of exposure to stress,
including violence, and its relationship to psychosocial and school success, and agreed tobecome one of the school’s community partners and provide information for purposes of
professional development and continuous school improvement.
The first section of the report describes the current environment in the school and the
community; the second discusses Stanton’s evolving resilience approach; and the thirdpresents the conceptual framework that links school improvement to student resilience. The
report concludes with reflections on the benefits of the approach for Stanton’s communityof students, family, and staff and considers implications for adapting the framework in other
school settings.

vii
Acknowledgments
The authors gratefully acknowledge the faculty, staff, parents, and community
partners of Stanton Elementary School and the CRESPAR research assistants assigned to theschool. Their able and enthusiastic contributions have enriched Stanton’s students and
inspired us.

1
Introduction
Inner-city schools are populated by many students eager to learn and succeed
academically despite the chronic stress of poverty and the conditions that can accompanylack of resources. Such schools can represent places of hope within communities whose
vitality is tested daily by violence, poor health of residents, lack of political clout,deteriorating and boarded-up housing, and substance abuse. An extensive tradition of
research on the schools these students attend has been conducted with the intent ofidentifying effective instructional practices and effective schools.
A more recent body of research on resilience provides a context for examining howindividual students respond to risk. Resilience is usually defined as an individual’s
successful response to risk (Rutter, 1987) and, according to Masten (1994) and Masten, Best,& Garmezy (1990), the term can be applied to three kinds of phenomena: 1) overcoming
odds against successful development, 2) sustained competence in the presence of acute orchronic life stressors, or 3) recovery from trauma. In the school context, resilient outcomes
are indicated by academic, social, and emotional competence.
Some recent formulations describe resilience as a property of organizations, such asschools and families (Anderson, 1994). Likewise, protective factors and processes can be
characteristics of persons and environments. Factors or processes are protective if theycontribute to good outcomes in individuals at risk (Rutter, 1987). In students, research has
identified many protective factors; among them are cognitive competence (particularlyreading), social competence, faith and optimism, a sense of responsibility toward others, and
the ability to plan.
Research, as reviewed by Benard (1991), has shown that protective school
environments foster protective characteristics in children — the very characteristics thatcontribute to children’s resilience — by establishing high expectations for student
achievement; providing opportunities for participation so that students can be activelyengaged in instructional work and in roles of responsibility within the school; and providing
caring and support through relations with school faculty and staff, peers, and family andcommunity members involved with the school.
In recent years, studies of resilience and research on effective schools have
contributed to a reconsideration of ways in which the school can foster competence inchildren and youths (Benard, 1991; Henderson & Milstein, 1996; Nettles & Pleck, 1994;
North Central Regional Educational Laboratory, 1994; Wang & Gordon, 1994; Zimmerman

2
& Arunkumar, 1994). This report describes a framework for exploring the processes of
resilience in students at Stanton Elementary School, an urban public school in Washington,D.C. The impetus for the Stanton framework was a March 1995 meeting of the coauthors
and Dr. Hope Hill, also of the Center for Research on the Education of Students Placed AtRisk (CRESPAR). At the meeting, the CRESPAR investigators invited Stanton to participate
in a study of exposure to stress, including violence, and its relationship to psychosocial andschool success. The principal, who began her administration at the start of the 1995-96
school year, described faculty and staff efforts that were consistent with a resilienceapproach. Subsequent meetings with faculty and parents presented CRESPAR investigators
with opportunities to engage in conversations about the constructs and processes that wouldbe explored in the research and the ways in which the research could augment the school’s
existing plans and activities. However, faculty in particular expressed concerns about hostinga research project rather than an intervention to alleviate some pressing problems that
persisted in some segments of the student population. To address these concerns, CRESPARagreed to become one of the school’s community partners and provide information for
purposes of professional development and continuous school improvement.
The first section of the report describes the current environment in the school and thecommunity, and the second discusses Stanton’s evolving resilience approach. The third part
presents the conceptual framework that links school improvement to student resilience. Weconclude with reflections on the benefits of the approach for Stanton’s community of
students, family, and staff and consider implications for adapting the framework in otherschool settings.
The School and Its Community
The School
Stanton Elcommercialized area bordered by three major thoroughfares. As of February 1998, there were
620 students enrolled. According to the school’s Title I Local School Improvement Plan, Update
1997-98, about 42% of the students are enrolled in prekindergarten, kindergarten, or first grade.
All of the students are African American, and the median household income for the schoolcatchment area is $12,000. Approximately 98% of the students are on the free or reduced lunch
program. The school has a principal and a vice-principal, 29 teachers, one full-time counselor,a librarian, one building resource teacher who serves as the change facilitator, nine educational

3
aides, a Title I Parent Coordinator, a part-time psychologist, and
cafeteria, and maintenance staff).
Stanton School has a history of engagement in two concurrent efforts towardcreating a caring, supportive environment with high expectations for student success. First,
since 1995, the school has undertaken activities which are components of the Comer process(Comer, 1985). The school is still designated a Comer school, and many of the outcomes
that the Comer process is intended to achieve overlap with outcomes observed in studies ofresilient children (see for example, Winfield, 1991; Werner, 1990; Nettles & Pleck, 1994).
Although there has not been a formal evaluation of the Comer process at Stanton, when theresilience framework was introduced in the Spring 1996 semester, major elements of the
Comer process were in place, namely community partners and the site-based schoolimprovement team consisting of parents, faculty, and a mental health worker.
Second, the school had been identified during the 1996-97 school year as a targetedassistance school (that is, one needing program improvement to increase student
achievement). Title I funds provide programmatic activities to improve student learning. TheDistrict of Columbia Public Schools (equivalent to the state education agency, or SEA)
requires that the school consult with parents and submit a Title I improvement plan. Theplan which was approved for the 1996-97 school year outlined activities toward goals for
increased basic and advanced reading and mathematics competence, improved skills inwriting, problem solving, and higher order thinking, heightened parent and community
involvement, and enhanced professional staff development to reflect emerging reform issues.With the introduction of district-wide emphasis on improved reading and mathematics
performance, Stanton’s 1997-98 plan identified literacy as the number one priority.
The Community
Although Stanton serves students that come from low-income families, the schoolis located in a community that has diverse economic circumstances. According to the 1990
Census of Population and Housing, in the school’s zip code 23% of families had incomesabove $50,000; 29% had incomes between $25,000 and $49,999; and 47% had incomes
below $24,000. Thirty-one percent (31%) of families with children under 18 lived below thepoverty line; 42% of female-headed families with children under 18 lived below the poverty
line.
There is diversity in occupations and educational attainment. Twenty-three percent
(23%) were in executive, administrative, and professional specialty occupations. A

4
substantial minority (42%) were in the combined categories of administrative support
positions and service occupations. Of persons in the labor force, about 10% wereunemployed (nearly twice the national average in 1990). Of individuals 18 years and older,
35% had not graduated from high school; 33% were high school graduates; 21% had somecollege education; and 11% had college degrees or graduate and professional degrees.
A variety of housing types may be found in the neighborhood; 86% of the units are
occupied. Residents have pressed for economic development, and in 1997, a shopping centerwas built near the school. The center includes a large food store and several shops, such as
a shoe store. In addition, several fast food chains operate within the blocks surrounding theschool. The school staff and families have expressed concern about the extent of violence,
other crimes, and drugs near the school. In short, the school and its setting have sources ofprotection and sources of risk.
Applying the Resilience Approach
Stanton’s application of the resilience construct integrates and extends the Comer
process and the school improvement priorities of Title I/Chapter 1. As discussed below,Stanton is using three strategies to apply the resilience approach: 1) implementing activities
to increase resilience; 2) assessing paths to student resilience; and 3) increasing faculty, staff,and parent awareness about resilience and related constructs. We discuss each of the
strategies below.
Implementing Activities to Increase Resilience
Stanton is implementing two sets of activities to foster resilience in students:1) increasing available resources; and 2) mobilizing protective processes in the
environment. These are basic strategies used in many interventions, such as Head Start.Evidence of their effectiveness comes from research on the “ingredients” of resilience as
identified by Masten (1994). Among these ingredients are the risks or adversities theindividual faces and the individual and environmental characteristics that serve as protection
against risk. The following describes the specific ways in which the two strategies are beingimplemented at Stanton.
Increasing resources available to Stanton students. Increasing the resourcesavailable to students at risk is a basic activity for many schools. At Stanton, the activity

5
includes the assembly of resources from the school district as well as the development of
community partnerships. Stanton’s community partners provide materials, funds,programmatic activities, volunteers, and services on behalf of Stanton’s students. For
example, instruction in life skills is provided for fifth and sixth grade boys through thePreteen Pregnancy Prevention Program for Boys (sponsored by Concerned Black Men); a
Rites of Passage program for 20 fifth graders is sponsored by the Family Medical andCounseling Center; a mentoring program for 35 girls in grades five and six is conducted by
the community-based organization Naje/SAFE; and mentoring for sixth grade boys isprovided by PROJECT 2000, Inc.
The resources are distributed according to needs identified in plans developed by the
school staff and the school improvement team. During 1995-96, resources generated fromcommunity organizations were used primarily to renovate the physical plant. For example,
the Peace Corps and Trinity United Methodist Church, among others, painted bathrooms,the health suite, and the boiler room hallway. In 1996-97, physical improvements continued
with assistance from community partners; however, a sizeable share of community resourceswere targeted to either motivate students to excel in academic areas or to increase mastery
of reading and mathematics. During 1996-97 and 1997-98, additional community partnerswere recruited to provide, at each grade level, one-to-one tutoring or other forms of student
assistance to augment the reading and mathematics programs. For example, volunteers fromThe Pentagon (“Book Buddies”) provide weekly, one-to-one reading experiences for first
graders. One church partner conducts The Summer Intensive Reading Program for studentsin grades three through six and volunteers from a second church partner provide tutoring and
remediation in reading and other subjects during the school year. Incentives are offered bytwo local science and technical organizations, Diversified Engineers and SMART. The
Social Security Administration, through its national YouthLink Program, provided 60computers and software for access to the Internet. Community partners, such as The
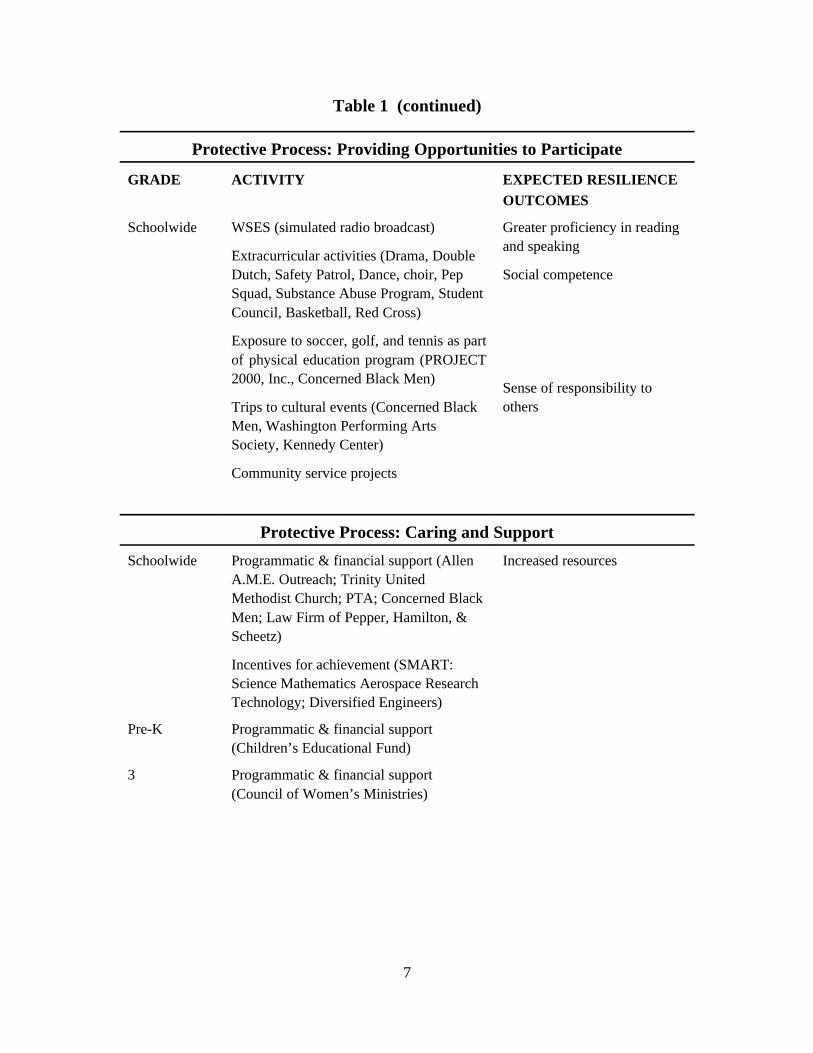
Pentagon Book Buddies, helped to wire the school. The resources and partners (shown inparentheses) are identified in Table 1.
Mobilizing protective processes. The second set of activities Stanton is using tofoster resilience in students is the enhancement of protection in the environment. The
activities, shown in Table 1, are grouped according to Benard’s (1991) three categories ofprotective processes: high expectations, opportunities to participate, and caring and support.
Because one of Stanton’s priority goals is to foster competence in academic areas,
especially reading, many activities which supplement existing instruction have been intro-

6
Table 1. Activities to Mobilize Protective Processes in the Environment
Protective Process: Establishing High Expectations
GRADE ACTIVITY EXPECTED RESILIENCEOUTCOMES
K-1 National Institute of Child Health (NICH) All reading activities:
1 Book Buddies (The Pentagon) Reading motivation, greater
2, 3 Sylvan Learning Systems, Inc. (Reading)proficiency in reading;movement of children frombelow basic reading levels tobasic level and above
3-6 Reading Resource Teacher
Summer Intensive Reading Program (AllenA.M.E. Church)
2-6 Tutoring and remediation (Trinity UnitedChurch; U.S. Navy Kids Program; Law firmof Pepper, Hamilton, & Scheetz)
5 Incentives for Science Achievement
1 D.C. Reads (Tutors from American
SchoolwideUniversity)
Computers/Internet Access (Social SecurityAdministration, NASA, Department ofTransportation)
Schoolwide Technology Program
Schoolwide Standards Specialist Coordinator(staff)
7
Table 1 (continued)
Protective Process: Providing Opportunities to Participate
GRADE ACTIVITY EXPECTED RESILIENCEOUTCOMES
Schoolwide WSES (simulated radio broadcast) Greater proficiency in reading
Extracurricular activities (Drama, DoubleDutch, Safety Patrol, Dance, choir, Pep Social competenceSquad, Substance Abuse Program, StudentCouncil, Basketball, Red Cross)
Exposure to soccer, golf, and tennis as partof physical education program (PROJECT2000, Inc., Concerned Black Men)
Trips to cultural events (Concerned BlackMen, Washington Performing ArtsSociety, Kennedy Center)
Community service projects
and speaking
Sense of responsibility toothers
Protective Process: Caring and Support
Schoolwide Programmatic & financial support (Allen Increased resourcesA.M.E. Outreach; Trinity UnitedMethodist Church; PTA; Concerned BlackMen; Law Firm of Pepper, Hamilton, &Scheetz)
Incentives for achievement (SMART:Science Mathematics Aerospace ResearchTechnology; Diversified Engineers)
Pre-K Programmatic & financial support(Children’s Educational Fund)
3 Programmatic & financial support(Council of Women’s Ministries)

8
Table 1 (continued)
Protective Process: Caring and Support
GRADE ACTIVITY EXPECTED RESILIENCEOUTCOMES
5 - 6 (girls) Mentors (Naje/SAFE) Social competence
6 (boys) Project 2000, Inc.
Conflict resolution/peer mediation (LawFirm of Pepper, Hamilton, & Scheetz)
Drug/Alcohol Program (Allen A.M.E.Outreach)
Substance Abuse Prevention Program(SAPE, Title IV funding)
4 Learning for Life (Boy Scouts of America)
5 Rites of Passage (Family Medical &Counseling Center)
4 - 6 Preteen Pregnancy Prevention Program forBoys (Concerned Black Men)
Schoolwide Parent Outreach Program Increased parental support for(Parents) children’s education
PTA, Parent Academy
Schoolwide Dissemination of Stanton Monthly Bulletin Higher morale among staff(Staff)

9
duced to increase students’ mastery experiences. Expected student outcomes include
enhanced self-efficacy and greater motivation for and proficiency in reading. Such activities,as shown in Table 1, are to mobilize the protective process of establishing high expectations.
For example, the kindergarten and first grade implemented a reading program developedthrough the National Institute for Child Health and Human Development. The program
emphasizes phonemic awareness, literature, and phonics. Volunteers (parents, grandparents,and community partners) participate in the program’s reading activities. In grades three
through six, the reading resource teacher conducts reading instruction in small groups of thelowest achievers. The Sylvan Reading Lab, a component of the Sylvan Learning Systems
program, serves students in the primary grades. The Lab includes special equipment for drilland phonics and for increased reading comprehension, and instruction consists of the Sylvan
curriculum, which focuses on basic reading skills.
The second protective process is providing opportunities to participate; the activitiesare shown in Table 1. One daily activity is Radio Station WSES (Wonderful Stanton
Elementary School). In keeping with the school’s focus on reading competence, this is afive-minute “broadcast” from the principal’s office to all classrooms in the school. Students
in Head Start through sixth grade rotate as announcers of school-wide news, birthdays ofstudents and staff, and reading of literary selections and thoughts or affirmations of the day.
The theme song for the broadcast is Ray Charles’ rendition of “America the Beautiful.”Other opportunities for participation include trips to cultural events (sponsored by
community partners) and extracurricular activities such as the student council, basketball,and a marching drum unit.
The third protective process is caring and support. As noted in the discussion of thefirst strategy, community partners provide programmatic and financial support. For example,
the law firm of Pepper, Hamilton, and Scheetz trains approximately 30 students per year inpeer conflict resolution. Also, the school has a Parent Outreach Program to increase parental
support for the children’s education.
Research shows that specific activities Stanton is using to enhance protective factors canbe effective. Forman et al. (1998) presented evidence of effectiveness for the reading instruction
approach that Stanton is using in kindergarten and grade one, but Mac Iver et al. (1998) foundin a two-year evaluation that the Sylvan Learning Systems program yielded mixed results. In the
Baltimore City Public Schools, students’ reading and math scores increased, but only the mathscores increased significantly. Nettles (1991a, 1991b) examined findings from evaluations of
community-related programs and found that such programs can foster resilience through the

10
provision of social support, resources, and instructional activities, such as tutoring. Hawkins et
al. (1992) have suggested that the strategy of enhancing protective factors may be aneffective one for alleviating problem behaviors, including substance use, risky sexual
behavior, and delinquency. Although the alleviation of such behaviors is not a direct goal,Stanton expects that the enhancement of resilience in the early grades will contribute to the
alleviation of problem behavior.
Assessing Paths to Student Resilience
The second strategy, assessment of factors associated with individual resilience, ispart of data collection in three Washington, D.C. schools in CRESPAR’s study of the
influence of perception of violence and other stress on school-related outcomes. Studentparticipants were enrolled in third and fourth grades in 1996-97 and attended schools in the
southeast quadrant of the city.
CRESPAR researchers began the study in 1995 with an extensive literature review
that resulted in the development of a conceptual framework of individual resilience. Asshown in Figure 1, this framework included four components: 1) the risk/protective
environment, 2) meaning, 3) student investments, and 4) outcomes. The risk/protectiveenvironment includes perceptions of interactions and resources within specific contexts,
such as the neighborhood, the family, and the peer group, or within a combination ofcontexts. In turn, perceptions of the environment as risk-laden or protective shape individual
meaning, defined as self-related beliefs and reasons for engaging or not engaging inacademic tasks. Individual meaning influences options for action (student investments), such
as effort at classwork and attending school. The results of these choices can be adaptive(resilient) or maladaptive outcomes.
The conceptualization described above was influenced by the theoretical models of
community effects on student attainment (Nettles, 1991b), adolescent risk-taking behavior(Levitt et al., 1991), and educational risk and resilience (Connell et al.,1994). The models
differ primarily in the choice of specific variables and in the way in which the action componentis defined.
The framework in Figure 1 guided the selection of measures. Measures of theperceived risk/protective environment included The Social Support Scale – Revised (Dubow
& Ullman, 1989), which assesses the child’s appraisals of peer, family, and teacher support;Life Events and Circumstances (Pryor-Brown & Cowen, 1989), an instrument which
assesses stressful events that have occurred in the child’s life in the past year (for example,the loss of job by a parent), and the Perceptions of Environmental Violence Scale (Hill,

11
1991), a set of items that measures the child’s perception of violence in the home, theschool, and the neighborhood. Measures of meaning included the Self-Description
Questionnaire (Marsh et al., 1990), an instrument that assesses seven dimensions of selfconcept (including reading and mathematics) and the Motivations for Reading Questionnaire
(Wigfield, Guthrie, & McGough, 1996), which taps different aspects of children’s reasonsfor reading (e.g., reading efficacy, importance of reading). Student investments will be
measured by teacher ratings of classroom behavior and resilient outcomes by scores on theninth edition of the Stanford Achievement Test Series (Stanford 9), the standardized
instrument used in the District of Columbia Public Schools. The source of data for thesemeasures will be school archival records. A complete set of measures is available on students
enrolled at Stanton during 1996-97 in grades three and four. These data will be used in theCRESPAR study on perceptions of violence and school outcomes.
At the school’s request, measures of hypothesized resiliency (protective) factors,
such as the Self-Description Questionnaire, were administered in classroom to Stantonstudents in grades two through six. Data collection procedures and descriptive analyses are
described in Appendix A. As discussed next, those data were used to increase staffawareness of the strengths children bring to and develop in the school context. Providing
such data is congruent with the strategy of mobilizing protective processes, specifically theprocess of establishing positive expectations for students’ success.
Increasing Awareness and Understanding
The first event of the Stanton/CRESPAR partnership was the one-day staffdevelopment retreat in August 1996. CRESPAR staff designed the retreat, which featured
topics requested by the principal and faculty, to introduce and illustrate the constructs ofrisk, resilience and protection. In one of three sessions, for example, participants used
Benard’s (1991) threefold categorization of protective factors (high expectations,opportunities for participation, and caring and support) to generate concrete examples of
such factors in the Stanton school and community and in children’s families. In a secondsession, participants discussed the family as a source of protection and of risk, and in the
third session, participants discussed the risks that substance use presented for students andfamilies.

12

13
Two professional development workshops, in September 1997 and in April 1998,
presented opportunities to build on the understandings of the initial workshop, to present theresults of research data collected from Stanton students during the 1996-97 academic year,
and to discuss Stanton’s progress in implementing activities to foster resilience in students.For example, at the September workshop, the handout in Appendix B was distributed to
faculty and parents. The handout summarizes how Stanton students described themselveson four protective factors: ability to form positive relationships, love of learning, self-
motivation, and self-worth and competence. The handout in Appendix C was distributed toteachers at the April workshop and shows how students in each grade ranked motivations
to read. Rankings ranged from 1 (reflecting the highest average on a motivation scale) to 11(the lowest average on a motivation scale). All grades had the highest average score on the
importance of reading, and extrinsic reasons were also rated highly. Students in grades twoand six on average reported higher efficacy in reading than students in other grades.
Other efforts to inform the faculty and staff include making reference materials on
resilience and other topics available in the school’s library, and informal conversations onresilience throughout the school year between CRESPAR researchers and school personnel.
The Stanton Case Study
As the collaborative relationship between Stanton and CRESPAR deepened, we
realized that the school’s increased actions to provide a protective environment would haveto become part of the conceptual framework. As shown in Figure 2, the current framework
expands the risk/protective environment to include not only students’ perceptions of socialsupport and stress, but the school organization and school-initiated activities as well. The
figure may be summarized in the following propositions.
1. Schools can implement activities that mobilize protective processes and mitigate riskfactors when the school environment is orderly and safe. A stable level of school
organization is one of the prerequisites for successful implementation of innovativeprograms (Gottfredson & Gottfredson, 1985). We are examining the school’s role in
fostering student resilience through direct observations in the school, a comparison ofplans and accomplishments, and review of documents produced by the school. We will
compare results of qualitative analyses of school organization with teacher responses onthe Effective School Battery (ESB, Gottfredson, 1991).

14
The remaining propositions are ones that the CRESPAR research project is
exploring in Stanton’s students:
2. Students will view the environment as supportive when school resources are increasedand activities that enhance protective factors are implemented as designed.
3. Students can view themselves as competent and motivated when they feel supportedby parents, the school, and the community.
3. Students’ everyday efforts can increase when they view themselves as competent andmotivated.
5. Resilience in school settings can occur when students’ everyday efforts are increased.
Evidence from research on adolescent populations suggests that Stanton’sconceptualization of resilience may be a fruitful one. For example, the educational risk and
resilience model (Connell, Spencer, & Aber, 1994) was validated in three separate samplesof African American young adolescents living in high-risk environments. The four components
of the model are (1) context, (2) self (or meaning-making processes), (3) action, and (4) aca-demic-related outcomes. The investigators found that student perceptions of parental involvement
(a contextual variable) influenced self-appraisals (i.e., general self-concept, efficacy in school,and perceived quality of interpersonal relationships). These self processes influenced emotional
engagement (e.g., satisfaction with school) and behavioral engagement (e.g., doing homework).Depending on the level of engagement, outcomes were negative (e.g., low grades) or positive
(e.g., high attendance).
We are using the single-case design (Yin, 1989) to test the hypothesized paths to
resilience shown in Figure 2. Questionnaire responses from Stanton students in grades twothrough six will be analyzed. To determine effectiveness of the approach in accomplishing
school-wide changes in academic competence, we will use changes in normal curve equivalents(NCEs) on the Stanford 9 reading and mathematics subtests. NCEs are the metric used in
reporting achievement gains in Title I programs. Moreover, we will compare changes inproportions of students who met defined performance standards on the Stanford 9. We discuss
results on school-wide impact below.

15

16
Impact on Student Achievement
As discussed earlier, Stanton targeted district and community resources toward
mobilizing protective processes, primarily those pertaining to competence in reading andmathematics. To gauge the school’s progress, changes i
examined for grades two through six on the Stanford 9. The school staff administered the testin October 1997 (fall) and April 1998 (spring).
Stanford Early School Achievement Test in the fall and the Stanford 9 in the spring. As shownin Table 2, the reading gains from fall to spring in grades two through six were 11 to 21 NCEs.
The mathematics gains in these grades ranged from 13 to 30. As shown in Table 2, the readingNCE gain was 4.1 and the mathematics gain was 18.1.
Table 2Mean National Normal Curve Equivalents on
Reading and Mathematics Subtests of the Stanford 9
Subtest
Reading Mathematics
Grade Fall 1997 Spring 1998 Change Fall 1997 Spring 1998 Change
1 43.9* 48.0 4.1 32.5* 50.6 18.1
2 25.4 37.4 12.0 16.6 47.0 30.4
3 21.6 43.4 21.8 19.9 50.5 30.6
4 24.0 35.3 11.3 27.0 41.1 14.1
5 19.2 34.8 15.6 17.9 35.1 17.2
6 29.0 41.3 12.3 25.7 42.9 17.2
*NCEs on the subscales of the 4th edition of the Stanford Early School Achievement Test Series
The Stanford 9 report also presents student performance according to four categories orlevels defined by expert panels: 1) Below Basic (little or no mastery of knowledge and skills);
2) Basic (partial mastery); 3) Proficient (prepared for the next grade); and 4) Advanced (superiorperformance). School-wide (grades two through six combined) changes were examined
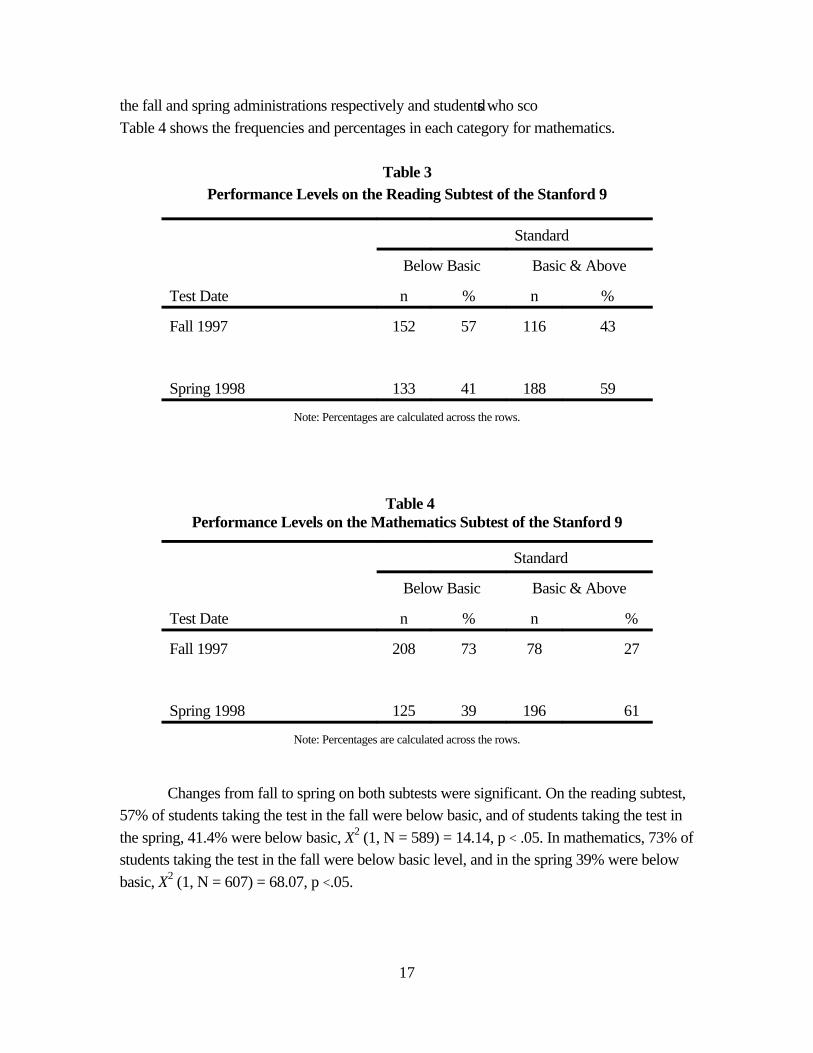
according to two categories of performance standards, 1) Below basic and 2) Basic, proficient,and advanced. Table 3 shows the frequencies and percentages of students below basic in reading
at
17
the fall and spring administrations respectively and students who scod
Table 4 shows the frequencies and percentages in each category for mathematics.
Table 3Performance Levels on the Reading Subtest of the Stanford 9
Standard
Below Basic Basic & Above
Test Date n % n %
Fall 1997 152 57 116 43
Spring 1998 133 41 188 59
Note: Percentages are calculated across the rows.
Table 4Performance Levels on the Mathematics Subtest of the Stanford 9
Standard
Below Basic Basic & Above
Test Date n % n %
Fall 1997 208 73 78 27
Spring 1998 125 39 196 61
Note: Percentages are calculated across the rows.
Changes from fall to spring on both subtests were significant. On the reading subtest,57% of students taking the test in the fall were below basic, and of students taking the test in
the spring, 41.4% were below basic, X (1, N = 589) = 14.14, p < .05. In mathematics, 73% of2
students taking the test in the fall were below basic level, and in the spring 39% were below
basic, X (1, N = 607) = 68.07, p <.05.2

18
Conclusion
The resilience approach at Stanton started as a straightforward research study, wherein
the researchers would come to the school, collect the data, and report the results to thefaculty. Instead, resilience is emerging as an organizing principle that gives Stanton a means
of integrating school improvement, regular and enhanced curricular offerings, and processesthat emphasize caring, high expectation, and opportunity. Moreover, resilience orients our
thinking toward an optimistic view of our students’ prospects. Elementary school childrendo not describe themselves as being at risk: someone assesses certain factors and applies the
label. Indeed, Stanton sees the problem and deficit-focused language of risk asfundamentally at odds with the goals of school improvement. But until schools adapt a
different paradigm — and to us the resilience approach is a new paradigm — we willcontinue to see children in urban schools as problems in the present and the future.
Although the resilience emphasis has emerged over two and a half years at Stanton,other schools might take an abbreviated route. The essential ingredients are a willingness
to examine a new way of thinking, an organizational readiness to fill in the gaps inprotective processes through use of effective instructional programs and involvement of
parent and community partners, and a way of assessing student factors related to resilience.A teacher checklist for recording information on individual students’ resiliency factors is
described in Sagor (1996), and Henderson and Milstein (1996) suggest ways of developingprofiles of student, faculty, and organizational resilience. We are attempting to identify
reliable measures of student protective factors, and future plans call for providing teacherswith information on ways to administer select measures, to interpret the data on individual
students, and to use data to implement strategies to foster student resilience. We are alsoexamining ways to share the information with families, who too often get dismal news about
children’s progress.
We have outlined the ways in which one school, Stanton Elementary, is embracingthe resilience approach. We do not view this as another program to improve test scores and
grades, although the results thus far are promising. Rather, we see this as a way of givingmeaning to the phrase, “building on children’s strengths.” We do this first by assessing the
child’s view of the environment as caring or threatening and then by identifying protectivefactors within the child. Stanton is beginning to use this information to understand the inner
strengths that children bring with them to school, to create a more accurate picture of thestress that the school can alleviate in their lives, and to fine-tune activities that will make
Stanton a more caring, protective school environment for all students.

19
References
Anderson, L. (1994). Effectiveness and efficiency in inner-city public schools: Chartingschool resilience. In M. C. Wang & E. W. Gordon (Eds.), Educational resilience ininner-city America: Challenges and prospects (pp. 141-149). Hillsdale, NJ: LawrenceErlbaum.
Benard, B. (1991). Fostering resiliency in kids: Protective factors in the family, school, andcommunity. Portland, OR: Western Center for Drug-Free Schools and Communities.
Comer, J. (1985). The Yale-New Haven primary prevention project: A follow-up study.Journal of the American Academy of Child Psychiatry, 23(2), 154-160.
Connell, J.P., Spencer, M.B., & Aber, J.L. (1994). Educational risk and resilience inAfrican-American youth: Context, self, action, and outcomes in school. ChildDevelopment, 65, 494-506.
Dubow, E.F., & Ullman, D.G. (1989). Assessing social support in elementary schoolchildren: The survey of children’s social support. Journal of Child Clinical Psychology,18, 52-64.
Foorman, B.R., Francis, D.J., Fletcher, J.M., Schatschneider, C., & Mehta, P. (1998). Therole of instruction in learning to read: Preventing reading failure in at-risk children.Journal of Educational Psychology, 90 (1), 37-33.
Gottfredson, G.D. (1991). The Effective School Battery: User’s Manual. Odessa, FL:Psychological Assessment Resources.
Gottfredson, G.D., & Gottfredson, D.C. (1985). Victimization in Schools. New York:Plenum.
Hawkins, J.D., Catalano, R.F., & Miller, J.Y. (1992). Risk and protective factors for alcoholand other drug problems in adolescence and early adulthood: Implications for substanceabuse prevention. Psychological Bulletin, 112, 64-105.
Henderson, N., & Milstein, M.M. (1996). Resiliency in schools: Making it happen forstudents and educators. Thousand Oaks, CA: Corwin.
Hill, H. (1991). Perceptions of environmental violence scale. Washington, DC: HowardUniversity.
Levitt, M.Z., Selman, R.L., & Richmond, J.B. (1991). The psychosocial foundations ofearly adolescents’ high risk behavior: Implications for research and practice. Journalof Research on Adolescence,1 (4), 349-378.
Mac Iver, M.A., Stringfield, S., McHugh, B., & Snively, F. (1998) Implementation andeffects of the Sylvan Learning Systems Program in the Baltimore City Public Schools:Evaluation Report. Baltimore: Johns Hopkins University, Center for SocialOrganization of Schools.

20
Marsh, H.W. (1990). Self description questionnaire - I: SDQ manual. Campbelltown,Australia: University of Western Sydney, Macarthur.
Masten, A. (1994). Resilience in individual development: Successful adaptation despite riskand adversity. In M. C. Wang & E. W. Gordon (Eds.), Educational resilience in inner-city America: Challenges and prospects (pp. 141-149). Hillsdale, NJ: LawrenceErlbaum.
Masten, A., Best, K.M., & Garmezy, N. (1990). Resilience and development: Contributionsfrom the study of children who overcame adversity. Development andPsychopathology, 2, 425-444.
Nettles, S.M. (1991a). Community contributions to school outcomes of African-Americanstudents. Education and Urban Society, 24 (1), 132-147.
Nettles, S.M. (1991b). Community involvement and disadvantaged students: A review.Review of Educational Research, 61, 379-406.
Nettles, S.M. & Pleck, J.H. (1994). Risk, resilience, and development: The multipleecologies of black adolescents in the United States. In R.J. Haggerty, L. Sherrod, N.Garmezy, & M. Rutter. (Eds.), Stress, risk, and resilience in children and adolescents:Processes, mechanisms, and intervention (pp. 147-181). New York: CambridgeUniversity Press.
North Central Regional Educational Laboratory. (1994). Resilience research: How can ithelp city schools? CITYSCHOOLS, I (1), 11-18.
Pryor-Brown, L., & Cowen, E. L. (1989). Stressful life events, support, and children’sschool adjustment. Journal of Clinical Child Psychology, 18, 214-230.
Rutter, M. (1987). Psychosocial resilience and protective mechanisms. American Journalof Orthopsychiatry, 57, 316-331.
Sagor, R. (1996). Building resiliency in students. Educational Leadership, 54 (1), 38-43.
Wang, M.C., & Gordon, E.W. (Eds.), Educational resilience in inner-city America:Challenges and prospects (pp. 141-149). Hillsdale, NJ: Lawrence Erlbaum.
Wang, M.C., Haertel, G.D., & Walberg, H.J. (1994). Educational resilience in inner cities.In M. C. Wang & E. W. Gordon (Eds.), Educational resilience in inner-city America:Challenges and prospects (pp. 41-149). Hillsdale, NJ: Lawrence Erlbaum.
Werner, E.E. (1990). Protective factors and individual resilience. In S. Meisels and J.Shonkoff (Eds.), Handbook of early childhood intervention. New York: CambridgeUniversity Press.
Wigfield, A., Guthrie, J., & McGough, K. (1996). A questionnaire measure of readingmotivations. (Instructional Resource No. 22). Athens, GA: National Reading ResearchCenter.
21
Winfield, L.F. (1991). (Ed.), Resilience, schooling, and development in African- Americanyouth: A conceptual framework. Education and Urban Society, 24 (1), 5-14.
Yin, R.K. (1989). Case study research: Design and methods. Newbury Park: CA: SagePublications.
Zimmerman, M.A., & Arunkumar, R. (1994). Resiliency research: Implications for schoolsand policy. Social Policy Report: Society for Research in Child Development, 8 (4).

22

23
Appendix A
Assessing Risk and Protective Factors
This appendix presents descriptive data onstudents at Stanton Elementary School in Washington, D.C. These questionnaires include threemeasures ol Sthe Self-Description Questionnaire, and the Motivations for Reading Questionnaire. In addition,a measure of stress, the Life Events and Circumstances scale, was administered.
Method
Participants
Participants were 263 children in the second through sixth grades. Parents were notifiedof the assessment according to guidelines in the District of Columbia Public Schoolsmemorandum, Collaborative Partnership with the Center for Research on the Education ofStudents Placed At Risk, December 8, 1995.
Procedure
Students completed paper-and-pencil measures in their classrooms monitored by fourresearch assistants (3 female and 1 male). All the measures were read aloud to minimize anyproblems related to reading. The research assistants worked in pairs. While one research assistantread aloud, the other assistant walked around the classroom checking to make sure that thestudents were following directions, not skipping ahead, or checking more than one response. Theteachers were asked to leave the classroom during the questionnaire session to protect thestudents’ confidentiality.
Data were collected in October and November of 1996 and in January of 1997.
Measures
The Social Support Appraisal Scale – Revised (Dubow & Ullman, 1989) is a 41-itempencil-and-paper instrument that assesses the child’s appraisals of peer, family, and teachersupport. Items were developed to reflect an individual’s conceptualization of social support —information indicating to the individual that he or she is valued and esteemed by others. Sampleitems illustrating the content of the three major subscales include: peer items (e.g., whether the

24
child feels left out by his/her friends), family items (e.g., whether the child is an importantmember of his/her family), and teacher items (e.g., whether the child feels his/her teachers aregood to ask for advice or help about probleof each item: “Some kids feel left out by their friends, but other kids don’t. Do you feel left outby your friends?” The child responds to each item on a 5-point continuum (1 = always, 5 =never). Dubow and Ullman (1989) reported an internal consistency reliability (Cronbach’s alpha)of .88 and 3-4 week test-retest reliability of .75.
The Self-Description Questionnaire-I (SDQ-I, Marsh et al.,1990) is designed to measureseven dimensions of self-concept. The instrument consists of 72 short items to which studentsrespond to along a 5-point response scale where 1 = “false,” 5 = “true.” The following is a briefdescription of each of the seven subscales:
1) Physical abilities/sports, on which students rate their ability and enjoyment of physicalactivities, sports, and games.
2) Physical appearance, wherein students rate their own attractiveness, how their appearancecompares with others, and how others think they look.
3) Relationship with peers, wherein students rate how easily they make friends, their popularity,and whether others want them as a friend.
4) Relationship with parents, wherein students rate how well they get along with their parents,whether parents are easy to talk to, like them, and whether they like their parents.
5) Reading, on which students rate their ability and their enjoyment/interest in reading.
6) Mathematics, wherein students rate their ability and enjoyment/interest in mathematics.
7) General school subjects, on which students rate their ability and enjoyment/interest in “allschool subjects.”
The SDQ-I includes three composite scores: (1) Total Nonacademic Self-Concept, whichis the mean of responses to the physical abilities, physical appearance, relations with parents, andrelations with peers scales; (2) Total Academic Self-Concept, which is the mean of responses tothe reading, mathematics, and generals chool scales, and (3) the Total Self-Concept, the meanof the responses to the seven factors named above.
The Motivations for Reading Questionnaire (MRQ; Wigfield, Guthrie & McGough,1996) is a 54- item questionnaire that assess different aspects of children’s motivation for reading.MRQ consists of 11 subscales, with each item a short sentence to which the child responds to ona 4-point scale (1 = very different from me, 4 = a lot like me). The 11 subscales are as follows:Reading efficacy (e.g., I am a good reader), Reading challenge (e.g., I usually learn difficultthings

25
by reading), Reading curiosity (e.g., I like to read about new things), Aesthetic enjoyment ofreading (e.g., I read stories about fantasy and make believe), Importance of reading (e.g., it isvery important to me to recognition (e.g., I like having the teacher say I read well), Reading for grades (e.g., I read toimprove my grades), Social reasons for reading (e.g., I often read to my brother or my sister),Reading competition (e.g., I like being the best at reading), and Reading work avoidance (e.g.,I don’t like vocabulary questions).
Internal consistency reliabilities of these scales were mostly greater than .70 save forreading efficacy, importance of reading, reading recognition, compliance, and reading workavoidance (Wigfield, Guthrie, & McGough, 1996).
The Life Events and Circumstances Scale (Pryor-Brown & Cowen, 1989) is a 22-iteminstrument that assesses stressful life events that have occurred in the child’s life within the pastyear (e.g., child changed schools, best friend moved out of town, loss of job by parent). Thefollowing sample items illustrate the format of each item: “I had to change to a new school,” “Mybest friend moved out of town.” The child responds in a dichotomous way-by checking either‘yes’ or ‘no.’ Nineteen of the items represent events over which the child has very little or nocontrol (e.g., parents separated, parent lost a job). These items are thus less likely to beconfounded with the resiliency outcomes as compared to the three events such as “a bad markon a test.”
Results
Descriptive Statistics
Table A1 presents the means, standard deviations, and ranges of each of the measures.Students in the combined sample reported an average of 7.03 stressful life events. The second,third, and fourth grade averaged 7.63, 7.48, and 7.14 life events respectively. Fifth and sixthgraders reported lower mean life events (6.04 and 6.95 respectively). Second grade studentsreported the highest mean level of perceived social support (170.3) and fourth graders the lowest(159.9). The mean score for the combined sample was 163.49.
Scores on the Self-Description Questionnaire for the combined sample were 36.09, 36.02,and 35.79 for the Total Nonacademic, Total Academic, and Total Self scores, respectively.
These means were higher than those (31.77 for Total Nonacademic, 29.53 for Total Academic,and 30.89 for Total Self) reported for the normative sample of 3,562 children in New South
Wales, Australia (Marsh, 1990).

26
Table A1Means, Standard Deviations, and Ranges of Study Variables
for the Combined Samples and for Each Grade
GRADES
Variables Combined 2 3 4 5 6Sample
Perceived M 163.49 170.3 159.9 158.2 162.3 166.1Social SD 24.68 24.6 23.4 24.2 24.9 25.5Support Range 90-205 90-203 100-193 115-201 101-205 101-205
N 252 68 58 46 46 34
Life Events M 7.03 7.63 7.48 7.14 6.04 6.95SD 3.69 3.32 3.24 4.47 3.83 4.31
Range 0-22 1-15 1-14 0-23 0-19 0-22N 259 68 56 50 48 37
Total Non- M 36.09 38.63 35.90 34.90 35.2 34.4academic SD 4.09 1.89 4.38 4.00 4.34 4.43
Range 15-40 32-40 15-40 23-40 21.40 24-40N 233 60 53 45 42 33
Total M 35.07 38.63 35 33.4 33.3 33.3Academic SD 5.28 2.74 5.01 1.90 4.19 5.84
Range 12-40 21-40 15-40 23-39 12-40 23-40N 233 60 53 45 42 33
Total Self M 35.79 38.88 35.7 34.2 34.6 34.1SD 4.41 2.09 4.47 4.05 4.91 4.54
Range 15-40 27-40 15-40 23-40 17-40 24-40N 233 60 53 45 42 32
Motivations M 34.68 36.96 35.54 34.40 33.85 31.34for Reading SD 4.63 2.98 4.21 3.68 4.48 4.98
Range 9-40 28-40 19-40 23-39 18-40 20.39N 256 69 56 47 47 35
* p < 0.10** p < 0.05*** p < 0.01
27
Mean total scores on the Motivations for Reading questionnaire were 34.69 for thecombined sample (grades 2 through 6); 36.96, 35.54, and 34.4 for the second, third, andfourth grade cohorts respectively, and 33.86 and 31.34 for the fifth and sixth gradesrespectively.
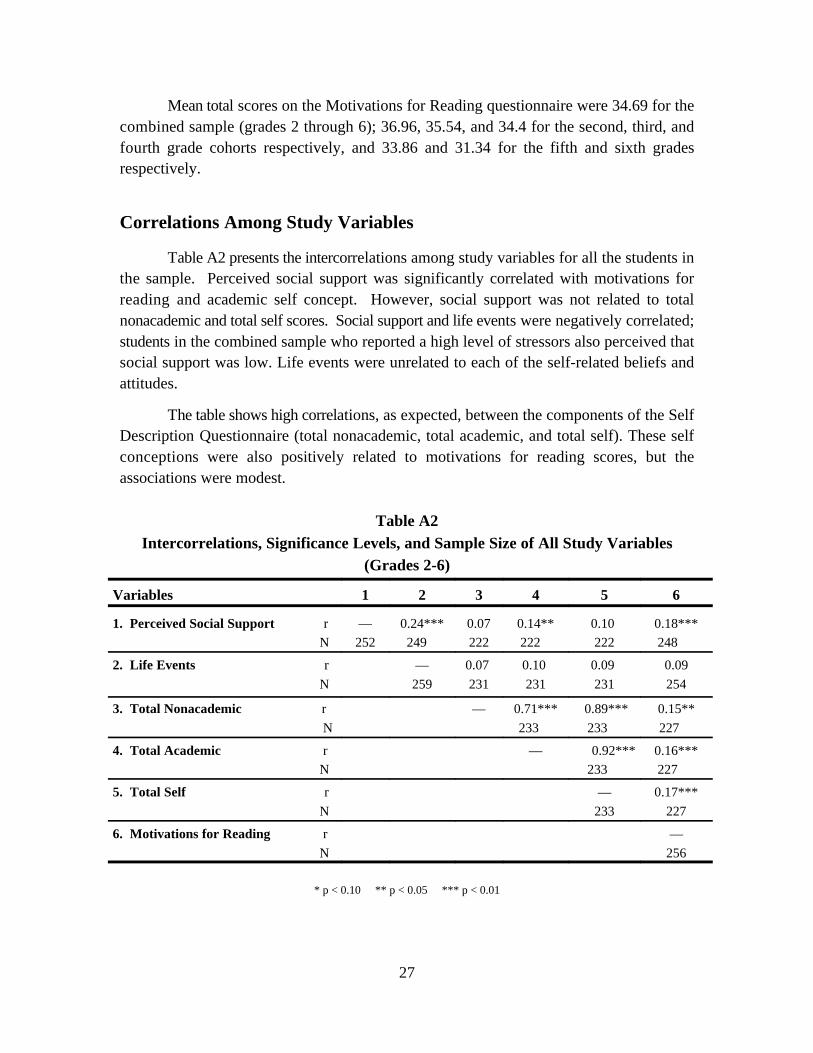
Correlations Among Study Variables
Table A2 presents the intercorrelations among study variables for all the students inthe sample. Perceived social support was significantly correlated with motivations forreading and academic self concept. However, social support was not related to totalnonacademic and total self scores. Social support and life events were negatively correlated;students in the combined sample who reported a high level of stressors also perceived thatsocial support was low. Life events were unrelated to each of the self-related beliefs andattitudes.
The table shows high correlations, as expected, between the components of the SelfDescription Questionnaire (total nonacademic, total academic, and total self). These selfconceptions were also positively related to motivations for reading scores, but theassociations were modest.
Table A2Intercorrelations, Significance Levels, and Sample Size of All Study Variables
(Grades 2-6)
Variables 1 2 3 4 5 6
1. Perceived Social Support r — 0.24*** 0.07 0.14** 0.10 0.18***
N 252 249 222 222 222 248
2. Life Events r — 0.07 0.10 0.09 0.09
N 259 231 231 231 254
3. Total Nonacademic r — 0.71*** 0.89*** 0.15**
N 233 233 227
4. Total Academic r — 0.92*** 0.16***
N 233 227
5. Total Self r — 0.17***
N 233 227
6. Motivations for Reading r —
N 256
* p < 0.10 ** p < 0.05 *** p < 0.01

29
Appendix BHandout Distributed at Professional Development Retreat, September 1997
PROTECTIVE FACTORS IN STANTON STUDENTS
Ability to Form Positive Relationships
Of the many ways that Stanton students describe themselves, in all grades except the 3 grade,rd
Parent Relations ranked highest. Children thought they got along well with parents, likedthem, and experienced parental acceptance and approval.
Love of Learning
Ability, enjoyment, and interest in reading (3 and 4 graders) and math (2 and 6 graders)rd th nd th
ranked high (3 of 6) on the list of dimensions of self-concept.rd
Self-Motivation
The number one motivation for reading among Stanton students is the importance of reading.
Their desire for outperforming others ranked second among the motivations.
Self-Worth and Competence
On the dimensions of self-concept, physical attractiveness ranked second. Other dimensionsincluded physical abilities, peer relations, parent relations, reading, and mathematics.
Overall, Stanton students perceived themselves as capable and proud of the way they were.

31
Appendix CHandout Distributed to Stanton Faculty
Table 1. How Stanton Students Rate Motivations for Reading
Motivation Grade Grade Grade Grade GradeScale 2 3 4 5 6
Sample Item
Importance of “It is very important to me to 1 1 1 1 1
Reading be a good reader.”
Reading 2 2 2 4 3
Competition“I like being best at reading.”
Reading for 4 3 3 2 2
Grades“I read to improve my grades.”
Reading for “I like having the teacher say I 5 4 4 6 3
Recognition read well.”
Reading 3 7 5 7 3
Efficacy“I am a good reader.”
Reading “I like to read about new 5 6 6 3 6
Curiosity things.”
Reading “I make pictures in my mind 5 4 7 5 5
Involvement when I read.”
Reading “If a book is interesting, I don’t 7 8 7 8 4
Challenge care how hard it is to read.”
Social 6 5 7 10 8
Reasons for
Reading
“I often read to my brother or
my sister.”
Compliance “I read because I have to.” 8 9 8 9 7
Reading 9 10 9 11
Work
Avoidance
“I don’t like vocabulary
questions”
9