Report 1 in preparation for the Crop and Food Security ... Planting... · 1.2.1 Over a 10-day...
38
1 A partnership between the Ministry of Agriculture, Forestry, Cooperatives & Rural Development (GRSS-MAFCRD) and the United Nations Food and Agriculture Organization (FAO) Crop Planting Assessment Mission to Western and Central Equatoria Republic of South Sudan April 2014 Report 1 in preparation for the Crop and Food Security Assessment Mission (CFSAM) Team leader: Dr Ian Robinson, AA International Ltd This report has been produced with the financial support of the EU, under the “Agriculture and Food Information System for Decision Support (AFIS)” Project in South Sudan FAO reference: GCP/SSD/003/EC; EU reference: FED/2012/304-645
-
Upload
nguyenhuong -
Category
Documents
-
view
233 -
download
0
Transcript of Report 1 in preparation for the Crop and Food Security ... Planting... · 1.2.1 Over a 10-day...

1
A partnership between the Ministry of Agriculture, Forestry, Cooperatives & Rural Development (GRSS-MAFCRD)
and the United Nations Food and Agriculture Organization (FAO)
Crop Planting Assessment Mission to Western and Central Equatoria
Republic of South Sudan April 2014
Report 1 in preparation for the Crop and Food Security Assessment Mission (CFSAM)
Team leader: Dr Ian Robinson, AA International Ltd
This report has been produced with the financial support of the EU, under the “Agriculture and Food Information System for Decision Support (AFIS)” Project in South Sudan
FAO reference: GCP/SSD/003/EC; EU reference: FED/2012/304-645

2
CONTENTS 1. OVERVIEW
1.1 Introduction 1.2 Actions 1.3 Findings
2. BACKGROUND INFORMATION
2.1 Agricultural systems 2.2 Livestock systems
3. FACTORS AFFECTING AREA
3.1 Critical factors 3.2 Rainfall (2014 and long-term average). 3.3 Access to land and farmer confidence.
3.4 Input Supply 3.5 Power sources 3.6 Pest and diseases 3.7 Livestock body condition 3.8 Livestock numbers / performance
4. CONCLUSIONS
4.1 Effect of rainfall. 4.2 Effect of access to land and confidence. 4.3 Effect of inputs 4.4 Effect of power supply. 4.5 Effect of pests and diseases. 4.6 Planted area
ANNEX 1 OBSERVATIONAL TRANSECTS ANNEX 2 CUMULATED RAINFALL – SOUTH SUDAN ANNEX 3 PLANTING SEASON ASSESSMENT CHECKLIST AND SUMMARY SHEET

3
1. OVERVIEW
1.1 Introduction 1.1.1 An MAFCRD/ FAO Planting Assessment Mission visited West and Central Equatoria from 28th March to 9th April 2014 to assess the overall land preparation and planting situation in the two States. The Mission, funded by the EU under the “Agriculture and Food Information System for Decision Support (AFIS)” Project in South Sudan FAO project symbol: GCP/SSD/003/EC, EU reference: FED/2012/304-645, was the first of a series of intermediate missions identified to feed information into an MAFCRD/ FAO/ WFP CFSAM to be conducted in October/ November. The Mission is timed in accordance with a Roadmap1 for activities prepared by the AA International Ltd Consultant. At the same time, Food Security Missions and Emergency Food Security missions were undertaken by Food Security Cluster Teams designed to assess household food security in a) stable areas and b) areas in crisis, respectively. Information in the form of summary tables from the two surveys was expected to be available for inclusion in this report; but due to delays in availability, any summaries may have to be added later by the CFSAM Task Force 2 (see Roadmap2). 1.1.2 The Planting Assessment Mission comprised the Consultant and two members drawn from the cadre of MAFCRD, MAFCE, NBS and other FAO staff who i) had been trained in CFSAM protocols and PET use; and ii) had shown a much better than average understanding and aptitude for the demanding nature of the work during their involvement in previous CFSAMs.3 1.1.3 In Juba before departure to the field, the Mission team was briefed separately by FAO Emergency Coordinators, WFP VAM staff; and received written authority to conduct the Mission from MAFCRD. Upon return to Juba, the FAO Country Representative was debriefed; and, an explanatory debriefing of the approach was given to Senior Staff (Under Secretaries and Directors General of MAFCRD) in a meeting chaired by the Deputy Minister4. 1.2 Actions. 1.2.1 Over a 10-day period, travelling through Mundri East, Mundri West, Maridi, Ibba, Yambio, Nzara and Ezo Counties in West Equatoria; and Yei, Morobo, Kajo-Keji, Juba and Terekeka Counties in Central Equatoria, the Mission Team conducted simultaneous observational transects (cropped/fallow areas, agricultural activities and livestock body condition score) based on a protocol provided in Annex 1. The transects followed both main roads, and access roads to sample location in each county. Walking transects and for more
1 Prepared under the ToRs of a specific mission from 23
rd March-12
th April in the “Agriculture and Food
Security Information and Analysis” Programme Area. 2 Produced by Ian Robinson under separate cover.
3 It is strongly recommended that the two team members (Thomas Misaka and Geoffrey Vinu) and eight others
showing similar abilities and enthusiasm are selected from the 100 or so persons who have been trained over the past seven years, and formed into a Task Force, from which intermediate CFSAM team members are exclusively drawn. 4 Cassava Room, MAFCRD, Juba, April 10
th.

4
detailed information, farmer case studies were conducted in each sample location. The road transects are shown in Figure 1. 1.2.2 During the Mission’s vehicle-based transects, observations were noted every minute using a simple standardised (between observers) A4 sheets. The notes were then clustered into 12-15 minute sets and the descriptive findings of each set were aggregated by county. In such a way, some 2 000 observations were made, each one ranking seasonal agricultural activities in order of their occurrence against the changing background matrix of bush (or forest)-savannah. The sets of observations were clustered into outward and return journey tables to reflect the rapid changes noted as the early season developed. Herds of cattle and goats and flocks of sheep, as seen during transects, were scored for body condition by mode using photo-indicators from PET Livestock Sudan; and, the presence of introduced fruit and timber trees was noted in order of their significance in the forest matrices of each county traversed. 1.2.3 Thirty -one farming household case-studies, selected on a random–as available basis in what were typical agricultural communities in the sample locations, were conducted using the CFSAM established checklists and the daily summary sheet protocols, adapted for the planting season. Information and data collected in such a manner were cross-checked against findings from key informant interviews with eight Assistant Commissioners for Agriculture and their staff. 1.2.4 Further location specific information was obtained from key informants through semi-structured interviews, using the same format, with Directors-General of Agriculture (1); Assistant Commissioner of Livestock (1) and their staff; Farmers’ Association Chairpersons (2); currently active NGO teams in the following counties in the two States viz- World Relief (Ibba); World Vision (Yambio); World Vision (Nzara); World Renew (Yei River); SPEDP5 (Terekeka) and NPA6 (Terekeka), established agro-industrial cooperative 7(Kajo-Keji) and two traders in agricultural inputs or credit. 1.2.5 Secondary information was obtained from a review of last year’s CFSAM tables and recent (2014) rainfall estimates and Normalized Difference Vegetation Index (NDVI) data were kindly provided by WFP (Rome) VAM unit. During the analysis, rainfall data were compared with key informant and cases study accounts of rainfall from January to April 2014. 1.2.6 Regarding market analysis, the Mission directly observed spot prices and received current market prices from case study farmers selling their goods in the local markets. 1.3 Findings 1.3.1 The Mission findings, extracted from the transects, case-studies, key informant interviews and secondary data, suggest that:-
At the time of the Mission to 12 counties in Greater Equatoria, the current crisis in the three states of Greater Upper Nile (Upper Nile; Jonglei and Unity) and in Juba City, as identified by incidents of armed conflict and / or restrictions on movement,
5 South Sudan Peace Education and Development Programme.
6 Norwegian People’s Aid.
7 Savannah Farmer’s Cooperative (525 feddans maize farm and 1600 maize outgrowers, 2013).

5
is having:- o no discernible effect on timely access to farm land and planting either close
to households or in far-fields in all counties visited except in Terekeka County.
o In Terekeka County, 2290 hh out of 28,000 households have been displaced from their communities in the payams of Mangala North and Gemeisa, and are settled temporarily on the Nile banks and islands, where they have been receiving support in cultivating small gardens using bucket irrigation of vegetables and maize. However, their farmlands estimated at around 5 000 feddans of cereals may be considered to be inaccessible8 for the time being.
1.3.2 Anticipated access problems connecting to conflict between herders and growers were not noted in West Equatoria. However, unusual migrations were reported to the Mission in by the Director-General of Agriculture, State Ministry of Agriculture as follows;
in Tambura arrival of 3150 head ex Jonglei;
in Mvolo arrival of 25,000 head ex Lakes;
in Maridi ( North) arrival of 45,000 head ex Jonglei;
in Mundri West arrival of 2,900 head ex Jonglei. Such movements may be related to the current crisis or to less than long-term-average rainfall noted in Jonglei, and Unity states in Greater Upper Nile (Annex 2). In Mundri, an NGO “No Violence” was seen brokering a peace accord between the Bor Dinka and settled communities that involved the identification and acceptance of standard operating procedures for reporting and compensating farmers for wanton / accidental crop destruction by livestock. 1.3.3 Abnormal movements of cattle were reported in Central Equatoria, away from the capital area towards the hills in Kajo Keji. 1.3.4. In Central Equatoria, cattle were noted to be the greatest pest at this time of the year as the tethering season, which generally starts after first season planting is finished, had yet to begin. In Kajo- Keji County, the Savannah Farmer’s Coop were planning to mobilise village youth to assist in protection against roaming goats and cattle, prior to the tethering period. Farmers in Yei River, Morobo and Terekeka Counties were also conscious of the danger from cattle (local and migratory) to their crops, particularly cassava in the two counties, and were noted to be either planting closer to home or intending to a) move part of the household to temporary huts in the far-fields; or b) farm more closely in groups to assist one another in this regard. 1.3.5 The rainfall since January 2014 in Western Equatoria has been greater than the long-term average and has supported the development of vegetation above the long-term maximum levels. This effect was confirmed in all counties visited, where the consensus of opinion recognised an early start, a short 1 to 2 dekads break followed by the appearance of what was expected to be established rains at the beginning of April. Consequently, clearing, cultivation and planting were noticed to be on-going under normal conditions at a normal pace. In the counties of Central Equatoria, the rains have been more diverse beginning later than usual in some places, but, at the time of the Mission, were still considered to be normal, and were prompting clearing, cultivating and planting. The situation is noted to be
8 Some individuals are returning to cultivate, but numbers are not known.

6
essentially similar in Greater Bahr el Ghazal; however, the rainfall so far in Greater Upper Nile has not been conducive to planting, exacerbating the compound crisis that requires further discussion outside the bounds of this report. 1.3.6 Agricultural inputs in all counties traversed in West Equatoria comprise only i) the abundant, locally-produced planting material (farmers’ own or market-sourced seeds, cassava cuttings and sweet potato runners); and, in the absence of animal traction and with very few functioning tractors ii) the regular household-based, hand-labour for digging. Consequently, no abnormal effects on area to be cultivated and planted were reported or noted due to absence of inputs. Indeed, all information retrieved from the case studies and key informants concerning farm sizes point to an increased area to be farmed this year. With no limits on access and notwithstanding complaints from farmers that they have plenty of second season cereals from 2013 for sale, confidence in the market seems9 high, All farmers interviewed expected to sow two crops of maize and groundnuts in rotation over the two planting seasons (April and August) in 2014; and to maintain the annual planting of cassava at normal levels, of both long (2 year) and short cycle (8-10 months) varieties. 1.3.7 The situation in Central Equatoria is no less buoyant than in West Equatoria, as epitomised by the Savannah Farmers’ Cooperative’s intention to double its maize area this year. Indeed, with the take-up of animal traction, more tractors per county than West Equatoria and with a similar approach to two field crops a year (maize-maize; maize-groundnut; groundnut–maize; or maize-sorghum), an even greater increase in area is to be expected over the areas reported in 2013. However, poorer farmers with no family labour included in our sample in Yei River County/ Morobo boundary are noted to be limited to preparing land in small aliquots, to match access to cash to pay for seeds and labour.10 Such a process upsets the critical timing of husbandry tasks and might be alleviated by access to short term loans / planting grants for such deserving households. 1.3.8 As the Mission took place so early in the season, outbreaks of crop pests and diseases had not yet occurred, therefore few incidents were reported or noted except for a) endemic cassava mosaic and brown streak disease; and b) monkeys, rats, squirrels, termites and local birds eating seeds. 1.3.9 In accordance with the approach adopted in previous years, the Mission’s calculation of cereal production per county is based on estimates of three variables:
estimates of the numbers of households in each county, adjusted a) for flood /conflict/ or other emergency affected households using data from the latest OCHA analyses; and b) by the latest advice concerning the number of farming households among the returning refugees or IDPs;
percentages of households farming;
estimates of the average farm area per household under cereals for each county, adjusted according to Mission observations made during field visits.
9 WFP purchases appear to have lifted farm-gate maize prices to from 1.5 SSLs/ kg to 2.0 SSLs /kg in Central
Equatoria. Although farmers informed the Mission of unsold stocks of maize in Ezo and Nzara, local market prices were NOT noticeably lower, suggesting a slow release strategy adopted by traders building up stocks for the higher prices in June. 10
Using funds as they become available earned by preparing land for others.

7
1.3.10 Regarding the number of farming households, the Mission’s findings suggest that the number is likely to increase concomitantly with population growth, as in previous years, in all counties except Mangala North and Gemeisa payams in Terekeka County, where 2290 IDP hhs are registered. 1.3.11 Regarding farm size, data collected at this round of assessments also suggest that the average farm size is greater than previously thought at around 5 feddans (2.1 ha) in West Equatoria; and 4.4 feddans (1.84 ha) in Central Equatoria. The areas noted include first and second year cassava at a total of 1.5 feddans in the Green Belt (i.e. not Juba or Terekeka Counties), suggesting that 3.5 feddans (1.47 ha) and 2.9 (1.21 ha) feddans respectively are available for field crops being mostly maize followed by sorghum > finger millet > upland rice and groundnuts. Previous CFSAM calculations of the second cereal planting area were made on the basis of the conservative estimate that only 30% of farmers in West and Central Equatoria had second season crops of cereals. The information already acquired during the current Mission, suggests that the number is much greater at around 90%; a factor which requires confirming at the second round of assessments to be conducted at the of the first season and beginning of the planting for the second. If true, cereal area is likely to increase due to greater areas and more double cropping. In 2013, the estimated national cereal area harvested increased by 2.84% above 2012’s revised Mission estimates to 1.1 million hectares. The equivalent data for West and Central Equatoria are 169 171 ha and 160 981 ha respectively. The findings of the planting assessment indicate that the combined increased first and second season cereal planted area in 2014 may be 195 794 ha in West Equatoria and 199 720 ha11 in Central Equatoria. Such estimates should be revisited during the second round of assessments at the time of first harvest and second planting. 2. BACKGROUND INFORMATION 2.1 Agricultural systems 2.1.1 The agro-ecology of South Sudan provides a growing season varying from 130-150 days per annum in the north to 280-300 days in the south-west. Consequently, agricultural performance varies considerably from place-to-place and from year-to-year, ranging from the regular possibility of at least two consecutive harvests from the same area in the Greenbelt located from Tambura to Kajo-Keji to crop failures in the marginal areas of the East Equatoria and Northern Bahr el Ghazal. 2.1.2 Agricultural production is, for the most part, based on small, hand-cultivated units presently farmed mostly by women-headed households belonging to larger family aggregations, which reflects the polygamous nature of most communities. 2.1.3 Animal traction is presently being used in Central Equatoria, Lakes, and Bahr el Ghazal but with the exception of Lakes, at a level that has local rather than national significance. 2.1.4 The repetitive failures of tractor introductions in the public sector since transition (CPA) is evinced by the hundreds of abandoned tractors noted in compounds across the country, most of which have broken-down within the first 1000 hrs of use12. The absence of skilled tractor drivers, spare-parts and good management all contribute to this lack of
11
2 100 ha deducted for IDPs in Terekeka County. 12
As noted on the chronometers.

8
functioning tractors in the public sector. Unfortunately, the recent introduction of two-wheeled walking tractors, a power source eminently more suited for use on the small family farms than the large 4-wheeled units usually imported at enormous cost i.e. 10 x 2-wheeled walking tractors may be purchased for the cost of 1 x 4-wheeled tractor, appears to be heading in the same direction. The current Mission noted abandoned 2–wheeled walking tractors units in Morobo (Dept of Agriculture) and Mundri (Farm Project) for precisely the same predictable reasons for failure, namely poor driving and maintenance skills and no spare parts. This repeat performance is considered by the Mission to be of particular consequence as the units have the potential to become the agricultural / rural equivalent of the motor-cycle goods-trailer of the urban context. The successful introduction of the 2- wheeled walking tractor through lease/lend/ buy service centres could change production from the agricultural sector in the Greenbelt at a single stroke where the area is virtually limitless, rainfall abundant but cultivating power of the hh farm is limited to the amount of land a family can clear, dig and then weed. 2.1.5 Tractors in the private sector last much longer than in the public sector, but their usefulness is challenged by an absence of machinery agents in South Sudan and a reliance on cross-border servicing. Consequently, tractors are noted to be more numerous close to the borders. Furthermore, with high import taxes on both the units and the spares (source: Savannah Farmers’ Cooperative General Manager) there is a reluctance to stock-up on spares well in advance which may effect the timeliness of operations. 2.1.6 Regarding current cereal production, nationally in most small-holder systems farmers grow a wide range of sorghum landraces with minor crops of maize13, bulrush millet, finger millet and upland rice according to location. Maize replaces sorghum as the major cereal in the Greenbelt and in riverine farms in northern Central Equatoria, Upper Nile and is the main staple in Unity State. Throughout the northern states of South Sudan, of the other crops grown groundnuts are make a significant contribution to the household food economy, replacing sorghum, as the main staple in poorer sorghum-growing years when the rains begin later than usual, and providing a regular staple and cash crop in the higher localities with sandier soils. Green grams, cowpeas, beans, sesame, pumpkins and tobacco add to the biodiversity of the northern farming areas. In the south and central areas, although groundnuts and the other crops are grown in quantity, cassava is the most important contributor to the household food economy providing at least half of the carbohydrate ration. As well as minor crops grown in the northern states, sweet potatoes, yams, and tree crops including coffee, mangoes, papayas, citrus and teak are also grown for home and some localized commercial use as shown in Figure 1.
13
Maize replaces sorghum as the major cereal in the Greenbelt and in riverine farms in northern Central Equatoria, Upper Nile and as the main staple in Unity State.

9
Figure 1 South Sudan - Indicative field- cropping calendar
Mar Apr May June July Aug Sept Oct Nov Dec Jan Feb
Unimodal
rainfall
zone
Rainfall Dry season Wet season Dry season
Main
crop
Land
preparation
and
planting
Growing season Harvest
Long-
cycle
crops
Growing season Harvest
Bimodal
rainfall
zone
Greenbelt
Rainfall Dry
season
Wet season Dry-ish season
First
crop
Land
preparation
and planting
Growing season Harvest
Second
& third
crops
Land
preparation
and
planting
Growing
season
Harvest
2.2 Livestock systems 2.2.1 Most livelihoods systems in South Sudan, with perhaps the exception of the Greenbelt where livestock are fewer and far between, include a proportion of their household income from livestock comprising varying numbers of cattle, goats and sheep, village-based scavenging pigs and back–yard poultry, depending upon wealth, household size and structure and location. 2.2.2 The minor and settled (non-transhumant) livestock system in the Greenbelt involves utilisation of local rough grazing (bush-fallow), cereal by-products and brewers’ grains for assorted sheep or goats (5-10), possibly 1-2 house cows per household, and draught oxen in some counties in Central Equatoria. All such animals graze within the vicinity of the village and are tethered during the growing season. 2.2.3 Elsewhere in South Sudan, the transhumant agro-pastoralist production system revolves around two sub-systems; (i) the seasonal movement of herds or flocks in cattle camps between two or more seasonal pasture areas; and (ii) utilisation of crop production by-products and fallow fields with an easy reach from the village, that is the base-camp/ settlement serving the mobile units and supporting changeable sections of the herds and flocks that provide the village with services such as traction and milk or a holding area for animals unable to follow the mobile units due to physiological state. 2.2.4 The pastoralist system is similar to the agro-pastoralist system but has no village-based agriculture. In the pastoralist sub-sector, the herds and flocks are bigger and move in larger aggregations, distances travelled are greater and may involve more locations; but the movements are still transhumant rather than nomadic in the unpredictable-roaming sense of the word. 2.2.5 Most of the domestic livestock population is found in the agro-pastoralist/pastoralist systems. The pastoralist component is, therefore, a livestock rearing system based on the prescribed movement of the majority of the herds and flocks, throughout the year, in search of water and grass. A small part of the herd is held at the home-base either for immediate use or as a way to spread risk. The rest of the herds and flocks are moved in units as

10
combinations of related family units, moving as groups. 2.2.6 Pasture management varies from north to south according to the climatic and edaphic conditions and cordiality of the relationships between tribes, which may loosely be called security. Traditionally, pastoralists move their animals within the framework of drinking water availability and where they know they are able to defend themselves and their assets. Pasture management is, therefore, a secondary consideration, with security always the primary concern. Consequently, the indigenous tropical grasses produce at a level far lower than their genetic potential exhibited by the same grasses on well-managed farms under similar rainfall and edaphic conditions. 2.2.7 Browse provides high protein dietary contributions throughout the year, and, during the dry season, leaves and pods, eaten with the dry grass, raises the digestibility of the diet. The production from browse trees varies from species to species, with age of tree and tree density per unit area. Most pasture management includes i) movements from camp to camp as areas become grazed to a point when further use becomes destructive; ii) daily travel of up to 12-14 km per day from the kraal to grazing areas for the more able/older or more conscientious herder, with earlier morning departures and later evening returns than the less able/often very young or less conscientious herder; iii) combination stocking (mixtures of numbers of cattle, sheep and goats) adjusted to match browse and grass type availability at the preferred sites; iv) changing watering regimes adjusted to account for water availability and the water content of grasses eaten at different times of the year; and the physiological state and associated requirements of the animals in the herd/flock; v) controlled and timely burning of pasture (only if it is expected that the burner will profit from the highly digestible re-growth); vi) shaking high protein pods and leaves/lopping branches/pollarding browse trees for feeding in situ or dragging back to the camp; and vi) regular visits to mineral rich areas included in the round. The transhumant pattern of movements are summarised in Figure 2 below. Figure 2 - Seasonal livestock calendar (major migratory patterns)
2.3 Livestock population in South Sudan 2.3.1 In December 2013, the livestock population was estimated to be a cattle population of 11.77 million head, similar to contemporary population estimates of sheep and goats at around 12 million head each. No further information has been gained in the past 4 months.
Details Months in the year and seasons
J F M A M J J A S O N D
Season Dry Wet Dry Wet Dry
Pastures Scarce Surplus Available Scarce
Water Scarce Limited Plenty Limited Scarce
Location by ethnic group
settled in dry season grazing areas
return to wet grazing areas
grazing within wet season grazing areas
migration initiated to agric by-products
settled in dry season grazing areas-

11
However, the livestock liaison officer should collate reports of movement, numbers, and where possible, performance14 during the coming year as part of the CFSAM Roadmap. 3. FACTORS AFFECTING PLANTING AREA 2014 3.1 Critical factors 3.1.1 The five critical factors affecting planting area in South Sudan termed key constraints in the ToRs of this Mission are 1) the quantity and distribution of rainfall; 2) security-based access to land around the homestead and in the far-fields and farmer confidence; 3) input supply; 4) power sources; and 5) pests and diseases. At the time of writing the Consultant had completed the Planting Assessment Mission to West and Central Equatoria where all factors had been investigated. However:-
FAO staff Missions to Jonglei had been cancelled;
FAO staff Mission to Unity had been unable to leave Bentiu.
Food Security Mission and Emergency Food Security returns from the Food Security Cluster Surveys had not been summarised and were unavailable for review by the Consultant.
Planting Missions15 to Greater Bahr el Ghazal and East Equatoria had not been undertaken.
As a result of the above, the Report covers West and Central Equatoria only. 3.2 Rainfall (2014 and long term average) 3.2.1 Rainfall development to date over the whole country is shown in Annex 2, depicting a very good development so far in Greater Equatoria and most of Greater Bahr el Ghazal, but unfortunately, not including the crisis areas (Jonglei and Unity States and parts of Upper Nile State) in Greater Upper Nile. 3.2.2 More specifically for the counties of West and Central Equatoria, as shown in Figures 3 and 4 below, rainfall performance so far this year (to the end of March), as noted by the satellite- based rainfall estimates and vegetation indexes (NDVIs), present patterns of dekadal rainfall and vegetation growth that are better than the long-term maximum levels for West Equatoria and are “improving” to maximum levels of vegetation in Central Equatoria. The indicators match comments from key informants and case-study farmers that reported that the rains were normal, with an early start followed by a two dekad break before becoming re-established by the end of the Mission and stimulating clearing, cultivating and planting. 3.2.3 Regarding the NDVI figures, the presence of a strong cover of vegetation in January 2014 that is well-above average reflects good rains at the end of 2013. The falling vegetation cover in February follows the usual pattern and is noted to pick up in March, again as expected. Summary maps for the whole of South Sudan are included in Annex 2 for consultation purposes. Compared to other areas, the rainfall so far in Greater Upper Nile has not been conducive to planting, creating a compound crisis that requires further discussion outside the bounds of this report.
14
In this regard, the Assistant Commissioner for Livestock, Terekeka County expressed interest in working with FAO in piloting a simple token based indicator recording scheme. 15
As recommended in the Roadmap.

12
3.2.4 Regarding local rainfall data16, unfortunately, the network of rain gauges established by the WFP- VAM, Rome during the CPA is not functioning as intended. The absence on salaries (2-3 months late) for county-based staff; and, the absence of any recurrent expenditure mean that a) staff at county level are not fulfilling their obligations to collect data from the rain gauges regularly; and b) SMS cards, upon which records retrieval from the more recent introduction of automatic weather stations depend, are not being renewed.
16
Comments may be of significance for the new AFIS programme planners.

13
Figures 3 and 4 Rainfall estimates and Normalized Vegetation Index West and Central Equatoria
3.3 Access to land and farmer confidence. 3.3.1 Mission transect observations taken continuously during the journey presented in Figure 5. The protocols observed are presented in Annex 1.
0
20
40
60
80
100
120
0.00
0.10
0.20
0.30
0.40
0.50
0.60
0.70
0.80
0.90
1.00
1 2 3 1 2 3 1 2 3 1 2 3 1 2 3 1 2 3 1 2 3 1 2 3 1 2 3 1 2 3 1 2 3 1 2 3
Jan Feb Mar Apr May Jun Jul Aug Sep Oct Nov Dec R
ain
fall
(mm
)
ND
VI
Dek|Month
Figure 3 Western Equatoria 2013
LTA
2014
2013
LTA
2014
0
20
40
60
80
100
120
0.00
0.10
0.20
0.30
0.40
0.50
0.60
0.70
0.80
0.90
1.00
1 2 3 1 2 3 1 2 3 1 2 3 1 2 3 1 2 3 1 2 3 1 2 3 1 2 3 1 2 3 1 2 3 1 2 3
Jan Feb Mar Apr May Jun Jul Aug Sep Oct Nov Dec
Rai
nfa
ll (m
m)
ND
VI
Dek|Month
Figure 4 Central Equatoria 2013
LTA
2014
2013
LTA
2014

14
Placed in parallel to roads taken by planting assessment t eam .
Figure 5 Map of transect s taken by CFSAM planting assessment team in Greater Equatoria ; March 2 8 th - April 9 th
14)

15
3.3.2 The histograms in Figure 6 provide a summary by county, of observations made of the frequency of appearance of a) established cassava fields; b) fallow plots/ fields exhibiting either stover or grass; c) freshly cleared/ burned areas; d) cultivated fields and e) planted crops (maize or groundnuts) and f) the bush-savannah background vegetation. The protocols dictate that:-
The appearance of the selected indicators is noted by the vehicle-based observer every minute.
The frequencies are clustered into 12-15 minute means.
The clusters were aggregated to provide total observations by county. 3.3.3 In all cases the intervention (farming) indicators were surrounded by natural vegetation most aptly described as bush savannah. Of the two elements in the bush-savannah complex, sometimes the bush element is dominant; and, sometimes it is the savannah element. From Maridi towards Yambio, the bush developed into forest, noted to include mature mango orchards and singleton mangoes; teak plantations and farm-based teak woodlots; oil-palm groves and a plethora of indigenous timber species (mahoganies) as well as Combretum, Commiphora, Ficus, Butyrus, Balanites, Zizyphus and Acacia species according to location. The forest plus inclusions complex is also the dominant matrix between the town of Nzara and Ezo.

16
Figure 6 West Equatoria: Transect observations scored for frequency of appearance on outward and return journeys from Juba
-10
0
10
20
30
40
50
60
Mundri East
Mundri West
Maridi Iba Yambio 1
Yambio 2
Nzara Ezo
Counties in W. Equatoria
Frequency Scores East-to-West Bush Savannah
Cassava
Fallow
Clearing
Cultivating
Planting
Linear (Bush Savannah)
Linear (Cassava)
Linear (Fallow )
Linear (Cultivating )
Linear (Planting) 0
10
20
30
40
50
60
Ezo Nzara Yambio Iba Maridi Mundri West
Counties in W.Equatoria
Frequency Scores -West to East Bush Savannah
Cassava
Fallow
Clearing
Cultivating
Planting
Linear (Bush Savannah)
Linear (Cassava)
Linear (Fallow )
Linear (Cultivating )

17
3.3.4 Regarding agricultural interventions, as shown in Figure 6:
Cassava in the dominant crop in all counties.
The frequency of maturing cassava (2nd and 3rd year) increases from east to west.
Except for Mundri East (not seen on the return journey) clearing/ cultivating and planting is noted to be occurring in all counties; increasing in frequency from east to west according to normal practice.
On the outward journey fallow land (stover or grass) is noted to decrease from east to west, however, three days later fallow land had decreased to a similar level exhibited in all counties from Ezo to the Yei road junction.
Although not in the figures, the crops being planted were identified as maize and groundnuts.
3.3.5 Similar data from the observations taken in Central Equatoria are given in Figure 7. Figure 7. Central Equatoria: Transect observations scored for frequency of appearance from Mundri to Yei to Terekeka via Juba.
3.3.6 In Central Equatoria, bush savannah dominates the vegetation on the way to Yei from Mundri, with far fewer forestry-fruit inclusions; however, cassava is still the most frequently observed agricultural intervention. In Yei River County, cultivation is apparent with bush-savannah giving way to grass-fallow in ratios that are sustained in Morobo and Kajo-Keji. From Kajo-Keji to Juba County, bush-savannah reappears with decreasing inclusions as dry-land vegetation predominates and is noted to continue along the transects in Terekeka County. Regarding agricultural interventions:
Cassava area decreases dramatically from south to north (Yei to Terekeka).
0
10
20
30
40
50
60
Yei 1 Yei 2 Morobo Kajo-Keji 1 Kajo -Keji 2 Juba Terekeka
Counties in Central Equatoriae
Frequency Scores Bush Savannah
Cassava
Fallow
Clearing
Cultivating
Planting
Linear (Bush Savannah)
Linear (Cassava)
Linear (Fallow )
Linear (Clearing )

18
Clearing of fallow (slash and burn), cultivating and planting are noted to be were beginning with the arrival of regular rainfall, and is according to normal practice.
Although not in the figures, the crops being planted were identified as maize and groundnuts.
3.3.7 Except in Terekeka County, where a total 2290 hh from Mangala North and Gemeisa payams were reported to have been displaced to the river banks and islands, the observation that access to land is normal suggested by transect observations was substantiated by the farmer case-studies and key informant interviews as all informants declared that cultivation and planting was proceeding normally. Therefore, despite the crisis that continues to disrupt life in Greater Upper Nile States and the daily challenges in Juba, the counties in West and Central Equatoria visited during the Mission showed no sign of tension or lack of farmer confidence. Farmers were hoping to expand their areas and although most still had maize for sale, it was felt that they were waiting for prices to go up in May before selling. The ubiquitous presence of cassava provides a safety net for staples in the form of cassava flour, which is connected to an elastic supply of cassava 2yr-3yrs old cassava tubers that are present in the forest/ bush fringes of the farms and are ready for processing at any time in the year. 3.4 Input Supply. 3.4.1 Input use throughout West and Central Equatoria is low. The International Fertiliser Development Company’s initiative ended last year. With the end of the project came the end of subsidised prices, resulting in a suspension of use. This is hardly surprising as the local traders in Yei are i) selling DAP and urea at the same price; ii) allegedly charging 10 SSLs per kg which translates to US$ 2 631 per tonne, when international prices are US $ 540/ tonne for DAP and US $ 380/ tonne for urea. Seed supplies come mostly from farmer-saved seed carried over from the previous season or from kinship or local market sources. Such planting material includes the improved varieties (open-pollinated maize- Longi 5 and Longi 4; sorghum-Serena and Sekado and Serenut groundnuts), as well as local land races. Case–study and key informant data regarding seeds and sources are summarised in Table 1. Table 1 Seed sources by county (* own, kinship or local market) State County Maize Dates Sorghum Dates Gnuts Dates Beans Dates Others
West Eq Mundri Longi 5* 04; 08 Dere* Bari* 04; 08 Serenut* 04; 08 Janjari 08 FM; UR; Cas
Maridi/ Ibba
Longi 5* 03;08 Dere*Bari* Serena*
04; 08 08
Local* 04; 08 Janjari Lubia
08 08
FM; UR; Cas
Yambio Longi 4 or 5*
03; 08 Lodoka* 04; Local* 04; 08 Janjari Lubia
08 08
FM;UR; Cas; SP;Ssm ;
Nzara Amakungu* Longi 4*
04 08
Dere* Serena*
04 06
Red* 04; 08 Janjari 09 FM;UR; Cas; SP;Ssm ;
Ezo Local* Longi*
03;04 08
Serena* Local* Local
03;04 08
Janjari 08;09 FM;UR; Cas; SP;Ssm ;
Cent Equ. Yei River Longi 4,5,6* + traders
04;08 Serena*; Godo*
02 05
Local local
04 08
n/a FM;UR; Cas; SP;Ssm ;
Morobo Longi* O4 Sekado* Godo*
04 05
Local local
04 08
n/a FM;UR; Cas; SP;Ssm ;
Kajo-Keji Longi 5* 04 ;08
Dere* 05 Local local
04 08
Cowpeas 06 ; 08
FM;UR; Cas; SP;Ssm ;
Terekeka Longi * 04 Lodoka* Serena*
05 05
local 04 Cowpeas 05 ;06 Cas;SP
FM=finger millet; UR=upland rice; Cas=cassava;SP=sweet potato; Ssm=sesame.
3.4.2 Sowing rates quoted were consistently in keeping with usual practices noted to be from 5 kg per feddan to 8 kg per feddan for maize and for sorghum (c. 12.5 kg to 20 kg /ha). Groundnut sowing rates were more diverse at 24 to 69 kg/ha but data collection may have suffered from an

19
unshelled- shelled confusion in the details provided. Sowing rates for other field crops were lower than maize and were connected to intercropping with cassava or with sorghum at the second planting season. 3.5 Power sources 3.5.1 As noted in the introduction, South Sudan’s household-based, agricultural sub-sector is predominantly based on hand-digging families. Animal traction exists in some areas, but tractors are rarely used. Public sector tractor services are defined by the tractors that are not working rather than the services they provide; and the private sector services are few and suffer from access to spare parts. As no international tractor agencies are established in South Sudan, all regularly changeable spares for tractors and farm machinery must be imported; causing delays and attracting import taxes. Table 2 provides information by county regarding the power sources used and charges levied this year Table 2 Power sources and costs per feddan. State County Tractor T.
Plough T. Harrow Oxen O.Plough Labour Clear Dig Others
West Eq Mundri 3 350 SSLs/f
n/a 30 pairs
300-450 SSL/f
yes 300-600SSL/f
450 SSL/f
n/a
Maridi/ Iba
3 350-400 SSL/f
n/a n/a n/a yes 400-600SSL/f
1x 2 wheel broken
Yambio 20 in State
270-350 SSL/f
5 pairs yes 350SSL/f n/a
Nzara n/a n/a n/a n/a n/a yes 500SSL/f 600 Saw-mills Tractors
Ezo none n/a n/a yes 25-50 SSL/day
Cent Equ. Yei River 5 inst. 7 private
250SSL/f 350SSL/f
100SSL/f yes 400-500SSL/f
2 wheel- needs to be tested.
Morobo 7 250SSL/f n/a n/a n/a yes 350SSL/f 1x 2 wheel broken
Kajo-Keji 7 220-279SSL/f
n/a Yes number ?
200 SSL/f
Yes Plots 3 x 10 sticks
n/a 175SSL/f 420SSL/f
Oxen want same as diggers.
Terekeka 3 350SSL/f n/a Yes ? yes s/burn 120SSL/f
450 SSL/f
3.6 Pests and diseases 3.6.1 As the Mission took place so early in the season, outbreaks of crop pests and diseases had not yet occurred, therefore few incidents were reported or noted except for a) endemic cassava mosaic and brown streak disease; and b) monkeys, rats, squirrels, termites and local birds eating seeds. As noted in the following sections premature / unusual migrations of herds from Jonglei may turn out to be the greater threat to areas planted than the indigenous pests in the northern payams of the counties visited. 3.7 Livestock numbers / performance 3.7.1 As noted earlier, the data needed to calculate the basic indicators of livestock performance do not exist. Therefore, case-study returns regarding livestock production emanating from semi-structured interviews cannot be verified by observations of records. Local herd and flock structures, noted by the Mission during the case-studies and confirmed during key informant interviews, suggest that in West and Central Equatoria Greenbelt counties, the main livestock rearing system is goat-based and comprises small sedentary, self-replacing units. Other ruminant

20
livestock kept by the households comprise small flocks of sheep, 1-2 house cows and store-stock (animals purchased for fattening from Greater Bahr el Ghazal). Table 3 provides a breakdown of the information retrieved relating to local livestock by county. Table 3 Summary of Livestock returns –sedentary hh livestock. State County Numbers Performance PET Scores
(Body Cond.) Disease/ Vaccination
Pasture / water
Unusual migration (D-G, MoA; W. Equat.)
Prices
West Eq Mundri Normal Normal Goats 4; Cattle 3
ECF CCPP
Both very good
2,900 head. Accord17 made with Bor Dinka.
Firm
Maridi/ Ibba
Increasing Normal Goats 4 None Both very good
45,000 ex Jonglei Firm
Yambio Increasing Normal Goats 4 ECF, CCPP, CBPP
Both very good
None Firm
Nzara Normal Normal Goats 4 None rptd Both very good
Increase in store stock18 Firm
Ezo Normal Normal Goats 4 Cattle 3-4
None rptd Both very good
None- Bororo presence from CAR -noted as usual
Firm
Cent Equ. Yei River Increasing Normal Goats 4 Cattle 4 2014>13
None rptd Both very good
Tethering not yet started- wandering stock
Firm
Morobo Normal Normal Goats 4 Black quarter
Grass very good; water scarce
Tethering not yet started- wandering stock
Firm
Kajo-Keji Normal Normal Goats 4 Ticks Both very good
Increase to east ex Juba County
Firm
Terekeka Normal Calving 60% Kidding 70%
Sedentary 14>13. Cattle camp- mode=2
Black quarter CCPP
Both very good
No information Firm
ECF=East Coast Fever; CCPP= contagious caprine plural pneumonia; CBPP= contagious bovine plural pneumonia.
3.7.2 The D-G for Agriculture, West Equatoria State reported the following unusual ( early) migrations of cattle to the Mission; in Tambura arrival of 3150 head ex Jonglei; in Mvolo arrival of 25,000 head ex Lakes; in Maridi ( North) arrival of 45,000 head ex Jonglei and in Mundri West arrival of 2,900 head ex Jonglei. If the numbers continue to rise, the initiative taken by No- violence, the NGO noted by the Mission to be preparing an accord between farmers/administrators and Bor Dinka in Mundri, may need to extend their initiative designed to establish protocols and cattle corridors in farming areas. 3.7.3 Abnormal movements of cattle were reported in Central Equatoria, away from the capital area towards the hills in Kajo Keji. 3.8 Livestock body condition 3.8.1 In the absence of production data, livestock body condition score is a suitable means of indicating the status of any herd or flock, and by inference a) its likely performance in recent months to date; and b) how it should be managed in the coming weeks. Livestock body condition change is an even better indicator. In this respect, the Mission set out to establish existing body condition scores at the end of the dry season as both a one-off indicator of the state of livestock in each county at the end of the dry season; and, to produce the first record in what should become a regular method of assessing livestock condition using a simple, standard operating procedure of recording condition three times a year.
17
NGO negotiating rules/ regulations called Non- Violence April 2014. 18
Livestock bought out of state brought for fattening and re-sale in 2-3 months.

21
3.8.2 Due to the rapid nature of the Mission, all herds and flocks passed during vehicular transects were rough-scored according to mode. The mode is the most common obvious score in the group under observation. As there is no time while passing, albeit slowly, animals in transit, to score such animals individually, there is ample time to group-score or to record the “mode”; that is to say, on passing a herd, or watching a herd pass across in front of the vehicle, there is time to note with confidence the score of most animals. 3.8.3 In such a way, goats in all locations in all counties were predominantly noted to be tightly positioned in score 4; sheep ranged a little more widely, with group scoring encompassing both 2s and 3s; and the cattle mode noted is Body Condition Score “2”, observed only once during the Mission, connecting to a 1000 head cattle camp in Kado, Terekeka County. 3.8.4 The mode scores show all species in the Greenbelt to be in very good condition for an assessment conducted at the end of the dry season. However, the cattle in Kado, Terekeka County, have a low mode for a mixed herd (bulls, steers, heifers as well as milking and dry cows). The Mission notes that regrowth in Kado was only just starting in the ranges presently being used in Kado; and, the animals seem to have already grazed most of the residual grasses in a 15 km radius of their camp as judged by a single direction transect. 4. CONCLUSIONS 4.1 Effect of rainfall. 4.1.1 Planting in the Greenbelt has begun, stimulated by what may be described as normal rainfall. More precisely, the rainfall so far in 2014 has sustained vegetation growth as estimated by NDVIs at the maximum long-term estimates. 4.2 Effect of access to land and confidence. 4.2.1 Access to land close to the homestead, with the exception of 2290 hh in Mangala North and Gemeisa payams in Terekeka County, poses no problem to other farmers in any of the eleven counties visited by the Mission. The 2290 hh mentioned have been displaced to riverine area and islands in the same county. While some intrepid hh members within the IDPs have returned to plant their farms, at this stage it seems improbable that the estimated c.5 000 feddans (2 100 ha) of cereals usually grown, will contribute to the county’s harvest. Access to far-fields is noted to be normal in all but the two locations noted above; and farmer confidence in production is noted to be higher than normal. 4.3 Effect of inputs 4.3.1 Regarding inputs, no shortages of seeds that are usually used throughout the Greenbelt are noted. Seeds used are predominantly home-grown, kinship shared or purchased in the local market at normal grain prices noted to be between 1 to 3 SSLs per kg19. Such seeds include the a) maize - the range of Longi releases of maize including Longi 4, Longi 5 and Longi 6, that are grown mostly for sale in the second season, when storage conditions are more favourable and marketing is more flexible; and b) Local maize landraces grown in the first season for consumption – green-roasted or hh use, and immediate sale.
19
Improved seeds imported by seed merchants retail between 7-to- 10 SSLs/ kg for maize

22
4.3.2 Regarding minor crops in the Greenbelt, groundnuts seeds are purchased in local markets for planting for the first season and carried over on-farm for the second season. Sorghum varieties used include Serena and Sekoda, and a range of niche sorghum landraces viz bari (early maturing) and dere / lodoka (late maturing) - are all usually carried over from the previous year’s harvests. The mission identified variously some 200 tonnes of potential maize seeds available from farmers’ associations in Mundri, Nzara and seed dealers in Yei- (Greenbelt Seeds Company). In addition, the Savannah Farmer’s Cooperative is providing improved seeds to 1600 maize outgrowers for grain for their flour mill. 4.3.3 Fertiliser use, stimulated by the IFDC programme of subsidised introduction of DAP and urea during the last 2-3 years, is noted to have declined dramatically due to the farmers’ perception of no perceived advantage i.e. “our land is fertile”, conditioned by allegedly exorbitant prices i.e. DAP the being sold at the same price as urea; and 1 kg of each is quoted as selling for 10 SSLs i.e. the retail price is 2 631 US/tonne compared to the current international prices of DAP at US$ 580 /tonne and urea at US$ 390/tonne. 4.4 Effect of power supply. 4.4.1 Despite power sources for land preparation appearing to be diminishing rather than increasing in the Mission locations, estimates of areas planted to cereals this year are expected to be 3.5 feddans (1.47 ha) in West Equatoria and 2.9 feddans (1.21 ha) in Central Equatoria as against 1.38 ha/ hh and 1.04 ha /hh used as last year’s CFSAM estimates. Furthermore, key informants and case studies confirmed that second planting of maize and groundnuts is conducted by an estimated 90% of farmers in the Greenbelt counties visited (i.e. not Terekeka or Juba counties) not 30% of the farmers as previously thought. 4.5 Effect of pests and diseases. 4.5.1 At this early stage of the agricultural year, plant pests and diseases were more anticipated than actual but included sowing-time, forest-inhabiting hazards including birds, squirrels, rats, termites, porcupines and weevils in store. Cassava mosaic and brown streak diseases are endemic, however, regarding the former, more clean fields than dirty fields were noted in walking transects in the counties visited, where yields of 2 yr cassava planted at 1.5 m centres are estimated after sampling as producing at c. 20 tonnes fresh tubers per ha (c 8 tonnes /feddan); thereby establishing solid food security safety nets throughout the areas visited. 4.5.2 A bigger threat in savannah areas may well be caused by unusual migratory patterns of transhumant livestock herds pushed from Jonglei, Lakes and Juba County into areas away from the conflict zones. So far, the Mission notes that some 75,000 head are reported to have entered the northern Greenbelt, without any untoward effects reported. If the crisis continues, this number will certainly rise. Therefore, the exemplary action of the NGO No violence who are presently brokering an accord between herders and settled farmers in Mundri, needs to be considered from the point of view of the usefulness of their action, elsewhere. 4.6 Planted area 4.6.1 In 2013, the estimated national cereal area harvested increased by 2.84% above 2012’s revised Mission estimates to 1.1 million hectares. The equivalent data for West and Central

23
Equatoria were 169,171 ha and 160,981 ha. The information already acquired by this Mission suggests that estimated cereal area in 2014 is likely to increase to 195 794 ha in West Equatoria and 199 720 ha20 in Central Equatoria. 4.6.2 Where a Plant Assessment Mission like this one, cannot be mounted for access reasons, aerial transects as described in Annex 1, along routes linking locations of agricultural activity are highly recommended.
20
2 100 ha deducted for IDPs in Terekeka County.

24
Annex 1 Observational Transects
A transect is “a path along which observations are made and records are taken at regular intervals, for future analyses.”
Transects have been useful tools in the study of natural, physical and man-made phenomena for centuries. They can be walked, driven, flown or studied virtually.
The usefulness of any transect depends on the relevance of the indicators selected, the rigour with which the indicators are observed and the diligence with which the observations are recorded.
In the context of Crop and Livestock Assessments, every journey should be considered to be a “transect” in which observations are recorded in a formal, rigorous manner. This approach enables the Team to gain;
• air travel: an overview of land occupied within existing settlements, any new settlements, farms being extended (“far-fields”), areas cultivated/ planted within farms, dominant crops, and later in the season, areas already harvested. PLUS location, size and proportional mix of herds and flocks; and three broad-based levels of forage availability ability (completely grazed, grazing on-going, untouched).
• road travel: a detailed record of agricultural activities regarding crops and animals including signs of access to land, frequencies of appearance of clearings, burning, cultivating, land forming (bunds- dykes-mounds), planting, stage of growth/development, state of harvest, PET yield range, general impressions of quality of performance from all localities traversed within and between zones. PLUS forage available and “mode” condition of livestock herds and flocks passed on or by the side of the road.
• walking: very detailed descriptions of crops grown, forage available and animals present. PET close –up scores at harvest time for crops; and all through the year for livestock condition scoring techniques. Use PET forages residual biomass scores in dry season
Having decided to “make each journey a “transect”, the team leader must decide on an approach (and team members follow it). The following suggestions may help.
Air transects (standard single-engine or twin-engine aircraft)-suggested protocol.
When organizing flights to or between entry points, accept the predetermined (usually the shortest) routes as the sample transects but:
• If the aircraft are chartered, have low-flying (500m-1000m) included in the terms of the contract.
• If the flights are regular UN flights, ask to fly low for the whole journey: request this through WFP when the routes are presented to flight operations; confirm the request with the pilot on each trip.
• Arrange for the key assessor/recorder to have pole position next to the window and behind the pilot with a view of the dials/meters for direction, altitude and speed.
For a charter flight, arrange this directly with the pilot.
For a regular UN flight, request to reserve the seat on each flight when making the flight booking.
Teams should be flexible, however: low flying increases fuel use and therefore costs; in areas of permanently low cloud cover, observation may require pilots to fly lower than the 500m but, in conflict areas, they may have to fly higher than 500m for security reasons.
During flights: From take-off to landing, the key assessor should continuously record, from one side of the plane, the phenomena under study observed at an angle of 60˚. This gives information from a strip of land 860m to 1720m wide depending on height above the ground. Other team members should be requested to try to do the same thing on the other side of the plane so doubling the size of the strip. Always look slightly forward not back.
Prepare and use a table to enable the observer to record the phenomena under study in a series of columns using simple ticks or numbers. A typical recording sheet is shown in Figure 1. At the end of each transect (journey) sum the scores for each column to get a description of overall agricultural conditions along the flight path.

25
Table 1: Air Transect Sample Table
Date: Journey: Altitude:
Time Dir. Village size
(A)
% hh
farming
% fields cropped/farm
Far fields
Y/N
Main crops (B)
Stage
(C)
Forage
(D)
Herds size( E)
Other
10.00hrs NW 1 70 80 N c green 1 3 x 20 cattle swamp
10.03hrs NW 3 65 80 N c green 1 1 x200 sheep swamp
A Estimate in units of 10 houses
B Make up a suitable code. (cereals =c; groundnuts= gn; cassava=cv ..etc.)
C Green; mature; harvested, stover collected. - make up a code.
D Code: 1 = used-up; 2=- being grazed; 3=– untouched
E It’s easier if counting is done in groups of 10 animals. Cattle have their size foot print and move slowly; sheep and goats can be differentiated by their scatter at the appearance of a low flying aircraft- goats disperse, sheep flock together.
Road transects- suggested protocol.
Use all road travel - on main roads, minor roads and tracks - as transects. These trips provide important opportunities to widen the understanding of the agricultural situation that should not be lost:
• Vehicles should be chosen with care so that observations are possible. High hedges or perennial grasses obscure the view from a normal Land Cruiser. Pick-ups that allow crop assessors to stand in the back afford much better views and should be the preferred vehicle under most circumstances; roof racks and window sills have sometimes been used as perching places off-road to obtain better views. However, assessors must also observe the highway-code on the main roads and ensure that they are perching safely;
• Decide on indicators to be used before departure.
• Prepare a clipboard with an easily completed transect form based on an A4 sheet in portrait.
o Draw parallel columns on each sheet for each indicator. The first column will show time of observation; the others connect to indicators of interest at the time of the journey;
o Standardise the recording procedures for all teams i.e. decide on a symbol for each indicator/ or either absence/ presence, positive/ negative for general pieces of information;
Pre-planting;-
1. Existing vegetation (forest, bush, savannah, last year’s stover, last year’s fallow, new clearing (forest), new slashing-new burn, old burn, pre-season cultivation, new hand digging-by labour gang or household, new ploughing –oxen/donkey; new ploughing by tractor; land-forming ( bunds, mounds; drains). 2. Sowing-planting (if possible–note crop);

26
3. Manuring/fertiliser distribution; 4. Germination –note crop; vegetative stages (height or leaf number) 5. Other actions (possible weeding; spraying; irrigating; harvesting irrigated crops).
o At harvest time use PET colour clusters / PET scores when appropriate to record approximate yields.
o Use PET Livestock Sudan condition scores for livestock body condition and PET forages scores for residual forages in the dry season.
Drivers should travel at speeds that allow continuous observation, i.e. about 40-60 km/hour on main roads and < 20 km/hour on tracks;
o Note date, route, time of departure on first page of the log for the journey.
o From departure score 2x every minute; driving at a steady speed; each A 4 page will cover
20-30 minutes offering a 10 -20 km cluster of information.
o Calculate means for each cluster that will provide data for overall mean for the journey.
• Livestock passed should be noted by species, condition scored by mode (most frequently occurring score in group).
Forage condition should be noted and residual biomass scored using PET Sudan forage cluster notations.
Walking transect- suggested protocol. On arrival at a designated area, or, an area of specific interest as determined by the results of the initial observations, or at predefined regular intervals:-
Observers leave the vehicle and switch to walking transects;
Each walking transect should encompass a significant numbers, which will depend on the location e.g. a 5 km walking transect in an irrigation scheme may encompass 100 farms; in a rain-fed area a transect of a similar distance may only pass through 20 areas of farm land given fallowing and movement.
Walking transects enables the assessors to look in detail at the fields, stage of crop growth, pests and disease levels; and, at harvest time using the PET Crops photo-indicators, score every field by using a yield estimate.
After suitable intervals case-studies with available farmers should be conducted using the CFSAM checklist. Such case-studies will take at least 1 hr. or longer if interpreters are needed.
Depending on the confidence of the assessor, the case-study occasions offer the opportunity to take a proper crop sample of at least 1 square metre (depending on field size and variation), thresh and weigh the product to a) obtain an objective measurement of the yield of the field under study; and b) to check the assessors use of the PET.
Similarly, o all livestock may be scored individually, and recorded according to class (i.e. dry females,
milking females, slaughter stock, store stock, heifers/ gimmers; draught animals); o residual forage (stover, perennial grasses and annual grasses) may also be scored using PET
Livestock (forages) photo indicators, with occasional cut sample cross–checks against the use of the photographs. The frequency of scoring will depend on the size of the pasture- but the intervals should be a) regular, b) involve 4 observations made though a 360◦ circle at each stop.
o All scores may be transcribed into dry matter weights per hectare. NB. As the transects progress, dominant crops will change. Each new crop will require a PET “close-up” inspection and PET cross-check (during a case-study) to confirm the assessor is using the photo indicators correctly. Such inspections may be done at the administrative centre farms with associated crop cutting,

27
threshing and weighing of sampled crops as shown below. Choose a straight forward, homogenous field to check yourself. The transect approach requires stamina and perseverance to be successful: • Crop assessors need to get a feeling for conditions as they change from place-to-place. They must be ready to withstand the dust, heat and wind associated with open top vehicles or windows being open. Other team members travelling with crop assessors must be ready to accept these conditions. • Drivers must be prepared to work extended hours and accept that their vehicles are going to get dirty both inside and out. The vehicle, on a continuing mission of several days, becomes at the same time, the office, the communications centre (radio link), the store for samples, the workshop and the field laboratory. Immediate advantages accrue if the job is done properly. On many occasions, teams have arrived at an entry point office to be met with claims of crop failure or animal starvation from officials who have rarely left their desks. Having just driven across at least part of the area, well-taken transect records enable the team to be able to enquire further on the solid basis of empirical information, often gained over hundreds of kilometres. When all sub-teams do the same thing, the accumulated knowledge of the season places the CFSAM team in a strong position to explain its findings and justify its conclusions in debriefing sessions, challenging opinions founded on rumour or vested interest, whenever it is necessary. Longer-term advantages arise at the report writing stage, when the conditions by zone are described in more detail.

28
Annex 2 Rainfall estimates
29
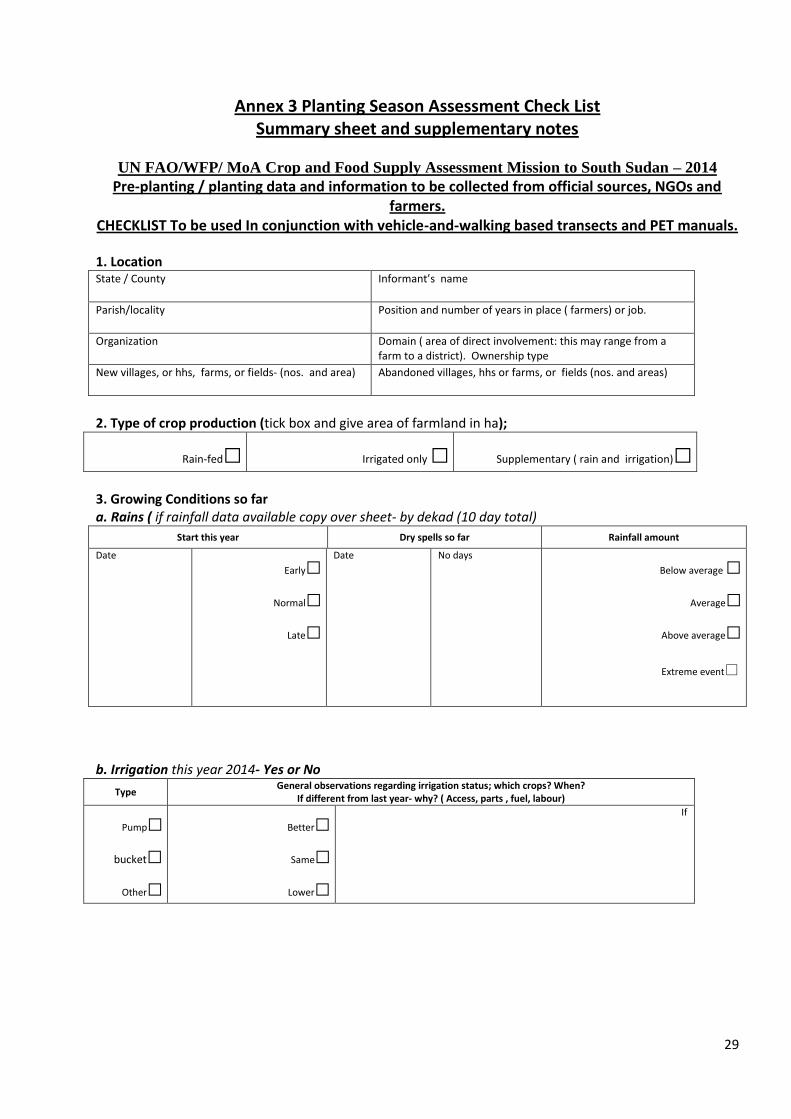
Annex 3 Planting Season Assessment Check List Summary sheet and supplementary notes
UN FAO/WFP/ MoA Crop and Food Supply Assessment Mission to South Sudan – 2014
Pre-planting / planting data and information to be collected from official sources, NGOs and farmers.
CHECKLIST To be used In conjunction with vehicle-and-walking based transects and PET manuals. 1. Location State / County Informant’s name
Parish/locality Position and number of years in place ( farmers) or job.
Organization Domain ( area of direct involvement: this may range from a farm to a district). Ownership type
New villages, or hhs, farms, or fields- (nos. and area) Abandoned villages, hhs or farms, or fields (nos. and areas)
2. Type of crop production (tick box and give area of farmland in ha);
Rain-fed□ Irrigated only □ Supplementary ( rain and irrigation)□
3. Growing Conditions so far a. Rains ( if rainfall data available copy over sheet- by dekad (10 day total)
Start this year Dry spells so far Rainfall amount
Date
Early□
Normal□
Late□
Date No days
Below average □
Average□
Above average□
Extreme event□
b. Irrigation this year 2014- Yes or No
Type General observations regarding irrigation status; which crops? When?
If different from last year- why? ( Access, parts , fuel, labour)
Pump□
bucket□
Other□
Better□
Same□
Lower□
If

30
4. 2014 Agricultural situation / inputs supply (ring yes or no); if yes tick boxes in columns & fill in costs etc).
Below normal
Normal Above normal
Type of costs/ availability/ quality and other.
Access to farm land ( near fields by house)
Access to farm land ( far fields, own field or group)
Labour supply >>>>>>.Yes or No
Agricultural tools supply >>>>>>.Yes or No
Oxen supply (own or shared or hired) >>>>>>.Yes or No
Tractor supply ( own/ shared or hired).Yes or No
Fuel supply>>>>>>.Yes or No
Spare parts supply>>>>>>.Yes or No
Seeds supply Main source: ( general statement)
Seed quality ( general statement)
Manure supply ( own stock /grazing over/ cattle camp) >>>>>.Yes or No Main source: ( general statement)
Fertiliser supply (chemical- urea/DAP/ compound)>>>>>>> Yes or No
Credit/grants supply >>>>>>.Yes or No Main source: Interest rate:
5. Actual activities to date in 2014 compared to 2013- use data ( weight or area) if available or comparative descriptor-e.g earlier/later; more/less;
RAPID Estimate of farm area = (state radius or 2 radii of farm seen as an oval-see Annex 1)
Activities Early Sorghum
Mid sorghum
Late sorghum
Maize Millets Gnuts Sweet Potatoes
Cassava Other
‘14 ‘13 ‘14 ‘13 ‘14 ‘13 ‘14 ‘13 ‘14 ‘13 ‘14 ‘13 ‘14 ‘13 ‘14 ‘13 ‘14 ‘13
seeds own (kg) market seeds ( kg) (price/kg) improved seeds ( kg) price/kg)
Cultivation (hand,
animal/tractor)
Sowing dates Replanting = Y/N and dates

31
6. Any pests / diseases / other losses so far this year 2014 Yes or No
Crop affected and area ( ha)
Control + area ( ha)
Response Other Comment
Yes’ how?
No Mild Gap
filling
Replant
field
7. Household livestock (Yes or No)
Mostly transhumant / Mostly sedentary
Total No.
March 2014
Total No.
March 2013
Sold this year 2014 (m or
f) vs
20‘13
Number breeding females
Now Vs
2013
% of females calving/ kidding
Body Condition
(1-5) PET Score
Now March 2014
Body Condition
(1-5) PET Score
March 2013
Diseases 2014
confirmed Or
treated
Diseases 2013
confirmed Or
treated
Adult
mortality ‘13/’14
Neo- natal mort.
’13/’14
Cattle
Sheep
Goats
Poultry
Other
Remarks:
Reasons; prices; comments;
8. Pasture & water for livestock [Condition: See photo indicators PET red ( good); yellow( moderate .) ;blue ( poor); include ZERO-where
pasture has disappeared.
Condition Now
2014
Condition previous year,
2013
Remarks including any changes in movements (transhumance, access to usual locations)
Pasture
Water
9. General Status of interviewees Current 2014 3 months ago March 2013 Comments on changes
Cereal stock (hh, community, govern.) Products (food & other items) bought or sold in the market
Other sources of cash income
Petty trade Wage labour
Handicrafts Remittances
Other
Petty trade Wage labour
Handicrafts Remittances
Other
Petty trade Wage labour
Handicrafts Remittances
Other Food aid received (kg) Other assistance received
Extreme events/ forced migration.
Unforced migration

32
10. Market Prices: Is interviewee using market ; Yes or No- if yes -Buying or Selling ? (Only collect direct first
hand info not hearsay- guesses) Market location: INCLUDE UNITS
Mar 2014 3 months
ago Mar 201
Future trend (up/down)
Remarks
Crops Buy Sell
Sorghum
Maize
PMillet
F Millet
Rice
Beans
Ground nuts
Cassava dry( flour)
Cassava fresh
Sesame
Other (fruit, vegetables)
Livestock
Cattle: Heifer
Breeding cow
Cull cow
Steer
Breeding Goat
Male Goat
Breeding ewe
Ram
Cull ewe/goat
Other
Terms of trade
kgs of main cereal for 1 goat
11. Market conditions: Location Distance
CONFIDENCE in Current situation- stocks/ sales Changes compared with previous
year
Links & trade with main wholesale markets
Range & quantities of food items available
Range & quantities of inputs and other items available
Summary Sheet Planting Assessment 2014
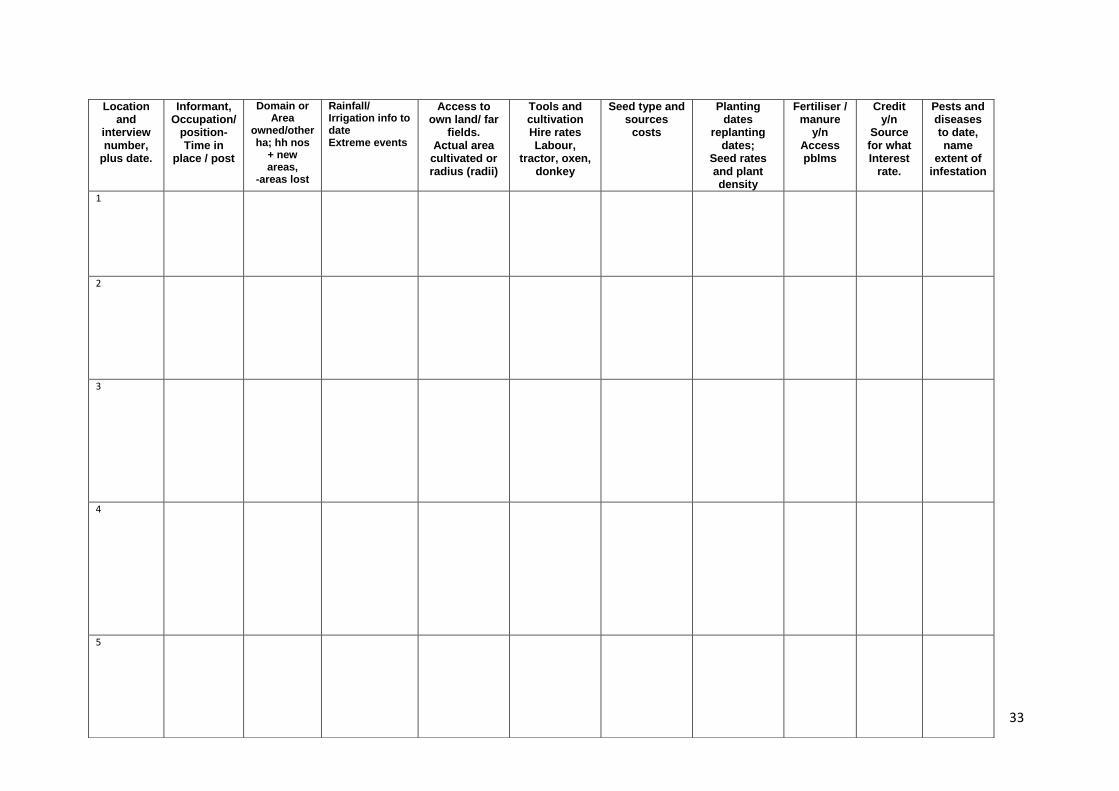
33
Location and
interview number,
plus date.
Informant, Occupation/
position- Time in
place / post
Domain or Area
owned/other ha; hh nos
+ new areas,
-areas lost
Rainfall/ Irrigation info to date Extreme events
Access to own land/ far
fields. Actual area
cultivated or radius (radii)
Tools and cultivation Hire rates Labour,
tractor, oxen, donkey
Seed type and sources
costs
Planting dates
replanting dates;
Seed rates and plant density
Fertiliser / manure
y/n Access pblms
Credit y/n
Source for what Interest
rate.
Pests and diseases to date, name
extent of infestation
1
2
3
4
5

34
Livestock Numbers & Body Condition,
Performance to date birth %s mortality rates –adult/ neo-natal
Animal diseases this year, confirmed, treated
Livestock movement, Timing this year
Access pasture and water availability
Livestock Selling Y/N, where/when Prices
Crop Stocks and Markets and prices
Extreme events; assistance; other
1
2
3
4
5
35
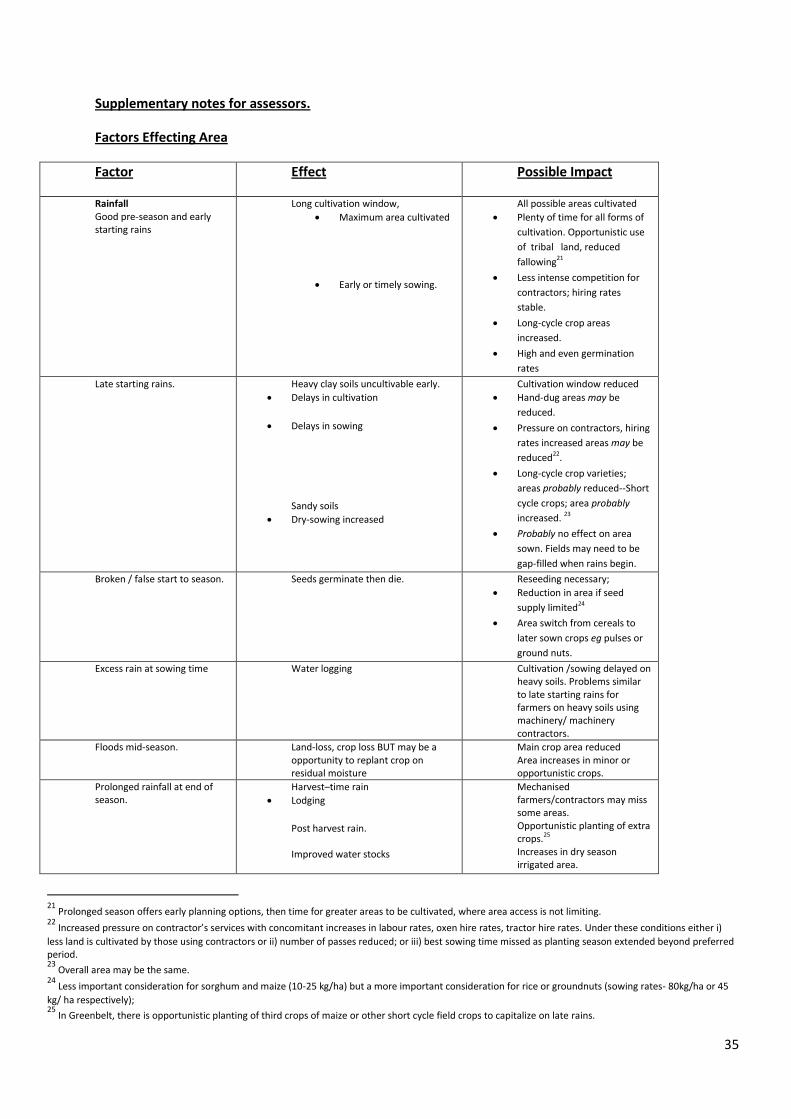
Supplementary notes for assessors.
Factors Effecting Area
Factor Effect Possible Impact
Rainfall Good pre-season and early starting rains
Long cultivation window,
Maximum area cultivated
Early or timely sowing.
All possible areas cultivated
Plenty of time for all forms of
cultivation. Opportunistic use
of tribal land, reduced
fallowing21
Less intense competition for
contractors; hiring rates
stable.
Long-cycle crop areas
increased.
High and even germination
rates
Late starting rains. Heavy clay soils uncultivable early.
Delays in cultivation
Delays in sowing
Sandy soils
Dry-sowing increased
Cultivation window reduced
Hand-dug areas may be
reduced.
Pressure on contractors, hiring
rates increased areas may be
reduced22.
Long-cycle crop varieties;
areas probably reduced--Short
cycle crops; area probably
increased. 23
Probably no effect on area
sown. Fields may need to be
gap-filled when rains begin.
Broken / false start to season. Seeds germinate then die. Reseeding necessary;
Reduction in area if seed
supply limited24
Area switch from cereals to
later sown crops eg pulses or
ground nuts.
Excess rain at sowing time Water logging Cultivation /sowing delayed on heavy soils. Problems similar to late starting rains for farmers on heavy soils using machinery/ machinery contractors.
Floods mid-season. Land-loss, crop loss BUT may be a opportunity to replant crop on residual moisture
Main crop area reduced Area increases in minor or opportunistic crops.
Prolonged rainfall at end of season.
Harvest–time rain
Lodging
Post harvest rain. Improved water stocks
Mechanised farmers/contractors may miss some areas. Opportunistic planting of extra crops.25 Increases in dry season irrigated area.
21
Prolonged season offers early planning options, then time for greater areas to be cultivated, where area access is not limiting. 22
Increased pressure on contractor’s services with concomitant increases in labour rates, oxen hire rates, tractor hire rates. Under these conditions either i)
less land is cultivated by those using contractors or ii) number of passes reduced; or iii) best sowing time missed as planting season extended beyond preferred period. 23
Overall area may be the same. 24
Less important consideration for sorghum and maize (10-25 kg/ha) but a more important consideration for rice or groundnuts (sowing rates- 80kg/ha or 45
kg/ ha respectively); 25
In Greenbelt, there is opportunistic planting of third crops of maize or other short cycle field crops to capitalize on late rains.
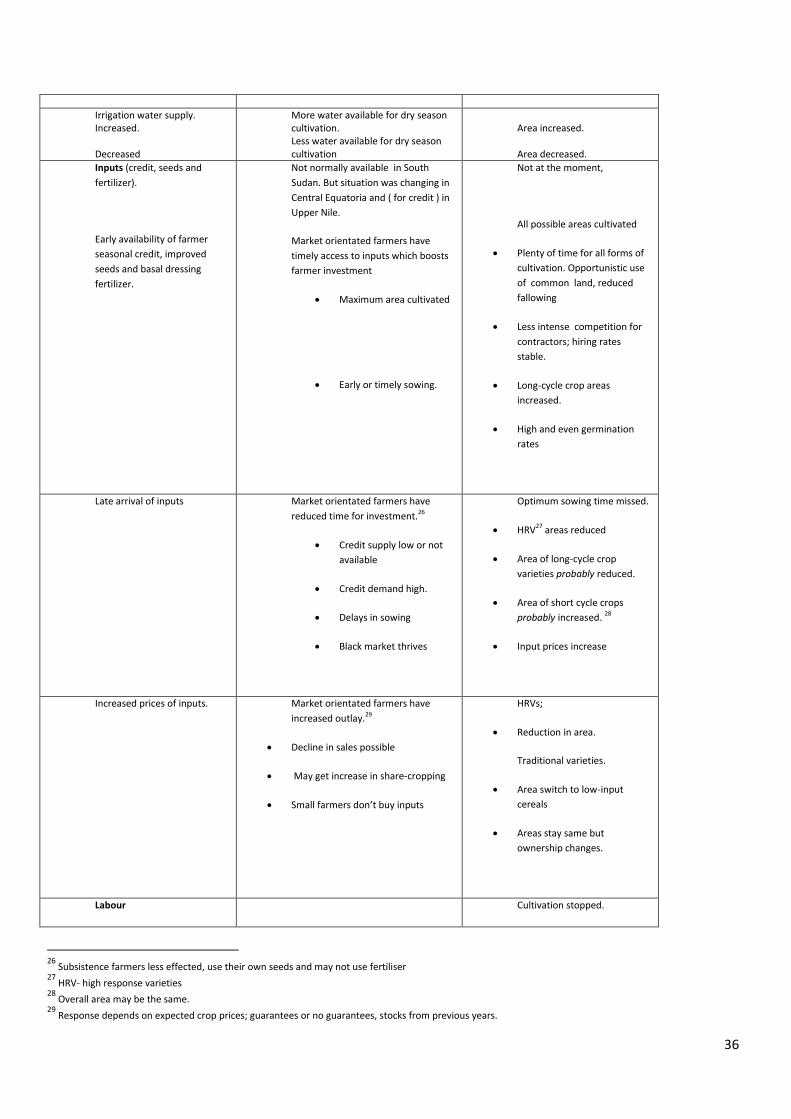
36
Irrigation water supply. Increased. Decreased
More water available for dry season cultivation. Less water available for dry season cultivation
Area increased. Area decreased.
Inputs (credit, seeds and
fertilizer).
Early availability of farmer
seasonal credit, improved
seeds and basal dressing
fertilizer.
Not normally available in South
Sudan. But situation was changing in
Central Equatoria and ( for credit ) in
Upper Nile.
Market orientated farmers have
timely access to inputs which boosts
farmer investment
Maximum area cultivated
Early or timely sowing.
Not at the moment,
All possible areas cultivated
Plenty of time for all forms of
cultivation. Opportunistic use
of common land, reduced
fallowing
Less intense competition for
contractors; hiring rates
stable.
Long-cycle crop areas
increased.
High and even germination
rates
Late arrival of inputs Market orientated farmers have
reduced time for investment.26
Credit supply low or not
available
Credit demand high.
Delays in sowing
Black market thrives
Optimum sowing time missed.
HRV27 areas reduced
Area of long-cycle crop
varieties probably reduced.
Area of short cycle crops
probably increased. 28
Input prices increase
Increased prices of inputs. Market orientated farmers have
increased outlay.29
Decline in sales possible
May get increase in share-cropping
Small farmers don’t buy inputs
HRVs;
Reduction in area.
Traditional varieties.
Area switch to low-input
cereals
Areas stay same but
ownership changes.
Labour Cultivation stopped.
26
Subsistence farmers less effected, use their own seeds and may not use fertiliser 27
HRV- high response varieties 28
Overall area may be the same. 29
Response depends on expected crop prices; guarantees or no guarantees, stocks from previous years.

37
Crisis displacement with
labour shortage early in
season.
Crisis displacement with
labour shortage late in season.
Long term migration.
Abandon village fields- early season.
New clearings unlikely.
Abandon village fields late season.
Farming population reduction.
Area reduced
Area switch to late-sown crops
No expansion of cultivated
area
Harvest missed.
Area lost
Fewer farming households.
Possible area reduction30
Possible land
redistribution/share
cropping31
Power sources
Draught animals- viral diseases
(epidemic eg rinderpest);
Draught animals- stole during
conflicy or
distress selling (most
households)32
Dramatic loss, oxen sharing cannot
keep- up with demand.
Dramatic loss, oxen sharing cannot
keep- up with demand.
Fewer animals to cultivate.
Area reduction.
Fewer animals to cultivate.
Area reduction.
Tractor availability disturbed.
Tractors removed, stolen or
broken.
Spare parts stolen or supply
chain cut.
Fuel /oil supply cut-off or
delayed.
Credit late or withdrawn
Hire prices dramatically
increased
Contractors raise prices Black-market
flourishes.
Investors reduce area unless price
forecasts good.
Owner- farmers struggle to find fuel.
Owner- farmers struggle to find fuel.
Hiring farmers cannot afford tractor
hire.
Long queues for few tractors
.
Area probably sustained,
quality falls.
Area reduced or redistributed
to very wealthy.
Area reduced or redistributed
to very wealthy.
Area reduced or one pass
only-reduces quality.
Area reduced or one pass
only-reduces quality.
Farmer Confidence
Falling confidence
Local conflict/insecurity-
All farmers- No far fields.
All farmers.
Area reduced increased fallow
30
Areas deserted by customary farmers, left unfarmed by others. 31
Land farmed by others in their absence (tribal agreements); squatting on abandoned government land 32
Rapid turnover of draught animals is valid strategy in trypanosomiasis areas. (Buy pre-season-sell post season; avoid feeding expenses/risk in dry season )
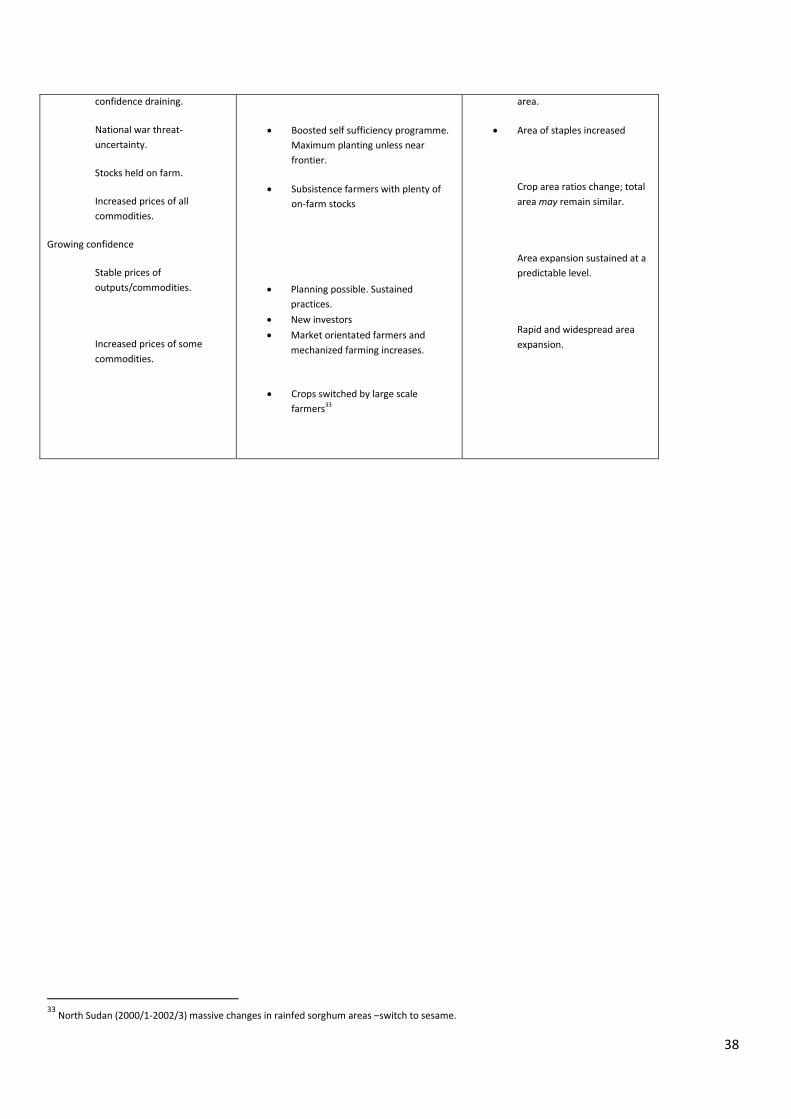
38
confidence draining.
National war threat-
uncertainty.
Stocks held on farm.
Increased prices of all
commodities.
Growing confidence
Stable prices of
outputs/commodities.
Increased prices of some
commodities.
Boosted self sufficiency programme.
Maximum planting unless near
frontier.
Subsistence farmers with plenty of
on-farm stocks
Planning possible. Sustained
practices.
New investors
Market orientated farmers and
mechanized farming increases.
Crops switched by large scale
farmers33
area.
Area of staples increased
Crop area ratios change; total
area may remain similar.
Area expansion sustained at a
predictable level.
Rapid and widespread area
expansion.
33
North Sudan (2000/1-2002/3) massive changes in rainfed sorghum areas –switch to sesame.