Repex Model Review - Australian Energy Regulator Powercor...Repex Model Review July 2010 CitiPower -...
60
Repex Model Review July 2010 CitiPower - Powercor Parsons Brinckerhoff Australia Pty Limited ABN 80 078 004 798 Level 27, Ernst & Young Centre 680 George Street SYDNEY NSW 2000 GPO Box 5394 SYDNEY NSW 2001 Australia Telephone +61 2 9272 5100 Facsimile +61 2 9272 5101 Email [email protected] Certified to ISO 9001, ISO 14001, AS/NZS 4801 CitiPower_Powercor_Repex_Review_V2_0.doc
Transcript of Repex Model Review - Australian Energy Regulator Powercor...Repex Model Review July 2010 CitiPower -...

Repex Model Review
July 2010
CitiPower - Powercor
Parsons Brinckerhoff Australia Pty Limited ABN 80 078 004 798
Level 27, Ernst & Young Centre 680 George Street SYDNEY NSW 2000 GPO Box 5394 SYDNEY NSW 2001 Australia Telephone +61 2 9272 5100 Facsimile +61 2 9272 5101 Email [email protected]
Certified to ISO 9001, ISO 14001, AS/NZS 4801 CitiPower_Powercor_Repex_Review_V2_0.doc

CITIPOWER_POWERCOR_REPEX_REVIEW_V3_0.DOC
Revision Details Date Amended By
1 Preliminary Draft 28 June 2010 E. Mudge, J. Thompson
2 Draft 30 June 2010 J. Thompson
3 Final 05 July 2010 J. Thompson
©Parsons Brinckerhoff Australia Pty Limited (PB) [2010].
Copyright in the drawings, information and data recorded in this document (the information) is the property of PB. This document and the information are solely for the use of the authorised recipient and this document may not be used, copied or reproduced in whole or part for any purpose other than that for which it was supplied by PB. PB makes no representation, undertakes no duty and accepts no responsibility to any third party who may use or rely upon this document or the information.
Author: John Thompson, Evan Mudge .......................................................
Signed: ........................................................................................................
Reviewer: J. Thompson ...................................................................................
Signed: ........................................................................................................
Approved by: J. Thompson ...................................................................................
Signed: ........................................................................................................
Date: 30 June 2010 ..................................................................................
Distribution: CitiPower - Powercor .....................................................................
Please note that when viewed electronically this document may contain pages that have been intentionally left blank. These blank pages may occur because in consideration of the environment and for your convenience, this document has been set up so that it can be printed correctly in double-sided format.

Repex Model Review
PARSONS BRINCKERHOFF CITIPOWER_POWERCOR_REPEX_REVIEW_V3_0.DOC Page i
Contents Page number
Glossary iii
Executive summary iii
1. Introduction 1
1.1 Background 1
1.2 Report outline 2
2. CitiPower submission 3
2.1 Submission outline 3
2.2 Key issues 3
2.3 Asset management plans 4
2.4 Summary 5
3. Powercor submission 6
3.1 Submission outline 6
3.2 Key issues 6
3.3 Asset management plans 7
3.4 Summary 8
4. The Nuttall review 9
4.1 Review approach 9
4.2 PB assessment 10
4.2.1 Rejection of business proposals 10 4.2.2 Basis for the substitute forecast 12 4.2.3 Inconsistent application of substitute forecasts 13
4.3 CitiPower findings 16
4.3.1 Specific issues 19 4.4 Powercor findings 20
4.4.1 Specific issues 22
5. Repex model review 24
5.1 Key inputs and outputs 24
5.2 Replacement Algorithm 25
5.2.1 Normal distribution assumption 26 5.2.2 Standard deviation assumption 28

Repex Model Review
Page ii CITIPOWER_POWERCOR_REPEX_REVIEW_V3_0.DOC PARSONS BRINCKERHOFF
5.2.3 Age as a proxy for condition assumption 29 5.3 Calibration 30
5.3.1 Calibration Outputs 31 5.4 PB’s findings - CitiPower 33
5.5 PB’s findings - Powercor 35
6. Conclusions 37
List of tables Page number
Table 1 – Replacement capital - 2011-15 regulatory control period $’000s (real 2010) 3
Table 2 – Replacement capital - 2011-15 regulatory control period $’000s (real 2010) 6
Table 3 – CitiPower Review Summary ($m 2010) 16
Table 4 – Powercor Review Summary ($m 2010) 20
Table 5 - Repcalc algorithm input variables 25
Table 6 - Calibrated life v expected life for all DNSPs 32
Table 7 - Calibrated life v expected life for CitiPower 33
Table 8 - Calibrated life v expected life for Powercor 35
Appendices Appendix A
CV – John Thompson
Appendix B
CV – Evan Mudge

Repex Model Review
PARSONS BRINCKERHOFF CITIPOWER_POWERCOR_REPEX_REVIEW_V3_0.DOC Page iii
Executive summary
CitiPower and Powercor (the businesses) have engaged Parsons Brinkerhoff (PB) to undertake an independent review of the methodology and calibration of the Repex model, which underpins the alternative replacement capex forecasts developed by Nuttall Consulting (“Nuttall”) for the current Australian Energy Regulator’s (AER’s) review of the businesses.
In undertaking our review, PB considered the businesses regulatory submissions and the key drivers of growth in the proposed replacement capex for the next regulatory control period. We noted that the replacement capex proposals are based on the business’ Asset Management Plans (AMPs), as well as specific programs of work. In the case of CP almost 50% of the growth in replacement capex is related to a targeted fault level mitigation project, while almost 60% of the replacement capex growth for PAL is driven by the proposed conductor replacement program. In both businesses the recent introduction of Condition Based Risk Management (CBRM) practices to major plant and equipment categories has also had a considerable impact on replacement capex growth.
PB’s review focused on relevant sections of the Nuttall report and AER’s draft determination. From our review of the Nuttall report PB has a number of concerns with the approach adopted in the review. In particular PB is of the opinion that it is unusual that the business’ models have been found to be suitable for business’ asset management practices but inappropriate for the regulatory review process. Moreover, while the Nuttall report contains little fundamental analysis of the business’ needs, risks, and proposed expenditure (prudency and efficiency) to support the dismissal of the business’ AMP’s, it relies on comparison to an unreviewed age based proprietary model to accept/reject the business proposals and as the basis for the substitute forecast. PB reviewed the application of the Repex model and is of the opinion that Nuttall’s replacement capex modelling does not align with the specific risks and needs identified in the businesses’ AMPs, and does not reflect the specific risks faced by the business over the next regulatory control period. Additionally, PB is of the opinion that considerable discretion has been exercised with regard to selection of a substitute forecast based on the 2006-2008 average, the Repex model results, or the business’ forecast.
PB’s review also considered that application of the National Electricity Rules which required a substitute forecast to be based on the current regulatory proposal, and must only amend the proposal the extent necessary to enable it to be approved by the AER. However, Nuttall’s substitute forecast is based on the independently developed Repex model, and there is no demonstration that the Repex model adjusts only to the extent required to achieve the capital expenditure objectives, or that the substitute forecast is sufficient to meet the expenditure needs of the businesses over the next regulatory control period. Given that the specific needs and risks identified in the AMPs include factors other than age, it is not clear to PB how the Repex model is able to estimate the risks associated with replacement drivers that are not related to time based deterioration or do not fit the assumed failure profile. Therefore, PB does not consider that Nuttall’s replacement capex model results are likely to produce a reasonable forecast of capital expenditure that reflects the circumstances of the businesses over the 2011-2015 period.
PB’s review has also found that the application of the Repex model as the basis for accepting/rejecting the replacement capex proposals creates an inherent bias in the total substitute forecast due to the acceptance of forecasts below the Repex model results and rejection of those above. PB understands that, given the limited calibration of the Repex model at a detailed level, the model is only intended to produce a reasonable estimate at the total expenditure level. Therefore, using Repex model forecasts at the activity code level as an acceptance/rejection criterion is inappropriate. Furthermore, despite the reliance on the Repex model as the baseline efficient forecast, no attempt has been made to compare the businesses proposed total replacement capex with the total expenditure calculated by the calibrated Repex model. In practice, Nuttall’s rejection of all activity code forecasts above the Repex model forecast (or historical levels) results in a substitute total replacement forecast that is materially below both the

Repex Model Review
Page iv CITIPOWER_POWERCOR_REPEX_REVIEW_V3_0.DOC PARSONS BRINCKERHOFF
forecasts proposed by the businesses, and the total replacement forecast predicted by the calibrated Repex model.
CitiPower findings
In our review of Nuttall’s CP findings we noted that the CP proposal (when the step change Fault Level Mitigation Project and the reclassified Reliability Improvement expenditure is put aside) is only 3% higher (approx.) than the total expenditure forecast by the calibrated Repex model, and 9% higher than the total substitute forecast recommended by Nuttall. In PB’s opinion, a 3% variation between a ‘top down’ forecast modelled on asset age and a ‘bottom-up’ forecast based on asset condition and risk is well within the range of reasonable modelling expectations, while the 9% difference is a result of the inconsistent use of the Repex model as a substitute forecast, and as the basis to accept/reject at the activity code level. Hence PB considers that the submitted proposal should be accepted as the baseline for the replacement capex forecast, and variations to the proposed forecast should be supported by clearly defined scope changes or alternative options based on a fundamental analysis of the businesses AMPs.
Powercor findings
In reviewing Nuttall’s PAL findings we noted that the PAL proposal (when the step change Conductor Replacement Program and Reliability Improvement activity code expenditure is put aside) is 6% lower (approx.) than the total expenditure forecast by the calibrated Repex model, and 22% higher than the total substitute forecast recommended by Nuttall. In PB’s opinion, a 6% variation between a ‘top down’ forecast modelled on asset age and a ‘bottom-up’ forecast based on asset condition and risk is within the range of reasonable modelling expectations, while the 22% difference is a result of the inconsistent use of the Repex model as a substitute forecast, and as the basis to accept/reject at the activity code level. Hence PB considers that the submitted proposal should be accepted as the baseline for the replacement capex forecast, and variations to the proposed forecast should be supported by clearly defined scope changes or alternative options based on a fundamental analysis of the businesses AMPs.
The Repex model
PB reviewed the Repex model, the underlying code, and the commentary provided in the Nuttall report to the extent possible given that the model relies a proprietary function that is not well documented. However we did not attempted to undertake a comprehensive audit or independent verification of the model or calculation methodology.
Our review of the Repex model highlights several issues of concern. Specifically, the assumption of a normal distribution as the basis modelling remaining life, the standard deviation assumption used in the Repex model, and the use of age as a proxy for asset condition. As the goodness of fit of the assumed normal distribution has not been demonstrated, PB is concerned that unless the distribution is well fitted to the underlying remaining life distribution of the assets (likely to be a Weibull distribution) then the Repex model may understate the required replacement volumes in the early stages of the asset wear out period, and understate the risks in future regulatory control periods due to the expectation of unrealistically long asset lives for a significant proportion of the population. Similarly we found that Nuttall’s standard deviation assumption is not demonstrated, and any error in the standard deviation estimate is likely to produce a materially different failure profile and a material error in the Repex model’s results. With no demonstration of the goodness of fit, in PB’s opinion the use of an assumed standard deviation means that the calibration process is unlikely to produce accurate forecasts.
PB is also concerned with the use of age as a proxy for asset condition in the Repex model. We note that this approach is highly dependent on an appropriate and reasonably homogenous asset categorisation, as well as assumptions of life extension or refurbishment practices and the absence of any significant non-time based drivers (e.g. obsolescence). As the businesses have based their replacement capex proposals on asset condition and other business drivers, and in the absence of any consideration of the

Repex Model Review
PARSONS BRINCKERHOFF CITIPOWER_POWERCOR_REPEX_REVIEW_V3_0.DOC Page v
activity code level asset categories, PB considers that the use of age as a proxy for condition is not a reasonable assumption when uniformly applied across all activity codes.
PB also gave consideration to the calibration of the Repex model through our review. However, as Nuttall does not report any information on the model accuracy, calibration results, or demonstrate the goodness of fit of the assumed normal distribution, PB has taken the approach of assessing the model’s accuracy indirectly through the resulting calibrated lives used by Nuttall.
PB notes that the Repex model implicitly assumes the assets homogeneous at the activity code level, and therefore there should be a significant degree of alignment of the ‘calibrated’ average replacement lives across the businesses. In our review we found that for all the activity codes except the Distribution Transformers code, the calibration process requires lives that are outside normal industry expectations. Similarly, in nine of the eleven categories, the variation between the highest and lowest calibrated lives is greater than the variation between the businesses’ expected values. In our view, this divergence indicates that the model is not predicting similar lives for similar assets, and suggests that the model is not calibrated to the underlying time-based deterioration modes common between the businesses. In the absence of a robust explanation, these differences appear to be the result of the model’s simple approach of fitting a normal distribution to a single historical point using the asset life (as the only independent variable available) to force the fit. Where the assumed distribution is a poor fit, or where the historical data at the point of calibration is dominated by non-time based deterioration modes (e.g. obsolescence), the life found by fitting the distribution in this manner will be arbitrary, and forecasts based on lives ‘calibrated’ in this way will be meaningless. Hence, it is more likely that the extended lives arising from the calibration process are primarily a result of the forced fit of the model to historical data. In PB’s opinion these results indicate that the any assertion that the model is calibrated is poorly supported, and the model is unlikely to produce a reasonable forecast of the businesses’ replacement expenditure requirements at an activity code level.
CitiPower Repex model calibration
In reviewing the calibration of the Repex model PB observed in 7 of the 11 activity codes CP’s expected lives were at the upper end of industry expectations, and yet to calibrate the Repex model significant life extensions were needed in most categories, and results in the calibrated average lives exceeding the upper end of typical industry expectations.
To test if the calibrated lives are reasonable in their own right PB considered the case of CP’s underground cables which comprise 43% of the network replacement value. From our analysis we noted that the calibrated average life of 87 years for CP is 17 years longer than that applied for Jemena and United at 60 years, and 44 to 45 years longer than that applied for SP AusNet and Powercor at 42 and 43 years respectively. Given the average life of 87 years, and Nuttall’s standard deviation approximation, this suggests an expectation that 20% of the cable population will remain in service for over 95 years, with 8% remaining in service for over 100 years. PB is not aware of any Australian distributor that would expect any cables to remain in service for over 100 years. Therefore we consider that the calibrated life input to the model does not appear to be aligned with industry expectations.
Similarly, PB notes that in the case of CP’s Secondary Systems, an average life extension of 6 years has been applied over the PAL proposed life of 49 years. In our opinion this ignores the fact that equipment of this type are typically replaced due to obsolescence, withdrawal of vendor support, or the unavailability of spares, and PB considers that the likelihood of achieving an average service life extension of this magnitude is extremely low without accepting the considerable amount of additional risk, or incurring mitigating expenditure associated with operating obsolete equipment.
Furthermore, when compared to the calibrated life expectations for the other Victorian businesses, it is clear that there is a calibration disparity. For example the life of underground cables on the PAL network (under common ownership and management as the CP network) has been calibrated downward by 26

Repex Model Review
Page vi CITIPOWER_POWERCOR_REPEX_REVIEW_V3_0.DOC PARSONS BRINCKERHOFF
years from the same original expected life of 60 years. As illustrated above, Nuttall’s calibrated lives assume that the entire population of underground cables on the PAL network would be largely replaced by 60 years, where end of life failures are only beginning for the CP network. It is not clear why cables on the CP network are expected to achieve service lives that are twice as long as the average service life on the PAL network.
In our opinion, a difference of this magnitude without a robust explanation reinforces our view that the model is not robustly calibrated to time based failure modes. PB considers that the use of a calibrated life that is well beyond normal industry expectations may significantly understate the reasonable level of total replacement capex required over the next regulatory control period.
Powercor Repex model findings
In reviewing the calibration of the Repex model PB observed in 6 of the 11 activity codes PAL’s expected lives were at the upper end of industry expectations. While only modest life extensions were needed to calibrate the Repex model in most categories significant adjustments were made in the OH Conductor, UG Cables, Power Transformers and Secondary Systems activity codes which Together comprise approximately 41% of the replacement value of the asset base.
To test if the calibrated lives are reasonable in their own right PB considered the case of PAL’s Secondary Systems activity code which was subject to an average life extension of 16 years over the PAL proposed life of 41 years. In PB’s opinion this ignores the fact that equipment in this category is typically replaced due to obsolescence, withdrawal of vendor support, or the unavailability of spares. In practice, the likelihood of achieving an average service life extension of this magnitude is extremely low without accepting the considerable amount of additional risk, or incurring mitigating expenditure associated with operating obsolete equipment.
In our opinion, a difference of this magnitude between the calibrated life and practical considerations reinforces our view that the model is not robustly calibrated to time based failure modes. Noting the significant adjustment applied by Nuttall’s for this activity code, PB considers that the use of a calibrated life that is well beyond normal industry expectations, may significantly understate the reasonable level of total replacement capex required over the next regulatory control period.
PB’s conclusions
From our review PB considers that Nuttall’s dismissal of the expenditure proposal does not reflect the specific risks faced by the business over the next regulatory control period and that Nuttall’s replacement capex modelling does not align with the specific risks and needs identified in the businesses’ AMPs.
Through our review we also found that the AER’s approach assumes that the asset condition and associated business risks over the period from 2006 to 2008 are not materially different to those expected over the next regulatory period. In the absence of an ex-post review of the drivers of actual replacement expenditure, PB considers that limited conclusions can be drawn based on historical levels of expenditure, particularly over relatively short periods. Additionally, in our view the AER’s approach has not resulted in a substitute forecast that is based on the businesses’ current regulatory proposals, nor has the Repex model forecast been shown to be the minimum adjustment required to achieve the capital expenditure objectives. Therefore the substitute forecasts may not be sufficient to address the specific needs and risks identified in the businesses’ submitted AMPs. Hence PB does not consider that Nuttall’s replacement capex model results are likely to produce a reasonable forecast of capital expenditure that reflects the circumstances of the businesses over the period 2011-2015.
Our review also found that limited confidence could be placed in the model’s calibration or the modelling assumptions, and that the age based calibration results do not align with reasonable industry expectations for the asset classes. In our opinion, Nuttall’s replacement capex modelling is unlikely to

Repex Model Review
PARSONS BRINCKERHOFF CITIPOWER_POWERCOR_REPEX_REVIEW_V3_0.DOC Page vii
produce capex forecasts at the activity code level that can be reasonably substituted for the businesses capex forecasts for the 2011-2015 period.

Repex Model Review
PARSONS BRINCKERHOFF CITIPOWER_POWERCOR_REPEX_REVIEW_V3_0.DOC Page 1
1. Introduction CitiPower Pty (“CP”) and Powercor Australia Ltd (“PAL”), (“the businesses”), have engaged Parsons Brinkerhoff Australia Pty Limited (“PB”) to undertake an independent review of the methodology and calibration of the alternative replacement capex forecasts developed by Nuttall Consulting (“Nuttall”) for the current Australian Energy Regulator’s (AER’s) review of the businesses.
This report provides PB’s independent review of the Nuttall replacement capex forecasting methodology and calibration, and specifically PB’s opinions on:
whether Nuttall’s replacement capex modelling reflects the businesses asset management plans
whether the use of the 2006-08 expenditure is appropriate for forecasting expenditure in 2011-15, and has the Nuttall report sufficiently considered the actual and expected capex in the 2006-10 regulatory control period
whether Nuttall’s replacement capex modelling is likely to produce a reasonable forecast of capital expenditure in consideration of the circumstances of the CP and PAL networks through the period 2011-15
whether Nuttall’s replacement capex modelling is likely to produce capex forecasts that can be reasonably substituted for the businesses capex forecasts for the 2011-15 regulatory control period.
1.1 Background
In undertaking their assessment of the regulatory proposals submitted by CP and PAL, the AER engaged Nuttall to provide specific technical advice regarding the businesses’ capital expenditure proposals. To support the review of the businesses’ replacement capex, Nuttall developed a replacement capex model (the Repex model), and has relied upon the results of this model in making replacement capex recommendations to the AER.
In their recent draft determination1, the AER has relied upon the recommendations put forward in the Nuttall report2, and rejected the businesses’ replacement capex forecasts. In its draft determination the AER has set out alternative capex forecasts which are based largely on the application of the Repex model3.
In responding to the AER’s draft determination, CP and PAL are reviewing the AER’s findings, Nuttall’s recommendations, as well as the Repex model and its application in the context of their network management circumstances.
1 Australian Energy Regulator, “Victorian electricity distribution network service providers Distribution
determination 2011–2015, Draft decision”, June 2010. 2 Nuttall Consulting, “Report – Capital Expenditure, Victorian Distribution Revenue Review, A report to
the AER, Final Report”, 4 June 2010. 3 Australian Energy Regulator, “Victorian electricity distribution network service providers Distribution
determination 2011–2015, Draft decision”, June 2010, p. 355, pp. 365-366.

Repex Model Review
Page 2 CITIPOWER_POWERCOR_REPEX_REVIEW_V3_0.DOC PARSONS BRINCKERHOFF
CP and PAL have engaged PB to undertake an independent review of the methodology applied by Nuttall in arriving at the recommendations for the alternative replacement capex forecasts, and in particular the application of the Repex model and its calibration.
1.2 Report outline
The following sections of this report set out PB’s review of the Nuttall report and the Repex model. An overview of the business submissions is considered in order to provide the context for the Nuttall review, and then the approach taken and findings of the Nuttall review are considered. This is followed by a review of the Repex model and its application to modelling the replacement capex of the businesses, with a specific emphasis on the approach taken in applying the Repex model and its calibration. PB’s opinions and our conclusions are set out in the closing sections.

Repex Model Review
PARSONS BRINCKERHOFF CITIPOWER_POWERCOR_REPEX_REVIEW_V3_0.DOC Page 3
2. CitiPower submission This section of the report sets out a brief overview of CitiPower’s (CP) regulatory submission, and provides the context for the Nuttall review of CP’s replacement capex.
2.1 Submission outline
In section 5.6 of CP’s “Regulatory Proposal 2011-15” (dated 30 November 2009); CP sets out its replacement capex proposal under the Reliability and Quality Maintained (RQM) category. The submitted replacement capex forecasts represent CP’s estimate of the capital necessary for the purposes of clause 6.5.7(a) of the National Electricity Rules (the Rules), in order to ensure that CP’s distribution system and network services meet relevant quality, reliability, safety, and security of supply standards.
Table 1 sets out CP’s forecast replacement capex for the 2011-15 regulatory control period in the context of the total demand and non-demand capex proposed by CP in its regulatory submission. CP’s submission notes that the forecast replacement capex represents an increase of approximately 103 per cent over the anticipated replacement capex of $168 million ($2010) during the current regulatory control period4.
Table 1 – Replacement capital - 2011-15 regulatory control period $’000s (real 2010)
Capex category 2011 2012 2013 2014 2015 Total
Reliability and quality maintained
56,099 69,357 63,795 69,781 83,030 342,062
Total demand and non-demand related
223,966 242,849 241,556 233,230 233,343 1,174,944
RQM % of Total 25.0 28.6 26.4 29.9 35.6 29.1 Source: CitiPower Pty, “Regulatory Proposal 2011-15”, 30 November 2009, Table 5.1, p. 51.
In support of its replacement capex forecast, CP provided information relating to its Asset Management Plans (AMP) and asset management processes, relevant key drives of the expenditure, as well as specific information relating to particulars of its replacement capex forecast. The key issues relating to the development of CP’s replacement capex forecast are considered briefly in the following sections.
2.2 Key issues
In developing its capex forecast, CP notes in its submission that reducing fault levels and replacement of plant and equipment are the two main areas of forecast investment that contribute to the growth of replacement capex over the 2011-15 regulatory control period5.
The forecast fault level reduction expenditure is associated with a specifically targeted program of works to redress increasing fault levels arising from growing system fault levels and the increasing volume of embedded generation. This program arises from a detailed
4 CitiPower Pty, “Regulatory Proposal 2011-15”, 30 November 2009, Table 5.1, p. 115. 5 ibid, p. 107.

Repex Model Review
Page 4 CITIPOWER_POWERCOR_REPEX_REVIEW_V3_0.DOC PARSONS BRINCKERHOFF
study of the specific fault level issues6, and accounts for almost 50% of the forecast increase in replacement capex.
The remaining increase in forecast replacement capex is associated with plant and equipment replacement programs that arise from CP’s application of Reliability Centred Maintenance (RCM) and Condition Based Risk Management (CBRM). In its regulatory submission CP notes that RCM practices are applied to the routine replacement of smaller items of plant and equipment, having regard to the age of the asset and its operating environment. CP also notes that as RCM practices have been applied in the current regulatory control period, they have no significant impact on the forecast growth in replacement capex. However, CBRM practices were introduced in the current regulatory control period, and do have an impact on replacement capex in last years of the current regulatory control period as well as replacement capex forecast for the next regulatory control period. Significantly, CBRM is applied to the replacement of large plant and equipment, with considerable impact on zone substation primary plant replacements. Hence the introduction of CBRM has considerable impact on the overall forecast growth in replacement capex7.
CP’s regulatory submission also notes that historical asset failure rates have not been directly used in estimating the forecast replacement capex. However, historical failure rates are implicit within CP’s replacement capex forecast as they result from CP’s current asset management policies, and these policies form the basis of the replacement capex forecast8.
A further key point in CP’s regulatory submission is the approach used to calculate the weighted average remaining life of assets for the purposes of populating table 2C of the Regulatory Template 6.2. In estimating the weighted average remaining life of assets, CP used a modelling approach that takes a high level view of the condition of assets in order to calculate the theoretical weighted average remaining life of assets. Importantly however, this remaining life forecast is completely independent of CP’s replacement capex forecast9.
2.3 Asset management plans
CP has developed a number of Asset Management Plans (AMPs) for specific asset types that are based on CP’s asset management framework and supported by an extensive suite of documentation. This documentation framework is modelled around the total asset management process as presented in the Publicly Available Specification 55 (PAS55) published by the British Standards Institute. CP notes that it is moving towards being consistent with PAS55-110.
In undertaking this review PB was provided with copies of the following asset management plans:
HV Circuit Breakers Asset Management Plan (CP-AMP-05 - Issue 1.0 Ver. 1.0, Nov 2009)
6 ibid, pp. 107-109. 7 ibid, pp. 104-107, 113-116. 8 ibid, p. 112. 9 ibid, pp. 109-110. 10 ibid, p. 105.

Repex Model Review
PARSONS BRINCKERHOFF CITIPOWER_POWERCOR_REPEX_REVIEW_V3_0.DOC Page 5
Network Asset Replacement Policy for 3000A LV Air Circuit Breakers - Type Nilsen "AB" Series (18-05-CP0009 - Issue No: 1.0, 24/10/2009)
Indoor HV Switchgear Asset Management Plan (CP-AMP-06, Issue 1.0 Ver. 1.0, Nov 2009)
Zone Substation Transformers Asset Management Plan (CP-AMP-04, Issue 1.0 Ver. 1.0, Nov 2009)
While PB has only undertaken a preliminary review of these documents, we note that they are fairly typical of such documentation within the industry, and seem relatively complete. We also note that these documents form the basis of the replacement capex forecasts for the next regulatory control period, and provide a financial summary of the capex and opex requirements under each respective AMP. However, as these documents are asset management plans, they do not provide any economic or risk assessment details, and PB notes that we have not reviewed any documentation that addresses the economic aspects of these plans.
2.4 Summary
PB has undertaken a high level review of the relevant sections of CP’s regulatory submission, and the supporting AMPs. From our review we note that CP has derived its forecast replacement capex from its AMPs, and that these AMPs underpin CP’s progressive move to a condition based replacement regime.
From CP’s submission PB also notes that the main factors driving the growth in forecast replacement capex are mainly attributable to the proposed expenditure to address a specific fault level issue, and the impact of recently introducing the CBRM methodology. In particular, PB notes that CBRM has been recently applied to major plant and equipment, and that its application to zone substation plant and equipment has contributed significantly to the growth in forecast replacement capex. We also note that the CBRM model provides a forward view of replacement needs based on a detailed view of equipment condition and risk derived from inspections and test reports. Hence while CP states that it does not have any software based replacement models, CBRM is itself such a model.
Repex Model Review
Page 6 CITIPOWER_POWERCOR_REPEX_REVIEW_V3_0.DOC PARSONS BRINCKERHOFF
3. Powercor submission This section of the report sets out a brief overview of Powercor’s (PAL) regulatory submission, and provides the context for the Nuttall review of PAL’s replacement capex.
3.1 Submission outline
In section 5.6 of PAL’s “Regulatory Proposal: 2011-15” (dated 30 November 2009), PAL sets out its proposed replacement capex under the Reliability and Quality Maintained (RQM) category. The submitted replacement capex forecasts represent PAL’s estimate of the capital necessary for the purposes of clause 6.5.7(a) of the National Electricity Rules (the Rules), in order to ensure that PAL’s distribution system and network services meet relevant quality, reliability, safety, and security of supply standards.
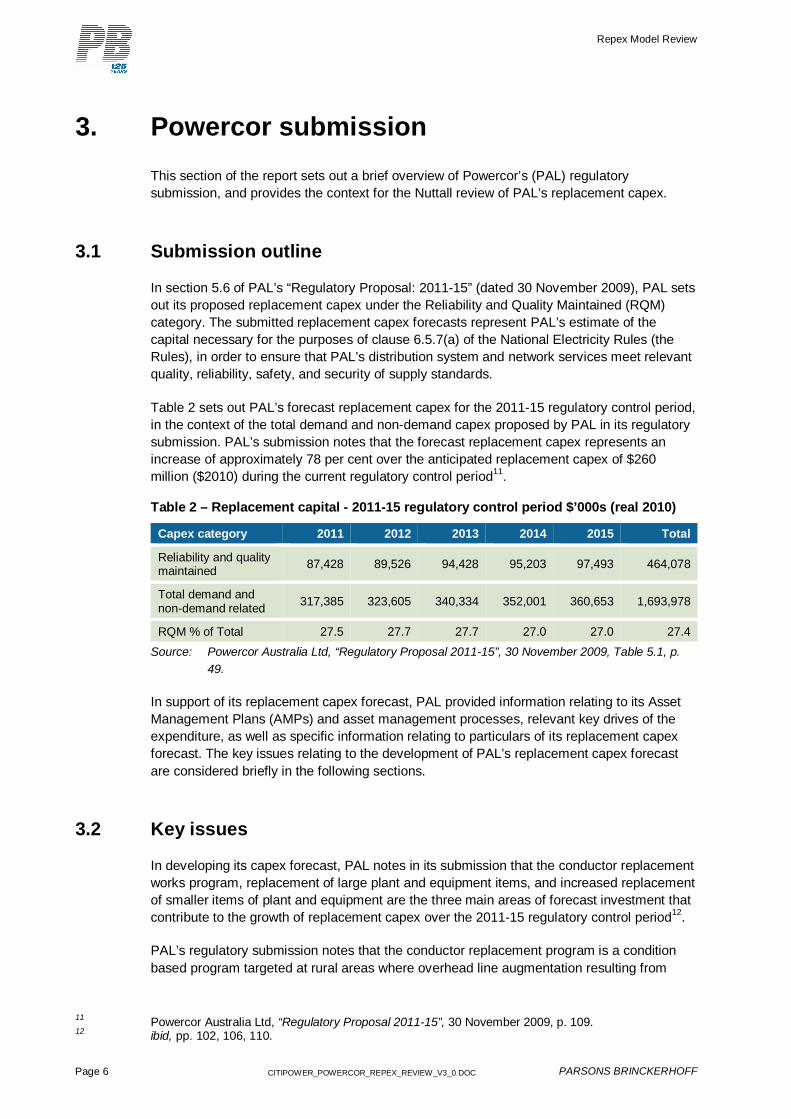
Table 2 sets out PAL’s forecast replacement capex for the 2011-15 regulatory control period, in the context of the total demand and non-demand capex proposed by PAL in its regulatory submission. PAL’s submission notes that the forecast replacement capex represents an increase of approximately 78 per cent over the anticipated replacement capex of $260 million ($2010) during the current regulatory control period11.
Table 2 – Replacement capital - 2011-15 regulatory control period $’000s (real 2010)
Capex category 2011 2012 2013 2014 2015 Total
Reliability and quality maintained 87,428 89,526 94,428 95,203 97,493 464,078
Total demand and non-demand related 317,385 323,605 340,334 352,001 360,653 1,693,978
RQM % of Total 27.5 27.7 27.7 27.0 27.0 27.4 Source: Powercor Australia Ltd, “Regulatory Proposal 2011-15”, 30 November 2009, Table 5.1, p.
49.
In support of its replacement capex forecast, PAL provided information relating to its Asset Management Plans (AMPs) and asset management processes, relevant key drives of the expenditure, as well as specific information relating to particulars of its replacement capex forecast. The key issues relating to the development of PAL’s replacement capex forecast are considered briefly in the following sections.
3.2 Key issues
In developing its capex forecast, PAL notes in its submission that the conductor replacement works program, replacement of large plant and equipment items, and increased replacement of smaller items of plant and equipment are the three main areas of forecast investment that contribute to the growth of replacement capex over the 2011-15 regulatory control period12.
PAL’s regulatory submission notes that the conductor replacement program is a condition based program targeted at rural areas where overhead line augmentation resulting from
11 Powercor Australia Ltd, “Regulatory Proposal 2011-15”, 30 November 2009, p. 109. 12 ibid, pp. 102, 106, 110.

Repex Model Review
PARSONS BRINCKERHOFF CITIPOWER_POWERCOR_REPEX_REVIEW_V3_0.DOC Page 7
demand growth is less likely13. This program accounts for almost 60% of the forecast increase in replacement capex.
Much of the remaining increase in forecast replacement capex is associated with the replacement of large plant and equipment items and increased replacement of smaller items of plant and equipment. These increases arise from PAL’s application of Reliability Centred Maintenance (RCM) and Condition Based Risk Management (CBRM).
In its regulatory submission PAL notes that RCM practices are applied to the routine replacement of smaller items of plant and equipment, having regard to the age of the asset and its operating environment. PAL also notes that as RCM practices have been applied in the current regulatory control period, they have no significant impact on the forecast growth in replacement capex. However, CBRM practices were introduced in the current regulatory control period, and impact on replacement capex in last years of the current regulatory control period as well as replacement capex forecast for the next regulatory control period. Significantly, CBRM is applied to the replacement of large plant and equipment, with considerable impact on zone substation primary plant replacements. Hence the introduction of CBRM has considerable impact on the overall forecast growth in replacement capex14.
PAL’s regulatory submission also notes that historical asset failure rates have not been directly used in estimating the forecast replacement capex. However, historical failure rates are implicit within PAL’s replacement capex forecast as they result from PAL’s current asset management policies, and these policies form the basis of the replacement capex forecast15.
A further key point in PAL’s regulatory submission is the approach used to calculate the weighted average remaining life of assets for the purposes of populating table 2C of the Regulatory Template 6.2. In estimating the weighted average remaining life of assets, PAL used a modelling approach that takes a high level view of the condition of assets in order to calculate the theoretical weighted average remaining life of assets. Importantly however, this remaining life forecast is completely independent of PAL’s replacement capex forecast16.
3.3 Asset management plans
PAL has developed a number of AMPs for specific asset types that are based on PAL’s asset management framework and supported by an extensive suite of documentation. This documentation framework is modelled around the total asset management process as presented in the Publicly Available Specification 55 (PAS55) published by the British Standards Institute. PAL notes that it is moving towards being consistent with PAS55-117.
In undertaking this review PB was provided with copies of the following asset management plans:
Network Asset Replacement Policy for 3000A LV Air Circuit Breakers - Type Nilsen "AB" Series (18-05-CP0009 - Issue No: 1.0, 24/10/2009)
HV Circuit Breakers Asset Management Plan (PAL-AMP-05, Issue 1.0 Ver. 1.0, Nov 2009)
13 ibid, pp. 106, 110. 14 ibid, p. 107. 15 ibid, p. 106. 16 ibid, pp. 102-103. 17 ibid, p. 100.

Repex Model Review
Page 8 CITIPOWER_POWERCOR_REPEX_REVIEW_V3_0.DOC PARSONS BRINCKERHOFF
Subtransmission and HV Conductors Asset Management Plan (01-00-M0015, Issue No: 1.0, 18/12/2009)
Zone Substation Transformers Asset Management Plan (PAL-AMP-04, Issue 1.0 Ver. 1.0, Nov 2009)
While PB has only undertaken a preliminary review of these documents, we note that they are fairly typical of such documentation within the industry, and seem relatively complete. We also note that these documents form the basis of the replacement capex forecasts for the next regulatory control period, and provide a financial summary of the capex and opex requirements under each respective AMPs. However, as these documents are asset management plans, they do not provide any economic or risk assessment details, and PB notes that we have not reviewed any documentation that addresses the economic aspects of these plans.
3.4 Summary
PB has undertaken a high level review of the relevant sections of the PAL regulatory submission, and the supporting AMPs. From our review we note that PAL has derived its forecast replacement capex from its AMPs, and that these AMPs underpin PAL’s progressive move to a condition based replacement regime.
From PAL’s submission PB notes that the main factors driving the growth in forecast replacement capex are the conductor replacement works program and the impact of recently introducing the CBRM methodology18. In particular, PB notes that CBRM has been recently applied to major plant and equipment, and that its application to zone substation plant and equipment has contributed significantly to the growth in forecast replacement capex. We also note that the CBRM model provides a forward view of replacement needs based on a detailed view of equipment condition and risk derived from inspections and test reports. Hence while PAL states that it does not have any software based replacement models, CBRM is itself such a model.
18 ibid, pp. 102, 106-107, 110.

Repex Model Review
PARSONS BRINCKERHOFF CITIPOWER_POWERCOR_REPEX_REVIEW_V3_0.DOC Page 9
4. The Nuttall review This section provides an overview of the approach taken by Nuttall to review the reasonableness of the businesses proposed replacement capital expenditure19 and the process used to develop the recommended substitute forecast.
PB notes that the substitute forecast proposed by Nuttall relies heavily on the Repex model which was prepared for the AER in September 2009, prior to the submission of the DNSP proposals20. Given the materiality of the Repex model in underpinning the AER’s draft determination for replacement capex, the detail of the model itself is discussed separately in section 5 of this report.
4.1 Review approach
The approach taken to review the replacement capital expenditure proposed by the businesses is summarised in section 8.9.2 draft determination21 and in the Nuttall report. Essentially the review involved:
benchmarking current regulatory control period capex against peer businesses
considering the actual and expected capex during the current and previous regulatory control periods
comparing the replacement capex forecast against the results of the Repex model.
Following their review, the AER adjusted the majority of replacement capex expenditure activity code forecasts proposed by the businesses to align with the Repex model. The AER states that the reason for using the Repex model forecasts was:
“…Due to calibration concerns as to whether the DNSPs’ forecasting models could reliably predict future asset replacement requirements, the AER has applied its repex model instead to forecast the required RQM capex”
To determine whether the Repex model forecast was used, or the replacement capex forecast proposed by the business was accepted, Nuttall has generally adopted:
the business’ forecast where it is close to or lower than the Repex model forecast, or where it is consistent with the 2006-2008 average expenditure
the Repex model forecast in cases where the business’ forecast is above the Repex model.
PB recognises that the AER’s approach allowed for investigation of the policies, procedures and forecasting methodologies supporting the businesses’ proposals as well as the underlying need and deferral options. However, despite Nuttall’s general acceptance of the policies, procedures, underlying need and forecasting methodologies, PB notes that Nuttall
19 Primarily in the Reliability and Quality Maintained (RQM) expenditure category. Note that due to
additional compliance drivers some replacement expenditure has been classified as being in the Environmental, Safety and Legal (ESL) category.
20 AER, Victorian Draft Distribution Determination – Draft Decision, p. 339. 21 ibid, p. 338.

Repex Model Review
Page 10 CITIPOWER_POWERCOR_REPEX_REVIEW_V3_0.DOC PARSONS BRINCKERHOFF
found that the Victorian businesses were not able to demonstrate that any of the models used to develop the components of their RQM forecasts were appropriate for developing regulatory forecasts that meet the ‘fit for purpose’ criterion applied by Nuttall.
4.2 PB assessment
PB has reviewed the relevant sections of the AER’s draft determination as well as the supporting Nuttall report, and has concerns with three aspects of the approach taken to the review; specifically the:
reason for rejection of the business’ proposals
basis of the substitute forecast
inconsistent application of the Repex model findings.
In particular, PB notes that the AER’s approach is based on the assumption that the Repex model, calibrated to expenditure in the first three years of the current period,22 provides an appropriate baseline for predicting future replacement capex requirements. In turn, this assumes that the asset condition and associated business risks over the period from 2006 to 2008 are not materially different to those expected over the next regulatory period. In PB’s view, in the absence of an ex-post review of the drivers of actual replacement expenditure, limited conclusions can be drawn based on historical levels of expenditure, particularly over relatively short periods.
Each of the issues noted above is considered in more detail in the following sections.
4.2.1 Rejection of business proposals
As noted in sections 2 and 3 above, the businesses submitted detailed AMPs that were typically prepared at an asset category level to support their replacement capex proposals. These AMPs are based on bottom up condition based assessments that rely upon RCM and CBRM practices to establish the expected replacement capex forecast over the next regulatory control period.
The business’ proposals have been rejected on the basis of a benchmarking analysis, and a high level assessment of the historical variation between the regulatory allowance and the actual expenditure over the previous and current regulatory control periods. Moreover, Nuttall rejected the forecast replacement expenditure proposed by the businesses on the basis that the forecasting models supporting the AMPs were not considered to be ‘fit for purpose’.
For each business, Nuttall accepted that the proposed plans were generally reasonable “at an internal level to identify likely future network needs, work levels and associated expenditure”23, but also considered that these plans were not suitable for preparing regulatory forecasts. On the basis of Nuttall’s analysis, the AER rejected the businesses’
22 Noting that the forecast years 2009 and 2010 have been excluded from the calibration process. 23 Nuttall Consulting, “Report – Capital Expenditure, Victorian Distribution Revenue Review, A report to
the AER, Final Report”, 4 June 2010, p. 11.

Repex Model Review
PARSONS BRINCKERHOFF CITIPOWER_POWERCOR_REPEX_REVIEW_V3_0.DOC Page 11
proposals “…Due to calibration concerns as to whether the DNSPs’ forecasting models could reliably predict future asset replacement requirements”24.
In PB’s opinion, it seems unusual that the businesses models have been accepted as suitable for asset management planning and identifying likely network needs, work levels and associated expenditure, but these same plans are considered inappropriate to support the regulatory process. Given the rejection of the replacement capex forecasts due to calibration concerns, the Nuttall position indicates that the Victorian industry’s replacement forecasting practices are incapable of satisfying the AER’s requirements. Yet the Nuttall report also identifies the Victorian distribution businesses as the most efficient in the eastern states.
PB also notes that the Nuttall report contains little in the way of analysis of the fundamental needs of the businesses to support the dismissal of the asset replacement needs set out in the AMPs. In place of a fundamental analysis of the needs, risks, and proposed expenditure (prudency and efficiency), Nuttall has dismissed the replacement capex proposals largely on the basis of an analysis which compares the business proposals to an unreviewed proprietary model that Nuttall acknowledges has not been fully calibrated at a detailed level25.
Notwithstanding our concerns regarding the calibration processes itself26, the approach taken by Nuttall to compare the proposals to a modelled forecast based on historical expenditure, cannot consider the risks faced by the businesses over the next regulatory control period, particularly risks that have been determined from a bottom up condition based assessment.
Form a review of the businesses’ AMP’s, Nuttall accepts the underlying philosophy of the businesses replacement capex and also accepts the risks proposed by the businesses in their supporting documentation27. However the proposed expenditure is rejected due to an apparent lack of transparent calibration of the businesses’ forecasts to their historical expenditure, and a limited demonstration of how risks are expected to change from the current period.
Furthermore, the AER’s decision to commission the Repex model, which is itself a ‘black box’ proprietary model28, was due to the ‘black box’ proprietary models used by other businesses in previous reviews to support their replacement capex proposals, and a desire to avoid the need for detailed analysis of AMPs29. In PB’s view, the non-alignment of these models with the Repex model is indicative of the errors associated with modelling due to sensitivities to input assumptions, and differing calculation approaches which take into
24 Australian Energy Regulator, “Victorian electricity distribution network service providers Distribution
determination 2011–2015, Draft decision”, June 2010, p. 338. 25 The Nuttall report (p 29) notes that a the model was developed to “allow a common framework to be
applied without the need to be overly intrusive in data collection and detailed analysis of the asset management plans” and that detailed calibration to support a bottom up approach was not undertaken due to the need for “extensive work with the DNSP’s prior to their submissions to ensure that a reasonably consistent data set is provided”
26 Refer to section 5 of this report 27 Nuttall Consulting, “Report – Capital Expenditure, Victorian Distribution Revenue Review, A report to
the AER, Final Report”, 4 June 2010, p. 65. 28 The replacement calculation engine comprises a user defined function ‘repcalc’ developed by Nuttall
Consulting with eight input variables named: Ageprof, Meth, Life, Sd, Year, Recur, Year 1, Loccy. No further description of the variables is provided and the algorithm is contained in a password protected Visual Basic module with limited explanatory notes to enable the logic to be reviewed.
29 Nuttall Consulting, “Report – Capital Expenditure, Victorian Distribution Revenue Review, A report to the AER, Final Report”, 4 June 2010, p. 29.
Repex Model Review
Page 12 CITIPOWER_POWERCOR_REPEX_REVIEW_V3_0.DOC PARSONS BRINCKERHOFF
account factors other than asset age, failure profiles and standard unit costs. Moreover, without a fundamental assessment of the AMPs and condition based forecasting approach taken by the businesses, a misalignment between model results does not necessarily demonstrate that the higher value of capex derived from the AMPs is unreasonable, imprudent or inefficient.
On the basis that there appears to have been little analysis of the fundamental needs set out in the documentation supporting the businesses’ expenditure proposals, and that the accuracy of the Repex model has neither been verified by a third party or demonstrated through calibration at a detail level, PB considers that Nuttall’s dismissal of the expenditure proposal, due in a large part to non-alignment with the Repex model results, does not reflect the specific risks faced by the business over the next regulatory control period, and does not reflect a reasonable benchmark for the acceptance/rejection of the businesses’ proposals. Therefore, PB is of the opinion that the Nuttall’s replacement capex modelling does not align with the specific risks and needs identified in the businesses’ AMPs.
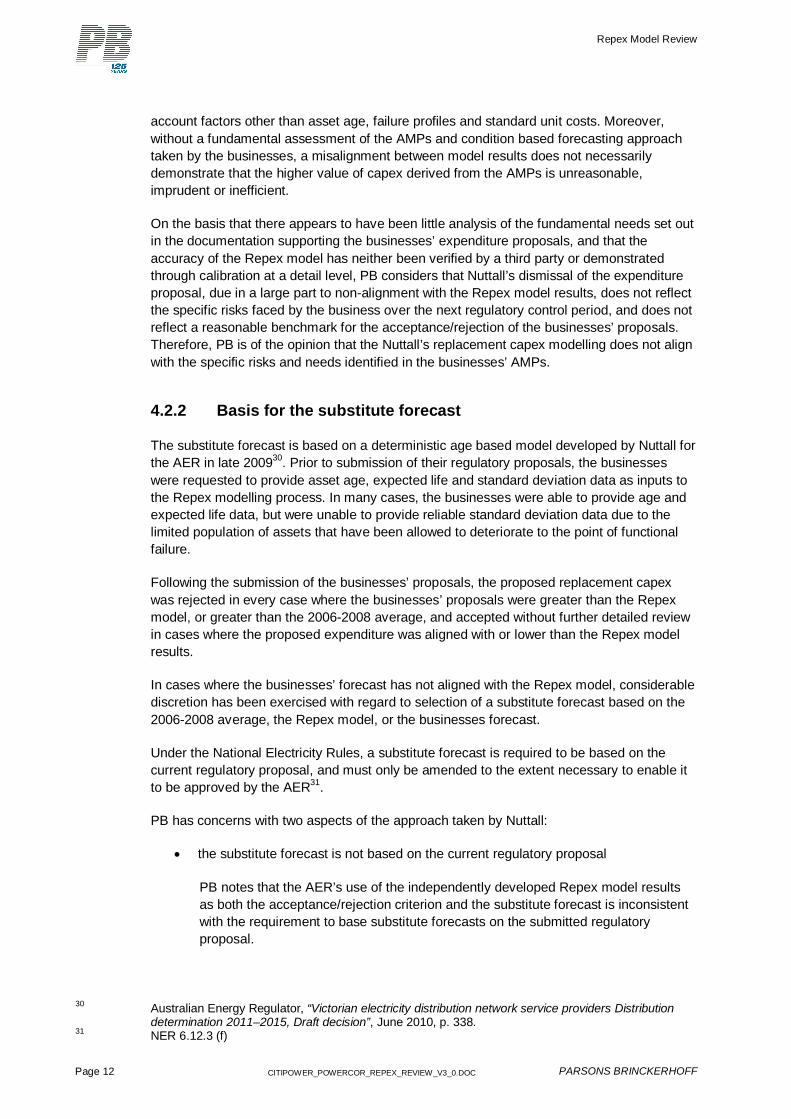
4.2.2 Basis for the substitute forecast
The substitute forecast is based on a deterministic age based model developed by Nuttall for the AER in late 200930. Prior to submission of their regulatory proposals, the businesses were requested to provide asset age, expected life and standard deviation data as inputs to the Repex modelling process. In many cases, the businesses were able to provide age and expected life data, but were unable to provide reliable standard deviation data due to the limited population of assets that have been allowed to deteriorate to the point of functional failure.
Following the submission of the businesses’ proposals, the proposed replacement capex was rejected in every case where the businesses’ proposals were greater than the Repex model, or greater than the 2006-2008 average, and accepted without further detailed review in cases where the proposed expenditure was aligned with or lower than the Repex model results.
In cases where the businesses’ forecast has not aligned with the Repex model, considerable discretion has been exercised with regard to selection of a substitute forecast based on the 2006-2008 average, the Repex model, or the businesses forecast.
Under the National Electricity Rules, a substitute forecast is required to be based on the current regulatory proposal, and must only be amended to the extent necessary to enable it to be approved by the AER31.
PB has concerns with two aspects of the approach taken by Nuttall:
the substitute forecast is not based on the current regulatory proposal
PB notes that the AER’s use of the independently developed Repex model results as both the acceptance/rejection criterion and the substitute forecast is inconsistent with the requirement to base substitute forecasts on the submitted regulatory proposal.
30 Australian Energy Regulator, “Victorian electricity distribution network service providers Distribution
determination 2011–2015, Draft decision”, June 2010, p. 338. 31 NER 6.12.3 (f)

Repex Model Review
PARSONS BRINCKERHOFF CITIPOWER_POWERCOR_REPEX_REVIEW_V3_0.DOC Page 13
the substitute forecast is not demonstrated to be adjusted only to the extent required to achieve the capital expenditure objectives.
While Nuttall has attempted to calibrate an age based forecast, no attempt has been made to demonstrate that the substitute forecast represents the minimum adjustment required, or that the substitute forecast is sufficient to meet the expenditure needs of the businesses over the next regulatory control period. Instead, Nuttall has proposed that the businesses are required to demonstrate, not only that the detailed adjustments applied by Nuttall are unreasonable, but also that the identified risks cannot be managed within the total substitute forecast32.
Furthermore, Nuttall’s expectation that the proposed allowances by replacement activity code are unlikely to reflect actual expenditure33 is demonstrative of the weak assurance offered by the recommended substitute forecasts for each replacement activity code.
On this basis, PB is of the view that the substitute forecast is not based on the businesses current regulatory proposals, and that the Repex model forecast has not been shown to be the minimum adjustment required to achieve the capital expenditure objectives. The substitute forecasts may not be sufficient to address the specific needs and risks identified in the businesses’ submitted AMPs, reflecting the assessed asset condition. Given that these needs include factors other than age, it is not clear how the Repex model is able to estimate the risks associated with replacement drivers that are not related to time based deterioration (e.g. technical obsolescence, changes in statutory obligations, parts availability, etc) or do not fit the assumed failure profile (such as multi-modal failure profiles due to differing root causes). Therefore, PB does not consider that Nuttall’s replacement capex model results are likely to produce a reasonable forecast of capital expenditure that reflects the circumstances of the businesses over the period 2011-2015.
4.2.3 Inconsistent application of substitute forecasts
The AER’s use of the Repex model as the acceptance/rejection criterion results in a total substitute forecast that is inherently biased against the businesses due to the acceptance of forecasts below the Repex model results and rejection of those above.
Noting the limited calibration of the model at a detailed level34, PB understands that the Repex model forecast is intended to produce a reasonable estimate of the future replacement capex requirements at a total expenditure level. This is consistent with Nuttall’s statement that:
“… We would fully expect that at the activity code level, actual expenditure may differ considerably as circumstances change and the full capital governance process is applied.”35
Therefore the use of activity code level Repex model forecasts as an acceptance/rejection criterion in the AER’s methodology is not supported by the developer of the model, and Nuttall further acknowledges that the modelled forecast is unlikely to represent the risks faced by the business over the next regulatory control period at an activity code level.
32 The Nuttall report (p.13) notes “Should the DNSP’s challenge this recommendation, it will be important
that they demonstrate why they cannot manage the overall risks within the overall recommendations. Focussing only on the matters raised in the detailed reviews may not adequately address this matter."
33 Nuttall Consulting, “Report – Capital Expenditure, Victorian Distribution Revenue Review, A report to the AER, Final Report”, 4 June 2010, p. 13
34 ibid, p. 29. 35 ibid, pp. 125, 204,

Repex Model Review
Page 14 CITIPOWER_POWERCOR_REPEX_REVIEW_V3_0.DOC PARSONS BRINCKERHOFF
PB notes that should there be any error in the calibration at an activity code level; Nuttall’s analysis framework forces the businesses to forfeit the value of both:
any material underestimate at the activity code level relative to the Repex model forecast
any material overestimate at the activity code level relative to the Repex model forecast
Despite the reliance on the Repex model as the baseline efficient forecast, no attempt has been made by Nuttall to compare the businesses proposed total replacement capex with the total expenditure calculated by the calibrated Repex model. This is despite the fact that the Repex model forecast is intended to produce a reasonable estimate at a total expenditure level. In practice, Nuttall’s rejection of all activity code forecasts above the Repex model forecast (or historical levels) on the basis of inadequate justification means that this approach results in a substitute total replacement forecast that is materially below both the forecasts proposed by the businesses, and the total replacement forecast predicted by the calibrated Repex model.
Therefore, PB is of the view that Nuttall’s analysis framework coupled with the use of the Repex model as an estimate of an efficient baseline forecast:
systemically underestimates the total substitute forecast for proposals that were not tightly aligned to the Repex model forecast in each activity code
places the risk of inaccuracy of the Repex model and the validity of its calibration on the businesses. Given that a $691m reduction across the five Victorian businesses has been recommended by Nuttall on the basis of this approach, the accuracy of the Repex model represents a material risk to the Victorian business’ ability to maintain reliability and quality of supply.
PB notes Nuttall’s statement that in the case of SP AusNet, a 12-14 year difference in the assumed average life of a single category (poles) could reduce the forecast replacement capex from 600% to 750% of average historical capex to a figure more in line with the 200% to 350% increase forecast for the other businesses36. Given that the Repex model is shown by Nuttall to be acutely sensitive to the input age assumptions in single categories, small errors in the accuracy of the calibration process are potentially highly material.
Furthermore, PB notes the following instances where the stated approach has not been applied consistently:
in one case (Powercor, Services category); the businesses proposed forecast was accepted on the basis of alignment with the historical average without any supporting fundamental analysis of the need37. In this instance the accepted forecast was approximately $7m (87%) above the Repex model forecast
in another case, (CitiPower, Fault Replacements category) the business forecast a reduction in expenditure, however Nuttall rejected the forecast of $11.7m and
36 The Nuttall report (pp. 36-37) states that the Repex model predicted annual increases of 200% to
750% relative to the 2004-2008 average based on the businesses assumed asset lives. Following Nuttall’s adjustment of assumed asset lives, the model predicted annual increases of 100% to 200%.
37 Nuttall Consulting, “Report – Capital Expenditure, Victorian Distribution Revenue Review, A report to the AER, Final Report”, 4 June 2010, p. 196.

Repex Model Review
PARSONS BRINCKERHOFF CITIPOWER_POWERCOR_REPEX_REVIEW_V3_0.DOC Page 15
provided a substitute forecast of $58.7m based on the Repex model without any fundamental analysis of the need38. In this instance, the accepted forecast was approximately $47.0m (401%) above the Repex model forecast
in a further case (CitiPower, HVFSD category) the business’ proposed forecast was noted to be relatively immaterial however, Nuttall rejected the forecast $1.57m expenditure on the basis of non-alignment with the Repex model, without any supporting fundamental analysis of the need. In this instance, the substitute forecast of $0.4m represented a 73% reduction to the businesses forecast requirement.
Noting the acceptance of some activity code level forecasts that are 87% to 401% above the Repex model forecasts, and the rejection of other forecasts well within this variation due to non-alignment with the Repex model, the confidence in the accuracy of the Repex model forecasts at an activity code level appears to be limited, and in some cases the selection of the substitute forecast appears to be arbitrary.
PB notes that the Repex model has been calibrated on the basis of 2006 to 2008 expenditure. Therefore this degree of variation between the Repex forecast and a forecast of expenditure based on historical trends over the 2006 to 2008 period supports the view that the model is not accurately calibrated at an activity code level, and therefore the calibration process exhibits a significant degree of error.
PB recognises that in two of the cases above, the businesses have benefited from a higher substitute forecast in the expenditure under consideration. However at a total replacement capex level, the discretionary acceptance or rejection of the Repex model’s activity code level forecasts leads to a strongly negative outcome for the businesses. For the Repex model to be considered a reasonable and unbiased estimator of the prudent and efficient replacement capex requirements of the businesses, both the total Repex model forecast and the aggregate of the substitute forecasts should be closely aligned. As outlined in the following section, PB found that there was a material difference between the total Repex model forecast and the total substitute forecast.
In PB’s opinion, this misalignment could be due to:
an inherent bias in the analysis approach leading to an underestimate of the prudent and efficient level of replacement capex required by the business
calibration errors in the Repex model meaning that the Repex model does not represent a prudent and efficient substitute forecast, at least at an activity code level
assumptions or simplifications in the replacement algorithms, categorisation, or input data leading to unrealistic forecasts at the activity code level. In this case it is difficult to understand how the integrity and calibration of the Repex model remains valid.
Therefore, PB considers that the Repex model activity code level forecasts should only be considered where the total replacement capex is inconsistent with the model’s findings, and where it can be transparently demonstrated that the activity code level forecast is well calibrated to the businesses’ asset base. Where detailed calibration has not been undertaken, or where the age based calibration results do not align with reasonable industry expectations for the asset class, the substitute forecast should be based on a fundamental assessment of the businesses’ proposed solutions.
38 ibid p.123 .

Repex Model Review
Page 16 CITIPOWER_POWERCOR_REPEX_REVIEW_V3_0.DOC PARSONS BRINCKERHOFF
In PB’s opinion, Nuttall’s replacement capex modelling is unlikely to produce capex forecasts at the activity code level that can be reasonably substituted for the businesses capex forecasts for the 2011-2015 period.
4.3 CitiPower findings
In reviewing the CP proposal, Nuttall rejected CP’s forecasts for nine of the twelve asset categories. As shown in Table 3, seven categories were rejected on the basis of the Repex model findings.
Table 3 – CitiPower Review Summary ($m 2010)
Activity Code Nuttall Consulting View Citi
Pow
er
Prop
osed
Cal
ibra
ted
Rep
ex M
odel
Nut
tall
Rec
omm
ende
d
Cross Arm Accepted 12.8 12.8 12.8
Fault Level Mitigation Project
Rejected – no allowance 100.5 - -
Fault Related Rejected – allowance based upon average 2006-2008, with increase based upon Repex model findings
22.439 58.7 58.7
HV Fuse Unit & Surge Diverter
Rejected – allowance based upon average 2006-2008, with increase based upon Repex model findings
1.6 0.4 0.4
HV Switch Rejected – allowance based upon average 2006-2008, with increase based upon Repex model findings
21.0 5.5 5.5
OH/UG Line Accepted 30.1 44.3 30.1
Pole Accepted 14.0 13.0 14.0
Reliability Improvement
Rejected – no allowance 5.9 - -
Services Rejected – allowance based upon average 2006-2008, with increase based upon Repex model findings
11.0 4.2 4.2
Transformer Rejected – allowance based upon average 2006-2008, with increase based upon Repex model findings
2.6 2.1 2.1
Zone Substation Plant
Rejected – allowance based upon average 2006-2008, with increase based upon Repex model findings
90.2 83.8 83.8
Zone Substation Secondary Systems
Rejected – allowance based upon average 2006-2008, with increase based upon Repex model findings
40.7 5.1 5.1
Total 352.8 229.9 216.7
39 PB notes that CP originally proposed a Fault Related expenditure of $11.7m. However this figure
contained an error and CP subsequently submitted a corrected figure of $22.4m.

Repex Model Review
PARSONS BRINCKERHOFF CITIPOWER_POWERCOR_REPEX_REVIEW_V3_0.DOC Page 17
Activity Code Nuttall Consulting View Citi
Pow
er
Prop
osed
Cal
ibra
ted
Rep
ex M
odel
Nut
tall
Rec
omm
ende
d
Rejected categories (no allowance) (106.4) - -
Total (ex rejected categories) 246.4 229.9 216.7 Source: Nuttall Report p. 126 & PB Analysis of AER Repex CitiPower.xls
The rejection of the $100.5m Fault Level Mitigation Project and the $5.9m Reliability Improvement expenditure category represents the majority of the replacement capex adjustment proposed by Nuttall. When these items are excluded from CP’s replacement forecast, the remaining portion of CP’s proposed replacement capex forecast is $246.4m. This figure is approximately 7% higher than the total expenditure forecast by the calibrated Repex model ($229.9m), and 14% higher than the total substitute forecast recommended by Nuttall ($216.7m). A simple comparison of CP’s proposal, the Repex model results, and Nuttall’s recommendation is shown in Error! Reference source not found. below for the activity code level.
Figure 1 – CitiPower Review Summary ($m 2010)
0
50
100
150
200
250
300
Cross Arm Fault Related HV Fuse Unit & Surge Diverter
HV Switch OH/UG Line Pole Services Transformer Zone Substation
Plant
Zone Substation Secondary Systems
Total (ex Rejected
Categories)
Tota
l Exp
endi
ture
($m
201
0)
CitiPower Proposed
Calibrated Repex Model
Nuttall Recommended
Source: Nuttall Report p. 126 & PB Analysis of AER Repex CitiPower.xls
In PB’s opinion, a 7% variation between a ‘top down’ forecast modelled on asset age and a ‘bottom-up’ forecast based on asset condition, risk and obsolescence issues as identified in CP’s AMPs, is within the range of reasonable modelling expectations. Noting the strong alignment with Nuttall’s independent high level forecast, it is not clear why the ‘top down’ Repex model forecast is adopted as a reasonable baseline over CP’s ‘bottom-up’ proposal. PB considers that the submitted proposal should be accepted as the baseline for the replacement capex forecast, and any variations to the proposed forecast should be supported by clearly defined scope changes or alternative options based on a fundamental analysis of the businesses AMPs. As discussed in section 4.2.3, the additional $13.2m difference between the calibrated Repex model forecast ($229.9m) and the substitute

Repex Model Review
Page 18 CITIPOWER_POWERCOR_REPEX_REVIEW_V3_0.DOC PARSONS BRINCKERHOFF
forecast proposed by Nuttall ($216.7m) is a result of the inconsistent use of the Repex model as a substitute forecast, and as the basis to accept/reject at the activity code level.
Noting Nuttall’s statement that a detailed ‘bottom-up’ calibration of the Repex model has not been undertaken for the purpose of this review40, the wide variation (-87% to +401%) in the accepted and rejected forecasts at the activity code level appears to be demonstrative of the limited confidence that can be placed in the Repex model forecasts at this level. For example, as illustrated in Table 3
CP originally proposed $11.7m expenditure in the Fault Related activity code. Nuttall rejected CP’s proposal and provided a substitute forecast of $58.7m on the basis of the Repex model findings. This represented a $47.0m (401%) increase above the businesses proposed expenditure in this category. The AER’s Draft Decision41 notes that CP’s original Fault Related expenditure proposal of $11.7m was in error, and that CP had corrected this to $22.4m. PB notes that the AER subsequently rejected Nuttall’s proposal and accepted CP’s proposal on the basis of alignment with the Repex model forecast.
CP proposed $40.7m in the Zone Substations Secondary Systems category. Nuttall rejected CP’s proposal and provided a substitute forecast of $5.1m on the basis of the Repex model findings. This represented a $35.6 (87%) decrease below the businesses proposed expenditure in this category.
CP proposed $30.1m in the OH/UG line category. Nuttall accepted the CP proposal despite the Repex Model findings indicating that expenditure of $44.3m would be required. This would require additional expenditure of $14.2m (47%) above the businesses proposed expenditure in this category.
Notwithstanding our concerns regarding the model and the validity of the calibration process itself, the strong alignment between the total Repex model forecast and the CP proposal (when the step change Fault Level Mitigation Project and the reclassified Reliability Improvement expenditure is put aside) demonstrates that the calibrated Repex model forecast is not materially different to the total forecast proposed by CP. However, as indicated in Table 3, despite this alignment it is apparent that both Nuttall and the AER have inconsistently applied the Repex model. In our opinion, this selective application of the Repex model creates an inherent bias.
On the assumption that the Repex model is a reasonable and unbiased estimate of CP’s future total replacement capex, the total CP forecast, excluding the Fault Level Mitigation Project and the Reliability Improvement program, can be considered to be a reasonable baseline forecast of the replacement capex needs of the business, and no further reliance on Repex model is required. Consistent with the intent of Nuttall’s methodology the two excluded line items should be evaluated as step change increases on the basis of the fundamental need, risks, and the consideration of alternative options.
40 Australian Energy Regulator, “Victorian electricity distribution network service providers Distribution
determination 2011–2015, Draft decision”, June 2010, p. 29. 41 ibid p. 354.

Repex Model Review
PARSONS BRINCKERHOFF CITIPOWER_POWERCOR_REPEX_REVIEW_V3_0.DOC Page 19
4.3.1 Specific issues
Fault level mitigation project
The $100.5m Fault Level Mitigation Project comprises approximately 29% of CP’s proposed capex and was rejected on the basis that Nuttall considered that “…there remains a significant possibility that the works may not be justified in the next period.”42 Given that:
the project is comprised of a number of smaller activities that could be undertaken independently
Nuttall does not disagree with the proposed options, or consider them unreasonable, but considers that the full scope of the project may not be justified in the next period
there is a reasonable probability that a proportion of the proposed expenditure would be justified in the next period.
the current practice of opening circuit breakers has been adopted as a short term solution. This practice was implemented to accommodate the unexpected increase in embedded generation connections in the CBD following government initiatives that have encouraged investment in embedded generation over the current period.
In PB’s opinion, it would seem appropriate to allow a component of the proposed expenditure to represent the proportion of the project that that is reasonably likely to be justified over the next regulatory control period, and a probability weighted component to represent the proportion of the project where the efficiency of the option or the timing of its implementation is uncertain.
Reliability improvement category
The forecast $5.9m Reliability Improvement expenditure was rejected on the basis that the expenditure had not previously been recorded under the reliability improvement activity code prior to 2010. Nuttall has not challenged the fundamental need for the expenditure but has assumed that an allowance for this work will be included in the substitute forecast due to the approach of forecasting the substitute expenditure based on historical trends and the Repex model.
PB notes that Nuttall has not attempted to identify how this expenditure has been allocated historically, and has not supported the rejection of this expenditure with any analysis of the fundamental need for the proposed expenditure. Given the alignment of CP’s proposed replacement expenditure with the Repex model results, and Nuttall’s implied acceptance of the need for the Reliability Improvement expenditure, PB considers that the Reliability Improvement expenditure should be reinstated as part of the CP’s baseline proposal.
42 Nuttall Consulting, “Report – Capital Expenditure, Victorian Distribution Revenue Review, A report to
the AER, Final Report”, 4 June 2010, p.29.
Repex Model Review
Page 20 CITIPOWER_POWERCOR_REPEX_REVIEW_V3_0.DOC PARSONS BRINCKERHOFF
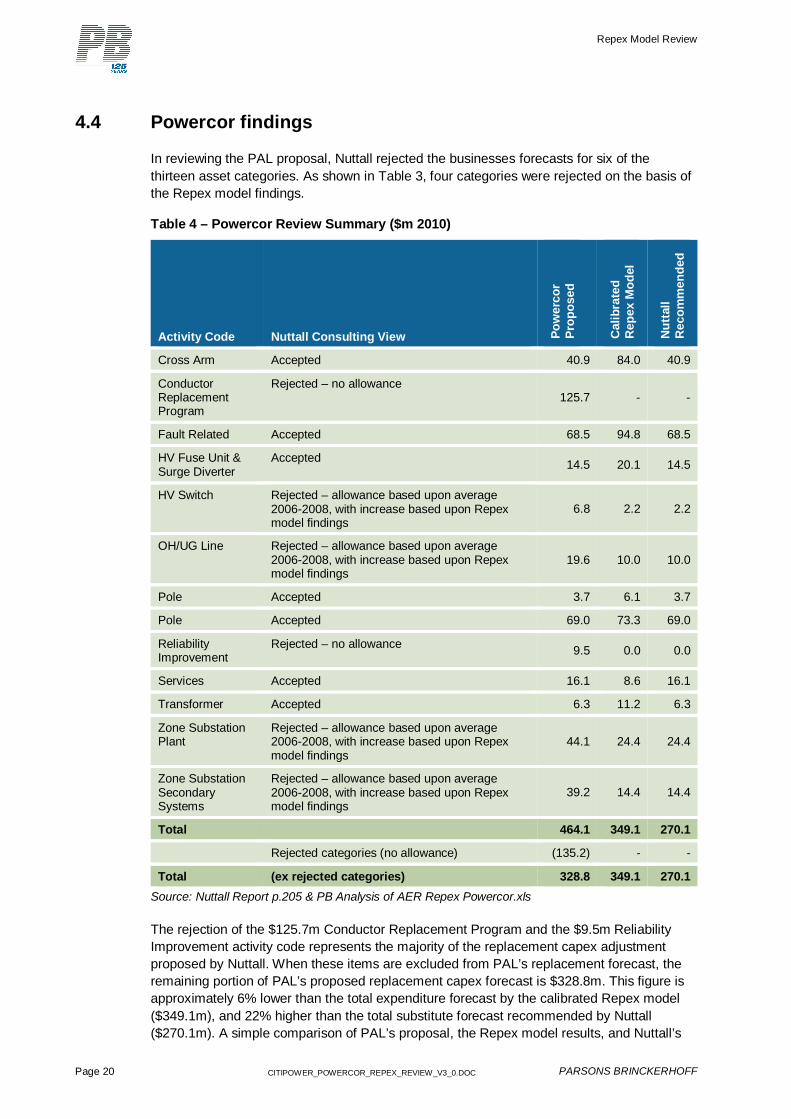
4.4 Powercor findings
In reviewing the PAL proposal, Nuttall rejected the businesses forecasts for six of the thirteen asset categories. As shown in Table 3, four categories were rejected on the basis of the Repex model findings.
Table 4 – Powercor Review Summary ($m 2010)
Activity Code Nuttall Consulting View Pow
erco
r Pr
opos
ed
Cal
ibra
ted
Rep
ex M
odel
Nut
tall
Rec
omm
ende
d
Cross Arm Accepted 40.9 84.0 40.9
Conductor Replacement Program
Rejected – no allowance 125.7 - -
Fault Related Accepted 68.5 94.8 68.5
HV Fuse Unit & Surge Diverter
Accepted 14.5 20.1 14.5
HV Switch Rejected – allowance based upon average 2006-2008, with increase based upon Repex model findings
6.8 2.2 2.2
OH/UG Line Rejected – allowance based upon average 2006-2008, with increase based upon Repex model findings
19.6 10.0 10.0
Pole Accepted 3.7 6.1 3.7
Pole Accepted 69.0 73.3 69.0
Reliability Improvement
Rejected – no allowance 9.5 0.0 0.0
Services Accepted 16.1 8.6 16.1
Transformer Accepted 6.3 11.2 6.3
Zone Substation Plant
Rejected – allowance based upon average 2006-2008, with increase based upon Repex model findings
44.1 24.4 24.4
Zone Substation Secondary Systems
Rejected – allowance based upon average 2006-2008, with increase based upon Repex model findings
39.2 14.4 14.4
Total 464.1 349.1 270.1
Rejected categories (no allowance) (135.2) - -
Total (ex rejected categories) 328.8 349.1 270.1 Source: Nuttall Report p.205 & PB Analysis of AER Repex Powercor.xls
The rejection of the $125.7m Conductor Replacement Program and the $9.5m Reliability Improvement activity code represents the majority of the replacement capex adjustment proposed by Nuttall. When these items are excluded from PAL’s replacement forecast, the remaining portion of PAL’s proposed replacement capex forecast is $328.8m. This figure is approximately 6% lower than the total expenditure forecast by the calibrated Repex model ($349.1m), and 22% higher than the total substitute forecast recommended by Nuttall ($270.1m). A simple comparison of PAL’s proposal, the Repex model results, and Nuttall’s

Repex Model Review
PARSONS BRINCKERHOFF CITIPOWER_POWERCOR_REPEX_REVIEW_V3_0.DOC Page 21
recommendation is shown in Error! Reference source not found. below for the activity code level.
Figure 2 – Powercor Review Summary ($m 2010)
0
50
100
150
200
250
300
350
400
Cross Arm Fault Related
HV Fuse Unit & Surge
Diverter
HV Switch OH/UG Line Other Pole Services Transformer Zone Substation
Plant
Zone Substation Secondary Systems
Total
Total Expenditure ($m 2010)
Powercor Proposed
Calibrated Repex Model
Nuttall Recommended
Source: Nuttall Report p.205 & PB Analysis of AER Repex Powercor.xls
In PB’s opinion a 6% variation between a ‘top down’ forecast modelled on asset age, and a ‘bottom-up’ forecast taking into specific account of asset condition, risk and obsolescence as identified in PAL’s AMPs, is within the range of reasonable modelling expectations. Noting the strong alignment with Nuttall’s independent high level forecast, it is not clear why the ‘top down’ Repex model forecast is adopted as a reasonable baseline over PAL’s ‘bottom-up’ proposal. PB considers that the submitted proposal should be accepted as the baseline for the replacement capex forecast, and any variations to this forecast should be supported by clearly defined scope changes or alternative options based on a fundamental analysis of the business’ AMPs. As discussed in section 4.2.3, the additional $79.0m difference between the calibrated Repex model forecast ($349.1m) and the substitute forecast proposed by Nuttall ($270.1m) is a result of the inconsistent use of the Repex model activity code forecasts as a substitute forecast, and as the basis to accept/reject at the activity code level.
Given Nuttall’s statement that a detailed ‘bottom-up’ calibration of the Repex model has not been undertaken for the purpose of this review43, the wide variation (-63% to +105%) in the accepted and rejected forecasts at the activity code level appears to be demonstrative of the limited confidence that can be placed in the Repex model forecasts at this level. For example, as illustrated in Table 4:
PAL proposed $40.9m in the Cross Arm replacement category. Nuttall accepted PAL’s proposal despite the Repex model findings indicating that expenditure of $84.0m would be expected. This would require additional expenditure of $42.9 (105%) above the businesses proposed expenditure in this category
PAL proposed $68.5m in the Fault Related category. Nuttall accepted PAL’s proposal despite the Repex model findings indicating that expenditure of $94.8m
43 ibid, p. 29.

Repex Model Review
Page 22 CITIPOWER_POWERCOR_REPEX_REVIEW_V3_0.DOC PARSONS BRINCKERHOFF
would be required. This would require additional expenditure of $26.2m (38%) above the businesses proposed expenditure in this category
PAL proposed $39.2m in the Zone Substations Secondary Systems category. Nuttall rejected PAL’s proposal and provided a substitute forecast of $14.4m on the basis of the Repex model findings. This represented a $24.9m (63%) decrease below the businesses proposed expenditure in this category
PAL proposed $16.1m in the service line category. Nuttall accepted PAL’s proposal despite the Repex model findings indicating that a lower expenditure of $8.6m would be required. The accepted forecast represented a $7.5m (46%) increase above the Repex model forecast in this category but was accepted on the basis that it ‘was not unreasonable’44.
Notwithstanding our concerns regarding the model and the validity of the calibration process itself, the strong alignment between the total Repex model forecast and PAL’s proposal (when the step change Conductor Replacement Program and the reclassified Reliability Improvement expenditure is put aside) demonstrates that the calibrated Repex model forecast is not materially different to the total forecast proposed by PAL.
On the assumption that the Repex model is a reasonable and unbiased estimate of PAL’s future total replacement capex, the total PAL forecast, excluding the Conductor Replacement Program and the Reliability Improvement category, can be considered to be a reasonable baseline forecast of the replacement capex needs of the business and no further reliance on Repex model would be required.
Consistent with the intent of Nuttall’s methodology, the two excluded line items should be evaluated as step change increases on the basis of the fundamental need, risks and the consideration of alternative options.
4.4.1 Specific issues
Conductor replacement program
The $125.7m Conductor Replacement Program comprises approximately 27% of PAL’s proposed capex. Due to the bushfire risk drivers the program was ‘ring fenced’ from the review to allow its consideration at a later stage following the recommendations of the Royal Commission into the 2008/09 bushfires. While PB notes that bushfire risk is one of the key drivers for the conductor replacement program, we also note Nuttall’s statement that that the program can be evaluated irrespective of the Royal Commissions findings45. Nuttall identifies that PAL should demonstrate that:
it has relevant test results that indicate it can target the appropriate conductors
its criteria and methodology for producing a 5 year forecast are a reasonable estimate of the prudent and efficient replacement quantities and costs (i.e. it maximises benefits based upon some robust economic/risk evaluation)
its plan and methodology are in accordance with ESV findings on these matters.
44 ibid, p. 196. 45 ibid, p. 187.

Repex Model Review
PARSONS BRINCKERHOFF CITIPOWER_POWERCOR_REPEX_REVIEW_V3_0.DOC Page 23
PB recognises the need to appropriately target the program, and that PAL’s criteria and methodology for producing the five year forecast should demonstrate the efficiency of the program with respect to the risks associated with conductor failure. However, where the program satisfies the first two criteria, it is not clear why the approval of the program should be contingent on the findings of ESV as the program would be justified (or not) on the basis of the economic/risk evaluation. Moreover, PB notes that both the Bushfire Royal Commission, and the ESV investigations demonstrate that the risks that PAL are targeting through this program are significant issues that will need to be addressed over the next regulatory control period. Consequently, where the risk is current and demonstrated, it would be imprudent of PAL not to act while it is awaiting the ESV findings where the expenditure is demonstrably efficient.
In PB’s view, the Conductor Replacement Program can be assessed independently of the Bushfire Royal Commission and ESV investigations based on consideration of the efficient capex required to address the fundamental needs and risks identified by PAL at this point in time. PB notes that it has been engaged by PAL to investigate the business case for the conductor replacement program, and our findings in relation to this program are set out in PB’s report ‘Overhead conductor replacement investment strategy’ May 2010.
Reliability improvement category
The forecast $9.5m Reliability Improvement expenditure was rejected on the basis that the expenditure had not previously been recorded under the reliability improvement activity code prior to 2010. Nuttall has not challenged the fundamental need for the expenditure but has assumed that an allowance for this work will be included in the substitute forecast due to Nuttall’s approach of forecasting the substitute expenditure based on historical trends and the Repex model.
PB notes that Nuttall has not attempted to identify how this expenditure has been allocated historically, and has not supported the rejection of this expenditure with any analysis of the fundamental need for the proposed expenditure. Given the alignment of PAL’s proposed replacement expenditure with the Repex model results, and Nuttall’s implied acceptance of the need for the Reliability Improvement expenditure, PB considers that the additional Reliability Improvement expenditure should be reinstated into the Powercor proposal.

Repex Model Review
Page 24 CITIPOWER_POWERCOR_REPEX_REVIEW_V3_0.DOC PARSONS BRINCKERHOFF
5. Repex model review This section provides an overview of the Repex model including the inputs, outputs, as well as a review of the key assumptions in the model and the model calibration process.
As noted by Nuttall, the model is similar to a number of the age based forecasting approaches that have been used by the businesses, and by the ESC in previous Victorian EDPR’s.
PB notes that the Repex model is driven by a proprietary user defined function ‘repcalc’ developed by Nuttall, however no guidance notes on the eight input variables to this function were provided in the model, the code, or the Nuttall report. Therefore PB’s comments in this section are based on a limited review of the model, the underlying code, and the commentary provided in the Nuttall report. PB has not attempted to undertake a comprehensive audit or independent verification of the model or calculation methodology.
5.1 Key inputs and outputs
The Repex Model is a spreadsheet model that applies an age based algorithm to estimate the volume of asset replacement based on the installation years, expected lives, assumed failure profile, and average age of the asset population. Nuttall identifies that the model is based on three key inputs46:
the age profile (i.e. the quantity of the asset and their installation date)
the mean replacement life and the standard deviation
the unit replacement costs.
Based on these inputs, the model produces:
age and asset value statistics based on the input age profile
the 20 year replacement forecast (quantities and expenditure)
the 20 year average age and average remaining life trends.
It is the second output that Nuttall has used as the basis for the substitute forecasts applied in the AER’s draft decision.
To test the validity of the input data used by Nuttall, PB has compared the input data provided by the businesses with the input data used in the version of the Repex model that supports Nuttall’s recommendations. This comparison is detailed in Section 5.4.
46 ibid, p. 30.
Repex Model Review
PARSONS BRINCKERHOFF CITIPOWER_POWERCOR_REPEX_REVIEW_V3_0.DOC Page 25
5.2 Replacement Algorithm
Based on a limited review of the Repex model spreadsheet and underlying VBA code, PB has identified that the replacement algorithm is driven by the input variables outlined in Table 5. As no help file or commentary to explain the function has been provided, and there are limited programmers notes included in the model to clarify the operations, PB has attempted to understand the variables included in the proprietary function and establish whether the variables in the ‘calibrated’ model reflect the businesses’ input data.
Table 5 - Repcalc algorithm input variables
Variable PB Description Auditable Based on Business Input Data
Ageprof Age Profile
Based on input data from the businesses adjusted by Nuttall to remove staked poles. It is not clear to PB why these asset quantities have been adjusted.
Yes Yes – Adjusted
Meth Calculation Method
A switch that appears to enable the calculation method to be selected between a Discrete Life, Normal Distribution, Weibull Distribution or Skewed Normal Distribution.
Based on the remainder of the model it appears that the Weibull or Skewed Normal Distribution methods are not selectable. The description provided in the Nuttall Report also indicates that only the Normal Distribution function has been applied.
Yes No
Life Average Life of the Asset Class
Based on Nuttall’s ‘calibrated’ lives. In most cases these lives vary from the businesses expected lives. The calibrated lives have also been multiplied by a hard coded generic multiplier (‘mult’) that appears to result from a Goal Seeking exercise to match the modelled expenditure to the actual expenditure. The actual expenditure has also been multiplied by a second hard coded ‘scale factor’47. It is not clear to PB what the scale factor is intended to represent.
No No
Sd Standard Deviation of the asset class Based on Nuttall’s assumption that the standard deviation is approximately the square root of the life. (In the case of CitiPower and Powercor none of the limited standard deviation data provided by the business has been used in the model).
Yes No
Year A constant value of 20 is used.
PB assumes that this value sets the timeframe for the forecast (noted by Nuttall to be 20 years48)
No No
Recur A True/False switch that appears to allow for assets to be replaced a second time should this occur again during the analysis period.
- -
47 Repex Model, ‘Sheet 2’ Cell: I1 48 Nuttall Consulting, “Report – Capital Expenditure, Victorian Distribution Revenue Review, A report to
the AER, Final Report”, 4 June 2010, p. 31.

Repex Model Review
Page 26 CITIPOWER_POWERCOR_REPEX_REVIEW_V3_0.DOC PARSONS BRINCKERHOFF
Variable PB Description Auditable Based on Business Input Data
Year 1 A True/False switch to allow the first year of the forecast to be switched between the last age profile year or the year following the last age profile year.
- -
Loccy This variable appears to be set to a constant value of 0.25 when used in the Weibull or Skewed Normal distribution calculations. As only the ‘Normal’ distribution is discussed by Nuttall, the ‘Loccy’ variable does not appear to be used in the analysis underpinning the AER’s draft decision.
- -
Source: PB analysis of the Repex model spreadsheet VBA module
PB did not identify any errors in the underlying code driving the ‘repcalc’ function in the Normal Distribution case. We did note that the code suggests that the developer had considered the use of alternative probability functions for modelling the end of life expectations based on established reliability engineering methodologies (e.g. Weibull Distribution). However, these do not seem to have been fully implemented in the model.
5.2.1 Normal distribution assumption
The use of a normal distribution is understandable due to the relative simplicity in defining the input parameters (mean and standard deviation). However, it is widely acknowledged in reliability engineering literature that the Weibull distribution function is the appropriate descriptor of failure probability arising from time dependent deterioration. Using the ‘calibrated’ CP underground cable life as an example, Figure 3 illustrates that for a function with a similar distribution around the ‘calibrated’ age of 87 years, the normal distribution would tend to underestimate the volume of failures expected in cables less than 75 years, and overestimate the number of assets that would survive past 100 years.
Figure 3 – Normal v Weibull Failure Distributions – CitiPower UG Cables
0.0%
0.5%
1.0%
1.5%
2.0%
2.5%
3.0%
3.5%
4.0%
4.5%
0 20 40 60 80 100 120 140 160
Prob
abili
ty o
f Fai
lure
Asset Age
Normal
Weibull
Source: PB analysis
Due to the long lives of network assets, many of the asset classes considered by the businesses are only beginning to exhibit end of life behaviour. Therefore, any significant underestimate of the earlier life failures will have a disproportionate effect on the volume of
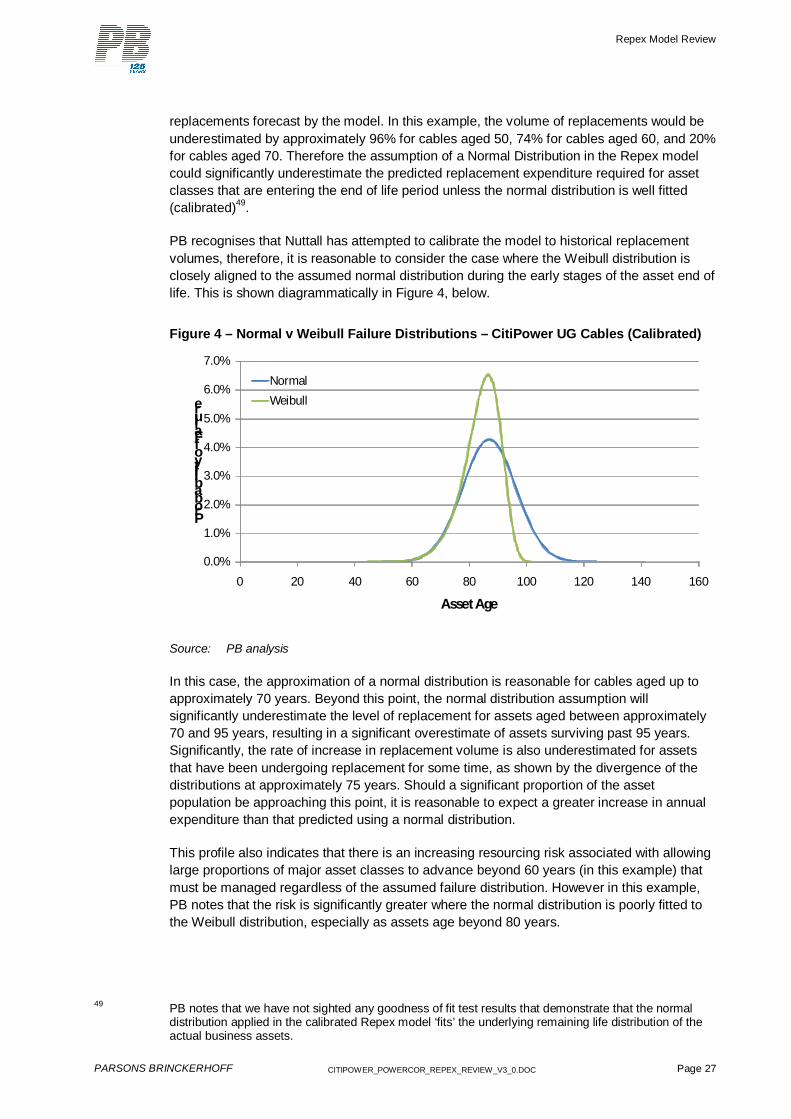
Repex Model Review
PARSONS BRINCKERHOFF CITIPOWER_POWERCOR_REPEX_REVIEW_V3_0.DOC Page 27
replacements forecast by the model. In this example, the volume of replacements would be underestimated by approximately 96% for cables aged 50, 74% for cables aged 60, and 20% for cables aged 70. Therefore the assumption of a Normal Distribution in the Repex model could significantly underestimate the predicted replacement expenditure required for asset classes that are entering the end of life period unless the normal distribution is well fitted (calibrated)49.
PB recognises that Nuttall has attempted to calibrate the model to historical replacement volumes, therefore, it is reasonable to consider the case where the Weibull distribution is closely aligned to the assumed normal distribution during the early stages of the asset end of life. This is shown diagrammatically in Figure 4, below.
Figure 4 – Normal v Weibull Failure Distributions – CitiPower UG Cables (Calibrated)
0.0%
1.0%
2.0%
3.0%
4.0%
5.0%
6.0%
7.0%
0 20 40 60 80 100 120 140 160
Probability of Failure
Asset Age
Normal
Weibull
Source: PB analysis
In this case, the approximation of a normal distribution is reasonable for cables aged up to approximately 70 years. Beyond this point, the normal distribution assumption will significantly underestimate the level of replacement for assets aged between approximately 70 and 95 years, resulting in a significant overestimate of assets surviving past 95 years. Significantly, the rate of increase in replacement volume is also underestimated for assets that have been undergoing replacement for some time, as shown by the divergence of the distributions at approximately 75 years. Should a significant proportion of the asset population be approaching this point, it is reasonable to expect a greater increase in annual expenditure than that predicted using a normal distribution.
This profile also indicates that there is an increasing resourcing risk associated with allowing large proportions of major asset classes to advance beyond 60 years (in this example) that must be managed regardless of the assumed failure distribution. However in this example, PB notes that the risk is significantly greater where the normal distribution is poorly fitted to the Weibull distribution, especially as assets age beyond 80 years.
49 PB notes that we have not sighted any goodness of fit test results that demonstrate that the normal
distribution applied in the calibrated Repex model ‘fits’ the underlying remaining life distribution of the actual business assets.

Repex Model Review
Page 28 CITIPOWER_POWERCOR_REPEX_REVIEW_V3_0.DOC PARSONS BRINCKERHOFF
Hence, unless the assumed normal distribution is well fitted to the underlying remaining life distribution (likely to be a Weibull distribution in the case of these assets) then PB is of the view that the use of a normal distribution to describe the end of life failure expectations as applied in the Repex model is likely to understate the required replacement volumes in the early stages of the asset wear out period. Furthermore this approach is also likely to understate the risks in future regulatory control periods due to the expectation of unrealistically long asset lives for a significant proportion of the population.
5.2.2 Standard deviation assumption
PB notes that limited standard deviation data was provided by the businesses due to the limited number of failure’s available to describe the failure function. In addition to the assumed normal distribution used in the Repex model, Nuttall also assumes that the standard deviation is the square root of the mean ‘calibrated life’ based on the understanding that it is an assumption used by Ofgem in the UK50. Figure 5 illustrates the effect of changing the assumed standard deviation. As with the normal distribution assumption, any overestimate of the actual standard deviation will result in a material overestimate of asset failures where the asset population is only beginning to reach the end of life. Similarly, any underestimate of the standard deviation will underestimate the rate of replacement growth that is required once failures begin to be observed.
Figure 5 – Effect of standard deviation assumptions
0.0%
1.0%
2.0%
3.0%
4.0%
5.0%
6.0%
7.0%
8.0%
9.0%
0 20 40 60 80 100 120 140 160
Probability of Failure
Asset Age
Nuttall - (St Dev 9.3 years)
St Dev 5 years
St Dev 15 Years
Source: PB analysis
Therefore, use of simple standard deviation assumptions in place of actual data to spread the replacement results in assumed fit of an assumed distribution is likely to produce a materially different failure profile. The resulting calibration process essentially fits the historical data to the assumed failure model, rather than fitting the model to the historical data.
50 ibid, p. 32.

Repex Model Review
PARSONS BRINCKERHOFF CITIPOWER_POWERCOR_REPEX_REVIEW_V3_0.DOC Page 29
PB notes that we have not sighted any goodness of fit test results that demonstrate that the normal distribution applied in the calibrated Repex model actually ‘fits’ the underlying remaining life distribution of the actual business assets at a known level of certainty.
PB recognises that a distribution could be fitted such that the over/underestimate is symmetrical, and where the model is considered over the longer term the errors in any one activity code could effectively cancel out as long as the analysis period is considerably longer than the average life. However, the analysis period for the Nuttall model is set to 20 years, with only the first five years of the forecast used for the purpose of setting the regulatory allowance. Considering that approximately 70% of the replacement value of the asset base in each business51 is in line assets (where the lives of poles, conductor and cables are comparatively long), the accuracy of the assumed failure profile in the early stages of the wear out period is critical as the averaging effect of older assets will not be achieved where very few of these assets subsequently exist.
Over the longer term, the diversification or errors (over and under estimates) in the different activity codes may mean that the total overall forecast is not unreasonable. PB is of the opinion that the use of an assumed standard deviation relationship means that the calibration process is unlikely to produce accurate forecasts at an activity code level over the short to medium term.
5.2.3 Age as a proxy for condition assumption
Nuttall’s model relies on the use of age as a proxy for condition. This approach is highly dependent on an appropriate categorisation and sub-categorisation of assets into classes that can be described by a single life and failure profile. That is the Repex model implicitly assumes the asses classes are reasonably homogenous. Hence the model is also highly dependent on the assumption that the assets within each class are subject, throughout their history, to a consistent environment across the asset class (i.e. similar maintenance practices, similar electrical and physical conditions, etc). To accurately capture failures where different failure modes occur at different times, or the deterioration rate is different for a similar asset in different locations (for example pole failures due to termite attack, fungal attack, third party impact, loading, etc) it would be necessary to assign multiple asset categories defined by failure mode or alternately define a complex multi-modal failure profile. A similar approach would also be required for assets where life extension or refurbishment activities (such as pole staking) is undertaken to enable the timing of additional expenditure to be captured.
Despite accurate sub-categorisation, certain replacement activities that are undertaken in response to accelerated deterioration or non-time based drivers (e.g. equipment obsolescence, change in safety/technical regulations) cannot be reflected in an age based model. Therefore the model will not provide suitable replacement forecasts for asset categories such as communications and SCADA equipment, where obsolescence/vendor support is a key driver for replacement.
On this basis, PB considers that the use of age as a proxy for condition is not a reasonable assumption when uniformly applied across all activity codes.
51 ibid, p. 35.

Repex Model Review
Page 30 CITIPOWER_POWERCOR_REPEX_REVIEW_V3_0.DOC PARSONS BRINCKERHOFF
5.3 Calibration
Nuttall identifies that the following data has been used as the basis for the calibration52:
the replacement volumes indicated by the individual asset age profiles, using the proportion of assets in these profile replacements between 2004 and 2008 as advised by the businesses in their responses to the Repex modelling information request
the historical (2006-2008) volumes and expenditure derived from replacement activity code level data provided by the businesses
The calibration process for the model is described by Nuttall as follows53:
determine the average historical replacement volumes (2004-2008) from the data indicated above
set the replacement life such that the 1st year of the forecast (2009) reflects this average volume
adjust the unit cost to reflect the relevant average annual activity code expenditure – the average for 2006-2008 was used here as this was the only reliable data available
re-adjust the replacement life to allow for the predicted increase in volumes from 2008 to 2009
PB understands the first two steps are intended to adjust the replacement volumes in 2009 to the average of the 2006 to 2008 volumes, with the third step attempting to match the unit costs so that the volume times unit cost relationship is consistent with historical expenditure. However the re-adjustment of replacement life in the fourth step appears to decalibrate the model from historical experience and calibrate the lives instead to a ‘predicted’ rather than actual increase in expenditure. It is also not clear whether the ‘predicted’ increase refers to the increase predicted by the original or the calibrated model.
In either case, the calibration process focuses on matching a single point (the 2009 replacement expenditure) to a single value (the average of the 2006-2008 expenditure). In PB’s opinion, this offers a relatively weak assurance that the model is calibrated at any other point in time. Further, due to the assumptions discussed in the preceding sections, we consider that it is most likely the model is calibrated to the modelling assumptions at this point rather than the modelling assumptions predicting the historical expenditure. In particular we note that Nuttall has not shown by means of back casting against the available 10 year historical RQM expenditure (at least at a total expenditure category level) or by other accepted model validation procedures, that the ‘calibrated’ model is calibrated to the businesses’ actual expenditure at any other point in time. In the absence of a calibration at multiple points in time, no reasonable estimate of the forecasting error of the model can be made.
In addition to the calibration process outlined by Nuttall, PB has reviewed the model and identified the following calibration factors:
52 ibid, p. 37. 53 ibid.

Repex Model Review
PARSONS BRINCKERHOFF CITIPOWER_POWERCOR_REPEX_REVIEW_V3_0.DOC Page 31
‘Scale Factor’54 – this hard coded multiplier appears to be used in the cost calibration process to inflate a hard coded original cost figure to form the target expenditure for an iterative goal seeking process. It is not clear to PB how the scale factor or the original cost figure have been derived.
‘Mult’55 - this hard coded multiplier appears to adjust for small differences between the target and calculated totals in the goal seeking process described above.
‘Life’56 - the adjusted lives arising from the calibration process are used to override the businesses submitted expected life assumptions so that the replacement volumes align with the historical average.
‘Unit Cost’57- the calibration process used by Nuttall to calibrate the unit costs is not clear, however comments contained in the model suggest that there is some uncertainty in the reconciliation of volumes and quantities with the businesses’ submitted data.
Following these calibration activities, Nuttall asserts that the model aligns with the businesses historical expenditure. PB notes that the calibration process has changed the forecast expenditure predicted by the model from an initial outcome of an approximately 100% to 650% p.a. increase in replacement expenditure58 to a 0% to 100% p.a. increase59 above historical levels. Therefore, the calibration process has a very material impact on the model outcomes. Noting that PB has been unable to follow the calibration process through the model, we are concerned that the calibration process may not be calibrating the model against historical results in a manner that enables confidence to be placed in the forecasting ability of the model.
As we have not been able to undertake a detailed review of the model calibration, and as Nuttall does not report any information on the accuracy, calibration results, or demonstrate the goodness of fit of the assumed normal distribution, PB has focused on reviewing the outputs of the calibration process to assess the reasonableness (or otherwise) of these results. This is discussed in the following section.
5.3.1 Calibration Outputs
In the apparent absence of a robust calibration process, PB considers it reasonable to assess the forecasting accuracy of the model indirectly through the calibrated lives that are required to enable Nuttall to fit the predicted expenditure to the average of the 2006-2008 expenditure.
As discussed in 5.2.3, the Repex model implicitly assumes that the assets are reasonably homogeneous at the activity code level. That is that the asset categories are of a similar type, operate in broadly similar environmental conditions and for a large proportion of the assets, were installed and maintained under common ownership and management for a large proportion of their lives. Therefore, it is reasonable to expect that there should be a significant degree of alignment between the ‘calibrated’ average replacement lives across
54 Repex Model, ‘Sheet 2’ Cell:I1 55 Repex Model, ‘Sheet 2’ Cell:Q2 56 Repex Model, ‘Sheet 2’ Column T 57 Repex Model, ‘Sheet 2’ Rows 5 to 17 58 Nuttall Consulting, “Report – Capital Expenditure, Victorian Distribution Revenue Review, A report to
the AER, Final Report”, 4 June 2010, p.36. 59 ibid p 39.

Repex Model Review
Page 32 CITIPOWER_POWERCOR_REPEX_REVIEW_V3_0.DOC PARSONS BRINCKERHOFF
the businesses. Where the calibrated replacement lives resulting from the common calibration process are broadly similar and within reasonable industry expectations, then the modelled approach would not appear to be unreasonable. However, where the calibrated lives for the same asset class differ substantially between businesses, the difference must be explained for the integrity of the model, and the calibration process, to be preserved. In the absence of a robust explanation of the differences in expected lives, the differences would appear to be the result of the model’s simple approach of fitting a normal distribution to a single historical point using the asset life (as the only independent variable available) to force the fit. In cases where the assumed distribution is a poor fit to the actual remaining life distribution, or where the historical data at the point of calibration is dominated by non-time based deterioration modes (e.g. obsolescence), the life found by fitting the distribution in this manner will be arbitrary, and forecasts based on lives ‘calibrated’ in this way will be meaningless.
Table 6compares the ‘calibrated’ lives to the range of average lives expected by the Victorian DNSPs. PB notes that for all activity codes except the Distribution Transformers code, the calibration process requires lives that are outside normal industry expectations. Similarly, in nine of the eleven categories, the variation between the highest and lowest calibrated lives is greater than the variation between the businesses’ expected values, in some cases by 18-23 years. This divergence indicates that the model is not predicting similar lives for similar assets, and suggests that the model is not calibrated to the underlying time-based deterioration modes common between the businesses.
Table 6 - Calibrated life v expected life for all DNSPs
Activity Code
Expe
cted
R
ange
Citi
Pow
er
Pow
erco
r
SP
Aus
Net
Jem
ena
Uni
ted
Ener
gy
Cal
ibra
ted
Ran
ge
Poles 44-58 78 66 56 55 65 55-78
Pole Top Structures 45-52 68 49 55 56 55 49-68
Overhead Conductors 46-60 86 79 87 68 85 68-87
Underground Cables 43-70 87 43 42 60 60 42-87
Zone Sub Stn Switchgear 50-56 65 60 64 63 63 60-65
Distribution Transformers 48-62 56 47 53 48 54 47-56
Power Transformers 55-65 65 68 83 67 71 65-83
SCADA, Network Control, Protection, Security
31-49 55 57 - 38 32 32-57
Service lines 40-67 92 69 45 57 42 42-92
Zone Sub Stn Other 48-53 65 59 45 60 61 45-65
Distribution Switchgear 31-50 63 42 39 42 34 34-63
No. Above Range 9 7 4 5 6 Source: Nuttall Report
In the absence of a clear alignment of the calibrated asset lives between businesses, the models would appear to be adversely affected by non-time related replacement influences that cannot be reliably predicted at an activity code level by an age based methodology alone. Furthermore, PB is of the view that while the extended lives may be indicative of the business favouring maintenance based solutions or asset refurbishment solutions in some

Repex Model Review
PARSONS BRINCKERHOFF CITIPOWER_POWERCOR_REPEX_REVIEW_V3_0.DOC Page 33
instances; it is more likely that the extended lives arising from the calibration process are primarily a result of the forced fit of the model to historical data.
From a review of Table 6, PB notes that the calibration lives are well outside normal industry expectations, and the poor correlation of calibration lives for similar assets across businesses indicates that the any assertion that the Repex model is calibrated is poorly supported. In PB’s opinion these results indicate that the model is unlikely to produce a reasonable forecast of the businesses’ replacement expenditure requirements at an activity code level.
5.4 PB’s findings - CitiPower
The calibration results for the CP model are summarised in Table 7. PB observes that the expected lives submitted by CP were at the upper end of industry expectations in 7 of the 11 activity codes.
Table 7 - Calibrated life v expected life for CitiPower
Activity Code
Expe
cted
R
ange
Citi
Pow
er
Ran
k
Cal
ibra
ted
Ran
ge
Citi
Pow
er
Ran
k
Life
Ex
tens
ion
Poles 44-58 58 1* 55-78 78 1 20
Pole Top Structures 45-52 45 4* 49-68 68 1 23
Overhead Conductors 46-60 60 1* 68-87 86 2 26
Underground Cables 43-70 70 1* 42-87 87 1 17
Zone Sub Stn Switchgear 50-56 56 1* 60-65 65 1 10
Distribution Transformers 48-62 55 2 47-56 56 1 1
Power Transformers 55-65 55 2* 65-83 65 5 10
SCADA, Network Control, Protection, Security
31-49 49 1 32-57 55 2 6
Service lines 40-67 60 2 42-92 92 1 32
Zone Sub Stn Other 48-53 53 1* 45-65 65 1 12
Distribution Switchgear 31-50 50 1 34-63 63 1 13
* equally ranked
Source: Nuttall Report and PB Analysis
The calibrated lives from the Repex model indicate that an extensive life extension factor must be applied in most categories to enable the model to match the historical expenditure. This includes extensions of between 17 and 32 years in the lines categories that comprise approximately 72% of the replacement value of the asset base. This results in the calibrated average lives exceeding the upper end of typical industry expectations by 17 to 26 years for these categories.
As the calibrated lives form the new inputs to the Repex model, it is necessary to consider whether the calibrated lives are reasonable in their own right. In the case of CP,

Repex Model Review
Page 34 CITIPOWER_POWERCOR_REPEX_REVIEW_V3_0.DOC PARSONS BRINCKERHOFF
underground cables comprise 43% of the replacement value of the network60 making this the most material activity code. The calibrated average life of 87 years for CP is 17 years longer than that applied for Jemena and United at 60 years, and 44 to 45 years longer than that applied for SP AusNet and Powercor at 42 and 43 years respectively. This is illustrated in Figure 6.
Similarly, in the case of the 6 year extension to average lives in the Secondary Systems activity code, the recommendation is on a category where PAL proposed the highest expected life at 49 years. The expected average life extension of 6 years ignores the fact that much of the equipment in this category is equipment where replacement is typically driven by obsolescence, withdrawal of vendor support, or the unavailability of spares. In many cases, an extension of 6 years may be uneconomic in the case of these assets. In practice, the likelihood of achieving an average service life extension of this magnitude is extremely low without accepting the considerable amount of additional risk, or incurring mitigating expenditure associated with operating obsolete equipment.
Figure 6 – Comparison of underground cable ‘calibrated’ life expectations
0%
1%
2%
3%
4%
5%
6%
7%
0 20 40 60 80 100 120 140 160
Probability of Failure
Asset Age
CitiPowerPowercorSPAusNetJemenaUnited Energy
Source: PB analysis
PB considers that there are two issues evident with the calibrated underground cable life:
given the average life of 87 years, and accepting Nuttall’s standard deviation approximation, results in the expectation that 20% of the cable population will remain in service for over 95 years, with 8% remaining in service for over 100 years. PB is not aware of any Australian distributor that would expect any cables to remain in service for over 100 years. Therefore we consider that the calibrated life input to the model does not appear to be aligned with industry expectations.
when compared to the calibrated life expectations for the other Victorian businesses, it is clear that there is a disparity in the calibration process. For example the life of underground cables on the PAL network (under common ownership and management as the CP network) has been calibrated downward by 26 years from the same original expected life of 60 years. As illustrated above, Nuttall’s calibrated
60 ibid p. 35.

Repex Model Review
PARSONS BRINCKERHOFF CITIPOWER_POWERCOR_REPEX_REVIEW_V3_0.DOC Page 35
lives assume that the entire population of underground cables on the PAL network would be largely replaced by 60 years, where end of life failures are only beginning for the CP network. It is not clear why cables on the CP network are expected to achieve service lives that are twice as long as the average service life on the PAL network.
PB also notes that similar issues are evident in each of the CP activity codes, albeit to a lesser extent due to the smaller contribution to the replacement value of the total asset base.
In our opinion, a difference of this magnitude without a robust explanation reinforces our view that the model is not robustly calibrated to time based failure modes. Noting the significance of the underground cables activity code in the CP asset base, and Nuttall’s statement that in the case of SP AusNet a 12-14 year difference in the assumed average life of a single category (poles) could reduce the total forecast replacement capex by a factor of two to six61, PB considers that the use of a calibrated life that is well beyond normal industry expectations may significantly understate the reasonable level of total replacement capex required over the next regulatory control period.
5.5 PB’s findings - Powercor
The calibration results for the PAL model are summarised in Table 7. PB observes that the expected lives submitted by PAL were at the upper end of industry expectations in 6 of the 11 activity codes.
Table 8 - Calibrated life v expected life for Powercor
Activity Code
Expe
cted
R
ange
Pow
erco
r
Ran
k
Cal
ibra
ted
Ran
ge
Pow
erco
r
Ran
k
Life
Ex
tens
ion
Poles 44-58 58 1* 55-78 66 2 8
Pole Top Structures 45-52 45 4* 49-68 49 5 4
Overhead Conductors 46-60 60 1* 68-87 79 4 19
Underground Cables 43-70 70 1* 42-87 43 4 -26
Zone Sub Stn Switchgear 50-56 56 1* 60-65 60 5 4
Distribution Transformers 48-62 48 4* 47-56 47 5 -1
Power Transformers 55-65 55 2* 65-83 68 4 13
SCADA, Network Control, Protection, Security
31-49 41 2 32-57 57 1 16
Service lines 40-67 67 1 42-92 69 2 2
Zone Sub Stn Other 48-53 53 1* 45-65 59 4 6
Distribution Switchgear 31-50 42 3 34-63 42 2* 1
* equally ranked
61 The Nuttall report (pp. 36-37) states that the Repex model predicted annual increases of 200% to
750% relative to the 2004-2008 average based on the businesses assumed asset lives. Following Nuttall’s adjustment of assumed asset lives, the model predicted annual increases of 100% to 200%.

Repex Model Review
Page 36 CITIPOWER_POWERCOR_REPEX_REVIEW_V3_0.DOC PARSONS BRINCKERHOFF
Source: Nuttall Report and PB Analysis
The calibrated lives from the Repex model indicate that a modest life extension factor is applied in most categories to enable the model to match the historical expenditure. However significant adjustments have been made in the OH Conductor, UG Cables, Power Transformers and Secondary Systems (SCADA, Network Control, Protection, Security) activity codes. These include extensions of between 13 and 19 years, and a negative adjustment of 26 years to the underground cables code. Together these categories comprise approximately 41% of the replacement value of the asset base62.
As the calibrated lives form the new inputs to the Repex model, it is necessary to consider whether the calibrated lives are reasonable in their own right. In the case of the 16 year extension to average lives in the Secondary Systems activity code, the recommendation is on a category where PAL proposed the second highest expected life at 41 years. The expected average life extension of 16 years ignores the fact that much of the equipment in this category is equipment where replacement is typically driven by obsolescence, withdrawal of vendor support, or the unavailability of spares. In many cases, an extension of 16 years exceeds the economic life of these assets. In practice, the likelihood of achieving an average service life extension of this magnitude is extremely low without accepting the considerable amount of additional risk, or incurring mitigating expenditure associated with operating obsolete equipment.
In our opinion, a difference of this magnitude between the calibrated life and practical considerations reinforces our view that the model is not robustly calibrated to time based failure modes. Noting the significant adjustment applied by Nuttall’s for this activity code, PB considers that the use of a calibrated life that is well beyond normal industry expectations, may significantly understate the reasonable level of total replacement capex required over the next regulatory control period.
62 Nuttall Consulting, “Report – Capital Expenditure, Victorian Distribution Revenue Review, A report to
the AER, Final Report”, 4 June 2010, p. 35.

Repex Model Review
PARSONS BRINCKERHOFF CITIPOWER_POWERCOR_REPEX_REVIEW_V3_0.DOC Page 37
6. Conclusions This report provides PB’s independent review of the Nuttall replacement capex forecasting methodology and the calibration of the supporting Repex model. In undertaking this review PB has noted a number of concerns, and provided specific opinions in relation to:
whether Nuttall’s replacement capex modelling reflects the businesses asset management plans
PB considers that Nuttall’s dismissal of the expenditure proposal, due in a large part to non-alignment with the Repex model results, does not reflect the specific risks faced by the business over the next regulatory control period. Therefore, PB is of the opinion that the Nuttall’s replacement capex modelling does not align with the specific risks and needs identified in the businesses’ AMPs.
whether the use of the 2006-08 expenditure is appropriate for forecasting expenditure in 2011-15, and has the Nuttall report sufficiently considered the actual and expected capex in the 2006-10 regulatory control period
PB noted that the AER’s approach is based on the assumption that the Repex model, calibrated to expenditure in the first three years of the current period, provides an appropriate baseline for predicting future replacement capex requirements. In turn, this assumes that the asset condition and associated business risks over the period from 2006 to 2008 are not materially different to those expected over the next regulatory period. In the absence of an ex-post review of the drivers of actual replacement expenditure, PB considers that limited conclusions can be drawn based on historical levels of expenditure, particularly over relatively short periods.
whether Nuttall’s replacement capex modelling is likely to produce a reasonable forecast of capital expenditure in consideration of the circumstances of the CP and PAL networks through the period 2011-15
PB is of the view that the substitute forecast is not based on the businesses current regulatory proposals, and that the Repex model forecast has not been shown to be the minimum adjustment required to achieve the capital expenditure objectives. Therefore the substitute forecasts may not be sufficient to address the specific needs and risks identified in the businesses’ submitted AMPs. Due to replacement driven by factors other than age, it is not clear how the Repex model is able to estimate replacements that are not related to time based deterioration (e.g. technical obsolescence, changes in statutory obligations, parts availability, etc) or do not fit the assumed failure profile (such as multi-modal failure profiles due to differing root causes). Therefore, PB does not consider that Nuttall’s replacement capex model results are likely to produce a reasonable forecast of capital expenditure that reflects the circumstances of the businesses over the period 2011-2015.
whether Nuttall’s replacement capex modelling is likely to produce capex forecasts that can be reasonably substituted for the businesses capex forecasts for the 2011-15 regulatory control period.
PB found that limited confidence could be placed in the calibration process and modelling assumptions, and that the age based calibration results do not align with reasonable industry expectations for the asset classes. In PB’s opinion, Nuttall’s replacement capex modelling is unlikely to produce capex forecasts at the activity

Repex Model Review
Page 38 CITIPOWER_POWERCOR_REPEX_REVIEW_V3_0.DOC PARSONS BRINCKERHOFF
code level that can be reasonably substituted for the businesses capex forecasts for the 2011-2015 period.

PARSONS BRINCKERHOFF CITIPOWER_POWERCOR_REPEX_REVIEW_V3_0.DOC Page 1
Appendix A
CV – John Thompson


PARSONS BRINCKERHOFF CITIPOWER_POWERCOR_REPEX_REVIEW_V3_0.DOC Page 1
JOHN THOMPSON Senior Consultant
Years of Experience 30 years (3 with PB, 27 with others)
Residence Languages Australia English
Education Masters of Business Administration, Deakin University, Melbourne; Post Graduate Research – Economics Risks in Energy Supply Reliability, University of Technology, Sydney; Bachelor of Engineering (Electrical) (1st Class Honours), University of Technology, Sydney.
Professional Affiliations Institution of Engineers Australia (IEAust): Member; Institution of Electrical and Electronic Engineers (IEEE): Member
Key Qualifications John is an electricity industry professional with a wide range of commercial, risk management and technical experience, as well as having undertaken major post graduate research work in the economics of network reliability. He has held a variety of technical and commercial positions during his career with one of the NSW leading distribution businesses (Integral Energy), which included extensive experience in the areas of network planning, operations, and design, well as retail and energy trading. He subsequently worked for the Australian Broadcasting Corporation in a senior strategic management role, and later with United Financial of Japan/Bank of Queensland in a senior risk management role. More recently, John managed a boutique engineering consultancy specialising in the design of electrical transmission and distribution infrastructure. John has considerable experience in asset management, risk management and infrastructure investment. John’s experience in risk management includes engineering risk, project risk, and financial risk using a range of quantitative and semi-quantitative methods. During his career John has developed particular expertise in the economics and modelling of large electrical networks, strategic planning, network planning, asset management as well as project engineering. This expertise is underpinned by sound technical knowledge and experience gained in all aspects of planning, design, operation, and maintenance of electrical networks. He has managed a wide range of network infrastructure projects, as well as business projects, and has experience in all facets of network business management and operations. In his work in the banking and finance industry, John also gained extensive experience in financial risk management and transaction structuring. This work included management of equity portfolio risk, credit risk management across consumer, commercial and institutional portfolios, as well as risk management of receivables programmes and various product lines. John was also extensively involved with the development of the bank’s Basel II accord response and implementation at the strategic, architectural and actuarial levels. Since joining PB John has been involved in a variety of projects including development of business cases for major investments, regulatory reviews, commercial due diligence, investment risk assessments, risk reviews and audits, as well as providing advice on regulatory compliance, asset management practices and strategy development.

PB Experience
Regulatory Advice and Pricing • Regulatory price control review, Queensland & South Australia, Energex, Ergon, ETSA. Engaged as
part of the PB team on a major project for the Australian Energy Regulator (AER) to review the electricity capital and operating expenditure submissions for Energex, Ergon, and ETSA.
• Facilities investment test compliance, Western Australia, Western Power. Engaged by Western Power to develop documentation to demonstrate compliance with Western Australia’s New Facilities Investment Test as part of the compliance review of Western Power by the Economic Regulatory Authority (ERA).
• Development of a market consultation paper, Tasmania, Transend/Aurora. Engaged to develop a joint consultation paper in accordance with the requirements of the National Electricity Rules (NER) for a major transmission and distribution expansion project on Hobart’s Eastern Shore.
• Regulatory price control review, NSW, TransGrid. Engaged as part of the PB team on a major project for the Australian Energy Regulator (AER) to review the electricity capital and operating expenditure submissions for TransGrid.
• Provide advice on network physical security strategy, Tasmania, Transend. Engaged to review and advise on a proposed security strategy and compare it to industry practice and best practice.
• Smart Grid business case development, NSW, Energy Australia. Engaged to develop a business case for the proposed development of a smart grid program for Energy Australia’s distribution system.
• Preparation of regulatory submission documentation, Western Australia, Western Power. Engaged to develop, in conjunction with Western Power, the businesses capital works submission documentation.
• Review of demand forecasting processes, Tasmania, Transend/Aurora. Engaged to review the demand forecasting processes of Transend and Aurora and provide advice on process improvements in light of best practice.
• Review of asset management and planning documentation, Tasmania, Transend. Engaged to review the key asset management plans and capital works business cases and provide advice on areas for improvement in preparation for an upcoming regulatory review.
• Tariff pricing model development, NSW, Sydney Airport Corporation Limited (SACL). Engaged to develop an automated tariff pricing model for SACL’s electricity network.
• Regulatory price control review, Victoria, SP AusNet and VENCorp. Engaged as part of the PB team on a major project for the Australian Energy Regulator (AER) to review the electricity capital and operating expenditure submissions for SP AusNet and VENCorp.
• Documentation review for Energy Australia, NSW, Energy Australia. A review of capital planning documentation to assess its quality, completeness and suitability to support the regulatory review process.
• Regulatory price control submission, Tasmania, Aurora Energy. Engaged as part of the PB team supporting the development of Aurora Energy’s distribution submission for 2007 pricing investigation to OTTER (Tasmanian Regulator).

PARSONS BRINCKERHOFF CITIPOWER_POWERCOR_REPEX_REVIEW_V3_0.DOC Page 3
Previous Experience
Risk Management (selected projects only) • Independent report and recommendations on the reliability of electrical supply to the Warragamba
Dam deep water access pumping station, NSW Department of Commerce. This included a workshop presentation to present and discuss the findings.
• Development and implementation of capital provisioning structures to support commercial funding arrangements for a number of the banks’ major corporate clients, NSW, various clients. This work also included bespoke structures for specific products, and for markets such as materials handling, medical imaging, data storage, and software.
• Credit risk management, Australia, Bank of Queensland/United Financial of Japan. Responsible for management of all credit approvals across Australia (exc. Qld) and New Zealand. This involved management of a team of credit analysts dealing with a broad range of commercial transactions and finance products for exposures in excess of $350,000.
• Calibration and verification of the Fair-Issacs consumer credit model on a diversified Australian consumer credit portfolio, Australia, Bank of Queensland. This work included development of both new and modified decision model rules to accommodate the idiosyncrasies of the particular portfolio.
• Developed a number of bank credit and risk management policies based on extensive research in various markets, Australia and New Zealand (e.g. wine industry, private education, gaming machines, New Zealand timber industry).
• Undertook a detailed operational risk assessment of broadcast facilities to identify key risks to the continuity of ABC broadcast operations in Sydney.
• Conducted analysis of a portfolio of financial products to determine the value at risk (VAR) within the portfolio and the economic value added (EVA) by the portfolio. This included recommendations on portfolio adjustments to optimise the portfolio’s value risk trade-off.
• Developed a number of put option documents to sell down the risks associated with commercial funding of particular assets (e.g. commercial leases, commercial debt).
• Developed a risk based pricing model to price retail electricity contracts into the overall retail portfolio. This involved pricing the proposed retail contract into the overall portfolio structure to determine the risk premium to apply to the proposed retail contract.
• Developed financial instrument models to price electricity trading risk in the national market. This involved modelling the key volatility parameters of the market and applying this to the determination of instrument value.
• Development of methodology to trade-off the capital cost of proposed network augmentation projects with the economic value of the proposed project based on the risks (uncertainties) associated with network performance, costs, timings, and the key economic value parameters (e.g. value of lost load).
• Performed an optimisation of a planned network capex portfolio based on the risk value trade-off associated with each project in the context of the overall portfolio.
• Conducted detailed analysis of the network performance risk associated with various proposed capex projects. This work also included studies into the optimum number and placement of network switches to maximise network performance.
Strategic Management • Valuation of a fiber optic business and the provision of advice on maximising the business value from
a range of ownership models for Aurora Energy (2009)
• Developed a technology strategy framework to bring together the overarching corporate strategy with the development strategies for specific technologies. This framework provided senior management

with a view of technology development that underpinned corporate strategy and provided a guide to capex funding.
• Development of a strategy to ensure the corporation’s facilities management system was developed to support integration across all media streams (i.e. television, radio, internet, digital spectrum).
• Commercial strategy development for a range of bank product lines and funding structures. This work focused on ensuring that risks were appropriately structured into the products and their supporting business systems.
• Development of a management and implementation strategy for the key requirements of the Basel II accord. This work addressed the overarching structural, procedural, and functional issues faced by the business in complying within the key elements of the accord.
• Development of a business strategy to incorporate load control (demand bidding) into the retail energy portfolio. This strategy focused on the issue of developing a suitable load control block within an immature market.
Power Systems and Forecasting • Modelling of the electricity pool price, and portfolio and market demands to produce short and long-
term forecasts of price and demand to support energy trading in the national electricity market. This work also required forecasting of a range of related variables such as energy, coal price etc.
• Spatial demand forecasting across a large electricity network to provide long term forecast that underpinned network augmentation planning and non-capital project development.
• Transmission and distribution planning and strategy – the detailed planning and commercial/economic assessment of network augmentation projects for presentation to senior management with recommendations for major network augmentations and networks connections (including embedded generation).
• Demand-side management, load control – development of network planning proposals and customer proposals to apply demand side initiatives and load control technology to support the achievement of capital programme deferral.
• Development of network planning standards including work on 22kV distribution standards, network reliability standards, and planning standards to achieve optimal feeder structure and switching arrangements.
• Operations planning work – undertake analysis to determine network operation sequences to support operations in unusual and complex situations (e.g. commissioning of major substations, embedded generation, etc).
• Network performance benchmarking – undertook benchmarking studies to compare network performance with the performance of reference networks in the USA, Canada, and the UK.
• Power system modelling and analysis, including power flow, fault analysis, stability analysis, reliability analysis, and analysis to support operations.
Professional History 2006 – present Parsons Brinckerhoff 2004 – 2006 Connect Design/Connect Engineering 2000 – 2004 United Financial of Japan/Bank of Queensland 1999 – 2000 Australian Broadcasting Corporation 1979 – 1999 Integral Energy

PARSONS BRINCKERHOFF CITIPOWER_POWERCOR_REPEX_REVIEW_V3_0.DOC Page 1
Appendix B
CV – Evan Mudge

EVAN MUDGE Consultant
Years of experience 7 (2 with PB, 5 with others)
Residence Australia
Languages English
Education Bachelor of Engineering (Hons 1) (Mechanical), University of Technology Sydney
Professional affiliations Engineers Australia: Member Green Building Council of Australia: Green Star Accredited Professional
Key qualifications Evan Mudge is an energy industry professional with consulting experience spanning a range of energy and industrial infrastructure projects. He is a professional Mechanical Engineer with specific experience in energy network revenue regulation, energy infrastructure investment, embedded generation and low emissions building design.
Evan’s experience spans the entire energy supply and consumption chain from coal mining and transport, power generation, electricity and gas network regulation, industrial and commercial energy use with a focus in innovative low greenhouse gas emission solutions. In addition, having undertaken operational analysis of steelworks and rail networks for prominent corporations and prepared specialist environmental assessment reports for major infrastructure projects, Evan possesses a unique understanding of the complex influences and constraints of infrastructure planning, regulatory concerns and project delivery. This background ensures that he can provide a holistic and practical view of the current issues affecting the energy industry.
PB experience
Energy Network Regulation
Ergon Energy Revenue Determination (2010), Queensland, Australian Energy Regulator. Reviewed Ergon Energy’s corporation initiated augmentation portfolio for the period 2010/11-2014/15 as submitted in the revised regulatory proposal. Provided recommendations to inform the regulator’s final decision.
ETSA Utilities Revenue Determination (2009-2010), South Australia, Australian Energy Regulator. Reviewed ETSA Utilities’ proposed $2.2b capital works portfolio for the SA electricity distribution network for the period 2010/11-2014/15. Included a review of the asset management, capital governance, risk management and cost estimating processes, major expenditure items and demand management initiatives. Provided recommendations to inform the regulator’s draft and final decision.
Productivity Performance of NSW State Owned Corporations (2009), New South Wales, Confidential Client. Researched international and domestic measurement of productivity performance. Identified and reported the limitations of multi-factor or single factor productivity measures and methodologies.
ActewAGL ACT Gas Distribution Network Access Arrangement (2009), Australian Capital Territory, ActewAGL.Reviewed ActewAGL’s proposed $200m capital works portfolio for the ACT and Queanbeyan gas distribution network over the period 2009/10-2013/14. Included a review of the key cost estimating and capital accumulation processes, investment decision making framework and selected major expenditure items. Provided advice regarding the likely regulatory treatment and identified the additional supporting material required to support the expenditure.

PARSONS BRINCKERHOFF CITIPOWER_POWERCOR_REPEX_REVIEW_V3_0.DOC Page 3
TransGrid Revenue Determination (2008), New South Wales, Australian Energy Regulator. Reviewed TransGrid’s proposed $2.6b capital works portfolio for the NSW electricity transmission network over the period 2009/10-2013/14. Included a review of the key cost estimating and capital accumulation processes, asset replacement programs and selected major projects. Provided recommendations to inform the regulators draft and final decisions.
Western Power Access Arrangement (2008), Western Australia, Western Power. Reviewed selected projects included in Western Power’s proposed capital works portfolio. Provided advice regarding the likely regulatory treatment and identifying the additional supporting material that may be required to support the expenditure.
Energy Infrastructure Investment Analysis
Smart Grid Smart City Funding Application (2009), Australia, Confidential Client. Undertook analysis of Australian distribution networks to demonstrate network comparability and translation of the findings from the Federal Government supported demonstration project across other networks. Provided specific input with regard to distributed energy smart grid applications for inclusion in the bid documentation.
Strategic Options for Shared Telecommunications Infrastructure (2009), Australia, Confidential Client. Researched international and domestic treatment of using regulated energy network assets to provide competitive telecommunications services to inform decisions taken by an Australian distribution network. Prepared options assessment to identify the ownership structure that would provide the most favourable outcome for the business.
Power Station Gas Availability Assessment (2009), Victoria, Origin. Provided high level assessment of gas availability and likely supply infrastructure constraints for a proposed 1000MW CCGT power station installation in Victoria. The assessment was used as input to a site selection study and was based on publically available planning documentation.
Due Diligence Investigation of Generation Assets (2009), Australia/New Zealand, Confidential Client. Technical due diligence investigation of open cycle gas turbine and process integrated industrial cogeneration power station sites to inform the due diligence process for their potential acquisition.
Transmission Line Cost Benchmarking (2008), Western Australia, Western Power. Undertook cost benchmarking analysis for a major 330kV transmission line project in Western Australia, including comparative assessment, consideration of local influences and analysis of the reasonableness of the proposed costs.
Previous experience
Distributed Generation Projects
Trigeneration Feasibility Assessments (2007-08), NSW/SA/VIC, Various Clients. Developed project
feasibility models for gas fired cogeneration and trigeneration projects, based on an analysis of capex, opex and projected energy sales revenue for commercial scale embedded generation projects. Including the presentation of technical and financial models to board level management, project stakeholders and financial partners to facilitate contractual agreements.
Distributed Generation Environmental Benefits Assessments (2007-08), NSW/SA/VIC, Various Clients. Quantification and valuation of the environmental benefit of low emissions power projects, including calculation of expected Greenhouse Gas Abatement Certificates, total tonnes CO2 avoided per year and estimate of the benefit to the project site NABERS Energy rating

Trigeneration Plant Revenue Optimisation (2007-08), NSW/SA/VIC, Various Clients. Developed optimised operational strategy to maximise revenue for embedded generation projects based on the site electrical and thermal energy demand, available spot market export prices and operational efficiency and capacity of the generation plant. Including evaluation of fuel procurement options and energy pricing within the constraints of the regulatory environment.
Energy Pricing Analysis (2007-08), NSW/SA/VIC, Various Clients. Determination of thermal and electrical energy tariffs for residential and commercial trigeneration systems against capex, opex and financing costs to comply with regulatory requirements and ensure appropriate return based on forecast energy quantities.
Building Energy Analysis
GridX Power MiniGrid Demonstrtation (2008), Glenfield NSW, GridX Power, Analysis of the GridX Power demonstration trigeneration minigrid at Glenfield to determine the effect of the system on the weather dependent electrical demand diversified across 16 homes. Included analysis of future staging options, optimisation of plant utilisation and evaluation of redundancy requirements to ensure compliance with reliability standards.
Tianjin Environmental Protection Board Green Building (2007), Tianjin China, Tianjin City. Developed the conceptual energy and environmental strategy for the refurbishment of the existing Tianjin Environmental Protection Bureau office building in China into a flagship green building. Including the analysis of geothermal heating and cooling potential, solar induced natural ventilation, photovoltaic generation yield and specification of the key design parameters of the low energy auxiliary services. The building is typical of 50,000 similar buildings across China that are due for replacement or upgrade and represents a template for wide scale transformation of China’s aged building stock.
Latitude East at World Square (2006-07), Sydney NSW, Multiplex. Sustainable Design Consultant for the 5 star NABERS rated Latitude East project at World Square, Sydney. Conducted a detailed energy simulation of the building architectural, mechanical and electrical systems to minimise the energy consumption of the building. Post completion tests confirmed that the building is the most CO2 efficient NABERS rated building in Sydney (excluding Green Power offsets). The building achieves this status using conventional Heating Ventilation and Air Conditioning systems.
Applied Research Investigations (2006-07), Various Locations, Australia. Sustainable Design Research Engineer - conducted various project driven research and modelling investigations to quantify the benefit of building technology and design features on energy use and thermal comfort in commercial and industrial buildings. Topics investigated included the effect of highly reflective roof coatings on air conditioning energy consumption, the thermal response of data centres under cooling system failure conditions, high rise building glazing optimisation, solar chimney design and simulation of natural ventilation performance through automated façade control.
Industrial Projects
Sydney Desalination Plant Noise Assessment (2007), Kurnell NSW, Blue Water Joint Venture. Environmental assessment of noise propagation under varying atmospheric conditions associated with the Sydney Desalination Plant. Including the submission of assessment reports to identify environmental noise controls required for compliance with the construction and operational license conditions for the project.
Port Botany Expansion Construction Noise Assessment (2006), Port Botany NSW, Sydney Ports. Environmental assessment of noise propagation under varying atmospheric conditions associated with the Port Botany Expansion dredging works. Including the submission of assessment reports to

PARSONS BRINCKERHOFF CITIPOWER_POWERCOR_REPEX_REVIEW_V3_0.DOC Page 5
identify environmental noise controls required for compliance with the license conditions for the project.
Port Kembla Site Master Plan (2005), Port Kembla NSW, BlueScope Steel. Operational analysis of the BlueScope Steel Port Kembla steelworks including workshop with internal stakeholders within BlueScope to determine the projected demands on the site over a 15 year planning horizon in order to develop a site master plan. Co-ordination of multidisciplinary team in the project planning and definition stage of the master plan development
Waste Heat Recovery (2005), Hobart TAS, Zinifex. Undertook desktop feasibility study for the use of waste heat from contaminated timber combustion as a process heat source at the Zinifex Risdon works in Hobart TAS. Provided recommendations enabling the combustion gases to be captured and scrubbed to reclaim contaminant metals in ash.
BlueScope Steel Coil Handling Study (2004-05), Port Kembla NSW, Australian Metal Recovery. Operational study of steel coil handling and transport strategy for the BlueScope Steel Port Kembla steelworks, including detailed modelling of crane movements to determine production bottle necks and utilisation rates following the hot strip mill upgrade. Evaluated the transport options, developed cost estimates and assessed feasibility of solutions to reduce work-in-progress inventory and offer significant improvements in the time-to-market for BlueScope’s steel coil products
Newpac Colliery Longwall Expansion (2004-05), Hunter Valley NSW, Resource Pacific. Project management / owners engineering team for the contract negotiation and project delivery planning of $200M longwall expansion project in the Hunter Valley including scheduling, co-ordination of contract input, review of payment claims and progress inspections for the conveyor supply contract.
Queensland Specialty Steels (2004-05), Ipswich Queensland, Boulder Steel. Project controls for the environmental impact statement and preliminary engineering stage of the proposed $800M Queensland Specialty Steel mill
Caterpillar 789C Haul Truck Noise Attenuation (2004), Hunter Valley NSW, Westrac Caterpillar. Detailed design and acoustic finite element analysis of noise attenuation package for Caterpillar 789C haul trucks for the BHP Billiton Mount Arthur North Project in the Hunter Valley, NSW. Post completion tests confirmed that the design resulted in the quietest trucks in their class worldwide providing significant operational benefits to the mine.
Illawarra-Eastern Suburbs Railway Line Timetable Design (2003-04), Sydney NSW, CityRail. Simulation of train operations, calculation of required fleet size, analysis of stabling operations and field survey of current patronage levels and runtimes to support the development of 2011 long range timetable for Illawarra/Eastern Suburbs Railway line.
Awards
Sustainable Design Consultant for Latitude East @ World Square, winner 2008 Australian Steel Institute Multi Level Steel Building Design Award. Energy consumption over the first year of operation confirmed that the building is the most CO2 efficient 5 star NABERS rated building in Sydney (excluding green power offsets).
Business Analyst for GridX minigrid trigeneration systems, winner 2007/08 Dupont Innovation Award, 2007 Banksia Climate Award, 2007 Housing Industry Association of Australia GreenSmart Awards, 2007 Urban Development Institute of Australia Awards and 2007 Australian Institute of Energy Excellence Award.

Design Engineer for 789C Caterpillar 789C Haul Truck Attenuation Project, winner of 2006 Engineers Australia Engineering Excellence award and Association of Consulting Engineers Australia (ACEA) Certificate of Achievement for Specialist Services.
Professional development
Terrapinn Financial Modelling Masterclass 2008
Green Star Accredited Professional Course 2007
Professional history 2008 – present Parsons Brinckerhoff 2007 – 2008 GridX Power 2006 – 2007 Bassett Applied Research (AECOM) 2004 – 2005 GHD 2003 Systemwide