Repetitive Member Factors for the Allowable … the failure criterion in ASTM D 6555 is currently a...
40
Repetitive Member Factors for the Allowable Properties of Wood Products Steve P. Verrill David E. Kretschmann United States Department of Agriculture Forest Service Forest Products Laboratory Research Paper FPL–RP–657 truncated Weibull COV (load sharing 5th)/(single member 5th) 0.1 0.2 0.3 0.4 0.4 0.6 0.8 1.0 1.2 rho = 1.0 rho = 0.9 rho = 0.7 rho = 0.5
Transcript of Repetitive Member Factors for the Allowable … the failure criterion in ASTM D 6555 is currently a...
Repetitive Member Factors for the AllowableProperties of Wood ProductsSteve P. VerrillDavid E. Kretschmann
United StatesDepartment ofAgriculture
Forest Service
ForestProductsLaboratory
ResearchPaperFPL–RP–657
truncated Weibull
COV
(load
sha
ring
5th)
/(sin
gle
mem
ber 5
th)
0.1 0.2 0.3 0.4
0.4
0.6
0.8
1.0
1.2
rho = 1.0rho = 0.9rho = 0.7rho = 0.5

September 2010
Verrill, Steve P.; Kretschmann, David E. 2010. Repetitive member factors for the allowable properties of wood products. Research Paper FPL-RP-657. Madison, WI: U.S. Department of Agriculture, Forest Service, Forest Products Laboratory. 38 p.
A limited number of free copies of this publication are available to the public from the Forest Products Laboratory, One Gifford Pinchot Drive, Madison, WI 53726–2398. This publication is also available online at www.fpl.fs.fed.us. Laboratory publications are sent to hundreds of libraries in the United States and elsewhere.
The Forest Products Laboratory is maintained in cooperation with the University of Wisconsin.
The use of trade or firm names in this publication is for reader information and does not imply endorsement by the United States Department of Agriculture (USDA) of any product or service.
The USDA prohibits discrimination in all its programs and activities on the basis of race, color, national origin, age, disability, and where applicable, sex, marital status, familial status, parental status, religion, sexual orienta-tion, genetic information, political beliefs, reprisal, or because all or a part of an individual’s income is derived from any public assistance program. (Not all prohibited bases apply to all programs.) Persons with disabilities who require alternative means for communication of program informa-tion (Braille, large print, audiotape, etc.) should contact USDA’s TARGET Center at (202) 720–2600 (voice and TDD). To file a complaint of discrimi-nation, write to USDA, Director, Office of Civil Rights, 1400 Independence Avenue, S.W., Washington, D.C. 20250–9410, or call (800) 795–3272 (voice) or (202) 720–6382 (TDD). USDA is an equal opportunity provider and employer.
AbstractWe identify confusion in the literature about the definition and calculation of repetitive member factors. This confusion casts some doubt on the validity of the 1.15 repetitive mem-ber factor permitted in ASTM D 245 and ASTM D 1990.
Keywords: repetitive members, assembly, reliability, redun-dancy, load sharing, composite action, residual capacity
Contents1 Introduction ........................................................................1
2 Confusion about the method of calculating a repetitive member adjustment ...............................................................1
3 Confusion about which literature values are relevant for the ASTM standards ..............................................................3
4 Additional sources of ambiguity ........................................5
5 Summary and conclusions .................................................6
6 Acknowledgments ..............................................................7
References .............................................................................7
7 Appendix A—The simulations ...........................................8
8 Appendix B—Correlations and the generation of the strengths and stiffnesses ........................................................9

Repetitive Member Factors for the AllowableProperties of Wood Products
Steve P. Verrill, Mathematical StatisticianDavid E. Kretschmann, Research General EngineerUSDA Forest Products Laboratory, Madison, Wisconsin
1 Introduction
It is generally accepted that there should be an upward repetitive member allowable propertyadjustment. ASTM D 245 (ASTM 2007a) and ASTM D 1990 (ASTM 2007b) specify a 1.15 factorfor allowable bending stress. This factor is also listed in table 1 of ASTM D 6555 (ASTM 2007c).In this report we identify sources of confusion regarding appropriate repetitive member factors.This confusion casts some doubt on the validity of the 1.15 value.
The two main sources of confusion that we discuss are associated with the fact that a fullrepetitive member factor can be modeled as a combination of subfactors. ASTM D 6555 identifiesthree subfactors — load sharing,1 composite action,2 and residual capacity.3
The first confusion is associated with the proper calculation of the load sharing subfactor. Thesecond confusion is associated with the question of whether the third subfactor, residual capacity,is to be included in the “full” repetitive member factor.
In Sections 2 and 3 we describe these two main sources of confusion in some detail. In Section4 we discuss additional sources of ambiguity. In Appendix A we discuss a simple simulation thatfocuses on the load sharing factor.
2 Confusion about the method of calculating a repetitive memberadjustment
In section X2.8 of ASTM D 6555, the repetitive member adjustment is determined experimentallyby finding an estimate of the fifth percentile of the strength distribution of an assembly (actuallya one-sided lower confidence bound on the fifth percentile) where an assembly’s strength is takento be the load at first member failure, and dividing that by an estimate of the fifth percentileof individual member strength (again, actually a one-sided lower confidence bound on the fifthpercentile). In the standard’s example, this ratio is 1.11. However, in section 8.4.1 of ASTM D 6555,the repetitive member adjustment is defined differently. Rather than the ratio of the fifth percentileof an assembly’s strength distribution to the fifth percentile of an individual member’s strengthdistribution, it is defined as the ratio of the fifth percentile of an assembly’s strength distributionto the fifth percentile of the minimum of k individual strengths (where an assembly is composed ofk members). The fifth percentile of this “minimum of k” strength distribution will be lower thanthe fifth percentile of the strength distribution of a single member, and the calculated repetitive
1In ASTM D 6555, section 3.1.4, “load sharing” is defined as “distribution of load among adjacent, parallelmembers in proportion to relative member stiffness.”
2In ASTM D 6555, section 3.1.1, “composite action” is defined as “interaction of two or more connected woodmembers that increases the effective section properties over that determined for the individual members.”
3In ASTM D 6555, section 3.1.8, “residual capacity” is defined as “ratio of the maximum assembly capacity tothe assembly capacity at first failure of an individual member or connection.”
1

member factor will be larger. Either of the standard’s definitions is permissible if subsequentlyapplied correctly in calculating allowable properties, but the ratio described in section 8.4.1 ofASTM D 6555 cannot be applied to the fifth percentile of an individual member (as is suggested insection 8.5.1 of ASTM D 6555). It would have to be applied to the fifth percentile of the distributionof the minimum strength of k members. Otherwise, we would be overestimating assembly strength.
To make this point clear, note that in the load sharing simulations described in Appendix A,for strength, stiffness correlations below 1.0, we have
ysngl > yassem > ymink (1)
where
ysngl = qth percentile of the single member strength distribution
yassem = qth percentile of the load sharing assembly strength distribution
ymink = qth percentile of the distribution of the minimum strength of k single members
where the assembly is composed of k members and q = 1, 5, 10.To obtain a correct yassem value, we could do (ratio RADS definition)
yassem = (yassem/ysngl)× ysngl ≡ RADS × ysngl
as is suggested by the example in section X2.8 of ASTM D 6555, or we could do (ratio RADM
definition)yassem = (yassem/ymink)× ymink ≡ RADM × ymink
butyassem 6= (yassem/ymink)× ysngl
In fact, since ysngl > ymink, (yassem/ymink) × ysngl can be a serious overestimate of yassem. Unfor-tunately, repetitive member factors reported in the literature are sometimes of the yassem/ymink
variety, and it is common practice to apply these factors to ysngl values (as suggested in section8.5.1 of ASTM D 6555).
We give some examples from the literature below.In a load sharing simulation in which assemblies contained five members, Zahn (1970, table 4)
reports load sharing fractional increases of 0.128, 0.096, 0.125, 0.082, and 0.125. However, thesefractional increases are not calculated as
(yassem − ysngl)/ysngl = RADS − 1
nor as(yassem − ymink)/ymink = RADM − 1
Instead they are calculated as(yassem − ymink)/ysngl
From Zahn’s table, we can calculate the “correct” RADS (yassem/ysngl) load sharing factors: 0.978,1.077, 0.891, 0.681, and 0.929. Thus, in four of the five cases that Zahn simulated, the assemblywas weaker (at the fifth percentile) than an individual member. (This does not take into accountcomposite action.)
Zahn also references an experiment conducted by Atherton and Corder (1965) at Oregon State.In this experiment, “floors” constructed of 14 beams and 1/2-inch sheathing grade plywood were
2
loaded to failure. The experimentally determined mean load capacity of five such floors was com-pared to the mean load capacity of five unsheathed “floors.” The load capacity of an unsheathed“floor” was taken to be the minimum of the strengths of the 14 beams that had been assignedto it. Thus the “increase in load capacity” reported in Zahn’s table 5 (taken from the OregonState report) has a RADM nature. That is, it represents the ratio of the strength of a load-sharingassembly to that of a weakest link assembly rather than to the strength of an individual member.
Wolfe and LaBissoniere (1991, table 3) report load sharing increases that range from 9% to47%. However, these are neither RADS nor RADM values. They constructed three roof assemblies,each containing eight trusses and a gable end. They defined assembly failure as the point at whichmaximum load was achieved. This point did not correspond to first member failure. (They discussthe failure of trusses within the roof assembly prior to the failure of the assembly.)
Their repetitive member factor was the ratio of the assembly load at failure to the smallestmaximum load on a member of the assembly that failed in the course of the assembly failure. Thisis not a ratio of fifth percentile estimates. Also, the denominator is closer to a minimum of kstrength value than to an individual member strength value.
Because Wolfe and LaBissoniere also tested individual trusses to failure, it is possible to calculateRADS ratios (although they are at mean population values rather than at fifth percentiles). Fromtheir table 1, for their three assemblies we obtain RADS values of 0.84, 1.00, and 1.024 These ratiosdo not support a repetitive member load sharing increase (assuming that we are beginning from asingle member allowable property base).
3 Confusion about which literature values are relevant for theASTM standards
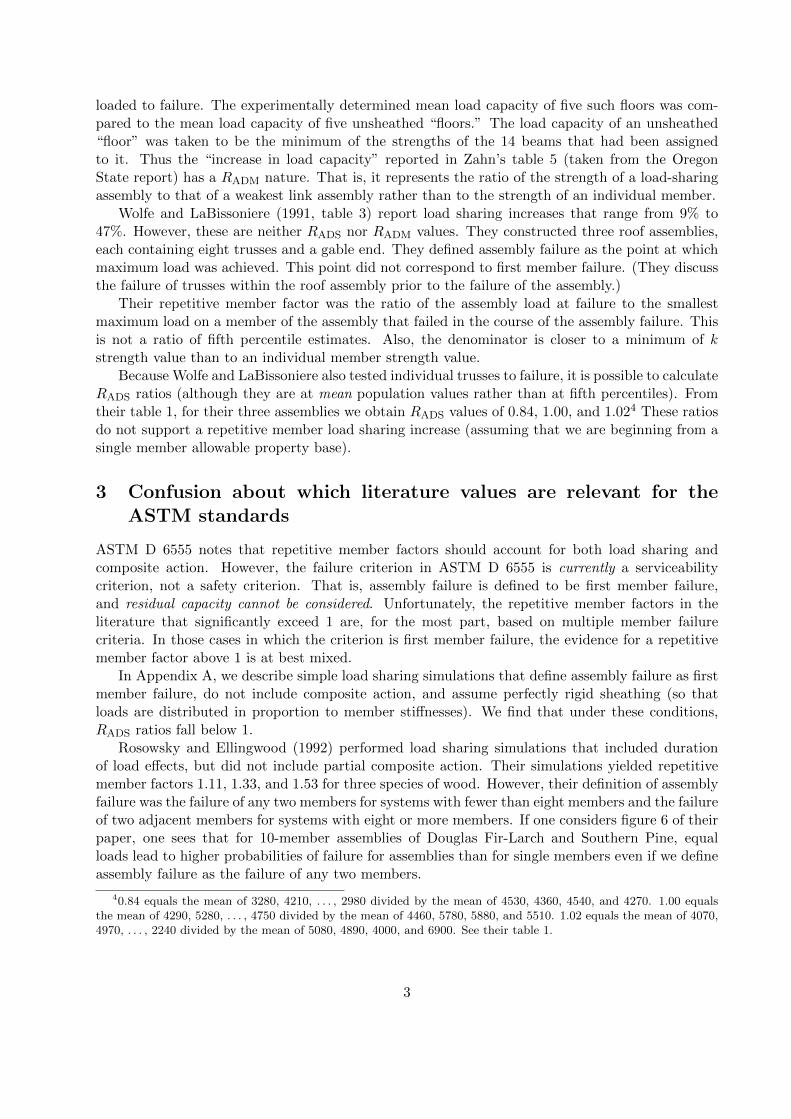
ASTM D 6555 notes that repetitive member factors should account for both load sharing andcomposite action. However, the failure criterion in ASTM D 6555 is currently a serviceabilitycriterion, not a safety criterion. That is, assembly failure is defined to be first member failure,and residual capacity cannot be considered. Unfortunately, the repetitive member factors in theliterature that significantly exceed 1 are, for the most part, based on multiple member failurecriteria. In those cases in which the criterion is first member failure, the evidence for a repetitivemember factor above 1 is at best mixed.
In Appendix A, we describe simple load sharing simulations that define assembly failure as firstmember failure, do not include composite action, and assume perfectly rigid sheathing (so thatloads are distributed in proportion to member stiffnesses). We find that under these conditions,RADS ratios fall below 1.
Rosowsky and Ellingwood (1992) performed load sharing simulations that included durationof load effects, but did not include partial composite action. Their simulations yielded repetitivemember factors 1.11, 1.33, and 1.53 for three species of wood. However, their definition of assemblyfailure was the failure of any two members for systems with fewer than eight members and the failureof two adjacent members for systems with eight or more members. If one considers figure 6 of theirpaper, one sees that for 10-member assemblies of Douglas Fir-Larch and Southern Pine, equalloads lead to higher probabilities of failure for assemblies than for single members even if we defineassembly failure as the failure of any two members.
40.84 equals the mean of 3280, 4210, . . . , 2980 divided by the mean of 4530, 4360, 4540, and 4270. 1.00 equalsthe mean of 4290, 5280, . . . , 4750 divided by the mean of 4460, 5780, 5880, and 5510. 1.02 equals the mean of 4070,4970, . . . , 2240 divided by the mean of 5080, 4890, 4000, and 6900. See their table 1.
3
Bulleit and Liu (1995) performed simulations that were based on a version of McCutcheon’s(1984) beam-spring analog model. Both duration of load and partial composite action were includedin their simulations. They defined assembly failure variously as the failure of any one member, ofany two members, of any three members, or of any four members. They report three cases (seetheir table 9) in which assembly failure was defined to be first member failure. The system factorsin these three cases were 1.04, 1.09, and 1.24. Bulleit and Liu also found cases in which systemfactors were less than 1. See their table 6.
Wheat et al. (1986) created 15 full-scale test floors (three replications of five distinct test floors).For each of these floors they reported both the ultimate load and the load at first member failure.We can compare the mean loads at first member failure with the population mean strengths ofindividual members. For the single member means, we used No. 2, 15% moisture content in-gradevalues (Green and Evans, 1987).
The resulting strength ratios were 0.60, 0.62, 0.79, 0.79, and 0.58. (Note that these are ratios atthe mean, not at the fifth percentile.) See their tables 1 and 5 for the data needed to calculate thesevalues. Given that Wheat et al. used No. 2 and better boards, these system factors are probablyoverestimates.
In a thorough and insightful analytical study, Rosowsky and Yu (2004) made use of an ex-tension (Yu, 2003) of McCutcheon’s (1984) beam-spring analog model to evaluate a portfolio ofwall systems. In this paper they considered four ratios related to our RADS = yassem/ysngl andRADM = yassem/ymink:
KPY ≈ (fifth percentile of ultimate system strength)/ yassem (2)
where PY denotes “post yield”;
KLS ≈ yassem/ymink = RADM (3)
where LS denotes “load sharing”;KNMEM ≈ ymink/ysngl (4)
where NMEM denotes “number of members”; and
KPCA ≡ (fifth percentile of T-beam strength)/ysngl (5)
where PCA denotes “partial composite action”.Equations 2, 3, and 4 are only approximations because our y’s do not include partial composite
action.Rosowsky and Yu calculated their raw repetitive member factor as
KPY ×KLS ×KNMEM ×KPCA
They found that, by far, the largest contributor to a repetitive member factor greater than 1 wasKPY. That is, residual capacity is the greatest contributor. However, D 6555 does not currentlypermit one to include residual capacity in the calculation of a repetitive member factor. When KPY
is set to 1 as it must be if we define assembly failure as first member failure, then Rosowsky andYu’s work yields repetitive member factors (that include partial composite action) that fall below1. (See, for example, their table 3. Also see Rosowsky et al., 2005.) This is driven by the smallvalue of KNMEM, essentially the ratio of the the fifth percentile of the minimum of the strengths ofk members to the fifth percentile of the strength distribution of a single member (where there arek members in the assembly).
4

Note that our RADS = yassem/ysngl is approximately equal to Rosowsky and Yu’s (2004) KLS ×KNMEM. They found (see their figure 8), as we have, that this product decreases with increasingmodulus of rupture coefficient of variation (COV).
We note that there are studies that calculate the repetitive member factor as done in sectionX2.8 of ASTM D 6555 (fifth percentile tolerance limit for the assembly strength distribution to thefifth percentile tolerance limit of an individual member strength distribution) and obtain valuesgreater than 1. See, for example, table 4 of Bohnhoff et al. (1991). (Note that ratios of fifthpercentile estimates can differ significantly from ratios of tolerance limits — compare the 1.27 and1.40 values in the last column of Bohnhoff et al.’s table 4. Further note that although their ratioof fifth percentile estimates is above 1, their ratio of means is below 1.)
Using finite element methods, Folz and Foschi (1989) obtained an average system factor of 1.38for systems in which assembly failure was first member failure. (However, they also obtained systemfactors that lay near or considerably below 1 in specific cases. See their table 7.) They did notconsider duration of load effects.
Thus, we are not claiming that there are no cases in which the repetitive member factor shouldbe greater than 1. We are saying, however, that there is confusion in the literature about thedefinition of a repetitive member factor and that it is by no means clear (at least if we restrictourselves to adjustments due to load sharing and partial composite action, and a definition ofassembly failure as first member failure) that the factor should, in general, be greater than 1 whenit is defined as yassem/ysngl, the ratio of the fifth percentile of the assembly strength distribution tothe fifth percentile of the individual member distribution (as it is commonly applied but not alwayscalculated).
4 Additional sources of ambiguity
Even if we settle on an RADS (rather than an RADM) definition of the repetitive member factor, andwe agree, for the current purposes of ASTM D 6555, to include only load sharing and compositeaction in this factor, we can obtain a wide range of RADS values. This point has been madepreviously by (at the least) Folz and Foschi (1989), Bulleit and Liu (1995), Rosowsky and Yu(2004), and comments in the standard itself. For example:
• As the number of members in an assembly increases, the repetitive member factor decreases.This is in accord with intuition and our simulations, and has been previously observed by Folzand Foschi (1989), Rosowsky and Ellingwood (1991), Bulleit and Liu (1995), and Rosowskyand Yu (2004).
• As the correlation between strength and stiffness increases — as load sharing becomes moreeffective — the repetitive member factor increases. This is in accord with intuition and oursimulations, and has been previously observed by Folz and Foschi (1989) and Bulleit and Liu(1995).
• As the modulus of rupture COV increases, RADS values decrease. In fact, for large COVs,load sharing assembly strengths can be much less than single member strengths. (It is truethat RADM values do increase with COV. That is, the advantage of load sharing assembliesover weakest link assemblies (but not over single members) increases with increasing COV.)
Intuitions about the effect of an increase in the coefficient of variation of MOR have been, insome cases, incorrect. (See, for example, Verrill and Kretschmann, 2009.) For a one memberfailure criterion, a decline in the repetitive member factor with an increase in MOR COV
5
has been observed by Folz and Foschi (1989), Bulleit and Liu (1995), and Rosowsky and Yu(2004). It is also apparent in our simulations. For a two adjacent members failure criterion,a decline in the repetitive member factor with an increase in MOR COV has been observedby Rosowsky and Ellingwood (1991).
In contrast, for various failure criteria that require more than one member failure, Bulleit andLiu (1995) report that the repetitive member factor increases as modulus of rupture COVincreases.
• Folz and Foschi (1989) and Bulleit and Liu (1995) have identified a number of other variables(for example, sheathing thickness and fastener stiffness) that can have a significant effect onthe repetitive member factor.
5 Summary and conclusions
We have identified confusion in the literature about the proper choices for ASTM repetitive memberfactors. It appears that at least some of the justification for an 1.15 ASTM repetitive member factormay be based on this confusion. First, engineers might have RADM values in mind rather than theappropriate RADS values. Second, they might have RADS values in mind that are appropriate fora multiple member failure criterion, but not for a first member failure criterion. Finally, we havereminded readers of the fact that there are additional variables (such as number of members inthe assembly and COV of the modulus of rupture) that can have a large effect on the repetitivemember factor.
Our work suggests that authors must be quite careful when they report the results of repetitivemember studies, and standards bodies must be even more careful when they interpret these results.For example, answers to the following questions must be clear:
1. Which of the subfactors — load sharing, partial composite action, residual capacity — doesa reported system factor include?
2. What is the definition of assembly failure? Is it first member failure as specified in ASTMD 6555, or the failure of two members, or the failure of two adjacent members, or maximumassembly load capacity, or . . . ?
3. What definition of repetitive member factor is used? If the repetitive factor is calculated asa ratio of strengths:
• Is it calculated as RADS = yassem/ysngl or RADM = yassem/ymink?
• If the RADM definition is used, how is the factor to be applied?
• At what percentile (e.g., 50th, 5th, . . . ) is the ratio calculated? ASTM D 6555 specifiesthe fifth percentile, but some data sets only permit it to be calculated at the mean.
• Is it a ratio of fifth percentiles or a ratio of tolerance bounds? ASTM D 6555 specifies thefifth percentile in Section 8.4.1.2, but uses tolerance bounds in the example in SectionX2.8.
4. How many members are in the assembly?
5. What distributions of single member strength are considered?
6. What is the COV of the individual member strength distributions?
6

7. What is the correlation between strength and stiffness?
The correct repetitive member factor can depend heavily upon the answers to these questions.Taken together, these dependencies suggest that a single repetitive member factor is unlikely
to be appropriate. This point has been made previously by Folz and Foschi (1989), Bulleit and Liu(1995), Rosowsky and Yu (2004), and in ASTM D 6555 itself.
6 Acknowledgments
The authors gratefully acknowledge the very valuable comments and suggestions of the reviewers.
References
Atherton, G.H.; Corder, S.E. 1965. Strength of floors with 2 by 6 Douglas-fir utility grade joists.Preliminary Report, Forest Research Laboratory, Oregon State University, Corvallis.
ASTM. 2007a. Standard practice for establishing structural grades and related allowable proper-ties for visually graded lumber. D 245-06. West Conshohocken, PA: ASTM International.
ASTM. 2007b. Standard practice for establishing allowable properties for visually graded dimen-sion lumber from in-grade tests of full-size specimens. D 1990-00. West Conshohocken, PA:ASTM International.
ASTM. 2007c. Standard guide for evaluating system effects in repetitive-member wood assemblies.D 6555-03. West Conshohocken, PA: ASTM International.
Bohnhoff, D.; Moody, R.; Verrill, S.; Shirak, L. 1991. Bending properties of reinforced andunreinforced spliced nail-laminated posts. Research Paper FPL-RP-503. Madison, WI: U.S.Department of Agriculture, Forest Service, Forest Products Laboratory.
Bulleit, W.; Liu, W. 1995. First-order reliability analysis of wood structural systems. Journal ofStructural Engineering. 121(3): 517–529.
Folz, B.; Foschi, R.O. 1989. Reliability-Based Design of Wood Structural Systems. Journal ofStructural Engineering. 115(7): 1666–1680.
Green, D.; Evans, J.W. 1987. Mechanical properties of visually graded lumber: Volume I, asummary. Publication 88-159-389. Dept. of Commerce. National Technical InformationService, Springfield, VA, 131 p.
McCutcheon, W.J. 1984. Deflections of uniformly loaded floors: a beam-spring analog. ResearchPaper FPL-RP-449. Madison, WI: U.S. Department of Agriculture, Forest Service, ForestProducts Laboratory.
Rosowsky, D.; Ellingwood, B. 1991. System Reliability and Load-Sharing Effects in Light-FrameWood Construction. Journal of Structural Engineering. 117(4): 1096–1114.
Rosowsky, D.; Ellingwood, B. 1992. Reliability of wood systems subjected to stochastic live Loads.Wood and Fiber Science. 24(1): 47–59.
Rosowsky, D.; Yu, G. 2004. Partial factor approach to repetitive-member system factors. Journalof Structural Engineering. 130(11): 1829–1841.
7

Rosowsky, D.; Yu, G.; Bulleit, W. 2005. Reliability of light-frame wall systems subject to combinedaxial and transverse loads. Journal of Structural Engineering. 131(9): 1444–1455.
Verrill, S.; Kretschmann, D. 2009. Material variability and repetitive member factors for theallowable properties of engineered wood products. ASTM Journal of Testing and Evaluation.37(6): 607–615.
Wheat, D.; Gromala, D.; Moody, R. 1986. Static Behavior of Wood-Joist Floors at Various LimitStates. Journal of Structural Engineering. 112(7): 1677–1691.
Wolfe, R.; LaBissoniere, T. 1991. Structural performance of light-frame roof assemblies. II.Conventional truss assemblies. Research Paper FPL-RP-499. Madison, WI: U.S. Departmentof Agriculture, Forest Service, Forest Products Laboratory.
Yu, G. 2003. Load sharing and system factors for light-frame wall systems. Ph.D. dissertation,Oregon State University, Corvallis, Oregon.
Zahn, J. 1970. Strength of multiple-member structures. Research Paper FPL-RP-139. Madison,WI: U.S. Department of Agriculture, Forest Service, Forest Products Laboratory.
7 Appendix A — The simulations
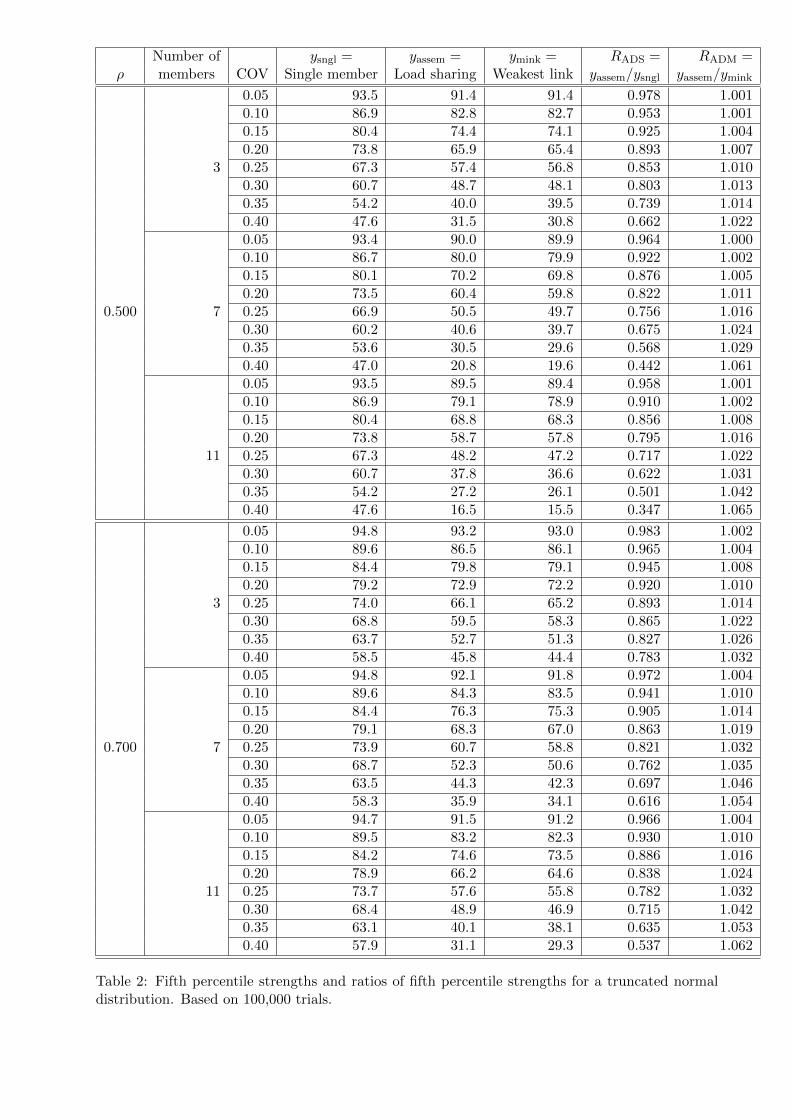
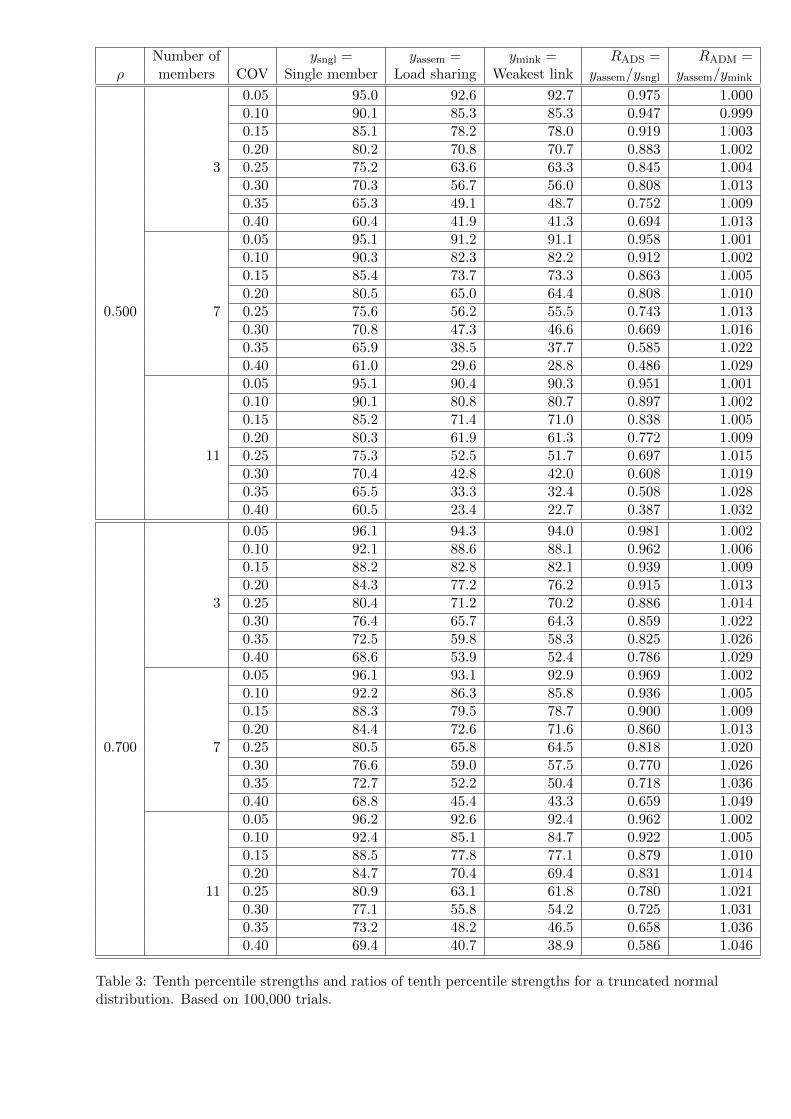
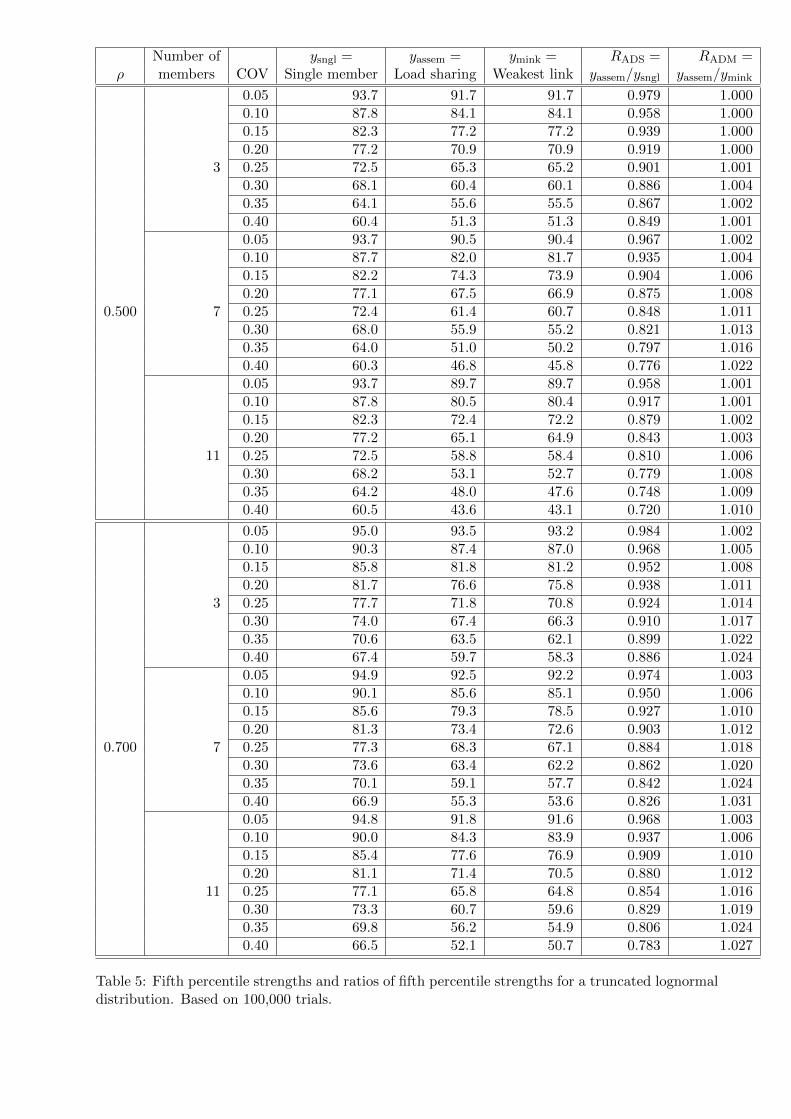
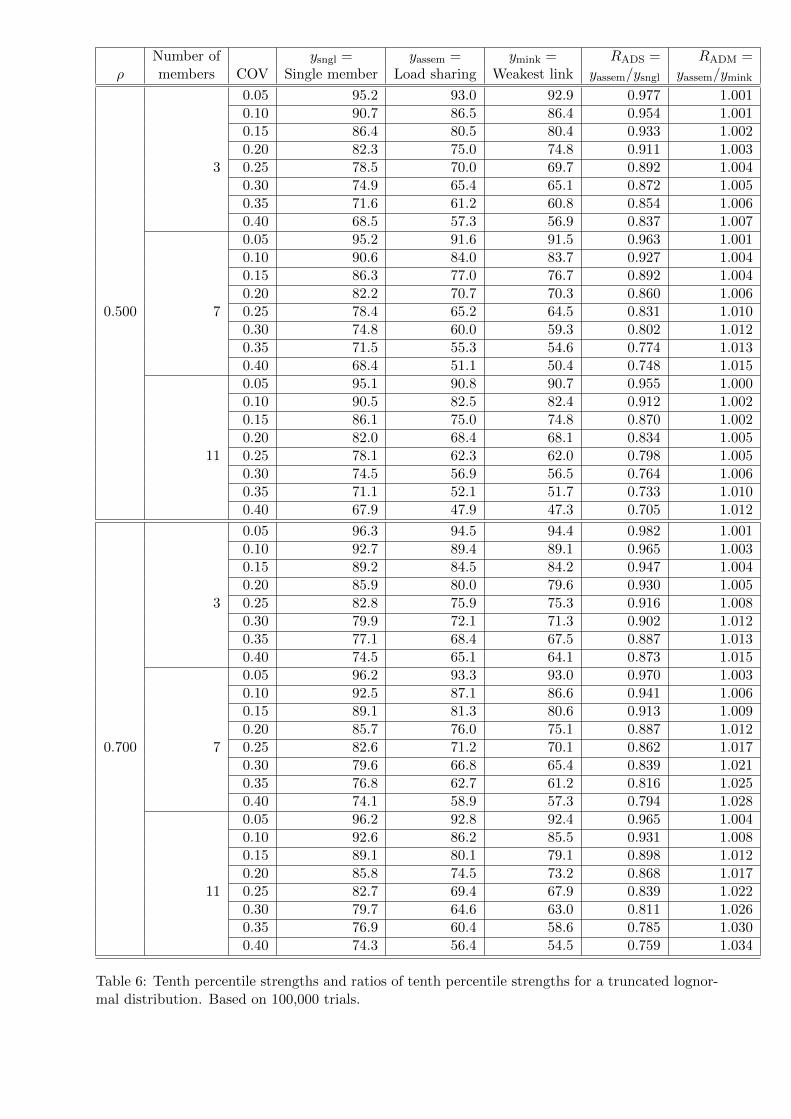
We worked with “truncated normal”, “truncated lognormal”, and “truncated Weibull” individualmember distributions. We were attempting to model the selection of No. 2 boards. For a givencorrelation between modulus of elasticity (MOE) and modulus of rupture (MOR), we generated100,000 pairs from the appropriate bivariate normal distribution. In the lognormal and Weibullcases one member of each pair had to be further transformed. See Appendix B for details. We thenidentified the 60,000 boards with the largest MOEs (the top 60% of the MOEs) and treated themas MSR (machine stress rated) No. 2 and better. We treated the 40,000 of these 60,000 with thelowest MOEs (the bottom two-thirds of the No. 2 and better) as No. 2 boards.
We considered assemblies of 3, 7, and 11 members. We modeled load sharing by assuming aninfinitely stiff diaphragm, which ensured that all members were displaced equally so that loadswere proportional to member stiffnesses. We did not include composite action in our model, andwe defined assembly failure to be first member failure (so we did not consider residual capacity5).
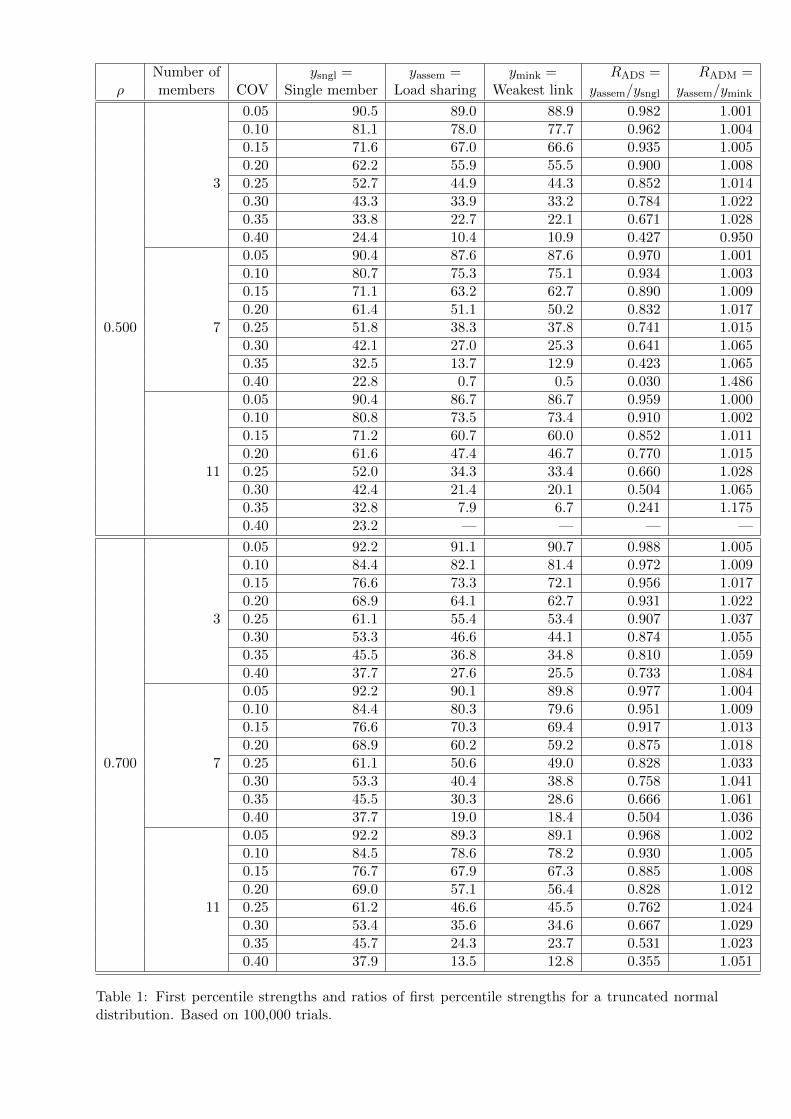
In our simulations we calculated the ratio of the qth quantile (q = 0.01, 0.05, 0.10) of thestrength distribution of a load sharing assembly to the qth quantile of the single member strengthdistribution (an RADS ratio) and the ratio of the qth quantile of the strength distribution of a loadsharing assembly to the qth quantile of the distribution of the minimum of k member strengths (anRADM ratio)
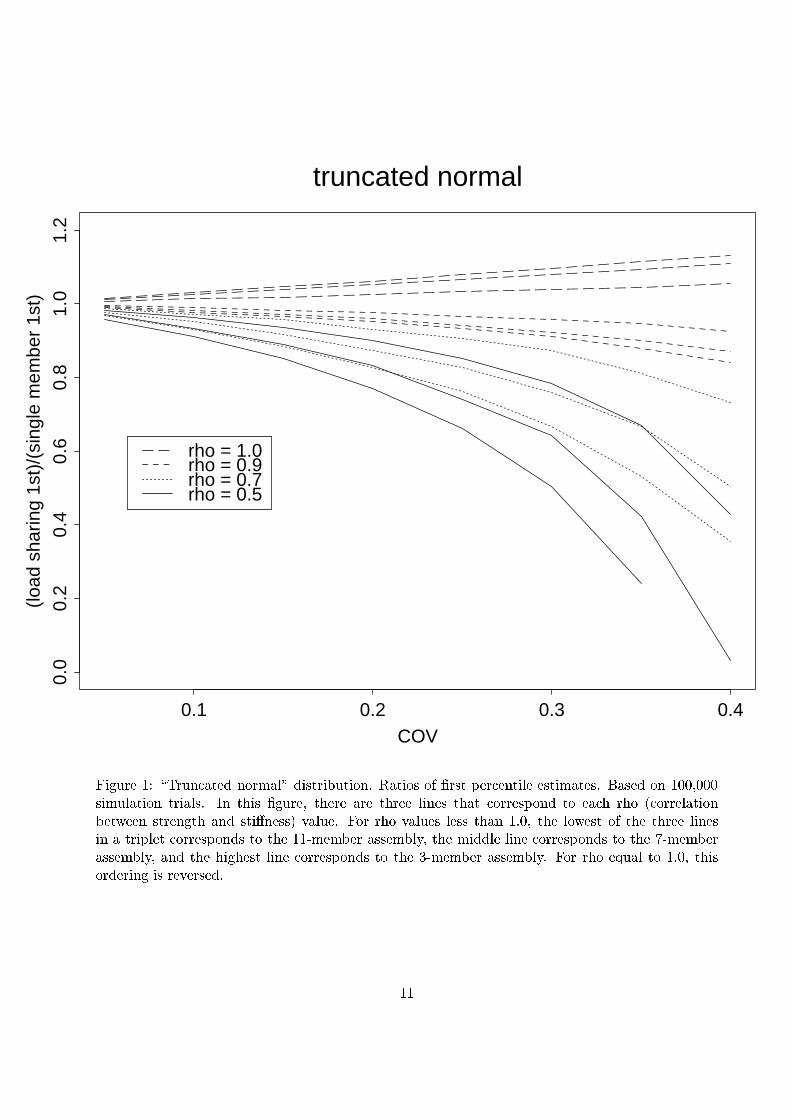
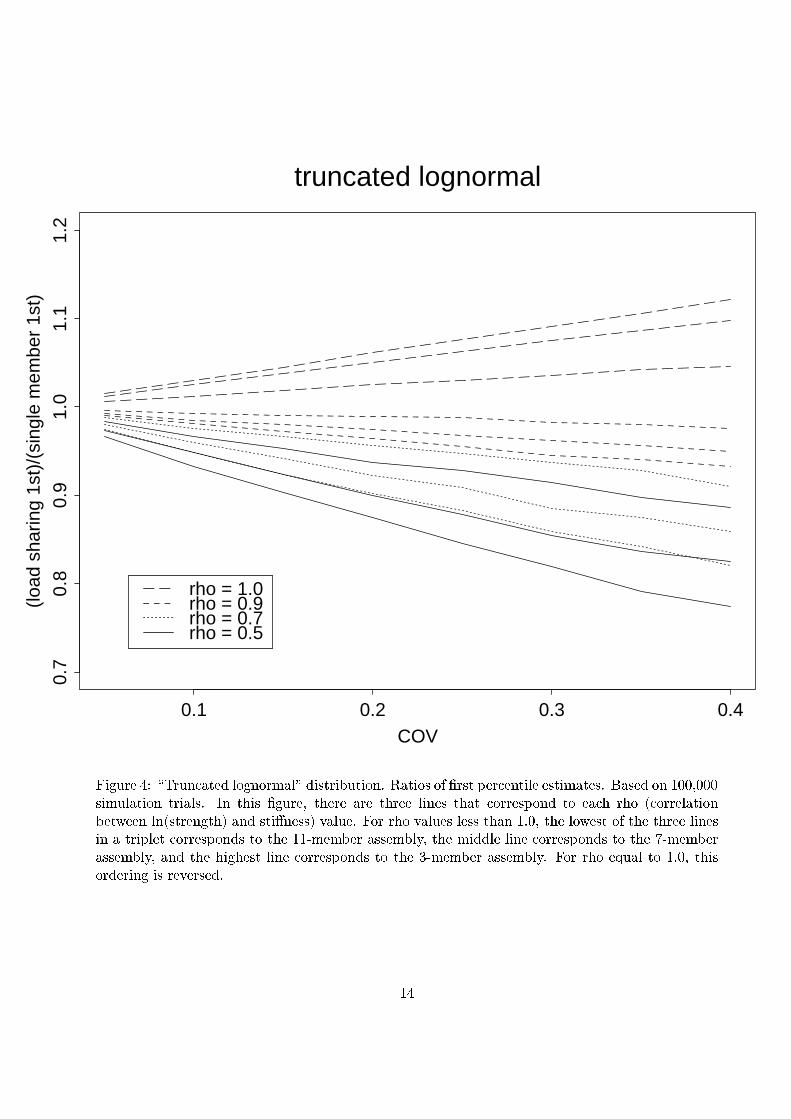
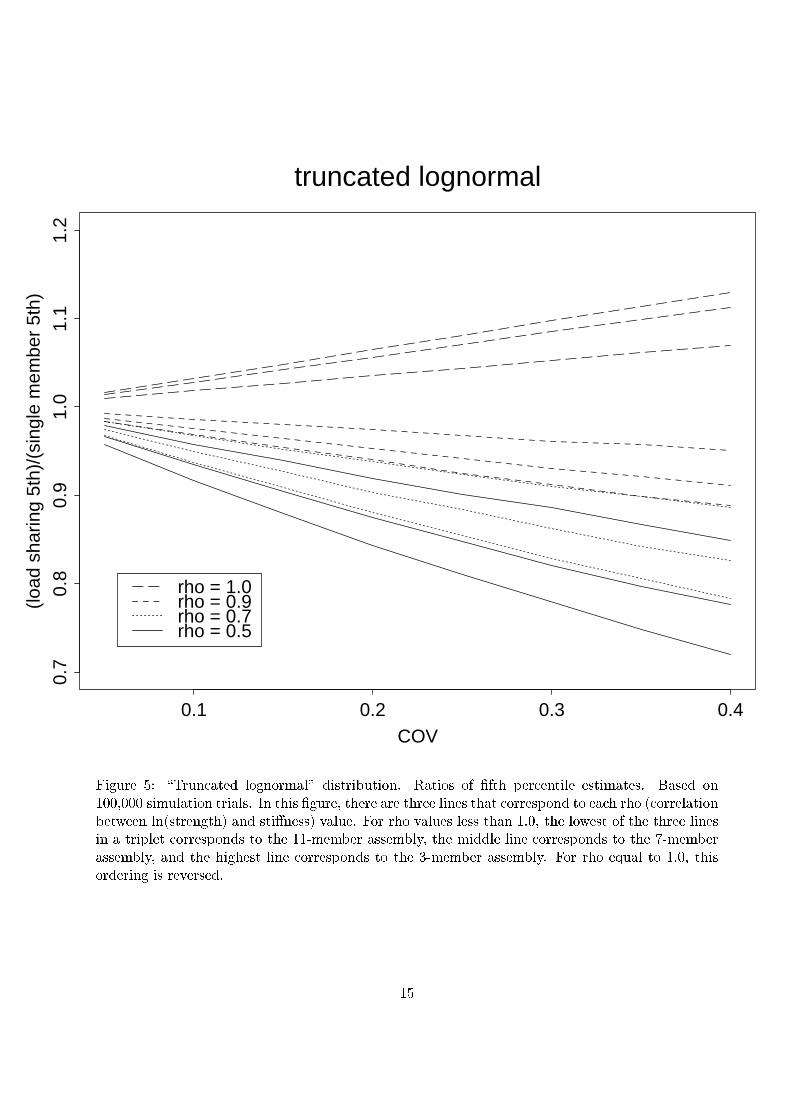
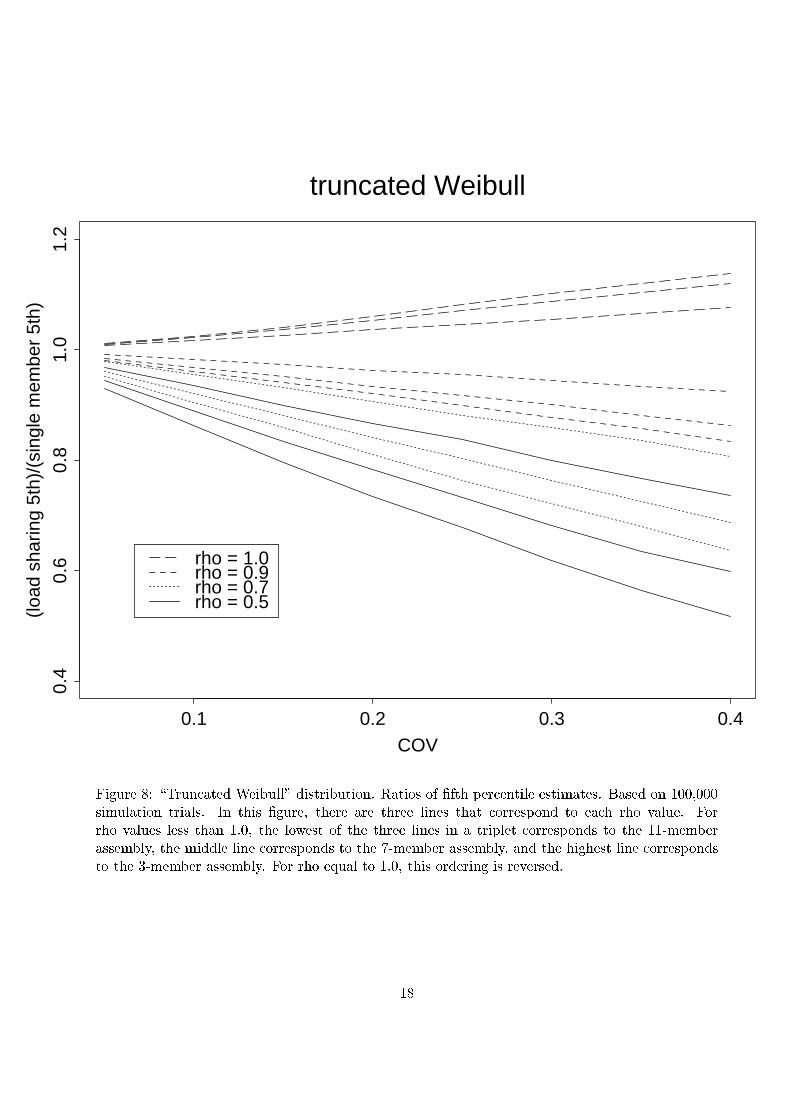
The RADS values appear in column 7 of our tables. The RADM values appear in column 8of the tables. In Figures 1–9 we plot RADS values versus COV. Figures 1–3 correspond to q =0.01, 0.05, 0.10 for a “truncated normal” distribution. Figures 4–6 correspond to q = 0.01, 0.05, 0.10for a “truncated lognormal” distribution. Figures 7–9 correspond to q = 0.01, 0.05, 0.10 for a“truncated Weibull” distribution. In each figure, there are three lines that correspond to each rho(correlation between strength and stiffness) value. For rho values less than 1.0, the lowest of the
5One reviewer, while accepting the results of the paper, argued that defining assembly failure as “first memberfailure” is not appropriate for tightly coupled assemblies such as laminates. We concur. However, for floors and roofs,we believe that first member failure is a reasonable assembly failure criterion. In any event, the current ASTM D6555 does not permit a repetitive member adjustment based on residual capacity.
8

the three lines in a triplet corresponds to the 11-member assembly, the middle line correspondsto the 7-member assembly, and the highest line corresponds to the 3-member assembly. For rhoequal to 1.0, this ordering is reversed. (In the in-grade data (Green and Evans, 1987), MOR/MOEcorrelations generally ranged from 0.60 to 0.75.)
Our simulations indicate that the ratios depend upon the assumed distribution (“truncatednormal,” “truncated lognormal,” “truncated Weibull”) of the individual members, the number ofmembers (3,7,11) in the assembly, the correlation between the MOR and the MOE, the q value,and the COV of the individual member strength distribution.
In particular, the simulations demonstrated the following:
• The RADM values are (as we would expect) always above 1. That is, load sharing assembliesdeserve an upward adjustment from weakest link assemblies.
• The RADS values are below 1 for strength, stiffness correlations below 1. That is, load sharingassemblies do not deserve an upward adjustment from single member values. In fact theirallowable properties should be adjusted downward from the allowable properties of singlemembers. (We emphasize that we are not considering composite action in our simulations.However, Rosowsky and Yu’s (2004) work suggests that this conclusion holds even if we doinclude composite action.)
• The downward adjustment should be greater for assemblies with more members.
• As we would expect, the downward adjustment is less as the correlation between strengthand stiffness increases — as load sharing becomes more effective. In fact, given a perfectcorrelation between strength and stiffness, the RADS values are greater than 1.
• As material variability increases (as COV increases), RADS values decrease. In fact, for largeCOVs, load sharing assembly strengths can be much less than single member strengths. (Itis true that RADM values do increase with COV. That is, the advantage of load sharing as-semblies over weakest link assemblies (but not over single members) increases with increasingCOV.)
The FORTRAN computer programs that we used in our simulations can be found athttp://www1.fpl.fs.fed.us/RepMem sim.html.
8 Appendix B — Correlations and the generation of the strengthsand stiffnesses
The MOEs were all normally distributed. The MORs were distributed as normal, lognormal, orWeibull random variables. In all cases the medians of the distributions were equal to 100.
8.1 Normal strengths
The MOE of an MOE,MOR pair was generated as
MOE = 100 + 100× COV× ε1where ε1 represents a generated N(0,1) random variable. The correlated MOR value was generatedas
MOR = 100 + 100× COV× (ρ× ε1 +√
1− ρ2 × ε2)where ε1 and ε2 are “independent” generated N(0,1)’s. The correlation between the MOE andMOR values is then ρ.
9
8.2 Lognormal strengths
The MOE of an MOE,MOR pair was generated as
MOE = 100 + 100× COV× ε1
where ε1 represents a generated N(0,1) random variable. The correlated MOR value was generatedas
MOR = 100× exp(σ ×
(ρ× ε1 +
√1− ρ2 × ε2
))where ε1 and ε2 are “independent” generated N(0,1)’s, and
σ =
√log(1 + COV2)
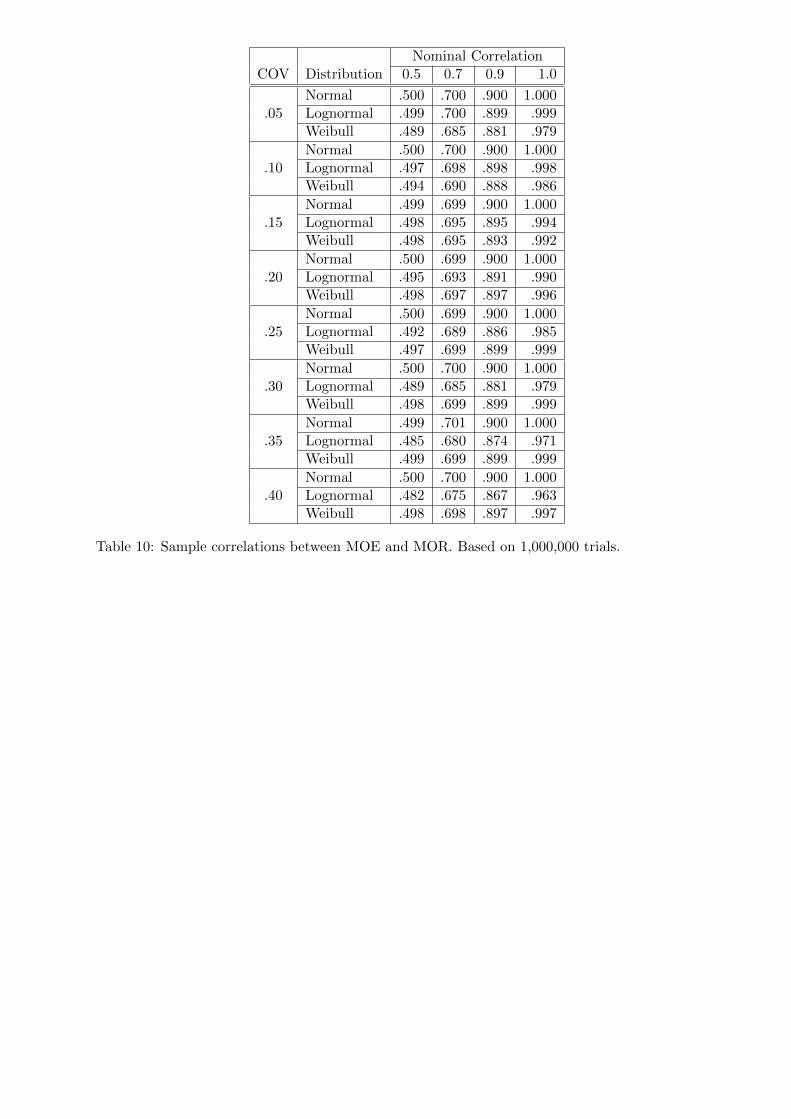
This ensures that the coefficient of variation of the MOR will be COV. However, the correlation be-tween the two elements of an MOE,MOR pair will not be exactly equal to ρ. The actual correlationis presented in Table 10.
8.3 Weibull strengths
The MOE of an MOE,MOR pair was generated as
MOE = 100 + 100× COV× ε1
where ε1 represents a generated N(0,1) random variable. The correlated MOR values was generatedvia three steps. First a N(0,1) correlated to the MOE was generated:
z = ρ× ε1 +√
1− ρ2 × ε2
where ε1 and ε2 are “independent” generated N(0,1)’s. Second, the N(0,1) random variable wastransformed into a Uniform(0,1) random variable:
u = Φ(z)
where Φ denotes the N(0,1) distribution function. Finally, the Uniform(0,1) random variable wastransformed into a Weibull random variable:
w = (− log(1− u))1/β/γ
where γ is the scale parameter and β is the shape parameter. β was determined by
COV =√
2βΓ(2/β)− Γ2(1/β)/Γ(1/β)
where Γ denotes the gamma function. This ensures that the coefficient of variation of the Weibullwill be COV. The γ value was then determined via
γ = log(2)1/β/100
which ensures that the median of the Weibull will be 100.The correlation between the two elements of an MOE,MOR pair will not be exactly equal to ρ.
The actual correlation is presented in Table 10.
10
truncated normal
COV
(load
sha
ring
1st)
/(si
ngle
mem
ber
1st)
0.1 0.2 0.3 0.4
0.0
0.2
0.4
0.6
0.8
1.0
1.2
rho = 1.0rho = 0.9rho = 0.7rho = 0.5
������ �� ���� ��� ���� �� ������������� � ���� �� ���� ���������� ����� ���� � ��� �� �������
����� ���� ��� ��� �� ���� ������ ����� �� ����� ����� �� � ���������� �� � �� ��� ������ ����
���!��� �������� �� ���"����# $ ���� ��� ��� $ ���� ���� �� � ���� ��� ��!��� �� ��� ����� ������� ������� ����������� �� ��� ��%������ ������&� ��� ������ ���� ����������� �� ��� '%������
������&� �� ��� ������� ���� ����������� �� ��� (%������ ������&� ��� ��� �)� � �� ���� ����
�������� �� ��$������
��

truncated normal
COV
(load
sha
ring
5th)
/(si
ngle
mem
ber
5th)
0.1 0.2 0.3 0.4
0.0
0.2
0.4
0.6
0.8
1.0
1.2
rho = 1.0rho = 0.9rho = 0.7rho = 0.5
������ *� ���� ��� ���� �� ������������� � ���� �� ���� ���������� ����� ���� � ��� �� �������
����� ���� ��� ��� �� ���� ������ ����� �� ����� ����� �� � ���������� �� � �� ��� ������ ����
���!��� �������� �� ���"����# $ ���� ��� ��� $ ���� ���� �� � ���� ��� ��!��� �� ��� ����� ������� ������� ����������� �� ��� ��%������ ������&� ��� ������ ���� ����������� �� ��� '%������
������&� �� ��� ������� ���� ����������� �� ��� (%������ ������&� ��� ��� �)� � �� ���� ����
�������� �� ��$������
�*

truncated normal
COV
(load
sha
ring
10th
)/(s
ingl
e m
embe
r 10
th)
0.1 0.2 0.3 0.4
0.0
0.2
0.4
0.6
0.8
1.0
1.2
rho = 1.0rho = 0.9rho = 0.7rho = 0.5
������ (� ���� ��� ���� �� ������������� � ���� �� ����� ���������� ����� ���� � ��� �� �������
����� ���� ��� ��� �� ���� ������ ����� �� ����� ����� �� � ���������� �� � �� ��� ������ ����
���!��� �������� �� ���"����# $ ���� ��� ��� $ ���� ���� �� � ���� ��� ��!��� �� ��� ����� ������� ������� ����������� �� ��� ��%������ ������&� ��� ������ ���� ����������� �� ��� '%������
������&� �� ��� ������� ���� ����������� �� ��� (%������ ������&� ��� ��� �)� � �� ���� ����
�������� �� ��$������
�(
truncated lognormal
COV
(load
sha
ring
1st)
/(si
ngle
mem
ber
1st)
0.1 0.2 0.3 0.4
0.7
0.8
0.9
1.0
1.1
1.2
rho = 1.0rho = 0.9rho = 0.7rho = 0.5
������ +� ���� ��� ������� �� ������������� � ���� �� ���� ���������� ����� ���� � ��� �� �������
����� ���� ��� ��� �� ���� ������ ����� �� ����� ����� �� � ���������� �� � �� ��� ������ ����
���!��� �� ��������# �� ���"����# $ ���� ��� ��� $ ���� ���� �� � ���� ��� ��!��� �� ��� ����� ������� ������� ����������� �� ��� ��%������ ������&� ��� ������ ���� ����������� �� ��� '%������
������&� �� ��� ������� ���� ����������� �� ��� (%������ ������&� ��� ��� �)� � �� ���� ����
�������� �� ��$������
�+
truncated lognormal
COV
(load
sha
ring
5th)
/(si
ngle
mem
ber
5th)
0.1 0.2 0.3 0.4
0.7
0.8
0.9
1.0
1.1
1.2
rho = 1.0rho = 0.9rho = 0.7rho = 0.5
������ ,� ���� ��� ������� �� ������������� � ���� �� ���� ���������� ����� ���� � ��� ��
������� ����� ���� ��� ��� �� ���� ������ ����� �� ����� ����� �� � ���������� �� � �� ��� ������ ����
���!��� �� ��������# �� ���"����# $ ���� ��� ��� $ ���� ���� �� � ���� ��� ��!��� �� ��� ����� ������� ������� ����������� �� ��� ��%������ ������&� ��� ������ ���� ����������� �� ��� '%������
������&� �� ��� ������� ���� ����������� �� ��� (%������ ������&� ��� ��� �)� � �� ���� ����
�������� �� ��$������
�,

truncated lognormal
COV
(load
sha
ring
10th
)/(s
ingl
e m
embe
r 10
th)
0.1 0.2 0.3 0.4
0.7
0.8
0.9
1.0
1.1
1.2
rho = 1.0rho = 0.9rho = 0.7rho = 0.5
������ -� ���� ��� ������� �� ������������� � ���� �� ����� ���������� ����� ���� � ��� ��
������� ����� ���� ��� ��� �� ���� ������ ����� �� ����� ����� �� � ���������� �� � �� ��� ������ ����
���!��� �� ��������# �� ���"����# $ ���� ��� ��� $ ���� ���� �� � ���� ��� ��!��� �� ��� ����� ������� ������� ����������� �� ��� ��%������ ������&� ��� ������ ���� ����������� �� ��� '%������
������&� �� ��� ������� ���� ����������� �� ��� (%������ ������&� ��� ��� �)� � �� ���� ����
�������� �� ��$������
�-

truncated Weibull
COV
(load
sha
ring
1st)
/(si
ngle
mem
ber
1st)
0.1 0.2 0.3 0.4
0.4
0.6
0.8
1.0
1.2
rho = 1.0rho = 0.9rho = 0.7rho = 0.5
������ '� ���� ��� .������� ������������� � ���� �� ���� ���������� ����� ���� � ��� �� �������
����� ���� ��� ��� �� ���� ������ ����� �� ����� ����� �� � ���������� �� � �� ��� $ ���� ���
��� $ ���� ���� �� � ���� ��� ��!��� �� ��� ����� ����� �� ������� ����������� �� ��� ��%������
������&� ��� ������ ���� ����������� �� ��� '%������ ������&� �� ��� ������� ���� �����������
�� ��� (%������ ������&� ��� ��� �)� � �� ���� ���� �������� �� ��$������
�'
truncated Weibull
COV
(load
sha
ring
5th)
/(si
ngle
mem
ber
5th)
0.1 0.2 0.3 0.4
0.4
0.6
0.8
1.0
1.2
rho = 1.0rho = 0.9rho = 0.7rho = 0.5
������ /� ���� ��� .������� ������������� � ���� �� ���� ���������� ����� ���� � ��� �� �������
����� ���� ��� ��� �� ���� ������ ����� �� ����� ����� �� � ���������� �� � �� ��� $ ���� ���
��� $ ���� ���� �� � ���� ��� ��!��� �� ��� ����� ����� �� ������� ����������� �� ��� ��%������
������&� ��� ������ ���� ����������� �� ��� '%������ ������&� �� ��� ������� ���� �����������
�� ��� (%������ ������&� ��� ��� �)� � �� ���� ���� �������� �� ��$������
�/

truncated Weibull
COV
(load
sha
ring
10th
)/(s
ingl
e m
embe
r 10
th)
0.1 0.2 0.3 0.4
0.4
0.6
0.8
1.0
1.2
rho = 1.0rho = 0.9rho = 0.7rho = 0.5
������ 0� ���� ��� .������� ������������� � ���� �� ����� ���������� ����� ���� � ��� �� �������
����� ���� ��� ��� �� ���� ������ ����� �� ����� ����� �� � ���������� �� � �� ��� $ ���� ��� ���
$ ���� ���� �� � ���� ��� ��!��� �� ��� ����� ����� �� ������� ����������� �� ��� ��%������ ������&�
��� ������ ���� ����������� �� ��� '%������ ������&� �� ��� ������� ���� ����������� �� ��� (%
������ ������&� ��� ��� �)� � �� ���� ���� �������� �� ��$������
�0
Number of ysngl = yassem = ymink = RADS = RADM =ρ members COV Single member Load sharing Weakest link yassem/ysngl yassem/ymink
0.05 90.5 89.0 88.9 0.982 1.0010.10 81.1 78.0 77.7 0.962 1.0040.15 71.6 67.0 66.6 0.935 1.0050.20 62.2 55.9 55.5 0.900 1.008
3 0.25 52.7 44.9 44.3 0.852 1.0140.30 43.3 33.9 33.2 0.784 1.0220.35 33.8 22.7 22.1 0.671 1.0280.40 24.4 10.4 10.9 0.427 0.9500.05 90.4 87.6 87.6 0.970 1.0010.10 80.7 75.3 75.1 0.934 1.0030.15 71.1 63.2 62.7 0.890 1.0090.20 61.4 51.1 50.2 0.832 1.017
0.500 7 0.25 51.8 38.3 37.8 0.741 1.0150.30 42.1 27.0 25.3 0.641 1.0650.35 32.5 13.7 12.9 0.423 1.0650.40 22.8 0.7 0.5 0.030 1.4860.05 90.4 86.7 86.7 0.959 1.0000.10 80.8 73.5 73.4 0.910 1.0020.15 71.2 60.7 60.0 0.852 1.0110.20 61.6 47.4 46.7 0.770 1.015
11 0.25 52.0 34.3 33.4 0.660 1.0280.30 42.4 21.4 20.1 0.504 1.0650.35 32.8 7.9 6.7 0.241 1.1750.40 23.2 — — — —
0.05 92.2 91.1 90.7 0.988 1.0050.10 84.4 82.1 81.4 0.972 1.0090.15 76.6 73.3 72.1 0.956 1.0170.20 68.9 64.1 62.7 0.931 1.022
3 0.25 61.1 55.4 53.4 0.907 1.0370.30 53.3 46.6 44.1 0.874 1.0550.35 45.5 36.8 34.8 0.810 1.0590.40 37.7 27.6 25.5 0.733 1.0840.05 92.2 90.1 89.8 0.977 1.0040.10 84.4 80.3 79.6 0.951 1.0090.15 76.6 70.3 69.4 0.917 1.0130.20 68.9 60.2 59.2 0.875 1.018
0.700 7 0.25 61.1 50.6 49.0 0.828 1.0330.30 53.3 40.4 38.8 0.758 1.0410.35 45.5 30.3 28.6 0.666 1.0610.40 37.7 19.0 18.4 0.504 1.0360.05 92.2 89.3 89.1 0.968 1.0020.10 84.5 78.6 78.2 0.930 1.0050.15 76.7 67.9 67.3 0.885 1.0080.20 69.0 57.1 56.4 0.828 1.012
11 0.25 61.2 46.6 45.5 0.762 1.0240.30 53.4 35.6 34.6 0.667 1.0290.35 45.7 24.3 23.7 0.531 1.0230.40 37.9 13.5 12.8 0.355 1.051
Table 1: First percentile strengths and ratios of first percentile strengths for a truncated normaldistribution. Based on 100,000 trials.

Number of ysngl = yassem = ymink = RADS = RADM =ρ members COV Single member Load sharing Weakest link yassem/ysngl yassem/ymink
0.05 95.3 94.9 94.3 0.995 1.0060.10 90.7 89.8 88.7 0.990 1.0130.15 86.0 84.5 83.0 0.982 1.0180.20 81.3 79.4 77.3 0.977 1.028
3 0.25 76.7 74.0 71.6 0.965 1.0330.30 72.0 68.9 66.0 0.957 1.0450.35 67.3 63.7 60.3 0.947 1.0570.40 62.7 57.9 54.6 0.924 1.0610.05 95.3 94.5 93.7 0.992 1.0090.10 90.6 89.0 87.4 0.983 1.0190.15 85.9 83.3 81.0 0.970 1.0280.20 81.2 77.9 74.7 0.960 1.043
0.900 7 0.25 76.5 72.0 68.4 0.941 1.0520.30 71.8 66.2 62.1 0.922 1.0660.35 67.1 60.4 55.7 0.901 1.0840.40 62.4 54.2 49.4 0.869 1.0970.05 95.3 94.4 93.4 0.990 1.0110.10 90.7 88.7 86.7 0.978 1.0230.15 86.0 83.0 80.1 0.965 1.0370.20 81.4 77.4 73.4 0.951 1.054
11 0.25 76.7 71.6 66.8 0.933 1.0720.30 72.1 65.5 60.1 0.910 1.0900.35 67.4 59.2 53.5 0.879 1.1070.40 62.8 52.7 46.9 0.840 1.126
0.05 98.8 99.4 98.7 1.006 1.0070.10 97.6 98.8 97.5 1.013 1.0130.15 96.3 98.1 96.2 1.019 1.0200.20 95.1 97.5 95.0 1.025 1.027
3 0.25 93.9 97.0 93.7 1.033 1.0350.30 92.7 96.4 92.5 1.040 1.0420.35 91.5 95.6 91.2 1.045 1.0480.40 90.2 95.1 90.0 1.054 1.0580.05 98.8 100.0 98.8 1.012 1.0130.10 97.6 100.1 97.5 1.025 1.0260.15 96.4 100.1 96.3 1.039 1.0400.20 95.2 100.2 95.0 1.052 1.054
1.000 7 0.25 94.0 100.2 93.8 1.066 1.0680.30 92.8 100.2 92.6 1.080 1.0830.35 91.6 100.3 91.3 1.094 1.0980.40 90.4 100.2 90.1 1.109 1.1130.05 98.8 100.3 98.7 1.015 1.0150.10 97.6 100.5 97.5 1.030 1.0310.15 96.3 100.8 96.2 1.046 1.0480.20 95.1 101.0 94.9 1.062 1.064
11 0.25 93.9 101.2 93.7 1.078 1.0810.30 92.7 101.5 92.4 1.095 1.0980.35 91.4 101.9 91.1 1.114 1.1180.40 90.2 102.1 89.9 1.131 1.136
Table 1 continued: First percentile strengths and ratios of first percentile strengths for a truncatednormal distribution. Based on 100,000 trials.
Number of ysngl = yassem = ymink = RADS = RADM =ρ members COV Single member Load sharing Weakest link yassem/ysngl yassem/ymink
0.05 93.5 91.4 91.4 0.978 1.0010.10 86.9 82.8 82.7 0.953 1.0010.15 80.4 74.4 74.1 0.925 1.0040.20 73.8 65.9 65.4 0.893 1.007
3 0.25 67.3 57.4 56.8 0.853 1.0100.30 60.7 48.7 48.1 0.803 1.0130.35 54.2 40.0 39.5 0.739 1.0140.40 47.6 31.5 30.8 0.662 1.0220.05 93.4 90.0 89.9 0.964 1.0000.10 86.7 80.0 79.9 0.922 1.0020.15 80.1 70.2 69.8 0.876 1.0050.20 73.5 60.4 59.8 0.822 1.011
0.500 7 0.25 66.9 50.5 49.7 0.756 1.0160.30 60.2 40.6 39.7 0.675 1.0240.35 53.6 30.5 29.6 0.568 1.0290.40 47.0 20.8 19.6 0.442 1.0610.05 93.5 89.5 89.4 0.958 1.0010.10 86.9 79.1 78.9 0.910 1.0020.15 80.4 68.8 68.3 0.856 1.0080.20 73.8 58.7 57.8 0.795 1.016
11 0.25 67.3 48.2 47.2 0.717 1.0220.30 60.7 37.8 36.6 0.622 1.0310.35 54.2 27.2 26.1 0.501 1.0420.40 47.6 16.5 15.5 0.347 1.065
0.05 94.8 93.2 93.0 0.983 1.0020.10 89.6 86.5 86.1 0.965 1.0040.15 84.4 79.8 79.1 0.945 1.0080.20 79.2 72.9 72.2 0.920 1.010
3 0.25 74.0 66.1 65.2 0.893 1.0140.30 68.8 59.5 58.3 0.865 1.0220.35 63.7 52.7 51.3 0.827 1.0260.40 58.5 45.8 44.4 0.783 1.0320.05 94.8 92.1 91.8 0.972 1.0040.10 89.6 84.3 83.5 0.941 1.0100.15 84.4 76.3 75.3 0.905 1.0140.20 79.1 68.3 67.0 0.863 1.019
0.700 7 0.25 73.9 60.7 58.8 0.821 1.0320.30 68.7 52.3 50.6 0.762 1.0350.35 63.5 44.3 42.3 0.697 1.0460.40 58.3 35.9 34.1 0.616 1.0540.05 94.7 91.5 91.2 0.966 1.0040.10 89.5 83.2 82.3 0.930 1.0100.15 84.2 74.6 73.5 0.886 1.0160.20 78.9 66.2 64.6 0.838 1.024
11 0.25 73.7 57.6 55.8 0.782 1.0320.30 68.4 48.9 46.9 0.715 1.0420.35 63.1 40.1 38.1 0.635 1.0530.40 57.9 31.1 29.3 0.537 1.062
Table 2: Fifth percentile strengths and ratios of fifth percentile strengths for a truncated normaldistribution. Based on 100,000 trials.

Number of ysngl = yassem = ymink = RADS = RADM =ρ members COV Single member Load sharing Weakest link yassem/ysngl yassem/ymink
0.05 96.9 96.3 95.8 0.993 1.0050.10 93.9 92.5 91.6 0.985 1.0100.15 90.8 88.9 87.4 0.978 1.0170.20 87.8 85.0 83.2 0.969 1.023
3 0.25 84.7 81.4 79.0 0.960 1.0300.30 81.7 77.6 74.8 0.950 1.0380.35 78.6 73.8 70.5 0.938 1.0460.40 75.6 70.0 66.3 0.926 1.0550.05 97.0 95.7 95.0 0.987 1.0080.10 93.9 91.5 89.9 0.974 1.0170.15 90.9 87.2 84.9 0.960 1.0270.20 87.8 82.9 79.9 0.944 1.037
0.900 7 0.25 84.8 78.5 74.9 0.925 1.0480.30 81.8 74.0 69.8 0.905 1.0590.35 78.7 69.5 64.8 0.883 1.0730.40 75.7 64.8 59.8 0.857 1.0850.05 96.9 95.5 94.6 0.985 1.0090.10 93.9 90.9 89.2 0.968 1.0200.15 90.8 86.3 83.8 0.950 1.0300.20 87.8 81.7 78.4 0.931 1.043
11 0.25 84.7 77.1 73.0 0.911 1.0570.30 81.6 72.3 67.5 0.886 1.0710.35 78.6 67.5 62.1 0.859 1.0870.40 75.5 62.7 56.7 0.830 1.105
0.05 99.0 99.8 98.8 1.009 1.0100.10 98.0 99.7 97.7 1.018 1.0210.15 97.0 99.5 96.5 1.026 1.0320.20 96.0 99.4 95.3 1.036 1.043
3 0.25 95.0 99.3 94.1 1.046 1.0550.30 94.0 99.1 93.0 1.055 1.0660.35 93.0 99.0 91.8 1.065 1.0790.40 92.0 98.9 90.6 1.076 1.0920.05 99.0 100.4 98.8 1.014 1.0160.10 98.0 100.7 97.5 1.028 1.0330.15 96.9 101.1 96.3 1.043 1.0500.20 95.9 101.5 95.1 1.058 1.068
1.000 7 0.25 94.9 101.9 93.8 1.073 1.0860.30 93.9 102.3 92.6 1.089 1.1040.35 92.9 102.6 91.3 1.105 1.1230.40 91.8 103.0 90.1 1.121 1.1430.05 99.0 100.6 98.8 1.016 1.0180.10 98.0 101.1 97.5 1.032 1.0370.15 97.0 101.7 96.3 1.049 1.0570.20 96.0 102.2 95.0 1.065 1.076
11 0.25 95.0 102.9 93.8 1.083 1.0970.30 94.0 103.4 92.5 1.101 1.1180.35 92.9 103.9 91.3 1.118 1.1390.40 91.9 104.5 90.0 1.137 1.161
Table 2 continued: Fifth percentile strengths and ratios of fifth percentile strengths for a truncatednormal distribution. Based on 100,000 trials.
Number of ysngl = yassem = ymink = RADS = RADM =ρ members COV Single member Load sharing Weakest link yassem/ysngl yassem/ymink
0.05 95.0 92.6 92.7 0.975 1.0000.10 90.1 85.3 85.3 0.947 0.9990.15 85.1 78.2 78.0 0.919 1.0030.20 80.2 70.8 70.7 0.883 1.002
3 0.25 75.2 63.6 63.3 0.845 1.0040.30 70.3 56.7 56.0 0.808 1.0130.35 65.3 49.1 48.7 0.752 1.0090.40 60.4 41.9 41.3 0.694 1.0130.05 95.1 91.2 91.1 0.958 1.0010.10 90.3 82.3 82.2 0.912 1.0020.15 85.4 73.7 73.3 0.863 1.0050.20 80.5 65.0 64.4 0.808 1.010
0.500 7 0.25 75.6 56.2 55.5 0.743 1.0130.30 70.8 47.3 46.6 0.669 1.0160.35 65.9 38.5 37.7 0.585 1.0220.40 61.0 29.6 28.8 0.486 1.0290.05 95.1 90.4 90.3 0.951 1.0010.10 90.1 80.8 80.7 0.897 1.0020.15 85.2 71.4 71.0 0.838 1.0050.20 80.3 61.9 61.3 0.772 1.009
11 0.25 75.3 52.5 51.7 0.697 1.0150.30 70.4 42.8 42.0 0.608 1.0190.35 65.5 33.3 32.4 0.508 1.0280.40 60.5 23.4 22.7 0.387 1.032
0.05 96.1 94.3 94.0 0.981 1.0020.10 92.1 88.6 88.1 0.962 1.0060.15 88.2 82.8 82.1 0.939 1.0090.20 84.3 77.2 76.2 0.915 1.013
3 0.25 80.4 71.2 70.2 0.886 1.0140.30 76.4 65.7 64.3 0.859 1.0220.35 72.5 59.8 58.3 0.825 1.0260.40 68.6 53.9 52.4 0.786 1.0290.05 96.1 93.1 92.9 0.969 1.0020.10 92.2 86.3 85.8 0.936 1.0050.15 88.3 79.5 78.7 0.900 1.0090.20 84.4 72.6 71.6 0.860 1.013
0.700 7 0.25 80.5 65.8 64.5 0.818 1.0200.30 76.6 59.0 57.5 0.770 1.0260.35 72.7 52.2 50.4 0.718 1.0360.40 68.8 45.4 43.3 0.659 1.0490.05 96.2 92.6 92.4 0.962 1.0020.10 92.4 85.1 84.7 0.922 1.0050.15 88.5 77.8 77.1 0.879 1.0100.20 84.7 70.4 69.4 0.831 1.014
11 0.25 80.9 63.1 61.8 0.780 1.0210.30 77.1 55.8 54.2 0.725 1.0310.35 73.2 48.2 46.5 0.658 1.0360.40 69.4 40.7 38.9 0.586 1.046
Table 3: Tenth percentile strengths and ratios of tenth percentile strengths for a truncated normaldistribution. Based on 100,000 trials.

Number of ysngl = yassem = ymink = RADS = RADM =ρ members COV Single member Load sharing Weakest link yassem/ysngl yassem/ymink
0.05 97.9 97.0 96.5 0.991 1.0050.10 95.7 94.0 93.0 0.982 1.0110.15 93.6 91.0 89.6 0.972 1.0160.20 91.4 88.0 86.1 0.962 1.022
3 0.25 89.3 85.0 82.6 0.951 1.0290.30 87.2 81.9 79.1 0.940 1.0360.35 85.0 78.9 75.6 0.928 1.0440.40 82.9 75.9 72.2 0.915 1.0520.05 97.8 96.3 95.7 0.984 1.0070.10 95.7 92.6 91.3 0.968 1.0140.15 93.5 88.9 87.0 0.950 1.0220.20 91.4 85.2 82.7 0.932 1.031
0.900 7 0.25 89.2 81.6 78.3 0.914 1.0420.30 87.1 77.8 74.0 0.893 1.0520.35 84.9 73.9 69.6 0.870 1.0620.40 82.8 69.9 65.3 0.844 1.0710.05 97.9 96.0 95.2 0.981 1.0080.10 95.8 92.0 90.4 0.961 1.0170.15 93.7 88.0 85.7 0.939 1.0270.20 91.6 84.0 80.9 0.917 1.039
11 0.25 89.5 79.8 76.1 0.892 1.0490.30 87.3 75.7 71.3 0.866 1.0610.35 85.2 71.5 66.5 0.838 1.0740.40 83.1 67.2 61.7 0.809 1.089
0.05 99.2 100.2 98.9 1.009 1.0130.10 98.5 100.3 97.8 1.018 1.0260.15 97.7 100.5 96.7 1.028 1.0390.20 97.0 100.6 95.6 1.037 1.052
3 0.25 96.2 100.7 94.5 1.046 1.0660.30 95.5 100.9 93.4 1.057 1.0810.35 94.7 101.1 92.3 1.067 1.0950.40 94.0 101.2 91.2 1.076 1.1090.05 99.3 100.6 98.8 1.013 1.0180.10 98.5 101.2 97.7 1.027 1.0360.15 97.8 101.8 96.5 1.041 1.0550.20 97.0 102.4 95.3 1.055 1.074
1.000 7 0.25 96.3 103.0 94.1 1.070 1.0940.30 95.5 103.5 93.0 1.084 1.1130.35 94.8 104.1 91.8 1.099 1.1340.40 94.0 104.7 90.6 1.114 1.1560.05 99.3 100.7 98.8 1.015 1.0190.10 98.6 101.5 97.7 1.030 1.0390.15 97.8 102.2 96.5 1.045 1.0600.20 97.1 103.0 95.3 1.060 1.080
11 0.25 96.4 103.7 94.1 1.076 1.1020.30 95.7 104.5 93.0 1.092 1.1240.35 94.9 105.2 91.8 1.108 1.1460.40 94.2 105.9 90.6 1.124 1.169
Table 3 continued: Tenth percentile strengths and ratios of tenth percentile strengths for a truncatednormal distribution. Based on 100,000 trials.

Number of ysngl = yassem = ymink = RADS = RADM =ρ members COV Single member Load sharing Weakest link yassem/ysngl yassem/ymink
0.05 90.9 89.4 89.4 0.984 1.0000.10 82.6 79.9 80.0 0.967 0.9990.15 75.1 71.6 71.6 0.953 0.9990.20 68.4 64.1 64.2 0.937 0.998
3 0.25 62.4 57.9 57.7 0.928 1.0040.30 57.0 52.2 51.9 0.915 1.0050.35 52.1 46.8 46.8 0.898 1.0010.40 47.8 42.4 42.3 0.886 1.0020.05 90.8 88.4 88.4 0.973 1.0000.10 82.6 78.3 78.2 0.948 1.0010.15 75.1 69.3 69.3 0.923 1.0010.20 68.4 61.6 61.4 0.900 1.002
0.500 7 0.25 62.3 54.7 54.6 0.878 1.0020.30 56.9 48.6 48.6 0.855 1.0010.35 52.1 43.5 43.3 0.836 1.0040.40 47.7 39.3 38.8 0.825 1.0150.05 90.9 87.8 87.9 0.966 0.9990.10 82.7 77.1 77.4 0.933 0.9970.15 75.2 67.9 68.1 0.903 0.9970.20 68.5 60.0 60.1 0.875 0.999
11 0.25 62.5 52.8 53.1 0.846 0.9960.30 57.1 46.8 47.0 0.819 0.9960.35 52.3 41.3 41.7 0.791 0.9920.40 47.9 37.1 37.1 0.774 1.001
0.05 92.6 91.5 91.2 0.988 1.0030.10 85.8 83.7 83.3 0.976 1.0050.15 79.5 76.9 76.0 0.967 1.0110.20 73.7 70.5 69.5 0.956 1.014
3 0.25 68.4 64.8 63.6 0.947 1.0190.30 63.6 59.6 58.3 0.937 1.0220.35 59.2 55.0 53.6 0.928 1.0260.40 55.2 50.2 49.3 0.910 1.0200.05 92.6 90.8 90.3 0.980 1.0050.10 85.8 82.4 81.7 0.960 1.0090.15 79.6 74.9 73.9 0.942 1.0150.20 73.8 68.1 66.9 0.922 1.018
0.700 7 0.25 68.6 62.4 60.6 0.909 1.0280.30 63.8 56.5 55.1 0.885 1.0250.35 59.4 52.0 50.1 0.875 1.0370.40 55.4 47.6 45.7 0.859 1.0410.05 92.5 90.1 89.7 0.974 1.0050.10 85.6 81.2 80.4 0.948 1.0090.15 79.2 73.2 72.2 0.924 1.0140.20 73.4 66.2 64.9 0.902 1.020
11 0.25 68.1 60.1 58.4 0.883 1.0290.30 63.3 54.3 52.7 0.859 1.0310.35 58.8 49.5 47.6 0.842 1.0400.40 54.8 44.9 43.1 0.820 1.042
Table 4: First percentile strengths and ratios of first percentile strengths for a truncated lognormaldistribution. Based on 100,000 trials.

Number of ysngl = yassem = ymink = RADS = RADM =ρ members COV Single member Load sharing Weakest link yassem/ysngl yassem/ymink
0.05 95.3 95.0 94.5 0.996 1.0060.10 90.9 90.3 89.2 0.993 1.0120.15 86.7 85.9 84.3 0.990 1.0180.20 82.8 81.8 79.8 0.989 1.026
3 0.25 79.0 78.1 75.5 0.988 1.0340.30 75.5 74.2 71.5 0.982 1.0370.35 72.3 70.8 67.8 0.980 1.0440.40 69.2 67.6 64.4 0.976 1.0490.05 95.4 94.7 93.8 0.993 1.0090.10 91.0 89.6 88.0 0.985 1.0180.15 86.8 85.1 82.7 0.980 1.0290.20 82.8 80.6 77.7 0.974 1.038
0.900 7 0.25 79.1 76.6 73.0 0.968 1.0490.30 75.6 72.7 68.7 0.962 1.0580.35 72.4 69.2 64.8 0.956 1.0680.40 69.3 65.9 61.2 0.950 1.0770.05 95.5 94.6 93.8 0.990 1.0080.10 91.2 89.5 88.0 0.981 1.0170.15 87.2 84.7 82.5 0.972 1.0270.20 83.3 80.3 77.5 0.964 1.036
11 0.25 79.7 76.1 72.8 0.955 1.0450.30 76.3 72.1 68.5 0.945 1.0520.35 73.1 68.8 64.6 0.941 1.0650.40 70.1 65.4 60.9 0.933 1.074
0.05 98.8 99.4 98.8 1.006 1.0070.10 97.6 98.8 97.5 1.012 1.0130.15 96.4 98.2 96.3 1.018 1.0190.20 95.3 97.6 95.2 1.025 1.026
3 0.25 94.2 97.0 94.0 1.030 1.0310.30 93.1 96.4 92.9 1.035 1.0370.35 92.1 95.9 91.8 1.042 1.0440.40 91.1 95.2 90.8 1.046 1.0490.05 98.8 100.0 98.7 1.012 1.0130.10 97.6 100.0 97.5 1.025 1.0260.15 96.4 100.0 96.3 1.038 1.0390.20 95.2 100.0 95.1 1.050 1.052
1.000 7 0.25 94.1 100.0 93.9 1.063 1.0650.30 93.0 100.0 92.8 1.075 1.0780.35 92.0 100.0 91.7 1.087 1.0910.40 91.0 99.9 90.7 1.098 1.1020.05 98.8 100.2 98.7 1.015 1.0150.10 97.6 100.5 97.5 1.030 1.0310.15 96.4 100.7 96.2 1.045 1.0470.20 95.2 101.0 95.0 1.061 1.063
11 0.25 94.1 101.3 93.9 1.076 1.0790.30 93.0 101.5 92.7 1.091 1.0940.35 92.0 101.7 91.6 1.106 1.1090.40 90.9 101.9 90.6 1.121 1.125
Table 4 continued: First percentile strengths and ratios of first percentile strengths for a truncatedlognormal distribution. Based on 100,000 trials.
Number of ysngl = yassem = ymink = RADS = RADM =ρ members COV Single member Load sharing Weakest link yassem/ysngl yassem/ymink
0.05 93.7 91.7 91.7 0.979 1.0000.10 87.8 84.1 84.1 0.958 1.0000.15 82.3 77.2 77.2 0.939 1.0000.20 77.2 70.9 70.9 0.919 1.000
3 0.25 72.5 65.3 65.2 0.901 1.0010.30 68.1 60.4 60.1 0.886 1.0040.35 64.1 55.6 55.5 0.867 1.0020.40 60.4 51.3 51.3 0.849 1.0010.05 93.7 90.5 90.4 0.967 1.0020.10 87.7 82.0 81.7 0.935 1.0040.15 82.2 74.3 73.9 0.904 1.0060.20 77.1 67.5 66.9 0.875 1.008
0.500 7 0.25 72.4 61.4 60.7 0.848 1.0110.30 68.0 55.9 55.2 0.821 1.0130.35 64.0 51.0 50.2 0.797 1.0160.40 60.3 46.8 45.8 0.776 1.0220.05 93.7 89.7 89.7 0.958 1.0010.10 87.8 80.5 80.4 0.917 1.0010.15 82.3 72.4 72.2 0.879 1.0020.20 77.2 65.1 64.9 0.843 1.003
11 0.25 72.5 58.8 58.4 0.810 1.0060.30 68.2 53.1 52.7 0.779 1.0080.35 64.2 48.0 47.6 0.748 1.0090.40 60.5 43.6 43.1 0.720 1.010
0.05 95.0 93.5 93.2 0.984 1.0020.10 90.3 87.4 87.0 0.968 1.0050.15 85.8 81.8 81.2 0.952 1.0080.20 81.7 76.6 75.8 0.938 1.011
3 0.25 77.7 71.8 70.8 0.924 1.0140.30 74.0 67.4 66.3 0.910 1.0170.35 70.6 63.5 62.1 0.899 1.0220.40 67.4 59.7 58.3 0.886 1.0240.05 94.9 92.5 92.2 0.974 1.0030.10 90.1 85.6 85.1 0.950 1.0060.15 85.6 79.3 78.5 0.927 1.0100.20 81.3 73.4 72.6 0.903 1.012
0.700 7 0.25 77.3 68.3 67.1 0.884 1.0180.30 73.6 63.4 62.2 0.862 1.0200.35 70.1 59.1 57.7 0.842 1.0240.40 66.9 55.3 53.6 0.826 1.0310.05 94.8 91.8 91.6 0.968 1.0030.10 90.0 84.3 83.9 0.937 1.0060.15 85.4 77.6 76.9 0.909 1.0100.20 81.1 71.4 70.5 0.880 1.012
11 0.25 77.1 65.8 64.8 0.854 1.0160.30 73.3 60.7 59.6 0.829 1.0190.35 69.8 56.2 54.9 0.806 1.0240.40 66.5 52.1 50.7 0.783 1.027
Table 5: Fifth percentile strengths and ratios of fifth percentile strengths for a truncated lognormaldistribution. Based on 100,000 trials.

Number of ysngl = yassem = ymink = RADS = RADM =ρ members COV Single member Load sharing Weakest link yassem/ysngl yassem/ymink
0.05 97.0 96.3 95.9 0.993 1.0050.10 94.1 92.9 92.0 0.986 1.0100.15 91.3 89.5 88.2 0.980 1.0150.20 88.7 86.4 84.7 0.974 1.020
3 0.25 86.1 83.4 81.3 0.968 1.0260.30 83.7 80.5 78.1 0.961 1.0300.35 81.4 77.8 75.1 0.957 1.0360.40 79.2 75.3 72.3 0.951 1.0410.05 97.0 95.8 95.1 0.987 1.0070.10 94.1 91.9 90.5 0.976 1.0150.15 91.4 88.1 86.1 0.964 1.0230.20 88.7 84.5 82.0 0.953 1.031
0.900 7 0.25 86.2 81.2 78.1 0.942 1.0400.30 83.7 77.9 74.5 0.930 1.0460.35 81.4 75.0 71.1 0.921 1.0560.40 79.2 72.2 67.9 0.911 1.0630.05 97.0 95.5 94.7 0.984 1.0080.10 94.1 91.1 89.7 0.969 1.0170.15 91.3 87.1 84.9 0.954 1.0250.20 88.6 83.3 80.5 0.940 1.034
11 0.25 86.0 79.6 76.4 0.925 1.0420.30 83.6 76.2 72.5 0.912 1.0510.35 81.2 73.1 68.9 0.899 1.0600.40 79.0 70.2 65.6 0.889 1.070
0.05 99.0 99.9 98.8 1.009 1.0110.10 98.0 99.7 97.7 1.018 1.0210.15 97.0 99.6 96.5 1.027 1.0320.20 96.1 99.5 95.4 1.036 1.043
3 0.25 95.2 99.4 94.3 1.044 1.0530.30 94.3 99.2 93.3 1.053 1.0640.35 93.4 99.1 92.3 1.061 1.0740.40 92.5 98.9 91.3 1.069 1.0840.05 99.0 100.4 98.8 1.014 1.0160.10 98.0 100.7 97.6 1.028 1.0320.15 97.0 101.1 96.4 1.042 1.0490.20 96.0 101.4 95.2 1.056 1.065
1.000 7 0.25 95.1 101.8 94.1 1.071 1.0820.30 94.2 102.2 93.0 1.085 1.0990.35 93.3 102.5 91.9 1.099 1.1150.40 92.4 102.9 90.9 1.113 1.1320.05 99.0 100.6 98.8 1.016 1.0180.10 98.0 101.1 97.5 1.032 1.0370.15 97.0 101.7 96.3 1.048 1.0550.20 96.0 102.2 95.1 1.065 1.074
11 0.25 95.0 102.8 94.0 1.081 1.0930.30 94.1 103.3 92.9 1.098 1.1120.35 93.2 103.8 91.8 1.114 1.1310.40 92.4 104.4 90.8 1.130 1.150
Table 5 continued: Fifth percentile strengths and ratios of fifth percentile strengths for a truncatedlognormal distribution. Based on 100,000 trials.
Number of ysngl = yassem = ymink = RADS = RADM =ρ members COV Single member Load sharing Weakest link yassem/ysngl yassem/ymink
0.05 95.2 93.0 92.9 0.977 1.0010.10 90.7 86.5 86.4 0.954 1.0010.15 86.4 80.5 80.4 0.933 1.0020.20 82.3 75.0 74.8 0.911 1.003
3 0.25 78.5 70.0 69.7 0.892 1.0040.30 74.9 65.4 65.1 0.872 1.0050.35 71.6 61.2 60.8 0.854 1.0060.40 68.5 57.3 56.9 0.837 1.0070.05 95.2 91.6 91.5 0.963 1.0010.10 90.6 84.0 83.7 0.927 1.0040.15 86.3 77.0 76.7 0.892 1.0040.20 82.2 70.7 70.3 0.860 1.006
0.500 7 0.25 78.4 65.2 64.5 0.831 1.0100.30 74.8 60.0 59.3 0.802 1.0120.35 71.5 55.3 54.6 0.774 1.0130.40 68.4 51.1 50.4 0.748 1.0150.05 95.1 90.8 90.7 0.955 1.0000.10 90.5 82.5 82.4 0.912 1.0020.15 86.1 75.0 74.8 0.870 1.0020.20 82.0 68.4 68.1 0.834 1.005
11 0.25 78.1 62.3 62.0 0.798 1.0050.30 74.5 56.9 56.5 0.764 1.0060.35 71.1 52.1 51.7 0.733 1.0100.40 67.9 47.9 47.3 0.705 1.012
0.05 96.3 94.5 94.4 0.982 1.0010.10 92.7 89.4 89.1 0.965 1.0030.15 89.2 84.5 84.2 0.947 1.0040.20 85.9 80.0 79.6 0.930 1.005
3 0.25 82.8 75.9 75.3 0.916 1.0080.30 79.9 72.1 71.3 0.902 1.0120.35 77.1 68.4 67.5 0.887 1.0130.40 74.5 65.1 64.1 0.873 1.0150.05 96.2 93.3 93.0 0.970 1.0030.10 92.5 87.1 86.6 0.941 1.0060.15 89.1 81.3 80.6 0.913 1.0090.20 85.7 76.0 75.1 0.887 1.012
0.700 7 0.25 82.6 71.2 70.1 0.862 1.0170.30 79.6 66.8 65.4 0.839 1.0210.35 76.8 62.7 61.2 0.816 1.0250.40 74.1 58.9 57.3 0.794 1.0280.05 96.2 92.8 92.4 0.965 1.0040.10 92.6 86.2 85.5 0.931 1.0080.15 89.1 80.1 79.1 0.898 1.0120.20 85.8 74.5 73.2 0.868 1.017
11 0.25 82.7 69.4 67.9 0.839 1.0220.30 79.7 64.6 63.0 0.811 1.0260.35 76.9 60.4 58.6 0.785 1.0300.40 74.3 56.4 54.5 0.759 1.034
Table 6: Tenth percentile strengths and ratios of tenth percentile strengths for a truncated lognor-mal distribution. Based on 100,000 trials.
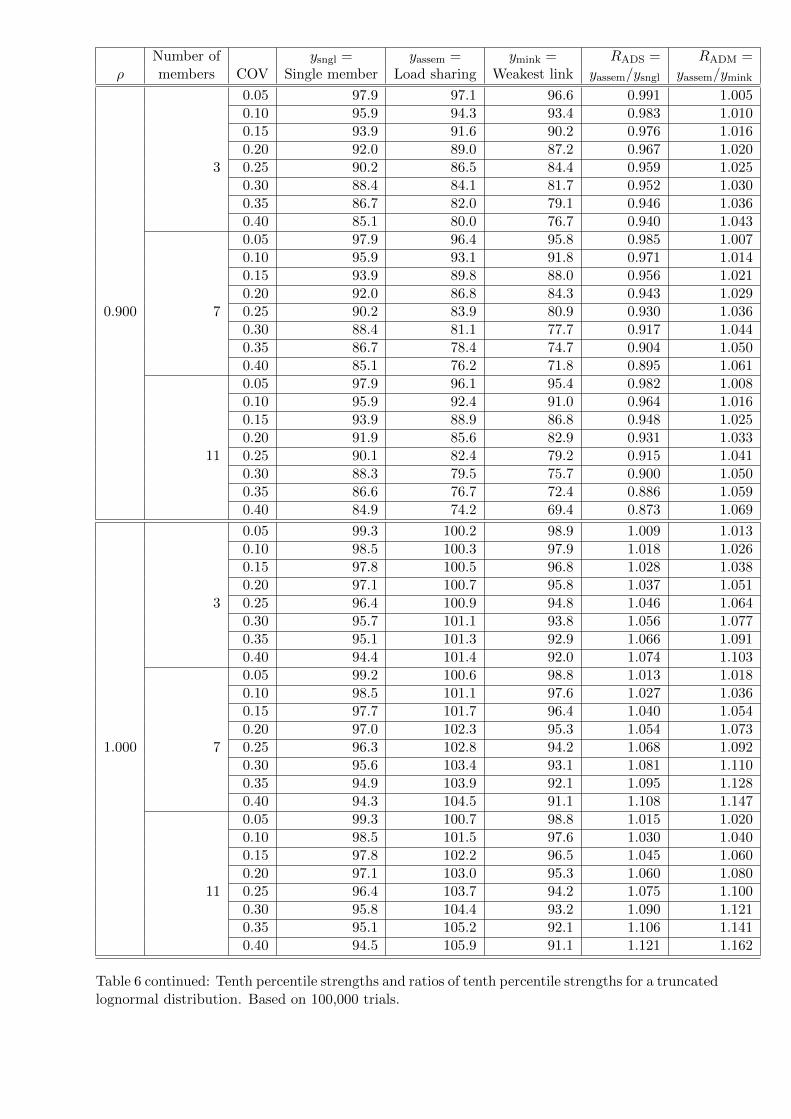
Number of ysngl = yassem = ymink = RADS = RADM =ρ members COV Single member Load sharing Weakest link yassem/ysngl yassem/ymink
0.05 97.9 97.1 96.6 0.991 1.0050.10 95.9 94.3 93.4 0.983 1.0100.15 93.9 91.6 90.2 0.976 1.0160.20 92.0 89.0 87.2 0.967 1.020
3 0.25 90.2 86.5 84.4 0.959 1.0250.30 88.4 84.1 81.7 0.952 1.0300.35 86.7 82.0 79.1 0.946 1.0360.40 85.1 80.0 76.7 0.940 1.0430.05 97.9 96.4 95.8 0.985 1.0070.10 95.9 93.1 91.8 0.971 1.0140.15 93.9 89.8 88.0 0.956 1.0210.20 92.0 86.8 84.3 0.943 1.029
0.900 7 0.25 90.2 83.9 80.9 0.930 1.0360.30 88.4 81.1 77.7 0.917 1.0440.35 86.7 78.4 74.7 0.904 1.0500.40 85.1 76.2 71.8 0.895 1.0610.05 97.9 96.1 95.4 0.982 1.0080.10 95.9 92.4 91.0 0.964 1.0160.15 93.9 88.9 86.8 0.948 1.0250.20 91.9 85.6 82.9 0.931 1.033
11 0.25 90.1 82.4 79.2 0.915 1.0410.30 88.3 79.5 75.7 0.900 1.0500.35 86.6 76.7 72.4 0.886 1.0590.40 84.9 74.2 69.4 0.873 1.069
0.05 99.3 100.2 98.9 1.009 1.0130.10 98.5 100.3 97.9 1.018 1.0260.15 97.8 100.5 96.8 1.028 1.0380.20 97.1 100.7 95.8 1.037 1.051
3 0.25 96.4 100.9 94.8 1.046 1.0640.30 95.7 101.1 93.8 1.056 1.0770.35 95.1 101.3 92.9 1.066 1.0910.40 94.4 101.4 92.0 1.074 1.1030.05 99.2 100.6 98.8 1.013 1.0180.10 98.5 101.1 97.6 1.027 1.0360.15 97.7 101.7 96.4 1.040 1.0540.20 97.0 102.3 95.3 1.054 1.073
1.000 7 0.25 96.3 102.8 94.2 1.068 1.0920.30 95.6 103.4 93.1 1.081 1.1100.35 94.9 103.9 92.1 1.095 1.1280.40 94.3 104.5 91.1 1.108 1.1470.05 99.3 100.7 98.8 1.015 1.0200.10 98.5 101.5 97.6 1.030 1.0400.15 97.8 102.2 96.5 1.045 1.0600.20 97.1 103.0 95.3 1.060 1.080
11 0.25 96.4 103.7 94.2 1.075 1.1000.30 95.8 104.4 93.2 1.090 1.1210.35 95.1 105.2 92.1 1.106 1.1410.40 94.5 105.9 91.1 1.121 1.162
Table 6 continued: Tenth percentile strengths and ratios of tenth percentile strengths for a truncatedlognormal distribution. Based on 100,000 trials.

Number of ysngl = yassem = ymink = RADS = RADM =ρ members COV Single member Load sharing Weakest link yassem/ysngl yassem/ymink
0.05 88.3 85.6 85.5 0.970 1.0020.10 77.4 72.8 72.4 0.941 1.0050.15 67.4 61.7 60.9 0.915 1.0130.20 58.4 51.4 50.9 0.880 1.011
3 0.25 50.4 43.3 42.2 0.860 1.0270.30 43.2 35.7 34.8 0.826 1.0260.35 37.0 29.1 28.6 0.788 1.0200.40 31.5 24.2 23.4 0.767 1.0340.05 88.0 83.4 83.1 0.948 1.0050.10 76.9 68.9 68.3 0.896 1.0090.15 66.8 56.7 55.7 0.849 1.0190.20 57.7 46.1 45.0 0.800 1.026
0.500 7 0.25 49.6 37.2 36.1 0.750 1.0310.30 42.4 29.8 28.7 0.704 1.0380.35 36.1 23.7 22.7 0.657 1.0430.40 30.6 18.9 17.9 0.617 1.0550.05 88.0 82.4 81.9 0.936 1.0060.10 76.9 67.1 66.3 0.873 1.0110.15 66.8 54.3 53.2 0.814 1.0220.20 57.6 43.4 42.3 0.753 1.026
11 0.25 49.5 34.4 33.3 0.694 1.0310.30 42.3 27.1 26.1 0.640 1.0390.35 36.0 21.4 20.3 0.595 1.0560.40 30.6 16.7 15.7 0.545 1.062
0.05 90.7 89.0 88.4 0.981 1.0070.10 81.9 78.7 77.6 0.961 1.0150.15 73.6 69.0 67.7 0.938 1.0190.20 65.8 60.4 58.8 0.917 1.027
3 0.25 58.6 52.2 50.7 0.891 1.0290.30 52.1 45.1 43.6 0.866 1.0340.35 46.1 38.9 37.3 0.843 1.0400.40 40.7 33.6 31.9 0.827 1.0550.05 90.8 87.2 86.6 0.960 1.0060.10 82.0 75.9 74.4 0.925 1.0190.15 73.7 64.9 63.5 0.880 1.0210.20 65.9 55.4 53.8 0.840 1.029
0.700 7 0.25 58.8 47.2 45.4 0.803 1.0400.30 52.2 40.2 38.1 0.771 1.0570.35 46.2 33.6 31.8 0.726 1.0570.40 40.8 28.2 26.4 0.690 1.0660.05 91.0 86.5 85.9 0.951 1.0070.10 82.3 74.5 73.2 0.905 1.0180.15 74.2 63.7 61.9 0.859 1.0290.20 66.6 54.0 52.0 0.811 1.037
11 0.25 59.5 45.4 43.4 0.764 1.0460.30 53.0 38.1 36.1 0.720 1.0580.35 47.0 31.9 29.8 0.678 1.0710.40 41.7 26.9 24.5 0.645 1.096
Table 7: First percentile strengths and ratios of first percentile strengths for a truncated Weibulldistribution. Based on 100,000 trials.

Number of ysngl = yassem = ymink = RADS = RADM =ρ members COV Single member Load sharing Weakest link yassem/ysngl yassem/ymink
0.05 95.0 94.5 93.9 0.995 1.0070.10 89.9 89.1 87.8 0.991 1.0150.15 84.9 83.7 81.9 0.985 1.0220.20 80.0 78.3 76.2 0.979 1.028
3 0.25 75.2 73.1 70.6 0.972 1.0350.30 70.6 68.3 65.4 0.968 1.0460.35 66.2 63.5 60.4 0.960 1.0530.40 61.9 58.8 55.7 0.950 1.0570.05 95.0 94.0 92.9 0.990 1.0120.10 90.0 88.0 86.0 0.978 1.0240.15 85.0 82.2 79.3 0.967 1.0380.20 80.1 76.6 72.8 0.955 1.051
0.900 7 0.25 75.4 70.9 66.7 0.940 1.0620.30 70.8 66.1 61.0 0.933 1.0830.35 66.4 61.1 55.6 0.920 1.0980.40 62.1 55.7 50.6 0.897 1.1020.05 94.9 93.4 92.2 0.985 1.0130.10 89.8 86.9 84.7 0.967 1.0250.15 84.8 80.6 77.5 0.951 1.0400.20 79.8 74.4 70.6 0.932 1.053
11 0.25 75.0 68.7 64.2 0.915 1.0700.30 70.3 63.1 58.1 0.897 1.0850.35 65.8 57.6 52.5 0.875 1.0980.40 61.6 53.0 47.3 0.861 1.119
0.05 98.8 99.4 98.8 1.006 1.0060.10 97.6 98.7 97.5 1.012 1.0130.15 96.3 98.1 96.2 1.019 1.0200.20 95.0 97.5 94.8 1.026 1.028
3 0.25 93.6 96.7 93.5 1.033 1.0350.30 92.3 95.9 92.1 1.040 1.0420.35 90.9 95.2 90.7 1.048 1.0510.40 89.5 94.5 89.2 1.056 1.0590.05 98.8 99.7 98.8 1.009 1.0090.10 97.6 99.6 97.6 1.020 1.0200.15 96.4 99.6 96.3 1.033 1.0340.20 95.1 99.7 94.9 1.049 1.050
1.000 7 0.25 93.8 99.9 93.6 1.065 1.0680.30 92.5 99.8 92.2 1.080 1.0830.35 91.1 99.7 90.8 1.094 1.0980.40 89.8 99.6 89.4 1.109 1.1130.05 98.8 99.8 98.8 1.010 1.0100.10 97.6 99.9 97.6 1.023 1.0240.15 96.4 100.1 96.3 1.039 1.0400.20 95.1 100.6 94.9 1.057 1.059
11 0.25 93.8 101.1 93.6 1.078 1.0810.30 92.5 101.4 92.2 1.096 1.1000.35 91.2 101.6 90.8 1.114 1.1180.40 89.8 101.6 89.4 1.131 1.136
Table 7 continued: First percentile strengths and ratios of first percentile strengths for a truncatedWeibull distribution. Based on 100,000 trials.
Number of ysngl = yassem = ymink = RADS = RADM =ρ members COV Single member Load sharing Weakest link yassem/ysngl yassem/ymink
0.05 92.6 89.5 89.4 0.967 1.0010.10 85.3 79.8 79.5 0.935 1.0040.15 78.3 70.5 70.2 0.899 1.0040.20 71.7 62.1 61.7 0.866 1.005
3 0.25 65.4 54.8 54.0 0.837 1.0130.30 59.5 47.5 47.1 0.799 1.0090.35 54.0 41.4 40.9 0.766 1.0110.40 48.9 36.0 35.5 0.736 1.0140.05 92.6 87.4 87.2 0.944 1.0020.10 85.3 75.9 75.5 0.889 1.0050.15 78.3 65.3 64.9 0.834 1.0070.20 71.7 56.1 55.5 0.783 1.012
0.500 7 0.25 65.4 47.8 47.1 0.732 1.0150.30 59.5 40.6 39.8 0.682 1.0190.35 54.0 34.2 33.5 0.634 1.0200.40 48.9 29.2 28.1 0.598 1.0380.05 92.6 86.1 86.0 0.930 1.0010.10 85.3 73.6 73.3 0.862 1.0030.15 78.4 62.3 62.1 0.795 1.0030.20 71.7 52.7 52.2 0.734 1.009
11 0.25 65.4 44.3 43.6 0.677 1.0160.30 59.5 36.8 36.3 0.618 1.0140.35 54.0 30.4 30.0 0.563 1.0140.40 48.9 25.3 24.7 0.516 1.022
0.05 94.3 92.2 91.9 0.978 1.0030.10 88.7 84.6 84.1 0.954 1.0060.15 83.2 77.5 76.6 0.931 1.0110.20 77.8 70.5 69.6 0.906 1.013
3 0.25 72.6 63.9 62.9 0.881 1.0160.30 67.6 57.9 56.8 0.858 1.0210.35 62.8 52.4 51.1 0.835 1.0270.40 58.3 47.0 45.8 0.807 1.0270.05 94.4 90.6 90.1 0.960 1.0050.10 88.8 81.8 80.8 0.921 1.0120.15 83.3 73.3 72.1 0.880 1.0180.20 78.0 65.6 64.0 0.841 1.026
0.700 7 0.25 72.8 58.4 56.5 0.803 1.0330.30 67.8 51.8 49.8 0.763 1.0400.35 63.1 45.7 43.7 0.725 1.0460.40 58.6 40.2 38.3 0.687 1.0520.05 94.4 89.9 89.4 0.952 1.0050.10 88.8 80.3 79.5 0.905 1.0100.15 83.3 71.4 70.3 0.858 1.0160.20 77.9 63.1 61.8 0.810 1.020
11 0.25 72.7 55.5 54.1 0.763 1.0250.30 67.7 48.8 47.2 0.721 1.0340.35 62.9 42.8 41.0 0.679 1.0420.40 58.4 37.2 35.6 0.636 1.045
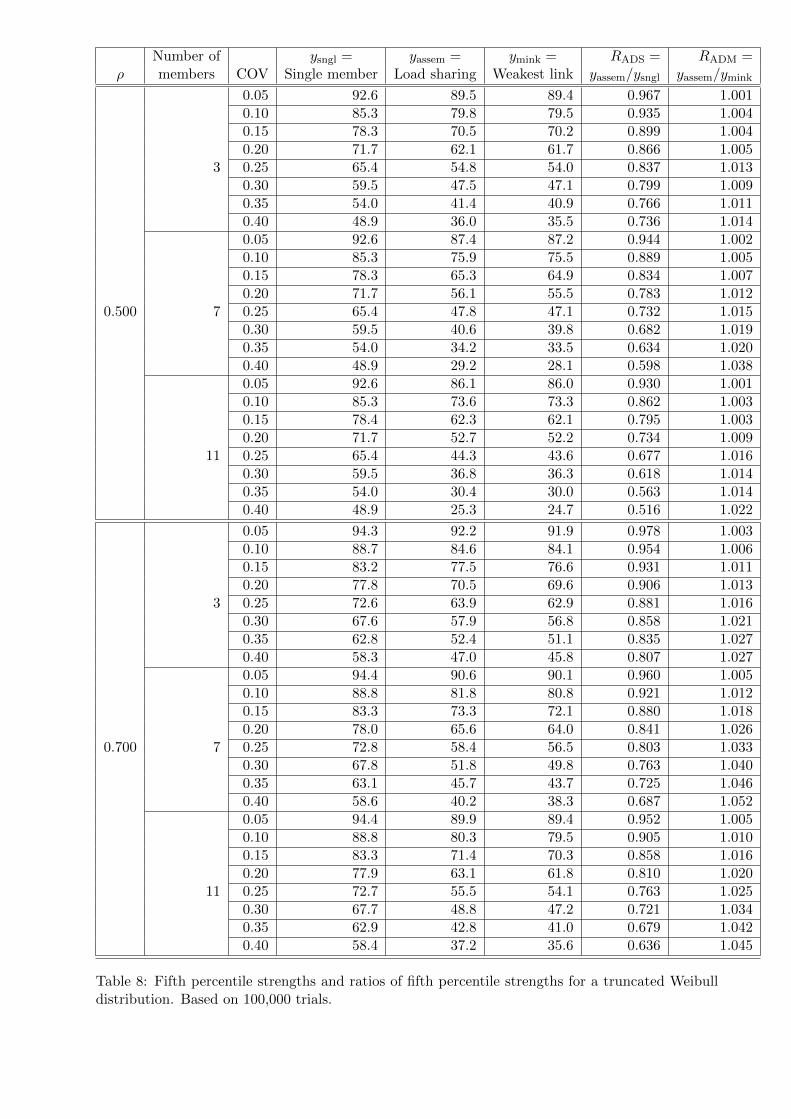
Table 8: Fifth percentile strengths and ratios of fifth percentile strengths for a truncated Weibulldistribution. Based on 100,000 trials.

Number of ysngl = yassem = ymink = RADS = RADM =ρ members COV Single member Load sharing Weakest link yassem/ysngl yassem/ymink
0.05 96.9 96.0 95.5 0.991 1.0060.10 93.7 92.0 91.0 0.982 1.0120.15 90.5 88.1 86.4 0.974 1.0190.20 87.2 84.0 82.0 0.963 1.025
3 0.25 84.0 80.1 77.6 0.954 1.0330.30 80.8 76.2 73.3 0.943 1.0390.35 77.7 72.5 69.2 0.934 1.0480.40 74.6 68.9 65.2 0.924 1.0560.05 97.0 95.5 94.5 0.984 1.0100.10 93.9 90.9 89.1 0.968 1.0210.15 90.7 86.3 83.7 0.952 1.0320.20 87.6 81.8 78.4 0.934 1.043
0.900 7 0.25 84.4 77.4 73.3 0.917 1.0550.30 81.3 73.2 68.4 0.900 1.0690.35 78.2 68.9 63.7 0.881 1.0800.40 75.2 64.8 59.3 0.863 1.0940.05 97.0 95.1 94.2 0.981 1.0100.10 93.9 90.2 88.4 0.961 1.0210.15 90.7 85.3 82.7 0.940 1.0310.20 87.5 80.6 77.2 0.921 1.045
11 0.25 84.4 75.8 71.8 0.899 1.0560.30 81.2 71.2 66.7 0.877 1.0680.35 78.2 66.9 61.8 0.857 1.0820.40 75.1 62.7 57.2 0.834 1.094
0.05 99.1 99.8 98.9 1.007 1.0090.10 98.1 99.6 97.8 1.016 1.0190.15 97.1 99.5 96.6 1.025 1.0310.20 96.1 99.5 95.4 1.036 1.043
3 0.25 95.0 99.3 94.1 1.045 1.0550.30 93.9 99.1 92.8 1.055 1.0680.35 92.8 98.9 91.6 1.066 1.0810.40 91.7 98.7 90.3 1.076 1.0940.05 99.1 100.0 98.8 1.009 1.0110.10 98.1 100.2 97.6 1.021 1.0260.15 97.1 100.5 96.4 1.036 1.0430.20 96.0 101.1 95.1 1.052 1.062
1.000 7 0.25 94.9 101.7 93.8 1.071 1.0840.30 93.8 102.1 92.5 1.088 1.1040.35 92.7 102.4 91.1 1.104 1.1230.40 91.6 102.5 89.8 1.119 1.1420.05 99.0 100.0 98.8 1.010 1.0130.10 98.0 100.3 97.6 1.024 1.0280.15 97.0 100.9 96.3 1.040 1.0480.20 95.9 101.6 95.0 1.060 1.070
11 0.25 94.8 102.6 93.6 1.082 1.0950.30 93.7 103.2 92.3 1.101 1.1180.35 92.6 103.6 90.9 1.119 1.1400.40 91.4 104.1 89.5 1.138 1.163
Table 8 continued: Fifth percentile strengths and ratios of fifth percentile strengths for a truncatedWeibull distribution. Based on 100,000 trials.
Number of ysngl = yassem = ymink = RADS = RADM =ρ members COV Single member Load sharing Weakest link yassem/ysngl yassem/ymink
0.05 94.6 91.6 91.5 0.968 1.0010.10 89.3 83.6 83.4 0.936 1.0020.15 84.0 75.9 75.7 0.904 1.0030.20 78.8 68.7 68.4 0.872 1.005
3 0.25 73.8 61.9 61.5 0.838 1.0050.30 69.0 55.6 55.2 0.806 1.0060.35 64.3 50.1 49.4 0.778 1.0130.40 59.9 44.8 44.1 0.748 1.0160.05 94.6 89.3 89.1 0.944 1.0020.10 89.2 79.3 78.9 0.889 1.0060.15 83.9 70.1 69.4 0.835 1.0090.20 78.8 61.6 60.8 0.782 1.013
0.500 7 0.25 73.7 53.9 53.0 0.731 1.0160.30 68.9 46.7 46.0 0.679 1.0160.35 64.2 40.6 39.8 0.632 1.0200.40 59.8 35.1 34.3 0.586 1.0220.05 94.6 88.3 88.1 0.933 1.0020.10 89.3 77.5 77.1 0.868 1.0060.15 84.1 67.5 67.0 0.803 1.0070.20 78.9 58.6 58.0 0.743 1.012
11 0.25 73.9 50.5 49.9 0.683 1.0120.30 69.1 43.4 42.7 0.629 1.0180.35 64.5 37.2 36.4 0.577 1.0220.40 60.1 31.8 31.0 0.530 1.029
0.05 96.0 93.7 93.5 0.976 1.0020.10 91.9 87.4 87.1 0.950 1.0040.15 87.9 81.4 80.8 0.927 1.0080.20 83.9 75.5 74.8 0.900 1.009
3 0.25 79.9 69.9 69.0 0.875 1.0130.30 76.0 64.6 63.5 0.850 1.0170.35 72.2 59.6 58.4 0.825 1.0210.40 68.5 54.8 53.5 0.801 1.0250.05 96.1 92.1 91.8 0.959 1.0030.10 92.1 84.5 84.0 0.917 1.0070.15 88.2 77.2 76.4 0.876 1.0100.20 84.2 70.2 69.3 0.834 1.013
0.700 7 0.25 80.3 63.8 62.6 0.794 1.0180.30 76.5 57.7 56.4 0.754 1.0220.35 72.7 52.1 50.7 0.717 1.0280.40 69.1 46.8 45.5 0.678 1.0310.05 96.0 91.3 90.9 0.951 1.0040.10 92.0 82.9 82.2 0.901 1.0080.15 88.0 75.2 74.0 0.854 1.0150.20 84.0 67.6 66.4 0.805 1.018
11 0.25 80.0 60.7 59.3 0.758 1.0240.30 76.1 54.4 52.7 0.714 1.0300.35 72.3 48.6 46.8 0.671 1.0380.40 68.7 43.3 41.4 0.630 1.045
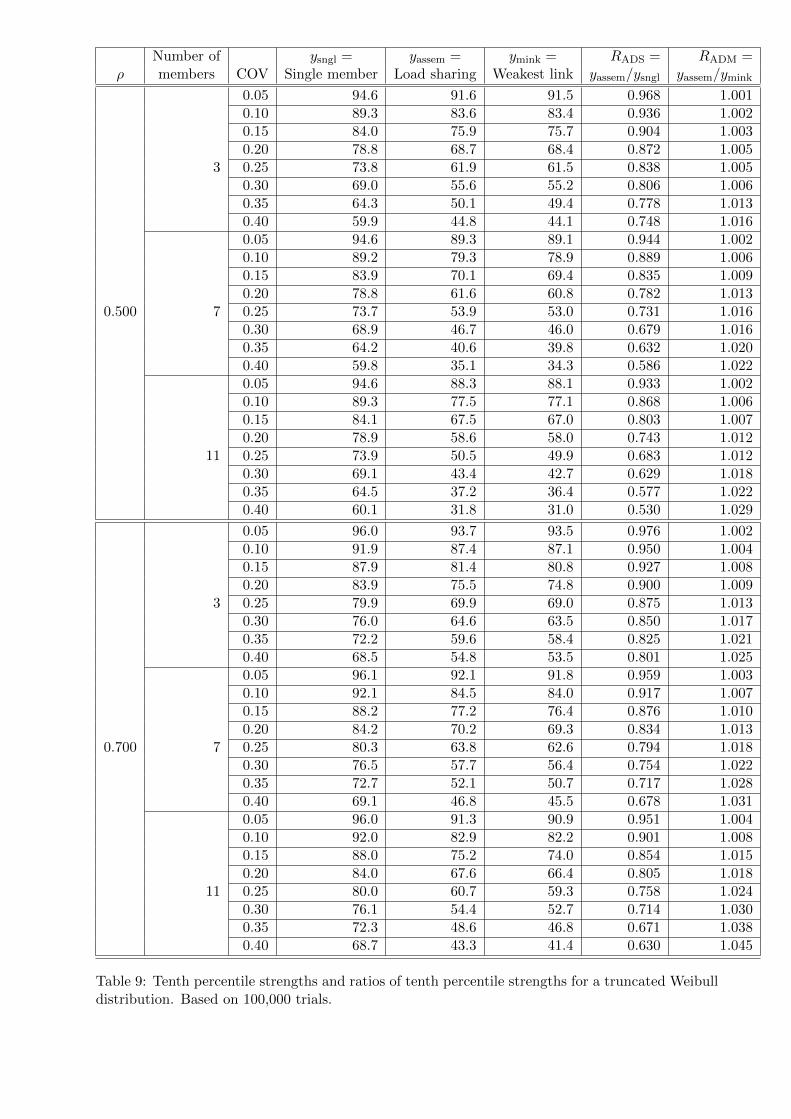
Table 9: Tenth percentile strengths and ratios of tenth percentile strengths for a truncated Weibulldistribution. Based on 100,000 trials.

Number of ysngl = yassem = ymink = RADS = RADM =ρ members COV Single member Load sharing Weakest link yassem/ysngl yassem/ymink
0.05 97.9 96.9 96.4 0.990 1.0060.10 95.8 93.8 92.8 0.979 1.0110.15 93.6 90.7 89.1 0.969 1.0180.20 91.4 87.6 85.4 0.959 1.026
3 0.25 89.1 84.4 81.8 0.947 1.0330.30 86.9 81.3 78.2 0.935 1.0400.35 84.6 78.2 74.7 0.924 1.0470.40 82.4 75.0 71.2 0.911 1.0530.05 97.9 96.1 95.4 0.982 1.0080.10 95.7 92.2 90.7 0.964 1.0170.15 93.4 88.3 86.1 0.945 1.0260.20 91.1 84.3 81.5 0.925 1.035
0.900 7 0.25 88.8 80.5 77.0 0.906 1.0450.30 86.5 76.7 72.6 0.886 1.0560.35 84.2 72.9 68.4 0.866 1.0660.40 81.9 69.4 64.4 0.847 1.0780.05 97.9 95.8 94.9 0.978 1.0100.10 95.8 91.6 89.8 0.956 1.0200.15 93.6 87.4 84.7 0.933 1.0310.20 91.4 83.3 79.8 0.911 1.044
11 0.25 89.2 79.1 74.9 0.887 1.0560.30 86.9 75.1 70.3 0.864 1.0680.35 84.7 71.2 65.8 0.842 1.0830.40 82.4 67.5 61.5 0.819 1.097
0.05 99.3 100.0 99.0 1.007 1.0100.10 98.5 100.1 97.9 1.015 1.0220.15 97.8 100.3 96.8 1.025 1.0360.20 97.0 100.5 95.6 1.036 1.051
3 0.25 96.1 100.7 94.4 1.048 1.0670.30 95.3 100.8 93.2 1.058 1.0810.35 94.4 100.8 92.0 1.068 1.0960.40 93.6 100.9 90.8 1.078 1.1110.05 99.3 100.1 98.9 1.008 1.0130.10 98.6 100.5 97.7 1.019 1.0280.15 97.8 101.0 96.5 1.033 1.0470.20 97.0 101.8 95.3 1.049 1.068
1.000 7 0.25 96.2 102.7 94.0 1.067 1.0920.30 95.4 103.2 92.7 1.083 1.1140.35 94.5 103.7 91.4 1.097 1.1340.40 93.7 104.1 90.1 1.112 1.1560.05 99.3 100.2 98.8 1.009 1.0140.10 98.5 100.6 97.6 1.021 1.0310.15 97.8 101.3 96.4 1.036 1.0510.20 97.0 102.1 95.1 1.053 1.074
11 0.25 96.1 103.3 93.7 1.074 1.1020.30 95.3 104.0 92.4 1.092 1.1260.35 94.4 104.6 91.0 1.108 1.1490.40 93.6 105.2 89.7 1.124 1.173
Table 9 continued: Tenth percentile strengths and ratios of Tenth percentile strengths for a trun-cated Weibull distribution. Based on 100,000 trials.
Nominal CorrelationCOV Distribution 0.5 0.7 0.9 1.0
Normal .500 .700 .900 1.000.05 Lognormal .499 .700 .899 .999
Weibull .489 .685 .881 .979
Normal .500 .700 .900 1.000.10 Lognormal .497 .698 .898 .998
Weibull .494 .690 .888 .986
Normal .499 .699 .900 1.000.15 Lognormal .498 .695 .895 .994
Weibull .498 .695 .893 .992
Normal .500 .699 .900 1.000.20 Lognormal .495 .693 .891 .990
Weibull .498 .697 .897 .996
Normal .500 .699 .900 1.000.25 Lognormal .492 .689 .886 .985
Weibull .497 .699 .899 .999
Normal .500 .700 .900 1.000.30 Lognormal .489 .685 .881 .979
Weibull .498 .699 .899 .999
Normal .499 .701 .900 1.000.35 Lognormal .485 .680 .874 .971
Weibull .499 .699 .899 .999
Normal .500 .700 .900 1.000.40 Lognormal .482 .675 .867 .963
Weibull .498 .698 .897 .997
Table 10: Sample correlations between MOE and MOR. Based on 1,000,000 trials.