Repeated Measures ANOVA - University of...
12
Repeated Measures ANOVA In this example participants saw one of three types of questions before seeing a word – a surface level question (Is the word printed in upper case letters?), a phonemic level question (Does the word rhyme with cat?) and a semantic level question (Is the word a type of animal?). Each participant saw 20 question / words pairs for each of the three types of questions. For each question / word pair, they pressed one key on the keyboard if the answer to the question was “Yes” and a different key if the answer was “No”. After seeing all 60 question / word pairs, they saw 180 words. Sixty of those words where the words they just studied and the other 120 words were distractors. They had to select the 60 words they had just seen. For each of the three question types, the number of words correctly recognized was recorded for each of the 25 participants. 1. Step 1: Write the null and alternative hypotheses and specify the probability of making a Type I error: H 0 : μ Surface = μ Rhyme = μ Semantic H 1 : not H 0 α = .05 2. Step 2: We will compare the reported p value to α. If p ≤ α, we will reject H 0 and conclude that the type of mnemonic likely had an effect on ordered recall. 3. Step 3: Calculate the test statistic: a. Open SPSS b. Either type the data (see the second to last page for the data) or open a data set. The class data set (for homework) is available from <http://academic.udayton.edu/gregelvers/psy216/SPSS/216dataS11.sav> . Save the data file somewhere and open it with SPSS. If you are typing the data, switch to the Variable View (click on that tab in the lower left) and create three variables. Name one of the variables surface, one phonemic and name the last variable semantic. Switch back to the Data View. Enter the data. Be sure to enter all of a given individual’s data on the same row. c. Analyze | General Linear Model | Repeated Measures
Transcript of Repeated Measures ANOVA - University of...
Repeated Measures ANOVA
In this example participants saw one of three types of questions before seeing a word – a surface
level question (Is the word printed in upper case letters?), a phonemic level question (Does the word
rhyme with cat?) and a semantic level question (Is the word a type of animal?). Each participant saw
20 question / words pairs for each of the three types of questions. For each question / word pair,
they pressed one key on the keyboard if the answer to the question was “Yes” and a different key if
the answer was “No”. After seeing all 60 question / word pairs, they saw 180 words. Sixty of those
words where the words they just studied and the other 120 words were distractors. They had to
select the 60 words they had just seen. For each of the three question types, the number of words
correctly recognized was recorded for each of the 25 participants.
1. Step 1: Write the null and alternative hypotheses and specify the probability of making a
Type I error:
H0: µSurface = μRhyme = μSemantic
H1: not H0
α = .05
2. Step 2: We will compare the reported p value to α. If p ≤ α, we will reject H0 and conclude
that the type of mnemonic likely had an effect on ordered recall.
3. Step 3: Calculate the test statistic:
a. Open SPSS
b. Either type the data (see the second to last page for the data) or open a data set.
The class data set (for homework) is available from
<http://academic.udayton.edu/gregelvers/psy216/SPSS/216dataS11.sav> . Save the
data file somewhere and open it with SPSS.
If you are typing the data, switch to the Variable View (click on that tab in the lower
left) and create three variables. Name one of the variables surface, one phonemic
and name the last variable semantic. Switch back to the Data View. Enter the data.
Be sure to enter all of a given individual’s data on the same row.
c. Analyze | General Linear Model | Repeated Measures
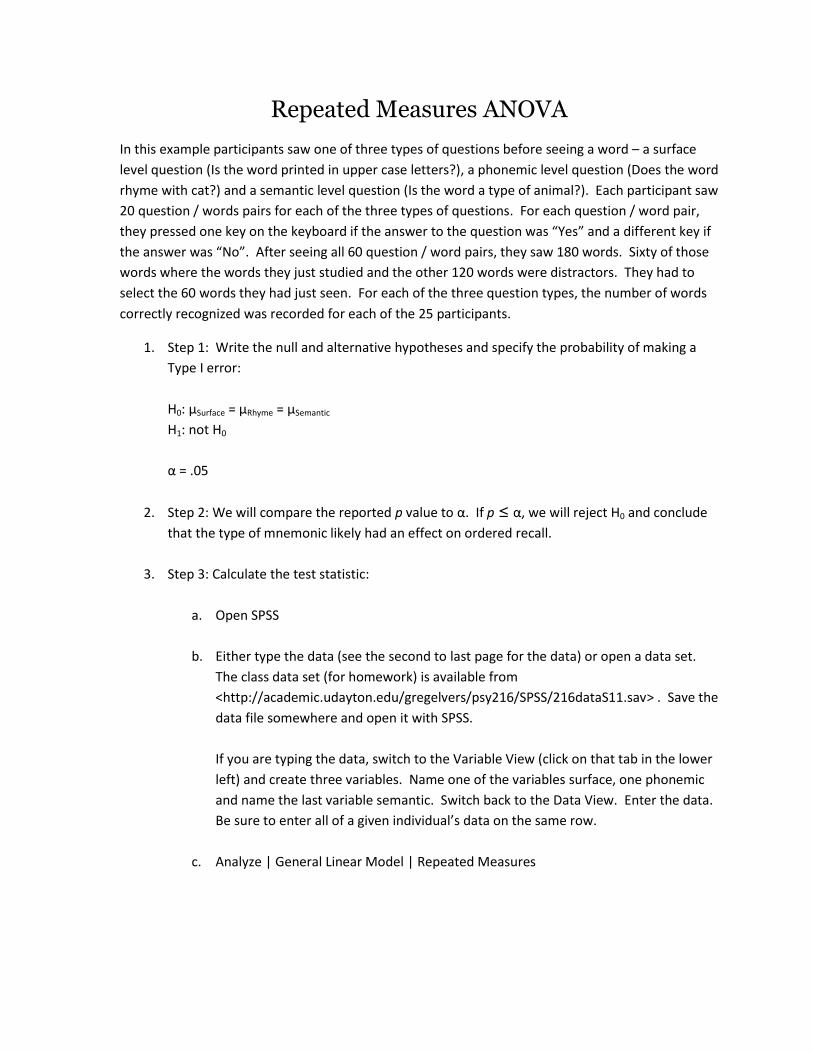
d. In the “Within-Subjects Factor Name:” box, type of the name of the IV: question
e. In the “Number of Levels:” box, type the number of levels of this IV: 3
f. Click the “Add” button
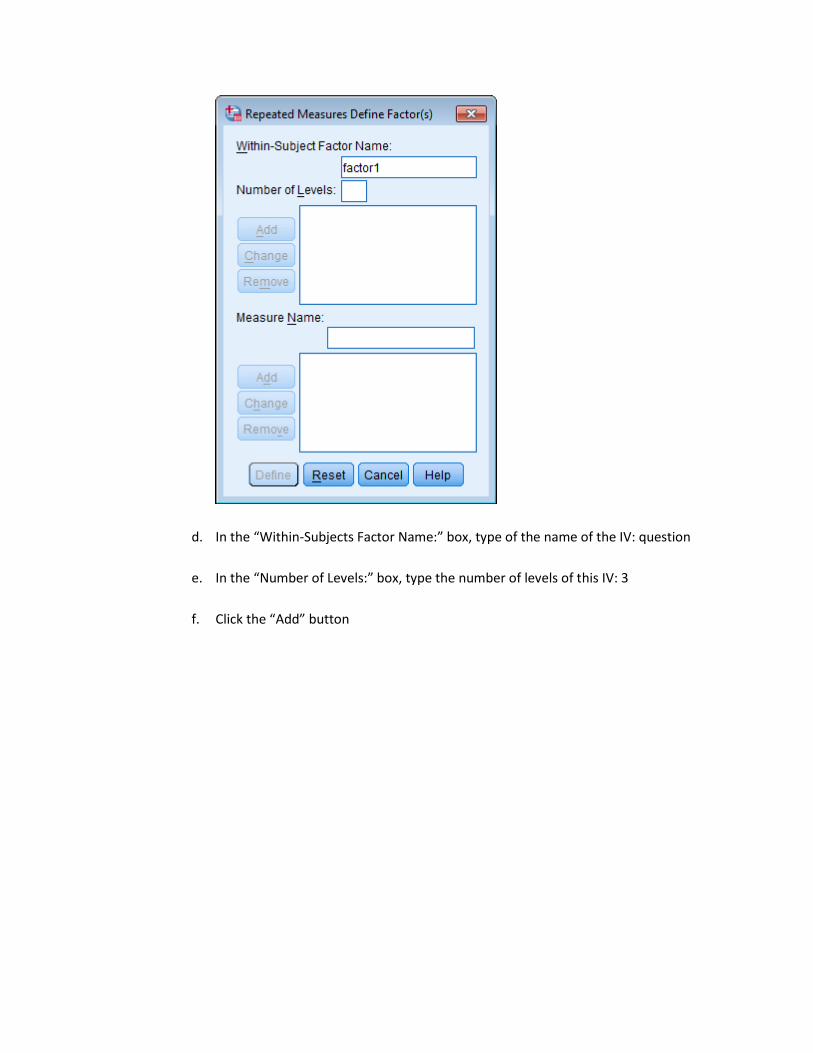
g. Click the “Define” button
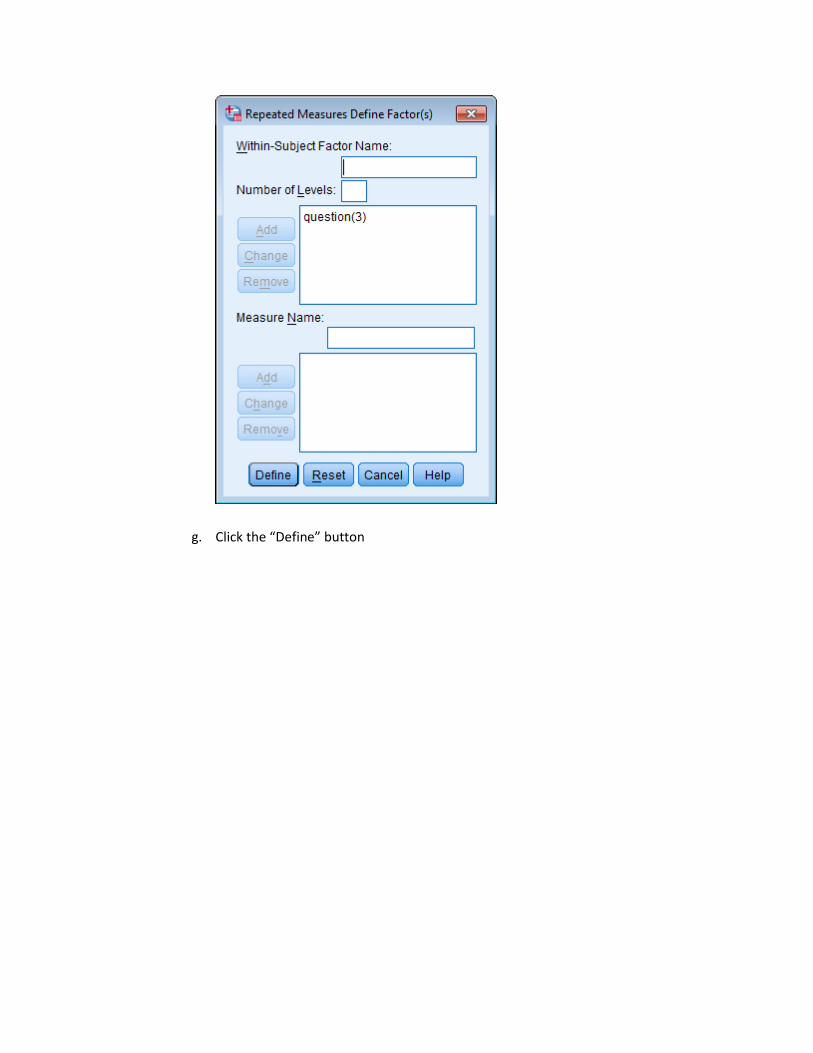
h. Move the variable that corresponds to the first level of the IV (Surface) from the box
on the left to the “Within-Subjects Variables (question):” box.
i. Repeat the previous steps for the variables that correspond to the second
(Phonemic) and third (Semantic) levels of the IV

j. While Post Hoc tests might be necessary (this IV has three levels; if we reject H0, we
would need to perform multiple comparisons), SPSS will not perform them for a
repeated measures IV. Thus, do not click on the “Post Hoc” button.
k. Click on the “Options” button.
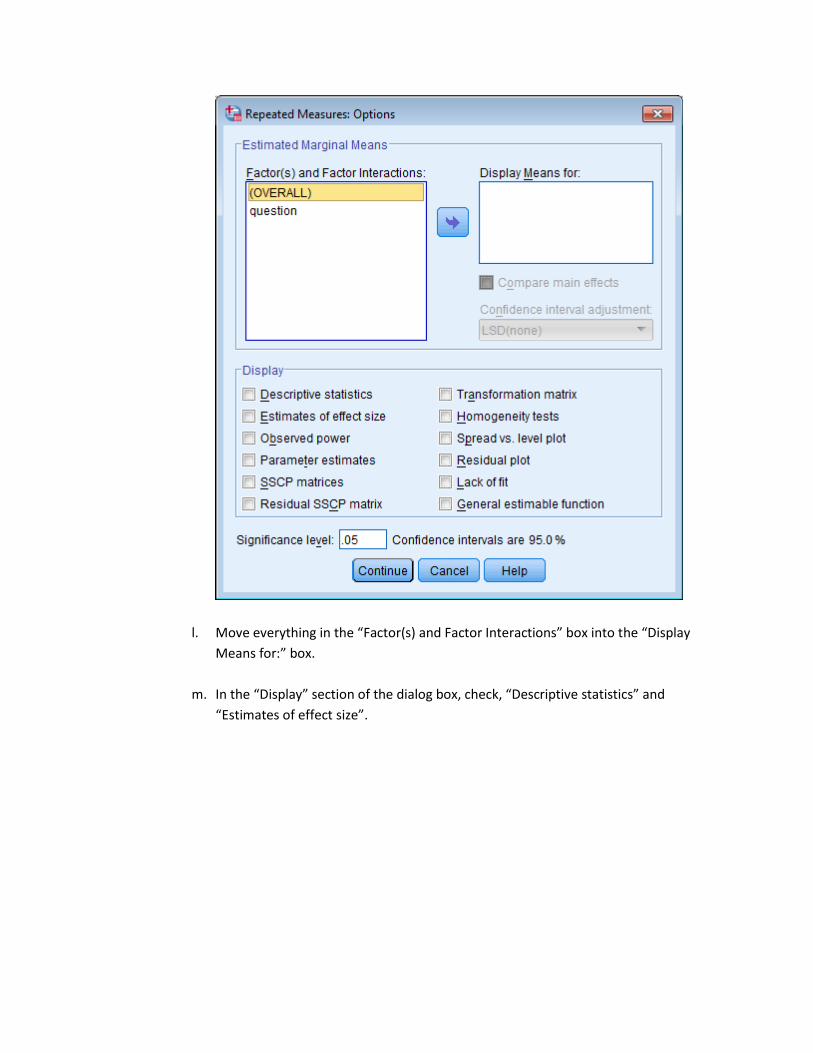
l. Move everything in the “Factor(s) and Factor Interactions” box into the “Display
Means for:” box.
m. In the “Display” section of the dialog box, check, “Descriptive statistics” and
“Estimates of effect size”.
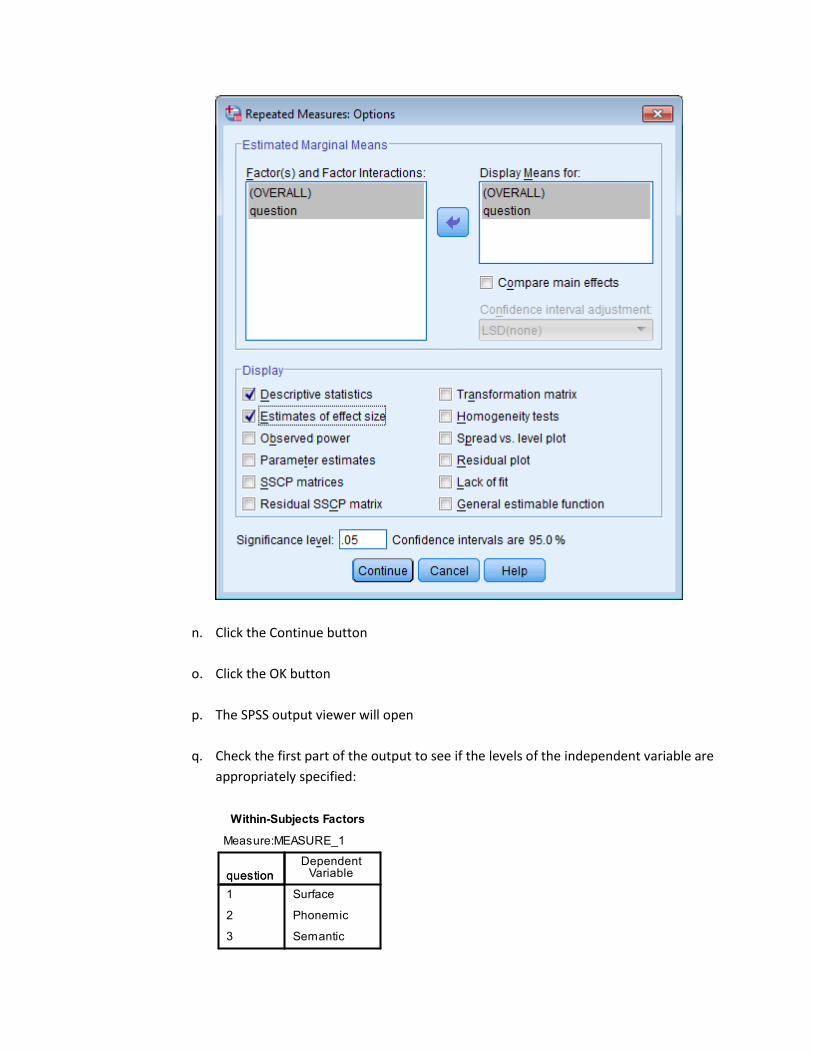
n. Click the Continue button
o. Click the OK button
p. The SPSS output viewer will open
q. Check the first part of the output to see if the levels of the independent variable are
appropriately specified:
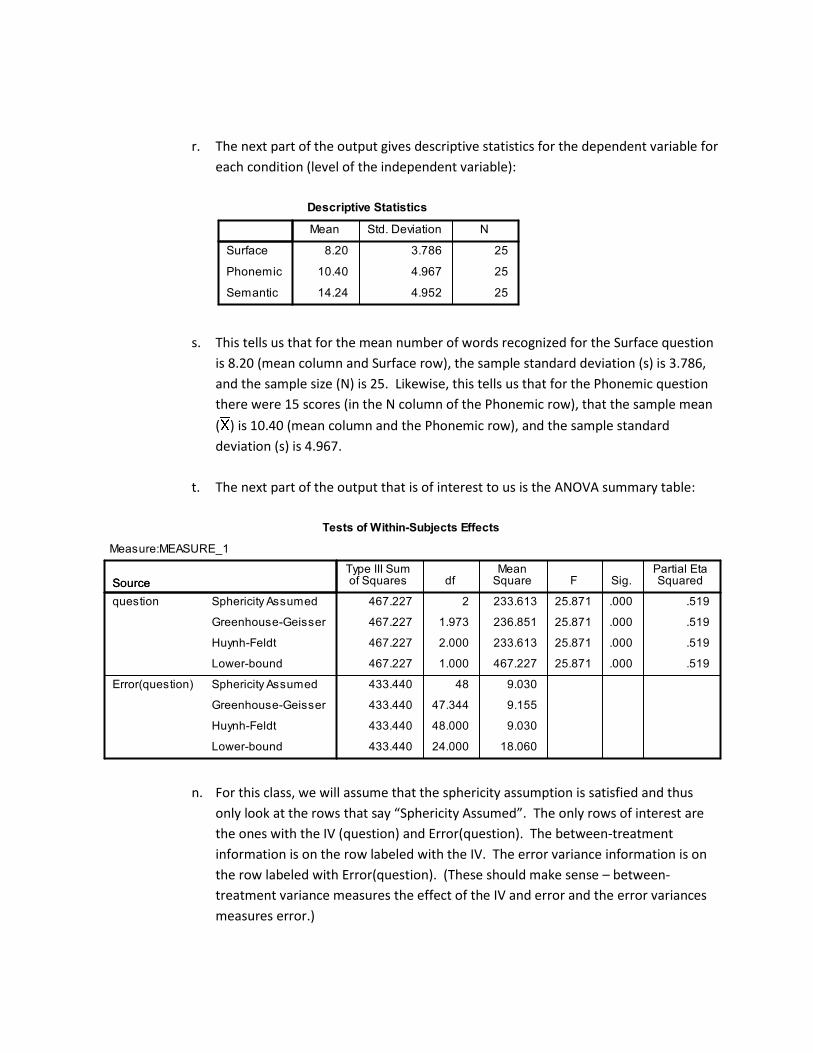
r. The next part of the output gives descriptive statistics for the dependent variable for
each condition (level of the independent variable):
s. This tells us that for the mean number of words recognized for the Surface question
is 8.20 (mean column and Surface row), the sample standard deviation (s) is 3.786,
and the sample size (N) is 25. Likewise, this tells us that for the Phonemic question
there were 15 scores (in the N column of the Phonemic row), that the sample mean
( ) is 10.40 (mean column and the Phonemic row), and the sample standard
deviation (s) is 4.967.
t. The next part of the output that is of interest to us is the ANOVA summary table:
n. For this class, we will assume that the sphericity assumption is satisfied and thus
only look at the rows that say “Sphericity Assumed”. The only rows of interest are
the ones with the IV (question) and Error(question). The between-treatment
information is on the row labeled with the IV. The error variance information is on
the row labeled with Error(question). (These should make sense – between-
treatment variance measures the effect of the IV and error and the error variances
measures error.)
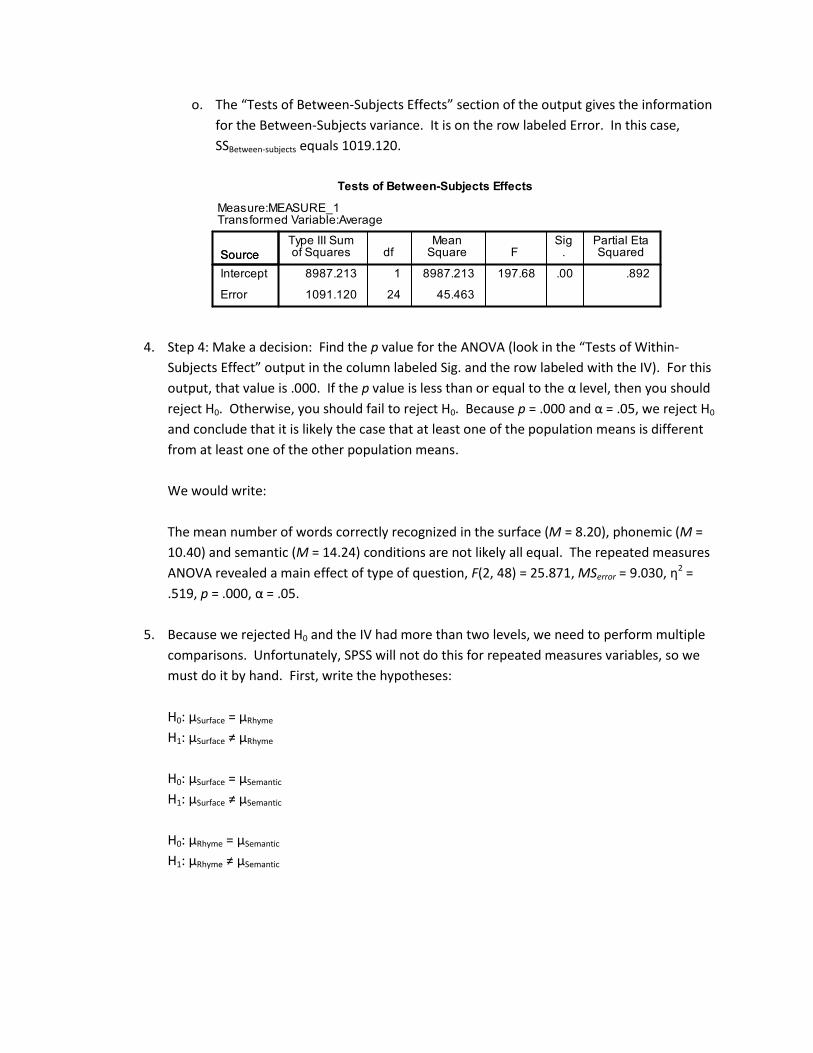
o. The “Tests of Between-Subjects Effects” section of the output gives the information
for the Between-Subjects variance. It is on the row labeled Error. In this case,
SSBetween-subjects equals 1019.120.
4. Step 4: Make a decision: Find the p value for the ANOVA (look in the “Tests of Within-
Subjects Effect” output in the column labeled Sig. and the row labeled with the IV). For this
output, that value is .000. If the p value is less than or equal to the α level, then you should
reject H0. Otherwise, you should fail to reject H0. Because p = .000 and α = .05, we reject H0
and conclude that it is likely the case that at least one of the population means is different
from at least one of the other population means.
We would write:
The mean number of words correctly recognized in the surface (M = 8.20), phonemic (M =
10.40) and semantic (M = 14.24) conditions are not likely all equal. The repeated measures
ANOVA revealed a main effect of type of question, F(2, 48) = 25.871, MSerror = 9.030, η2 =
.519, p = .000, α = .05.
5. Because we rejected H0 and the IV had more than two levels, we need to perform multiple
comparisons. Unfortunately, SPSS will not do this for repeated measures variables, so we
must do it by hand. First, write the hypotheses:
H0: μSurface = μRhyme
H1: μSurface ≠ μRhyme
H0: μSurface = μSemantic
H1: μSurface ≠ μSemantic
H0: μRhyme = μSemantic
H1: μRhyme ≠ μSemantic
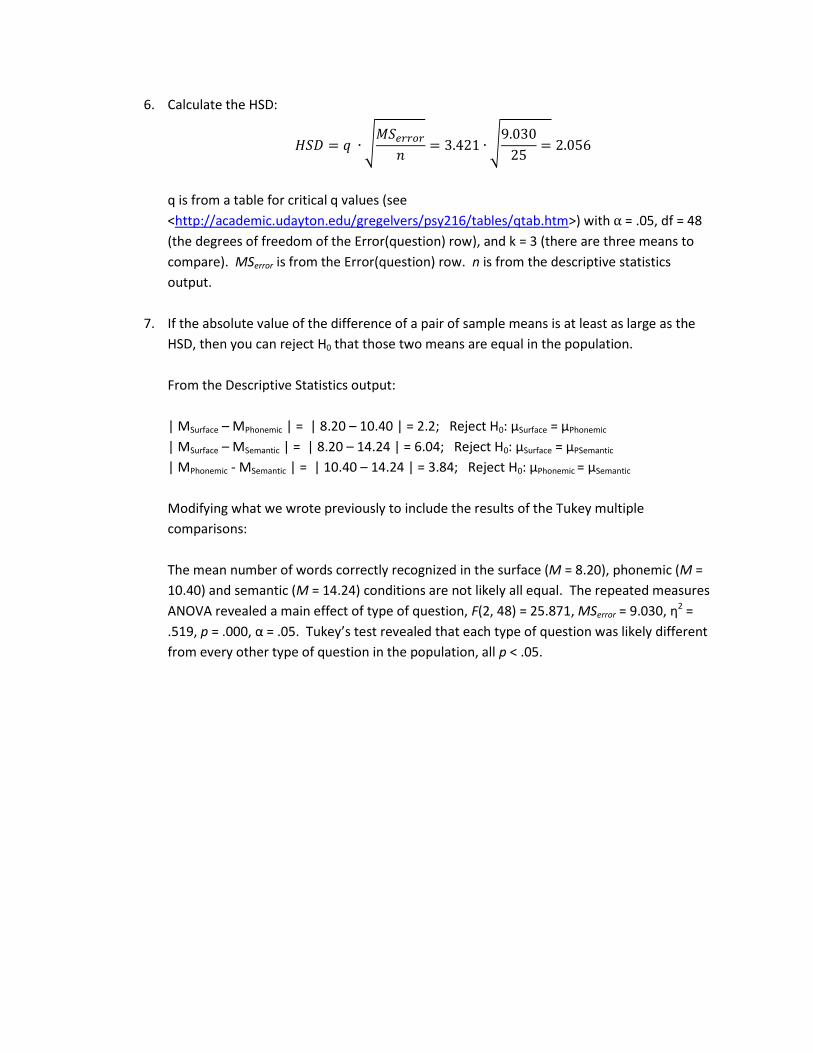
6. Calculate the HSD:
√
√
q is from a table for critical q values (see
<http://academic.udayton.edu/gregelvers/psy216/tables/qtab.htm>) with α = .05, df = 48
(the degrees of freedom of the Error(question) row), and k = 3 (there are three means to
compare). MSerror is from the Error(question) row. n is from the descriptive statistics
output.
7. If the absolute value of the difference of a pair of sample means is at least as large as the
HSD, then you can reject H0 that those two means are equal in the population.
From the Descriptive Statistics output:
| MSurface – MPhonemic | = | 8.20 – 10.40 | = 2.2; Reject H0: μSurface = μPhonemic
| MSurface – MSemantic | = | 8.20 – 14.24 | = 6.04; Reject H0: μSurface = μPSemantic
| MPhonemic - MSemantic | = | 10.40 – 14.24 | = 3.84; Reject H0: μPhonemic = μSemantic
Modifying what we wrote previously to include the results of the Tukey multiple
comparisons:
The mean number of words correctly recognized in the surface (M = 8.20), phonemic (M =
10.40) and semantic (M = 14.24) conditions are not likely all equal. The repeated measures
ANOVA revealed a main effect of type of question, F(2, 48) = 25.871, MSerror = 9.030, η2 =
.519, p = .000, α = .05. Tukey’s test revealed that each type of question was likely different
from every other type of question in the population, all p < .05.
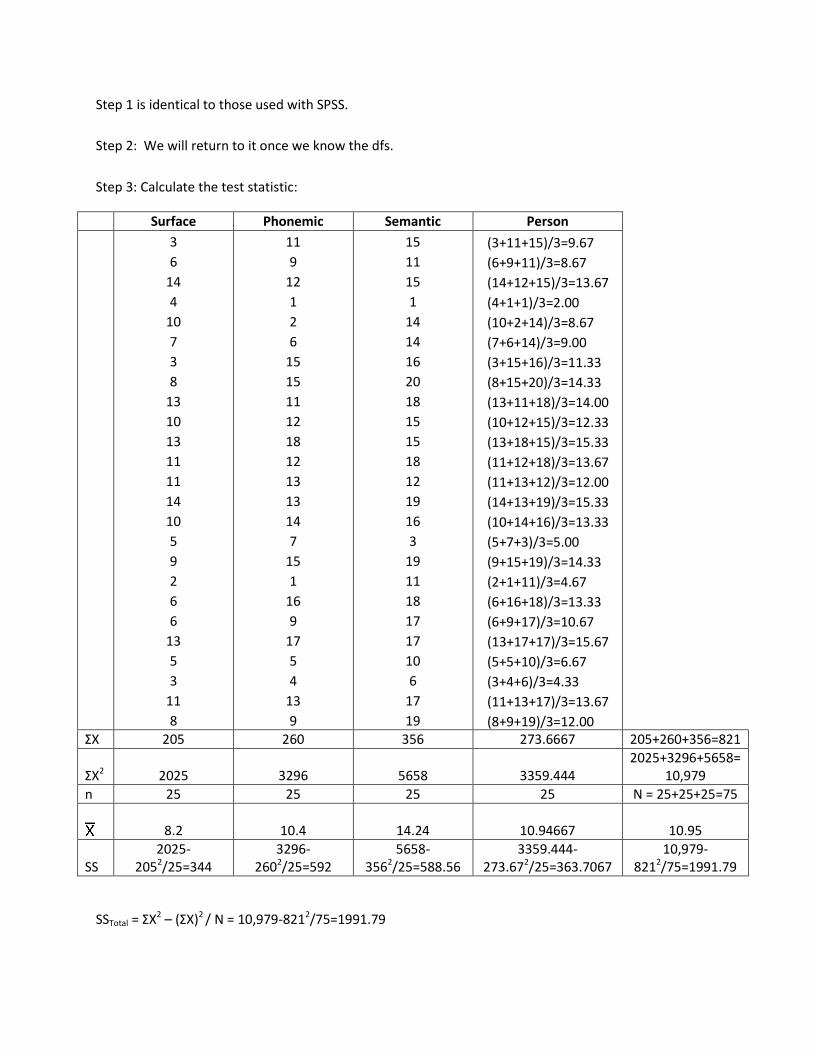
Step 1 is identical to those used with SPSS.
Step 2: We will return to it once we know the dfs.
Step 3: Calculate the test statistic:
Surface Phonemic Semantic Person
3
6
14
4
10
7
3
8
13
10
13
11
11
14
10
5
9
2
6
6
13
5
3
11
8
11
9
12
1
2
6
15
15
11
12
18
12
13
13
14
7
15
1
16
9
17
5
4
13
9
15
11
15
1
14
14
16
20
18
15
15
18
12
19
16
3
19
11
18
17
17
10
6
17
19
(3+11+15)/3=9.67
(6+9+11)/3=8.67
(14+12+15)/3=13.67
(4+1+1)/3=2.00
(10+2+14)/3=8.67
(7+6+14)/3=9.00
(3+15+16)/3=11.33
(8+15+20)/3=14.33
(13+11+18)/3=14.00
(10+12+15)/3=12.33
(13+18+15)/3=15.33
(11+12+18)/3=13.67
(11+13+12)/3=12.00
(14+13+19)/3=15.33
(10+14+16)/3=13.33
(5+7+3)/3=5.00
(9+15+19)/3=14.33
(2+1+11)/3=4.67
(6+16+18)/3=13.33
(6+9+17)/3=10.67
(13+17+17)/3=15.67
(5+5+10)/3=6.67
(3+4+6)/3=4.33
(11+13+17)/3=13.67
(8+9+19)/3=12.00
ΣX 205 260 356 273.6667 205+260+356=821
ΣX2 2025 3296 5658 3359.444
2025+3296+5658=10,979
n 25 25 25 25 N = 25+25+25=75
8.2 10.4 14.24 10.94667
10.95
SS
2025-2052/25=344
3296-2602/25=592
5658-3562/25=588.56
3359.444-273.672/25=363.7067
10,979-8212/75=1991.79
SSTotal = ΣX2 – (ΣX)2 / N = 10,979-8212/75=1991.79
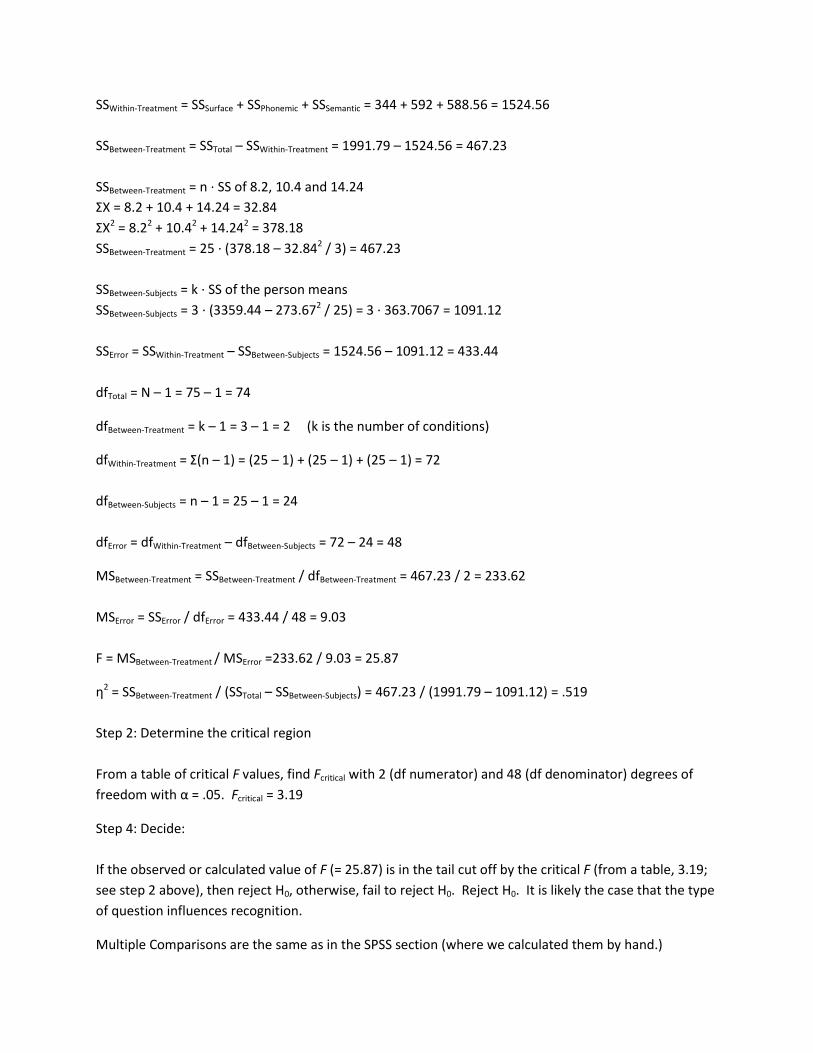
SSWithin-Treatment = SSSurface + SSPhonemic + SSSemantic = 344 + 592 + 588.56 = 1524.56
SSBetween-Treatment = SSTotal – SSWithin-Treatment = 1991.79 – 1524.56 = 467.23
SSBetween-Treatment = n ∙ SS of 8.2, 10.4 and 14.24
ΣX = 8.2 + 10.4 + 14.24 = 32.84
ΣX2 = 8.22 + 10.42 + 14.242 = 378.18
SSBetween-Treatment = 25 ∙ (378.18 – 32.842 / 3) = 467.23
SSBetween-Subjects = k ∙ SS of the person means
SSBetween-Subjects = 3 ∙ (3359.44 – 273.672 / 25) = 3 ∙ 363.7067 = 1091.12
SSError = SSWithin-Treatment – SSBetween-Subjects = 1524.56 – 1091.12 = 433.44
dfTotal = N – 1 = 75 – 1 = 74
dfBetween-Treatment = k – 1 = 3 – 1 = 2 (k is the number of conditions)
dfWithin-Treatment = Σ(n – 1) = (25 – 1) + (25 – 1) + (25 – 1) = 72
dfBetween-Subjects = n – 1 = 25 – 1 = 24
dfError = dfWithin-Treatment – dfBetween-Subjects = 72 – 24 = 48
MSBetween-Treatment = SSBetween-Treatment / dfBetween-Treatment = 467.23 / 2 = 233.62
MSError = SSError / dfError = 433.44 / 48 = 9.03
F = MSBetween-Treatment / MSError =233.62 / 9.03 = 25.87
η2 = SSBetween-Treatment / (SSTotal – SSBetween-Subjects) = 467.23 / (1991.79 – 1091.12) = .519
Step 2: Determine the critical region
From a table of critical F values, find Fcritical with 2 (df numerator) and 48 (df denominator) degrees of
freedom with α = .05. Fcritical = 3.19
Step 4: Decide:
If the observed or calculated value of F (= 25.87) is in the tail cut off by the critical F (from a table, 3.19;
see step 2 above), then reject H0, otherwise, fail to reject H0. Reject H0. It is likely the case that the type
of question influences recognition.
Multiple Comparisons are the same as in the SPSS section (where we calculated them by hand.)