Rep-VB SMcC-SBC DPD Issue-260914€¦ · Building on the work of the HA’s strategic model, SBC...
164
Stockton-on-Tees Borough Council Development Planning Document Modelling Review 224125-19 Issue | 25 September 2014 This report takes into account the particular instructions and requirements of our client. It is not intended for and should not be relied upon by any third party and no responsibility is undertaken to any third party. Job number 212152-19 Ove Arup & Partners Ltd Central Square Forth Street Newcastle upon Tyne NE1 3PL United Kingdom www.arup.com
Transcript of Rep-VB SMcC-SBC DPD Issue-260914€¦ · Building on the work of the HA’s strategic model, SBC...
Stockton-on-Tees Borough Council
Development Planning Document
Modelling Review
224125-19
Issue | 25 September 2014
This report takes into account the particular instructions and requirements of our client.
It is not intended for and should not be relied upon by any third party and no responsibility is undertaken to any third party. Job number 212152-19
Ove Arup & Partners Ltd Central Square Forth Street Newcastle upon Tyne NE1 3PL United Kingdom www.arup.com
Stockton-on-Tees Borough Council Development Planning DocumentModelling Review
224125-19 | Issue | 25 September 2014
\\GLOBAL\EUROPE\NEWCASTLE\JOBS\220000\224125\19 WEST STOCKTON HOUSING\DOCS\27- REPORTS\DPD SUMMARY MODELLLING REPORT\REP-VB_SMCC-SBC DPD ISSUE-260914.DOCX
Contents
Page
1 Introduction 1
2 West Stockton 2
2.1 Introduction 2 2.2 Base Model Development 2 2.3 Future Model Development 12 2.4 Proposed development -West Stockton Housing 14 2.5 Forecast Year Assessment 20 2.6 Traffic Demand 21 2.7 Results Summary 22 2.8 WeSAM Summary 26
3 South Yarm 28
3.1 Introduction 28 3.2 Base Model Development 28 3.3 Traffic Data 31 3.4 Model development 34 3.5 Calibration 37 3.6 Model Validation 38 3.7 Future Model Development 40 3.8 Committed Highway Schemes 41 3.9 South Yarm 42 3.10 Proposed Highway Improvement 43 3.11 Forecast Year Assessment 43 3.12 YIBAM Summary 47
4 Wynyard 48
4.1 Introduction 48 4.2 Wynyard Park - Extant Planning Context 49 4.3 Highways Agency Pinchpoint Scheme 50 4.4 North Tees Hospital at Wynyard Park 51 4.5 Base Model Development 52 4.6 Future Year Model for Assessment 53 4.7 Residential Assessment Process 54 4.8 Highway Mitigation 55 4.9 Cumulative Scenario 55 4.10 Results 57

Stockton-on-Tees Borough Council Development Planning DocumentModelling Review
224125-19 | Issue | 25 September 2014
\\GLOBAL\EUROPE\NEWCASTLE\JOBS\220000\224125\19 WEST STOCKTON HOUSING\DOCS\27- REPORTS\DPD SUMMARY MODELLLING REPORT\REP-VB_SMCC-SBC DPD ISSUE-260914.DOCX
Appendices
Appendix A
WeSAM Traffic Data
Appendix B
WeSAM Matrices
Appendix C
WeSAM Validation Screenshots
Appendix D
WeSAM Highway Improvements
Appendix E
YIBAM ATC's
Appendix F
YIBAM Highway Improvements
Appendix G
YIBAM Results
Appendix H
JMP Wynyard VISSIM Validation Report
Appendix I
Wynyard Committed Development Flows
Appendix J
Wynyard Mitigation Plans

Stockton-on-Tees Borough Council Development Planning DocumentModelling Review
224125-19 | Issue | 25 September 2014
\\GLOBAL\EUROPE\NEWCASTLE\JOBS\220000\224125\19 WEST STOCKTON HOUSING\DOCS\27- REPORTS\DPD SUMMARY MODELLLING REPORT\REP-VB_SMCC-SBC DPD ISSUE-260914.DOCX
Page 1
1 Introduction
Stockton-on-Tees Borough Council (SBC), both directly and through Tees Valley Unlimited (TVU), are co-operating closely with the Highways Agency (HA) to develop a co-ordinated approach to considering the wider impacts of Local Development Framework (LDF) proposals. SBC in partnership with Arup are developing new approaches to assess the impact and opportunities arising from proposed developments.
TVU, in co-operation with all the Tees Valley local authorities (including SBC), have compiled a development database which enables the impact of developments across the Tees Valley to be assessed. This development database can provide future year scenarios for both the Tees Valley strategic transport model and the HA’s modelling tools.
The HA’s modelling tools include those that provide a more detailed coverage of the Tees Valley trunk road junctions through use of existing micro-simulation models and those shared by and owned by SBC. The HA have also developed a wider Meso-scopic transport model, which they have used as part of the LDF process to consider the wider impact of developments on their network in the Tees Valley. By combining all of the tools available to the Local Authorities, TVU and the HA, a robust Area Action Plan has been established to identify and prioritise transport investments required to unlock the developments outlined in the authority’s LDF, the HA’s route based strategies and the wider Tees Valley Strategic Economic Plan. This will continue to be maintained and updated as information related to development proposals changes, and the developments themselves come forward.
Building on the work of the HA’s strategic model, SBC commissioned Arup to develop detailed micro-simulation models for Yarm and Ingleby Barwick (YIBAM AIMSUN model) and West Stockton (WeSAM AIMSUN model). These models were validated and used to test various housing development impacts and mitigation measures as described in Sections 2 and 3. The models were instrumental in justifying S106 contributions by several developers towards the costs of the identified highway improvements.
Section 4 describes a similar modelling process for the Wynyard area highway network. The process was managed by Arup on behalf of SBC, the modelling was primarily undertaken by JMP on behalf of the HA and Stockton and Hartlepool local authorities.

Stockton-on-Tees Borough Council Development Planning DocumentModelling Review
224125-19 | Issue | 25 September 2014
\\GLOBAL\EUROPE\NEWCASTLE\JOBS\220000\224125\19 WEST STOCKTON HOUSING\DOCS\27- REPORTS\DPD SUMMARY MODELLLING REPORT\REP-VB_SMCC-SBC DPD ISSUE-260914.DOCX
Page 2
2 West Stockton
2.1 Introduction A traffic model for the West Stockton road network was developed by Arup in 2013 using the traffic micro-simulation software AIMSUN.
The West Stockton AIMSUN Model (WeSAM) provides a tool that has been used to determine the traffic impact of potential housing developments and to inform the requirement for future highway interventions.
The study was undertaken in two phases and separate documents that describe the elements of these two phases have been provided. These documents are;
WeSAM Local Model Validation Report (LMVR) – February 2014, and
WeSAM Forecasting Report – March 2014.
This chapter details the chronology of the overall study and describes the various stages during the course of the study. This report should be read in conjunction with the aforementioned documents wherever referenced.
2.2 Base Model Development
2.2.1 Base Year (2013)
The WeSAM was developed in 2013, which also forms the base year of the model. The key requisite of the base model development stage was to develop a calibrated and validated model that replicates existing traffic conditions in West Stockton for the morning and evening peak periods.
2.2.2 Study Area
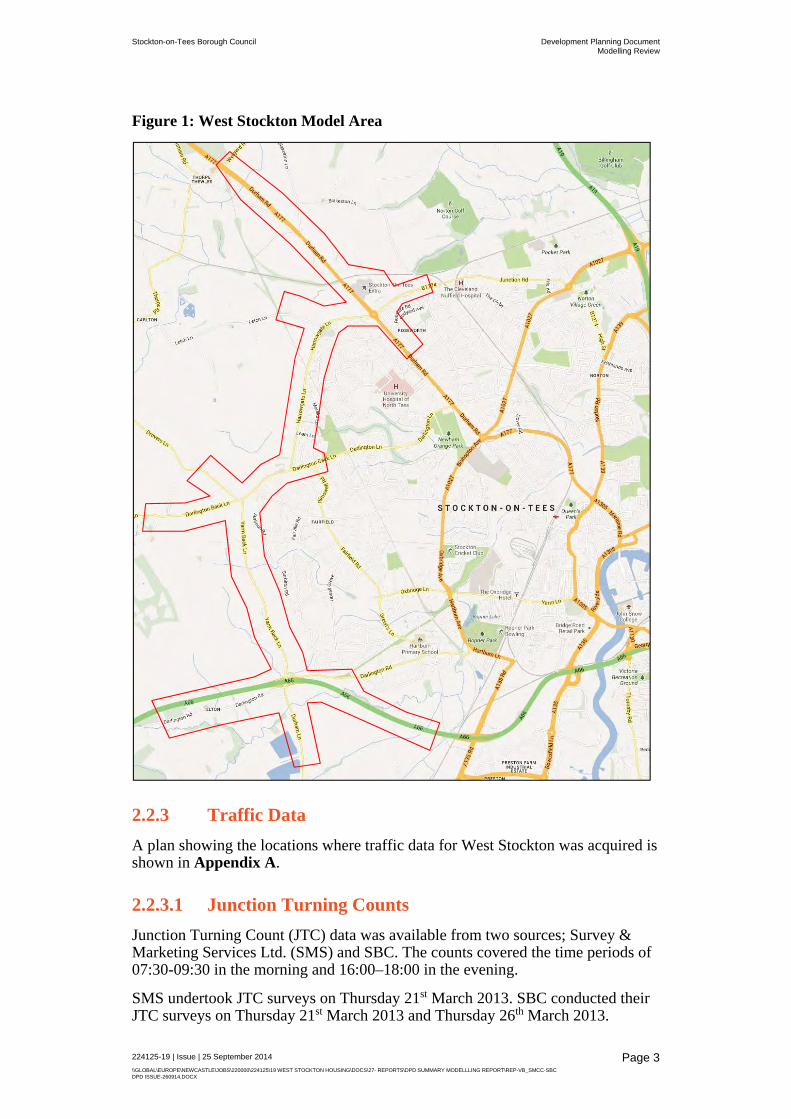
The extent of the road network included in the model is shown in Figure 1.
At the northern end, the model encompasses the A177 Durham Road / B1274 Junction Road / Harrowgate Lane four-arm roundabout. The north and south arms of the A177 extend up to the junctions with Wynyard Road and Hardwick Road respectively, but exclude the junctions themselves. The B1274 Junction Road extends up to the Ragpath Lane / Blakeston Lane junction but excludes the junction.
At the southern end the model encompasses the A66 / Yarm Back Lane / Darlington Road / Durham Lane Interchange, also called the A66 Elton Interchange (I/C). The merge and diverge of the A66 on either side of the Interchange have been included in the model.
Between the northern and southern extremities, the model includes three distinct roads and the main junctions along them. These roads are:
Harrowgate Lane;
Darlington Back Lane (DBL); and,
Yarm Back Lane (YBL).
Stockton-on-Tees Borough Council Development Planning DocumentModelling Review
224125-19 | Issue | 25 September 2014
\\GLOBAL\EUROPE\NEWCASTLE\JOBS\220000\224125\19 WEST STOCKTON HOUSING\DOCS\27- REPORTS\DPD SUMMARY MODELLLING REPORT\REP-VB_SMCC-SBC DPD ISSUE-260914.DOCX
Page 3
Figure 1: West Stockton Model Area
2.2.3 Traffic Data
A plan showing the locations where traffic data for West Stockton was acquired is shown in Appendix A.
2.2.3.1 Junction Turning Counts
Junction Turning Count (JTC) data was available from two sources; Survey & Marketing Services Ltd. (SMS) and SBC. The counts covered the time periods of 07:30-09:30 in the morning and 16:00–18:00 in the evening.
SMS undertook JTC surveys on Thursday 21st March 2013. SBC conducted their JTC surveys on Thursday 21st March 2013 and Thursday 26th March 2013.
Stockton-on-Tees Borough Council Development Planning DocumentModelling Review
224125-19 | Issue | 25 September 2014
\\GLOBAL\EUROPE\NEWCASTLE\JOBS\220000\224125\19 WEST STOCKTON HOUSING\DOCS\27- REPORTS\DPD SUMMARY MODELLLING REPORT\REP-VB_SMCC-SBC DPD ISSUE-260914.DOCX
Page 4
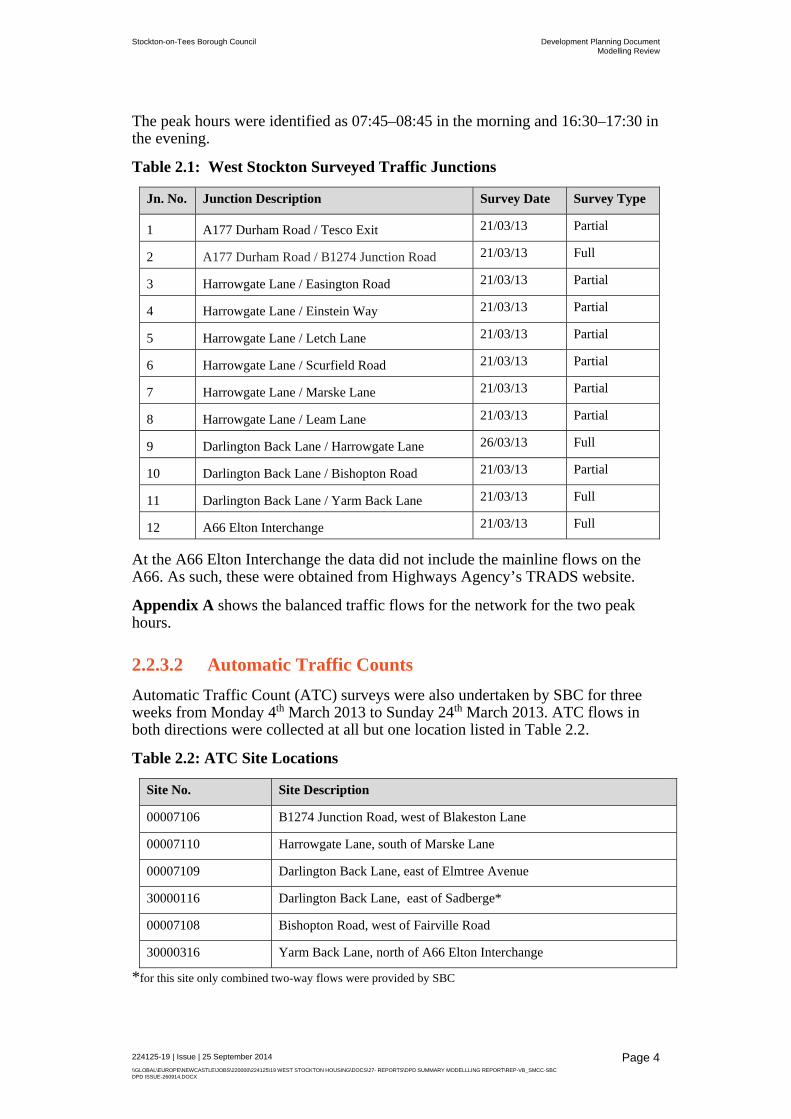
The peak hours were identified as 07:45–08:45 in the morning and 16:30–17:30 in the evening.
Table 2.1: West Stockton Surveyed Traffic Junctions
Jn. No. Junction Description Survey Date Survey Type
1 A177 Durham Road / Tesco Exit 21/03/13 Partial
2 A177 Durham Road / B1274 Junction Road 21/03/13 Full
3 Harrowgate Lane / Easington Road 21/03/13 Partial
4 Harrowgate Lane / Einstein Way 21/03/13 Partial
5 Harrowgate Lane / Letch Lane 21/03/13 Partial
6 Harrowgate Lane / Scurfield Road 21/03/13 Partial
7 Harrowgate Lane / Marske Lane 21/03/13 Partial
8 Harrowgate Lane / Leam Lane 21/03/13 Partial
9 Darlington Back Lane / Harrowgate Lane 26/03/13 Full
10 Darlington Back Lane / Bishopton Road 21/03/13 Partial
11 Darlington Back Lane / Yarm Back Lane 21/03/13 Full
12 A66 Elton Interchange 21/03/13 Full
At the A66 Elton Interchange the data did not include the mainline flows on the A66. As such, these were obtained from Highways Agency’s TRADS website.
Appendix A shows the balanced traffic flows for the network for the two peak hours.
2.2.3.2 Automatic Traffic Counts
Automatic Traffic Count (ATC) surveys were also undertaken by SBC for three weeks from Monday 4th March 2013 to Sunday 24th March 2013. ATC flows in both directions were collected at all but one location listed in Table 2.2.
Table 2.2: ATC Site Locations
Site No. Site Description
00007106 B1274 Junction Road, west of Blakeston Lane
00007110 Harrowgate Lane, south of Marske Lane
00007109 Darlington Back Lane, east of Elmtree Avenue
30000116 Darlington Back Lane, east of Sadberge*
00007108 Bishopton Road, west of Fairville Road
30000316 Yarm Back Lane, north of A66 Elton Interchange
*for this site only combined two-way flows were provided by SBC

Stockton-on-Tees Borough Council Development Planning DocumentModelling Review
224125-19 | Issue | 25 September 2014
\\GLOBAL\EUROPE\NEWCASTLE\JOBS\220000\224125\19 WEST STOCKTON HOUSING\DOCS\27- REPORTS\DPD SUMMARY MODELLLING REPORT\REP-VB_SMCC-SBC DPD ISSUE-260914.DOCX
Page 5
2.2.3.3 Journey Times
Journey time surveys were undertaken by SBC on Thursday 21st March 2013. The journey times were recorded between 07:45 - 09.15 in the morning and 16:15 – 17:45 in the evening.
Arup also undertook journey time observations on the same day. Table 2.3a shows the journey time routes and the average journey times over these routes during the peak hours.
Table 2.3a: Observed Average Peak Hour Journey Times (mm:ss)
Route No.
Road Section Between Journey Time
AM PM
1 B1274 Junction Road WB Ragpath Lane to A177 Durham Road 01:34 01:24
2 Harrowgate Lane SB A177 Durham Road to DBL 03:08 03:10
3 DBL SB, YBL SB Harrowgate Lane to Elton Interchange (Durham Lane exit) 03:44 03:44
4 Durham Lane NB 500m south of Elton Interchange to Elton Interchange (YBL exit) 01:04 05:47
5 YBL NB, DBL NB Elton Interchange (YBL exit) to Harrowgate Lane 06:26 05:54
6 Harrowgate Lane NB DBL to Harrowgate Lane 03:34 03:56
Routes 1, 2 and 3 combined together comprise the total southbound journey time, and routes 4, 5 and 6 combined together comprise the total northbound journey time.
The total southbound and northbound average journey times during the AM peak hour have been calculated to be 08:26 and 11:04 respectively. These values for the PM peak are 08:18 and 15:37 respectively.
Arup also measured the journey times on both approaches of the A177 at the A177 Durham Road / B1274 Junction Road roundabout, and these are given in Table 2.3b for the peak hours.
Table 2.3b: Additional Journey Times (mm:ss)
Route No.
Road Section Between Journey Time
AM PM
7 A177 Durham Road SB 50mph speed limit start to B1274 Junction Road 04:46 01:40
8 A177 Durham Road NB Hardwick Road to Harrowgate Lane 00:57 02:09
It should be noted that all journey times mentioned above represent typical average conditions are sometimes likely to be worse than the ones modelled.
Stockton-on-Tees Borough Council Development Planning DocumentModelling Review
224125-19 | Issue | 25 September 2014
\\GLOBAL\EUROPE\NEWCASTLE\JOBS\220000\224125\19 WEST STOCKTON HOUSING\DOCS\27- REPORTS\DPD SUMMARY MODELLLING REPORT\REP-VB_SMCC-SBC DPD ISSUE-260914.DOCX
Page 6
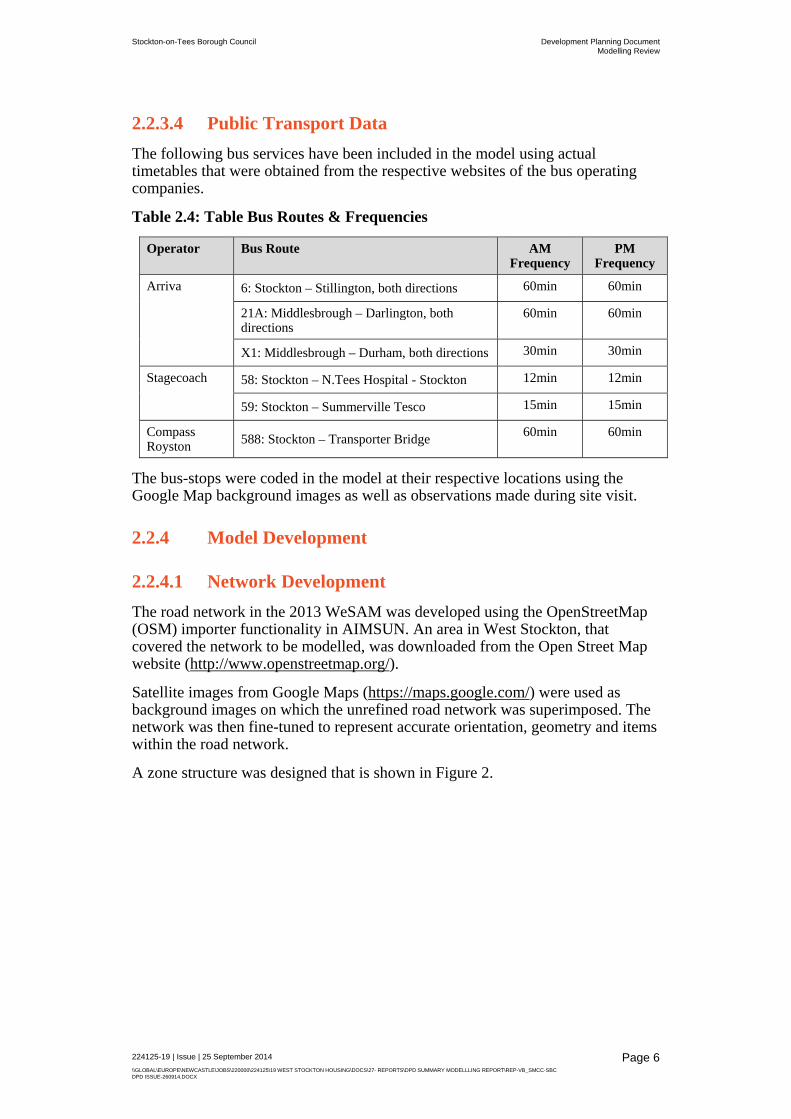
2.2.3.4 Public Transport Data
The following bus services have been included in the model using actual timetables that were obtained from the respective websites of the bus operating companies.
Table 2.4: Table Bus Routes & Frequencies
Operator Bus Route AM Frequency
PM Frequency
Arriva 6: Stockton – Stillington, both directions 60min 60min
21A: Middlesbrough – Darlington, both directions
60min 60min
X1: Middlesbrough – Durham, both directions 30min 30min
Stagecoach 58: Stockton – N.Tees Hospital - Stockton 12min 12min
59: Stockton – Summerville Tesco 15min 15min
Compass Royston 588: Stockton – Transporter Bridge 60min 60min
The bus-stops were coded in the model at their respective locations using the Google Map background images as well as observations made during site visit.
2.2.4 Model Development
2.2.4.1 Network Development
The road network in the 2013 WeSAM was developed using the OpenStreetMap (OSM) importer functionality in AIMSUN. An area in West Stockton, that covered the network to be modelled, was downloaded from the Open Street Map website (http://www.openstreetmap.org/).
Satellite images from Google Maps (https://maps.google.com/) were used as background images on which the unrefined road network was superimposed. The network was then fine-tuned to represent accurate orientation, geometry and items within the road network.
A zone structure was designed that is shown in Figure 2.

Stockton-on-Tees Borough Council Development Planning DocumentModelling Review
224125-19 | Issue | 25 September 2014
\\GLOBAL\EUROPE\NEWCASTLE\JOBS\220000\224125\19 WEST STOCKTON HOUSING\DOCS\27- REPORTS\DPD SUMMARY MODELLLING REPORT\REP-VB_SMCC-SBC DPD ISSUE-260914.DOCX
Page 7
Figure 2: AIMSUN Model Zones
4
13
"9.2
1
19

Stockton-on-Tees Borough Council Development Planning DocumentModelling Review
224125-19 | Issue | 25 September 2014
\\GLOBAL\EUROPE\NEWCASTLE\JOBS\220000\224125\19 WEST STOCKTON HOUSING\DOCS\27- REPORTS\DPD SUMMARY MODELLLING REPORT\REP-VB_SMCC-SBC DPD ISSUE-260914.DOCX
Page 8
2.2.4.2 Modelled Time Periods
Section 2.1 earlier identified the peak hours for the network to be 07:45–08:45 in the morning and 16:30–17:30 in the evening. The model has been built to cover the;
AM peak period - 07:30-09:00, and,
PM peak period - 16:15-17:45.
This allowed the inclusion of a 15min warm-up period to build a reasonable level of traffic in the network prior to the start of the peak hours
2.2.4.3 Traffic Demand
The traffic demand was input in the model using Origin-Destination (O-D) matrices. In the absence of Road Side Interview (RSI) or Automatic Number Place Recognition (ANPR) surveys that are normally required for developing O-D matrices, the O-D matrices for the WeSAM were built using a synthetic technique combining the traffic count information and a Furnessing method. The matrix development process for the AM and PM peak hours is described in detail in the WeSAM LMVR.
The benefit of this approach is that the manual control over the manipulation process ensures that no unrealistic changes to the matrix are made in order to match observed traffic flows. This process was undertaken independently for Cars, LGVs and HGVs for both the peak hours. The final matrices that were used in the model are given in Appendix B.
The traffic demand was input in six 15min periods. The AM and PM hourly matrix was factored for each of the six 15min periods so as to represent the temporal distribution throughout the modelled period. In the morning, this temporal distribution peaks during the 15min period starting at 07:45, and in the evening, the distribution peaks during the 15min period starting at 16:30.
Table 2.5 below shows the factors used for the 15min periods for both the peak periods.
Table 2.5: Factors used for 15min Traffic Input Matrices
AM Peak Period (07:30-09:00) PM Peak Period (16:15-17:45)
07:30 22% 16:15 23%
07:45 27% 16:30 26%
08:00 25% 16:45 23.5%
08:15 25% 17:00 25.3%
08:30 23% 17:15 25.2%
08:45 21% 17:30 23%
.

Stockton-on-Tees Borough Council Development Planning DocumentModelling Review
224125-19 | Issue | 25 September 2014
\\GLOBAL\EUROPE\NEWCASTLE\JOBS\220000\224125\19 WEST STOCKTON HOUSING\DOCS\27- REPORTS\DPD SUMMARY MODELLLING REPORT\REP-VB_SMCC-SBC DPD ISSUE-260914.DOCX
Page 9
2.2.5 Calibration
The Calibration of the WeSAM model was undertaken for three aspects;
1. Traffic Matrix Calibration, which is an iterative process that involves the comparison of observed flow and corresponding flow from the O-D matrix to ascertain the fitness of trip matrices to be used in the model as traffic demand.
2. Model Calibration, which involves the adjustment of the following parameters within the model to ensure that best representation of network, vehicle behaviour and traffic demand.
Section characteristics
Vehicle characteristics
Simulation step and reaction time
Behavioural models
Traffic demand profile
3. Assignment Calibration, which uses the Design Manual for Roads and Bridges (DMRB) advised GEH statistic1 as a goodness of fit test to compare two sets of traffic volumes, in this case the modelled flows and observed flows.
Appendix B, that shows the calculated matrices, also shows the matrix calibration results. The comparisons indicate that there are negligible differences in the observed and matrix-calculated flows and therefore the matrices are deemed to be fit for use in the model.
The detail Model calibration process for the WeSAM can be found in the WeSAM LMVR. Table 2.6 shows the overall Assignment Calibration statistics.
Table 2.6: Assignment Calibration Statistics
Criteria Performance
AM PM
% Links with a GEH Statistic of less than 5 100% 100%
% Link flows modelled within 100 vph for flows less than 700 100% 100%
% Link flows modelled within 15% for flows between 700 and 2,700 vph 100% 100%
The table shows that the assignment calibration for the WeSAM model satisfied the required DMRB criteria.
1 DMRB Volume 12 recommends that for a model to be calibrated / validated , 85% of link flows should have a GEH statistic of less than 5 and 100% of links should have a GEH statistic of less than 8.

Stockton-on-Tees Borough Council Development Planning DocumentModelling Review
224125-19 | Issue | 25 September 2014
\\GLOBAL\EUROPE\NEWCASTLE\JOBS\220000\224125\19 WEST STOCKTON HOUSING\DOCS\27- REPORTS\DPD SUMMARY MODELLLING REPORT\REP-VB_SMCC-SBC DPD ISSUE-260914.DOCX
Page 10
2.2.6 Validation
Validation is the process of checking model output against an independently observed dataset to ensure that the calibrated model is robust. The validation of the WeSAM was undertaken in two steps;
1. Link Flow Validation, that uses the DMRB advised GEH criteria for comparing observed and modelled flows, and
2. Journey Time Validation, that compares the observed and modelled journey times for pre-defined routes.
2.2.6.1 Link Flow Validation
The Link Flow Validation is shown in Table 2.7 and 2.8 for the AM and PM peak respectively. It should be noted that the observed flows used in the Validation process are independent to the link flows used for calibration.
Table 2.7: Traffic Flow Validation (vph), AM Peak (08:00 -09:00)
Site Description Direction Observed Data
Modelled Data
Diff %Diff GEH
B1274 Junction Road, west of Blakeston Lane
EB 637 598 -39 -6% 1.6
WB 730 725 -5 -1% 0.2
Harrowgate Lane, south of Marske Lane
NB 765 858 93 12% 3.3
SB 597 676 79 13% 3.1
Yarm Back Lane, north of A66 Elton I/C
NB 335 346 11 3% 0.6
SB 727 772 45 6% 1.6
Table 2.8: Traffic Flow Validation (vph), PM Peak (Average of 16:00 – 17:00 and 17:00 – 18:00)
Site Description Direction Observed Data
Modelled Data
Diff %Diff GEH
B1274 Junction Road, west of Blakeston Lane
EB 706 582 -123 -17% 4.9
WB 690 710 20 3% 0.7
Harrowgate Lane, south of Marske Lane
NB 500 584 84 17% 3.6
SB 746 878 133 18% 4.7
Yarm Back Lane, north of A66 Elton I/C
NB 497 542 45 9% 2.0
SB 469 501 32 7% 1.5
Tables 2.7 and 2.8 indicate that all GEH values are less than 5 during both peak hours, thus meeting the DMRB criteria for link flow validation.

Stockton-on-Tees Borough Council Development Planning DocumentModelling Review
224125-19 | Issue | 25 September 2014
\\GLOBAL\EUROPE\NEWCASTLE\JOBS\220000\224125\19 WEST STOCKTON HOUSING\DOCS\27- REPORTS\DPD SUMMARY MODELLLING REPORT\REP-VB_SMCC-SBC DPD ISSUE-260914.DOCX
Page 11
2.2.6.2 Journey Time Validation
For journey time validation, DMRB Volume 12, Chapter 4 (Table 4.2) recommends that the modelled journey times should be within 15% (or 1 min if higher) of the observed journey times for 85% of the routes or higher. The comparison of the average journey times for the eight routes2 is shown below.
Table 2.9: Journey Time Comparison (mm:ss)
AM Peak PM Peak
Observed Modelled % Diff Observed Modelled % Diff
Route 1 01:34 01:37 4% 01:24 01:14 -11%
Route 2 03:08 03:21 7% 03:10 03:26 9%
Route 3 03:44 03:47 1% 03:44 03:30 -6%
SB Total 08:26 08:44 4% 08:18 08:11 -1%
Route 4 01:04 01:05 1% 05:47 06:03 5%
Route 5 06:26 06:08 -5% 05:54 05:37 -5%
Route 6 03:34 03:52 9% 03:56 04:03 3%
NB Total 11:04 11:05 0% 15:37 15:43 1%
Route 7 04:46 04:28 -6% 01:40 01:32 -8%
Route 8 00:57 00:54 -6% 02:09 02:09 0%
The table shows that during both the peak hours, all modelled journey times satisfy the recommended DMRB criteria. It should be noted that all journey times mentioned above are average values and conditions are sometimes worse than the typical ones modelled.
SBC indicated that the location and extent of queuing that occurred in the model was an accurate representation of average traffic conditions in West Stockton.
Screenshots from the model that show the queuing that occurs during the peak hours are shown in Appendix C.
2 Refer Tables 2.3a and 2.3b for Route Description.

Stockton-on-Tees Borough Council Development Planning DocumentModelling Review
224125-19 | Issue | 25 September 2014
\\GLOBAL\EUROPE\NEWCASTLE\JOBS\220000\224125\19 WEST STOCKTON HOUSING\DOCS\27- REPORTS\DPD SUMMARY MODELLLING REPORT\REP-VB_SMCC-SBC DPD ISSUE-260914.DOCX
Page 12
2.3 Future Model Development
2.3.1 Committed Developments
Various committed developments were identified in the vicinity of the modelled area. These details of these developments are given below.
Table 2.10: Committed Developments in West Stockton
No. Description Development Type Size
1 Tesco Extra Change of use from A1 to D2 3,066 sq.m
2 Blakeston School Mixed Residential 46 units
3 Peacocks Yard Mixed Residential 149 units (80 built)
4 Norton Education Centre Mixed Residential 85 units
5 Redhouse School Change of use -
6 North Tees Hospital Change of use to Mixed Residential 340 units
7 Allens West Mixed Residential Community Facility Retail
845 units 60 bed care home 500 sq.m 250 sq.m
8 NIFCO Production Unit 6,411 sq.m
A plan showing the location of the committed developments is shown in Figure 3.
Following discussions with SBC, it was inferred that the change of land uses at the Tesco and Redhouse School sites are likely to generate more or less similar traffic as the existing land use. As such, no change in trips was assumed for these two sites.
The trip generation for the proposed land use at the North Tees hospital was not available when the study was undertaken. However, SBC informed that the change in land use at this site would potentially have a lower trip generation as compared to the existing land use. The existing trip generation from the zone representing the North Tees hospital site was retained in the forecast year, thus allowing a worst case trip generation scenario for this site.
The trips generated from the rest of committed developments that would travel through the modelled road network are shown in Table 2.11, along with the trip loading points in the model.
The trips from the individual developments were distributed in the model based on existing trip distribution from their corresponding loading point.

Stockton-on-Tees Borough Council Development Planning DocumentModelling Review
224125-19 | Issue | 25 September 2014
\\GLOBAL\EUROPE\NEWCASTLE\JOBS\220000\224125\19 WEST STOCKTON HOUSING\DOCS\27- REPORTS\DPD SUMMARY MODELLLING REPORT\REP-VB_SMCC-SBC DPD ISSUE-260914.DOCX
Page 13
Figure 3: Committed & Proposed Developments’ Locations
Stockton-on-Tees Borough Council Development Planning DocumentModelling Review
224125-19 | Issue | 25 September 2014
\\GLOBAL\EUROPE\NEWCASTLE\JOBS\220000\224125\19 WEST STOCKTON HOUSING\DOCS\27- REPORTS\DPD SUMMARY MODELLLING REPORT\REP-VB_SMCC-SBC DPD ISSUE-260914.DOCX
Page 14
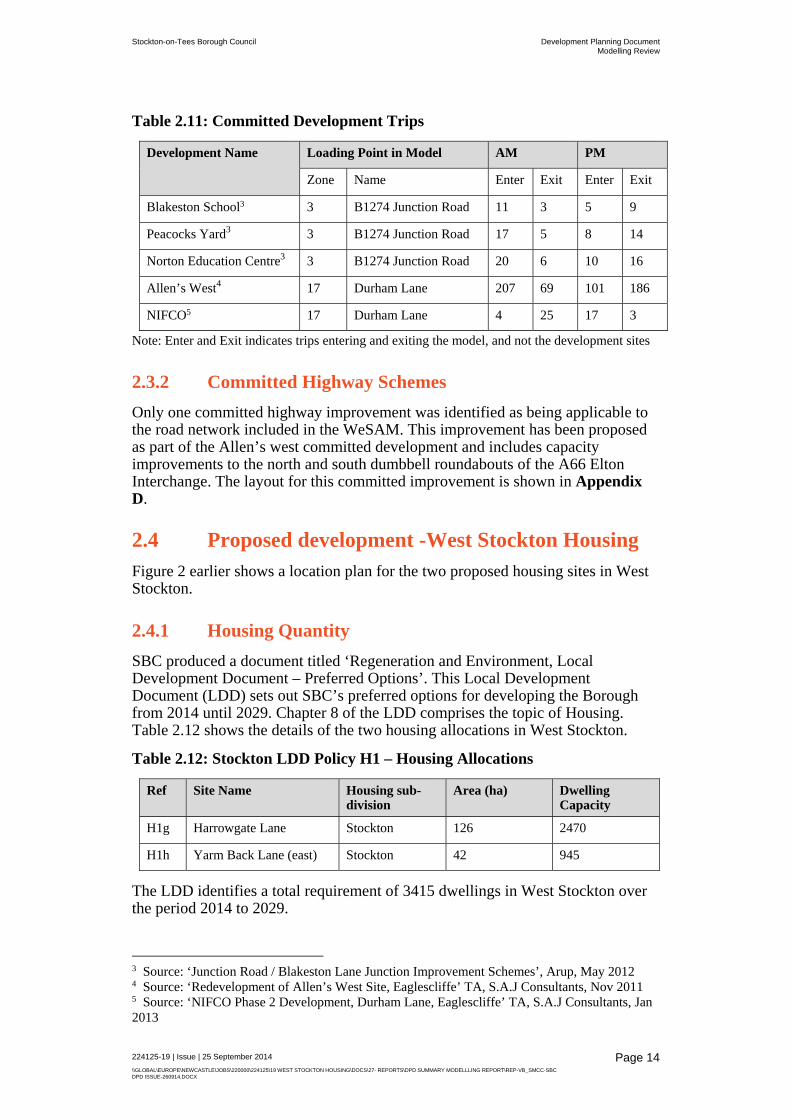
Table 2.11: Committed Development Trips
Development Name Loading Point in Model AM PM
Zone Name Enter Exit Enter Exit
Blakeston School3 3 B1274 Junction Road 11 3 5 9
Peacocks Yard3 3 B1274 Junction Road 17 5 8 14
Norton Education Centre3 3 B1274 Junction Road 20 6 10 16
Allen’s West4 17 Durham Lane 207 69 101 186
NIFCO5 17 Durham Lane 4 25 17 3
Note: Enter and Exit indicates trips entering and exiting the model, and not the development sites
2.3.2 Committed Highway Schemes
Only one committed highway improvement was identified as being applicable to the road network included in the WeSAM. This improvement has been proposed as part of the Allen’s west committed development and includes capacity improvements to the north and south dumbbell roundabouts of the A66 Elton Interchange. The layout for this committed improvement is shown in Appendix D.
2.4 Proposed development -West Stockton Housing Figure 2 earlier shows a location plan for the two proposed housing sites in West Stockton.
2.4.1 Housing Quantity
SBC produced a document titled ‘Regeneration and Environment, Local Development Document – Preferred Options’. This Local Development Document (LDD) sets out SBC’s preferred options for developing the Borough from 2014 until 2029. Chapter 8 of the LDD comprises the topic of Housing. Table 2.12 shows the details of the two housing allocations in West Stockton.
Table 2.12: Stockton LDD Policy H1 – Housing Allocations
Ref Site Name Housing sub-division
Area (ha) Dwelling Capacity
H1g Harrowgate Lane Stockton 126 2470
H1h Yarm Back Lane (east) Stockton 42 945
The LDD identifies a total requirement of 3415 dwellings in West Stockton over the period 2014 to 2029.
3 Source: ‘Junction Road / Blakeston Lane Junction Improvement Schemes’, Arup, May 2012 4 Source: ‘Redevelopment of Allen’s West Site, Eaglescliffe’ TA, S.A.J Consultants, Nov 2011 5 Source: ‘NIFCO Phase 2 Development, Durham Lane, Eaglescliffe’ TA, S.A.J Consultants, Jan 2013

Stockton-on-Tees Borough Council Development Planning DocumentModelling Review
224125-19 | Issue | 25 September 2014
\\GLOBAL\EUROPE\NEWCASTLE\JOBS\220000\224125\19 WEST STOCKTON HOUSING\DOCS\27- REPORTS\DPD SUMMARY MODELLLING REPORT\REP-VB_SMCC-SBC DPD ISSUE-260914.DOCX
Page 15
At a meeting with SBC in August 2013, it was deduced that a proportion of land from the two development sites would be lost to potential highway improvements. As such, it would be impractical to achieve a yield of 3,415 dwellings on the two development sites.
Discussions were undertaken between Arup and SBC to determine the optimum housing yield for West Stockton. Later agreements resulted in the need to test the road network for varying levels of housing with a view to coming to a decision on an acceptable level of impact. It was therefore agreed between Arup and SBC to test the model for the housing numbers shown in Table 2.13.
Table 2.13: Housing Level Options
No. Harrowgate Lane Site Yarm Back Lane Site Total
1 2400 900 3300
2 2200 700 2900
3 2000 500 2500
The full sequence of scenario testing that identified the final housing level was as follows:
i. Due to the congestion in the base model, mitigation improvements were developed for the A177 Durham Road / B1274 Junction Road junction and the YBL/DBL junction (see section 2.3.4 below). This ensured release of the full traffic demand at the westbound diverge and the eastbound merge of the A66 Interchange, a location where improvements were clearly necessary due to the congestion experienced in the base model;
ii. The merge/diverges at the A66/Elton Interchange were improved to appropriate layouts corresponding to the forecast traffic demand and any site constraints (see section 2.3.4. below for more details); and,
iii. The road network created in i. and ii. was then tested for 3,300, 2,900 and 2,500 houses.
Results from this initial assessment indicated that for both the 3,300 and 2,900 houses scenarios, the eastbound merge would experience a level of congestion that would result in;
flow breakdown on the A66 eastbound mainline, and
potential queues that would block the upstream Yarm Back Lane/Darlington Road junction.
It was therefore agreed between Arup and SBC to consider a maximum of 2,500 dwellings in this study for the purpose of finalising the road network mitigations. This included the roundabouts at the top of the A66 Elton Interchange slip roads where unacceptable congestion was being experienced, even for the 2,500 house scenario.
It should be noted that the 2,500 dwellings assumed for the West Stockton site were split with 2,000 dwellings being assumed on the Harrowgate Lane site and the remaining 500 dwellings on the Yarm Back Lane site. The latter site has a

Stockton-on-Tees Borough Council Development Planning DocumentModelling Review
224125-19 | Issue | 25 September 2014
\\GLOBAL\EUROPE\NEWCASTLE\JOBS\220000\224125\19 WEST STOCKTON HOUSING\DOCS\27- REPORTS\DPD SUMMARY MODELLLING REPORT\REP-VB_SMCC-SBC DPD ISSUE-260914.DOCX
Page 16
greater traffic impact per dwelling (due to its proximity) on the A66 and Elton Interchange.
For the purpose of this study, the Harrowgate Lanes site has been divided into;
‘North’ site north of Letch Lane, and
‘Central’ site south of Letch Lane.
At the time the forecasting study was being undertaken, the Co-Operative Group (Co-op) was considering developing the North site. The proposal is for a residential development of 350 dwellings adjacent to the Horse and Jockey pub. The North site is also referred to as the ‘Co-op’ site.
Table 2.14 summarises the household numbers & locations in West Stockton.
Table 2.14 Housing Locations & Sizes
Site Name/Location Dwellings
Harrowgate Lane North 350
Harrowgate Lane Central 1,650
Yarm Back Lane 500
Total 2,500
2.4.2 Trip Generation
In August 2013 Curtins Consulting, on behalf of the Co-operative group, produced a Transport Assessment (TA) in support of the planning application for the development of 350 dwellings on the Co-Op site. The TA mentioned a set of trip rates that were derived from TRICS software and are shown in Table 3.3.
Additionally, the Highway Agency’s (HA) PENELOPE model data was made available to Arup and this data contained average trip rates for West Stockton.
A third set of trip rates were obtained from the data provided by Tees Valley United (TVU) for West Stockton from the strategic Tees Valley TRIPS Model (TVM).
The HA and TVM trip rates are also shown in Table 2.15.
Table 2.15: Peak Hour Trip Rates
Source AM PM
Arr Dep Arr Dep
Curtins TA (TRICS) 0.155 0.413 0.388 0.237
Highways Agency 0.16 0.43 0.390 0.240
Tees Valley Model 0.156 0.406 0.376 0.227
Whilst the HA and TVM average trip rates for the overall West Stockton area are from studies undertaken at strategic level, the Curtins TA trip rates were derived

Stockton-on-Tees Borough Council Development Planning DocumentModelling Review
224125-19 | Issue | 25 September 2014
\\GLOBAL\EUROPE\NEWCASTLE\JOBS\220000\224125\19 WEST STOCKTON HOUSING\DOCS\27- REPORTS\DPD SUMMARY MODELLLING REPORT\REP-VB_SMCC-SBC DPD ISSUE-260914.DOCX
Page 17
from TRICS specifically for the Co-op site. However, the similarity between the three sets of trip rates is evident from the above table.
On further review SBC advised that, for the sole purpose of the WeSAM model, the Curtins TA trip rates were appropriate average6 for the West Stockton area. As such, the Curtins TA trip rates were used to determine trip generation from the Harrowgate Lane site, as well as the Yarm Back Lane site. Table 2.16 shows the trip generation from the proposed development sites.
Table 2.16: Proposed Housing Development Trips
Development Location
Loading Point in Model AM PM
Zone Name Arr Dep Arr Dep
Harrowgate Lane 20 Harrowgate Lane North 54 145 136 83
21 & 22 Harrowgate Lane Central 256 681 640 391
Yarm Back Lane 23 YBL Site Access 80 215 195 120
2.4.3 Trip Distribution
The 2001 Census – UK travel flows data was obtained from the Nomis website7 with Bishopgarth ward in West Stockton as the ‘area of residence’. The trip distribution for the Harrowgate Lane Central site was determined from the Census data. Thereafter, adjustments were made to obtain the distributions for the Co-Op site and Yarm Back Lane site which are likely to have different assignment through the network based on their locations and proximity to the A177 and A66 respectively. The final trip distributions for the three locations are given in Table 2.17 on the next page.
The table indicates that a total of 60.1% of the Yarm Back Lane site traffic would use the A66 Elton Interchange as compared to 25.5% from Harrowgate Lane Central site, and 20.5% from the Harrowgate Lane North site. Therefore, the same number of houses on both the Harrowgate Lane and the Yarm Back Lane sites would assign different amounts of traffic towards the A66 Elton Interchange, with the traffic levels at this Interchange being considerably more from the Yarm Back Lane site.
The WeSAM study has considered 500 households on the Yarm Back Lane site. If the yield on the Yarm Back Lane site was to increase then the yield on the Harrowgate Lane site would have to reduce by a greater amount than this increase. This is to maintain the overall traffic levels from the total West Stockton development at the A66 Elton Interchange. In such a scenario, the total housing yield for the West Stockton area would effectively be less than the 2500 households assumed in the study.
6 The average trip rates mentioned in this study are for the entire West Stockton area as a whole. Individual developments within West Stockton are likely to have varying trip rates based on their location within the site and their proximity to the strategic road network. 7 http://www.nomisweb.co.uk

Stockton-on-Tees Borough Council Development Planning DocumentModelling Review
224125-19 | Issue | 25 September 2014
\\GLOBAL\EUROPE\NEWCASTLE\JOBS\220000\224125\19 WEST STOCKTON HOUSING\DOCS\27- REPORTS\DPD SUMMARY MODELLLING REPORT\REP-VB_SMCC-SBC DPD ISSUE-260914.DOCX
Page 18
Table 2.17: Trip Distribution for West Stockton Housing Development
Origin/Destination Harrowgate Lane Site Yarm Back
Lane Site North (Co-Op) Central
A177 Durham Rd (N) 3.6% 3.6% 3.6%
B1274 Junction Road 32.8% 19.6% 9.8%
A177 Durham Rd (S) 32.3% 19.0% 1.0%
Letch Lane 1.2% 1.2% 1.2%
Scurfield Rd 2.7% 2.7% 2.7%
Darlington Back Lane (E) 2.7% 13.5% 10.8%
Bishopton Road West 2.7% 13.3% 9.3%
Darlington Back Lane (W) 1.6% 1.6% 1.6%
A66(E) 11.8% 16.8% 51.4%
Durham Lane 4.2% 4.2% 4.2%
A66 (W) 4.5% 4.5% 4.5%
2.4.4 Proposed Highway Improvements
Highway improvements were designed to relieve existing traffic congestion on the road network and to mitigate the traffic impact of the West Stockton Housing. The junctions/locations where improvements were considered are listed below.
A177 Durham Road / B1274 Junction Road
Darlington Back Lane / Yarm Back Lane
A66 Elton Interchange eastbound Merge and westbound Diverge
A66 Elton Interchange North and South junctions
An iterative design development process to determine optimum improvement layouts for the above junctions/locations was undertaken by Arup which involved continuous discussions with SBC.
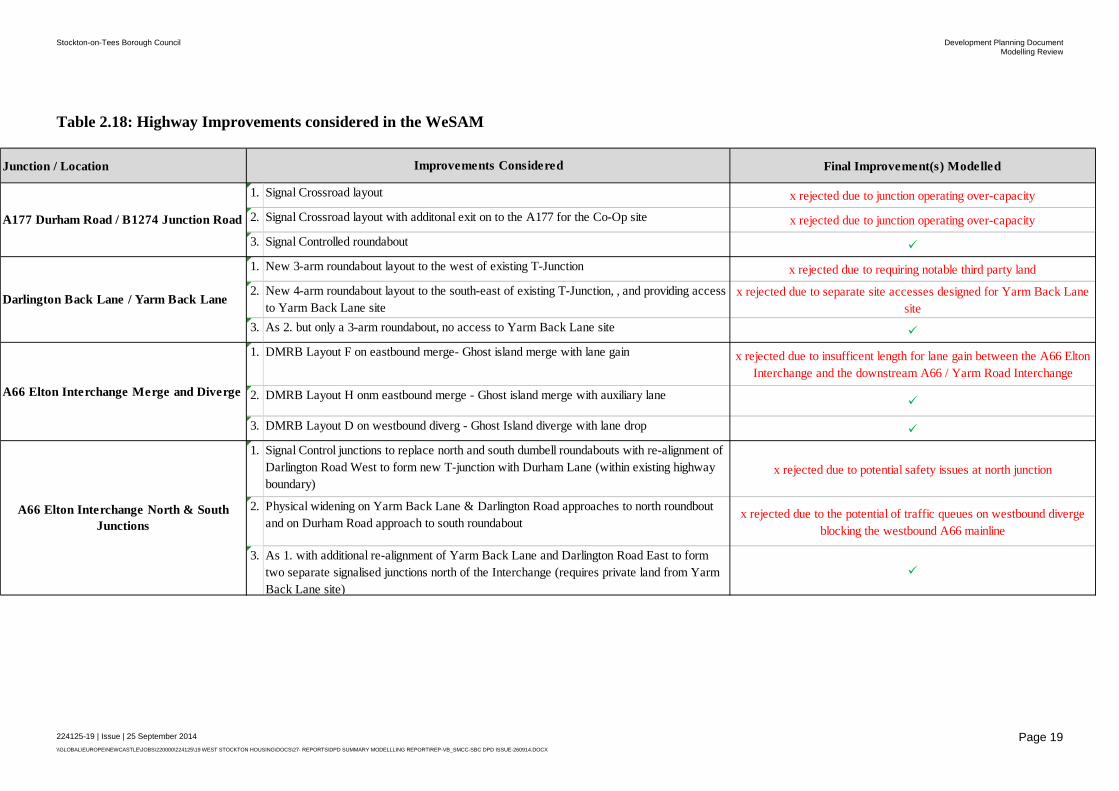
The details of the improvements considered at each of the above junctions/locations are given in Table 2.18.
Following the initial testing of the various layouts in the AIMSUN model, a final set of preferred improvements was determined and these are also shown in Appendix D.
The improvement at the A66 Interchange supersedes the Allen’s West committed highway scheme mentioned in Section 2.3.2 earlier.
Stockton-on-Tees Borough Council Development Planning DocumentModelling Review
224125-19 | Issue | 25 September 2014
\\GLOBAL\EUROPE\NEWCASTLE\JOBS\220000\224125\19 WEST STOCKTON HOUSING\DOCS\27- REPORTS\DPD SUMMARY MODELLLING REPORT\REP-VB_SMCC-SBC DPD ISSUE-260914.DOCX
Page 19
Table 2.18: Highway Improvements considered in the WeSAM
Junction / Location Final Improvement(s) Modelled
1. Signal Crossroad layout x rejected due to junction operating over-capacity
2. Signal Crossroad layout with additonal exit on to the A177 for the Co-Op site x rejected due to junction operating over-capacity
3. Signal Controlled roundabout
1. New 3-arm roundabout layout to the west of existing T-Junction x rejected due to requiring notable third party land
2. New 4-arm roundabout layout to the south-east of existing T-Junction, , and providing access to Yarm Back Lane site
x rejected due to separate site accesses designed for Yarm Back Lane site
3. As 2. but only a 3-arm roundabout, no access to Yarm Back Lane site
1. DMRB Layout F on eastbound merge- Ghost island merge with lane gain x rejected due to insufficent length for lane gain between the A66 Elton Interchange and the downstream A66 / Yarm Road Interchange
2. DMRB Layout H onm eastbound merge - Ghost island merge with auxiliary lane
3. DMRB Layout D on westbound diverg - Ghost Island diverge with lane drop
1. Signal Control junctions to replace north and south dumbell roundabouts with re-alignment of Darlington Road West to form new T-junction with Durham Lane (within existing highway boundary)
x rejected due to potential safety issues at north junction
2. Physical widening on Yarm Back Lane & Darlington Road approaches to north roundbout and on Durham Road approach to south roundabout
x rejected due to the potential of traffic queues on westbound diverge blocking the westbound A66 mainline
3. As 1. with additional re-alignment of Yarm Back Lane and Darlington Road East to form two separate signalised junctions north of the Interchange (requires private land from Yarm Back Lane site)
Darlington Back Lane / Yarm Back Lane
Improvements Considered
A177 Durham Road / B1274 Junction Road
A66 Elton Interchange Merge and Diverge
A66 Elton Interchange North & South Junctions
Stockton-on-Tees Borough Council Development Planning DocumentModelling Review
224125-19 | Issue | 25 September 2014
\\GLOBAL\EUROPE\NEWCASTLE\JOBS\220000\224125\19 WEST STOCKTON HOUSING\DOCS\27- REPORTS\DPD SUMMARY MODELLLING REPORT\REP-VB_SMCC-SBC DPD ISSUE-260914.DOCX
Page 20
2.4.5 Supplementary Highway Schemes
The TA produced by Curtins for the Co-op site had proposed modifications to the three-arm Harrowgate Lane / Einstein Way signal junction. A fourth arm is proposed on the north side to form a signal crossroads layout. The new arm will form the site access for the residential site. The layout is shown in Appendix D.
For the purpose of assigning the West Stockton housing development traffic, new access points at certain locations of the existing road network were necessary. For the Harrowgate Lane Central site these access points included;
3-arm Priority junction south of Leam Lane
3-arm Roundabout junction north of Marske Lane
4-arm Roundabout junction to tie in with Leam Lane
For the Yarm Back Lane site, two 3-arm Priority junctions were included to provide access to the development site.
Screenshots from the model showing the access junctions for the Harrowgate Lane Central site and the Yarm Back Lane site are given in Appendix D.
2.5 Forecast Year Assessment
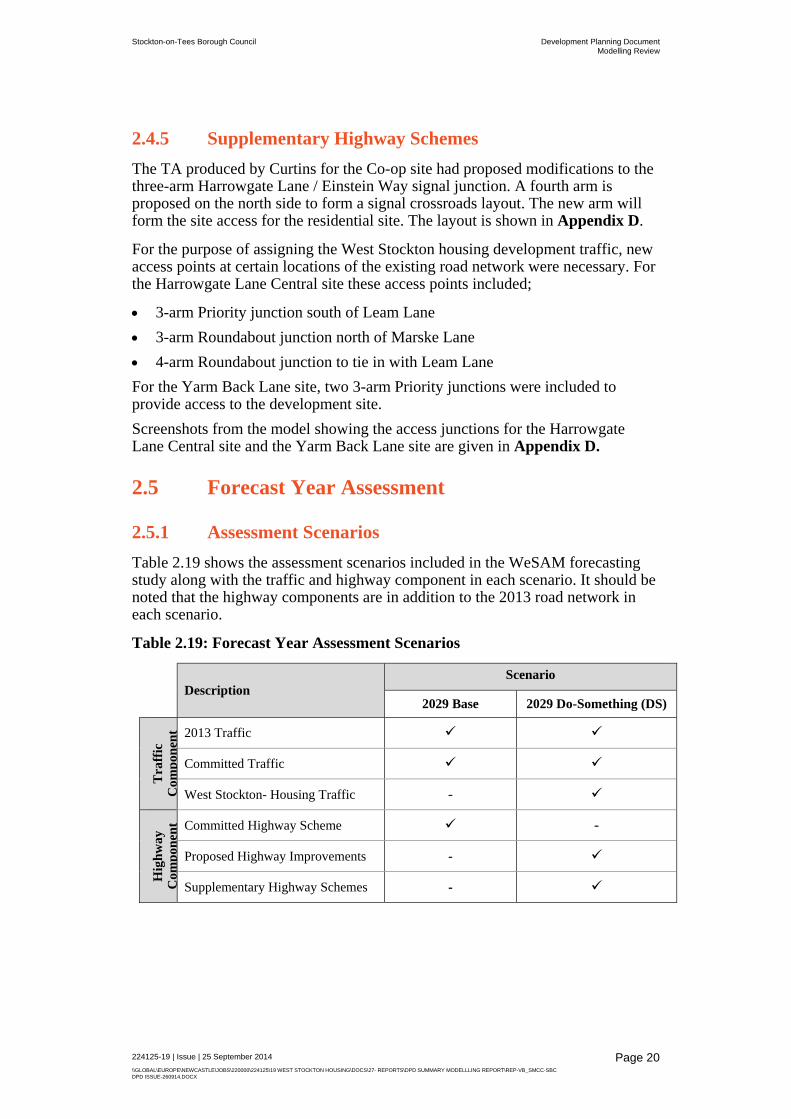
2.5.1 Assessment Scenarios
Table 2.19 shows the assessment scenarios included in the WeSAM forecasting study along with the traffic and highway component in each scenario. It should be noted that the highway components are in addition to the 2013 road network in each scenario.
Table 2.19: Forecast Year Assessment Scenarios
Description
Scenario
2029 Base 2029 Do-Something (DS)
Tra
ffic
C
omp
onen
t 2013 Traffic
Committed Traffic
West Stockton- Housing Traffic -
Hig
hway
C
omp
onen
t Committed Highway Scheme -
Proposed Highway Improvements -
Supplementary Highway Schemes -

Stockton-on-Tees Borough Council Development Planning DocumentModelling Review
224125-19 | Issue | 25 September 2014
\\GLOBAL\EUROPE\NEWCASTLE\JOBS\220000\224125\19 WEST STOCKTON HOUSING\DOCS\27- REPORTS\DPD SUMMARY MODELLLING REPORT\REP-VB_SMCC-SBC DPD ISSUE-260914.DOCX
Page 21
2.6 Traffic Demand
2.6.1 Traffic Growth
The table below shows the growth factors obtained from Department of Transport’s (DfT) NTM-TEMPro8 data for the West Stockton area. The table also shows the potential growth due to the committed and a proposed development of 2500 households.
Table 2.20: 2013 to 2029 Traffic Growth Factors
Peak Hour
NTM-Tempro Growth (Average Weekday)
Proposed Development Only Growth
Proposed + Committed Development Growth
AM Peak 1.20
1.15 1.18
PM Peak 1.17 1.21
As can be seen from the table, the effective traffic growth due to the combination of the 2,500 household proposed development and the committed development is approximately the traffic growth estimated from NTM-TEMPro between 2013 and 2029 for West Stockton. Hence, whilst developing the 2029 year background traffic demand, traffic growth of 1.00 has been used. The trip generation from the committed and proposed development is assumed to constitute all of the traffic growth expected in this area of West Stockton for all the DS scenarios.
2.6.2 Traffic Demand Input
The traffic demand was input in the model for the two scenarios using traffic matrices in line with the WeSAM LMVR. Individual matrices were developed for the committed development traffic and for the West Stockton housing traffic.
The 2029 Base traffic demand included the 2013 matrices from the LMVR and the committed development traffic matrices. The 2029 DS scenario included the 2029 Base matrices and in addition the West Stockton housing traffic matrices.
2.6.3 Traffic Demand Profile
The traffic demand for the 2029 Base scenario was input in six 15 minute periods using the same factors as the base model (shown earlier in Table 2.5).
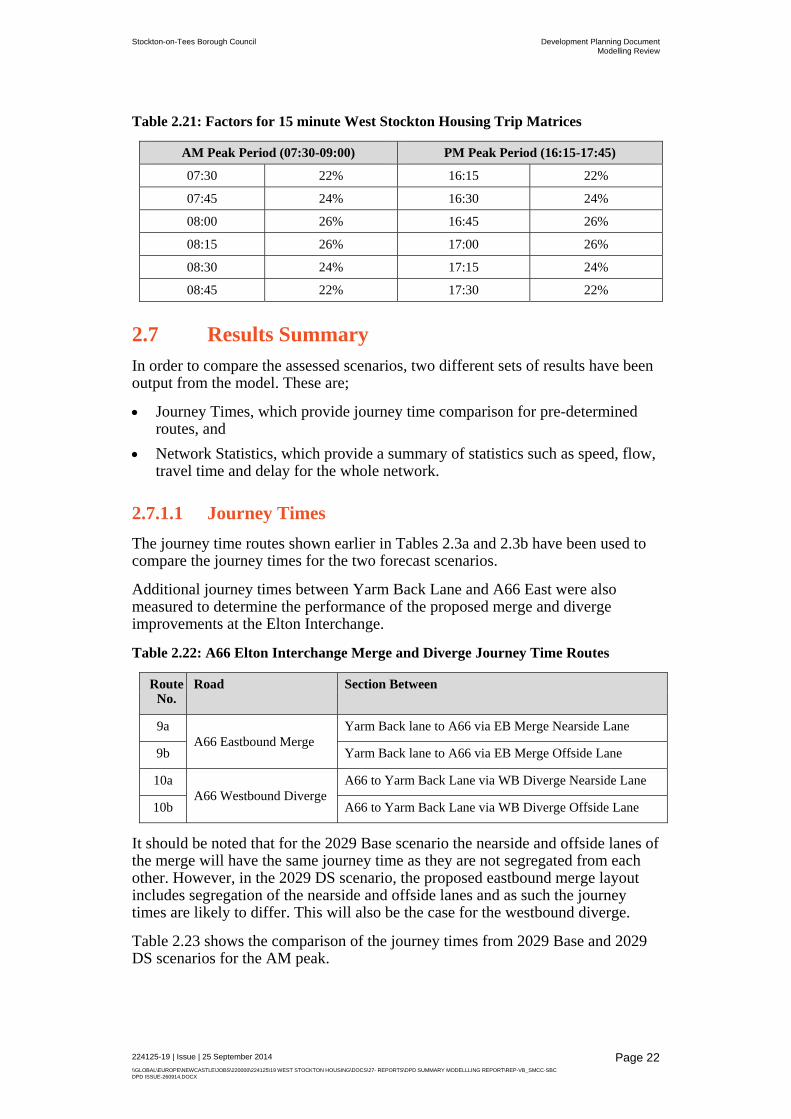
For the West Stockton housing traffic, the AM and PM hourly matrix was factored for each of the six 15 minute periods to represent a normal distribution throughout the modelled period. Table 2.21 below shows the factors used for the 15 minute periods for both the peak periods.
8 NTM: National Transport Model, TEMPro: Trip End Model Presentation Program.
Stockton-on-Tees Borough Council Development Planning DocumentModelling Review
224125-19 | Issue | 25 September 2014
\\GLOBAL\EUROPE\NEWCASTLE\JOBS\220000\224125\19 WEST STOCKTON HOUSING\DOCS\27- REPORTS\DPD SUMMARY MODELLLING REPORT\REP-VB_SMCC-SBC DPD ISSUE-260914.DOCX
Page 22
Table 2.21: Factors for 15 minute West Stockton Housing Trip Matrices
AM Peak Period (07:30-09:00) PM Peak Period (16:15-17:45)
07:30 22% 16:15 22%
07:45 24% 16:30 24%
08:00 26% 16:45 26%
08:15 26% 17:00 26%
08:30 24% 17:15 24%
08:45 22% 17:30 22%
2.7 Results Summary In order to compare the assessed scenarios, two different sets of results have been output from the model. These are;
Journey Times, which provide journey time comparison for pre-determined routes, and
Network Statistics, which provide a summary of statistics such as speed, flow, travel time and delay for the whole network.
2.7.1.1 Journey Times
The journey time routes shown earlier in Tables 2.3a and 2.3b have been used to compare the journey times for the two forecast scenarios.
Additional journey times between Yarm Back Lane and A66 East were also measured to determine the performance of the proposed merge and diverge improvements at the Elton Interchange.
Table 2.22: A66 Elton Interchange Merge and Diverge Journey Time Routes
Route No.
Road Section Between
9a A66 Eastbound Merge
Yarm Back lane to A66 via EB Merge Nearside Lane
9b Yarm Back lane to A66 via EB Merge Offside Lane
10a A66 Westbound Diverge
A66 to Yarm Back Lane via WB Diverge Nearside Lane
10b A66 to Yarm Back Lane via WB Diverge Offside Lane
It should be noted that for the 2029 Base scenario the nearside and offside lanes of the merge will have the same journey time as they are not segregated from each other. However, in the 2029 DS scenario, the proposed eastbound merge layout includes segregation of the nearside and offside lanes and as such the journey times are likely to differ. This will also be the case for the westbound diverge.
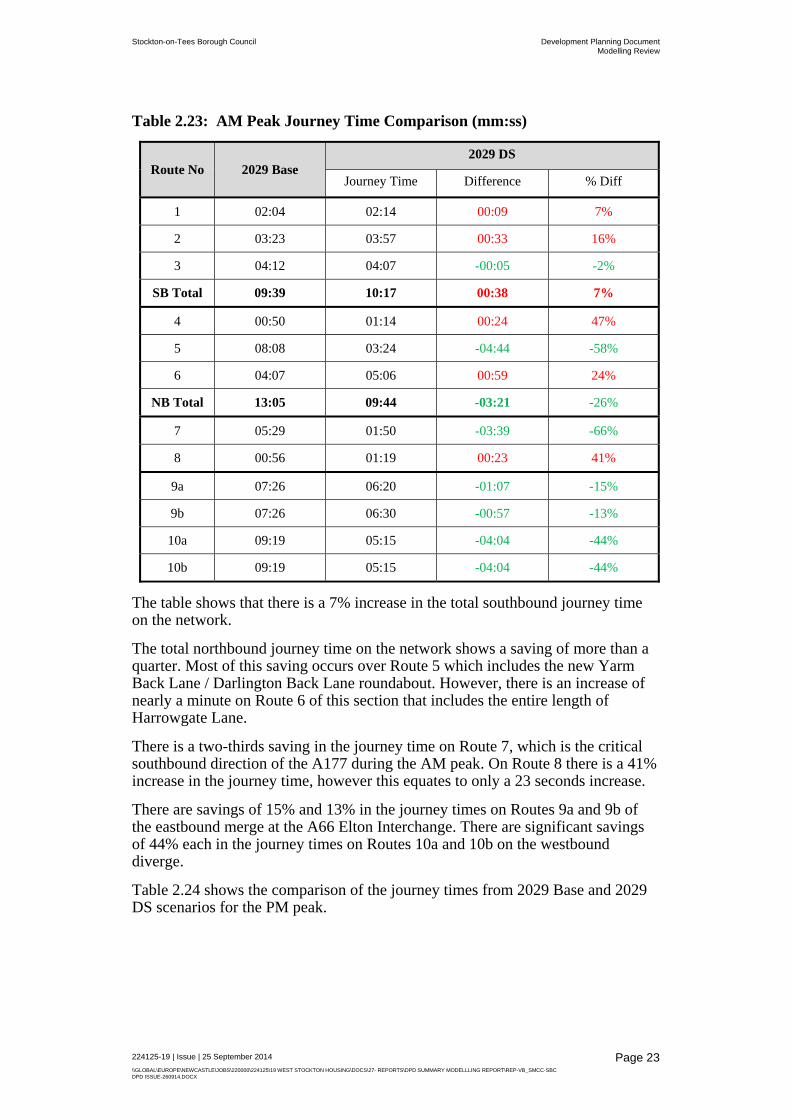
Table 2.23 shows the comparison of the journey times from 2029 Base and 2029 DS scenarios for the AM peak.
Stockton-on-Tees Borough Council Development Planning DocumentModelling Review
224125-19 | Issue | 25 September 2014
\\GLOBAL\EUROPE\NEWCASTLE\JOBS\220000\224125\19 WEST STOCKTON HOUSING\DOCS\27- REPORTS\DPD SUMMARY MODELLLING REPORT\REP-VB_SMCC-SBC DPD ISSUE-260914.DOCX
Page 23
Table 2.23: AM Peak Journey Time Comparison (mm:ss)
Route No 2029 Base 2029 DS
Journey Time Difference % Diff
1 02:04 02:14 00:09 7%
2 03:23 03:57 00:33 16%
3 04:12 04:07 -00:05 -2%
SB Total 09:39 10:17 00:38 7%
4 00:50 01:14 00:24 47%
5 08:08 03:24 -04:44 -58%
6 04:07 05:06 00:59 24%
NB Total 13:05 09:44 -03:21 -26%
7 05:29 01:50 -03:39 -66%
8 00:56 01:19 00:23 41%
9a 07:26 06:20 -01:07 -15%
9b 07:26 06:30 -00:57 -13%
10a 09:19 05:15 -04:04 -44%
10b 09:19 05:15 -04:04 -44%
The table shows that there is a 7% increase in the total southbound journey time on the network.
The total northbound journey time on the network shows a saving of more than a quarter. Most of this saving occurs over Route 5 which includes the new Yarm Back Lane / Darlington Back Lane roundabout. However, there is an increase of nearly a minute on Route 6 of this section that includes the entire length of Harrowgate Lane.
There is a two-thirds saving in the journey time on Route 7, which is the critical southbound direction of the A177 during the AM peak. On Route 8 there is a 41% increase in the journey time, however this equates to only a 23 seconds increase.
There are savings of 15% and 13% in the journey times on Routes 9a and 9b of the eastbound merge at the A66 Elton Interchange. There are significant savings of 44% each in the journey times on Routes 10a and 10b on the westbound diverge.
Table 2.24 shows the comparison of the journey times from 2029 Base and 2029 DS scenarios for the PM peak.

Stockton-on-Tees Borough Council Development Planning DocumentModelling Review
224125-19 | Issue | 25 September 2014
\\GLOBAL\EUROPE\NEWCASTLE\JOBS\220000\224125\19 WEST STOCKTON HOUSING\DOCS\27- REPORTS\DPD SUMMARY MODELLLING REPORT\REP-VB_SMCC-SBC DPD ISSUE-260914.DOCX
Page 24
Table 2.24: PM Peak Journey Time Comparison (mm:ss)
Route No 2029 Base 2029 DS
Journey Time Difference % Diff
1 01:25 01:27 00:02 2%
2 03:27 03:57 00:30 14%
3 03:29 04:26 00:57 28%
SB Total 08:21 09:50 01:29 18%
4 01:18 02:06 00:48 62%
5 06:50 03:19 -03:31 -51%
6 04:22 04:23 00:00 0%
NB Total 12:31 09:48 -02:42 -22%
7 01:38 02:13 00:34 35%
8 07:11 01:51 -05:20 -74%
9a 04:03 04:24 00:21 8%
9b 04:03 04:29 00:26 11%
10a 08:32 05:03 -03:28 -41%
10b 08:32 05:07 -03:25 -40%
The table shows that there is approximately 1.5 minute increase in the total southbound journey time which equates to an 18% increase. Nearly a minute of this increase occurs on Route 3 that includes the southbound approach to the new signal layout at the A66 Elton Interchange. The signal settings at this junction, that are required to keep overall traffic operations optimum, could potentially be the cause of this delay.
The total northbound journey time on the network shows a saving of just under a quarter. Once again, most of this saving occurs over Route 5 that includes the new Yarm Back Lane / Darlington Back Lane roundabout.
On Route 7 there is a 35% increase in the journey time, however this equates to only a 34 seconds increase. Route 8, which represents the critical northbound direction of the A177 in the PM peak, shows a saving of nearly three-quarters in its journey time.
There are minor increases of 8% and 11% in the journey times on Routes 9a and 9b, both of which are less than 30 seconds. There are significant savings of around 40% in the journey times on both Route 10a and Route 10b.
2.7.1.2 Network Statistics
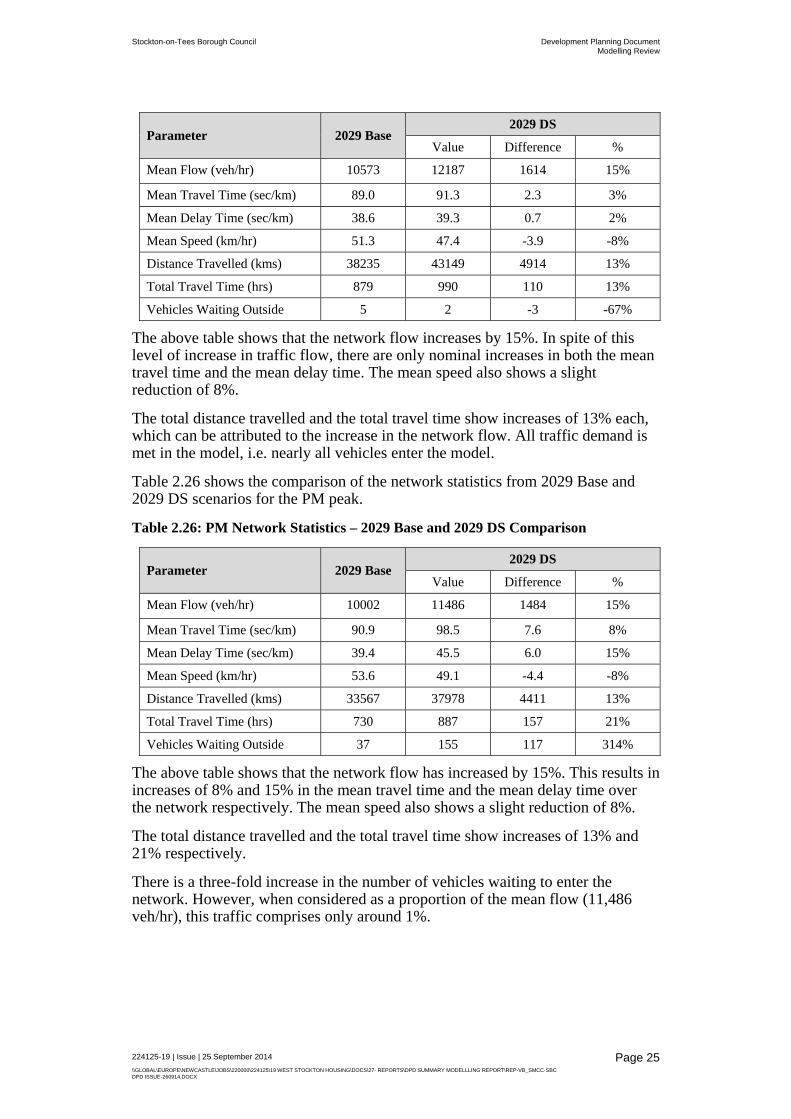
Table 2.25 shows the comparison of the network statistics from 2029 Base and 2029 DS scenarios for the AM peak.
Table 2.25: AM Network Statistics – 2029 Base and 2029 DS Comparison
Stockton-on-Tees Borough Council Development Planning DocumentModelling Review
224125-19 | Issue | 25 September 2014
\\GLOBAL\EUROPE\NEWCASTLE\JOBS\220000\224125\19 WEST STOCKTON HOUSING\DOCS\27- REPORTS\DPD SUMMARY MODELLLING REPORT\REP-VB_SMCC-SBC DPD ISSUE-260914.DOCX
Page 25
Parameter 2029 Base 2029 DS
Value Difference %
Mean Flow (veh/hr) 10573 12187 1614 15%
Mean Travel Time (sec/km) 89.0 91.3 2.3 3%
Mean Delay Time (sec/km) 38.6 39.3 0.7 2%
Mean Speed (km/hr) 51.3 47.4 -3.9 -8%
Distance Travelled (kms) 38235 43149 4914 13%
Total Travel Time (hrs) 879 990 110 13%
Vehicles Waiting Outside 5 2 -3 -67%
The above table shows that the network flow increases by 15%. In spite of this level of increase in traffic flow, there are only nominal increases in both the mean travel time and the mean delay time. The mean speed also shows a slight reduction of 8%.
The total distance travelled and the total travel time show increases of 13% each, which can be attributed to the increase in the network flow. All traffic demand is met in the model, i.e. nearly all vehicles enter the model.
Table 2.26 shows the comparison of the network statistics from 2029 Base and 2029 DS scenarios for the PM peak.
Table 2.26: PM Network Statistics – 2029 Base and 2029 DS Comparison
Parameter 2029 Base 2029 DS
Value Difference %
Mean Flow (veh/hr) 10002 11486 1484 15%
Mean Travel Time (sec/km) 90.9 98.5 7.6 8%
Mean Delay Time (sec/km) 39.4 45.5 6.0 15%
Mean Speed (km/hr) 53.6 49.1 -4.4 -8%
Distance Travelled (kms) 33567 37978 4411 13%
Total Travel Time (hrs) 730 887 157 21%
Vehicles Waiting Outside 37 155 117 314%
The above table shows that the network flow has increased by 15%. This results in increases of 8% and 15% in the mean travel time and the mean delay time over the network respectively. The mean speed also shows a slight reduction of 8%.
The total distance travelled and the total travel time show increases of 13% and 21% respectively.
There is a three-fold increase in the number of vehicles waiting to enter the network. However, when considered as a proportion of the mean flow (11,486 veh/hr), this traffic comprises only around 1%.

Stockton-on-Tees Borough Council Development Planning DocumentModelling Review
224125-19 | Issue | 25 September 2014
\\GLOBAL\EUROPE\NEWCASTLE\JOBS\220000\224125\19 WEST STOCKTON HOUSING\DOCS\27- REPORTS\DPD SUMMARY MODELLLING REPORT\REP-VB_SMCC-SBC DPD ISSUE-260914.DOCX
Page 26
2.8 WeSAM Summary
2.8.1 Base Model
Following the model validation tests, the WeSAM model was considered to meet the DMRB criteria. It should be noted that a key feature/need for the West Stockton model was the ability to model the queues at critical locations, caused by ‘tidal’ traffic flows. This was achieved through validating the morning and evening peak period journey times within the model against observed journey times. SBC also affirmed that the location and extent of queuing that formed in the model was realistic and accurately represented average traffic conditions in West Stockton.
The model was therefore considered fit for its intended purpose, which was to model the traffic impact caused by proposed developments within West Stockton. Advice should be sought from Arup and SBC before utilising the model for any other purpose than what it has been developed for.
2.8.2 Future Model Assessment
The WeSAM forecasting study outlines the committed and proposed improvement schemes as well as developments to be included in the future year model. The study also provides a methodology for background traffic growth, committed development traffic and traffic distribution over the network.
The main focus of the forecasting study was to determine the efficacy of a set of highway improvements that were considered vital for mitigating the impact of the West Stockton housing development. The assessment was undertaken for a future year of 2029 which is when all proposed development is estimated to be built.
The study shows that in 2029;
1. The northbound section of the network journey time route that includes the Yarm Back Lane / Darlington Back Lane roundabout shows a significant saving in journey time during both the peak hours. This indicates that the improvement not only improves the existing congestion at this junction but also successfully mitigates the impact of the additional housing traffic.
2. The proposed improvement at the A177 Durham Road / Harrowgate Lane roundabout results in significant journey time savings on A177 in the critical directions during the peak hours, i.e. southbound in the AM peak and northbound in the PM peak.
3. With the eastbound merge improvement in place at the A66 Elton Interchange, there is some amount of saving in the AM peak journey times over this section, and a marginal increase in journey times during the PM peak.
4. The westbound diverge improvement at the A66 Elton Interchange results in significant savings in journey times on this section during both the peak hours.
5. The network statistics show that the traffic increases by 15% due to the proposed West Stockton development during both the peak hours. However there is little impact in the key parameters such as mean speed and mean

Stockton-on-Tees Borough Council Development Planning DocumentModelling Review
224125-19 | Issue | 25 September 2014
\\GLOBAL\EUROPE\NEWCASTLE\JOBS\220000\224125\19 WEST STOCKTON HOUSING\DOCS\27- REPORTS\DPD SUMMARY MODELLLING REPORT\REP-VB_SMCC-SBC DPD ISSUE-260914.DOCX
Page 27
travel time during the AM peak hour and marginal worsening during the PM peak hour. Nearly all the additional demand is met during the AM peak hour but during the PM peak hour, there is a nominal increase in the number of vehicles waiting outside the network. Compared to the total hourly demand, this is considered to be a relatively small value.
Additionally, the visual inspection of the model showed that;
6. During the AM peak hour, there is occasional congestion on Harrowgate Lane near Scurfield Road. The cause of this congestion is a combination of;
Right turners into Scurfield Road blocking the northbound ahead traffic, and
Pedestrian Crossing operations south of Scurfield Road.
With the increased level of traffic on Harrowgate Lane due to the additional housing trips, the queue that occurs near Scurfield Road quickly extends beyond the northern site access of the Harrowgate Central site, occasionally reaching up to Bishopgarth School. An alternative route through the Harrowgate Lane housing development site could be considered to mitigate this congestion on Harrowgate Lane.
7. The five new site accesses operate without any notable issues.
From the findings of the WeSAM study it was concluded that;
The highway improvements identified in the study would successfully relieve traffic congestion at critical locations during both peak hours even with the additional traffic generation from the proposed West Stockton Housing development.
There would be very little impact in the network wide traffic conditions during the AM peak hour, and only a marginal worsening during the PM peak hour.
Harrowgate Lane is likely to experience occasional northbound traffic congestion between Scurfield Road and Bishopgarth School during the AM peak hour.
SBC have informed that there is a possibility of an alternative route through the Harrowgate Lane site that would assist in relieving any future traffic congestion on Harrowgate Lane itself. Any potential benefit/impact of such an alternative route needs to be tested.

Stockton-on-Tees Borough Council Development Planning DocumentModelling Review
224125-19 | Issue | 25 September 2014
\\GLOBAL\EUROPE\NEWCASTLE\JOBS\220000\224125\19 WEST STOCKTON HOUSING\DOCS\27- REPORTS\DPD SUMMARY MODELLLING REPORT\REP-VB_SMCC-SBC DPD ISSUE-260914.DOCX
Page 28
3 South Yarm
3.1 Introduction A traffic model for the Yarm and Ingleby Barwick road network was developed by Arup in 2012 using the traffic micro-simulation software AIMSUN.
The Yarm and Ingleby Barwick AIMSUN Model (YIBAM) provides a tool that has been used to determine the traffic impact of potential housing developments and to inform the requirement for future highway interventions within Yarm and Ingleby Barwick.
The study was undertaken in two phases and separate documents were provided that describe the elements of these two phases. These documents are:
YIBAM Local Model Validation Report (LMVR) – April 2013, and
YIBAM Forecasting Report – April 2013.
This chapter details the chronology of the overall study and describes the various stages during the course of the study. This report should be read in conjunction with the aforementioned documents wherever referenced.
3.2 Base Model Development
3.2.1 Base Year (2013)
The YIBAM was developed in 2012, this also forms the base year for the model. The key requisite of the base model development stage was to develop a calibrated and validated model that replicates existing traffic conditions in Yarm and Ingleby Barwick for the AM and PM peak periods.
3.2.2 Study Area The modelled area was established to cover both Yarm and Ingleby Barwick. The vast proportion of trips that are generated within Yarm are destined for locations within the rest of the Tees Valley to the north. The choice of routes for this traffic is therefore either;
the A67 via Yarm Bridge,
The A19 via the A67 south and Crathorne,
The A19 or the A66 via Ingleby Barwick.
There are no bottlenecks on the local road network, beyond Yarm, on the A67 south to the Highways Agency maintained Crathorne interchange. Therefore the extents of the model needed to cover the bottlenecks of the A67 Yarm High Street / Yarm Bridge, together with the road network within Ingleby Barwick (IB). The modelled area is shown in Figure 4 below.

Stockton-on-Tees Borough Council Development Planning DocumentModelling Review
224125-19 | Issue | 25 September 2014
\\GLOBAL\EUROPE\NEWCASTLE\JOBS\220000\224125\19 WEST STOCKTON HOUSING\DOCS\27- REPORTS\DPD SUMMARY MODELLLING REPORT\REP-VB_SMCC-SBC DPD ISSUE-260914.DOCX
Page 29
Figure 4: Yarm and Ingleby Barwick Model Area
The A67 Yarm High Street together with Yarm Bridge, shown in Figure 2 below, acts as a major bottleneck for a number of reasons.
Firstly; the next upstream crossing of the River Tees is 15km to the west, whilst the next downstream crossing is Queen Elizabeth Way north of Ingleby Barwick, 10km away.
Secondly; Yarm High Street serves as a unique and attractive High Street that acts as a major destination for specialist / boutique shopping trips within the Tees Valley and North Yorkshire. Car parking is located on short aisles on either side of the street over its full length. Together with the two frequently called pedestrian crossings, this parking limits the vehicular throughput of the road. Congestion caused by this limited capacity is frequently experienced during morning and evening weekday peak periods.
A key feature/need for the YIBAM is the ability to model the queues on Yarm High Street. This was achieved through validating the morning and evening peak period journey times within the model against observed journey times. The model can therefore be utilised to model the change in delays caused by a volumetric

Stockton-on-Tees Borough Council Development Planning DocumentModelling Review
224125-19 | Issue | 25 September 2014
\\GLOBAL\EUROPE\NEWCASTLE\JOBS\220000\224125\19 WEST STOCKTON HOUSING\DOCS\27- REPORTS\DPD SUMMARY MODELLLING REPORT\REP-VB_SMCC-SBC DPD ISSUE-260914.DOCX
Page 30
change. As the representation of Yarm High Street has been simplified within the model, the model cannot be used as a tool for modelling the effects of any proposed physical changes to the High Street.
Figure 5: A67 Yarm High Street / Yarm Bridge
Stockton-on-Tees Borough Council Development Planning DocumentModelling Review
224125-19 | Issue | 25 September 2014
\\GLOBAL\EUROPE\NEWCASTLE\JOBS\220000\224125\19 WEST STOCKTON HOUSING\DOCS\27- REPORTS\DPD SUMMARY MODELLLING REPORT\REP-VB_SMCC-SBC DPD ISSUE-260914.DOCX
Page 31
3.3 Traffic Data
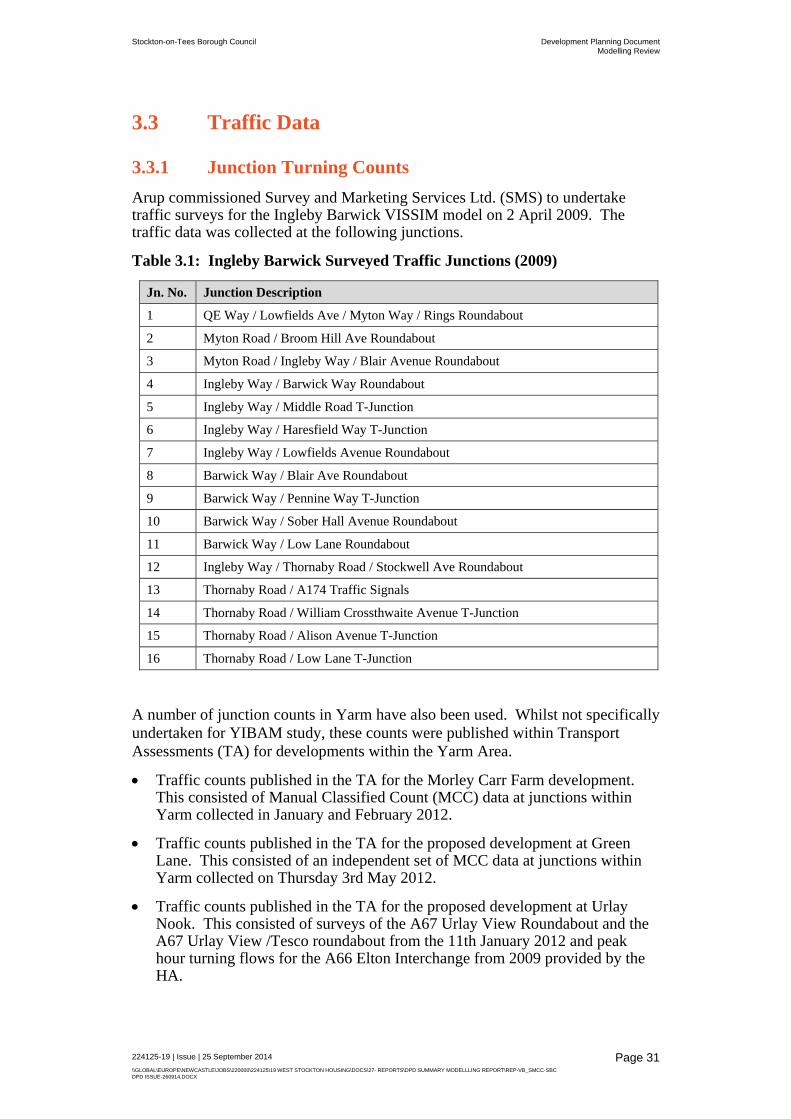
3.3.1 Junction Turning Counts
Arup commissioned Survey and Marketing Services Ltd. (SMS) to undertake traffic surveys for the Ingleby Barwick VISSIM model on 2 April 2009. The traffic data was collected at the following junctions.
Table 3.1: Ingleby Barwick Surveyed Traffic Junctions (2009)
Jn. No. Junction Description
1 QE Way / Lowfields Ave / Myton Way / Rings Roundabout
2 Myton Road / Broom Hill Ave Roundabout
3 Myton Road / Ingleby Way / Blair Avenue Roundabout
4 Ingleby Way / Barwick Way Roundabout
5 Ingleby Way / Middle Road T-Junction
6 Ingleby Way / Haresfield Way T-Junction
7 Ingleby Way / Lowfields Avenue Roundabout
8 Barwick Way / Blair Ave Roundabout
9 Barwick Way / Pennine Way T-Junction
10 Barwick Way / Sober Hall Avenue Roundabout
11 Barwick Way / Low Lane Roundabout
12 Ingleby Way / Thornaby Road / Stockwell Ave Roundabout
13 Thornaby Road / A174 Traffic Signals
14 Thornaby Road / William Crossthwaite Avenue T-Junction
15 Thornaby Road / Alison Avenue T-Junction
16 Thornaby Road / Low Lane T-Junction
A number of junction counts in Yarm have also been used. Whilst not specifically undertaken for YIBAM study, these counts were published within Transport Assessments (TA) for developments within the Yarm Area.
Traffic counts published in the TA for the Morley Carr Farm development. This consisted of Manual Classified Count (MCC) data at junctions within Yarm collected in January and February 2012.
Traffic counts published in the TA for the proposed development at Green Lane. This consisted of an independent set of MCC data at junctions within Yarm collected on Thursday 3rd May 2012.
Traffic counts published in the TA for the proposed development at Urlay Nook. This consisted of surveys of the A67 Urlay View Roundabout and the A67 Urlay View /Tesco roundabout from the 11th January 2012 and peak hour turning flows for the A66 Elton Interchange from 2009 provided by the HA.

Stockton-on-Tees Borough Council Development Planning DocumentModelling Review
224125-19 | Issue | 25 September 2014
\\GLOBAL\EUROPE\NEWCASTLE\JOBS\220000\224125\19 WEST STOCKTON HOUSING\DOCS\27- REPORTS\DPD SUMMARY MODELLLING REPORT\REP-VB_SMCC-SBC DPD ISSUE-260914.DOCX
Page 32
Counts of the following junctions were obtained:
Table 3.2: Yarm JTC locations
Jn. No. Junction Description
1 A67 Thirsk Road / A1044 Green Lane
2 Allerton Bank / B1264 Green Lane
3 A67 The Spital / Worsall Road
4 A67 Yarm Bridge / A67 Urlay Nook Road / A135 Yarm Rd / Aislaby Road
Data was processed to form 15 minute link flows which has been utilised within the data calibration phase.
3.3.2 2009 – 2012 Traffic Growth
Traffic data from the A19 was obtained from the Highways Agency’s (HA) HATRIS database. It is considered that this data is broadly representative of conditions in the area as;
This data has been collected on the dominant route between Yarm / Ingleby Barwick and Stockton / Middlesbrough.
Data has been collected for 9 months in 2009 and 9 months in 2012.
The table below summarises the 2-Way Annual Average Weekday Traffic (AAWT) by month for 2009 and 2012.
Table 3.3: A19 2-Way AAWT & Growth
Month 2009 Data 2012 Data Growth in
2-Way AAWT NB SB 2-Way NB SB 2-Way
January 36379 38471 74,850 36233 38531 74,764 1.00
February 37852 40100 77,952 38489 40825 79,314 1.02
March 39327 42463 81,790 39803 42304 82,107 1.00
April 39210 42022 81,232 38116 40490 78,606 0.97
May 39270 41713 80,983 38749 41531 80,280 0.99
June 39752 42653 82,405 37835 39972 77,807 0.94
July 40145 42406 82,551 38036 39564 77,600 0.94
August 40023 42565 82,588 38566 40815 79,381 0.96
September 39773 42529 82,302 39672 41291 80,963 0.98
The data shows that there has been little or no growth on the A19 between the A174 Parkway and the A1130 Mandale Road junctions. This analysis shows that traffic data collected in 2009 remains representative of 2012 conditions.

Stockton-on-Tees Borough Council Development Planning DocumentModelling Review
224125-19 | Issue | 25 September 2014
\\GLOBAL\EUROPE\NEWCASTLE\JOBS\220000\224125\19 WEST STOCKTON HOUSING\DOCS\27- REPORTS\DPD SUMMARY MODELLLING REPORT\REP-VB_SMCC-SBC DPD ISSUE-260914.DOCX
Page 33
3.3.3 Automatic Traffic Counts
ATC data was obtained from SBC at a number of locations within Yarm for a typical week in November 2012. These are given in Appendix E, and the following table specifies the location and period during which these counts were undertaken.
Table 3.4: ATC Sites and Survey Dates
Site ID. Description Survey Dates
30001110 A67 Kirklevington, North of A19 05/11/12 – 11/11/12
30000873 A67 High Street, North of Yarm Bridge 05/11/12 – 11/11/12
30008340 A1044 Leven Road, West of Hilton turn off 05/11/12 – 11/11/12
30000091 A67 High Street, North of B1265 Worsall Road 05/11/12 – 11/11/12
3.3.4 Journey Time Surveys
Journey time surveys in Ingleby Barwick were undertaken by Arup for both peak hours on the same day when SMS undertook the JTC surveys mentioned in Table 3.1. Critical routes were identified for the Ingleby Barwick network and it was ensured that at least two readings were taken for every route, preferably during the 2nd and 3rd quarter of the peak hour that showed significant congestion. Readings were taken in both directions on individual sections of the critical routes.
In October 2012 Arup commissioned SMS to undertake journey time surveys on Yarm High Street. The survey was undertaken on 8 November 2012.
The final journey times that have been used in this study are given below for the AM and PM peak hours.
Table 3.5 Ingleby Barwick and Yarm Journey Times (mm:ss)
Route No. Description
Journey Time
AM PM
Route 1 QE Way (bridge) to Tesco Roundabout 02:10 04:46
Route 2 Tesco Roundabout to QE Way 03:30 02:10
Route 3 Tesco Roundabout to A174 Signals 06:55 03:48
Route 4 A174 Signals to Tesco Roundabouts 02:28 02:49
Route 5 Tesco Roundabout to Barwick Way/Low Lane Roundabout 02:29 02:21
Route 6 Barwick Way/Low Lane Roundabout to Tesco Roundabout 02:28 02:40
Route 7 A67/B1264 Roundabout to High Street/ Bridge Street 07:05 06:22
3.3.5 Traffic Signal Data
There is only one signal controlled junction in Ingleby Barwick, which is at the A174 Parkway/Thornaby Road junction. The phases, signal staging, green times and cycle time at this junction were observed for both peak hours during the site
Stockton-on-Tees Borough Council Development Planning DocumentModelling Review
224125-19 | Issue | 25 September 2014
\\GLOBAL\EUROPE\NEWCASTLE\JOBS\220000\224125\19 WEST STOCKTON HOUSING\DOCS\27- REPORTS\DPD SUMMARY MODELLLING REPORT\REP-VB_SMCC-SBC DPD ISSUE-260914.DOCX
Page 34
visit that was conducted on 2nd April 2009 as part of the previous study. Information from these observations was used to model the junction in the original VISSIM model using a fixed-time control. A similar approach has been used to model this junction in the YIBAM.
The information regarding Signal Control at the following locations in Yarm was obtained from Middlesbrough Council for;
Pelican crossings on Yarm High Street, and
A67 Urlay Nook Road / A135 Yarm Road junction.
Middlesbrough Council specified “The two pelicans on Yarm High Street run a fixed vehicle period, i.e. they will always give 30s green to vehicles then will change when a pedestrian demand is entered. At Yarm School it operates in VA so when vehicles are present it will run 30s green but can gap out if there are gaps in traffic to operate pedestrian phase. Under peak conditions though we could safely assume that traffic demand will be constant”.
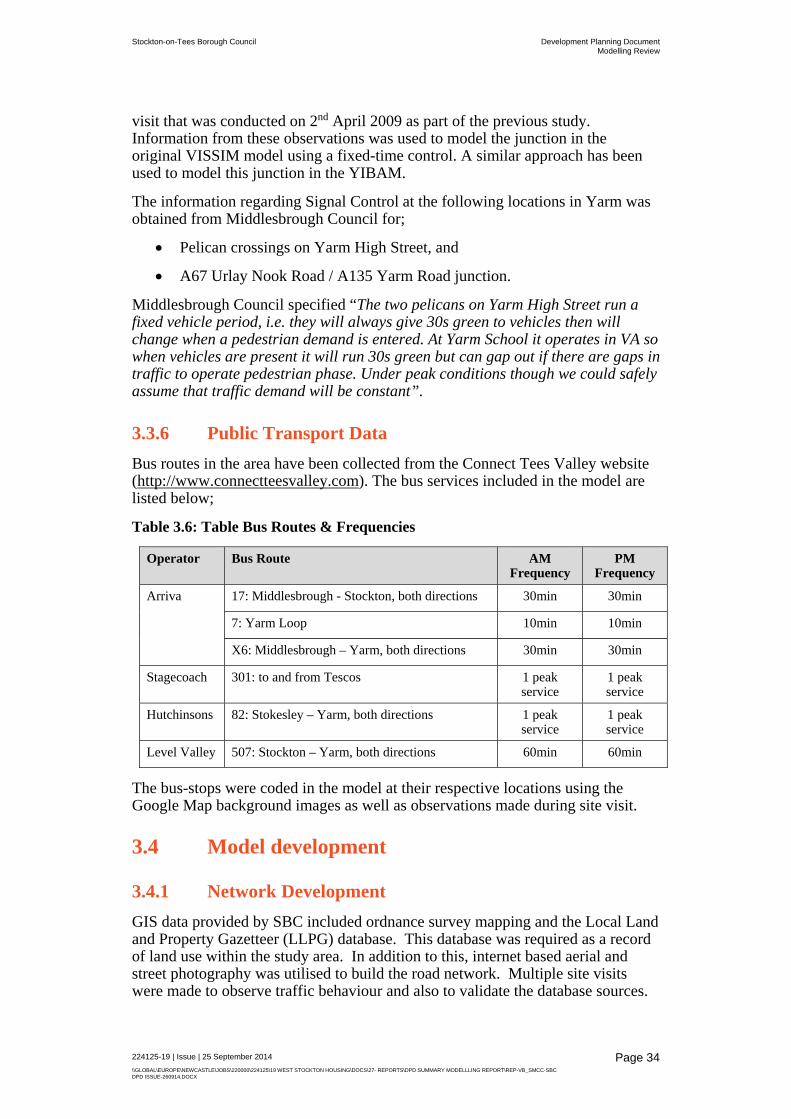
3.3.6 Public Transport Data
Bus routes in the area have been collected from the Connect Tees Valley website (http://www.connectteesvalley.com). The bus services included in the model are listed below;
Table 3.6: Table Bus Routes & Frequencies
Operator Bus Route AM Frequency
PM Frequency
Arriva 17: Middlesbrough - Stockton, both directions 30min 30min
7: Yarm Loop 10min 10min
X6: Middlesbrough – Yarm, both directions 30min 30min
Stagecoach 301: to and from Tescos 1 peak service
1 peak service
Hutchinsons 82: Stokesley – Yarm, both directions 1 peak service
1 peak service
Level Valley 507: Stockton – Yarm, both directions 60min 60min
The bus-stops were coded in the model at their respective locations using the Google Map background images as well as observations made during site visit.
3.4 Model development
3.4.1 Network Development
GIS data provided by SBC included ordnance survey mapping and the Local Land and Property Gazetteer (LLPG) database. This database was required as a record of land use within the study area. In addition to this, internet based aerial and street photography was utilised to build the road network. Multiple site visits were made to observe traffic behaviour and also to validate the database sources.

Stockton-on-Tees Borough Council Development Planning DocumentModelling Review
224125-19 | Issue | 25 September 2014
\\GLOBAL\EUROPE\NEWCASTLE\JOBS\220000\224125\19 WEST STOCKTON HOUSING\DOCS\27- REPORTS\DPD SUMMARY MODELLLING REPORT\REP-VB_SMCC-SBC DPD ISSUE-260914.DOCX
Page 35
A zone structure was designed that identified the predominant land uses in each zone. Figure 6 shows the zone structure and land uses identified.
Figure 6: YIBAM Zone Structure
3.4.2 Modelled Time Periods
The model has been built to cover the;
AM peak period - 07:30-09:00, and,
PM peak period - 16:15-17:45.
3.4.3 Traffic Demand
Traditionally O-D matrices would be developed using data collected from road side interview surveys or travel diaries. However this information is expensive to collect, and there was no existing information of this type available to inform the model. As such the O-D matrices were built using a synthetic technique combining trip generation and the traffic count information.

Stockton-on-Tees Borough Council Development Planning DocumentModelling Review
224125-19 | Issue | 25 September 2014
\\GLOBAL\EUROPE\NEWCASTLE\JOBS\220000\224125\19 WEST STOCKTON HOUSING\DOCS\27- REPORTS\DPD SUMMARY MODELLLING REPORT\REP-VB_SMCC-SBC DPD ISSUE-260914.DOCX
Page 36
In the morning the peak demand for school and travel to work trips were generally coincident. As such a single matrix was developed to represent the pattern of movements during the AM Peak period 07:30-09:30. The traffic demand was input in eight 15min periods. The AM hourly matrix was factored for each of the eight 15min periods so as to represent the temporal distribution throughout the hour. This temporal distribution peaks during the 15min period starting at 08:00.
In the afternoon the peak demands for school and travel to work trips occur during two different periods. As such for the PM period two matrices have been developed to capture the different movements that occur during this period.
From 16:00-17:00 a School matrix was developed. This reflects the trip making across the model with peak generation from the school zones. The traffic demand was input in four 15min periods. The School hourly matrix was factored for each of the four 15min periods to obtain a distribution that peaks during the 15min period starting at 16:30.
The PM hourly matrix was developed to represent the return from work peak hour. For the PM Peak hour 17:00-18:00, the traffic demand was input in four 15min periods. The PM hourly matrix was factored for each of the four 15min periods to obtain a distribution that peaks during the 15min period starting at 17:30.
The PM peak period model runs continuously for the complete two hour period.
Table 3.7 below shows the factors used for the 15min periods for both the peak periods.
Table 3.7: Factors used for 15min Traffic Input Matrices
AM Peak Period (07:30-09:30) PM Peak Period (16:00-18:00)
15min Start Matrix Used Factor 15min Start Matrix Used Factor
07:30
AM PEAK
24% 16:00
SCHOOL
22%
07:45 25% 16:15 24.9%
08:00 26% 16:30 26.5%
08:15 25% 16:45 26.3%
08:30 25.3% 17:00
PM
26.5%
08:45 23.7% 17:15 24.8%
09:00 20% 17:30 24.3%
09:15 20% 17:45 24.2%

Stockton-on-Tees Borough Council Development Planning DocumentModelling Review
224125-19 | Issue | 25 September 2014
\\GLOBAL\EUROPE\NEWCASTLE\JOBS\220000\224125\19 WEST STOCKTON HOUSING\DOCS\27- REPORTS\DPD SUMMARY MODELLLING REPORT\REP-VB_SMCC-SBC DPD ISSUE-260914.DOCX
Page 37
3.5 Calibration The Calibration of the YIBAM model was undertaken for three aspects;
3. Traffic Matrix Calibration, which is an iterative process that involves the comparison of observed flow and corresponding flow from the O-D matrix to ascertain the fitness of trip matrices to be used in the model as traffic demand.
4. Model Calibration, which involves the adjustment of the following parameters within the model to ensure that best representation of network, vehicle behaviour and traffic demand.
Section characteristics
Vehicle characteristics
Simulation step and reaction time
Behavioural models
Traffic demand profile
5. Assignment Calibration, which uses the Design Manual for Roads and Bridges (DMRB) advised GEH statistic as a goodness of fit test to compare two sets of traffic volumes, in this case the modelled flows and observed flows.
The detail Model calibration process for the YIBAM can be found in the YIBAM LMVR. Table 3.8 shows Assignment Calibration results.
Table 3.8: Assignment Calibration Statistics
Criteria Performance
AM PM
% Links with a GEH Statistic of less than 8 95% 98.1%
% Links with a GEH Statistic of less than 5 77% 80.9%
% Link flows modelled within 100 vph for flows less than 700 78% 75.9%
% Link flows modelled within 15% for flows between 700 and 2,700 vph 74% 58.7%

Stockton-on-Tees Borough Council Development Planning DocumentModelling Review
224125-19 | Issue | 25 September 2014
\\GLOBAL\EUROPE\NEWCASTLE\JOBS\220000\224125\19 WEST STOCKTON HOUSING\DOCS\27- REPORTS\DPD SUMMARY MODELLLING REPORT\REP-VB_SMCC-SBC DPD ISSUE-260914.DOCX
Page 38
3.6 Model Validation The validation of the YIBAM was undertaken in two steps;
6. Link Flow Validation, that uses the DMRB advised GEH criteria for comparing observed and modelled flows
7. Journey Time Validation, that compares the observed and modelled journey times for pre-defined routes.
3.6.1 Link Flow Validation
The Link Flow Validation is shown in Table 3.9 and 310 for the AM and PM peak respectively. It should be noted that the observed flows used in the Validation process are independent to the link flows used for calibration.
Table 3.9: Traffic Flow Validation (vph), AM Peak (08:00-09:00)
Direction Detector Ref
Observed Data
Modelled Data
GEH
A67 Kirklevington, North of A19 NB V1 303 337 1.9
SB V2 585 519 2.8
A67 High Street, North of Yarm Bridge
NB V3 783 803 0.7
SB V4 891 853 1.3
A1044 Leven Road, West of Hilton Turn off
EB V5 809 914 3.6
WB V6 702 694 0.3
A67 High Street, North of B1265 Worsall Road
NB V7 921 870 1.7
SB V8 636 695 2.3
The GEH values of all AM Peak traffic flows compared in the table above are less than 5.
Table 3.10: Traffic Flow Validation (vph), PM Peak (17:00-18:00)
Direction Detector Ref
Observed Data
Modelled Data
GEH
A67 Kirklevington, North of A19 NB V1 1035 1035 0.0
SB V2 581 618 1.5
A67 High Street, North of Yarm Bridge
NB V3 1488 1563 1.9
SB V4 1504 1726 5.5
A1044 Leven Road, West of Hilton Turn off
EB V5 1340 1552 5.6
WB V6 1313 1377 1.7
A67 High Street, North of B1265 Worsall Road
NB V7 1461 1590 3.3
SB V8 1511 1629 3.0
The table shows that for the PM Peak two of the GEH values are greater than 5, however these are only marginally greater.

Stockton-on-Tees Borough Council Development Planning DocumentModelling Review
224125-19 | Issue | 25 September 2014
\\GLOBAL\EUROPE\NEWCASTLE\JOBS\220000\224125\19 WEST STOCKTON HOUSING\DOCS\27- REPORTS\DPD SUMMARY MODELLLING REPORT\REP-VB_SMCC-SBC DPD ISSUE-260914.DOCX
Page 39
3.6.2 Journey Time Validation
DMRB Volume 12, Chapter 4 (Table 4.2) mentions that the modelled journey times should be within 15% (or 1min if higher) as compared to the observed journey times for 85% of the routes or higher.
The journey time comparison for the seven routes9 is shown in the table below.
Table 3.11: Journey Time Comparison (mm:ss)
AM Peak (08:00-09:00) PM Peak Period (17:00-18:00)
Observed Modelled % Diff Observed Modelled % Diff
Route 1 02:10 02:01 -7% 04:46 04:34 -5%
Route 2 03:30 03:47 8% 02:10 01:49 -19%
Route 3 06:55 06:45 -2% 03:48 03:40 -4%
Route 4 02:28 02:41 8% 02:49 02:41 -5%
Route 5 02:29 02:26 -2% 02:21 02:21 0%
Route 6 02:28 02:37 5% 02:40 02:32 -6%
Route 7 07:05 06:54 -3% 06:22 06:35 3%
The table shows that during the AM peak hour, all modelled journey times satisfy the recommended criteria.
During the PM peak hour, the modelled journey time on Route 2 is 19% lower than the observed journey time of 02mins 10secs; however it is within the 1min margin as specified in the guidelines.
9 Refer Table 3.5 for Route Description.

Stockton-on-Tees Borough Council Development Planning DocumentModelling Review
224125-19 | Issue | 25 September 2014
\\GLOBAL\EUROPE\NEWCASTLE\JOBS\220000\224125\19 WEST STOCKTON HOUSING\DOCS\27- REPORTS\DPD SUMMARY MODELLLING REPORT\REP-VB_SMCC-SBC DPD ISSUE-260914.DOCX
Page 40
3.7 Future Model Development
3.7.1 Committed Developments
The following developments were identified as committed for the purpose of building the YIBAM and are included in the future committed base. The details of these developments are given below.
Table 3.12: Committed Developments in Yarm and Ingleby Barwick
No. Description Development Type Size
1 IB Consented Housing Mixed Residential 1,633 dwellings
2 IB Tesco Store Extension Retail 2,494 sq.m
3 Morley Carr Housing Mixed Residential 350 dwellings
7 Allens West Mixed Residential Community Facility Retail
845 dwellings 60 bed care home 500 sq.m 250 sq.m
8 Tall Trees Residential Mixed Residential 161 dwellings
The trips generated from the committed developments that would travel through the modelled road network are shown in Table 3.13, along with the trip loading points in the model.
The trips from the individual developments were distributed in the model based on existing trip distribution from their corresponding loading point.
Table 3.13: Committed Development Trips
Development Name Loading Point in Model AM PM
Zone Name Enter Exit Enter Exit
IB Consented Housing10 70 80
Rings Broom Hill
715 244
277 95
410 140
677 232
IB Tesco Extension10 130 Tesco Access - - 94 99
Allen’s West11 10001 (1A) Durham Lane 273 100 139 248
Tall Trees Residential12 4 B1264 West 130 52 50 101
Morley Carr Housing12 131 & 139 Allerton Balk 133 62 80 139
Note: Enter and Exit indicates trips entering and exiting the model, and not the development sites
10 Source: ‘Junction Road / Blakeston Lane Junction Improvement Schemes’, Arup, May 2012 11 Source: ‘Redevelopment of Allen’s West Site, Eaglescliffe’ TA, S.A.J Consultants, Nov 2011 12 Source: ‘Proposed Residential Development, Green Lane, Yarm’ TA, S.A.J Consultants, Feb 2013

Stockton-on-Tees Borough Council Development Planning DocumentModelling Review
224125-19 | Issue | 25 September 2014
\\GLOBAL\EUROPE\NEWCASTLE\JOBS\220000\224125\19 WEST STOCKTON HOUSING\DOCS\27- REPORTS\DPD SUMMARY MODELLLING REPORT\REP-VB_SMCC-SBC DPD ISSUE-260914.DOCX
Page 41
3.8 Committed Highway Schemes A number of committed highway improvements were planned within Ingleby Barwick when the YIBAM study was being undertaken. These improvements are shown in Appendix F and can be considered as Eastern Improvement Schemes and Western Improvement Schemes as follows;
3.8.1 IB Eastern Improvements 1. A174 Parkway / Teesside Industrial Estate Roundabout: new access
roundabout into the Teesside Industrial Estate (TIE) is associated with redevelopment within TIE.
2. Dualling of the A174 Parkway Extension: between the A174 / Thornaby Road traffic signal junction and the roundabout described in 1. above.
3. A174 Parkway Extension/ Thornaby Road Signals: modified signal control layout including changing of priorities within the traffic signal phasing and provision of a second right turn lane onto the A174
4. Thornaby Road / Low Lane Junction Improvement: signalisation of an existing uncontrolled priority T-junction.
3.8.2 IB Western Improvements 1. Myton Way / Broom Hill Avenue Signals: signal crossroad layout to replace
existing roundabout.
2. Myton Way Dualling: between the Myton Way / Ingleby Way (Tesco) roundabout and the Broom Hill signals;
3. Ingleby Way local Dualling (Tesco Scheme): associated with the Tesco extension proposal and includes 2 lanes in each direction between the Myton Way / Ingleby Way / Blair Avenue (Tesco) roundabout and the Ingleby Way / Barwick Way roundabout, and highway modifications at the Tesco Roundabout; and
4. The Rings / Queen Elizabeth Way (Quarry Farm) Roundabout Improvement includes local widening on Queen Elizabeth Way on the roundabout approaches in both directions.
Although it was announced in April 2013 that the extension to the Tesco store in Ingleby Barwick would not go ahead, funding was available for the Tesco Scheme from other housing developments.

Stockton-on-Tees Borough Council Development Planning DocumentModelling Review
224125-19 | Issue | 25 September 2014
\\GLOBAL\EUROPE\NEWCASTLE\JOBS\220000\224125\19 WEST STOCKTON HOUSING\DOCS\27- REPORTS\DPD SUMMARY MODELLLING REPORT\REP-VB_SMCC-SBC DPD ISSUE-260914.DOCX
Page 42
3.9 South Yarm
3.9.1 Housing Quantity
Chapter 8 of the LDD produced by SBC incudes ‘Policy H1j – South West Yarm’ that identifies land for up to a total of 745 dwellings to be built in South Yarm over the period 2014 to 2029. The document also notes that there are significant issues on the local road network that would need to be mitigated should development go ahead.
A planning application (12/1990/EIS) was submitted to SBC in August 2012 by Theakston Estates Limited & Partners (Theakston). This application initially proposed 735 dwellings on land to the south of Green Lane in Yarm. Initial modelling results, outlined in this report, indicated that the proposed highway improvements would not sufficiently mitigate the impact of 735 dwellings.
Following discussions between SBC, Arup and S.A.J. Transport Consultants, who were acting on behalf of Theakston, a reduced housing level of 550 dwellings was considered for further assessment. Additionally, an element of peak hour spreading due to the level of congestion on the High Street, and a 5% reduction in trip rates due to travel planning measures were also considered.
Results for the 550 dwellings scenarios showed that there would still be capacity issues, especially on Green Lane. The planning application was therefore revised to 370 dwellings with two new vehicular accesses into the site located on Green Lane.
3.9.2 Trip Generation
The TA produced by S.A.J. proposed trip rates for South Yarm that are shown in Table 3.14 along with reduced trip rates due to the 5% reduction to account for travel planning measures. The resultant trips generated are also shown.
Table 3.14: Peak Hour Trip Rates and Generation
Source AM PM
Arr Dep Arr Dep
Original Trip Rates 0.243 0.491 0.495 0.355
Trip Rates with 5% reduction 0.231 0.466 0.470 0.337
Resultant Trips 85 173 174 125
3.9.3 Trip Distribution
Baseline traffic distribution was informed by a review of traffic patterns within the existing Tees Valley TRIPS Model.
However, initial testing of the transport model using the distributions from the Tees Valley TRIPS Model suggested that adding additional traffic to Yarm High Street would cause existing background traffic to divert onto other routes. This re-routing of traffic is due to the High Street having limited capacity. A review of historical traffic data for Yarm High Street shows that traffic flows through Yarm

Stockton-on-Tees Borough Council Development Planning DocumentModelling Review
224125-19 | Issue | 25 September 2014
\\GLOBAL\EUROPE\NEWCASTLE\JOBS\220000\224125\19 WEST STOCKTON HOUSING\DOCS\27- REPORTS\DPD SUMMARY MODELLLING REPORT\REP-VB_SMCC-SBC DPD ISSUE-260914.DOCX
Page 43
have been consistent for many years. Data shows that the daily traffic volume on the A67 on Yarm High Street is a little lower than it was in 1980. This indicates that once capacity through the High Street is reached traffic diverts onto other routes.
Therefore, the traffic distribution within the model has been adjusted to mirror this effect, with some traffic re-assigned onto other routes. The traffic that was reassigned was the traffic that was not travelling to Yarm High Street itself but travelling to destinations north or south of the High Street. The final trip distribution used in the model for South Yarm trips is given in Table 3.15
Table 3.15: Trip Distribution for West Stockton Housing Development
Origin/Destination Original Distribution Final Distribution
B1264 Green Lane 0.0% 0.0%
A67 (N) Yarm 18.0% 0.0%
Yarm High Street 10.0% 10%
Queen Elizabeth Way (IB) 9.0% 16.0%
A1045 Thornaby Road 9.0% 16.0%
A1044 Low Lane East 11.0% 11.0%
A67 (S) 43.0% 47.0%
3.10 Proposed Highway Improvement The only proposed highway improvement for the South Yarm housing development is the junction improvement at the A67 / Green Lane roundabout. The improvement, which is shown in Appendix F, proposed the widening of all approaches to the roundabout to include flared entries on all arms.
3.11 Forecast Year Assessment
3.11.1 Background Traffic Growth
Due to the large level of development proposed for the Yarm and Ingleby Barwick area, the background traffic growth in the model has been assumed to be solely due to the additional trips associated with the future development. As such, no additional growth was applied to the background traffic as the addition of committed and development traffic would exceed traffic growth forecasts.
3.11.2 Assessment Scenarios
Table 3.16 shows the assessment scenarios included in the YIBAM forecasting study along with the traffic and highway component in each scenario. It should be noted that the highway components are in addition to the 2012 road network in each scenario.

Stockton-on-Tees Borough Council Development Planning DocumentModelling Review
224125-19 | Issue | 25 September 2014
\\GLOBAL\EUROPE\NEWCASTLE\JOBS\220000\224125\19 WEST STOCKTON HOUSING\DOCS\27- REPORTS\DPD SUMMARY MODELLLING REPORT\REP-VB_SMCC-SBC DPD ISSUE-260914.DOCX
Page 44
Table 3.16: Forecast Year Assessment Scenarios
Description
Scenario 2022 Base 2022 South Yarm
Tra
ffic
C
omp
onen
t 2012 Traffic
Committed Traffic
South Yarm Housing Traffic -
Hig
hway
C
omp
onen
t
Committed Highway Schemes -
Proposed Highway Improvement -
3.11.3 Performance Indicators
Journey times have been used to test the impact of the various scenarios on the critical links. Vehicle queue lengths have also been presented for some scenarios.
The modelled area covers the Yarm and Ingleby Barwick area and the critical routes monitored are:
Route 1: Queen Elizabeth Way (bridge) to Tesco roundabout;
Route 2: Tesco roundabout to Queen Elizabeth Way;
Route 3: Tesco roundabout to A174 Parkway;
Route 4: A174 Parkway to Tesco roundabout;
Route 5: Tesco roundabout to Barwick Way / Low Lane roundabout;
Route 6: Barwick Way / Low Lane roundabout to Tesco roundabout;
Route 7: A67 northbound from Green Lane roundabout to Yarm High Street (Bridge Street); and
Route 8: A67 southbound from Yarm High Street (Bridge Street) to Green Lane roundabout.
3.11.4 Modelled Time Periods
The model results are presented for the following time periods:
AM peak period is 07:30 – 09:30; and
PM peak period is 16:00 – 18:00.
3.11.5 Results Summary
The initial assessment of the development traffic impact in Ingleby Barwick had shown that the existing ‘committed’ improvements within Ingleby Barwick created sufficient highway capacity to accommodate the additional development

Stockton-on-Tees Borough Council Development Planning DocumentModelling Review
224125-19 | Issue | 25 September 2014
\\GLOBAL\EUROPE\NEWCASTLE\JOBS\220000\224125\19 WEST STOCKTON HOUSING\DOCS\27- REPORTS\DPD SUMMARY MODELLLING REPORT\REP-VB_SMCC-SBC DPD ISSUE-260914.DOCX
Page 45
traffic. The full results comparison is shown in Appendix G and the summary below concentrates on the impact within Yarm.
Table 3.17 shows the impact on journey times within Yarm due to the proposed 370 household development.
Table 3.17 - Journey Time Increases: Committed Base & South West Yarm (370)
Peak Period and Route
2022 Committed Base 2022 South West Yarm + Mitigation
Time Time Change
AM Peak (08:00 – 09:00)
A67 Northbound 09:00 10:13 01:13
A67 Southbound 08:11 06:52 -01:18
PM Peak (17:00 – 18:00)
A67 Northbound 09:32 10:57 01:24
A67 Southbound 13:41 11:32 -02:09
With 370 dwellings, the northbound journey time through Yarm on the A67 increases by 01:13 minutes in the AM peak and 01:24 minutes in the PM peak.
Whilst acknowledging that the base journey times confirm the network is congested in the morning peak as traffic is travelling slowly through the network, a 1 minute increase does not indicate a significant increase and is within the levels of traffic fluctuation that you would expect on a daily basis.
Table 3.18 shows the impact of the South West Yarm development on the traffic signals on Green Lane at the Railway Bridge, and on the Green Lane approach to the A67 / Green Lane roundabout. It should be noted that these queues are the maximum queues occurring in a 15 minute period. The average queue per signal cycle (as calculated by traffic signal design programmes such as LINSIG) would be less.
Table 3.18 - Queue Increases: Committed Base & South West Yarm (370)
Peak Period and Approach
Committed Base South West Yarm + Mitigation
Vehicles Vehicles Change
AM Peak (08:00 – 09:00)
Roundabout - A67 Southbound 50 47 -3
Roundabout – Green Lane Westbound 31 15 -16
Roundabout – A67 Northbound 9 4 -5
Roundabout - Green Lane Eastbound 28 42 14
Railway Bridge Eastbound 32 37 5
Railway Bridge Westbound 26 54 28
PM Peak (17:00 – 18:00) Roundabout - A67 Southbound 40 46 6
Roundabout – Green Lane Westbound 26 6 -20
Roundabout – A67 Northbound 28 10 -18
Roundabout - Green Lane Eastbound 32 32 0
Railway Bridge Eastbound 23 50 27
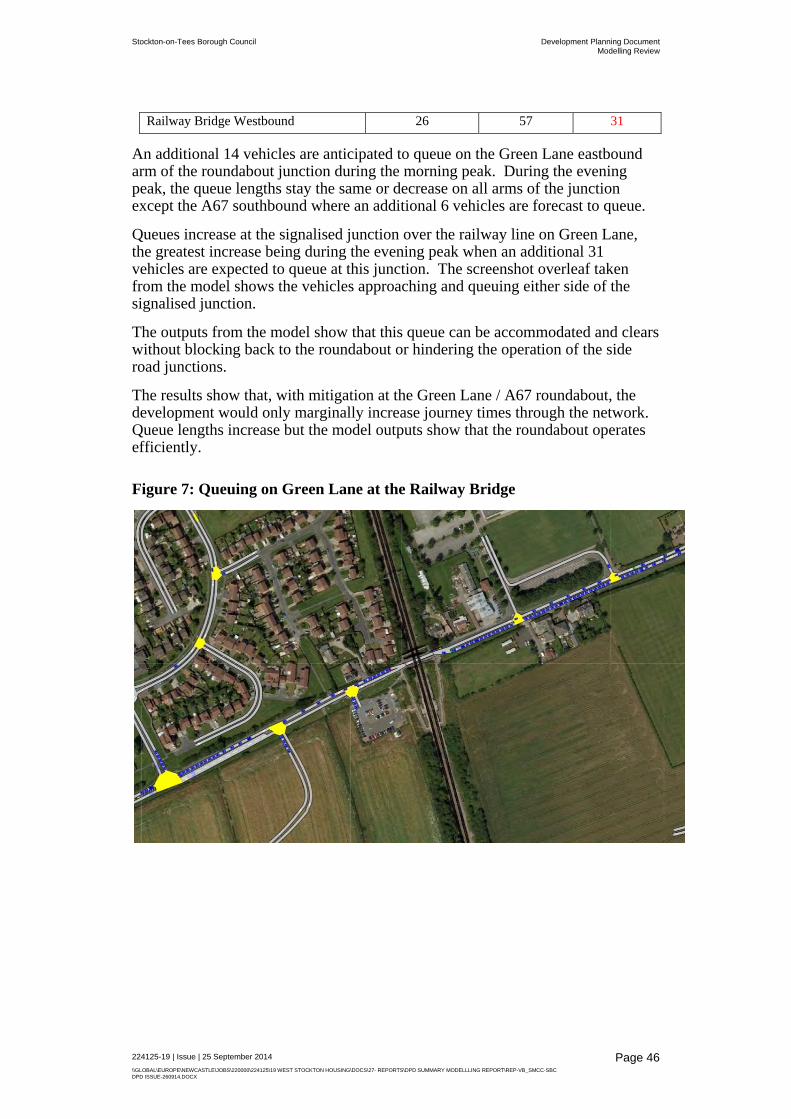
Stockton-on-Tees Borough Council Development Planning DocumentModelling Review
224125-19 | Issue | 25 September 2014
\\GLOBAL\EUROPE\NEWCASTLE\JOBS\220000\224125\19 WEST STOCKTON HOUSING\DOCS\27- REPORTS\DPD SUMMARY MODELLLING REPORT\REP-VB_SMCC-SBC DPD ISSUE-260914.DOCX
Page 46
Railway Bridge Westbound 26 57 31
An additional 14 vehicles are anticipated to queue on the Green Lane eastbound arm of the roundabout junction during the morning peak. During the evening peak, the queue lengths stay the same or decrease on all arms of the junction except the A67 southbound where an additional 6 vehicles are forecast to queue.
Queues increase at the signalised junction over the railway line on Green Lane, the greatest increase being during the evening peak when an additional 31 vehicles are expected to queue at this junction. The screenshot overleaf taken from the model shows the vehicles approaching and queuing either side of the signalised junction.
The outputs from the model show that this queue can be accommodated and clears without blocking back to the roundabout or hindering the operation of the side road junctions.
The results show that, with mitigation at the Green Lane / A67 roundabout, the development would only marginally increase journey times through the network. Queue lengths increase but the model outputs show that the roundabout operates efficiently.
Figure 7: Queuing on Green Lane at the Railway Bridge

Stockton-on-Tees Borough Council Development Planning DocumentModelling Review
224125-19 | Issue | 25 September 2014
\\GLOBAL\EUROPE\NEWCASTLE\JOBS\220000\224125\19 WEST STOCKTON HOUSING\DOCS\27- REPORTS\DPD SUMMARY MODELLLING REPORT\REP-VB_SMCC-SBC DPD ISSUE-260914.DOCX
Page 47
3.12 YIBAM Summary
3.12.1 Base Model
Following the model validation tests, the YIBAM model was considered fit for purpose and meets DMRB criteria. It should be noted that a key feature/need for the YIBAM was the ability to model the queues within Yarm, caused by heavy traffic flows and the high level of pedestrian and parking activity on the High Street. This was achieved through validating the morning and evening peak period journey times within the model against observed journey times.
The model was therefore considered fit to be utilised to model the change in delays caused by a volumetric change, such as that caused by proposed developments within the area. As the representation of Yarm High Street has been simplified within the model, the model cannot be used as a tool for modelling the effects of any proposed physical changes to the High Street.
3.12.2 Future Model Assessment
The following can be summarised from the forecasting assessment undertaken for the South Yarm housing development
A review of data from the Tees Valley TRIPS model and historical traffic count data shows that the traffic flows through Yarm High Street have been relatively unchanged since the 1980’s. The addition of traffic on the local network results in traffic travelling through Yarm High Street diverting onto other routes;
The committed ‘Eastern’ and Western’ highway improvements in Ingleby Barwick create sufficient highway capacity to accommodate the additional development traffic.
The addition of 735 or 550 houses in South West Yarm would increase journey times, with the A67 southbound link and Green Lane adversely affected
The proposed improvement at the A67 / Green Lane roundabout would not mitigate the traffic impact of 735 or 550 households
The development of 370 houses would increase journey times through Yarm by just over 1 minute compared to the committed base. This is considered to be a negligible increase in journey times

Stockton-on-Tees Borough Council Development Planning DocumentModelling Review
224125-19 | Issue | 25 September 2014
\\GLOBAL\EUROPE\NEWCASTLE\JOBS\220000\224125\19 WEST STOCKTON HOUSING\DOCS\27- REPORTS\DPD SUMMARY MODELLLING REPORT\REP-VB_SMCC-SBC DPD ISSUE-260914.DOCX
Page 48
4 Wynyard
4.1 Introduction This section discusses the process undertaken to consider planning applications for awarded for 1,110 residential units at Wynyard in Stockton on Tees. It should be noted all modelling was undertaken by JMP the Highways Agency’s consultants.
A collaborative masterplan led approach was undertaken to assess and determine the traffic impact of proposed housing at Wynyard. The administrative boundary between Stockton on Tees Borough Council (SBC) and Hartlepool Borough Council (HBC) crossed the masterplan area, two of the sites were in SBC and one in HBC.
Initially there was an aspiration for a total of 2,200 houses on three sites plus a new Hospital at Wynyard was proposed. However following analysis undertaken by the Highways Agency the total housing permissible was capped at 1,100 units.
The revised applications that received planning consent totalled 1,100 houses plus a two form entry primary school across three sites, namely,
• SBC 400 houses at Wynyard Park north of A689 (Woodland view);
• SBC 500 houses plus school at Wynyard Village (Wynyard Village); and,
• HBC 200 houses north of A689 (Wynyard Park).
Planning applications totalling 1,100 houses were submitted in the locations indicated in Figure 8.
Figure 8 Housing Applications
The scope of the study area included the following junctions, indicated in Figure 8.
Stockton-on-Tees Borough Council Development Planning DocumentModelling Review
224125-19 | Issue | 25 September 2014
\\GLOBAL\EUROPE\NEWCASTLE\JOBS\220000\224125\19 WEST STOCKTON HOUSING\DOCS\27- REPORTS\DPD SUMMARY MODELLLING REPORT\REP-VB_SMCC-SBC DPD ISSUE-260914.DOCX
Page 49
A689/The Wynd (Junction 1);
A689/Glenarm Road (Junction 2);
A689/Samsung Avenue (Junction 3);
A689/A19 including merge/diverge analysis on the A19 sliproads (Junction 4) ; and,
A869/The Services (Junction 5)
The planning determination process included the following stakeholders:
ATLAS – Department for Communities and Local Government, Advisory Team for Large Applications, (independent advisory service);
Stockton Borough Council, (Planning Authority);
Hartlepool Borough Council (Planning Authority);
Highways Agency (Managers of Strategic Road Network);
North Tees and Hartlepool NHS Foundation Trust (developers of proposed new hospital at Wynyard)
Cameron Hall Developments Ltd. (developer at Wynyard Village)
Wynyard Park (developer at Wynyard Park and Woodland View).
4.2 Wynyard Park - Extant Planning Context The Wynyard area currently has planning consent for approximately 280,000m2 of commercial floorspace with no significant highway related planning obligations. Commercial development can therefore come forward without mitigating highway impacts.
A plan of the extant planning consent is displayed in Figure 9 below.

Stockton-on-Tees Borough Council Development Planning DocumentModelling Review
224125-19 | Issue | 25 September 2014
\\GLOBAL\EUROPE\NEWCASTLE\JOBS\220000\224125\19 WEST STOCKTON HOUSING\DOCS\27- REPORTS\DPD SUMMARY MODELLLING REPORT\REP-VB_SMCC-SBC DPD ISSUE-260914.DOCX
Page 50
Figure 9: Extant Planning Consent Wynyard Park
This chapter details the process of the assessment of the housing developments This report should be read in conjunction with the aforementioned documents wherever referenced.
4.3 Highways Agency Pinchpoint Scheme Prior to assessing developments the model was used to assess an approved scheme submitted to Central Government, the A19/A689 Pinchpoint Scheme. The Pinch Point Programme forms part of the UK Government's growth initiative, the junction was identified as a barrier to growth as the junction experiences queuing on the A689 westbound approach and on the A19 mainline.
A drawing of the scheme is displayed in Figure 10.
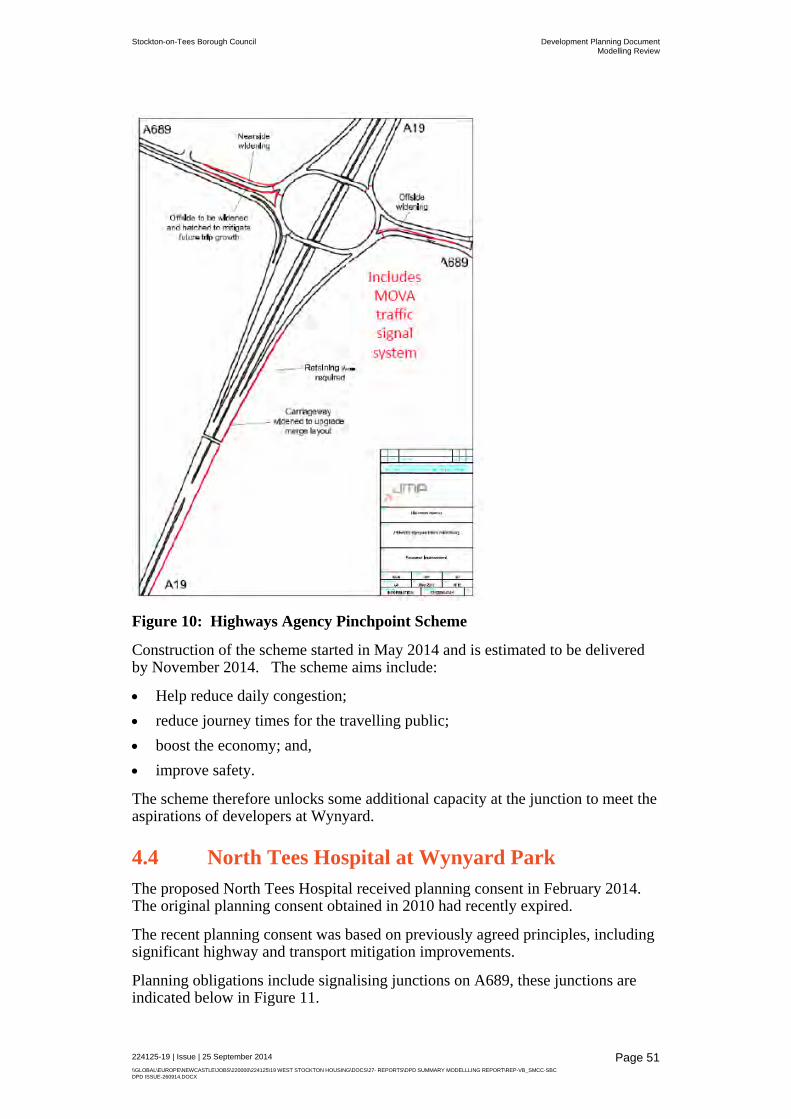
Stockton-on-Tees Borough Council Development Planning DocumentModelling Review
224125-19 | Issue | 25 September 2014
\\GLOBAL\EUROPE\NEWCASTLE\JOBS\220000\224125\19 WEST STOCKTON HOUSING\DOCS\27- REPORTS\DPD SUMMARY MODELLLING REPORT\REP-VB_SMCC-SBC DPD ISSUE-260914.DOCX
Page 51
Figure 10: Highways Agency Pinchpoint Scheme
Construction of the scheme started in May 2014 and is estimated to be delivered by November 2014. The scheme aims include:
Help reduce daily congestion;
reduce journey times for the travelling public;
boost the economy; and,
improve safety.
The scheme therefore unlocks some additional capacity at the junction to meet the aspirations of developers at Wynyard.
4.4 North Tees Hospital at Wynyard Park The proposed North Tees Hospital received planning consent in February 2014. The original planning consent obtained in 2010 had recently expired.
The recent planning consent was based on previously agreed principles, including significant highway and transport mitigation improvements.
Planning obligations include signalising junctions on A689, these junctions are indicated below in Figure 11.

Stockton-on-Tees Borough Council Development Planning DocumentModelling Review
224125-19 | Issue | 25 September 2014
\\GLOBAL\EUROPE\NEWCASTLE\JOBS\220000\224125\19 WEST STOCKTON HOUSING\DOCS\27- REPORTS\DPD SUMMARY MODELLLING REPORT\REP-VB_SMCC-SBC DPD ISSUE-260914.DOCX
Page 52
Figure 11: Junction Improvements related to Hospital Planning Consent
The planning obligations required improvements at the following junctions:
A689/Glenarm Road (Junction 2);
A689/Samsung Avenue (Junction 3);
A689/A19 including merge/diverge analysis on the A19 sliproads (Junction 4);
A869/The Services (Junction 5); and
A689/A1185/Wolviston (Junction 6).
4.5 Base Model Development
4.5.1 Base Year (2013)
The original Wynyard model was developed in 2010 by JMP on behalf of the Highways Agency, the model was used to assess the impact of a new hospital proposed at Wynyard Park for the AM and PM peak periods. The proposed development subsequently obtained planning consent in 2010. The basis of the model has therefore been scrutinised through the planning process and has satisfied key stakeholders, namely Stockton Borough Council, Hartlepool Borough Council and the Highways Agency.
This model was updated in early 2013 to reflect up-to-date traffic flows. The traffic flows were jointly commissioned by AECOM (Wynyard Park) and SAJ Consulting (Cameron Hall, Wynyard Village), the traffic consultants representing the proposed housing developers.
The model was validated and calibrated by JMP the process is presented in the document:
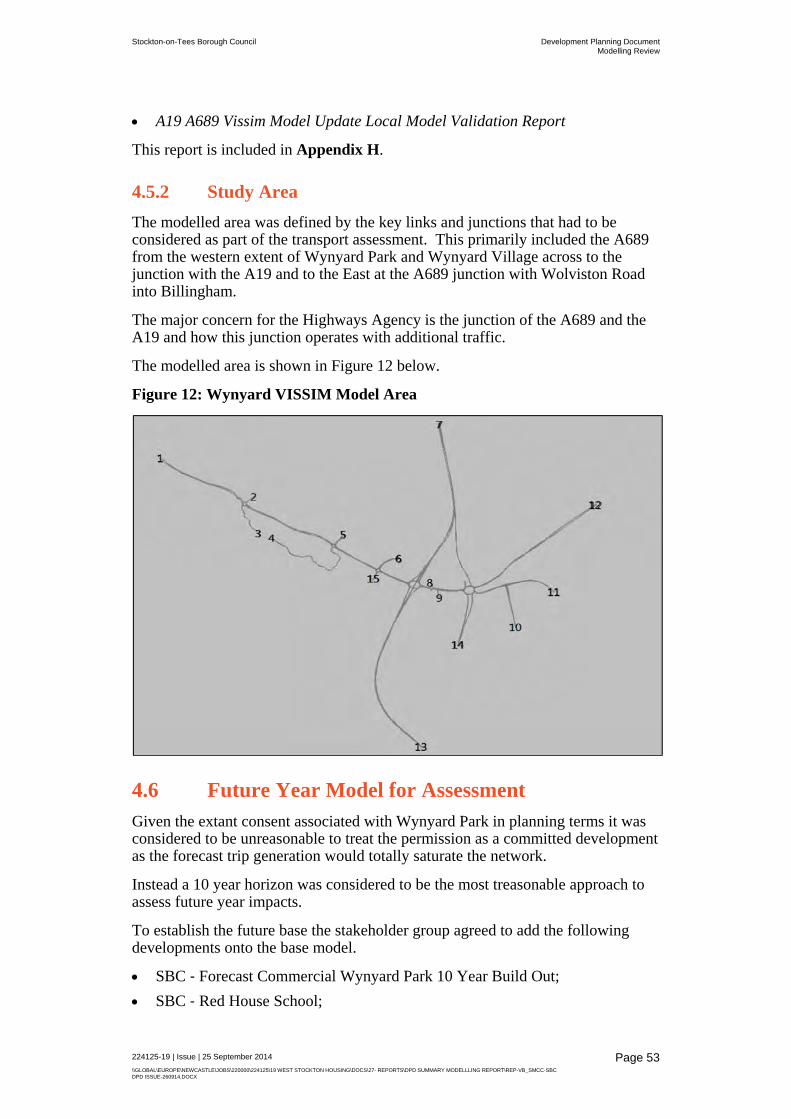
Stockton-on-Tees Borough Council Development Planning DocumentModelling Review
224125-19 | Issue | 25 September 2014
\\GLOBAL\EUROPE\NEWCASTLE\JOBS\220000\224125\19 WEST STOCKTON HOUSING\DOCS\27- REPORTS\DPD SUMMARY MODELLLING REPORT\REP-VB_SMCC-SBC DPD ISSUE-260914.DOCX
Page 53
A19 A689 Vissim Model Update Local Model Validation Report
This report is included in Appendix H.
4.5.2 Study Area
The modelled area was defined by the key links and junctions that had to be considered as part of the transport assessment. This primarily included the A689 from the western extent of Wynyard Park and Wynyard Village across to the junction with the A19 and to the East at the A689 junction with Wolviston Road into Billingham.
The major concern for the Highways Agency is the junction of the A689 and the A19 and how this junction operates with additional traffic.
The modelled area is shown in Figure 12 below.
Figure 12: Wynyard VISSIM Model Area
4.6 Future Year Model for Assessment Given the extant consent associated with Wynyard Park in planning terms it was considered to be unreasonable to treat the permission as a committed development as the forecast trip generation would totally saturate the network.
Instead a 10 year horizon was considered to be the most treasonable approach to assess future year impacts.
To establish the future base the stakeholder group agreed to add the following developments onto the base model.
SBC ‐ Forecast Commercial Wynyard Park 10 Year Build Out;
SBC ‐ Red House School;

Stockton-on-Tees Borough Council Development Planning DocumentModelling Review
224125-19 | Issue | 25 September 2014
\\GLOBAL\EUROPE\NEWCASTLE\JOBS\220000\224125\19 WEST STOCKTON HOUSING\DOCS\27- REPORTS\DPD SUMMARY MODELLLING REPORT\REP-VB_SMCC-SBC DPD ISSUE-260914.DOCX
Page 54
SBC ‐ Wynyard Golf Club Hotel;
HBC ‐ North Tees and Hartlepool Hospital;
HBC ‐ Taylor Wimpey – 200 Residential Units, The Pentagon site;
HBC ‐ Wynyard Woods 1 (34 units);
HBC ‐ Wynyard Woods 2 (100 units); and,
HBC ‐ Hartlepool SW Extension (720 of 2750 proposed HBC allocation).
The location of the developments is indicated in Figure 13 below.
Figure 13: Committed Developments
The traffic flows associated with these committed developments are included in Appendix I.
As so much committed development was added into the model to derive the future base the stakeholder group agreed that no background traffic growth would be applied to base flows i.e. the traffic flows related to the committed developments is the background traffic growth.
4.7 Residential Assessment Process A comprehensive assessment of the residential sites was undertaken, trip rates, committed developments, trip distribution and all assumptions agreed between stakeholders.
The model was then run by JMP, the Highways Agencies term consultants and results were passed onto Arup who in turn passed the results on the developer teams for interpretation.
In considering the initial results the applicants were able to determine what further mitigation was required to facilitate the optimum traffic conditions for each development.

Stockton-on-Tees Borough Council Development Planning DocumentModelling Review
224125-19 | Issue | 25 September 2014
\\GLOBAL\EUROPE\NEWCASTLE\JOBS\220000\224125\19 WEST STOCKTON HOUSING\DOCS\27- REPORTS\DPD SUMMARY MODELLLING REPORT\REP-VB_SMCC-SBC DPD ISSUE-260914.DOCX
Page 55
4.8 Highway Mitigation The mitigation proposed the applicants was run by JMP using the Vissim model and the following mitigation package was identified.
In addition to the A19/A689 Pinchpoint Scheme, the three residential sites residential developments requires signalisation and minor widening of:
SBC ‐ A689/Wynyard Avenue/(Red House School) Roundabout;
SBC ‐ A689/Glenarm Road/The Wynd Roundabout; and,
HBC ‐ A689/The Wynd Roundabout; and,
A foot/cycle bridge over the A689.
The proposed mitigation assumes that the HBC housing growth within the south west extension is capped to 720 units. It’s worth nothing there are aspirations for considerably more which may require further analysis to determine additional mitigation.
This is a similar package of mitigation included with the hospital planning consent, however the hospital package also proposes additional signalisation of:
SBC ‐ A689/Services Roundabout; and,
SBC ‐ A689/A1185 Wolviston Road Roundabout.
The plans associated with the mitigation are included in Appendix J.
4.9 Cumulative Scenario The cumulative scenario used to identify the final results assumes that all the residential developments and the hospital are built across all three sites in the ten year time frame used to determine the future base scenario.
It includes the hospital and all the mitigation proposals.
Prior to the implementation of any developments trigger points will be established to ensure mitigation is delivered prior to junctions operating at capacity.
The modelling indicated that the AM Peak period was the most onerous time period.
Snapshots of network performance are identified below in Figures 13-16.
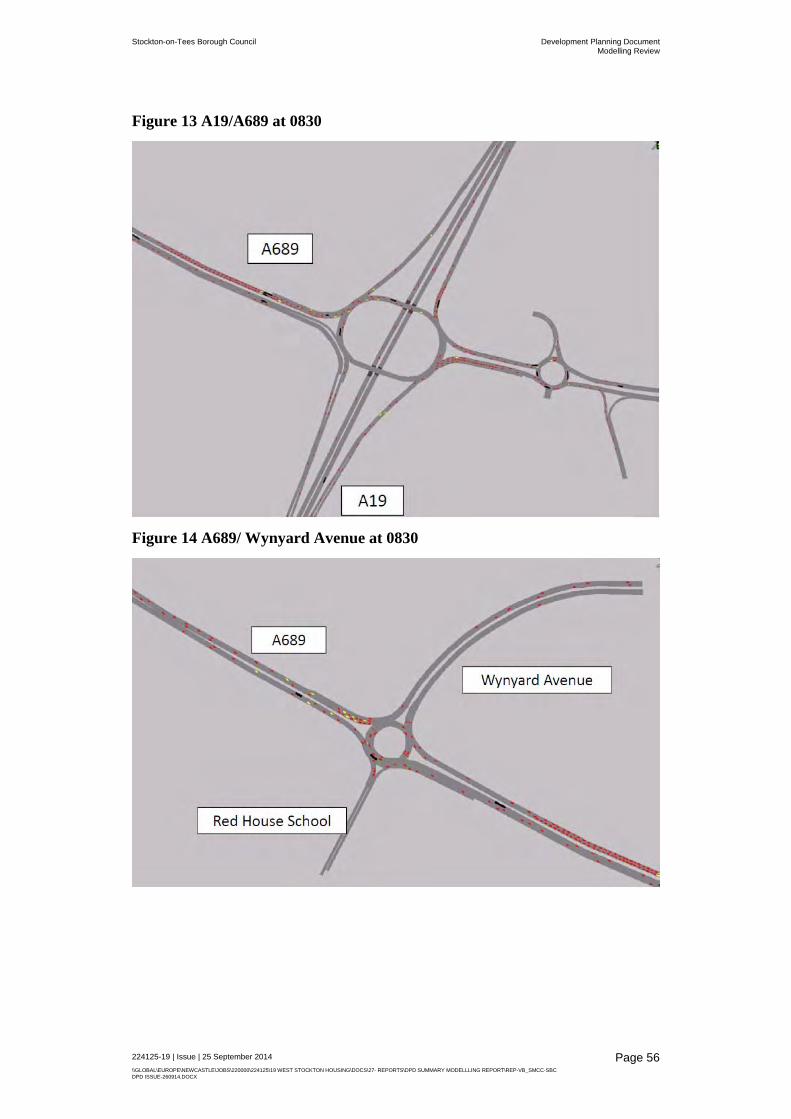
Stockton-on-Tees Borough Council Development Planning DocumentModelling Review
224125-19 | Issue | 25 September 2014
\\GLOBAL\EUROPE\NEWCASTLE\JOBS\220000\224125\19 WEST STOCKTON HOUSING\DOCS\27- REPORTS\DPD SUMMARY MODELLLING REPORT\REP-VB_SMCC-SBC DPD ISSUE-260914.DOCX
Page 56
Figure 13 A19/A689 at 0830
Figure 14 A689/ Wynyard Avenue at 0830
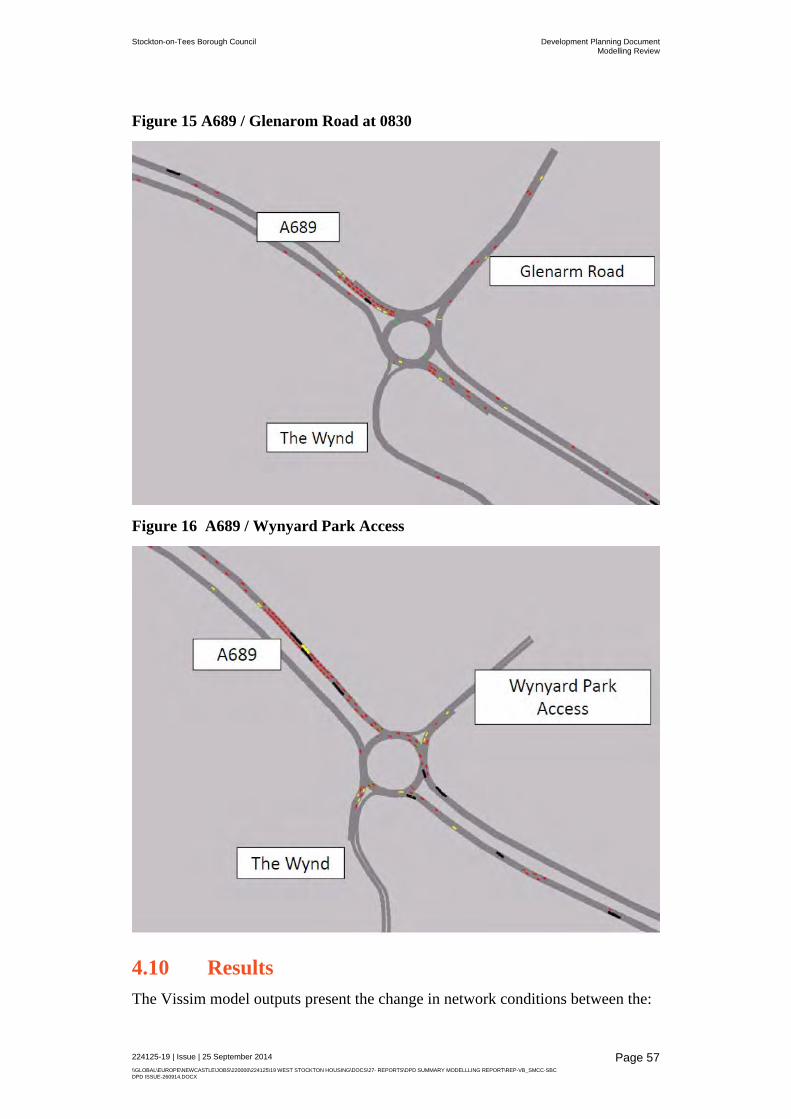
Stockton-on-Tees Borough Council Development Planning DocumentModelling Review
224125-19 | Issue | 25 September 2014
\\GLOBAL\EUROPE\NEWCASTLE\JOBS\220000\224125\19 WEST STOCKTON HOUSING\DOCS\27- REPORTS\DPD SUMMARY MODELLLING REPORT\REP-VB_SMCC-SBC DPD ISSUE-260914.DOCX
Page 57
Figure 15 A689 / Glenarom Road at 0830
Figure 16 A689 / Wynyard Park Access
4.10 Results The Vissim model outputs present the change in network conditions between the:

Stockton-on-Tees Borough Council Development Planning DocumentModelling Review
224125-19 | Issue | 25 September 2014
\\GLOBAL\EUROPE\NEWCASTLE\JOBS\220000\224125\19 WEST STOCKTON HOUSING\DOCS\27- REPORTS\DPD SUMMARY MODELLLING REPORT\REP-VB_SMCC-SBC DPD ISSUE-260914.DOCX
Page 58
Existing situation;
future year (2023) with and without hospital; and,
Future year with hospital and with all the residential development.
The outputs present the changes in queues lengths, journey times across the A689 and traffic flows.
Journey times were used to determine the most tangible difference between each scenario.
The journey times for the key scenarios are identified below in Table 4.1
Table 4.1 Summary Model Journey Time Results.
The journey times were measured from west along the A689 from the west of The Wynd junction to the A19. The most critical time is the AM journey from west to east across the network – it currently takes 06:26.
Once all the committed development is added onto the network they journey time would be 31:15 AM Eastbound to A19 in 2023 with no junction improvements, this is the do nothing scenario.
In 2023 with hospital mitigation package introduced the journey time reduces to 08:04 due to signalisation of junctions along A689.
Adding 1,100 houses results in 2 minute increase of JT from west of the Wynd to the A19. Main increase in journey time relates to due to the MOVA traffic signals holding back traffic managing the discharge of vehicles onto the A19 main line.
Overall the increase in journey times was considered not to be severe taking into account guidance of NPPF and much better than the situation with no mitigation coming forward.

Appendix A
WeSAM Traffic Data

Key:
JTC Locations
Journey Time Routes
ATC Site
West Stockton Housing
Traffic Data Locations
Date Scale
May 2013 Not to Scale
7
10
4
Route 1
Route 2
Route 3
Route 3
Route 4
Route 5
Route 5
Route 6
5
1
N N
3
9
2
8
11
12
6
5

389 A177 Durham Road
1060
966 94
354
Tesco
0
234
389 260 234
649
A177 Durham Road 1200
649 A177 Durham Road
1200
294 308 638 254
98 67 581 578 594 588 632 281
31 581 3 594 6 632 57 650
Letch Lane Harrowgate Lane Harrowgate Lane Harrowgate Lane
Harrowgate Lane Harrowgate Lane Harrowgate Lane B1274 Junction Road
50 453 456 488 147
42 453 448 456 432 488 102 570
8 514 411 5 16 8 24 44 56 78 208 115 321
522 21 68 401
Harrowgate Lane 442 Einstein Way 11 Easington Road 62 A177 Durham Road 1016
522 Harrowgate Lane
442
406 36
345
SBC-21/03/13
Scurfield Road
17
172
505 309 155
814
Harrowgate Lane 561
814 Harrowgate Lane
561
530 31
41
SBC-21/03/13
Marske Lane
44
72
770 10 28
780
Harrowgate Lane 558
780 Harrowgate Lane
558
542 16
24
SBC-21/03/13
Leam Lane
36
88
744 8 52
752
Redmarshall Road Harrowgate Lane 594
96
752 Harrowgate Lane
225
9 18 158 49 594
238 195 539 379 215
34 473 351 656 117
473 122 656 332
Darlington Back Lane SMS-14/03/13 Darlington Back Lane SMS-14/03/13 Darlington Back Lane
Darlington Back Lane Darlington Back Lane SBC-26/03/13 Darlington Back Lane
261 44 753 591 213
231 753 486 591 212 425
12 43 229 478 267 305 105
284 572
Yarm Back Lane 670 Bishopton Road 227
SMS-14/03/13
ID 1 2 3 4 5 Sum
1. Yarm Back Lane 1 0 14 436 223 0 673
2. Darlington Road East 2 2 0 217 205 0 424
3 0 0 0 0 0 0
4 270 171 301 0 0 742 0.36 0.23 0.41 0.61 0.39
5. EB OFF-Slip 3. EB ON-Slip 5 12 40 0 45 0 97
284 225 954 473 0 1936
4. Overbridge A66
A66 SMS-14/03/13
ID 4 6 7 8 9 Sum
9. WB ON-Slip 6. WB OFF-Slip 4 0 0 292 36 145 473 0.62 0.08 0.31 0.89 0.11
6 223 0 169 31 0 423
7 478 0 0 3 23 504
8. Darlington Road West 8 41 0 13 0 1 55
9 0 0 0 0 0 0
7. Durham Lane 742 0 474 70 169 1455
Traffic Counts: AM Peak Car (07:45 - 08:45)
West Stockton Housing
AIMSUN Base 2013 Model
Darlington Road West
Junction B
Yarm Back Lane
Darlington Road East
A66 EB ON-Slip
Overbridge
A66 EB OFF-Slip
Sum
Junction A
Overbridge
A66 WB OFF-Slip
Durham Lane
A66 WB ON-Slip
Sum
B
A

11 A177 Durham Road
75
75 0
0
Tesco
0
8
11 0 8
11
A177 Durham Road 83
11 A177 Durham Road
83
2 65 12 6
4 4 52 52 52 52 52 47
0 52 0 52 0 52 3 58
Letch Lane Harrowgate Lane Harrowgate Lane Harrowgate Lane
Harrowgate Lane Harrowgate Lane Harrowgate Lane B1274 Junction Road
2 72 72 72 3
2 72 72 72 71 72 4 13
0 48 70 0 0 0 1 0 1 3 6 5 6
48 0 1 14
Harrowgate Lane 70 Einstein Way 0 Easington Road 1 A177 Durham Road 21
48 Harrowgate Lane
70
70 0
0
Scurfield Road
0
0
48 0 0
48
Harrowgate Lane 70
48 Harrowgate Lane
70
68 2
2
Marske Lane
0
2
48 0 2
48
Harrowgate Lane 70
48 Harrowgate Lane
70
68 2
3
Leam Lane
1
1
47 1 0
48
Redmarshall Road Harrowgate Lane 68
21
48 Harrowgate Lane
20
2 0 11 9 68
32 18 43 64 4
12 51 27 44 1
51 24 44 5
Darlington Back Lane SMS-14/03/13 Darlington Back Lane SMS-14/03/13 Darlington Back Lane
Darlington Back Lane Darlington Back Lane SMS-14/03/13 Darlington Back Lane
26 7 69 66 5
20 69 49 66 2 7
6 12 24 42 20 17 17
42 37
Yarm Back Lane 65 Bishopton Road 41
SMS-14/03/13
ID 1 2 3 4 5 Sum
1. Yarm Back Lane 1 0 1 44 16 0 61
2. Darlington Road East 2 0 0 20 21 0 41
3 0 0 0 0 0 0
4 37 26 35 0 0 98 0.38 0.27 0.36 0.59 0.41
5. EB OFF-Slip 3. EB ON-Slip 5 3 5 0 3 0 11
40 32 99 40 0 211
4. Overbridge A66
A66 SMS-14/03/13
ID 4 6 7 8 9 Sum
9. WB ON-Slip 6. WB OFF-Slip 4 0 0 20 4 16 40 0.5 0.1 0.4 0.83 0.17
6 49 0 27 1 0 77
7 47 0 0 1 0 48
8. Darlington Road West 8 2 0 0 0 0 2
9 0 0 0 0 0 0
7. Durham Lane 98 0 47 6 16 167
Traffic Counts: AM Peak LGV (07:45 - 08:45)
West Stockton Housing
AIMSUN Base 2013 Model
Darlington Road West
Junction B
Yarm Back Lane
Darlington Road East
A66 EB ON-Slip
Overbridge
A66 EB OFF-Slip
Sum
Junction A
Overbridge
A66 WB OFF-Slip
Durham Lane
A66 WB ON-Slip
Sum
B
A

8 A177 Durham Road
12
12 0
0
Tesco
0
2
8 0 2
8
A177 Durham Road 14
8 A177 Durham Road
14
1 1 10 3
2 2 3 3 4 4 4 1
0 3 0 4 0 4 2 4
Letch Lane Harrowgate Lane Harrowgate Lane Harrowgate Lane
Harrowgate Lane Harrowgate Lane Harrowgate Lane B1274 Junction Road
2 5 4 4 0
2 5 4 4 4 4 2 5
0 1 3 1 1 0 0 0 0 1 7 0 3
1 2 0 8
Harrowgate Lane 3 Einstein Way 0 Easington Road 0 A177 Durham Road 15
1 Harrowgate Lane
3
3 0
2
Scurfield Road
0
0
1 2 0
3
Harrowgate Lane 3
3 Harrowgate Lane
3
3 0
0
Marske Lane
0
0
3 0 0
3
Harrowgate Lane 3
3 Harrowgate Lane
3
2 1
1
Leam Lane
0
0
3 0 0
3
Redmarshall Road Harrowgate Lane 2
2
3 Harrowgate Lane
5
0 1 4 0 2
8 4 2 1 1
4 8 7 9 7
8 1 9 8
Darlington Back Lane SMS-14/03/13 Darlington Back Lane SMS-14/03/13 Darlington Back Lane
Darlington Back Lane Darlington Back Lane SMS-14/03/13 Darlington Back Lane
5 0 10 12 1
2 10 8 12 11 12
2 2 4 8 2 2 4
8 4
Yarm Back Lane 16 Bishopton Road 5
SMS-14/03/13
ID 1 2 3 4 5 Sum
1. Yarm Back Lane 1 1 12 3 0 16
2. Darlington Road East 2 0 4 5 0 9
3 0 0 0 0 0
4 7 1 25 0 33 0.21 0.03 0.76 0.88 0.13
5. EB OFF-Slip 3. EB ON-Slip 5 1 1 0 6 8
8 3 41 14 0 66
4. Overbridge A66
A66 SMS-14/03/13
ID 4 6 7 8 9 Sum
9. WB ON-Slip 6. WB OFF-Slip 4 0 10 1 3 14 0.71 0.07 0.21 0.91 0.09
6 7 13 0 0 20
7 25 0 0 4 29
8. Darlington Road West 8 1 0 0 0 1
9 0 0 0 0 0
7. Durham Lane 33 0 23 1 7 64
West Stockton Housing
AIMSUN Base 2013 Model
Traffic Counts: AM Peak HGV (07:45 - 08:45)
Junction B
Yarm Back Lane
Darlington Road East
A66 EB ON-Slip
Overbridge
A66 WB ON-Slip
Sum
Sum
Junction A
Overbridge
A66 WB OFF-Slip
Durham Lane
Darlington Road West
A66 EB OFF-SlipB
A

270 A177 Durham Road
552
439 113
733
Tesco
0
640
270 620 640
890
A177 Durham Road 1079
890 A177 Durham Road
1079
277 442 377 260
59 50 469 467 482 468 513 174
9 469 2 482 14 513 62 666
Letch Lane Harrowgate Lane Harrowgate Lane Harrowgate Lane
Harrowgate Lane Harrowgate Lane Harrowgate Lane B1274 Junction Road
99 696 707 761 249
89 696 693 707 686 760 240 569
10 419 607 3 15 14 21 45 74 79 364 232 80
429 18 66 675
Harrowgate Lane 616 Einstein Way 16 Easington Road 88 A177 Durham Road 519
429 Harrowgate Lane
616
564 52
186
SBC-21/03/13
Scurfield Road
50
338
379 134 288
513
Harrowgate Lane 852
513 Harrowgate Lane
852
769 83
102
SBC-21/03/13
Marske Lane
45
58
468 19 13
487
Harrowgate Lane 782
487 Harrowgate Lane
782
739 43
94
SBC-21/03/13
Leam Lane
24
62
463 51 38
514
Redmarshall Road Harrowgate Lane 777
222
514 Harrowgate Lane
174
35 12 86 76 777
302 247 393 515 262
20 641 467 608 215
641 174 608 477
Darlington Back Lane SMS-14/03/13 Darlington Back Lane SMS-14/03/13 Darlington Back Lane
Darlington Back Lane Darlington Back Lane SBC-26/03/13 Darlington Back Lane
232 68 582 643 121
180 582 405 643 128 249
40 119 318 334 177 141 238
477 318
Yarm Back Lane 440 Bishopton Road 412
SMS-14/03/13
ID 1 2 3 4 5 Sum
1. Yarm Back Lane 1 0 27 243 171 0 441
2. Darlington Road East 2 9 0 140 138 0 287
3 0 0 0 0 0 0
4 440 482 174 0 0 1096 0.4 0.44 0.16 0.48 0.52
5. EB OFF-Slip 3. EB ON-Slip 5 25 126 0 23 0 174
473.5 635 557 332 0 1998
4. Overbridge A66
A66 SMS-14/03/13
ID 4 6 7 8 9 Sum
9. WB ON-Slip 6. WB OFF-Slip 4 0 0 212 57 63 332 0.64 0.17 0.19 0.79 0.21
6 625 0 210 156 0 991
7 427 0 0 12 19 457.5
8. Darlington Road West 8 44 0 5 0 1 50
9 0 0 0 0 0 0
7. Durham Lane 1096 0 427 225 83 1831
Traffic Counts: PM Peak Car (16:30 - 17:30)
West Stockton Housing
AIMSUN Base 2013 Model
Darlington Road West
A66 EB OFF-Slip
Sum
Junction A
Overbridge
A66 WB OFF-Slip
Durham Lane
A66 WB ON-Slip
Sum
Junction B
Yarm Back Lane
Darlington Road East
A66 EB ON-Slip
OverbridgeB
A
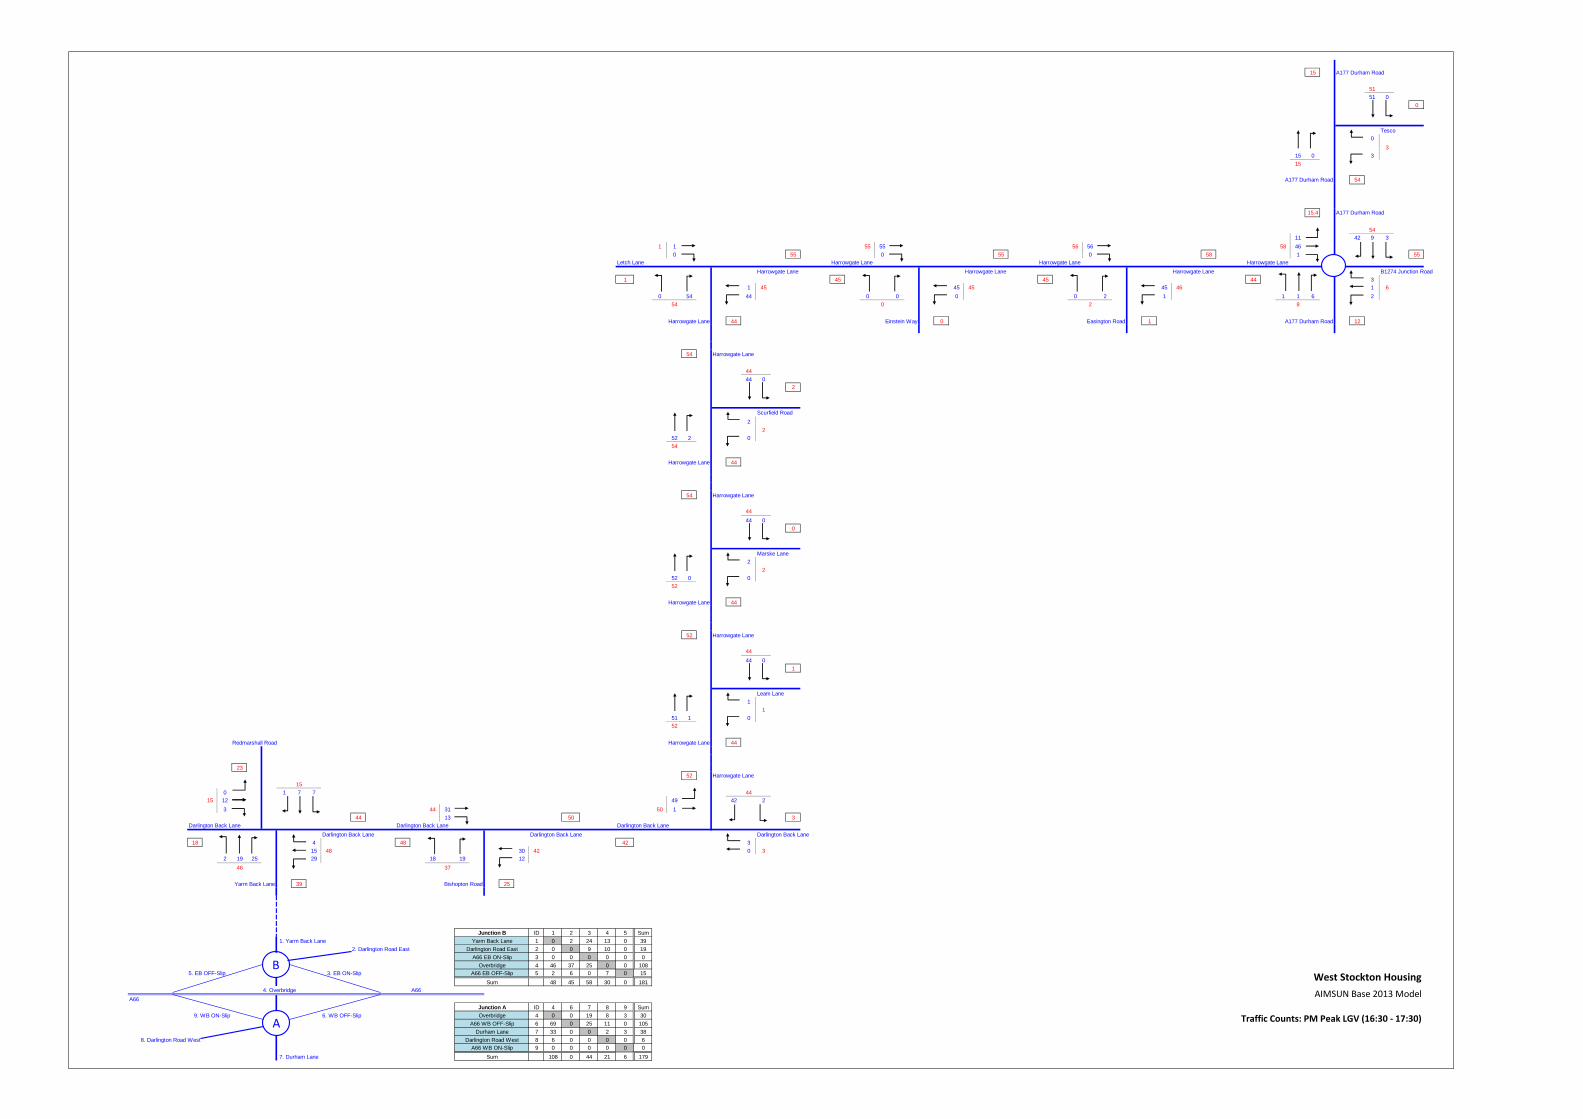
15 A177 Durham Road
51
51 0
0
Tesco
0
3
15 0 3
15
A177 Durham Road 54
15.4 A177 Durham Road
54
11 42 9 3
1 1 55 55 56 56 58 46
0 55 0 55 0 58 1 55
Letch Lane Harrowgate Lane Harrowgate Lane Harrowgate Lane
Harrowgate Lane Harrowgate Lane Harrowgate Lane B1274 Junction Road
1 45 45 44 3
1 45 45 45 45 46 1 6
0 54 44 0 0 0 0 2 1 1 1 6 2
54 0 2 8
Harrowgate Lane 44 Einstein Way 0 Easington Road 1 A177 Durham Road 12
54 Harrowgate Lane
44
44 0
2
Scurfield Road
2
2
52 2 0
54
Harrowgate Lane 44
54 Harrowgate Lane
44
44 0
0
Marske Lane
2
2
52 0 0
52
Harrowgate Lane 44
52 Harrowgate Lane
44
44 0
1
Leam Lane
1
1
51 1 0
52
Redmarshall Road Harrowgate Lane 44
23
52 Harrowgate Lane
15
0 1 7 7 44
15 12 49 42 2
3 44 31 50 1
44 13 50 3
Darlington Back Lane SMS-14/03/13 Darlington Back Lane SMS-14/03/13 Darlington Back Lane
Darlington Back Lane Darlington Back Lane SMS-14/03/13 Darlington Back Lane
18 4 48 42 3
15 48 30 42 0 3
2 19 25 29 18 19 12
46 37
Yarm Back Lane 39 Bishopton Road 25
SMS-14/03/13
ID 1 2 3 4 5 Sum
1. Yarm Back Lane 1 0 2 24 13 0 39
2. Darlington Road East 2 0 0 9 10 0 19
3 0 0 0 0 0 0
4 46 37 25 0 0 108 0.43 0.34 0.23 0.55 0.45
5. EB OFF-Slip 3. EB ON-Slip 5 2 6 0 7 0 15
48 45 58 30 0 181
4. Overbridge A66
A66 SMS-14/03/13
ID 4 6 7 8 9 Sum
9. WB ON-Slip 6. WB OFF-Slip 4 0 0 19 8 3 30 0.63 0.27 0.1 0.7 0.3
6 69 0 25 11 0 105
7 33 0 0 2 3 38
8. Darlington Road West 8 6 0 0 0 0 6
9 0 0 0 0 0 0
7. Durham Lane 108 0 44 21 6 179
Traffic Counts: PM Peak LGV (16:30 - 17:30)
West Stockton Housing
AIMSUN Base 2013 Model
Darlington Road West
A66 EB OFF-Slip
Sum
Junction A
Overbridge
A66 WB OFF-Slip
Durham Lane
A66 WB ON-Slip
Sum
Junction B
Yarm Back Lane
Darlington Road East
A66 EB ON-Slip
OverbridgeB
A

4 A177 Durham Road
9
9 0
0
Tesco
0
3
4 0 3
4
A177 Durham Road 12
4 A177 Durham Road
12
0 5 5 2
2 2 1 1 1 1 1 1
0 1 0 1 0 1 0 3
Letch Lane Harrowgate Lane Harrowgate Lane Harrowgate Lane
Harrowgate Lane Harrowgate Lane Harrowgate Lane B1274 Junction Road
2 6 6 6 0
2 6 6 6 6 6 1 2
0 -1 4 0 0 0 0 0 0 0 4 0 1
-1 0 0 4
Harrowgate Lane 4 Einstein Way 0 Easington Road 0 A177 Durham Road 6
-1 Harrowgate Lane
4
2 2
3
Scurfield Road
0
2
-1 1 2
0
Harrowgate Lane 4
0 Harrowgate Lane
4
4 0
0
Marske Lane
0
0
0 0 0
0
Harrowgate Lane 4
0 Harrowgate Lane
4
4 0
0
Leam Lane
0
0
0 0 0
0
Redmarshall Road Harrowgate Lane 4
6
0 Harrowgate Lane
1
0 0 1 0 4
7 6 0 4 0
1 8 5 7 7
8 3 7 7
Darlington Back Lane SMS-14/03/13 Darlington Back Lane SMS-14/03/13 Darlington Back Lane
Darlington Back Lane Darlington Back Lane SMS-14/03/13 Darlington Back Lane
5 1 7 4 0
3 7 3 4 0 0
2 5 2 3 4 2 1
9 6
Yarm Back Lane 5 Bishopton Road 4
SMS-14/03/13
ID 1 2 3 4 5 Sum
1. Yarm Back Lane 1 0 2 3 0 5
2. Darlington Road East 2 0 0 1 0 1
3 0 0 0 0 0
4 10 3 9 0 22 0.45 0.14 0.41 0.77 0.23
5. EB OFF-Slip 3. EB ON-Slip 5 0 3 0 5 8
10 6 11 9 0 36
4. Overbridge A66
A66 SMS-14/03/13
ID 4 6 7 8 9 Sum
9. WB ON-Slip 6. WB OFF-Slip 4 0 7 0 2 9 0.78 0 0.22 1 0
6 12 11 7 0 30
7 10 0 0 7 17
8. Darlington Road West 8 0 0 0 0 0
9 0 0 0 0 0
7. Durham Lane 22 0 18 7 9 56
West Stockton Housing
AIMSUN Base 2013 Model
Traffic Counts: PM Peak HGV (16:30 - 17:30)
A66 WB ON-Slip
Sum
Darlington Road West
A66 WB OFF-Slip
Durham Lane
Junction B
Yarm Back Lane
Darlington Road East
A66 EB ON-Slip
Overbridge
A66 EB OFF-Slip
Sum
Junction A
Overbridge
B
A

Appendix B
WeSAM Matrices
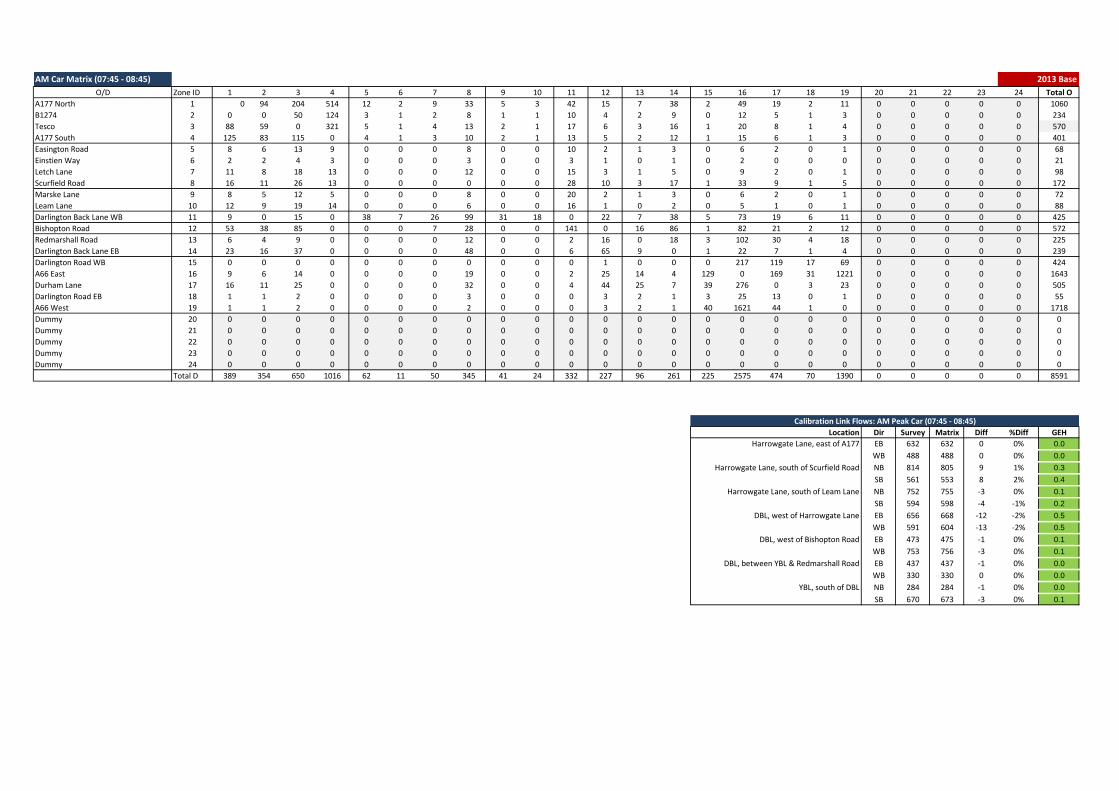
AM Car Matrix (07:45 - 08:45) 2013 Base
O/D Zone ID 1 2 3 4 5 6 7 8 9 10 11 12 13 14 15 16 17 18 19 20 21 22 23 24 Total O
A177 North 1 0 94 204 514 12 2 9 33 5 3 42 15 7 38 2 49 19 2 11 0 0 0 0 0 1060
B1274 2 0 0 50 124 3 1 2 8 1 1 10 4 2 9 0 12 5 1 3 0 0 0 0 0 234
Tesco 3 88 59 0 321 5 1 4 13 2 1 17 6 3 16 1 20 8 1 4 0 0 0 0 0 570
A177 South 4 125 83 115 0 4 1 3 10 2 1 13 5 2 12 1 15 6 1 3 0 0 0 0 0 401
Easington Road 5 8 6 13 9 0 0 0 8 0 0 10 2 1 3 0 6 2 0 1 0 0 0 0 0 68
Einstien Way 6 2 2 4 3 0 0 0 3 0 0 3 1 0 1 0 2 0 0 0 0 0 0 0 0 21
Letch Lane 7 11 8 18 13 0 0 0 12 0 0 15 3 1 5 0 9 2 0 1 0 0 0 0 0 98
Scurfield Road 8 16 11 26 13 0 0 0 0 0 0 28 10 3 17 1 33 9 1 5 0 0 0 0 0 172
Marske Lane 9 8 5 12 5 0 0 0 8 0 0 20 2 1 3 0 6 2 0 1 0 0 0 0 0 72
Leam Lane 10 12 9 19 14 0 0 0 6 0 0 16 1 0 2 0 5 1 0 1 0 0 0 0 0 88
Darlington Back Lane WB 11 9 0 15 0 38 7 26 99 31 18 0 22 7 38 5 73 19 6 11 0 0 0 0 0 425
Bishopton Road 12 53 38 85 0 0 0 7 28 0 0 141 0 16 86 1 82 21 2 12 0 0 0 0 0 572
Redmarshall Road 13 6 4 9 0 0 0 0 12 0 0 2 16 0 18 3 102 30 4 18 0 0 0 0 0 225
Darlington Back Lane EB 14 23 16 37 0 0 0 0 48 0 0 6 65 9 0 1 22 7 1 4 0 0 0 0 0 239
Darlington Road WB 15 0 0 0 0 0 0 0 0 0 0 0 1 0 0 0 217 119 17 69 0 0 0 0 0 424
A66 East 16 9 6 14 0 0 0 0 19 0 0 2 25 14 4 129 0 169 31 1221 0 0 0 0 0 1643
Durham Lane 17 16 11 25 0 0 0 0 32 0 0 4 44 25 7 39 276 0 3 23 0 0 0 0 0 505
Darlington Road EB 18 1 1 2 0 0 0 0 3 0 0 0 3 2 1 3 25 13 0 1 0 0 0 0 0 55
A66 West 19 1 1 2 0 0 0 0 2 0 0 0 3 2 1 40 1621 44 1 0 0 0 0 0 0 1718
Dummy 20 0 0 0 0 0 0 0 0 0 0 0 0 0 0 0 0 0 0 0 0 0 0 0 0 0
Dummy 21 0 0 0 0 0 0 0 0 0 0 0 0 0 0 0 0 0 0 0 0 0 0 0 0 0
Dummy 22 0 0 0 0 0 0 0 0 0 0 0 0 0 0 0 0 0 0 0 0 0 0 0 0 0
Dummy 23 0 0 0 0 0 0 0 0 0 0 0 0 0 0 0 0 0 0 0 0 0 0 0 0 0
Dummy 24 0 0 0 0 0 0 0 0 0 0 0 0 0 0 0 0 0 0 0 0 0 0 0 0 0
Total D 389 354 650 1016 62 11 50 345 41 24 332 227 96 261 225 2575 474 70 1390 0 0 0 0 0 8591
0 0 0 0 0 0 0 0 0 0 0 0 0 0 0 1621 0 0 1221 0 0 0 0 0
Trads Data WB EB Location Dir Survey Matrix Diff %Diff GEH
A66 East of Elton I/C 2044 3120 Harrowgate Lane, east of A177 EB 632 632 0 0% 0.0
Slip Flow 518 1094 WB 488 488 0 0% 0.0
Mailine 1526 2026 Harrowgate Lane, south of Scurfield Road NB 814 805 9 1% 0.3
0.8 SB 561 553 8 2% 0.4
Car 1220.67 1620.8 Harrowgate Lane, south of Leam Lane NB 752 755 -3 0% 0.1
SB 594 598 -4 -1% 0.2
DBL, west of Harrowgate Lane EB 656 668 -12 -2% 0.5
WB 591 604 -13 -2% 0.5
DBL, west of Bishopton Road EB 473 475 -1 0% 0.1
WB 753 756 -3 0% 0.1
DBL, between YBL & Redmarshall Road EB 437 437 -1 0% 0.0
WB 330 330 0 0% 0.0
YBL, south of DBL NB 284 284 -1 0% 0.0
SB 670 673 -3 0% 0.1
Calibration Link Flows: AM Peak Car (07:45 - 08:45)

AM LGV Matrix (07:45 - 08:45) 2013 Base
O/D Zone ID 1 2 3 4 5 6 7 8 9 10 11 12 13 14 15 16 17 18 19 20 21 22 23 24 Total O
A177 North 1 0 0 5 11 1 0 1 0 1 2 2 11 4 11 0 16 3 1 3 0 0 0 0 0 73
B1274 2 0 0 1 1 0 0 0 0 0 0 0 1 0 1 0 2 0 0 0 0 0 0 0 0 8
Tesco 3 3 0 0 6 0 0 0 0 0 0 0 1 0 1 0 1 0 0 0 0 0 0 0 0 13
A177 South 4 6 0 5 0 0 0 0 0 0 0 0 1 0 1 0 1 0 0 0 0 0 0 0 0 14
Easington Road 5 0 0 0 0 0 0 0 0 0 0 0 0 0 0 0 0 0 0 0 0 0 0 0 0 1
Einstien Way 6 0 0 0 0 0 0 0 0 0 0 0 0 0 0 0 0 0 0 0 0 0 0 0 0 0
Letch Lane 7 0 0 2 2 0 0 0 0 0 0 0 0 0 0 0 0 0 0 0 0 0 0 0 0 4
Scurfield Road 8 0 0 0 0 0 0 0 0 0 0 0 0 0 0 0 0 0 0 0 0 0 0 0 0 0
Marske Lane 9 0 0 1 1 0 0 0 0 0 0 0 0 0 0 0 0 0 0 0 0 0 0 0 0 2
Leam Lane 10 0 0 0 0 0 0 0 0 0 0 0 0 0 0 0 0 0 0 0 0 0 0 0 0 1
Darlington Back Lane WB 11 0 0 1 0 0 0 0 0 0 1 0 1 0 1 0 2 0 0 0 0 0 0 0 0 7
Bishopton Road 12 1 0 20 0 0 0 0 0 0 0 2 0 2 5 0 6 1 0 1 0 0 0 0 0 37
Redmarshall Road 13 0 0 4 0 0 0 0 0 0 0 0 5 0 0 0 8 1 0 1 0 0 0 0 0 20
Darlington Back Lane EB 14 0 0 8 0 0 0 0 0 0 0 0 10 2 0 0 9 1 0 1 0 0 0 0 0 32
Darlington Road WB 15 0 0 0 0 0 0 0 0 0 0 0 0 0 0 0 20 10 2 9 0 0 0 0 0 41
A66 East 16 0 0 6 0 0 0 0 0 0 0 0 7 8 4 23 0 27 1 229 0 0 0 0 0 305
Durham Lane 17 0 0 3 0 0 0 0 0 0 0 0 3 3 2 3 34 0 1 0 0 0 0 0 0 49
Darlington Road EB 18 0 0 0 0 0 0 0 0 0 0 0 0 0 0 0 1 0 0 0 0 0 0 0 0 2
A66 West 19 0 0 1 0 0 0 0 0 0 0 0 1 1 0 5 304 3 0 0 0 0 0 0 0 315
Dummy 20 0 0 0 0 0 0 0 0 0 0 0 0 0 0 0 0 0 0 0 0 0 0 0 0 0
Dummy 21 0 0 0 0 0 0 0 0 0 0 0 0 0 0 0 0 0 0 0 0 0 0 0 0 0
Dummy 22 0 0 0 0 0 0 0 0 0 0 0 0 0 0 0 0 0 0 0 0 0 0 0 0 0
Dummy 23 0 0 0 0 0 0 0 0 0 0 0 0 0 0 0 0 0 0 0 0 0 0 0 0 0
Dummy 24 0 0 0 0 0 0 0 0 0 0 0 0 0 0 0 0 0 0 0 0 0 0 0 0 0
Total D 11 0 58 21 1 0 2 0 2 3 5 41 21 26 32 403 47 6 245 0 0 0 0 0 924
Location Dir Survey Matrix Diff %Diff GEH
Harrowgate Lane, east of A177 EB 52 52 0 0% 0.0
WB 72 70 2 3% 0.2
Harrowgate Lane, south of Scurfield Road NB 48 48 0 -1% 0.0
0.15 SB 70 68 2 2% 0.2
LGV 229 304 Harrowgate Lane, south of Leam Lane NB 48 47 1 2% 0.1
SB 68 65 3 4% 0.4
DBL, west of Harrowgate Lane EB 44 46 -2 -5% 0.3
WB 66 66 0 0% 0.0
DBL, west of Bishopton Road EB 51 49 2 3% 0.2
WB 69 65 4 6% 0.5
DBL, between YBL & Redmarshall Road EB 50 50 0 0% 0.0
WB 45 45 0 0% 0.0
YBL, south of DBL NB 42 40 2 4% 0.3
SB 65 61 4 6% 0.5
Calibration Link Flows: AM Peak LGV (07:45 - 08:45)

AM HGV Matrix (07:45 - 08:45) 2013 Base
O/D Zone ID 1 2 3 4 5 6 7 8 9 10 11 12 13 14 15 16 17 18 19 20 21 22 23 24 Total O
A177 North 1 0 0 3 9 0 0 0 0 0 0 0 0 0 0 0 0 0 0 0 0 0 0 0 0 12
B1274 2 0 0 0 1 0 0 0 0 0 0 0 0 0 0 0 0 0 0 0 0 0 0 0 0 2
Tesco 3 0 0 0 3 0 0 0 0 0 0 1 0 0 0 0 0 0 0 0 0 0 0 0 0 5
A177 South 4 7 0 0 0 0 0 0 0 0 0 1 0 0 0 0 0 0 0 0 0 0 0 0 0 8
Easington Road 5 0 0 0 0 0 0 0 0 0 0 0 0 0 0 0 0 0 0 0 0 0 0 0 0 0
Einstien Way 6 0 0 0 1 0 0 0 0 0 0 1 0 0 0 0 0 0 0 0 0 0 0 0 0 2
Letch Lane 7 0 0 0 1 0 0 0 0 0 0 1 0 0 0 0 0 0 0 0 0 0 0 0 0 2
Scurfield Road 8 0 0 0 0 0 0 0 0 0 0 0 0 0 0 0 0 0 0 0 0 0 0 0 0 0
Marske Lane 9 0 0 0 0 0 0 0 0 0 0 0 0 0 0 0 0 0 0 0 0 0 0 0 0 0
Leam Lane 10 0 0 0 0 0 0 0 0 0 0 0 0 0 0 0 0 0 0 0 0 0 0 0 0 0
Darlington Back Lane WB 11 0 0 0 0 0 0 2 1 0 1 0 1 0 1 0 4 1 0 0 0 0 0 0 0 12
Bishopton Road 12 0 0 0 0 0 0 0 0 0 0 3 0 0 0 0 1 0 0 0 0 0 0 0 0 4
Redmarshall Road 13 0 0 0 0 0 0 0 0 0 0 0 0 0 1 0 3 0 0 0 0 0 0 0 0 5
Darlington Back Lane EB 14 0 0 0 0 0 0 0 0 0 0 1 2 0 0 0 3 0 0 0 0 0 0 0 0 8
Darlington Road WB 15 0 0 0 0 0 0 0 0 0 0 0 0 0 0 0 4 3 0 2 0 0 0 0 0 9
A66 East 16 0 0 0 0 0 0 0 0 0 0 1 1 1 1 1 0 13 0 76 0 0 0 0 0 96
Durham Lane 17 0 0 0 0 0 0 0 0 0 0 0 0 0 0 0 24 0 0 4 0 0 0 0 0 30
Darlington Road EB 18 0 0 0 0 0 0 0 0 0 0 0 0 0 0 0 1 0 0 0 0 0 0 0 0 1
A66 West 19 0 0 0 0 0 0 0 0 0 0 0 0 0 0 1 101 6 0 0 0 0 0 0 0 109
Dummy 20 0 0 0 0 0 0 0 0 0 0 0 0 0 0 0 0 0 0 0 0 0 0 0 0 0
Dummy 21 0 0 0 0 0 0 0 0 0 0 0 0 0 0 0 0 0 0 0 0 0 0 0 0 0
Dummy 22 0 0 0 0 0 0 0 0 0 0 0 0 0 0 0 0 0 0 0 0 0 0 0 0 0
Dummy 23 0 0 0 0 0 0 0 0 0 0 0 0 0 0 0 0 0 0 0 0 0 0 0 0 0
Dummy 24 0 0 0 0 0 0 0 0 0 0 0 0 0 0 0 0 0 0 0 0 0 0 0 0 0
Total D 8 0 4 15 0 0 2 2 0 1 8 5 2 5 3 142 23 1 83 0 0 0 0 0 305
Location Dir Survey Matrix Diff %Diff GEH
Harrowgate Lane, east of A177 EB 4 4 0 0% 0.0
WB 4 4 0 -1% 0.0
Harrowgate Lane, south of Scurfield Road NB 3 5 -2 -82% 1.2
0.05 SB 3 6 -3 -88% 1.3
HGV 76 101 Harrowgate Lane, south of Leam Lane NB 3 6 -3 -114% 1.6
SB 2 6 -4 -180% 1.8
DBL, west of Harrowgate Lane EB 9 7 2 23% 0.7
WB 12 10 2 17% 0.6
DBL, west of Bishopton Road EB 8 8 0 1% 0.0
WB 10 10 0 0% 0.0
DBL, between YBL & Redmarshall Road EB 12 12 0 0% 0.0
WB 6 6 0 0% 0.0
YBL, south of DBL NB 8 8 0 1% 0.0
SB 16 16 0 0% 0.0
Calibration Link Flows: AM Peak HGV (07:45 - 08:45)
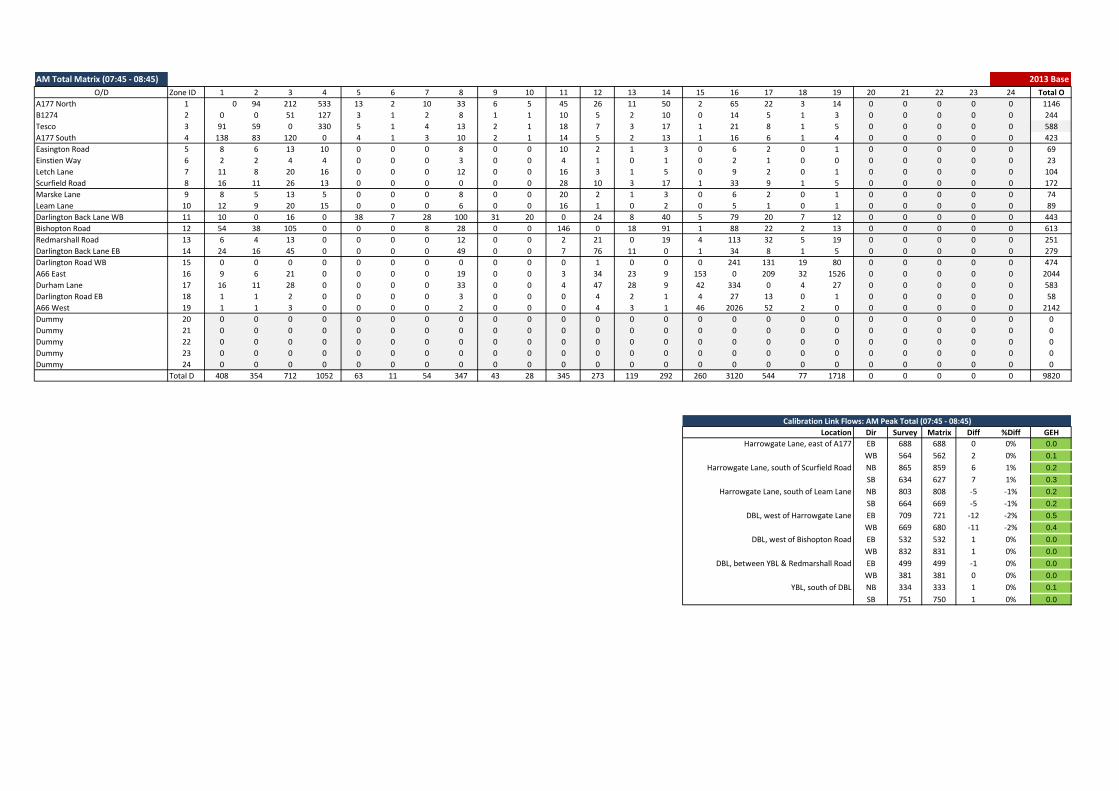
AM Total Matrix (07:45 - 08:45) 2013 Base
O/D Zone ID 1 2 3 4 5 6 7 8 9 10 11 12 13 14 15 16 17 18 19 20 21 22 23 24 Total O
A177 North 1 0 94 212 533 13 2 10 33 6 5 45 26 11 50 2 65 22 3 14 0 0 0 0 0 1146
B1274 2 0 0 51 127 3 1 2 8 1 1 10 5 2 10 0 14 5 1 3 0 0 0 0 0 244
Tesco 3 91 59 0 330 5 1 4 13 2 1 18 7 3 17 1 21 8 1 5 0 0 0 0 0 588
A177 South 4 138 83 120 0 4 1 3 10 2 1 14 5 2 13 1 16 6 1 4 0 0 0 0 0 423
Easington Road 5 8 6 13 10 0 0 0 8 0 0 10 2 1 3 0 6 2 0 1 0 0 0 0 0 69
Einstien Way 6 2 2 4 4 0 0 0 3 0 0 4 1 0 1 0 2 1 0 0 0 0 0 0 0 23
Letch Lane 7 11 8 20 16 0 0 0 12 0 0 16 3 1 5 0 9 2 0 1 0 0 0 0 0 104
Scurfield Road 8 16 11 26 13 0 0 0 0 0 0 28 10 3 17 1 33 9 1 5 0 0 0 0 0 172
Marske Lane 9 8 5 13 5 0 0 0 8 0 0 20 2 1 3 0 6 2 0 1 0 0 0 0 0 74
Leam Lane 10 12 9 20 15 0 0 0 6 0 0 16 1 0 2 0 5 1 0 1 0 0 0 0 0 89
Darlington Back Lane WB 11 10 0 16 0 38 7 28 100 31 20 0 24 8 40 5 79 20 7 12 0 0 0 0 0 443
Bishopton Road 12 54 38 105 0 0 0 8 28 0 0 146 0 18 91 1 88 22 2 13 0 0 0 0 0 613
Redmarshall Road 13 6 4 13 0 0 0 0 12 0 0 2 21 0 19 4 113 32 5 19 0 0 0 0 0 251
Darlington Back Lane EB 14 24 16 45 0 0 0 0 49 0 0 7 76 11 0 1 34 8 1 5 0 0 0 0 0 279
Darlington Road WB 15 0 0 0 0 0 0 0 0 0 0 0 1 0 0 0 241 131 19 80 0 0 0 0 0 474
A66 East 16 9 6 21 0 0 0 0 19 0 0 3 34 23 9 153 0 209 32 1526 0 0 0 0 0 2044
Durham Lane 17 16 11 28 0 0 0 0 33 0 0 4 47 28 9 42 334 0 4 27 0 0 0 0 0 583
Darlington Road EB 18 1 1 2 0 0 0 0 3 0 0 0 4 2 1 4 27 13 0 1 0 0 0 0 0 58
A66 West 19 1 1 3 0 0 0 0 2 0 0 0 4 3 1 46 2026 52 2 0 0 0 0 0 0 2142
Dummy 20 0 0 0 0 0 0 0 0 0 0 0 0 0 0 0 0 0 0 0 0 0 0 0 0 0
Dummy 21 0 0 0 0 0 0 0 0 0 0 0 0 0 0 0 0 0 0 0 0 0 0 0 0 0
Dummy 22 0 0 0 0 0 0 0 0 0 0 0 0 0 0 0 0 0 0 0 0 0 0 0 0 0
Dummy 23 0 0 0 0 0 0 0 0 0 0 0 0 0 0 0 0 0 0 0 0 0 0 0 0 0
Dummy 24 0 0 0 0 0 0 0 0 0 0 0 0 0 0 0 0 0 0 0 0 0 0 0 0 0
Total D 408 354 712 1052 63 11 54 347 43 28 345 273 119 292 260 3120 544 77 1718 0 0 0 0 0 9820
Location Dir Survey Matrix Diff %Diff GEH
Harrowgate Lane, east of A177 EB 688 688 0 0% 0.0
WB 564 562 2 0% 0.1
Harrowgate Lane, south of Scurfield Road NB 865 859 6 1% 0.2
SB 634 627 7 1% 0.3
Harrowgate Lane, south of Leam Lane NB 803 808 -5 -1% 0.2
SB 664 669 -5 -1% 0.2
DBL, west of Harrowgate Lane EB 709 721 -12 -2% 0.5
WB 669 680 -11 -2% 0.4
DBL, west of Bishopton Road EB 532 532 1 0% 0.0
WB 832 831 1 0% 0.0
DBL, between YBL & Redmarshall Road EB 499 499 -1 0% 0.0
WB 381 381 0 0% 0.0
YBL, south of DBL NB 334 333 1 0% 0.1
SB 751 750 1 0% 0.0
Calibration Link Flows: AM Peak Total (07:45 - 08:45)

PM Car Matrix (16:30 - 17:30) 2013 Base
O/D Zone ID 1 2 3 4 5 6 7 8 9 10 11 12 13 14 15 16 17 18 19 20 21 22 23 24 Total O
A177 North 1 0 113 106 153 15 3 17 13 19 18 27 14 7 18 1 15 8 2 3 0 0 0 0 0 551
B1274 2 0 0 154 224 22 4 25 19 28 26 39 20 10 27 2 21 12 2 4 0 0 0 0 0 639
Tesco 3 76 173 0 80 20 4 23 17 26 24 36 18 9 25 2 20 11 2 4 0 0 0 0 0 568
A177 South 4 110 254 232 0 7 1 8 6 9 8 12 6 3 8 1 6 4 1 1 0 0 0 0 0 675
Easington Road 5 4 8 7 28 0 0 0 4 0 0 8 2 1 2 0 2 1 0 0 0 0 0 0 0 67
Einstien Way 6 1 2 2 8 0 0 0 1 0 0 2 1 0 0 0 1 0 0 0 0 0 0 0 0 18
Letch Lane 7 3 7 7 25 0 0 0 3 0 0 7 2 1 2 0 2 1 0 0 0 0 0 0 0 60
Scurfield Road 8 14 32 29 0 0 0 0 0 0 0 126 32 11 29 6 35 13 7 5 0 0 0 0 0 338
Marske Lane 9 3 6 6 0 0 0 0 6 0 0 25 3 1 3 0 3 1 0 0 0 0 0 0 0 58
Leam Lane 10 3 7 6 0 0 0 0 6 0 0 27 3 1 3 0 4 1 0 0 0 0 0 0 0 62
Darlington Back Lane WB 11 0 0 0 0 15 3 9 6 20 18 0 34 12 31 9 56 21 8 5 0 0 0 0 0 248
Bishopton Road 12 16 36 32 0 0 0 11 8 0 0 140 0 12 32 1 19 7 1 3 0 0 0 0 0 318
Redmarshall Road 13 5 11 10 0 2 0 1 12 0 0 4 31 0 12 5 47 21 6 7 0 0 0 0 0 175
Darlington Back Lane EB 14 15 35 32 0 8 1 4 39 0 0 14 101 35 0 1 11 5 1 2 0 0 0 0 0 304
Darlington Road WB 15 0 1 1 0 0 0 0 1 0 0 0 3 2 1 0 140 85 25 28 0 0 0 0 0 287
A66 East 16 10 24 21 0 0 0 0 22 0 0 5 70 57 19 397 0 210 156 1376 0 0 0 0 0 2367
Durham Lane 17 9 20 18 0 0 0 0 19 0 0 4 59 48 16 77 157 0 12 19 0 0 0 0 0 458
Darlington Road EB 18 1 2 2 0 0 0 0 2 0 0 0 6 5 2 8 17 5 0 1 0 0 0 0 0 50
A66 West 19 1 3 2 0 0 0 0 2 0 0 1 8 6 2 126 835 21 2 0 0 0 0 0 0 1009
Dummy 20 0 0 0 0 0 0 0 0 0 0 0 0 0 0 0 0 0 0 0 0 0 0 0 0 0
Dummy 21 0 0 0 0 0 0 0 0 0 0 0 0 0 0 0 0 0 0 0 0 0 0 0 0 0
Dummy 22 0 0 0 0 0 0 0 0 0 0 0 0 0 0 0 0 0 0 0 0 0 0 0 0 0
Dummy 23 0 0 0 0 0 0 0 0 0 0 0 0 0 0 0 0 0 0 0 0 0 0 0 0 0
Dummy 24 0 0 0 0 0 0 0 0 0 0 0 0 0 0 0 0 0 0 0 0 0 0 0 0 0
Total D 270 733 666 519 88 16 99 186 102 94 477 412 222 232 635 1392 427 225 1459 0 0 0 0 0 8254
0 0 0 0 0 0 0 0 0 0 0 0 0 0 0 835 0 0 1376 0 0 0 0 0
Trads Data WB EB Location Dir Survey Matrix Diff %Diff GEH
A66 East of Elton I/C 2844 2138 Harrowgate Lane, east of A177 EB 513 513 0 0% 0.0
Slip Flow 1124 1094 WB 760 758 2 0% 0.1
Mailine 1720 1044 Harrowgate Lane, south of Scurfield Road NB 513 515 -2 0% 0.1
0.8 SB 852 855 -3 0% 0.1
Car 1376 835 Harrowgate Lane, south of Leam Lane NB 514 510 4 1% 0.2
SB 777 774 3 0% 0.1
DBL, west of Harrowgate Lane EB 608 607 1 0% 0.0
WB 643 642 1 0% 0.0
DBL, west of Bishopton Road EB 641 642 0 0% 0.0
WB 582 583 -1 0% 0.0
DBL, between YBL & Redmarshall Road EB 430 431 -2 0% 0.1
WB 407 407 0 0% 0.0
YBL, south of DBL NB 477 475 1 0% 0.1
SB 440 441 -1 0% 0.0
Calibration Link Flows: PM Peak Car (16:30 - 17:30)
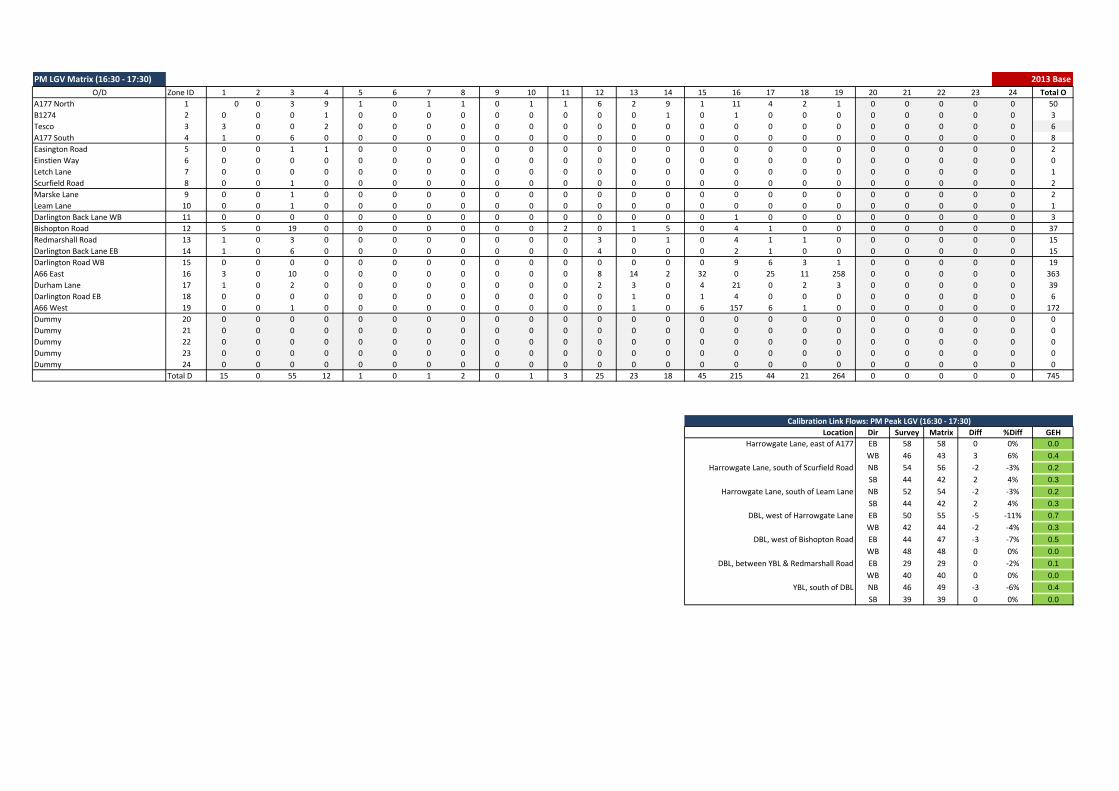
PM LGV Matrix (16:30 - 17:30) 2013 Base
O/D Zone ID 1 2 3 4 5 6 7 8 9 10 11 12 13 14 15 16 17 18 19 20 21 22 23 24 Total O
A177 North 1 0 0 3 9 1 0 1 1 0 1 1 6 2 9 1 11 4 2 1 0 0 0 0 0 50
B1274 2 0 0 0 1 0 0 0 0 0 0 0 0 0 1 0 1 0 0 0 0 0 0 0 0 3
Tesco 3 3 0 0 2 0 0 0 0 0 0 0 0 0 0 0 0 0 0 0 0 0 0 0 0 6
A177 South 4 1 0 6 0 0 0 0 0 0 0 0 0 0 0 0 0 0 0 0 0 0 0 0 0 8
Easington Road 5 0 0 1 1 0 0 0 0 0 0 0 0 0 0 0 0 0 0 0 0 0 0 0 0 2
Einstien Way 6 0 0 0 0 0 0 0 0 0 0 0 0 0 0 0 0 0 0 0 0 0 0 0 0 0
Letch Lane 7 0 0 0 0 0 0 0 0 0 0 0 0 0 0 0 0 0 0 0 0 0 0 0 0 1
Scurfield Road 8 0 0 1 0 0 0 0 0 0 0 0 0 0 0 0 0 0 0 0 0 0 0 0 0 2
Marske Lane 9 0 0 1 0 0 0 0 0 0 0 0 0 0 0 0 0 0 0 0 0 0 0 0 0 2
Leam Lane 10 0 0 1 0 0 0 0 0 0 0 0 0 0 0 0 0 0 0 0 0 0 0 0 0 1
Darlington Back Lane WB 11 0 0 0 0 0 0 0 0 0 0 0 0 0 0 0 1 0 0 0 0 0 0 0 0 3
Bishopton Road 12 5 0 19 0 0 0 0 0 0 0 2 0 1 5 0 4 1 0 0 0 0 0 0 0 37
Redmarshall Road 13 1 0 3 0 0 0 0 0 0 0 0 3 0 1 0 4 1 1 0 0 0 0 0 0 15
Darlington Back Lane EB 14 1 0 6 0 0 0 0 0 0 0 0 4 0 0 0 2 1 0 0 0 0 0 0 0 15
Darlington Road WB 15 0 0 0 0 0 0 0 0 0 0 0 0 0 0 0 9 6 3 1 0 0 0 0 0 19
A66 East 16 3 0 10 0 0 0 0 0 0 0 0 8 14 2 32 0 25 11 258 0 0 0 0 0 363
Durham Lane 17 1 0 2 0 0 0 0 0 0 0 0 2 3 0 4 21 0 2 3 0 0 0 0 0 39
Darlington Road EB 18 0 0 0 0 0 0 0 0 0 0 0 0 1 0 1 4 0 0 0 0 0 0 0 0 6
A66 West 19 0 0 1 0 0 0 0 0 0 0 0 0 1 0 6 157 6 1 0 0 0 0 0 0 172
Dummy 20 0 0 0 0 0 0 0 0 0 0 0 0 0 0 0 0 0 0 0 0 0 0 0 0 0
Dummy 21 0 0 0 0 0 0 0 0 0 0 0 0 0 0 0 0 0 0 0 0 0 0 0 0 0
Dummy 22 0 0 0 0 0 0 0 0 0 0 0 0 0 0 0 0 0 0 0 0 0 0 0 0 0
Dummy 23 0 0 0 0 0 0 0 0 0 0 0 0 0 0 0 0 0 0 0 0 0 0 0 0 0
Dummy 24 0 0 0 0 0 0 0 0 0 0 0 0 0 0 0 0 0 0 0 0 0 0 0 0 0
Total D 15 0 55 12 1 0 1 2 0 1 3 25 23 18 45 215 44 21 264 0 0 0 0 0 745
Location Dir Survey Matrix Diff %Diff GEH
Harrowgate Lane, east of A177 EB 58 58 0 0% 0.0
WB 46 43 3 6% 0.4
Harrowgate Lane, south of Scurfield Road NB 54 56 -2 -3% 0.2
0.15 SB 44 42 2 4% 0.3
LGV 258 157 Harrowgate Lane, south of Leam Lane NB 52 54 -2 -3% 0.2
SB 44 42 2 4% 0.3
DBL, west of Harrowgate Lane EB 50 55 -5 -11% 0.7
WB 42 44 -2 -4% 0.3
DBL, west of Bishopton Road EB 44 47 -3 -7% 0.5
WB 48 48 0 0% 0.0
DBL, between YBL & Redmarshall Road EB 29 29 0 -2% 0.1
WB 40 40 0 0% 0.0
YBL, south of DBL NB 46 49 -3 -6% 0.4
SB 39 39 0 0% 0.0
Calibration Link Flows: PM Peak LGV (16:30 - 17:30)

PM HGV Matrix (16:30 - 17:30) 2013 Base
O/D Zone ID 1 2 3 4 5 6 7 8 9 10 11 12 13 14 15 16 17 18 19 20 21 22 23 24 Total O
A177 North 1 0 0 2 4 0 0 1 0 0 0 1 0 0 1 0 0 0 0 0 0 0 0 0 0 9
B1274 2 0 0 1 1 0 0 0 0 0 0 0 0 0 0 0 0 0 0 0 0 0 0 0 0 3
Tesco 3 0 0 0 1 0 0 0 0 0 0 0 0 0 0 0 0 0 0 0 0 0 0 0 0 2
A177 South 4 4 0 0 0 0 0 0 0 0 0 0 0 0 0 0 0 0 0 0 0 0 0 0 0 4
Easington Road 5 0 0 0 0 0 0 0 0 0 0 0 0 0 0 0 0 0 0 0 0 0 0 0 0 0
Einstien Way 6 0 0 0 0 0 0 0 0 0 0 0 0 0 0 0 0 0 0 0 0 0 0 0 0 0
Letch Lane 7 0 0 0 0 0 0 0 0 0 0 1 0 0 0 0 0 0 0 0 0 0 0 0 0 2
Scurfield Road 8 0 0 0 0 0 0 0 0 0 0 1 0 0 0 0 0 0 0 0 0 0 0 0 0 2
Marske Lane 9 0 0 0 0 0 0 0 0 0 0 0 0 0 0 0 0 0 0 0 0 0 0 0 0 0
Leam Lane 10 0 0 0 0 0 0 0 0 0 0 0 0 0 0 0 0 0 0 0 0 0 0 0 0 0
Darlington Back Lane WB 11 0 0 0 0 0 0 0 0 0 0 0 0 0 0 0 0 0 0 0 0 0 0 0 0 0
Bishopton Road 12 0 0 0 0 0 0 0 0 0 0 3 0 0 1 0 0 0 0 0 0 0 0 0 0 6
Redmarshall Road 13 0 0 0 0 0 0 0 0 0 0 0 0 0 0 0 0 0 0 0 0 0 0 0 0 1
Darlington Back Lane EB 14 0 0 0 0 0 0 0 2 0 0 1 2 0 0 0 0 0 0 0 0 0 0 0 0 7
Darlington Road WB 15 0 0 0 0 0 0 0 0 0 0 0 0 0 0 0 0 0 0 1 0 0 0 0 0 1
A66 East 16 0 0 0 0 0 0 0 1 0 0 0 1 4 2 3 0 11 7 86 0 0 0 0 0 115
Durham Lane 17 0 0 0 0 0 0 0 0 0 0 0 0 1 0 0 9 0 0 7 0 0 0 0 0 18
Darlington Road EB 18 0 0 0 0 0 0 0 0 0 0 0 0 0 0 0 0 0 0 0 0 0 0 0 0 0
A66 West 19 0 0 0 0 0 0 0 0 0 0 0 0 0 0 3 52 5 0 0 0 0 0 0 0 60
Dummy 20 0 0 0 0 0 0 0 0 0 0 0 0 0 0 0 0 0 0 0 0 0 0 0 0 0
Dummy 21 0 0 0 0 0 0 0 0 0 0 0 0 0 0 0 0 0 0 0 0 0 0 0 0 0
Dummy 22 0 0 0 0 0 0 0 0 0 0 0 0 0 0 0 0 0 0 0 0 0 0 0 0 0
Dummy 23 0 0 0 0 0 0 0 0 0 0 0 0 0 0 0 0 0 0 0 0 0 0 0 0 0
Dummy 24 0 0 0 0 0 0 0 0 0 0 0 0 0 0 0 0 0 0 0 0 0 0 0 0 0
Total D 4 0 3 6 0 0 2 3 0 0 7 4 6 5 6 63 18 7 95 0 0 0 0 0 229
Location Dir Survey Matrix Diff %Diff GEH
Harrowgate Lane, east of A177 EB 1 1 0 0% 0.0
WB 6 6 0 3% 0.1
Harrowgate Lane, south of Scurfield Road NB 0 4 -4 #DIV/0! 2.9
0.05 SB 4 8 -4 -97% 1.6
HGV 86 52 Harrowgate Lane, south of Leam Lane NB 0 4 -4 #DIV/0! 2.9
SB 4 8 -4 -97% 1.6
DBL, west of Harrowgate Lane EB 7 8 -1 -19% 0.5
WB 4 5 -1 -27% 0.5
DBL, west of Bishopton Road EB 8 8 0 -5% 0.1
WB 7 7 0 0% 0.0
DBL, between YBL & Redmarshall Road EB 8 8 0 5% 0.1
WB 11 11 0 0% 0.0
YBL, south of DBL NB 9 10 -1 -9% 0.3
SB 5 5 0 0% 0.0
Calibration Link Flows: PM Peak HGV (16:30 - 17:30)

PM Total Matrix (16:30 - 17:30) 2013 Base
O/D Zone ID 1 2 3 4 5 6 7 8 9 10 11 12 13 14 15 16 17 18 19 20 21 22 23 24 Total O
A177 North 1 0 113 110 166 16 3 19 14 19 19 28 20 10 28 2 26 12 3 4 0 0 0 0 0 611
B1274 2 0 0 155 225 22 4 25 19 28 26 39 20 10 28 2 22 12 2 4 0 0 0 0 0 645
Tesco 3 79 173 0 83 20 4 23 17 26 24 36 18 9 25 2 20 11 2 4 0 0 0 0 0 576
A177 South 4 115 254 238 0 7 1 8 6 9 8 12 6 3 8 1 7 4 1 1 0 0 0 0 0 687
Easington Road 5 4 8 8 29 0 0 0 4 0 0 8 2 1 2 0 2 1 0 0 0 0 0 0 0 69
Einstien Way 6 1 2 2 8 0 0 0 1 0 0 2 1 0 0 0 1 0 0 0 0 0 0 0 0 18
Letch Lane 7 3 7 7 26 0 0 0 4 0 0 8 2 1 2 0 2 1 0 0 0 0 0 0 0 63
Scurfield Road 8 14 32 30 0 0 0 0 0 0 0 127 32 11 29 6 35 13 8 5 0 0 0 0 0 342
Marske Lane 9 3 6 7 0 0 0 0 6 0 0 25 3 1 3 0 4 1 0 0 0 0 0 0 0 60
Leam Lane 10 3 7 7 0 0 0 0 6 0 0 27 3 1 3 0 4 1 0 1 0 0 0 0 0 63
Darlington Back Lane WB 11 0 0 0 0 15 3 9 6 20 18 0 35 12 32 9 57 21 8 5 0 0 0 0 0 251
Bishopton Road 12 20 36 51 0 0 0 12 9 0 0 145 0 14 38 1 24 8 1 3 0 0 0 0 0 362
Redmarshall Road 13 6 11 13 0 2 0 1 12 0 0 4 34 0 13 6 52 22 7 7 0 0 0 0 0 191
Darlington Back Lane EB 14 17 35 38 0 8 1 5 41 0 0 15 107 35 0 1 13 6 2 2 0 0 0 0 0 326
Darlington Road WB 15 0 1 1 0 0 0 0 1 0 0 0 3 2 1 0 149 91 28 30 0 0 0 0 0 307
A66 East 16 13 24 32 0 0 0 0 23 0 0 5 79 76 22 433 0 246 174 1720 0 0 0 0 0 2845
Durham Lane 17 9 20 20 0 0 0 0 19 0 0 4 62 53 17 81 188 0 14 29 0 0 0 0 0 515
Darlington Road EB 18 1 2 2 0 0 0 0 2 0 0 0 6 5 2 9 20 5 0 1 0 0 0 0 0 56
A66 West 19 1 3 3 0 0 0 0 2 0 0 1 8 7 2 135 1044 32 3 0 0 0 0 0 0 1241
Dummy 20 0 0 0 0 0 0 0 0 0 0 0 0 0 0 0 0 0 0 0 0 0 0 0 0 0
Dummy 21 0 0 0 0 0 0 0 0 0 0 0 0 0 0 0 0 0 0 0 0 0 0 0 0 0
Dummy 22 0 0 0 0 0 0 0 0 0 0 0 0 0 0 0 0 0 0 0 0 0 0 0 0 0
Dummy 23 0 0 0 0 0 0 0 0 0 0 0 0 0 0 0 0 0 0 0 0 0 0 0 0 0
Dummy 24 0 0 0 0 0 0 0 0 0 0 0 0 0 0 0 0 0 0 0 0 0 0 0 0 0
Total D 290 733 723.786 536.602 89 16 102 191 102 95 487 441 251 255 686 1670 489 253 1818 0 0 0 0 0 9228
Location Dir Survey Matrix Diff %Diff GEH
Harrowgate Lane, east of A177 EB 572 572 0 0% 0.0
WB 812 808 4 1% 0.2
Harrowgate Lane, south of Scurfield Road NB 567 575 -8 -1% 0.3
SB 900 905 -5 -1% 0.2
Harrowgate Lane, south of Leam Lane NB 566 568 -2 0% 0.1
SB 825 824 1 0% 0.0
DBL, west of Harrowgate Lane EB 665 671 -6 -1% 0.2
WB 689 691 -2 0% 0.1
DBL, west of Bishopton Road EB 693 697 -4 -1% 0.1
WB 637 638 -1 0% 0.0
DBL, between YBL & Redmarshall Road EB 467 468 -2 0% 0.1
WB 458 458 0 0% 0.0
YBL, south of DBL NB 532 534 -2 0% 0.1
SB 484 485 -1 0% 0.0
Calibration Link Flows: PM Peak Total (16:30 - 17:30)

Appendix C
WeSAM Validation Screenshots
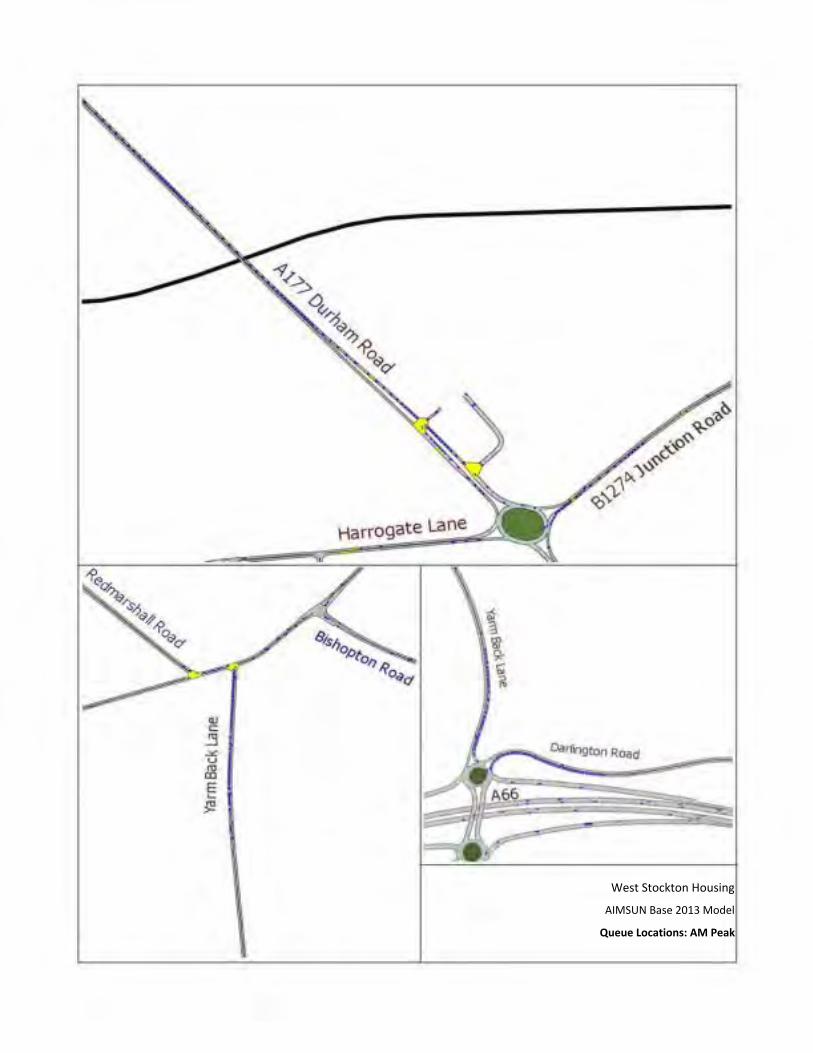
West Stockton Housing
AIMSUN Base 2013 Model
Queue Locations: AM Peak

West Stockton Housing
AIMSUN Base 2013 Model
Queue Locations: PM Peak
Harrogate Lane
~ =:as\ngton
Road

Appendix D
WeSAM Highway Improvements

Darlington Back Lane / Yarm Back Lane Improvement

Harrowgate Lane Northern Site Access
Harrowgate Lane Central Site Access 1
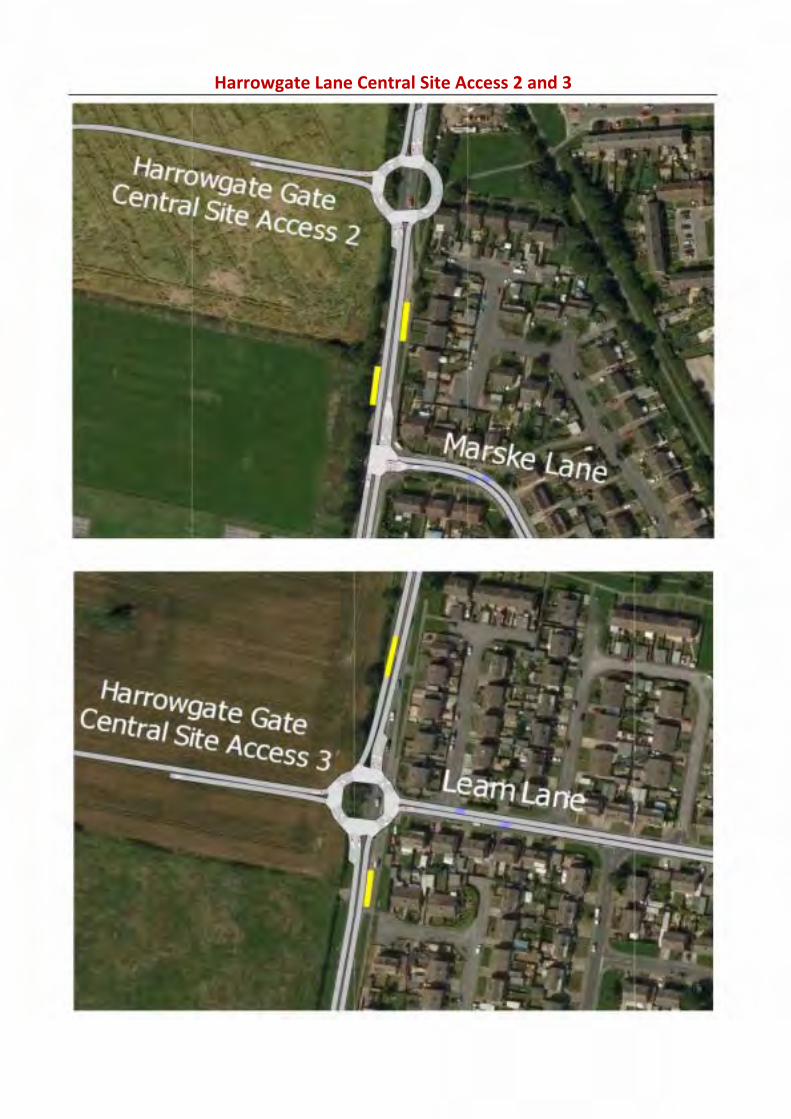
Harrowgate Lane Central Site Access 2 and 3

Yarm Back Lane Site Access Junctions

Status:
Project:
Drg Title:
Scale: Drawn: Checked:First Issue:
Drg No: Rev:
Size:
Rev:
Description:
Date:
By:
Chkd:
Curtins Consulting Ltd
10 Oxford Court, Bishopsgate, Manchester, M2 3WQ
t: 0161 236 2394 f: 0161 228 7902
e: [email protected] www.curtins.com
Birmingham • Bristol • Cardiff • Douglas • Edinburgh • Kendal • Leeds • Liverpool • London • Manchester • Nottingham
Structures • Civils • Environmental • Infrastructure • Transport Planning • Health & Safety • Dispute Resolution

Darlington Back Lane / Yarm Back Lane Improvement

Job No
Drawing Status
Discipline
Scale at A1
Drawing No Issue
Drawing Title
Job Title
Client
Issue Date By Chkd Appd
A1
1
2
3
4
5
6
7
8
9
10
11
© Arup
A B C D E F G H I J K L M N
Do not scale
Drawin
g in
Pro
gres
s
Indi
cativ
e Onl
y
C.900.G.008 P2224125-19
1:1000
Preliminary
Civils
Darlington Back Lane
Proposed Roundabout Arrangement
West Stockton Housing
Stockton Borough Council
F:\220000\224125\19 W
est S
tockton H
ousing\A
cad\O
utgoing\2013-10-03_1218\zC
900G
008.dw
g 3 O
ct 2013 12:38:09
Central Square, Forth Street
Newcastle upon Tyne NE1 3PL
Tel +44 (0)191 261 6080 Fax +44 (0)191 261 7879
www.arup.com
/ /P1 27 09 13 PC ARJ ARJ
Preliminary Issue
/ /P2 02 10 13 PC VB SW
Roundabout layout revised
Created using CADplot http://www.oasys-software.com/cadplot/
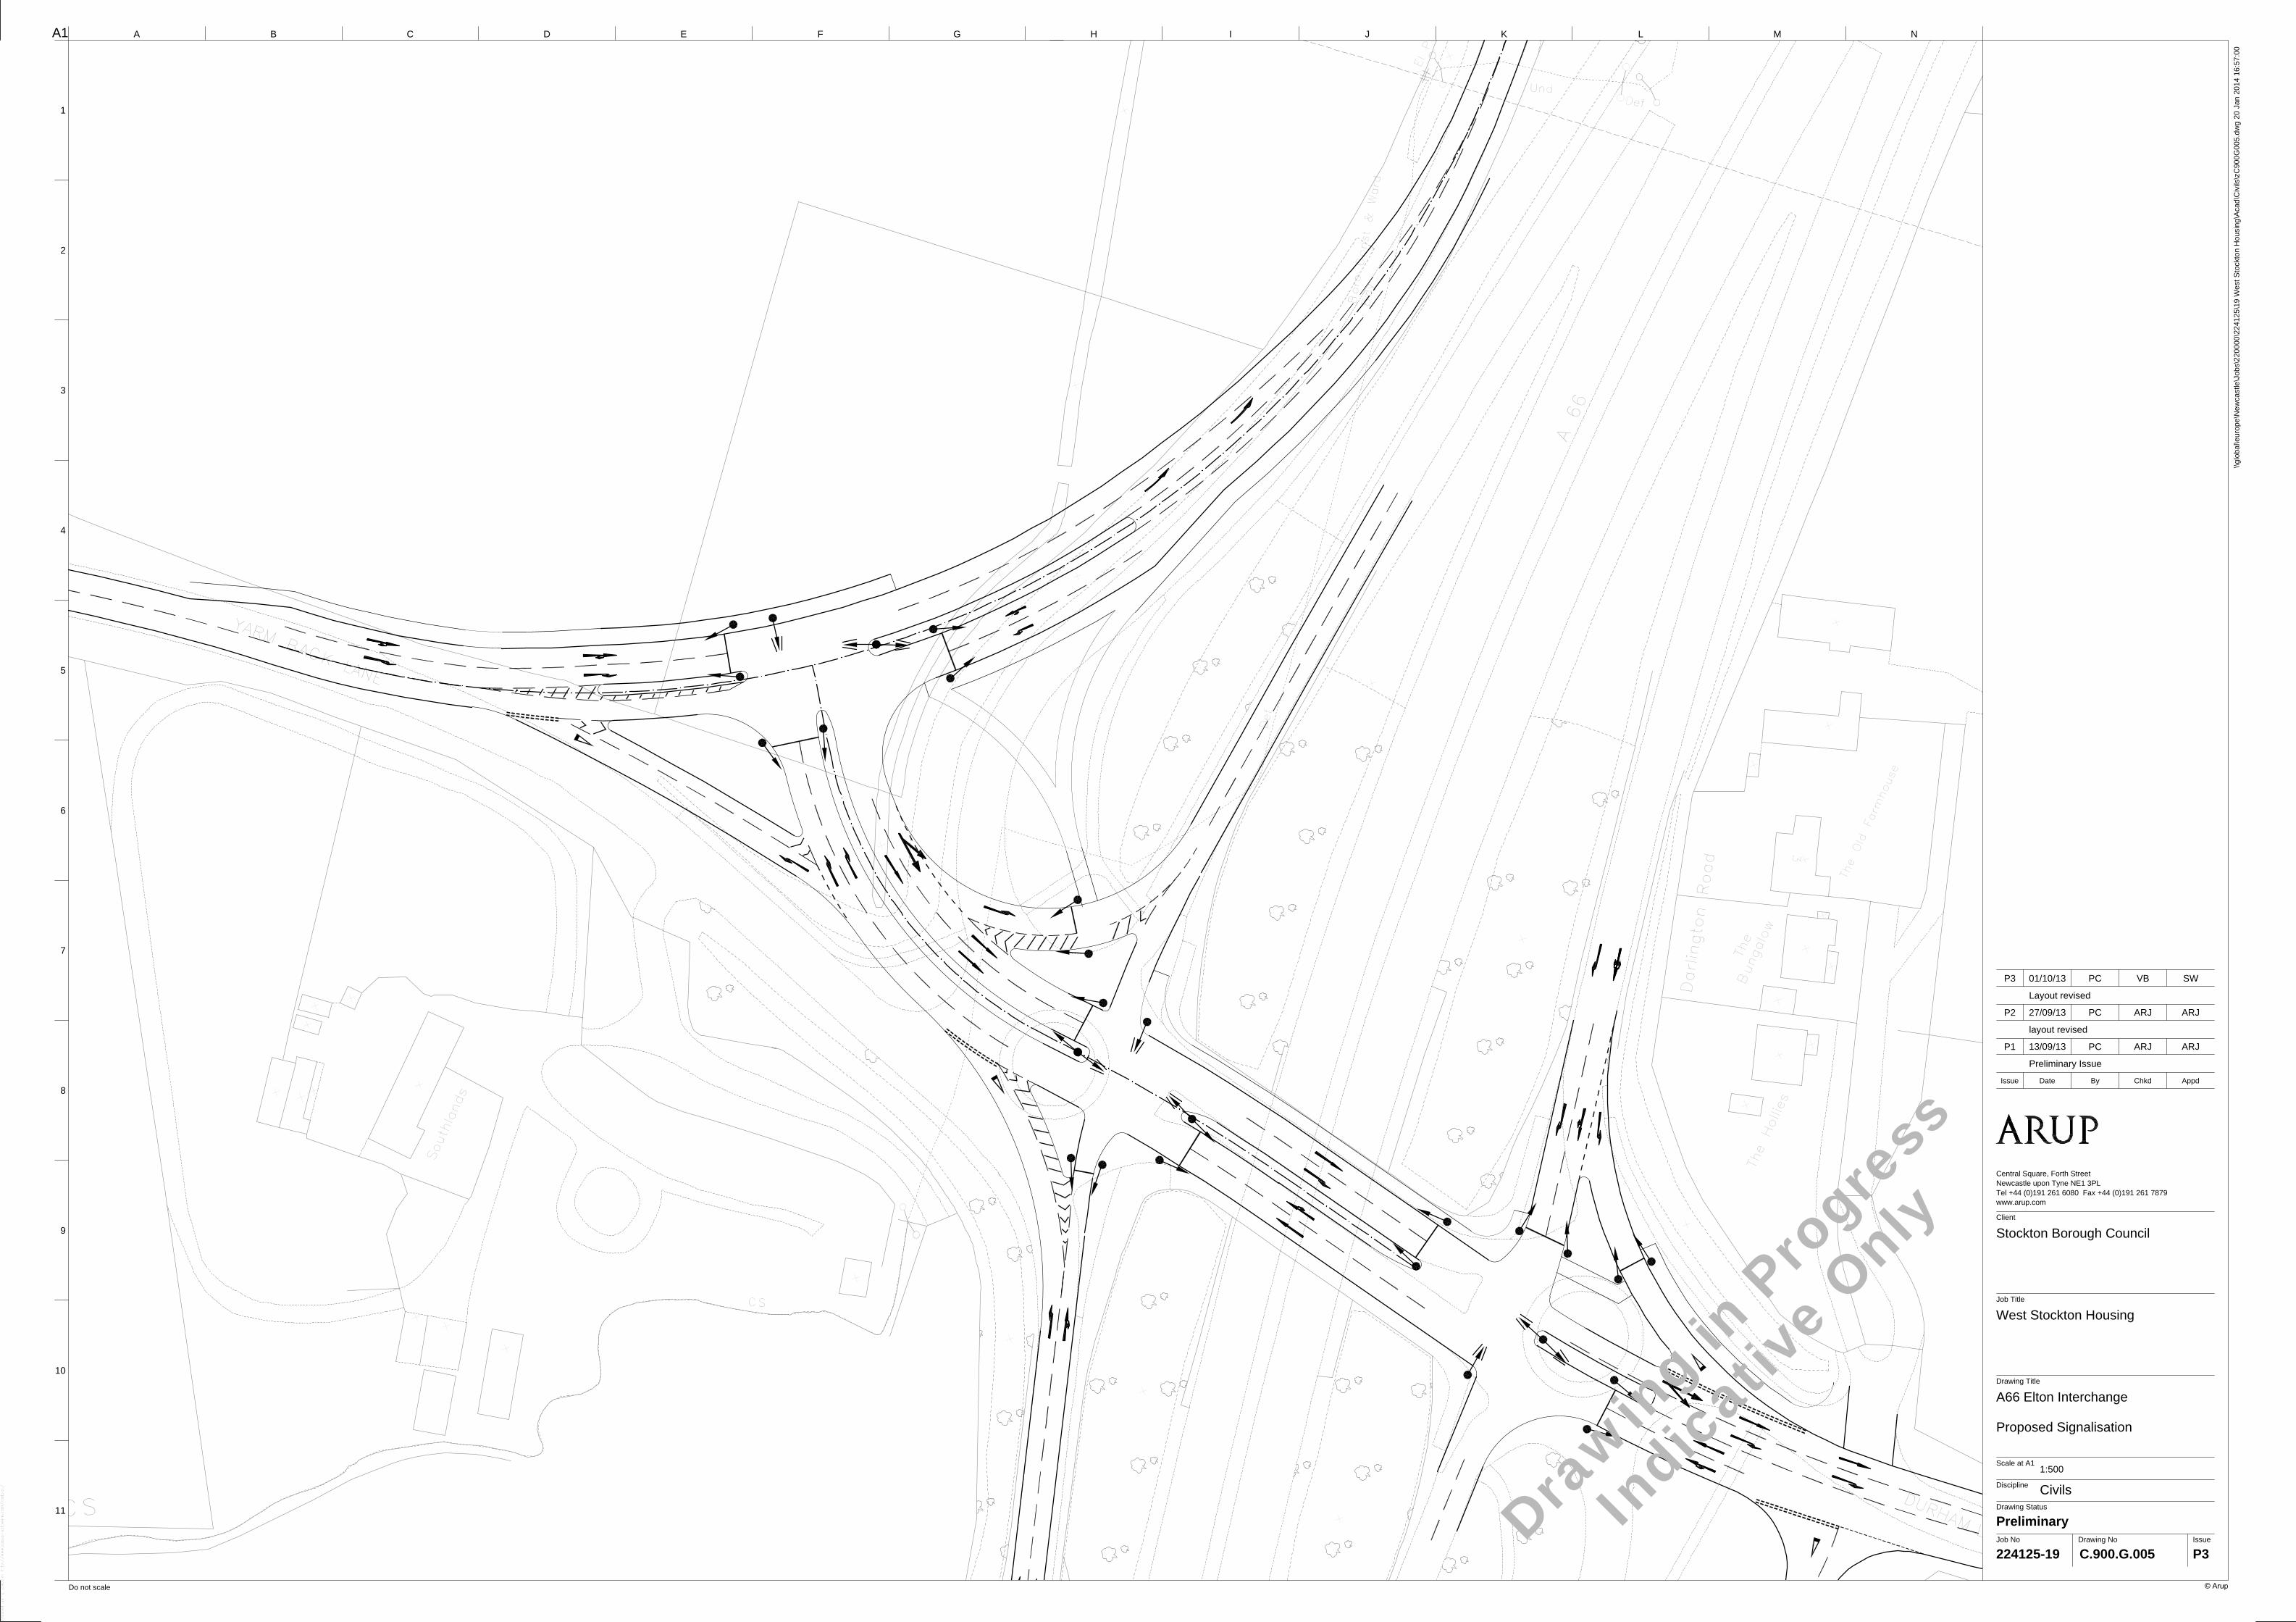
E
l
P
s
T
h
e
O
l
d
F
a
r
m
h
o
u
s
e
B
u
n
g
a
l
o
w
T
h
e
T
h
e
H
o
l
l
i
e
s
S
o
u
t
h
l
a
n
d
s
Job No
Drawing Status
Discipline
Scale at A1
Drawing No Issue
Drawing Title
Job Title
Client
Issue Date By Chkd Appd
A1
1
2
3
4
5
6
7
8
9
10
11
© Arup
A B C D E F G H I J K L M N
Do not scale
Drawin
g in
Pro
gres
s
Indi
cativ
e Onl
y
C.900.G.005 P3224125-19
1:500
Preliminary
Civils
A66 Elton Interchange
Proposed Signalisation
West Stockton Housing
Stockton Borough Council
\\global\europe\N
ew
castle\Jobs\220000\224125\19 W
est S
tockton H
ousing\A
cad\C
ivils\zC
900G
005.dw
g 20 Jan 2014 16:57:00
Central Square, Forth Street
Newcastle upon Tyne NE1 3PL
Tel +44 (0)191 261 6080 Fax +44 (0)191 261 7879
www.arup.com
/ /P1 13 09 13 PC ARJ ARJ
Preliminary Issue
/ /P2 27 09 13 PC ARJ ARJ
layout revised
/ /P3 01 10 13 PC VB SW
Layout revised
Created using CADplot http://www.oasys-software.com/cadplot/

11
1---
-- < -.~
-~
A) '/;'> . ' <,..'"; (,;,
. . ' r.f!, .... q;, ' . I ~"
~G, \ \
I I I I . I
/I ,),~
I I I •i .. ··;
I I I
• I
I 1 ''··
·----=----
I
0 0 0
0 0 '
dl, ' d3,
••
=--
I I
I
I I
I
/ I
I I
I I
f •• I
I I
I
I I
I I
I I
I I
I
/!J
I I
I I
Do not scala
I I
I I
=
I
c
I I
I i
t;/{ 1
I I
0 lnr3 ,-,/1 ('/3 I '"", ~
I I
I I
I I
I I
I I
I .. , I
I
I £
I I
I I
I
I
I I
I I
0 E
1 r·
I I
I I
I I
I I
I I
I I I)
I
I " .. I I I
I ~-1 -'-" I I I I I I
"t;~~ I ~ "'' I
H~i~fb;Jm ( a~. nrJ / I 1 ---------~ ......, ~o~l '
I I I
I I
I I
~· I
I I
I I f.,
I I
/!J I
I
-----1- -j, I
I I
I I
f~r~,. I
I I
I
Merge I Diverge Requirements in accordance with TO 22/06 Layout Of Grade Separated Junctions
Eastbound Merge: Layout Type H (Figura 2/4.5)
Road Class: Rural 120kph
Geometric Design Parameters (Table 4/3}:
Overlap Nose length Nose Ratio Taper (RH Lane) Ghost island Tail Auxiliary lane
50m 85m 1:30 150m 150m 190m
Westbound Diverge: Layout Type B (Figure 215)
Road Class: Rural 120kph
Geometric Design Parameters (Table 4/4):
Taper1 Ghost island Head Taper2 Nose Length Nose Taper Over1ap
150m 160m 150m 10m 1:15 50m
F
Taper Langlh
55m
... . ..
G H
I I .
. .I .' (,1
I
(
' I
I
/ I
I
/ Hartbum Beck Culvert. Work.l to headwall required
'
------
Work to farm track underpass required
~
•
~· • ) \,1 ":·'·
\ I ( '· l 0\· .
.. \\ \ •.. \\
\_ \ \
••
)
'
/
P2 I 25109/13 I PC I ARJ ARJ
Merge geometJy revised
P1 I 20102113 1 SR I ARJ ARJ
Preliminary Issue
Issue I Date By
ARUP Central Square, Forth SWat NeiNcastle upon Tyne NE1 3PL
Chkd
Tel +44 (0)191 261 6060 Fax +44 (0)191 261 7679 """'-W.arup.oom
Cien1
Stockton Borough Council
Job TIUe
Appd
Elton Interchange Improvements
Drawing Tille
Proposed Geometry and Lining
Scale atA1 1:1250
Discipline Civils Drawing Status
Preliminary Job No Drawing No
224125-19 C.900.G.002 ~~· P2
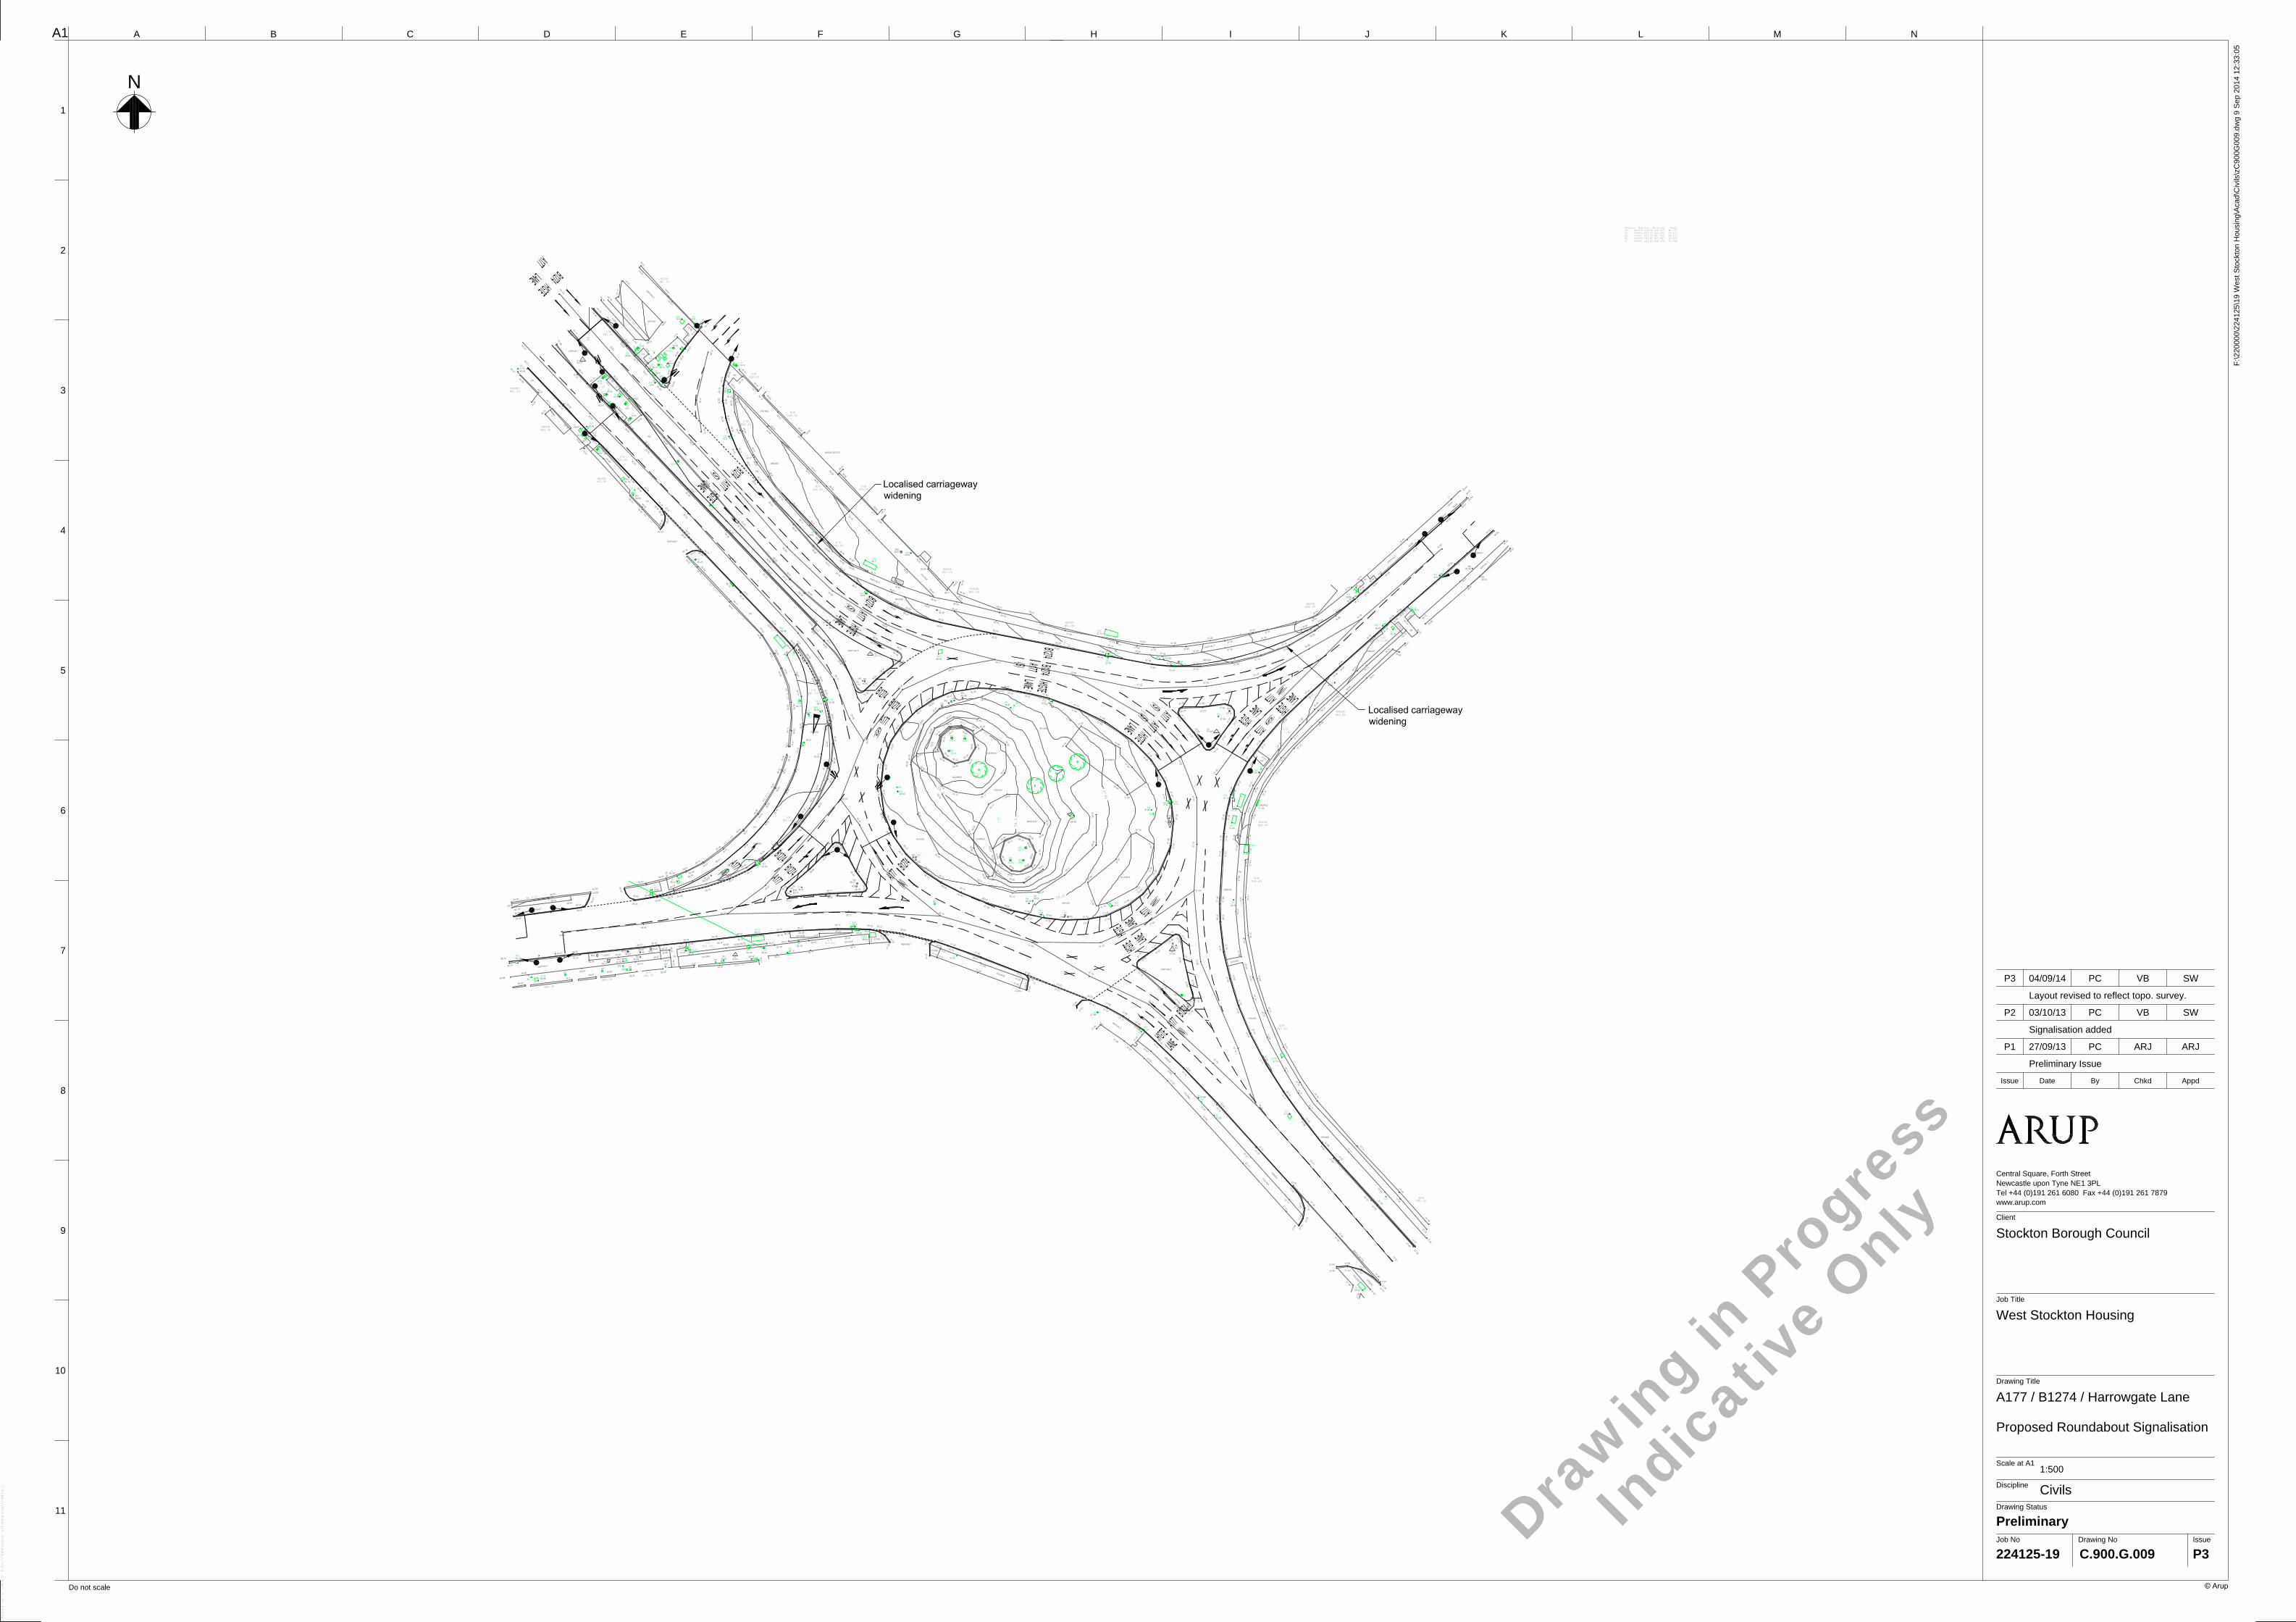
Job No
Drawing Status
Discipline
Scale at A1
Drawing No Issue
Drawing Title
Job Title
Client
Issue Date By Chkd Appd
A1
1
2
3
4
5
6
7
8
9
10
11
© Arup
A B C D E F G H I J K L M N
Do not scale
Drawin
g in
Pro
gres
s
Indi
cativ
e Onl
y
C.900.G.009 P3224125-19
1:500
Preliminary
Civils
A177 / B1274 / Harrowgate Lane
Proposed Roundabout Signalisation
West Stockton Housing
Stockton Borough Council
F:\220000\224125\19 W
est S
tockton H
ousing\A
cad\C
ivils\zC
900G
009.dw
g 9 S
ep 2014 12:33:05
Central Square, Forth Street
Newcastle upon Tyne NE1 3PL
Tel +44 (0)191 261 6080 Fax +44 (0)191 261 7879
www.arup.com
/ /P1 27 09 13 PC ARJ ARJ
Preliminary Issue
/ /P2 03 10 13 PC VB SW
Signalisation added
/ /P3 04 09 14 PC VB SW
Layout revised to reflect topo. survey.
N
Created using CADplot http://www.oasys-software.com/cadplot/
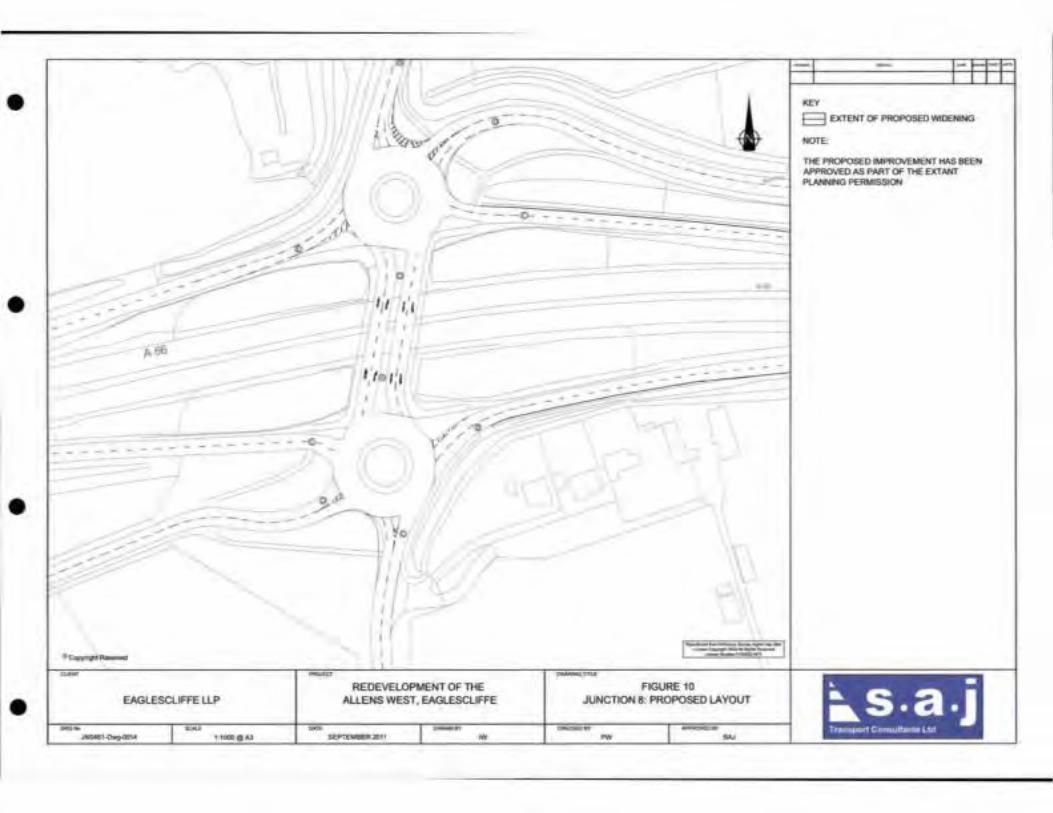
•
•
•
•
-__....
otP /---~
--- \'. Yo _..--~-~--- - I
.. ~~ Q8T
EAGLESCLIFFE LLP
...... """-" J-1~ 1IOGIIQAl
........,.
"""'
l/1 r I
I /' I
REDEVELOPMENT OF 1HE ALLENS WEST, EAGLESCUFFE
-..-5a'TB&IR3111 PN
r::o:;=~~-==-1 ._:m4_.,.
--mu: FIGURE 10
JUNCTION 8: PROPOSED LAYOUT
....,..., .. Jlill'fi'JIIDWB'.-r-
PW s.o.J
KEY
E3 EXTENT OF PROPOSED WIDENING
NOTE:
n£ PROf'OSED IMPROVEMENT HAS BEEN APPRO\IED AS PART OF THE EXTAHT PlANNING PERMISS10N
~ -.s.a.J Tram~l)CM1 Conaultanls Ud

Appendix E
YIBAM ATC's
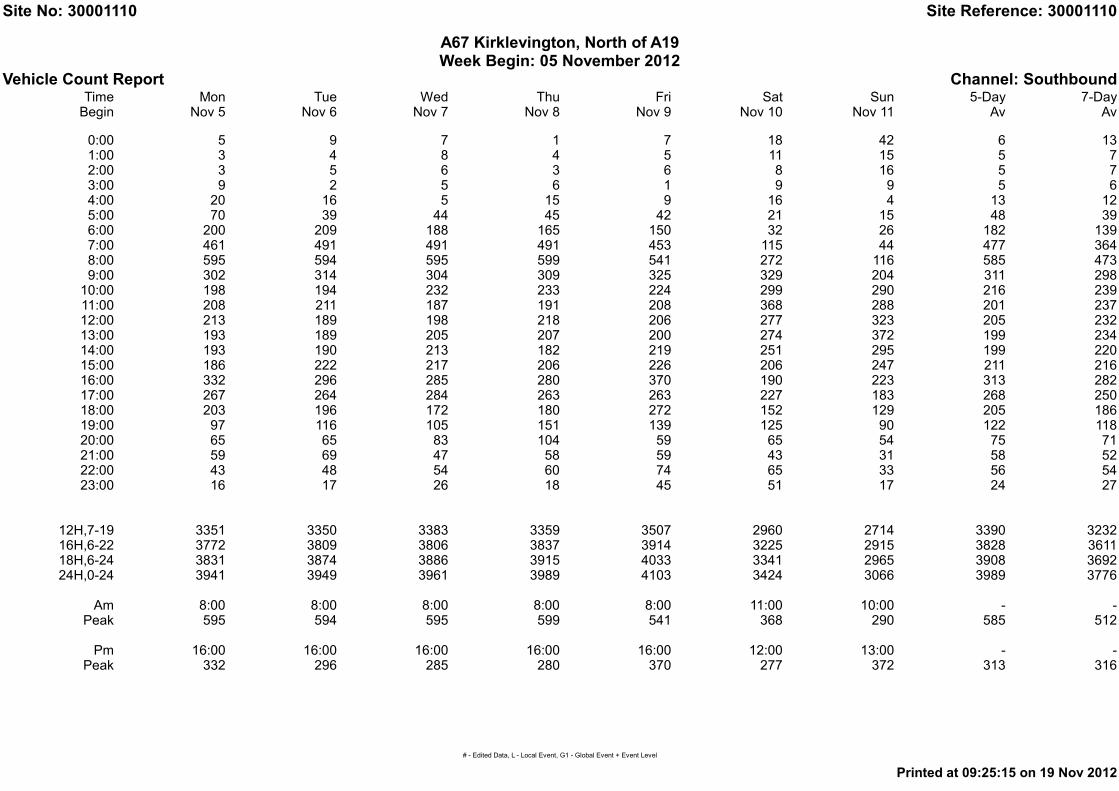
Site No: 30001110 Site Reference: 30001110
A67 Kirklevington, North of A19Week Begin: 05 November 2012
Vehicle Count Report Channel: SouthboundTime Mon Tue Wed Thu Fri Sat Sun 5-Day 7-DayBegin Nov 5 Nov 6 Nov 7 Nov 8 Nov 9 Nov 10 Nov 11 Av Av
0:00 5 9 7 1 7 18 42 6 131:00 3 4 8 4 5 11 15 5 72:00 3 5 6 3 6 8 16 5 73:00 9 2 5 6 1 9 9 5 64:00 20 16 5 15 9 16 4 13 125:00 70 39 44 45 42 21 15 48 396:00 200 209 188 165 150 32 26 182 1397:00 461 491 491 491 453 115 44 477 3648:00 595 594 595 599 541 272 116 585 4739:00 302 314 304 309 325 329 204 311 29810:00 198 194 232 233 224 299 290 216 23911:00 208 211 187 191 208 368 288 201 23712:00 213 189 198 218 206 277 323 205 23213:00 193 189 205 207 200 274 372 199 23414:00 193 190 213 182 219 251 295 199 22015:00 186 222 217 206 226 206 247 211 21616:00 332 296 285 280 370 190 223 313 28217:00 267 264 284 263 263 227 183 268 25018:00 203 196 172 180 272 152 129 205 18619:00 97 116 105 151 139 125 90 122 11820:00 65 65 83 104 59 65 54 75 7121:00 59 69 47 58 59 43 31 58 5222:00 43 48 54 60 74 65 33 56 5423:00 16 17 26 18 45 51 17 24 27
12H,7-19 3351 3350 3383 3359 3507 2960 2714 3390 323216H,6-22 3772 3809 3806 3837 3914 3225 2915 3828 361118H,6-24 3831 3874 3886 3915 4033 3341 2965 3908 369224H,0-24 3941 3949 3961 3989 4103 3424 3066 3989 3776
Am 8:00 8:00 8:00 8:00 8:00 11:00 10:00 - -Peak 595 594 595 599 541 368 290 585 512
Pm 16:00 16:00 16:00 16:00 16:00 12:00 13:00 - -Peak 332 296 285 280 370 277 372 313 316
# - Edited Data, L - Local Event, G1 - Global Event + Event Level
Printed at 09:25:15 on 19 Nov 2012

Site No: 30001110 Site Reference: 30001110
A67 Kirklevington, North of A19Week Begin: 05 November 2012
Vehicle Count Report Channel: NorthboundTime Mon Tue Wed Thu Fri Sat Sun 5-Day 7-DayBegin Nov 5 Nov 6 Nov 7 Nov 8 Nov 9 Nov 10 Nov 11 Av Av
0:00 14 16 28 10 16 39 51 17 251:00 15 7 7 10 11 20 26 10 142:00 5 7 8 7 7 10 14 7 83:00 4 3 2 5 4 10 6 4 54:00 9 5 4 5 9 8 7 6 75:00 19 17 23 21 17 15 8 19 176:00 45 58 44 52 52 22 13 50 417:00 195 201 217 197 189 86 45 200 1618:00 316 293 306 310 292 114 52 303 2409:00 152 174 155 187 175 180 102 169 16110:00 165 156 151 178 175 195 158 165 16811:00 190 165 182 186 219 226 234 188 20012:00 174 224 202 229 233 289 318 212 23813:00 206 218 225 216 253 313 302 224 24814:00 215 232 264 267 274 316 332 250 27115:00 329 318 317 344 442 304 372 350 34716:00 427 443 471 407 541 360 316 458 42417:00 623 620 555 572 516 333 299 577 50318:00 362 366 394 379 370 224 145 374 32019:00 173 191 188 243 226 179 154 204 19320:00 131 124 117 138 127 105 80 127 11721:00 77 88 84 99 81 75 58 86 8022:00 56 71 73 94 145 93 48 88 8323:00 35 37 48 45 58 76 24 45 46
12H,7-19 3354 3410 3439 3472 3679 2940 2675 3471 328116H,6-22 3780 3871 3872 4004 4165 3321 2980 3938 371318H,6-24 3871 3979 3993 4143 4368 3490 3052 4071 384224H,0-24 3937 4034 4065 4201 4432 3592 3164 4134 3918
Am 8:00 8:00 8:00 8:00 8:00 11:00 11:00 - -Peak 316 293 306 310 292 226 234 303 282
Pm 17:00 17:00 17:00 17:00 16:00 16:00 15:00 - -Peak 623 620 555 572 541 360 372 582 520
# - Edited Data, L - Local Event, G1 - Global Event + Event Level
Printed at 09:25:15 on 19 Nov 2012

Site No: 30001110 Site Reference: 30001110
A67 Kirklevington, North of A19Week Begin: 05 November 2012
Vehicle Count Report All ChannelsTime Mon Tue Wed Thu Fri Sat Sun 5-Day 7-DayBegin Nov 5 Nov 6 Nov 7 Nov 8 Nov 9 Nov 10 Nov 11 Av Av
0:00 19 25 35 11 23 57 93 23 381:00 18 11 15 14 16 31 41 15 212:00 8 12 14 10 13 18 30 11 153:00 13 5 7 11 5 19 15 8 114:00 29 21 9 20 18 24 11 19 195:00 89 56 67 66 59 36 23 67 576:00 245 267 232 217 202 54 39 233 1797:00 656 692 708 688 642 201 89 677 5258:00 911 887 901 909 833 386 168 888 7149:00 454 488 459 496 500 509 306 479 45910:00 363 350 383 411 399 494 448 381 40711:00 398 376 369 377 427 594 522 389 43812:00 387 413 400 447 439 566 641 417 47013:00 399 407 430 423 453 587 674 422 48214:00 408 422 477 449 493 567 627 450 49215:00 515 540 534 550 668 510 619 561 56216:00 759 739 756 687 911 550 539 770 70617:00 890 884 839 835 779 560 482 845 75318:00 565 562 566 559 642 376 274 579 50619:00 270 307 293 394 365 304 244 326 31120:00 196 189 200 242 186 170 134 203 18821:00 136 157 131 157 140 118 89 144 13322:00 99 119 127 154 219 158 81 144 13723:00 51 54 74 63 103 127 41 69 73
12H,7-19 6705 6760 6822 6831 7186 5900 5389 6861 651316H,6-22 7552 7680 7678 7841 8079 6546 5895 7766 732418H,6-24 7702 7853 7879 8058 8401 6831 6017 7979 753424H,0-24 7878 7983 8026 8190 8535 7016 6230 8122 7694
Am 8:00 8:00 8:00 8:00 8:00 11:00 11:00 - -Peak 911 887 901 909 833 594 522 888 794
Pm 17:00 17:00 17:00 17:00 16:00 13:00 13:00 - -Peak 890 884 839 835 911 587 674 872 803
# - Edited Data, L - Local Event, G1 - Global Event + Event Level
Printed at 09:27:40 on 19 Nov 2012
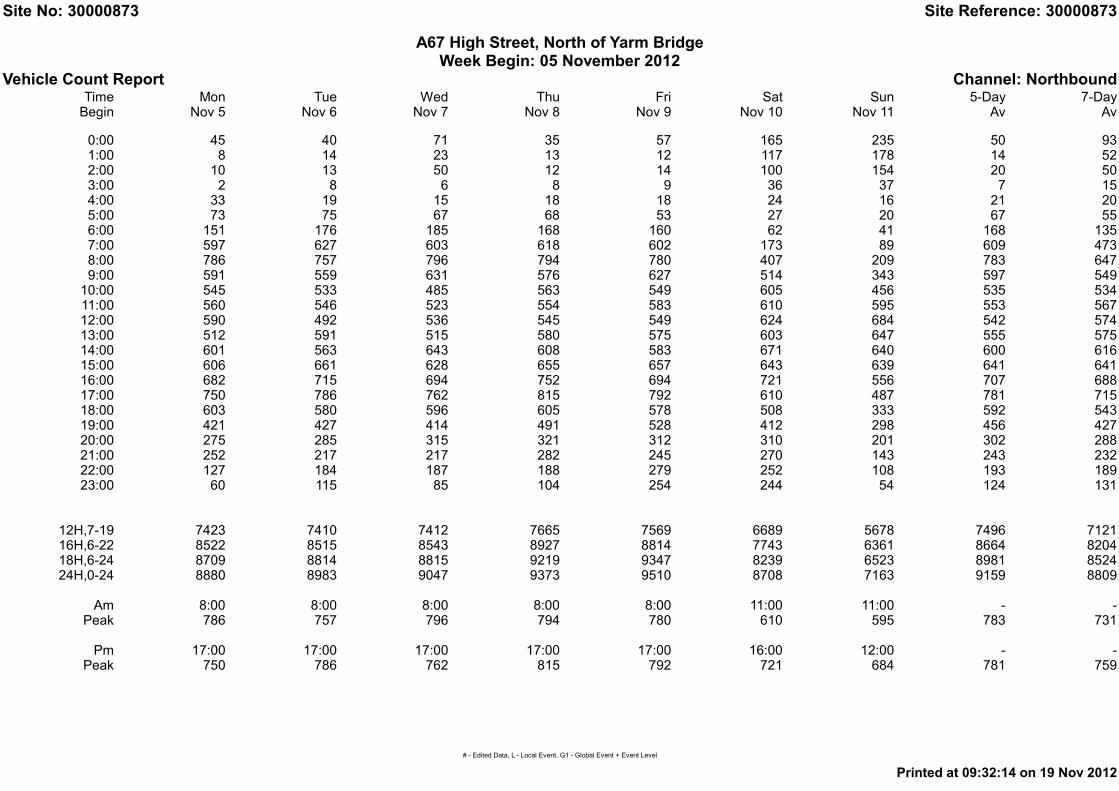
Site No: 30000873 Site Reference: 30000873
A67 High Street, North of Yarm BridgeWeek Begin: 05 November 2012
Vehicle Count Report Channel: NorthboundTime Mon Tue Wed Thu Fri Sat Sun 5-Day 7-DayBegin Nov 5 Nov 6 Nov 7 Nov 8 Nov 9 Nov 10 Nov 11 Av Av
0:00 45 40 71 35 57 165 235 50 931:00 8 14 23 13 12 117 178 14 522:00 10 13 50 12 14 100 154 20 503:00 2 8 6 8 9 36 37 7 154:00 33 19 15 18 18 24 16 21 205:00 73 75 67 68 53 27 20 67 556:00 151 176 185 168 160 62 41 168 1357:00 597 627 603 618 602 173 89 609 4738:00 786 757 796 794 780 407 209 783 6479:00 591 559 631 576 627 514 343 597 54910:00 545 533 485 563 549 605 456 535 53411:00 560 546 523 554 583 610 595 553 56712:00 590 492 536 545 549 624 684 542 57413:00 512 591 515 580 575 603 647 555 57514:00 601 563 643 608 583 671 640 600 61615:00 606 661 628 655 657 643 639 641 64116:00 682 715 694 752 694 721 556 707 68817:00 750 786 762 815 792 610 487 781 71518:00 603 580 596 605 578 508 333 592 54319:00 421 427 414 491 528 412 298 456 42720:00 275 285 315 321 312 310 201 302 28821:00 252 217 217 282 245 270 143 243 23222:00 127 184 187 188 279 252 108 193 18923:00 60 115 85 104 254 244 54 124 131
12H,7-19 7423 7410 7412 7665 7569 6689 5678 7496 712116H,6-22 8522 8515 8543 8927 8814 7743 6361 8664 820418H,6-24 8709 8814 8815 9219 9347 8239 6523 8981 852424H,0-24 8880 8983 9047 9373 9510 8708 7163 9159 8809
Am 8:00 8:00 8:00 8:00 8:00 11:00 11:00 - -Peak 786 757 796 794 780 610 595 783 731
Pm 17:00 17:00 17:00 17:00 17:00 16:00 12:00 - -Peak 750 786 762 815 792 721 684 781 759
# - Edited Data, L - Local Event, G1 - Global Event + Event Level
Printed at 09:32:14 on 19 Nov 2012

Site No: 30000873 Site Reference: 30000873
A67 High Street, North of Yarm BridgeWeek Begin: 05 November 2012
Vehicle Count Report Channel: SouthboundTime Mon Tue Wed Thu Fri Sat Sun 5-Day 7-DayBegin Nov 5 Nov 6 Nov 7 Nov 8 Nov 9 Nov 10 Nov 11 Av Av
0:00 21 23 41 30 33 162 206 30 741:00 10 6 16 7 12 78 151 10 402:00 8 13 19 13 14 44 61 13 253:00 13 12 10 13 14 34 27 12 184:00 25 18 11 18 9 24 18 16 185:00 59 56 59 48 42 25 35 53 466:00 156 158 140 139 130 64 34 145 1177:00 480 519 505 520 504 201 95 506 4038:00 890 869 910 902 886 433 200 891 7279:00 601 625 592 630 589 621 396 607 57910:00 550 547 530 565 596 642 470 558 55711:00 585 572 529 561 574 648 547 564 57412:00 557 538 539 580 573 584 658 557 57613:00 581 534 589 558 617 586 693 576 59414:00 560 549 563 591 592 619 635 571 58715:00 683 684 718 724 685 595 623 699 67316:00 689 749 708 735 728 623 626 722 69417:00 786 797 762 812 754 646 401 782 70818:00 684 706 610 819 649 543 317 694 61819:00 347 518 471 497 566 514 269 480 45520:00 359 282 286 330 310 346 186 313 30021:00 268 251 270 245 255 246 141 258 23922:00 160 181 234 249 327 252 110 230 21623:00 63 105 72 101 229 225 60 114 122
12H,7-19 7646 7689 7555 7997 7747 6741 5661 7727 729116H,6-22 8776 8898 8722 9208 9008 7911 6291 8922 840218H,6-24 8999 9184 9028 9558 9564 8388 6461 9267 874024H,0-24 9135 9312 9184 9687 9688 8755 6959 9401 8960
Am 8:00 8:00 8:00 8:00 8:00 11:00 11:00 - -Peak 890 869 910 902 886 648 547 891 807
Pm 17:00 17:00 17:00 18:00 17:00 17:00 13:00 - -Peak 786 797 762 819 754 646 693 784 751
# - Edited Data, L - Local Event, G1 - Global Event + Event Level
Printed at 09:32:14 on 19 Nov 2012

Site No: 30000873 Site Reference: 30000873
A67 High Street, North of Yarm BridgeWeek Begin: 05 November 2012
Vehicle Count Report All ChannelsTime Mon Tue Wed Thu Fri Sat Sun 5-Day 7-DayBegin Nov 5 Nov 6 Nov 7 Nov 8 Nov 9 Nov 10 Nov 11 Av Av
0:00 66 63 112 65 90 327 441 79 1661:00 18 20 39 20 24 195 329 24 922:00 18 26 69 25 28 144 215 33 753:00 15 20 16 21 23 70 64 19 334:00 58 37 26 36 27 48 34 37 385:00 132 131 126 116 95 52 55 120 1016:00 307 334 325 307 290 126 75 313 2527:00 1077 1146 1108 1138 1106 374 184 1115 8768:00 1676 1626 1706 1696 1666 840 409 1674 13749:00 1192 1184 1223 1206 1216 1135 739 1204 112810:00 1095 1080 1015 1128 1145 1247 926 1093 109111:00 1145 1118 1052 1115 1157 1258 1142 1117 114112:00 1147 1030 1075 1125 1122 1208 1342 1100 115013:00 1093 1125 1104 1138 1192 1189 1340 1130 116914:00 1161 1112 1206 1199 1175 1290 1275 1171 120315:00 1289 1345 1346 1379 1342 1238 1262 1340 131416:00 1371 1464 1402 1487 1422 1344 1182 1429 138217:00 1536 1583 1524 1627 1546 1256 888 1563 142318:00 1287 1286 1206 1424 1227 1051 650 1286 116219:00 768 945 885 988 1094 926 567 936 88220:00 634 567 601 651 622 656 387 615 58821:00 520 468 487 527 500 516 284 500 47222:00 287 365 421 437 606 504 218 423 40523:00 123 220 157 205 483 469 114 238 253
12H,7-19 15069 15099 14967 15662 15316 13430 11339 15223 1441216H,6-22 17298 17413 17265 18135 17822 15654 12652 17587 1660618H,6-24 17708 17998 17843 18777 18911 16627 12984 18247 1726424H,0-24 18015 18295 18231 19060 19198 17463 14122 18560 17769
Am 8:00 8:00 8:00 8:00 8:00 11:00 11:00 - -Peak 1676 1626 1706 1696 1666 1258 1142 1674 1539
Pm 17:00 17:00 17:00 17:00 17:00 16:00 12:00 - -Peak 1536 1583 1524 1627 1546 1344 1342 1563 1500
# - Edited Data, L - Local Event, G1 - Global Event + Event Level
Printed at 09:33:32 on 19 Nov 2012

Site No: 30008340 Site Reference: 30008340
A1044 Leven Road, West of Hilton Turn offWeek Begin: 05 November 2012
Vehicle Count Report Channel: EastboundTime Mon Tue Wed Thu Fri Sat Sun 5-Day 7-DayBegin Nov 5 Nov 6 Nov 7 Nov 8 Nov 9 Nov 10 Nov 11 Av Av
0:00 19 22 30 25 31 114 122 25 521:00 9 9 10 2 8 59 91 8 272:00 3 4 22 3 6 38 62 8 203:00 6 4 5 5 5 20 19 5 94:00 7 6 10 9 13 9 13 9 105:00 27 37 45 37 32 11 14 36 296:00 112 130 129 122 115 39 19 122 957:00 498 529 532 520 476 112 74 511 3928:00 757 823 824 847 794 256 120 809 6329:00 481 512 516 551 570 385 251 526 46710:00 376 362 367 398 387 485 408 378 39811:00 372 371 379 411 395 484 498 386 41612:00 351 347 370 377 464 499 520 382 41813:00 411 395 377 412 467 492 496 412 43614:00 375 376 440 422 540 516 517 431 45515:00 522 533 575 569 585 480 489 557 53616:00 585 652 633 676 762 446 454 662 60117:00 660 657 727 727 621 434 398 678 60318:00 473 503 527 499 486 346 256 498 44119:00 327 321 355 393 326 326 207 344 32220:00 212 212 215 271 187 227 119 219 20621:00 163 163 164 162 169 134 92 164 15022:00 113 140 134 146 141 196 79 135 13623:00 39 76 61 74 138 143 37 78 81
12H,7-19 5861 6060 6267 6409 6547 4935 4481 6229 579416H,6-22 6675 6886 7130 7357 7344 5661 4918 7078 656718H,6-24 6827 7102 7325 7577 7623 6000 5034 7291 678424H,0-24 6898 7184 7447 7658 7718 6251 5355 7381 6930
Am 8:00 8:00 8:00 8:00 8:00 10:00 11:00 - -Peak 757 823 824 847 794 485 498 809 718
Pm 17:00 17:00 17:00 17:00 16:00 14:00 12:00 - -Peak 660 657 727 727 762 516 520 707 653
# - Edited Data, L - Local Event, G1 - Global Event + Event Level
Printed at 09:54:55 on 19 Nov 2012

Site No: 30008340 Site Reference: 30008340
A1044 Leven Road, West of Hilton Turn offWeek Begin: 05 November 2012
Vehicle Count Report Channel: WestboundTime Mon Tue Wed Thu Fri Sat Sun 5-Day 7-DayBegin Nov 5 Nov 6 Nov 7 Nov 8 Nov 9 Nov 10 Nov 11 Av Av
0:00 20 19 23 20 16 95 121 20 451:00 1 8 9 6 10 56 89 7 262:00 8 2 5 2 2 22 43 4 123:00 5 1 7 5 6 18 18 5 94:00 12 8 5 10 16 16 14 10 125:00 52 42 46 46 39 11 16 45 366:00 128 123 117 125 106 35 28 120 957:00 431 454 463 459 422 154 87 446 3538:00 685 702 723 707 691 253 144 702 5589:00 325 314 358 394 398 410 268 358 35210:00 316 308 361 360 379 411 367 345 35711:00 333 358 348 352 422 500 413 363 38912:00 337 345 402 384 486 541 560 391 43613:00 371 348 324 373 415 517 517 366 40914:00 412 414 382 395 440 451 429 409 41815:00 589 631 579 620 741 424 489 632 58216:00 629 633 655 660 688 460 449 653 59617:00 620 657 722 723 576 391 311 660 57118:00 544 491 504 547 434 361 255 504 44819:00 258 377 364 362 342 308 196 341 31520:00 222 205 233 240 193 210 117 219 20321:00 172 164 147 169 145 169 90 159 15122:00 100 121 137 109 220 165 67 137 13123:00 52 48 55 59 122 138 34 67 73
12H,7-19 5592 5655 5821 5974 6092 4873 4289 5827 547116H,6-22 6372 6524 6682 6870 6878 5595 4720 6665 623418H,6-24 6524 6693 6874 7038 7220 5898 4821 6870 643824H,0-24 6622 6773 6969 7127 7309 6116 5122 6960 6577
Am 8:00 8:00 8:00 8:00 8:00 11:00 11:00 - -Peak 685 702 723 707 691 500 413 702 632
Pm 16:00 17:00 17:00 17:00 15:00 12:00 12:00 - -Peak 629 657 722 723 741 541 560 694 653
# - Edited Data, L - Local Event, G1 - Global Event + Event Level
Printed at 09:54:55 on 19 Nov 2012

Site No: 30008340 Site Reference: 30008340
A1044 Leven Road, West of Hilton Turn offWeek Begin: 05 November 2012
Vehicle Count Report All ChannelsTime Mon Tue Wed Thu Fri Sat Sun 5-Day 7-DayBegin Nov 5 Nov 6 Nov 7 Nov 8 Nov 9 Nov 10 Nov 11 Av Av
0:00 39 41 53 45 47 209 243 45 971:00 10 17 19 8 18 115 180 14 522:00 11 6 27 5 8 60 105 11 323:00 11 5 12 10 11 38 37 10 184:00 19 14 15 19 29 25 27 19 215:00 79 79 91 83 71 22 30 81 656:00 240 253 246 247 221 74 47 241 1907:00 929 983 995 979 898 266 161 957 7448:00 1442 1525 1547 1554 1485 509 264 1511 11899:00 806 826 874 945 968 795 519 884 81910:00 692 670 728 758 766 896 775 723 75511:00 705 729 727 763 817 984 911 748 80512:00 688 692 772 761 950 1040 1080 773 85513:00 782 743 701 785 882 1009 1013 779 84514:00 787 790 822 817 980 967 946 839 87315:00 1111 1164 1154 1189 1326 904 978 1189 111816:00 1214 1285 1288 1336 1450 906 903 1315 119717:00 1280 1314 1449 1450 1197 825 709 1338 117518:00 1017 994 1031 1046 920 707 511 1002 88919:00 585 698 719 755 668 634 403 685 63720:00 434 417 448 511 380 437 236 438 40921:00 335 327 311 331 314 303 182 324 30022:00 213 261 271 255 361 361 146 272 26723:00 91 124 116 133 260 281 71 145 154
12H,7-19 11453 11715 12088 12383 12639 9808 8770 12056 1126516H,6-22 13047 13410 13812 14227 14222 11256 9638 13744 1280218H,6-24 13351 13795 14199 14615 14843 11898 9855 14161 1322224H,0-24 13520 13957 14416 14785 15027 12367 10477 14341 13507
Am 8:00 8:00 8:00 8:00 8:00 11:00 11:00 - -Peak 1442 1525 1547 1554 1485 984 911 1511 1350
Pm 17:00 17:00 17:00 17:00 16:00 12:00 12:00 - -Peak 1280 1314 1449 1450 1450 1040 1080 1389 1295
# - Edited Data, L - Local Event, G1 - Global Event + Event Level
Printed at 10:02:07 on 19 Nov 2012
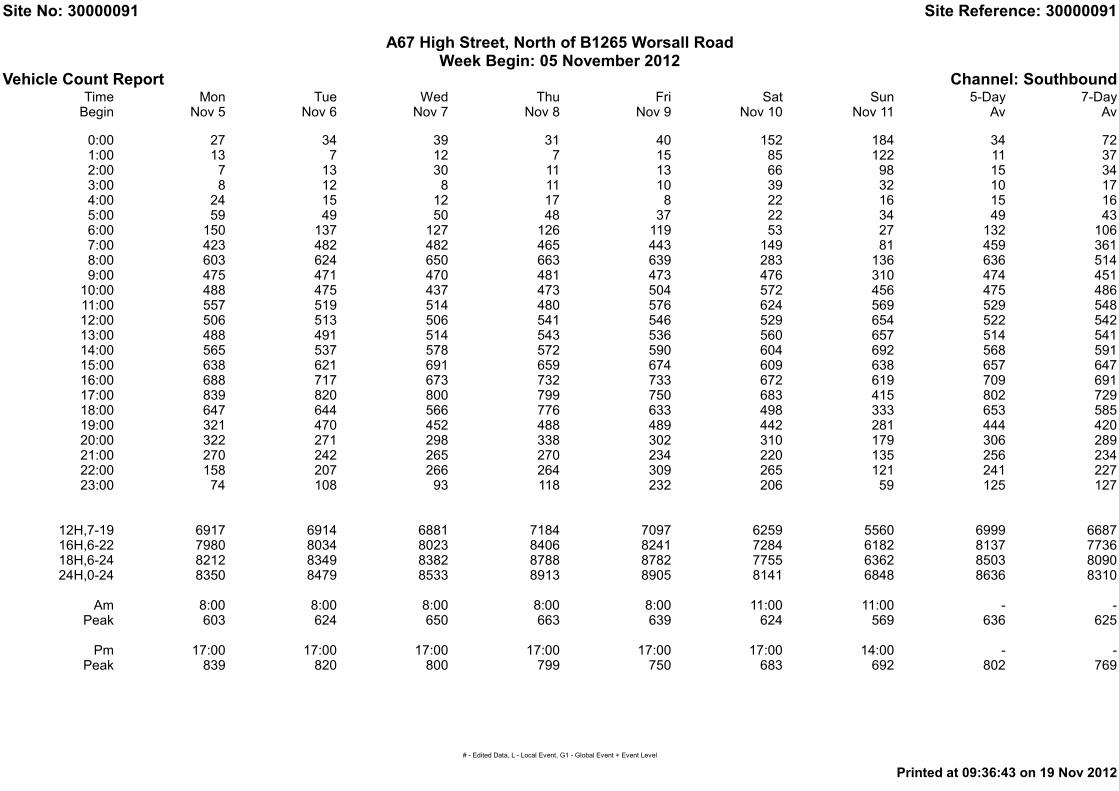
Site No: 30000091 Site Reference: 30000091
A67 High Street, North of B1265 Worsall RoadWeek Begin: 05 November 2012
Vehicle Count Report Channel: SouthboundTime Mon Tue Wed Thu Fri Sat Sun 5-Day 7-DayBegin Nov 5 Nov 6 Nov 7 Nov 8 Nov 9 Nov 10 Nov 11 Av Av
0:00 27 34 39 31 40 152 184 34 721:00 13 7 12 7 15 85 122 11 372:00 7 13 30 11 13 66 98 15 343:00 8 12 8 11 10 39 32 10 174:00 24 15 12 17 8 22 16 15 165:00 59 49 50 48 37 22 34 49 436:00 150 137 127 126 119 53 27 132 1067:00 423 482 482 465 443 149 81 459 3618:00 603 624 650 663 639 283 136 636 5149:00 475 471 470 481 473 476 310 474 45110:00 488 475 437 473 504 572 456 475 48611:00 557 519 514 480 576 624 569 529 54812:00 506 513 506 541 546 529 654 522 54213:00 488 491 514 543 536 560 657 514 54114:00 565 537 578 572 590 604 692 568 59115:00 638 621 691 659 674 609 638 657 64716:00 688 717 673 732 733 672 619 709 69117:00 839 820 800 799 750 683 415 802 72918:00 647 644 566 776 633 498 333 653 58519:00 321 470 452 488 489 442 281 444 42020:00 322 271 298 338 302 310 179 306 28921:00 270 242 265 270 234 220 135 256 23422:00 158 207 266 264 309 265 121 241 22723:00 74 108 93 118 232 206 59 125 127
12H,7-19 6917 6914 6881 7184 7097 6259 5560 6999 668716H,6-22 7980 8034 8023 8406 8241 7284 6182 8137 773618H,6-24 8212 8349 8382 8788 8782 7755 6362 8503 809024H,0-24 8350 8479 8533 8913 8905 8141 6848 8636 8310
Am 8:00 8:00 8:00 8:00 8:00 11:00 11:00 - -Peak 603 624 650 663 639 624 569 636 625
Pm 17:00 17:00 17:00 17:00 17:00 17:00 14:00 - -Peak 839 820 800 799 750 683 692 802 769
# - Edited Data, L - Local Event, G1 - Global Event + Event Level
Printed at 09:36:43 on 19 Nov 2012
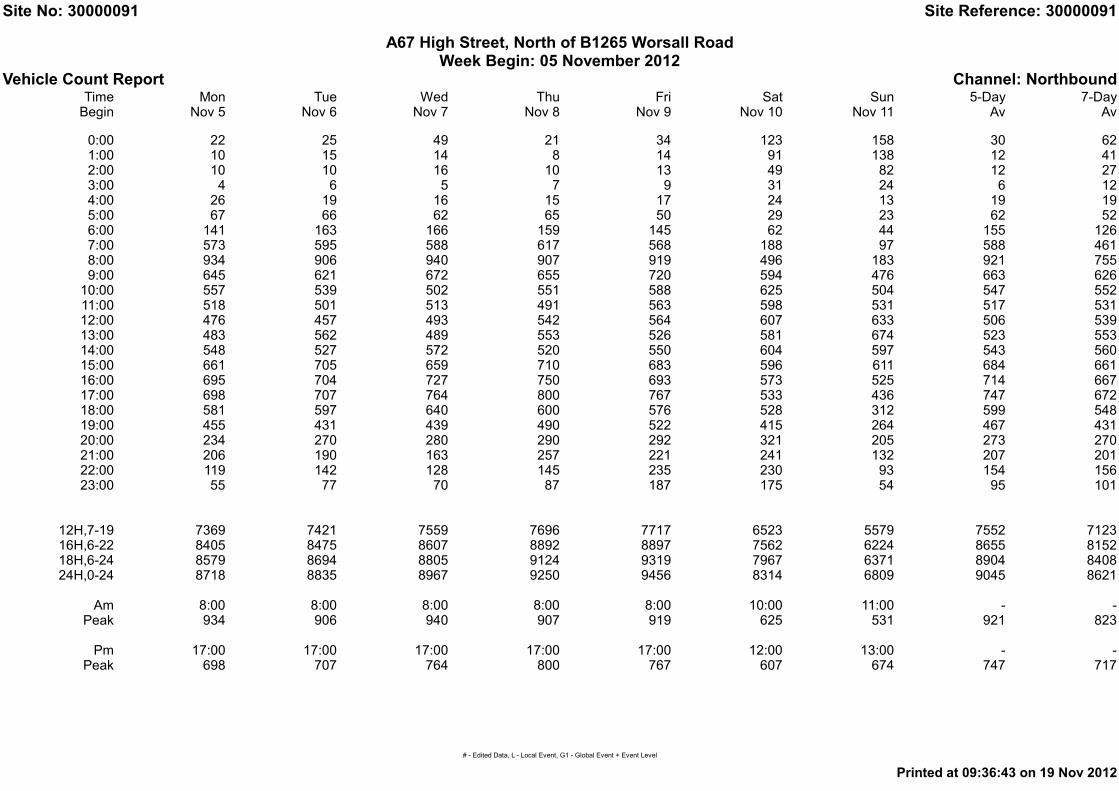
Site No: 30000091 Site Reference: 30000091
A67 High Street, North of B1265 Worsall RoadWeek Begin: 05 November 2012
Vehicle Count Report Channel: NorthboundTime Mon Tue Wed Thu Fri Sat Sun 5-Day 7-DayBegin Nov 5 Nov 6 Nov 7 Nov 8 Nov 9 Nov 10 Nov 11 Av Av
0:00 22 25 49 21 34 123 158 30 621:00 10 15 14 8 14 91 138 12 412:00 10 10 16 10 13 49 82 12 273:00 4 6 5 7 9 31 24 6 124:00 26 19 16 15 17 24 13 19 195:00 67 66 62 65 50 29 23 62 526:00 141 163 166 159 145 62 44 155 1267:00 573 595 588 617 568 188 97 588 4618:00 934 906 940 907 919 496 183 921 7559:00 645 621 672 655 720 594 476 663 62610:00 557 539 502 551 588 625 504 547 55211:00 518 501 513 491 563 598 531 517 53112:00 476 457 493 542 564 607 633 506 53913:00 483 562 489 553 526 581 674 523 55314:00 548 527 572 520 550 604 597 543 56015:00 661 705 659 710 683 596 611 684 66116:00 695 704 727 750 693 573 525 714 66717:00 698 707 764 800 767 533 436 747 67218:00 581 597 640 600 576 528 312 599 54819:00 455 431 439 490 522 415 264 467 43120:00 234 270 280 290 292 321 205 273 27021:00 206 190 163 257 221 241 132 207 20122:00 119 142 128 145 235 230 93 154 15623:00 55 77 70 87 187 175 54 95 101
12H,7-19 7369 7421 7559 7696 7717 6523 5579 7552 712316H,6-22 8405 8475 8607 8892 8897 7562 6224 8655 815218H,6-24 8579 8694 8805 9124 9319 7967 6371 8904 840824H,0-24 8718 8835 8967 9250 9456 8314 6809 9045 8621
Am 8:00 8:00 8:00 8:00 8:00 10:00 11:00 - -Peak 934 906 940 907 919 625 531 921 823
Pm 17:00 17:00 17:00 17:00 17:00 12:00 13:00 - -Peak 698 707 764 800 767 607 674 747 717
# - Edited Data, L - Local Event, G1 - Global Event + Event Level
Printed at 09:36:43 on 19 Nov 2012
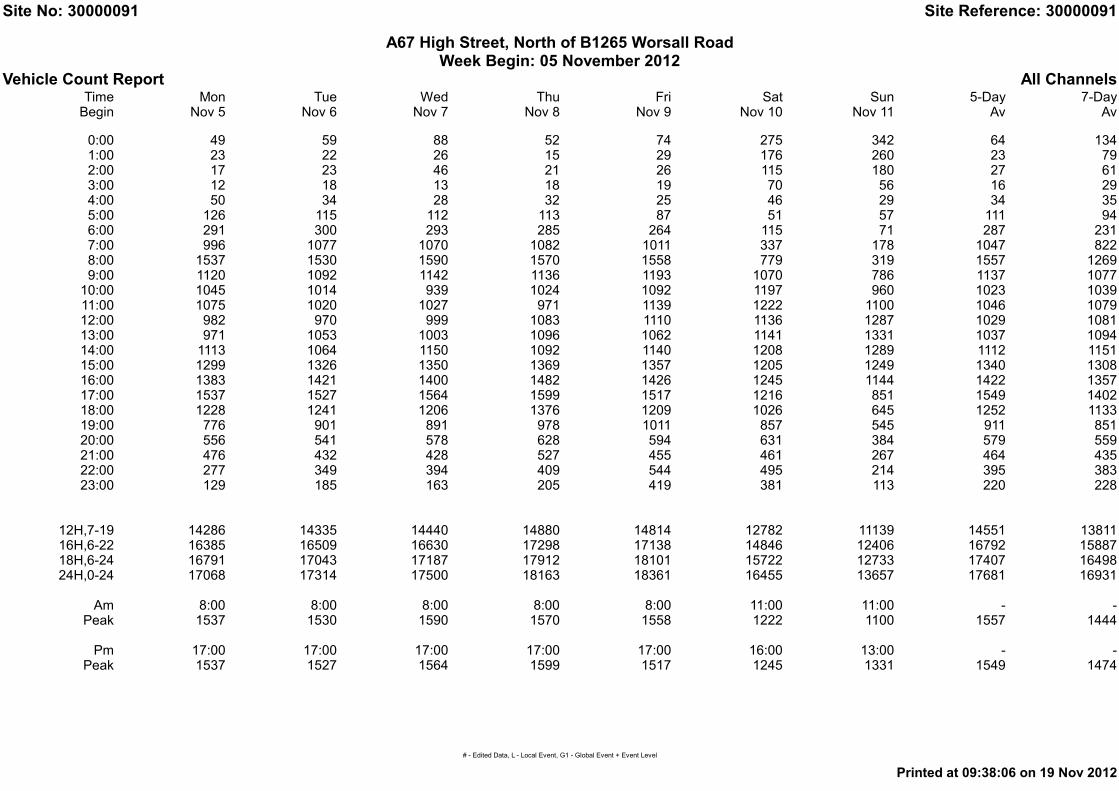
Site No: 30000091 Site Reference: 30000091
A67 High Street, North of B1265 Worsall RoadWeek Begin: 05 November 2012
Vehicle Count Report All ChannelsTime Mon Tue Wed Thu Fri Sat Sun 5-Day 7-DayBegin Nov 5 Nov 6 Nov 7 Nov 8 Nov 9 Nov 10 Nov 11 Av Av
0:00 49 59 88 52 74 275 342 64 1341:00 23 22 26 15 29 176 260 23 792:00 17 23 46 21 26 115 180 27 613:00 12 18 13 18 19 70 56 16 294:00 50 34 28 32 25 46 29 34 355:00 126 115 112 113 87 51 57 111 946:00 291 300 293 285 264 115 71 287 2317:00 996 1077 1070 1082 1011 337 178 1047 8228:00 1537 1530 1590 1570 1558 779 319 1557 12699:00 1120 1092 1142 1136 1193 1070 786 1137 107710:00 1045 1014 939 1024 1092 1197 960 1023 103911:00 1075 1020 1027 971 1139 1222 1100 1046 107912:00 982 970 999 1083 1110 1136 1287 1029 108113:00 971 1053 1003 1096 1062 1141 1331 1037 109414:00 1113 1064 1150 1092 1140 1208 1289 1112 115115:00 1299 1326 1350 1369 1357 1205 1249 1340 130816:00 1383 1421 1400 1482 1426 1245 1144 1422 135717:00 1537 1527 1564 1599 1517 1216 851 1549 140218:00 1228 1241 1206 1376 1209 1026 645 1252 113319:00 776 901 891 978 1011 857 545 911 85120:00 556 541 578 628 594 631 384 579 55921:00 476 432 428 527 455 461 267 464 43522:00 277 349 394 409 544 495 214 395 38323:00 129 185 163 205 419 381 113 220 228
12H,7-19 14286 14335 14440 14880 14814 12782 11139 14551 1381116H,6-22 16385 16509 16630 17298 17138 14846 12406 16792 1588718H,6-24 16791 17043 17187 17912 18101 15722 12733 17407 1649824H,0-24 17068 17314 17500 18163 18361 16455 13657 17681 16931
Am 8:00 8:00 8:00 8:00 8:00 11:00 11:00 - -Peak 1537 1530 1590 1570 1558 1222 1100 1557 1444
Pm 17:00 17:00 17:00 17:00 17:00 16:00 13:00 - -Peak 1537 1527 1564 1599 1517 1245 1331 1549 1474
# - Edited Data, L - Local Event, G1 - Global Event + Event Level
Printed at 09:38:06 on 19 Nov 2012

Appendix F
YIBAM Highway Improvements
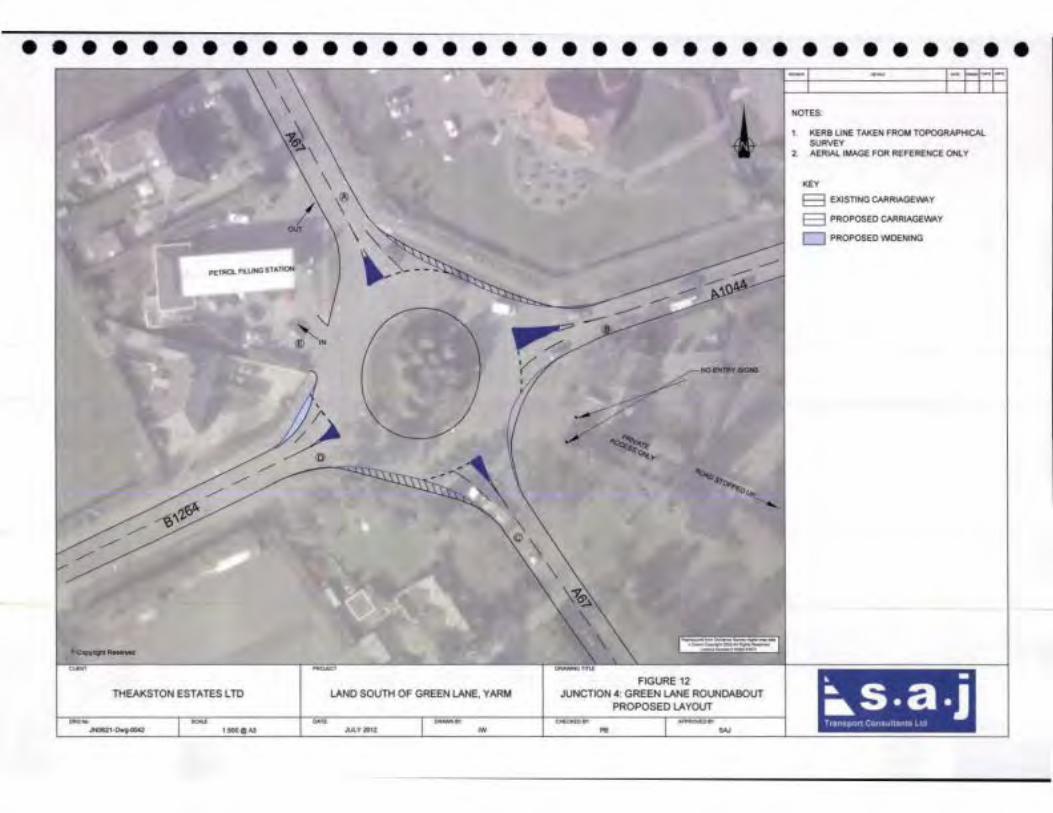
•••••••• • ••••••••••••••••••••••••
pElR(lL FI.UMG STATIOtl
CUI'N1
THEAKSTON ESTATES LTD
1.500QA3
LAND SOUTH OF GREEN LANE, YARM
IW
FIGURE 12 JUNCTION 4: GREEN LANE ROUNDABOUT
PROPOSED LAYOUT
P8
NOTES:
1. KERB UNE TAKEN FROM TOPOGRAPHICAl SURVEY
2. AERIAL IMAGE FOR REFERENCE ONLY
KEY
EJ EXISTING CARRIAGEWAY
EJ PROPOSED CARRIAGEWAY
D PROPOSED 'MOENING
II. -•s.a.J T111nsport Consullanls Lid

-----------/
--------------- ___.. .------------- \ ___ j ~ \ ______ / '-----.. .. ··------·----- ----------- --- . . ---- ----.---- -
..... ___ _ '-----·:;;---. ..--'"
•
• - - --~ --=--:=-~--~-~-----~-2--·--·----·--~-~---- - - - ,..._ I ---------- ··--------- ------------- I _____________ ::.____ -----~~~--- -1 -v------------ ---.._ ------.... .,......_ ___ ~,o:--;~ I
-Til ------~---------- ----------- -----~:::-.-:-:-:
•
I
// / /
\
I /
I
•
" ' ' ' • ' "
I
' " •• ' '
/
/i / _,~ ___ ,_,_, __ , __ ,_,_, __ , __ ,_~-!
/
•
r I I
~
I I '
i )i ) " " " ' .,,
' ,:' .....
/ J f '
I " f
!
"
I
' " " " " " " ' " " "
I I
!;! ,I I I I
" " • • ' • ' ' ' ' ' " •
" " "
.. i ;· / ,/ I !
I;' I / I ' I / I I I
I ! I I
"
Ill I " •
I , I
!l/11 I It I!/ I
I ' I I /1 I J / // / I I " I J ' / J
! ,. ' / ( I I ! ' I I f J I i I I i I I ; 1 1
i 11 I o I J ' /1! ( il l \ ! i i /
!
/ i
I I
/ /
I I _)
/ ,'
,' --
I '
/
' i
j I
(
/
' /
( /
/
/
"' \
I /
\ I I
This drawing should not be scaled. All dimensions must be checked on site and con1ractorto
report any omissions or errors to the contract administrator
NOTES
Des~tion Om Chk Date
Drawing Statua PRELIMINARY D APPROVAL D
INFORMATION 0 TENCER 0 CONSTRUCTION 0
~ Stockton-on-Tees BOROUGH COUNCIL
819 plans, bnght future
Development & Neighbourhood Services Head of Technical Servk:es Richard McGuctdn B. Eng., C. Eng., M.I.C.E. P.O.Bat 229, KingBway Hou•, West Precinct, Bllllrgh11m, TS23 2VL.. Telephone (01642) 393939. E-mail: technicalservioes@sbx:klun.gov.uk
Pmfed
Quarry Farm Roundabout lngleby Barwick
""""'"' Proposed Layout - Option 6
"""' ""' No. Jan 2014 TS/02/124/01/12
DlllWI1 Checked Scales @A 1
JG 1:500

JJ Otltlot.l
\ \ \ \ \
/
\ \ \ \ ~t ~
I
¥ \
\~ \ \ \ \ \ \ \ \ \ \ \ \ \ I ~ \
' l~-~--.
/ \ / \ Exi5Uog Pellc.~n <toning
lo be e•tended atross wtc!enlog.
-- - ·-
Centre of Excellence
Loc.al Transpon Dtlfwl)'
- · -
~ Stockton-on-Tees A ~up tOROUGH COUNCil
Development & Neighbourhood Services
r.:::=::-;::-:::=====:::-;=:::-::=;:;::;;;:-;;::-:;=.::;:;:;;::;:=::;:=~ NNdff~~Of.:ko!bnl:MN~O.S~CJ.,.....UU. Thl$ map~ reprodVeed flomOtdnanco Surwty mateflalwfth the pet mission ofOtdnaneoSurvey P.0.8o•2:t, l()lplo'IY"""*·w('ttPI'td'l«......., T5nrn.. on be"-tf of U\e Controler of Her Majesty'& Suuionary Off;ce. @Crown CopyfiOht. Uneutl'lofi:sed 1~tfl1£4)))t)9)t.t.-.t:H~I;)n.p"£1l reP'Qduetlon lnfMgO$ Crown Copyright and may toad to prosac.ution 01 clvil prooeeditlgs. sc.o~es SIOd<lO<>«l·Te<~s Borough Ccuneil 100023297 1:500
' HOlE$
-INFORMATION till TENDER 0
INGLEBY BARWICK -ACCESS IMPROVEMENTS FOR TESCO STOR
Fi 4! .2.. .,.,.,_
Proposed Layout t- A ~d...i ti :1 NJ. !"'\ cd-Af c.c-.h' 0 t'\5.
.1ob lfo.

1 ,I\,.. • , :r I ., A ! ) ...,. / ......... :"' .. .. ; .;•··-··.. _.. -...
~ y • ....
")~i ,........ It ' ~ ....... ~ .... v ")( 1 .---. . .............. r ........ ..
s ,,.. ,. .. /' 4s
-.
t
ARUP
:foB N o ~ I Z-S 4 b !7 - ~
1:NCt L..E f3V U r .., I P-W c K- vI sf, i M
H,'-{foN W A't ~~f<.OON,Hrt..L. & i4N~ L. fM(J
seALE. .:- I ! GDo ~A:,
MAD£ (t}1 _ V B
6TII.\1US - iN Di CA1 rv ~

1
1r r
l T }-
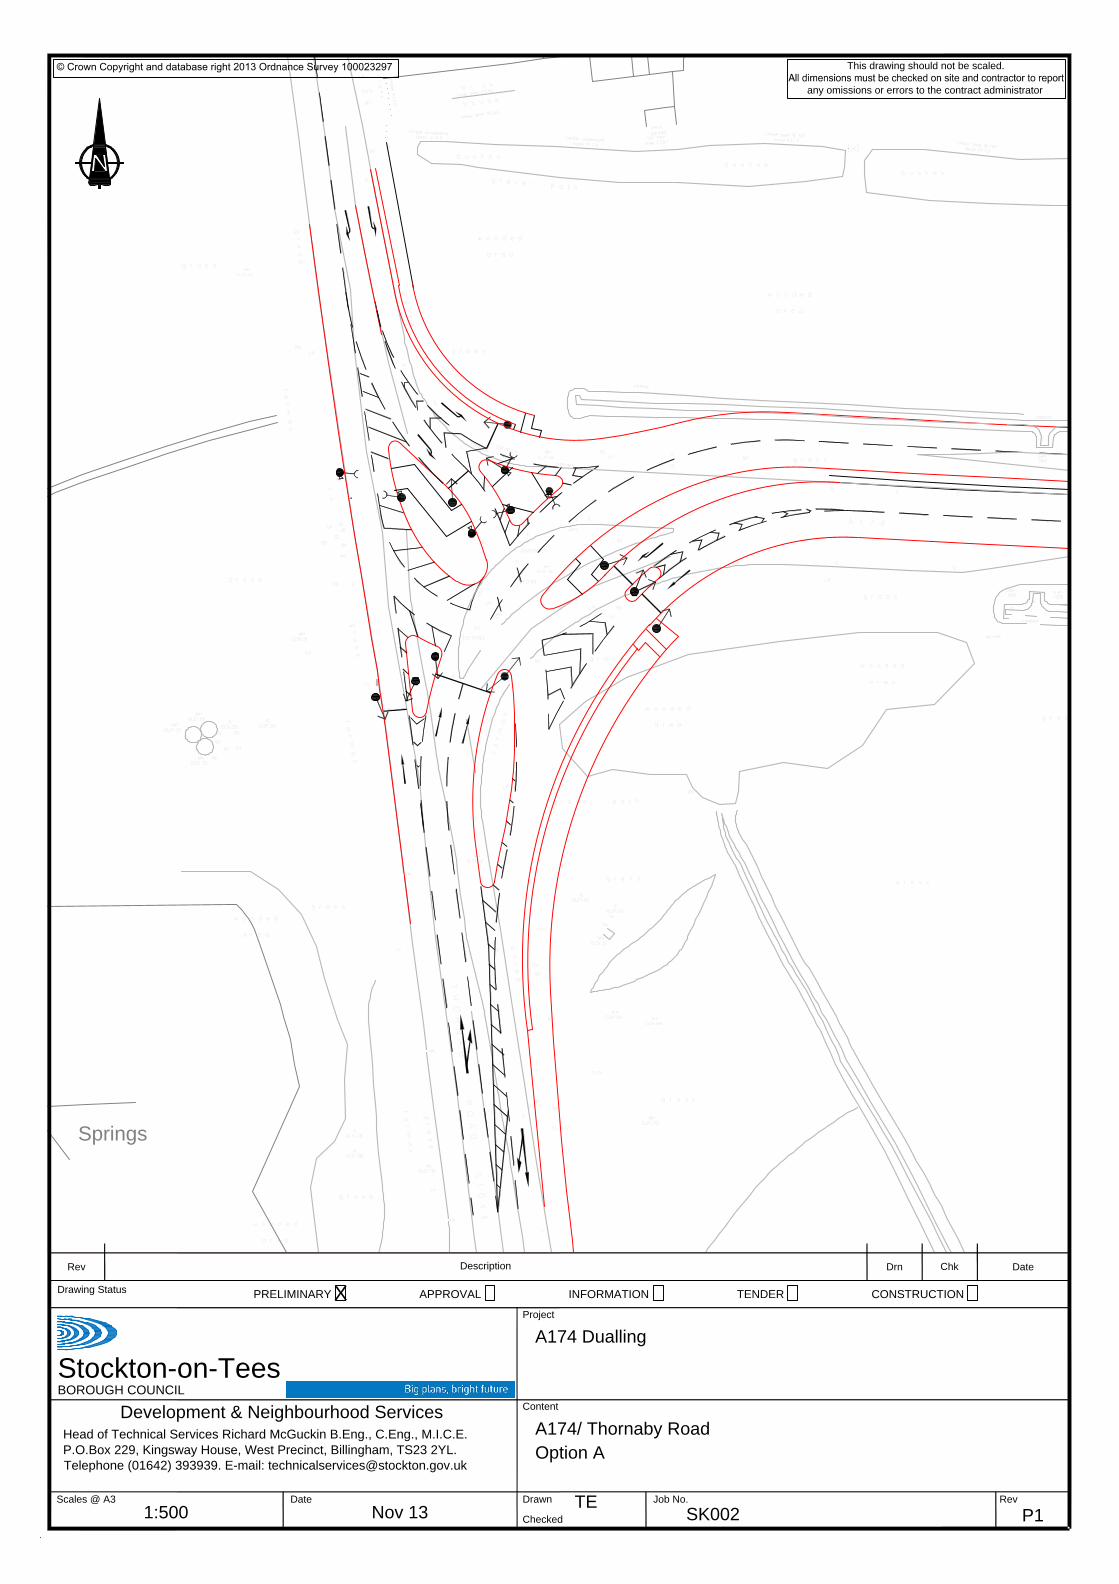
Springs
Scales @ A3
Drawing Status
Date Drawn
Content
Project
Checked
Job No.
APPROVALPRELIMINARY CONSTRUCTIONINFORMATION TENDER
© Crown Copyright and database right 2013 Ordnance Survey 100023297
Stockton-on-Tees
BOROUGH COUNCIL
Head of Technical Services Richard McGuckin B.Eng., C.Eng., M.I.C.E.
P.O.Box 229, Kingsway House, West Precinct, Billingham, TS23 2YL.
Telephone (01642) 393939. E-mail: [email protected]
This drawing should not be scaled.
any omissions or errors to the contract administrator
Rev
Description
Drn Chk Date
Rev
Development & Neighbourhood Services
A174 Dualling
A174/ Thornaby Road
Option A
1:500 Nov 13
TE
SK002
X
P1
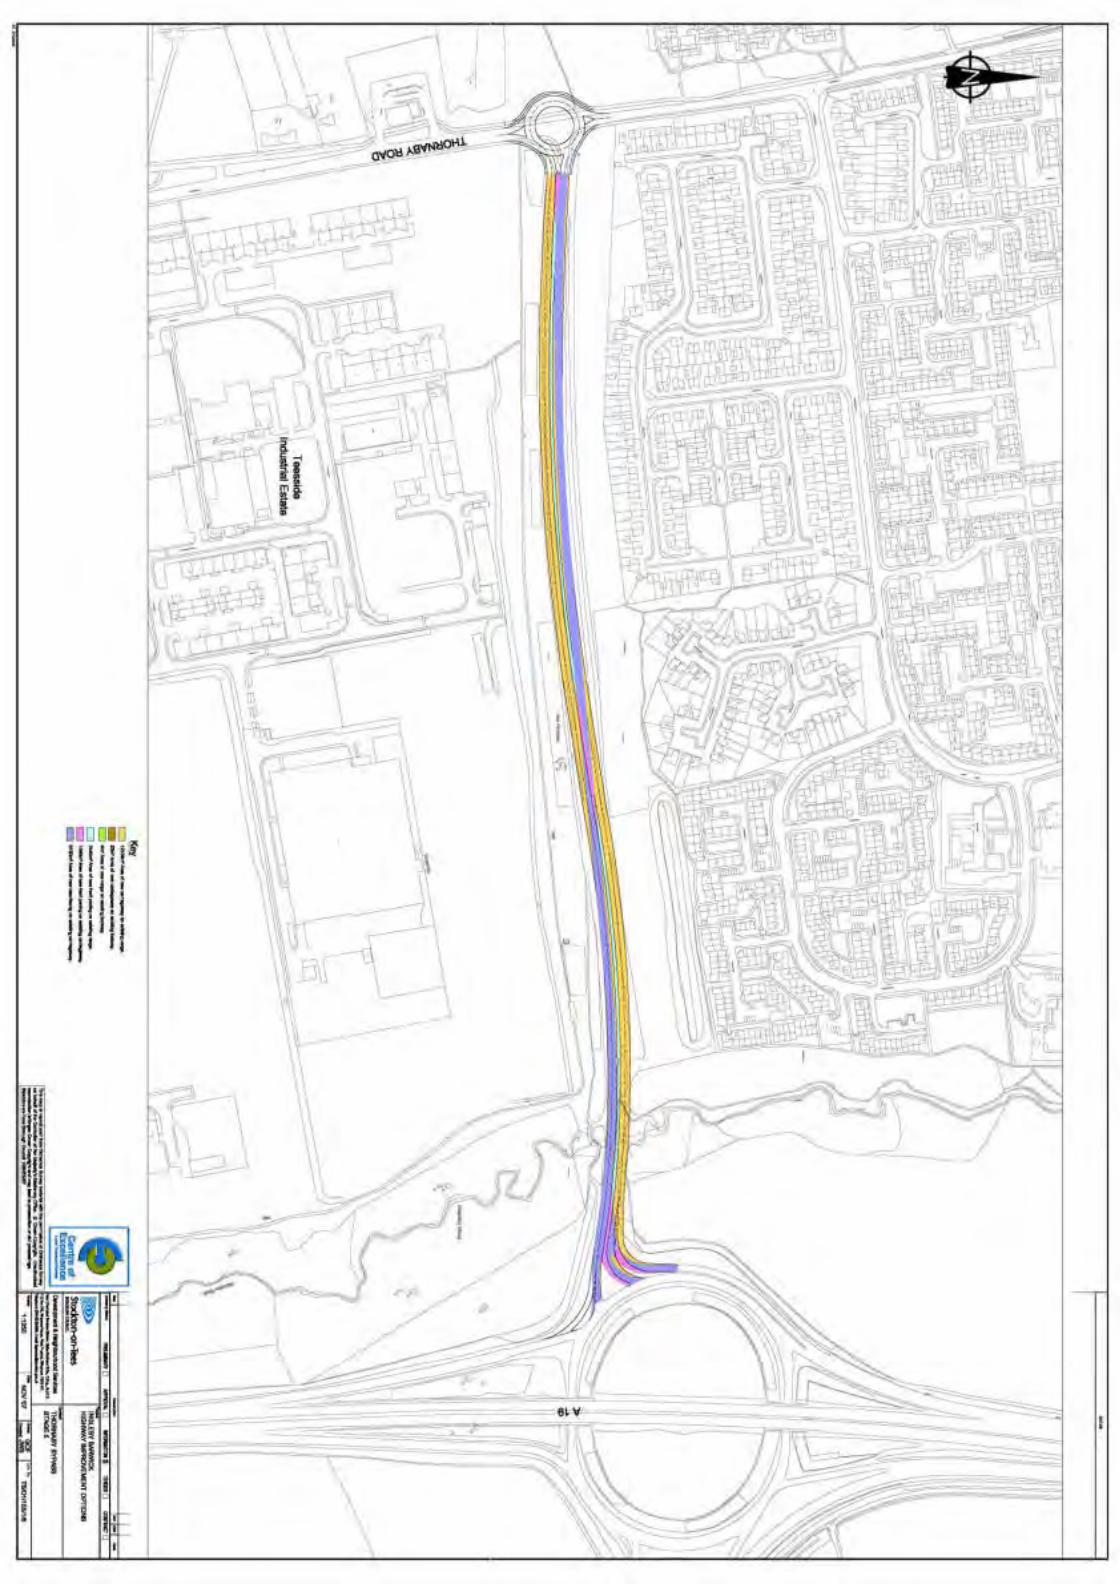

-
-
I
""''"
I-
I-
EIStJb Sis
\
Al Ongmal
NOTES
"
New Plantation New Planlatloo
===-------== A -; ~ ~ \ \
-----..- -/ L --- _;--
•
Key D 32561W Area of new carriageway on existing verge.
D 12271W Area of new hard paving on existing verge.
CJ 348mz Area of new hard paving on existing carriagew.:Jy.
c:J 1342m2 Area of new resurfacing on existing carriageway.
-
I I - r
\ -
! ~------ ....-.-New Plantation
New Plantation
\~ r
Description Om Chk
Drawing Status PRELIMINARY 0 APPROVAL 0 INFORMATION !XI TENDER 0 CONTRACT 0 Project
INGLEBY BARWICK ~?» HIGHWAY IMPROVEMENT OPTIONS
Centre of Excellence
Stockton-on-Tees BOROUGH COUNCIL
Development & Neighbourhood Services r:;:;--;---,-------;---,-;--:;:-,----:;----;-:--;---::;--:;--~==~::;:=:::;;==-, Head (Technical Services DMBioo ):Mike Robinson B.Sc., C.Eng., M.I.C.E. This map is reproduced from Ordnance Survey material with the permission of Ordnance Survey P.O.BoJ: 229, Kingsway HolJBe, west Pll!Cinct, Billingham, TS23 2YL
Local Transport Delivery
on behalf of the Controller of Her Majesty's Stationary Office. @ Crown Copyright. Unauthorised Telephone (01642) 393939. E-md: hi!IJways@stnc:klon.gov.uk:
Scales Date
Content
PARKWAY EXTENSION ROUNDABOUT - OPTION A
Job No . reproduction infringes Crown Copyright and may lead to prosecution or civil proceedings. Stockton-on-Tees Borough Council100023297 1:500 NOV '07
0"'"" GCF
Cheoked JWS TS/D1/155/1/7
Date

Appendix G
YIBAM Results

AM Peak 08:00 - 09:00
Journey Times
Route No. Description 8a 12e 12e minus 8a
Route 7 A67 / B1264 RA to High Street / Bridge Street 09:00 10:13 01:13
Route 8 A67 Southbound (Coatham Vale to Kirklevington Hall Dr) 08:11 06:52 -01:18
Route 9 Green Lane EB (West of Allerton Bank to East of Glaisdale Road) 04:20 04:21 00:02
Route 10 Green Lane WB (East of Glaisdale Road to West of Allerton Bank) 05:03 04:23 -00:40
Side Road 1 Worsall Road NB (Allerton Bank to The Spital) 07:09 08:26 01:16
Side Road 2 Leven Road WB (Valley Drive to A67 Thirsk Road) 03:11 02:38 -00:34
Side Road 3 Kirk Road SB (Leven Road to Green Lane) 01:08 01:01 -00:07
Queues
A67/A1044 Roundabout 8a 12e 12e minus 8a
A67 Southbound 50 47 -3
Green Lane Westbound 31 15 -16
A67 Northbound 9 4 -4
Green Lane Eastbound 28 42 14
Roundabout Total 108
Railway Bridge Eastbound 32 37 5
Railway Bridge Westbound 26 54 28
Summary Statistics
Parameter Unit 8a 12e 12e minus 8a
Mean Flow veh/hr 13331 13517 186
Mean Travel Time sec/km 107 111 4
Mean Delay Time sec/km 49 52 3
Mean Speed km/hr 41.0 40 -1
Total Distance travelled km 40694 41674 980
Total Traveltime hr 1112 1178 66
Veh waiting to enter 18 28 10
Veh inside the network 1191 1249 58
Veh exited network 13331 13517 186
Matrix Total 13084 13316 232
Ave Journey Distance km / trip 3.11 3.13 0.0
Ave Journey Time mins / trip 5.1 5.3 0.2
Mitigation
370 Houses
2022 Green Lane Rev3 +
Mitigation 10%
2022
Committed
Base
Redistributed
\\global\europe\newcastle\Jobs\220000\224125\10 Yarm Modelling Support\Docs\40- Calcs\Aimsun\
Scenarios Results Green Lane Rev3 -20130227.xlsx 1/2
17:35
25/09/2014

PM Peak 17:00 - 18:00
Journey Times
Route No. Description 8a 12e 12e minus 8a
Route 7 A67 / B1264 RA to High Street / Bridge Street 09:32 10:57 01:24
Route 8 A67 Southbound (Coatham Vale to Kirklevington Hall Dr) 13:41 11:32 -02:09
Route 9 Green Lane EB (West of Allerton Bank to East of Glaisdale Road) 04:19 05:51 01:32
Route 10 Green Lane WB (East of Glaisdale Road to West of Allerton Bank) 04:07 04:29 00:22
Side Road 1 Worsall Road NB (Allerton Bank to The Spital) 03:14 03:26 00:12
Side Road 2 Leven Road WB (Valley Drive to A67 Thirsk Road) 01:12 01:30 00:18
Side Road 3 Kirk Road SB (Leven Road to Green Lane) 00:57 00:59 00:02
Queues
A67/A1044 Roundabou 8a 12e 12e minus 8a
A67 Southbound 40 46 6
Green Lane Westbound 26 6 -20
A67 Northbound 28 10 -18
Green Lane Eastbound 32 32 0
Roundabout Total 95
Railway Bridge Eastbound 23 50 27
Railway Bridge Westbound 26 57 31
Summary Statistics
Parameter Unit 8a 12e 12e minus 8a
Mean Flow veh/hr 13817 14075 258
Mean Travel Time sec/km 116 119 3
Mean Delay Time sec/km 58 60 2
Mean Speed km/hr 38.9 38 0
Total Distance travelled km 41596 42922 1326
Total Traveltime hr 1185 1267 82
Veh waiting to enter 74 75 2
Veh inside the network 1324 1428 104
Veh exited network 13817 14075 258
Matrix Total 13675 13944 269
Ave Journey Distance km / trip 3.04 3.08 0.0
Ave Journey Time mins / trip 5.2 5.5 0.3
Mitigation
370 Houses
2022 Green Lane Rev3 +
Mitigation 10%
2022
Committed
Base
Redistributed
\\global\europe\newcastle\Jobs\220000\224125\10 Yarm Modelling Support\Docs\40- Calcs\Aimsun\
Scenarios Results Green Lane Rev3 -20130227.xlsx 2/2
17:35
25/09/2014

Appendix H
JMP Wynyard VISSIM Validation Report

A19 A689 Vissim Model Update
Local Model Validation Report
Report


A19 A689 Vissim Model Update
Local Model Validation Report
Report
JMP Consultants Limited
Rotterdam House 116 Quayside Newcastle Upon Tyne
NE1 3DY T 0191 206 4085
F 0191 206 4001 E [email protected]
www.jmp.co.uk
Job No. V211111
Report No. V211111-001
Prepared by PG
Verified by SP
Approved by SP
Status Draft
Issue No. 1
Date 21 March 2013


A19 A689 Vissim Model Update
Local Model Validation Report
Report
Contents Amendments Record
This document has been issued and amended as follows:
Status/Revision Revision description Issue Number Approved By Date
Draft 1 Steve Pickard 20/03/2013
Final 2 Steve Pickard 21/03/2013

Job No Report No Issue no Report Name Page
V211111 V211111-001 1 A19 A689 Vissim Model Update 7
Contents
1 INTRODUCTION ................................................................................................................... 1
Overview ............................................................................................................................... 1
Report Structure .................................................................................................................... 1
2 BASE NETWORK VISSIM MODEL CONSTRUCTION ........................................................... 2
Overview ............................................................................................................................... 2
Methodology for Network Construction ................................................................................... 4
Summary ............................................................................................................................... 5
3 TRAFFIC FLOW DATA COLLECTION ................................................................................... 6
Background ........................................................................................................................... 6
Matrix Estimation ................................................................................................................... 6
4 BASE MODEL CALIBRATION ............................................................................................... 7
Synopsis ................................................................................................................................ 7
Overview ............................................................................................................................... 7
Calibration Results................................................................................................................. 9
5 BASE MODEL VALIDATION................................................................................................ 10
Overview ............................................................................................................................. 10
Validation Results ................................................................................................................ 10
6 SUMMARY .......................................................................................................................... 15
Tables, Figures and Diagrams
Table 2.1 Five key steps to network construction ...........................................................................4 Table 4.1 Calibration Results.........................................................................................................9 Table 5.1 TRADS Data Model Validation – Morning Peak ............................................................ 11 Table 5.2 TRADS Data Model Validation – Evening Peak ............................................................ 11 Table 5.3 Journey Time Model Validation – Morning Peak ........................................................... 11 Table 5.4 Journey Time Model Validation – Evening Peak ........................................................... 12 Table 5.5 Journey Time Variability Analysis ................................................................................. 13
Figure 3.1 - Study area network coverage ......................................................................................2 Figure 4.1 – MTC survey locations .................................................................................................6 Figure 5.1 - Vissim model iterative calibration .................................................................................8 Figure 6.1 – TRADS and journey time validation........................................................................... 10 Figure 6.2 – A689 eastbound modelled queue .............................................................................. 14
Appendices
APPENDIX A Calibration Spreadsheets


Job No Report No Issue no Report Name Page
V211111 V211111-001 1 A19 A689 Vissim Model Update 1
1 Introduction
Overview
1.1 The objective of this study was to produce a 2013 base year VISSIM model of the A19 and A689
for the morning and evening peak periods. The model was calibrated and validated in accordance
with guidance presented in the Department for Transport [DfT] published Design Manual for Roads and Bridges [DMRB].
1.2 Subsequently, the recently approved A19 / A689 Wolviston pinch point programme scheme has
been coded into the model to enable the testing of development scenarios by applicants and their
consultants.
Report Structure
1.3 This report is concerned with the calibration and validation of the base model.
1.4 Following this introduction, the report is divided into the following chapters:
Chapter 2 describes the base network VISSIM model construction;
Chapter 3 describes the traffic flow data collection and derivation;
Chapter 4 describes the base model calibration;
Chapter 5 describes the base model validation; and
Chapter 6 provides a brief summary.

Page Job No Report No Issue no Report Name
2 V211111 V211111-001 1 A19 A689 Vissim Model Update
2 Base Network VISSIM Model Construction
Overview
2.1 This chapter presents the location of the study area and provide details of the methodology
governing the construction of the VISSIM model.
Network Coverage
2.2 The study area comprises the area shown below in Figure 2.1.
Figure 2.1 - Study area network coverage
2.3 The study area network includes the following junctions:
A689 / The Wynd / Newton Hanzard Long Drive,
A689 / The Wynd / Glenarm Road (hospital access),
A689/Samsung Avenue,
A19/A689 Wolviston Interchange,
A689/services, and
A689/A1185 Wolviston Roundabout.
Data Collection / Understanding Network Operation
2.4 The network was obtained from a previous VISSIM modelling commission to assess the impact of
the potential Wynyard Hospital scheme.

Job No Report No Issue no Report Name Page
V211111 V211111-001 1 A19 A689 Vissim Model Update 3
2.5 The construction of the network is thus documented within the Local Model Validation Report for
that study (File Reference: JMP Wynyard LMVR NEA2109-001 161009.doc)
Standards, Guidance and Reference Documents
2.6 In constructing the model network, a number of standards, guidance and reference documents
were used to assist and provide information on best practice. This referencing increases
confidence in the robustness of the model and ensures that it meets accepted criteria on micro-
simulation modelling.
2.7 The following is a list of the standards, guidance and reference documents that were used:
VISSIM 5.1 user manual;
Design Manual for Roads and Bridges [DMRB] Volume 12, Section 2 Traffic Appraisal Advice;
HA Micro-simulation Guidelines, 2007; and
IAN 36/01 - the use and application of micro-simulation traffic models.
Modelled Time Period
2.8 The duration of the modelled peak period is 07.00 – 09.30, the duration of the evening peak period
is 16:00 to 18:30.
2.9 The model ran for a period of 150 minutes (9000 seconds), which incorporates the observed peak
hour and ‘shoulder’ periods either side of the peak hour to demonstrate the rising and falling nature
of traffic flows in the study area.

Page Job No Report No Issue no Report Name
4 V211111 V211111-001 1 A19 A689 Vissim Model Update
Methodology for Network Construction
2.10 Table 2.1 below demonstrates the five key steps to constructing the base VISSIM model. The
network was constructed using a mixture of generic and network specific data in VISSIM version
5.40.02.
Table 2.1 Five key steps to network construction
Network Construction
Parameters VISSIM Default Setting
Comment
Step 1 Define links and connectors
Motorway mainline Yes Wiedemann 99
Urban Yes Wiedemann 74
Motorway offline Yes Wiedemann 74
Step 2 Define vehicle information
Vehicle types Yes Cars and HGV’s
Vehicle classes Yes Cars and HGV’s
Vehicle compositions No Separate matrices were derived for both light and heavy vehicles
Step 3 Define desired speed distributions
Speed No Average speed data extracted from TRADS, along with known road speed limits
Step 4 Define network specific characteristics
Lane change distance No Adjustments made to facilitate network calibration
Areas of reduced speed
N/A Used to reflect vehicles reduced speed on roundabouts
Gradients N/A
Priority markers No Adjustments made to facilitate network calibration
Yellow boxes N/A
Traffic signals N/A
Step 5 Define data collection points and markers
Data collection and node evaluation
No Based upon TRADS survey locations and junction turning movements
Step 1 – Define Links and Connectors
2.11 No information relating to the driver behaviour parameters was altered from the default settings.
Step 2 – Define Vehicle Information
2.12 The vehicle information was extracted from survey data and combined into cars and HGV’s.
Step 3 – Check Desired Speed Distributions
2.13 The desired speed distributions were profiled from known study area speed limits and average
speeds determined from TRADS.
Step 4 – Check Network Specific Characteristics
2.14 Some of the data coded into the network was site specific as described in the following sub-
sections;

Job No Report No Issue no Report Name Page
V211111 V211111-001 1 A19 A689 Vissim Model Update 5
Motorway junction lane change distances - The lane change distances for the trunk road
junctions were set to reflect the signing along the routes. The distances were set in order to
best represent how far in advance drivers would first begin to organise themselves for the next
section of their route.
Priority markers – The priority control markers were calibrated to best reflect the operation of
each junction.
Step 5 – Define Data Collection Points and Markers
2.15 A complete set of data collection points were coded into the model for validation purposes.
2.16 All data was output in comma separated value (CSV) format for input into MS Excel utilising
bespoke spreadsheets to compare recordings.
2.17 A series of extra checks were made on the network to ensure the validity of the traffic model
network in Vissim. These checks are as follows:
Range Checks
The characteristics of all the links were checked to ensure that they are appropriate for that type of
link. Characteristics include speed flow relationships and number of lanes.
Link Lengths
The lengths of all links within the network were checked against distances measured on site visits
and from OS maps.
Route Checking
The routes for all vehicles between each origin and destination pair were checked for
appropriateness of routeing.
Summary
2.18 The A19 and A689 corridor was represented in Vissim using the stepped approach to network
configuration described above. Network parameters have been further modified as part of the
iterative calibration process described in Chapter 4.
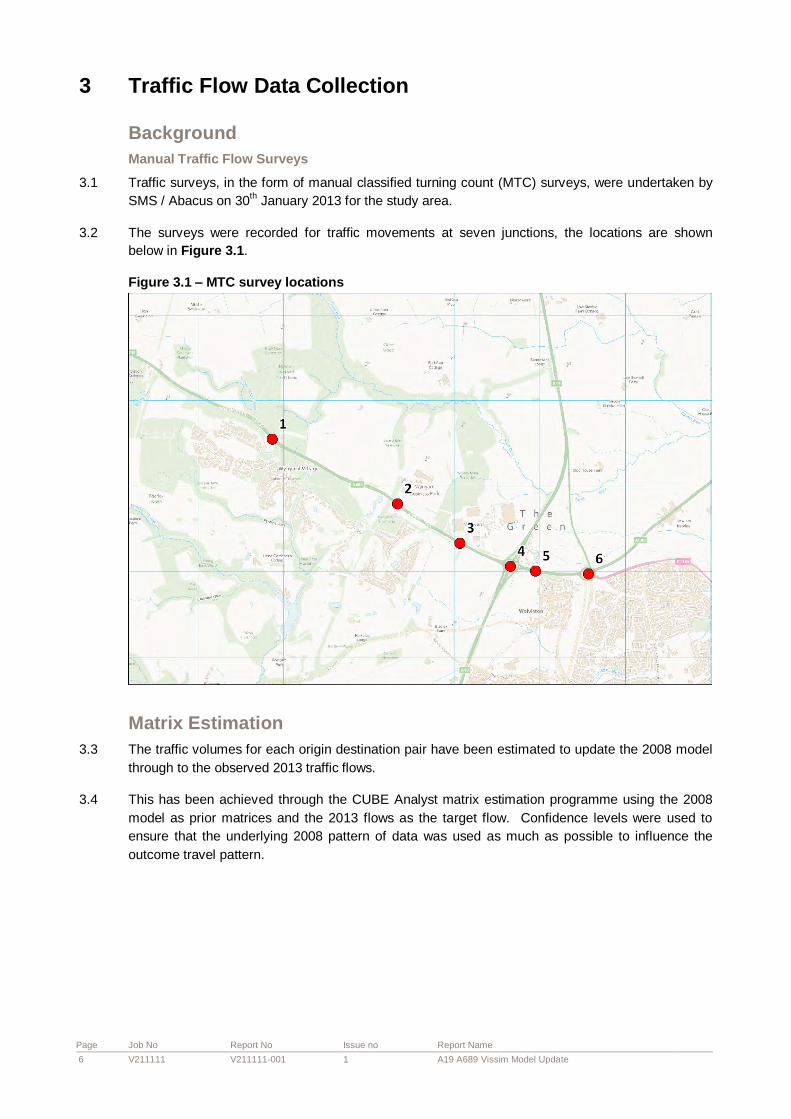
Page Job No Report No Issue no Report Name
6 V211111 V211111-001 1 A19 A689 Vissim Model Update
3 Traffic Flow Data Collection
Background
Manual Traffic Flow Surveys
3.1 Traffic surveys, in the form of manual classified turning count (MTC) surveys, were undertaken by
SMS / Abacus on 30th January 2013 for the study area.
3.2 The surveys were recorded for traffic movements at seven junctions, the locations are shown
below in Figure 3.1.
Figure 3.1 – MTC survey locations
Matrix Estimation
3.3 The traffic volumes for each origin destination pair have been estimated to update the 2008 model
through to the observed 2013 traffic flows.
3.4 This has been achieved through the CUBE Analyst matrix estimation programme using the 2008
model as prior matrices and the 2013 flows as the target flow. Confidence levels were used to
ensure that the underlying 2008 pattern of data was used as much as possible to influence the
outcome travel pattern.

Job No Report No Issue no Report Name Page
V211111 V211111-001 1 A19 A689 Vissim Model Update 7
4 Base Model Calibration
Synopsis
4.1 Calibration of a base model is an iterative process requiring modifications, in this case, to the
construction of the base network.
4.2 A key aspect of model calibration is comparing the observed traffic data against the modelled traffic
data, and with traffic behaviour in the model being reviewed against JMP’s site knowledge.
Overview
4.3 Calibration is defined as “a process of tuning and refining the input data and parameters within the model in order to agree with real observed data, and then provide a tool which is reliable for forecasting” (IAN 36/01).
4.4 The DMRB, Volume 12, provides guidance on the acceptable criteria to be achieved when
comparing modelled link flows against observed counts. This is traditionally used for the calibration
and validation of macroscopic models such as SATURN, and it is suggested in the HA Micro-
simulation Guidance that it also be used for micro-simulation models.
4.5 The GEH statistic is a standard way of comparing observed and modelled flows defined in DMRB
Volume 12. It removes the bias that exists when comparing flows of different magnitudes using
percentages, such that a difference of 10 in a flow of 100 VPH is less significant (GEH = 3) than a
difference of 100 in a flow of 1000 vph (GEH = 11.5)
4.6 The GEH statistic is calculated by:
2/
2
CM
CMGEH
Where:
GEH = GEH statistic
M = Modelled flow
C = Observed flow
4.7 DMRB guidance indicates that GEH should be below 5.0 for 85% of modelled hourly flows.
Iterative Process
4.8 Obtaining a calibrated Vissim model can be an iterative process, as shown below in Figure 4.1,
requiring in this case, modifications to the construction of the base model network.

Page Job No Report No Issue no Report Name
8 V211111 V211111-001 1 A19 A689 Vissim Model Update
Figure 4.1 - Vissim model iterative calibration
4.9 Paragraphs 4.13 to 4.16 discuss the process of refining the input data and the default parameters
within Vissim such that the model agrees with real observed data. The objective is to achieve
calibration of the Vissim model such that it agrees (to an acceptable level of confidence) with real
observed data as defined in the DMRB.
4.10 Validation of the Vissim model (as described in Chapter 5) is the next step and seeks to
demonstrate that the base model is suitable for use in scenario testing by comparing the modelled
outputs to further independent traffic data. The data used in the validation process is independent
of that used in the calibration process.
Refining Input Data
4.11 Chapter 3 describes the traffic flow derivation process. In this instance, the data extracted from
Vissim (after flows have been assigned to the network) shows that all vehicles were able to leave
their input points, suggesting correct assignment within the model.
Parameter Calibration
4.12 A key theme emerging from the guidelines mentioned in Chapter 2 is that the parameters used in
the micro-simulation model (whichever software is used) need to have been specifically tested and
then selected to produce the expected vehicle behaviour.
4.13 Vissim version 5.40.02 offers the user the opportunity to select one of two car following models
which affect vehicle behaviour within Vissim, namely Weidemann 74 or Weidemann 99.
4.14 The parameters that were used in the base model were based mainly on Weidemann 99 for the
A19(T), since the parameters which underpin this car following model are suitable for motorway
and trunk road traffic. Weidemann 74 was used for the remainder of the model, because the
parameters produced by this car following model are suitable for modelling local road traffic.
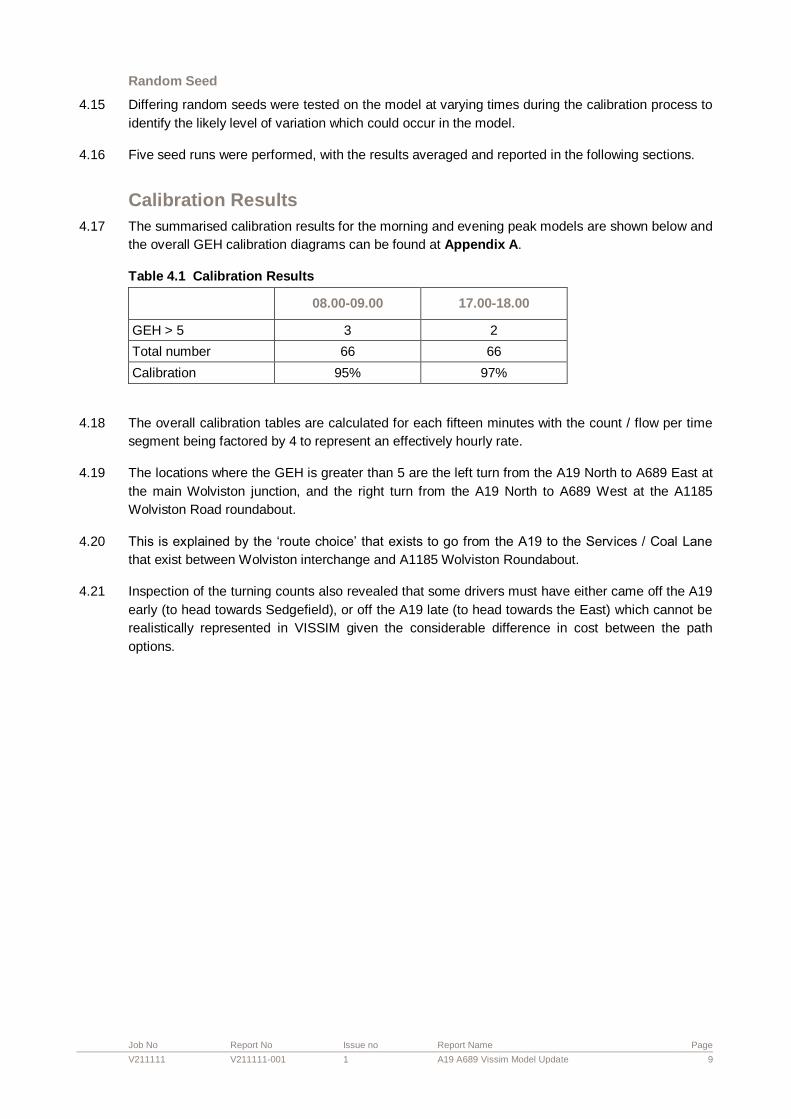
Job No Report No Issue no Report Name Page
V211111 V211111-001 1 A19 A689 Vissim Model Update 9
Random Seed
4.15 Differing random seeds were tested on the model at varying times during the calibration process to
identify the likely level of variation which could occur in the model.
4.16 Five seed runs were performed, with the results averaged and reported in the following sections.
Calibration Results
4.17 The summarised calibration results for the morning and evening peak models are shown below and
the overall GEH calibration diagrams can be found at Appendix A.
Table 4.1 Calibration Results
08.00-09.00 17.00-18.00
GEH > 5 3 2
Total number 66 66
Calibration 95% 97%
4.18 The overall calibration tables are calculated for each fifteen minutes with the count / flow per time
segment being factored by 4 to represent an effectively hourly rate.
4.19 The locations where the GEH is greater than 5 are the left turn from the A19 North to A689 East at
the main Wolviston junction, and the right turn from the A19 North to A689 West at the A1185
Wolviston Road roundabout.
4.20 This is explained by the ‘route choice’ that exists to go from the A19 to the Services / Coal Lane
that exist between Wolviston interchange and A1185 Wolviston Roundabout.
4.21 Inspection of the turning counts also revealed that some drivers must have either came off the A19
early (to head towards Sedgefield), or off the A19 late (to head towards the East) which cannot be
realistically represented in VISSIM given the considerable difference in cost between the path
options.

Page Job No Report No Issue no Report Name
10 V211111 V211111-001 1 A19 A689 Vissim Model Update
5 Base Model Validation
Overview
5.1 Validation is defined as the qualitative comparison of data produced by the network model with
data not used as a constraint in the model calibration or in the direct estimation of accuracy of the
model data. The principle behind it is to check that the calibration is valid and to assess the quality
of the information provided by the model.
5.2 A19 modelled link traffic flows were validated against flows taken from the TRADS website.
5.3 Modelled performance was also compared against journey times for the A689. These journey times
were undertaken in June 2009 and are not directly comparable to the prevailing times.
5.4 The TRADS locations (numbered 1, 2 and 3) and the journey time routes (shown in blue and red)
used in the validation process can be seen below in Figure 5.1. Only sites at location 1 had data
available for 2013 at time of reporting.
Figure 5.1 – TRADS and journey time validation
5.5 Error messages output from Vissim were also been reviewed to ensure that all vehicles are
capable of entering the network and are not erroneously removed or hindered by unrepresentative
congestion.
Validation Results
5.6 Table 5.1 below details the comparisons and associated results between the observed and
modelled data for the morning peak, where the required DMRB assessment criteria is:

Job No Report No Issue no Report Name Page
V211111 V211111-001 1 A19 A689 Vissim Model Update 11
A difference of less than 15%; or
An absolute difference of less than 60 seconds (for values outside 15%).
Table 5.1 TRADS Data Model Validation – Morning Peak
TRADS Location
07.00-08.00
TRADS Flows
08.00-09.00
TRADS Flows
07.00-08.00
Modelled Flows
08.00-09.00
Modelled Flows
07.00-08.00
GEH
08.00-09.00
GEH
A19 northbound before junction with A689
3115 3096 2759 3297 6.56 3.55
A19 southbound before junction with A689
3481 3287 3395 3521 1.46 4.02
Validation 75%
5.7 Table 5.2 below details the equivalent comparisons and associated results between the observed
and modelled data for the evening peak.
Table 5.2 TRADS Data Model Validation – Evening Peak
TRADS Location
16.00-17.00
TRADS Flows
17.00-18.00
TRADS Flows
16.00-17.00
Modelled Flows
17.00-18.00
Modelled Flows
16.00-17.00
GEH
17.00-18.00
GEH
A19 northbound before junction with A689
3944 3652 3479 3568 7.63 1.39
A19 southbound before junction with A689
3099 2907 2887 3016 3.88 2.01
Validation 75%
5.8 The independent flow validation data correlates well with the observed flow, with the main issue
being northbound in hour 1 of both time periods. This is rectified by hour 2 and crucially the model
validates across the sum of both hours.
5.9 The table below provides a comparison of the journey time results for the Observed (June 2009)
data, 2009 modelled and 2013 modelled data for the morning peak. Based on the above
assessments, the 2009 morning peak base Vissim model achieves a 100% level of validation
against TRADS flows and observed (averaged) journey times.
Table 5.3 Journey Time Model Validation – Morning Peak
Journey time route 07.00- 08.00- 07.00- 08.00- 07.00- 08.00-

Page Job No Report No Issue no Report Name
12 V211111 V211111-001 1 A19 A689 Vissim Model Update
08.00
Observed journey times (mins)
09.00
Observed journey times (mins)
08.00
Modelled journey times (mins)
09.00
Modelled journey times (mins)
08.00
DMRB Check
09.00
DMRB Check
South of A19/A689 interchange to the A689/the Wynd roundabout
2.52 2.50 3.08 3.12 Yes Yes
A689/the Wynd roundabout to North of A19/A689 interchange
3.46 4.27 2.57 4.04 Yes ( <60 seconds)
Yes
Journey time route
07.00-08.00
2009 Modelled journey times (mins)
08.00-09.00
2009 Modelled journey times (mins)
07.00-08.00
Modelled journey times (mins)
08.00-09.00
Modelled journey times (mins)
07.00-08.00
DMRB Check
08.00-09.00
DMRB Check
South of A19/A689 interchange to the A689/the Wynd roundabout
3.05 3.10 3.08 3.12 Yes Yes
A689/the Wynd roundabout to North of A19/A689 interchange
3.34 4.01 2.57 4.04 Yes ( <60 seconds)
Yes
Validation 100%
5.10 The table below provides a comparison of the journey time results for the Observed data and the
2013 modelled data for the evening peak.
Table 5.4 Journey Time Model Validation – Evening Peak
Journey time route
16.00-17.00
Observed journey times (mins)
17.00-18.00
Observed journey times (mins)
16.00-17.00
Modelled journey times (mins)
17.00-18.00
Modelled journey times (mins)
16.00-17.00
DMRB Check
17.00-18.00
DMRB Check
South of A19/A689 interchange to the A689/the Wynd roundabout
3.46 4.27 3.14 3.16 Yes No
A689/the Wynd roundabout to North of A19/A689 interchange
3.17 3.17 3.25 2.48 Yes Yes ( <60 seconds)
Validation 75%
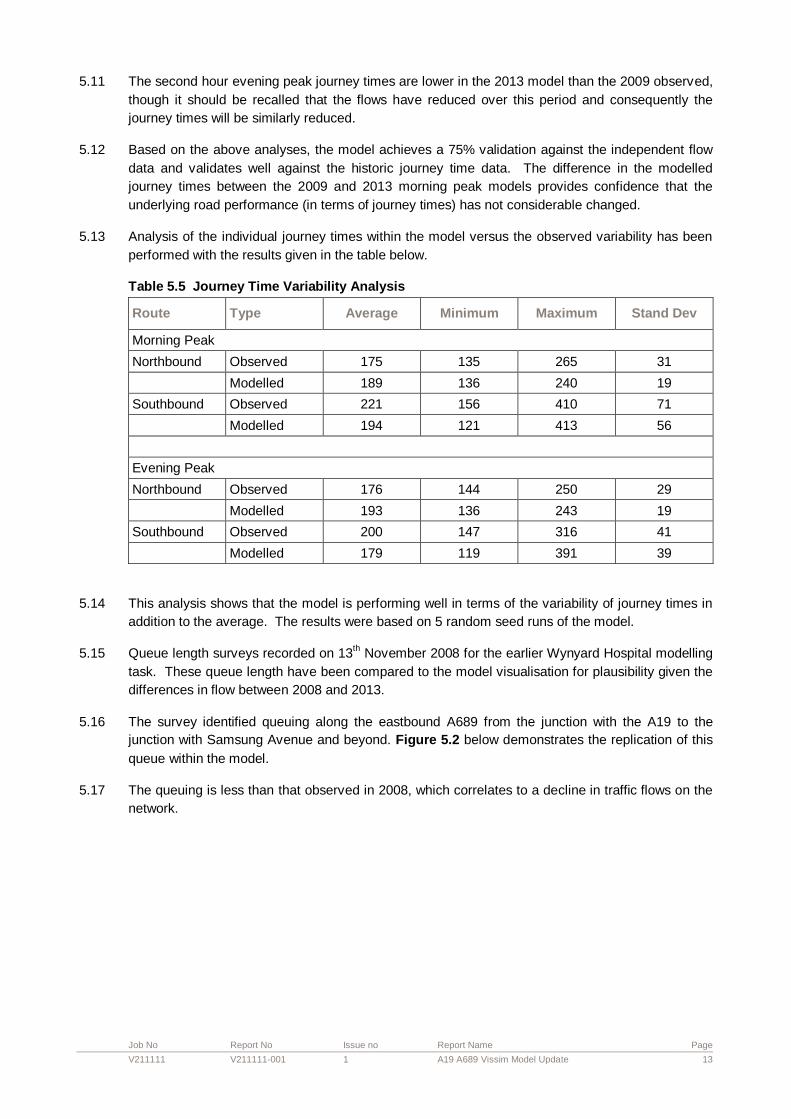
Job No Report No Issue no Report Name Page
V211111 V211111-001 1 A19 A689 Vissim Model Update 13
5.11 The second hour evening peak journey times are lower in the 2013 model than the 2009 observed,
though it should be recalled that the flows have reduced over this period and consequently the
journey times will be similarly reduced.
5.12 Based on the above analyses, the model achieves a 75% validation against the independent flow
data and validates well against the historic journey time data. The difference in the modelled
journey times between the 2009 and 2013 morning peak models provides confidence that the
underlying road performance (in terms of journey times) has not considerable changed.
5.13 Analysis of the individual journey times within the model versus the observed variability has been
performed with the results given in the table below.
Table 5.5 Journey Time Variability Analysis
Route Type Average Minimum Maximum Stand Dev
Morning Peak
Northbound Observed 175 135 265 31
Modelled 189 136 240 19
Southbound Observed 221 156 410 71
Modelled 194 121 413 56
Evening Peak
Northbound Observed 176 144 250 29
Modelled 193 136 243 19
Southbound Observed 200 147 316 41
Modelled 179 119 391 39
5.14 This analysis shows that the model is performing well in terms of the variability of journey times in
addition to the average. The results were based on 5 random seed runs of the model.
5.15 Queue length surveys recorded on 13th November 2008 for the earlier Wynyard Hospital modelling
task. These queue length have been compared to the model visualisation for plausibility given the
differences in flow between 2008 and 2013.
5.16 The survey identified queuing along the eastbound A689 from the junction with the A19 to the
junction with Samsung Avenue and beyond. Figure 5.2 below demonstrates the replication of this
queue within the model.
5.17 The queuing is less than that observed in 2008, which correlates to a decline in traffic flows on the
network.

Page Job No Report No Issue no Report Name
14 V211111 V211111-001 1 A19 A689 Vissim Model Update
Figure 5.2 – A689 eastbound modelled queue
Job No Report No Issue no Report Name Page
V211111 V211111-001 1 A19 A689 Vissim Model Update 15
6 Summary
6.1 The aim of this exercise was to produce a fully calibrated and validated (to DMRB standards) base
year Vissim model of the A19 / A689 study area network.
6.2 Results of the calibration exercise show that the model compares favourably against observed
turning counts in both the morning and evening peak hours, and peak periods.
6.3 The validation of the model against further independent data demonstrates that the model again
compares well against the observed link flows and journey times.
6.4 It is therefore considered that this Vissim model is fit for the purpose of model forecasting.

Page Job No Report No Issue no Report Name
A16 V211111 V211111-001 1 A19 A689 Vissim Model Update
Appendix A
Calibration Spreadsheets

5.2 2.8 2.6 0.4
0.0 0.0 2.0 0.8 2.0 1.3 0.2 1.5 0.2 7.5 0.4 2.6 5.2 U
0.7
2.0 2.1 1.2 0.7 4.3 1.6 0.2
0.4 0.0 0.0 1.5 3.9 3.6 1.1
0.1 1.4 0.9 2.1
2.0 0.1 0.6 0.9 0.2 1.5
0.7 0.4 0.3 0.0 0.1 1.9
0.1 0.0 0.1 0.3 0.1 1.9 0.1 0.5 0.6 0.8 1.9 0.1 0.3 0.6 1.1
U 0.5 0.6
3.5
Client: Project: Title:Highways Agency V211111 A19 A689 VISSIM Model Update AM GEH Appendix A
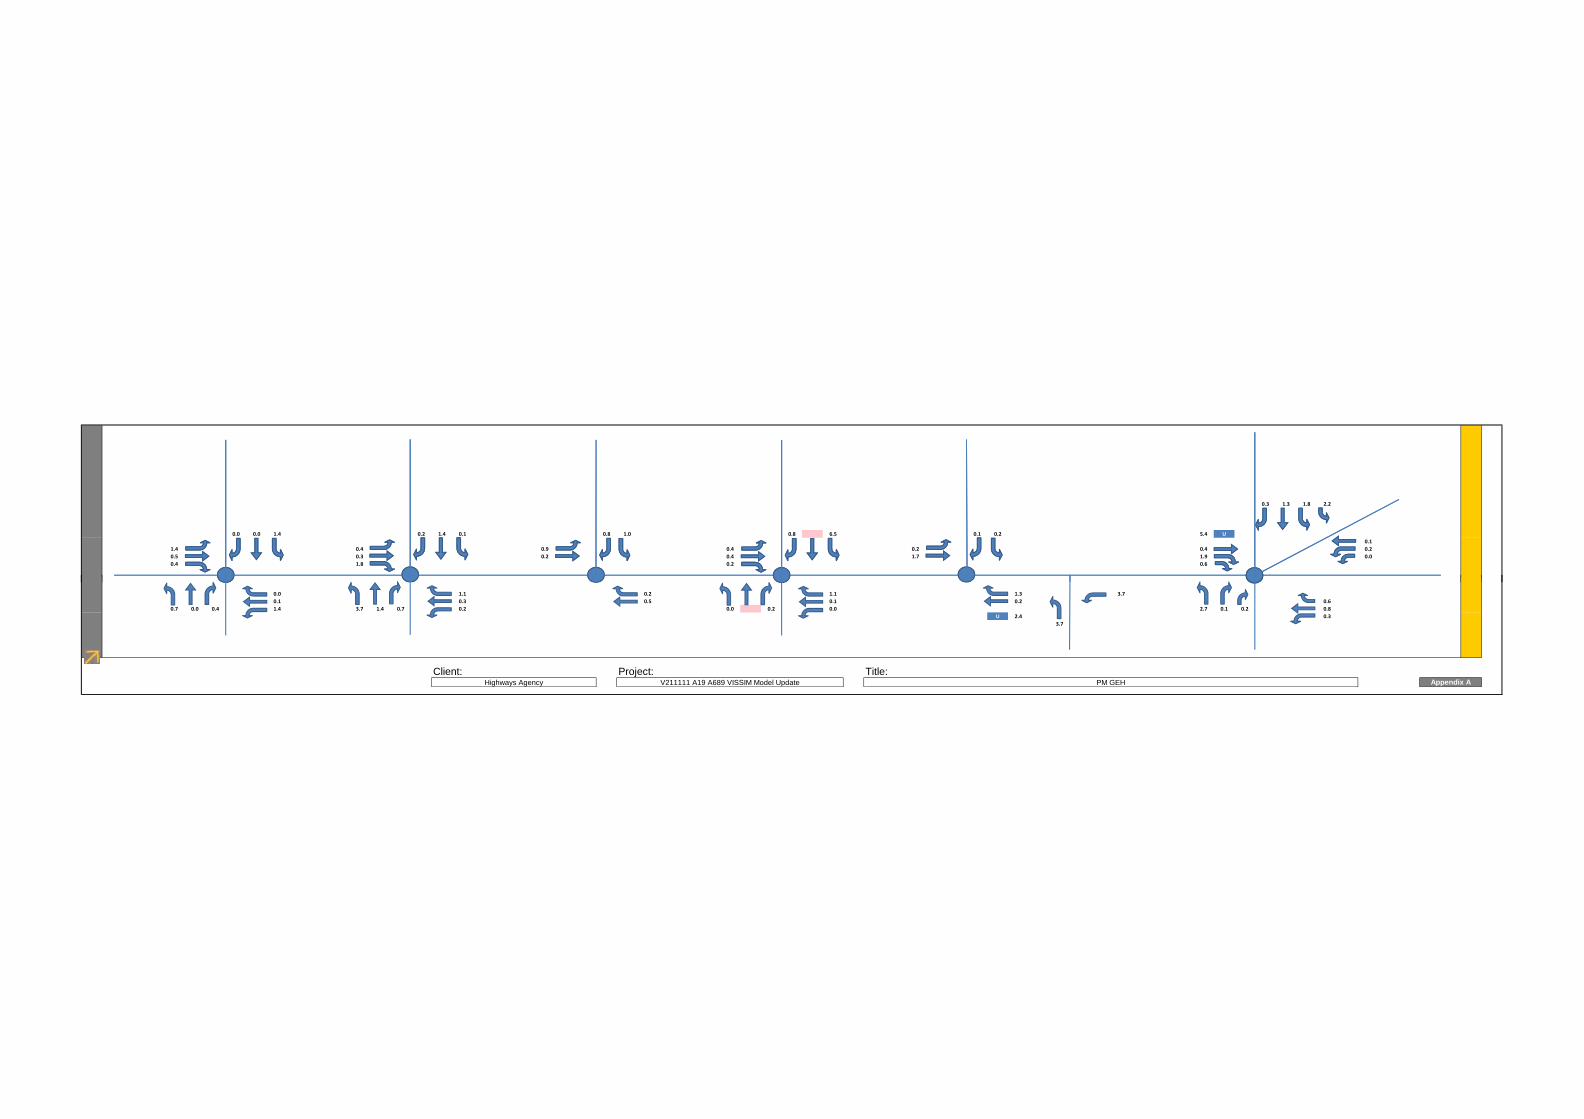
0.3 1.3 1.8 2.2
0.0 0.0 1.4 0.2 1.4 0.1 0.8 1.0 0.8 6.5 0.1 0.2 5.4 U
0.1
1.4 0.4 0.9 0.4 0.2 0.4 0.2
0.5 0.3 0.2 0.4 1.7 1.9 0.0
0.4 1.8 0.2 0.6
0.0 1.1 0.2 1.1 1.3 3.7
0.1 0.3 0.5 0.1 0.2 0.6
0.7 0.0 0.4 1.4 3.7 1.4 0.7 0.2 0.0 0.2 0.0 2.7 0.1 0.2 0.8
U 2.4 0.3
3.7
Client: Project: Title:Highways Agency V211111 A19 A689 VISSIM Model Update PM GEH Appendix A

Appendix I
Wynyard Committed Development Flows
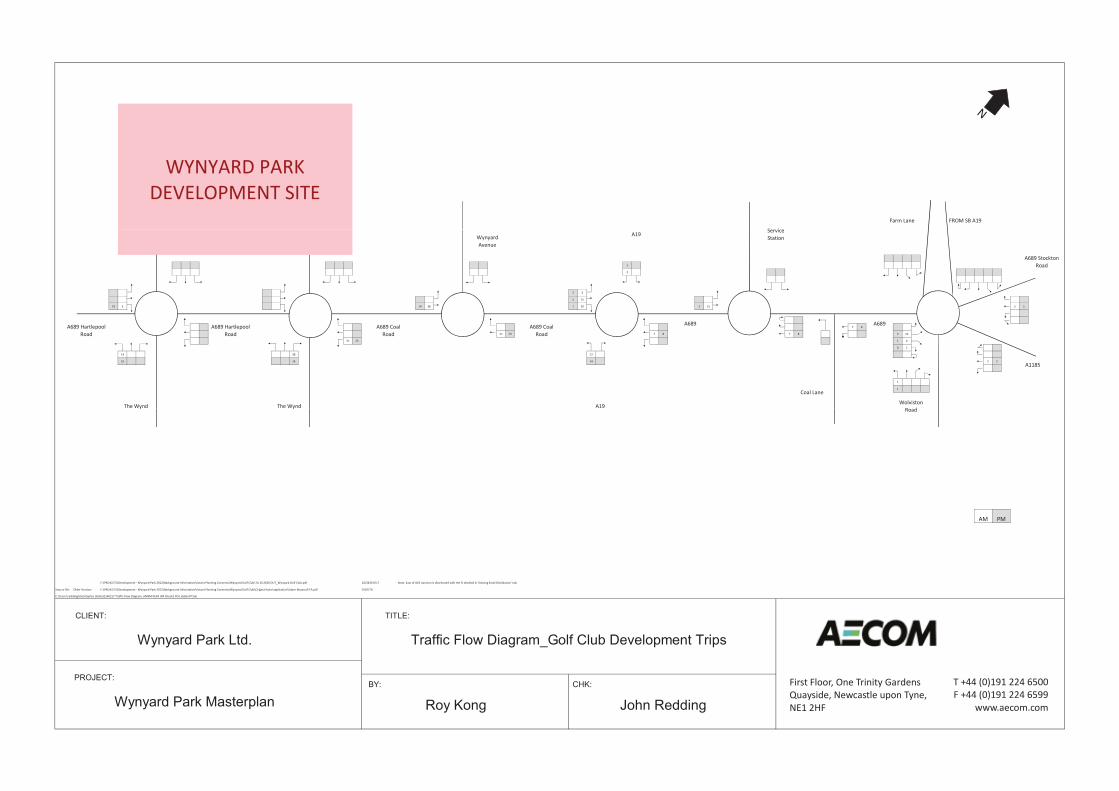
WYNYARD PARKDEVELOPMENT SITE
Farm Lane FROM SB A19
Service
1
2
2 3
5 15
19 3 14 38 7 20 5 15 5 5
7 8
21 23 7 8 7 8 3 10
21 23 1 4
0 1
14 38 12
10 14 14 2 2
1
1
A689 StocktonRoad
A689 HartlepoolRoad
A689 HartlepoolRoad
A689 CoalRoad
A689 CoalRoad
A689 A689
A1185
Coal Lane
The Wynd The Wynd WolvistonR dA19
ServiceStationWynyard
Avenue
A19
F:\PROJECTS\Development - Wynyard Park 2012\Background Information\Extant Planning Consents\Wynyard Golf Club\TA 10 2430 OUT_Wynyard Golf Club.pdf 10/2430 OUT Note: East of A19 Junction is distributed with the % detailed in 'Existing Empl Distribution' tab.
y y Road
AM PM
Source file: Older Version: F:\PROJECTS\Development - Wynyard Park 2012\Background Information\Extant Planning Consents\Wynyard Golf Club\Original hotel application\Faber Maunsell TA.pdf 07/0770
C:\Users\reddingj\Desktop\to delete\[140217 Traffic Flow Diagram_AMPM PEAK JPR Check2 PCU.xls]Golf Club
First Floor, One Trinity GardensQuayside, Newcastle upon Tyne,NE1 2HF
T +44 (0)191 224 6500F +44 (0)191 224 6599
www.aecom.com

Service
WYNYARD PARKDEVELOPMENT SITE
Farm Lane FROM SB A19
-49
-11
22
110 0
0
0 10 88 46 85
6 34 -1 13 16 36
0 -16 -91 82 82 13 34 17 3
25 6
19 25 -6 15 -64 -41 30 7 25 6 9 20
-25 -9 -21 -7 303 67 -5 -1 3 10
1 3
-21 -16 38 294 100 -2 0 0
-6 -5 50 160 -3 -3 7 2
-50 2
-27 0
ServiceStationWynyard
Avenue
A19
A689 StocktonRoad
A689 HartlepoolRoad
A689 HartlepoolRoad
A689 CoalRoad
A689 CoalRoad
A689 A689
A1185
Coal Lane
The Wynd The Wynd WolvistonR dA19
Red HouseSchool
Data Source - e-mail from SAJ (Patrick Wong) dated 15/05/2013 12/0067
y y Road
AM PM
Source file:
C:\Users\reddingj\Desktop\to delete\[140217 Traffic Flow Diagram_AMPM PEAK JPR Check2 PCU.xls]Red House School
First Floor, One Trinity GardensQuayside, Newcastle upon Tyne,NE1 2HF
T +44 (0)191 224 6500F +44 (0)191 224 6599
www.aecom.com
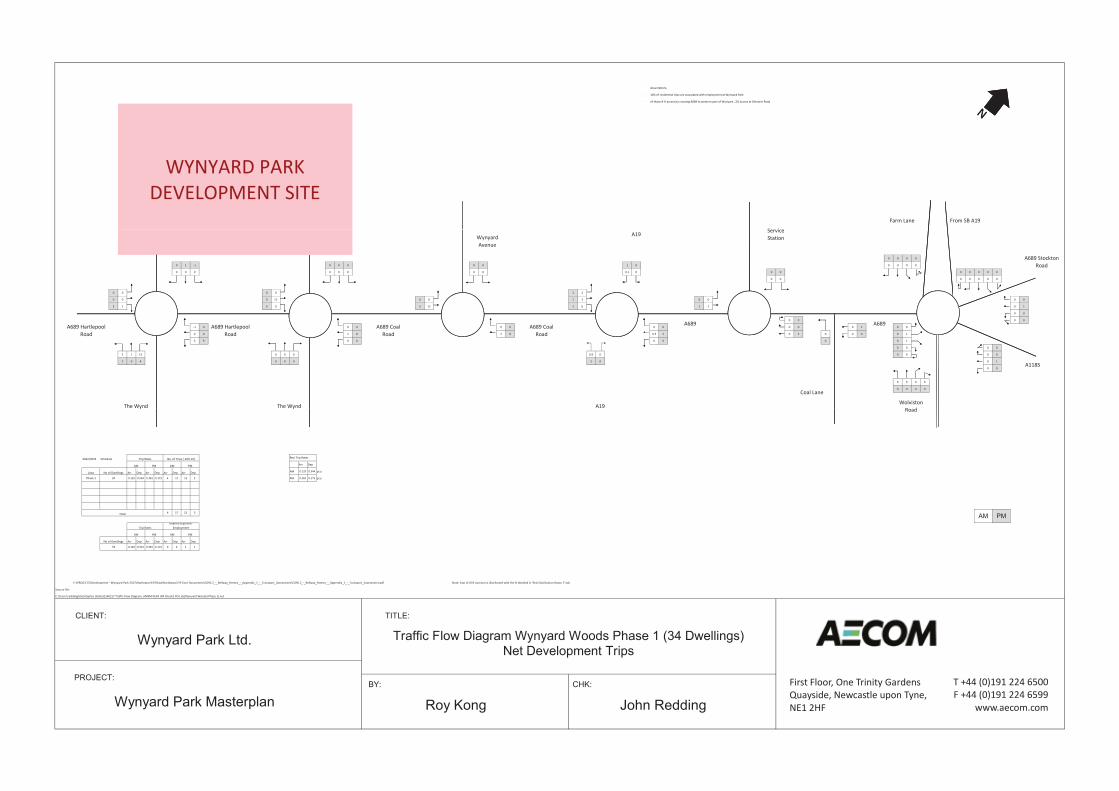
Assumptions
- 10% of residential trips are associated with employment at Wynyard Park
- of those 8 % access by crossing A689 to western part of Wynyard , 2% access at Glenarm Road
WYNYARD PARKDEVELOPMENT SITE
Farm Lane From SB A19
Service
0 0 0 0
0 1 -1 0 0 0 0 0 1 0 0 0 0 0
0 0 0 0 0 0 0 0 0.1 0 0 0 0 0 0 0 0
0 0 0 0 0 0 0
0 0 0 0 1 2
0 0 3 12 0 0 1 3 0 0 0 0
3 1 0 0 3 12 2 6 1 2 0 1
0 0
0 0 0 0
-1 0 0 0 0 0 0 0 0 0 0 2 0 0
0 0 2 8 2 8 0.3 2 0 2 0 0 0 0 1
3 9 0 0 0 0 0 0 1
0 0 0 0
5 1 13 0 0 0 0.9 0 0 0 0 0
2 0 4 0 0 0 5 0 0 1
0 0
0 0 0 0
0 0 0 0
A689 StocktonRoad
A689 HartlepoolRoad
A689 HartlepoolRoad
A689 CoalRoad
A689 CoalRoad
A689 A689
A1185
Coal Lane
The Wynd The Wynd WolvistonR dA19
ServiceStationWynyard
Avenue
A19
2022/2023 Schedule Resi Trip Rates
Arr Dep
Arr Dep Arr Dep Arr Dep Arr Dep AM 0.129 0.544 pcu
0.129 0.544 0.381 0.172 4 17 12 5 PM 0.381 0.172 pcu
4 17 12 5
Arr Dep Arr Dep Arr Dep Arr Dep
0.129 0.544 0.381 0.172 0 2 1 1
F:\PROJECTS\Development - Wynyard Park 2012\Hartlepool EiP\Data\Hartlepool EiP Core Documents\CD95.2_-_Bellway_Homes_-_Appendix_1_-_Transport_Assessment\CD95.2_-_Bellway_Homes_-_Appendix_1_-_Transport_Assessment.pdf Note: East of A19 Junction is distributed with the % detailed in 'Resi Distribution Route 1' tab.
y y Road
Trip Rates No. of Trips (-10% Int)
AM PM AM PM
Area No of Dwellings
Phase 1 34
Total
Trip RatesInternal trips Resi-
Employment
AM PM AM PM
No of Dwellings
34
Source file:
C:\Users\reddingj\Desktop\to delete\[140217 Traffic Flow Diagram_AMPM PEAK JPR Check2 PCU.xls]Wynyard Woods (Phase 1) net
First Floor, One Trinity GardensQuayside, Newcastle upon Tyne,NE1 2HF
T +44 (0)191 224 6500F +44 (0)191 224 6599
www.aecom.com

Assumptions
- 10% of residential trips are associated with employment at Wynyard Park
- of those 8 % access by crossing A689 to western part of Wynyard , 2% access at Glenarm Road
WYNYARD PARKDEVELOPMENT SITE
Farm Lane From SB A19
Service
0 0 0 0
0 2 -2 1 0 -1 1 -1 4 0 0 0 0 0
0 1 -1 0 0 0 0 0 0 0 1 0 0 0 0 0 0
0 1 0 0 0 0 0
0 0 0 1 1 7
0 0 10 35 0 1 2 8 0 1 0 0
10 3 0 0 9 34 5 19 2 7 0 2
0 0
0 0 0 0
-2 -1 -1 0 -1 0 0 0 0 1 1 5 0 0
0 0 6 24 5 23 1 5 1 5 0 0 0 1 3
9 26 0 0 0 0 0 1 4
0 1 0 0
14 3 37 0 0 0 3 0 0 0 0 0
5 1 12 0 0 0 13 0 1 3
0 0
0 0 0 0
1 0 0 0
A689 StocktonRoad
A689 HartlepoolRoad
A689 HartlepoolRoad
A689 CoalRoad
A689 CoalRoad
A689 A689
A1185
Coal Lane
The Wynd The Wynd WolvistonR dA19
ServiceStationWynyard
Avenue
A19
2022/2023 Schedule Resi Trip Rates
Arr Dep
Arr Dep Arr Dep Arr Dep Arr Dep AM 0.129 0.544 pcu
0.129 0.544 0.381 0.172 12 49 34 15 PM 0.381 0.172 pcu
12 49 34 15
Arr Dep Arr Dep Arr Dep Arr Dep
0.129 0.544 0.381 0.172 1 5 4 2
F:\PROJECTS\Development - Wynyard Park 2012\Hartlepool EiP\Data\Hartlepool EiP Core Documents\CD95.2_-_Bellway_Homes_-_Appendix_1_-_Transport_Assessment\CD95.2_-_Bellway_Homes_-_Appendix_1_-_Transport_Assessment.pdf Note: East of A19 Junction is distributed with the % detailed in 'Resi Distribution Route 1' tab.
y y Road
Trip Rates No. of Trips (-10% Int)
AM PM AM PM
Area No of Dwellings
Phase 1 100
Total
Trip RatesInternal trips Resi-
Employment
AM PM AM PM
No of Dwellings
100
Source file:
C:\Users\reddingj\Desktop\to delete\[140217 Traffic Flow Diagram_AMPM PEAK JPR Check2 PCU.xls]Wynyard Woods (Phase 2) net
First Floor, One Trinity GardensQuayside, Newcastle upon Tyne,NE1 2HF
T +44 (0)191 224 6500F +44 (0)191 224 6599
www.aecom.com

Assumptions
- Trip rates based on e-mails from Michael Hoult confirming person trip rates and distribution (10/05/13) and mode share (17/05/13)
- Assumed that 10% of residential trips from SW Sector are to employment opportunities at Wynyard Park thus flows reduced by 10% to avoid double counting as included in employment trips
Service
WYNYARD PARKDEVELOPMENT SITE
Farm Lane From SB A19
23
11
20 10 20 10 20 10
20 10 83 41 120 70
38 22
26 15 120 70
23 13 23 13 23 13 23 13 120 70 83 41
72 42
17 34
31
63
ServiceStationWynyard
Avenue
A19
A689 StocktonRoad
A689 HartlepoolRoad
A689 HartlepoolRoad
A689 CoalRoad
A689 CoalRoad
A689 A689
A1185
Coal Lane
The Wynd The Wynd WolvistonR dA19
2022/2023 Schedule Resi Trip Rates
Arr Dep
Area No of Dwellings Arr Dep Arr Dep Arr Dep Arr Dep AM 0.270 0.629 veh
SW Extension 720 0.270 0.629 0.552 0.367 194 453 398 264 PM 0.552 0.367 veh
194 453 398 264
F:\PROJECTS\Development - Wynyard Park 2012\Hartlepool EiP\Data\Hartlepool EiP Core Documents\CD95.2_-_Bellway_Homes_-_Appendix_1_-_Transport_Assessment\CD95.2_-_Bellway_Homes_-_Appendix_1_-_Transport_Assessment.pdf Note: East of A19 Junction is distributed with the % detailed in 'Resi Distribution Route 1' tab.
Trip Rates No. of Trips (-10% Int)
AM PM
y y Road
AM PM
Total
Source file:
C:\Users\reddingj\Desktop\to delete\[140217 Traffic Flow Diagram_AMPM PEAK JPR Check2 PCU.xls]Hartlepool SW Extension 2023
First Floor, One Trinity GardensQuayside, Newcastle upon Tyne,NE1 2HF
T +44 (0)191 224 6500F +44 (0)191 224 6599
www.aecom.com

WYNYARD PARKDEVELOPMENT SITE
Farm Lane From SB A19
Service
0 0 0 0
8 0 20 0 0 -2 2 -2 8 0 0 0 0 0
28 0 71 0 0 -1 1 -1 1 0 1 0 0 0 0 0 0
0 1 0 0 0 0 0
20 6 0 0 3 14 0
0 -1 20 70 1 2 4 16 0 0 1 0 0
0 0 0 0 17 68 9 37 0 3 14 1 3
0 0
0 0 0 0
13 49 -2 -1 -2 -1 0 0 0 1 2 11 0 0
0 -1 13 49 10 46 2 11 1 10 0 0 0 1 5
0 0 0 0 0 0 0 2 8
0 2 0 0
0 0 0 0 0 0 5 0 0 0 0 0
0 0 0 0 0 0 27 0 1 6
0 0
0 0 0 0
1 0 0 0
A689 StocktonRoad
A689 HartlepoolRoad
A689 HartlepoolRoad
A689 CoalRoad
A689 CoalRoad
A689 A689
A1185
Coal Lane
The Wynd The Wynd WolvistonRoadA19
ServiceStationWynyard
Avenue
A19
2022/2023 Schedule Resi Trip Rates
Arr Dep
Arr Dep Arr Dep Arr Dep Arr Dep AM 0.129 0.544 pcu
0.129 0.544 0.381 0.172 19 79 55 25 PM 0.381 0.172 pcu
0.129 0.544 0.381 0.172 1 4 3 1 note takes 0.9 x full tripgen
0.129 0.544 0.381 0.172 3 15 10 5
23 98 69 31
Arr Dep Arr Dep Arr Dep Arr Dep
0.129 0.544 0.381 0.172 3 11 8 3
-3 -11 -8 -3
ASSUMES 10% TOTAL TRIPS RESI TO WYNYARD 5% W3, 2.5% W2, 2.5% W1
Road
Trip Rates No. of Trips (-10% Int)
AM PM AM PM
Area No of Dwellings
A 161
X 9
Y 30
Total
Trip RatesInternal trips Resi-
Employment
AM PM AM PM
No of Dwellings
200
Source file:
C:\Users\reddingj\Desktop\to delete\[140217 Traffic Flow Diagram_AMPM PEAK JPR Check2 PCU.xls]Resi Route 1 TW200
First Floor, One Trinity GardensQuayside, Newcastle upon Tyne,NE1 2HF
T +44 (0)191 224 6500F +44 (0)191 224 6599
www.aecom.com
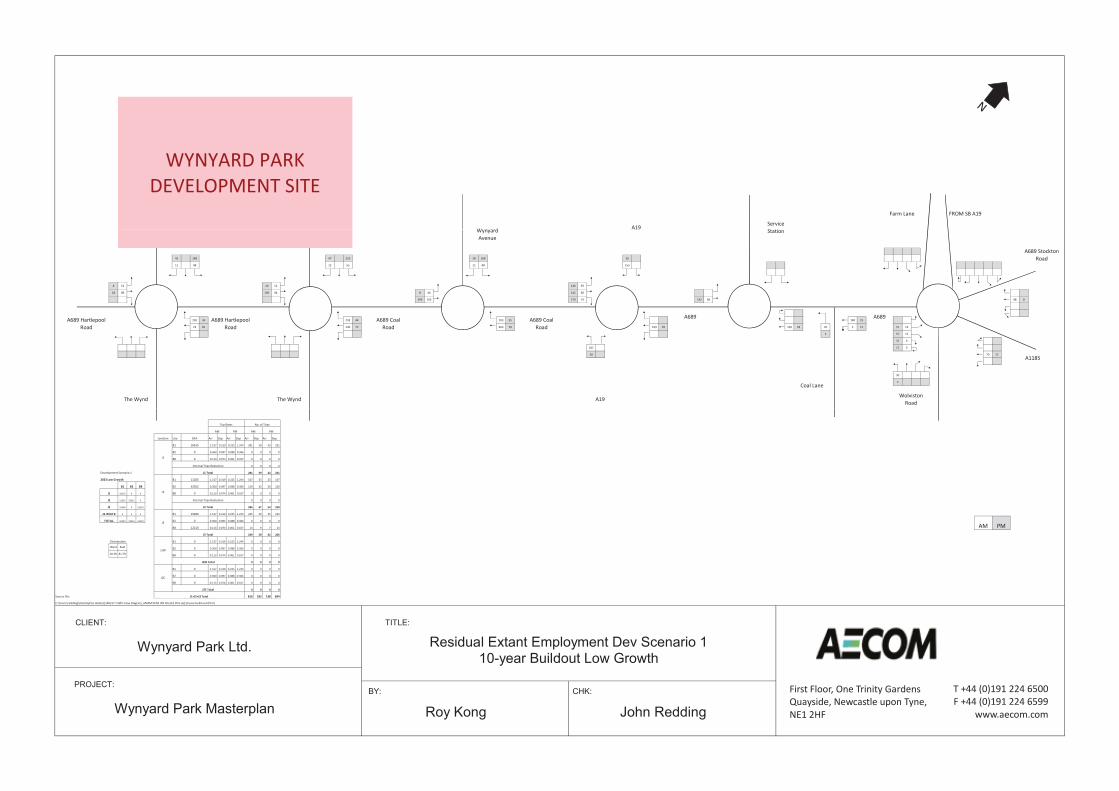
WYNYARD PARKDEVELOPMENT SITE
Farm Lane FROM SB A19
ServiceSt tiWynyard A19
42 188 47 210 38 168 26
11 48 12 55 11 48 155
8 52 10 52 146 39
18 98 196 94 8 46 142 38
399 103 279 74 142 38 48 8
230 34 233 44 203 35 148 25
23 85 240 72 463 78 169 28 169 28 20 3 12 51 14
3 57 15
22 6
342 12 3
58 70 12
30
5
A1185
Coal Lane
The Wynd The Wynd WolvistonRoadA19
A689 StocktonRoad
A689 HartlepoolRoad
A689 HartlepoolRoad
A689 CoalRoad
A689 CoalRoad
A689 A689
StationWynyardAvenue
Use Arr Dep Arr Dep Arr Dep Arr Dep
B1 1.517 0.319 0.225 1.244 281 59 42 231
B2 0.360 0.097 0.088 0.366 0 0 0 0
B8 0.113 0.074 0.061 0.107 0 0 0 0
0 0 0 0
Development Scenario 1 281 59 42 231
2023 Low Growth B1 1.517 0.319 0.225 1.244 167 35 25 137
B1 B2 B8 B2 0.360 0.097 0.088 0.366 119 32 29 120
18535 0 0 B8 0.113 0.074 0.061 0.107 0 0 0 0
11025 32922 0 0 0 0 0
15480 0 12210 286 67 54 258
0 0 0 B1 1.517 0.319 0.225 1.244 235 49 35 193
45040 32922 12210 B2 0.360 0.097 0.088 0.366 0 0 0 0
B8 0.113 0.074 0.061 0.107 14 9 7 13
249 58 42 206
B1 1.517 0.319 0.225 1.244 0 0 0 0
West East B2 0.360 0.097 0.088 0.366 0 0 0 0
18.3% 81.7% B8 0.113 0.074 0.061 0.107 0 0 0 0
0 0 0 0
B1 1.517 0.319 0.225 1.244 0 0 0 0
B2 0.360 0.097 0.088 0.366 0 0 0 0
B8 0.113 0.074 0.061 0.107 0 0 0 0
J3 Total
32922
Junction
J1
J2
J3
J1W
J2E
J1W Total
J1
J3
J1 W/J2 E 15480
0
12210
TOTAL
PM AM PM
J2 Total
18535
0
0
11025
J1 Total
0
0
0
0
0
0
0Distrubution
AM PM
Internal Trips Reduction
Internal Trips Reduction
J2
GFA
Trip Rates No. of Trips
AM
0 0 0 0
Source file: 816 185 138 694
C:\Users\reddingj\Desktop\to delete\[140217 Traffic Flow Diagram_AMPM PEAK JPR Check2 PCU.xls]10 year build out (PCU)
J1+J2+J3 Total
J2E Total
First Floor, One Trinity GardensQuayside, Newcastle upon Tyne,NE1 2HF
T +44 (0)191 224 6500F +44 (0)191 224 6599
www.aecom.com

Appendix J
Wynyard Mitigation Plans

GREEN SHOWS 3.6M MINIMUM HIGHWAY VERGE
BOX2:8CAU: AT ~181:SOO
BOX 5: IICN..E AT~ IS 1:12:50
NOTES:
BOX 1: THIS SHOWS l1iA T THE 295m VISIBILITY SPLAY REMAINS WITHIN THE ADOPTED HIGHWAY BOUNDARY. TliE RED LINE DOES NOT CROSS THE BLUE LINE.
BOX 2: THJS SHOWS lliAT THE PROPOSED KERBUNE PROVIDES AT LEAST A 3.6M WIDE VERGEONTHEAPPROACH TOTHE
' ROUNDABOUT. THE BLACK LINE DOES NOT CROSS THE GREEN LINE.
DEVELOPMENT PLANNING liMITED Ttl : 07473751305 E'nlll : [email protected]
l'illp'i"-.dev-i*rlnilg.co.uk
NOiih Taee & HBllfepool NHS Fotlldatlcn Truat
@ Development Planning Limited
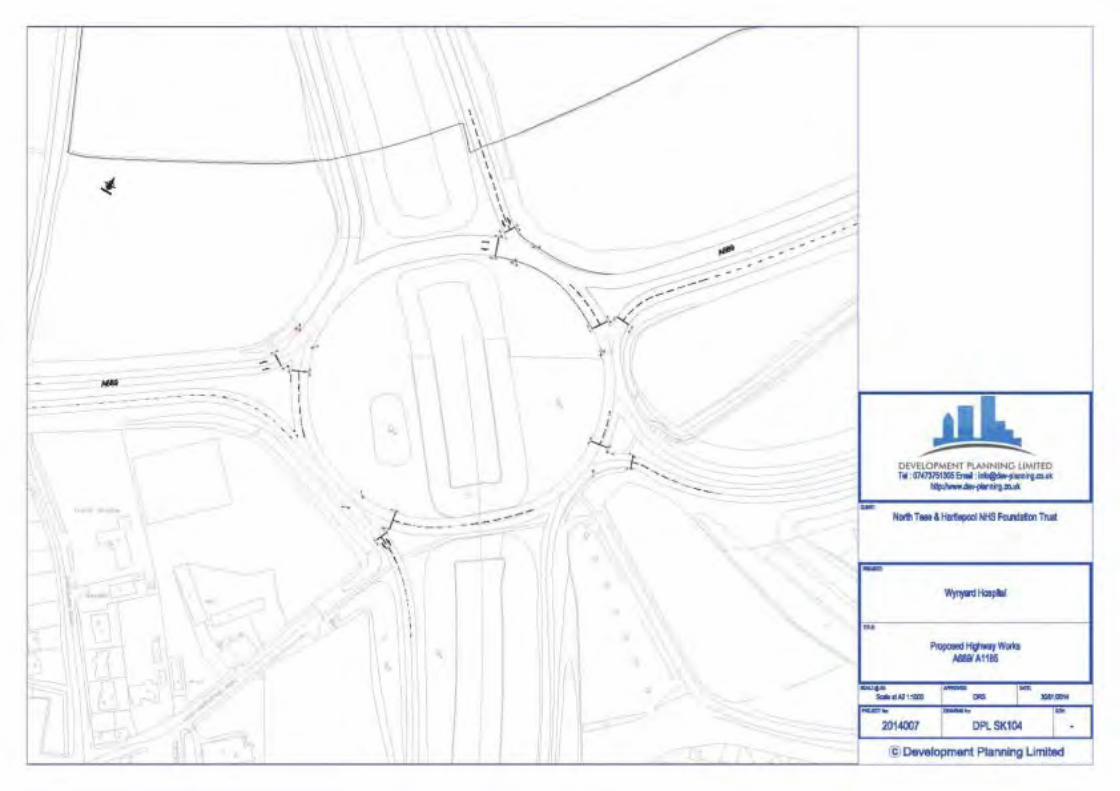
----- ---- ~-=-=--~
\
J, --_:.-, __ •~ ~ - ---- - ---
.6', ' "' ) I \
\
I
13.,
- :~ -==----
DEVELOPMENT PLANNING liMITED Ttl: 074737S1S05 Emil : iota@dll'-planning.m.uk
l'illp'J.'ftw.dllti*rulilg.co.uk
-- ~- ~W..~. ------------------------~ NO!ih Taee & Hartlepool NHS Follldatlcn Trust
.....,
' Wynyrd Hasplal
nne
Proposed H'9TnY WOib ~A1185
~ ... -Si* II A2 1:1000 DRS _ .. _ .. llllt
2014007
@ Development Planning Limited
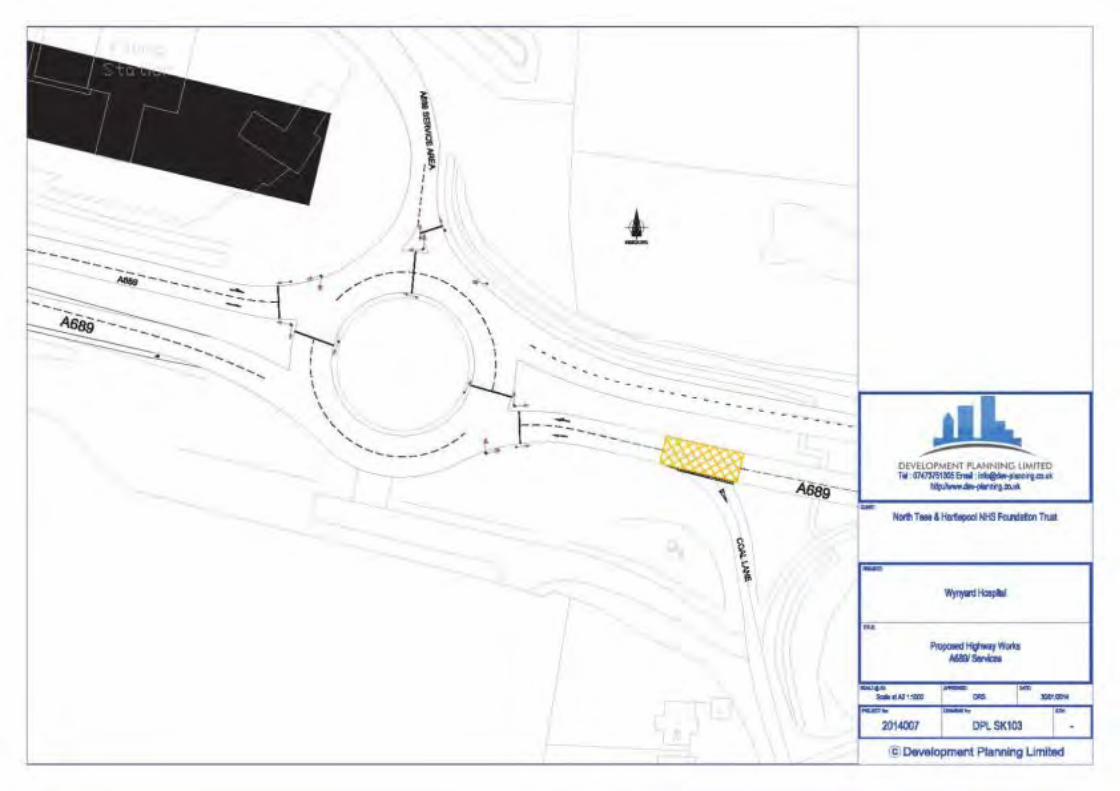
I \ \ \
' ' / ' , ...... / ............. ____ .,.
----
I I ! \
~~r----~- ---------------
I
-. ........ _. __
DEVELOPMENT PLANNING LIMITED Ttl : 07473751005 Emil : illla@dlll'-planning.m.uk
Nip'J.Ww~ilg.=.uk
Wynyrrd Hasplal
@ Development Planning Limited
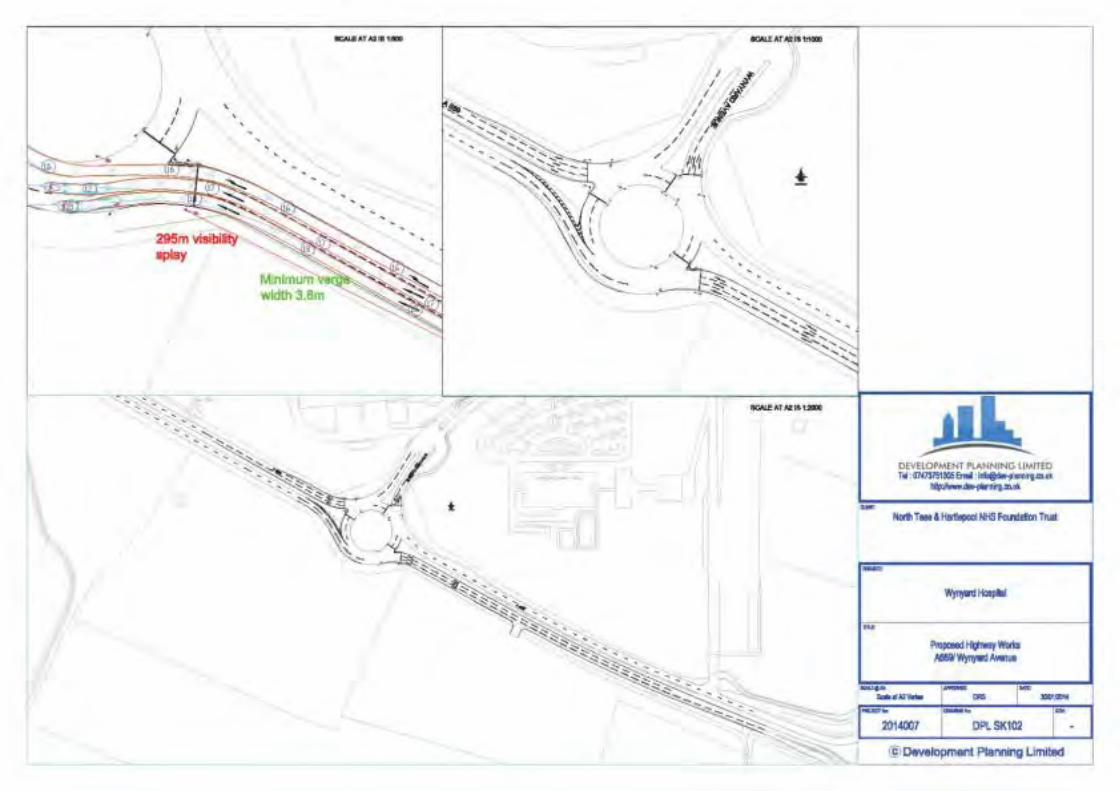
a::AI.EAT A21B 1:1100 8CAI.E AT A21S 1.1000
\
DEVELOPMENT PLANNING liMITED Ttl : 074737S1!Kl5 E'mli : [email protected]
Nip'JI'ftw~ilg.co.ut
NO!Il Taee & HBllfepoal NHS Follldatlcn Truat
@ Development Planning Limited
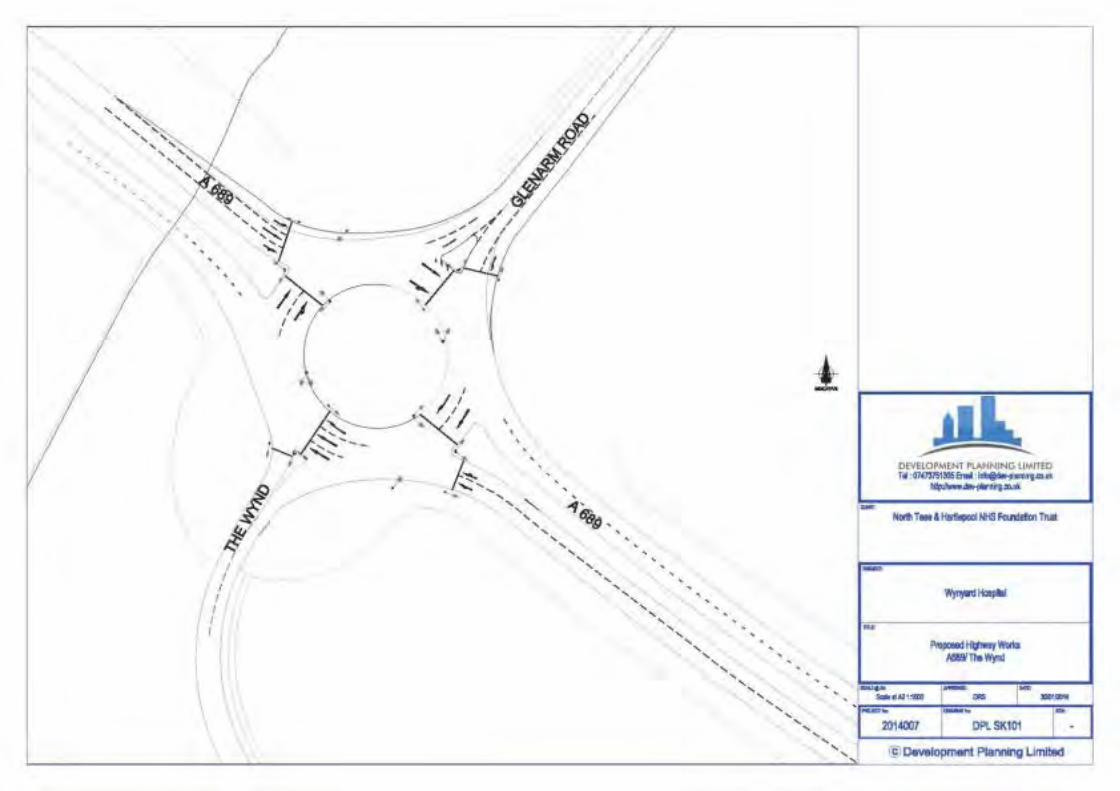
I \ \
~ ~' ~---
/
tf7/ I
//, I I
I , ,
DEVELOPMENT PLANNING liMITED Ttl : 074737S1SD5 E'mri : [email protected]
Nip'~~ilg.co.uk
N4lih Taee & HBlllepool NHS Follldatlcn Trust
DPLSK101
@ Development Planning Limited
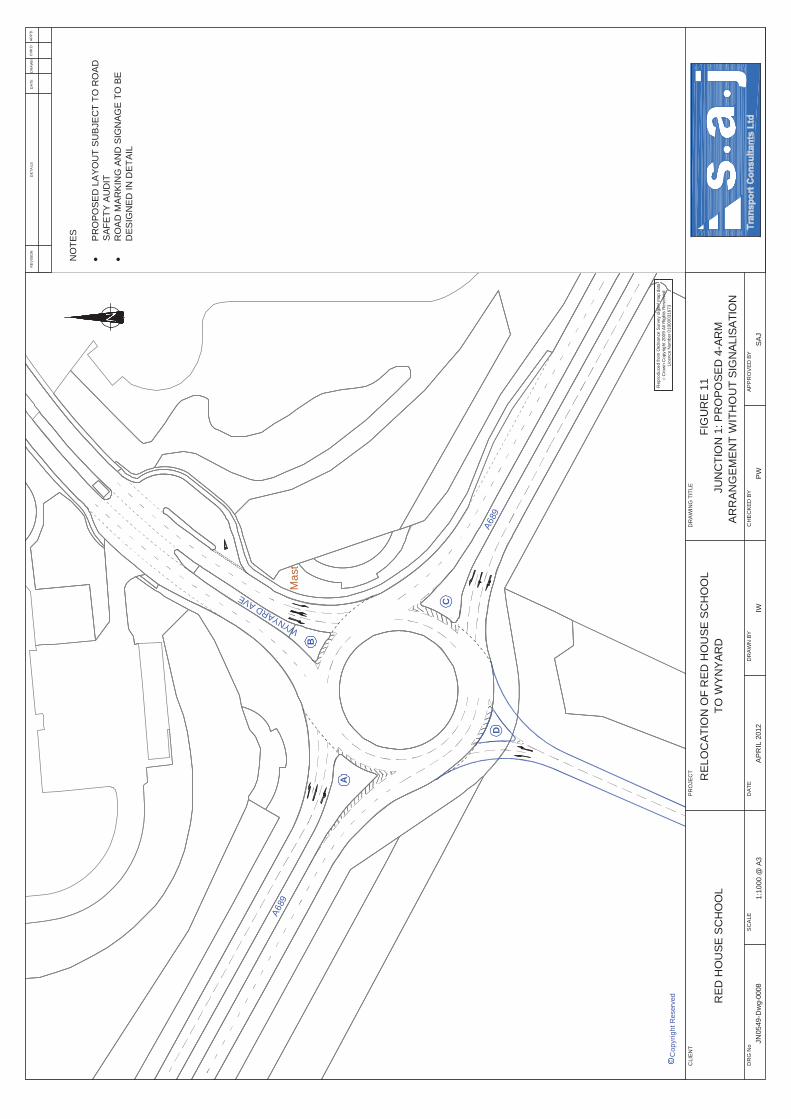
Ma
st
A689
A689
WYNYARD
AVE
A
B
C
D
DR
AW
ND
AT
ED
ET
AIL
SR
EV
ISIO
NC
HK
'DA
PP
'D
cC
op
yri
gh
tR
eserv
ed
Repro
du
ced
from
Ord
nan
ce
Surv
ey
dig
italm
ap
data
Cro
wn
Copyrig
ht200
9A
llR
ights
Re
serv
ed
Lic
ence
Num
ber0
10000
31673
PR
OJE
CT
CLIE
NT
DR
AW
ING
TIT
LE
DR
GN
oS
CA
LE
DA
TE
AP
PR
OV
ED
BY
CH
EC
KE
DB
YD
RA
WN
BY
RE
LO
CA
TIO
NO
FR
ED
HO
US
ES
CH
OO
L
TO
WY
NY
AR
DR
ED
HO
US
ES
CH
OO
L
FIG
UR
E11
JU
NC
TIO
N1:P
RO
PO
SE
D4-A
RM
AR
RA
NG
EM
EN
TW
ITH
OU
TS
IGN
ALIS
AT
ION
JN
05
49
-Dw
g-0
008
1:1
00
0@
A3
AP
RIL
2012
IWP
WS
AJ
NO
TE
S
PR
OP
OS
ED
LA
YO
UT
SU
BJE
CT
TO
RO
AD
SA
FE
TY
AU
DIT
RO
AD
MA
RK
ING
AN
DS
IGN
AG
ET
OB
E
DE
SIG
NE
DIN
DE
TA
IL
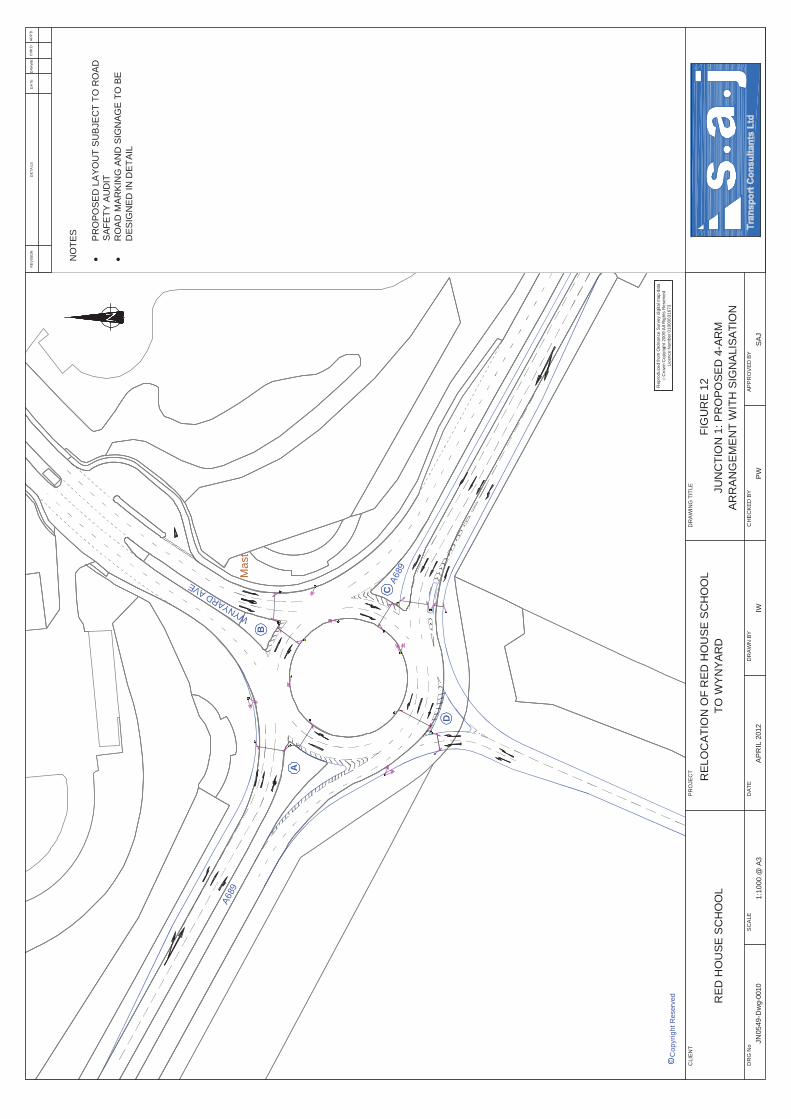
Ma
st
A689
A689
WYNYARD
AVE
A
B
C
D
DR
AW
ND
AT
ED
ET
AIL
SR
EV
ISIO
NC
HK
'DA
PP
'D
cC
op
yri
gh
tR
eserv
ed
Repro
du
ced
from
Ord
nan
ce
Surv
ey
dig
italm
ap
data
Cro
wn
Copyrig
ht200
9A
llR
ights
Re
serv
ed
Lic
ence
Num
ber0
10000
31673
PR
OJE
CT
CLIE
NT
DR
AW
ING
TIT
LE
DR
GN
oS
CA
LE
DA
TE
AP
PR
OV
ED
BY
CH
EC
KE
DB
YD
RA
WN
BY
RE
LO
CA
TIO
NO
FR
ED
HO
US
ES
CH
OO
L
TO
WY
NY
AR
DR
ED
HO
US
ES
CH
OO
L
FIG
UR
E12
JU
NC
TIO
N1:P
RO
PO
SE
D4-A
RM
AR
RA
NG
EM
EN
TW
ITH
SIG
NA
LIS
AT
ION
JN
05
49
-Dw
g-0
010
1:1
00
0@
A3
AP
RIL
2012
IWP
WS
AJ
NO
TE
S
PR
OP
OS
ED
LA
YO
UT
SU
BJE
CT
TO
RO
AD
SA
FE
TY
AU
DIT
RO
AD
MA
RK
ING
AN
DS
IGN
AG
ET
OB
E
DE
SIG
NE
DIN
DE
TA
IL
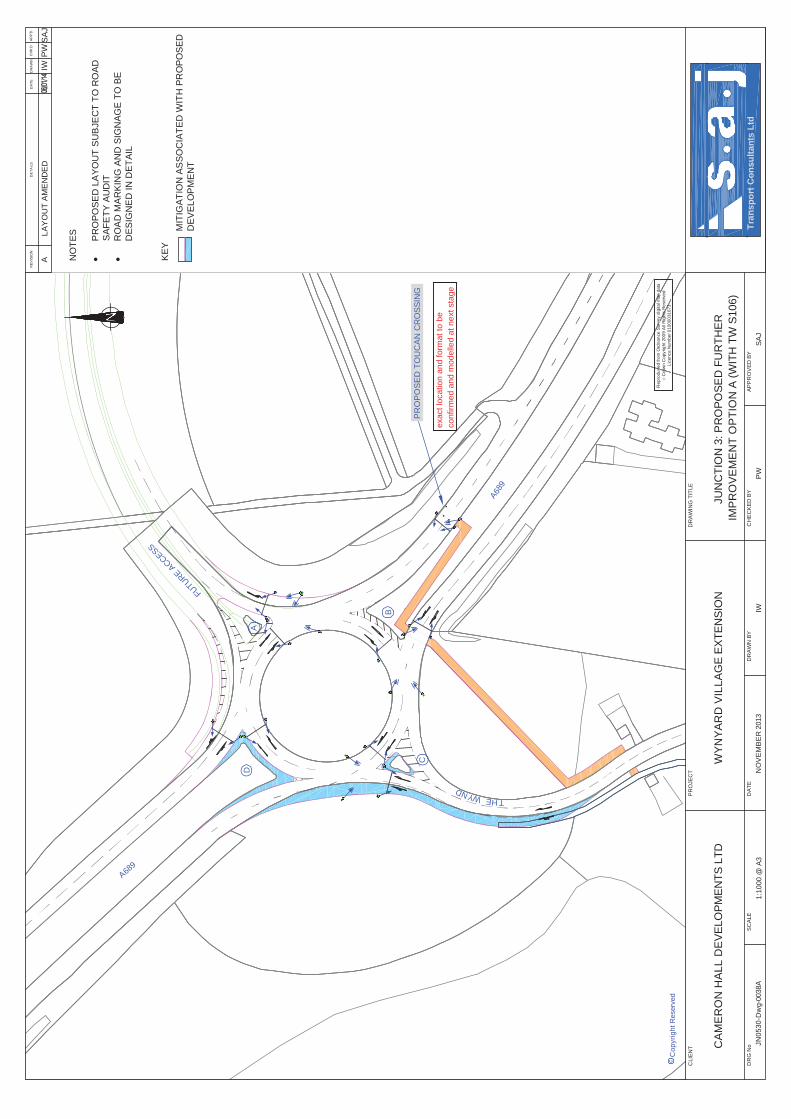
A689
A689
THEWYND
A
B
C
D
FUTUREACCESS
PR
OP
OS
ED
TO
UC
AN
CR
OS
SIN
G
DR
AW
ND
AT
ED
ET
AIL
SR
EV
ISIO
NC
HK
'DA
PP
'D
cC
op
yrig
htR
eser
ved
Rep
rodu
ced
from
Ord
nan
ceS
urve
ydi
gita
lmap
data
Cro
wn
Cop
yrig
ht20
09
All
Rig
hts
Re
serv
edL
icen
ceN
umbe
r010
000
3167
3
PR
OJE
CT
CLI
EN
TD
RA
WIN
GT
ITLE
DR
GN
oS
CA
LED
AT
EA
PP
RO
VE
DB
YC
HE
CK
ED
BY
DR
AW
NB
YT
ran
sp
ort
Co
nsu
ltan
tsL
td
WY
NY
AR
DV
ILL
AG
EE
XT
EN
SIO
NC
AM
ER
ON
HA
LL
DE
VE
LOP
ME
NT
SLT
DJU
NC
TIO
N3:
PR
OP
OS
ED
FU
RT
HE
RIM
PR
OV
EM
EN
TO
PT
ION
A(W
ITH
TW
S10
6)
JN0
53
0-D
wg-
0038
A1
:10
00
@A
3N
OV
EM
BE
R20
13IW
PW
SA
J
NO
TE
S
PR
OP
OS
ED
LAY
OU
TS
UB
JEC
TT
OR
OA
DS
AF
ET
YA
UD
ITR
OA
DM
AR
KIN
GA
ND
SIG
NA
GE
TO
BE
DE
SIG
NE
DIN
DE
TA
IL
MIT
IGA
TIO
NA
SS
OC
IAT
ED
WIT
HP
RO
PO
SE
DD
EV
EL
OP
ME
NT
KE
Y
AL
AY
OU
TA
ME
ND
ED
IWP
WS
AJ
exac
t loc
atio
n an
d fo
rmat
to b
e co
nfirm
ed a
nd m
odel
led
at n
ext s
tage

A
B
C
D
HANZARD DRIV
E
A689
A689
THE WYND
IND
ICA
TIV
E
NO
TE
S
Clie
nt:
Rev
:
ww
w.a
ecom
.com
Fax
: +44
(0)
113
391
689
9T
el: +
44 (
0) 1
13 3
91 6
800
No.
App
'd:
Des
ign:
Chk
'd:
Sca
le:
CA
D:
Dat
e:
Titl
e:
Pro
ject
:
App
'dR
evD
etai
lD
ate
Mad
eC
hk'd
A1
cm
LEE
DS
, LS
11 9
AR
5th
Flo
or, 2
City
Wal
k
"Thi
s do
cum
ent h
as b
een
prep
ared
by
AE
CO
M L
td (
"AL"
) fo
r th
e so
le u
se o
f our
Clie
nt (
the
"Clie
nt")
and
in a
ccor
danc
e w
ith g
ener
ally
acc
epte
d co
nsul
tanc
y pr
inci
ples
, the
bud
get f
or fe
es a
nd th
e te
rms
of r
efer
ence
agr
eed
betw
een
AL
and
the
Clie
nt. A
nyin
form
atio
n pr
ovid
ed b
y th
ird p
artie
s an
d re
ferr
ed to
her
ein
has
not b
een
chec
ked
or v
erifi
ed b
y A
L, u
nles
s ot
herw
ise
expr
essl
y st
ated
in th
e do
cum
ent.
No
third
par
ty m
ay r
ely
upon
this
doc
umen
t with
out t
he p
rior
and
expr
ess
writ
ten
agre
emen
t of A
L"
DRG Path: F:\PROJECTS\Development - Wynyard Park 2012\Overarching TA\Modelling\LinSig (Nov 2013)\6248512-FM04-REV2.dwg Layout Tab: Layout1 ● User: ALLSOPM Plot time: 11/11/2013 @ 12:41 PM
WY
NY
AR
D P
AR
K L
IMIT
ED
WY
NY
AR
D P
AR
K
JUN
CT
ION
4 P
RO
PO
SE
D
FU
RT
HE
R M
ITIG
AT
ION
MA
LA 1:50
008
/11/
2013
6248
512-
FM
042
MA
JR
-08
/11/
2013
LAF
IRS
T IS
SU
EM
AJR
211
/11/
2013
LAA
ME
ND
ME
NT
S T
O M
AR
KIN
GS
MA
JR

A68
9
A68
9
WYNYARD AVE
A
B
C
D
NO
TE
S
Clie
nt:
Rev
:
ww
w.a
ecom
.com
Fax
: +44
(0)
113
391
689
9T
el: +
44 (
0) 1
13 3
91 6
800
No.
App
'd:
Des
ign:
Chk
'd:
Sca
le:
CA
D:
Dat
e:
Titl
e:
Pro
ject
:
App
'dR
evD
etai
lD
ate
Mad
eC
hk'd
A1
cm
LEE
DS
, LS
11 9
AR
5th
Flo
or, 2
City
Wal
k
"Thi
s do
cum
ent h
as b
een
prep
ared
by
AE
CO
M L
td (
"AL"
) fo
r th
e so
le u
se o
f our
Clie
nt (
the
"Clie
nt")
and
in a
ccor
danc
e w
ith g
ener
ally
acc
epte
d co
nsul
tanc
y pr
inci
ples
, the
bud
get f
or fe
es a
nd th
e te
rms
of r
efer
ence
agr
eed
betw
een
AL
and
the
Clie
nt. A
nyin
form
atio
n pr
ovid
ed b
y th
ird p
artie
s an
d re
ferr
ed to
her
ein
has
not b
een
chec
ked
or v
erifi
ed b
y A
L, u
nles
s ot
herw
ise
expr
essl
y st
ated
in th
e do
cum
ent.
No
third
par
ty m
ay r
ely
upon
this
doc
umen
t with
out t
he p
rior
and
expr
ess
writ
ten
agre
emen
t of A
L"
DRG Path: F:\PROJECTS\Development - Wynyard Park 2012\Overarching TA\Modelling\LinSig (Nov 2013)\6248512-FM05-REV2.dwg Layout Tab: Layout1 ● User: ALLSOPM Plot time: 11/11/2013 @ 12:42 PM
WY
NY
AR
D P
AR
K L
IMIT
ED
WY
NY
AR
D P
AR
K
JUN
CT
ION
5 P
RO
PO
SE
D
FU
RT
HE
R M
ITIG
AT
ION
MA
LA 1:50
008
/11/
2013
6248
512-
FM
052
MA
JR
IND
ICA
TIV
E
-08
/11/
2013
LAF
IRS
T IS
SU
EM
AJR
211
/11/
2013
LALA
NE
ALL
OC
AT
ION
AM
EN
DM
EN
TM
AJR