Re˜ning the fatigue assessment procedure of existing steel ...645375/FULLTEXT01.pdf · A...
68
KTH Architecture and the Built Environment Refining the fatigue assessment procedure of existing steel bridges JOHN LEANDER Doctoral Thesis in Structural Engineering and Bridges Stockholm, Sweden 2013
Transcript of Re˜ning the fatigue assessment procedure of existing steel ...645375/FULLTEXT01.pdf · A...

KTH Architecture andthe Bui l t Environment
Re�ning the fatigue assessmentprocedure of existing steel bridges
J O H N L E A N D E R
Doctoral Thesis inStructural Engineering and Bridges
Stockholm, Sweden 2013


Refining the fatigue assessment procedure ofexisting steel bridges
JOHN LEANDER
Doctoral ThesisStockholm, Sweden 2013

TRITA-BKN. Bulletin 118, 2013ISSN 1103-4270ISRN KTH/BKN/B--118--SE
KTH School of ABESE-100 44 Stockholm
SWEDEN
Akademisk avhandling som med tillstånd av Kungl Tekniska högskolan framläggestill offentlig granskning för avläggande av teknologie doktorsexamen i bro- ochstålbyggnad fredagen den 11 oktober 2013 klockan 10.00 i sal Kol, Kungl Tekniskahögskolan, Brinellvägen 8, Stockholm.
© John Leander, June 2013
Tryck: Universitetsservice US-AB
iii
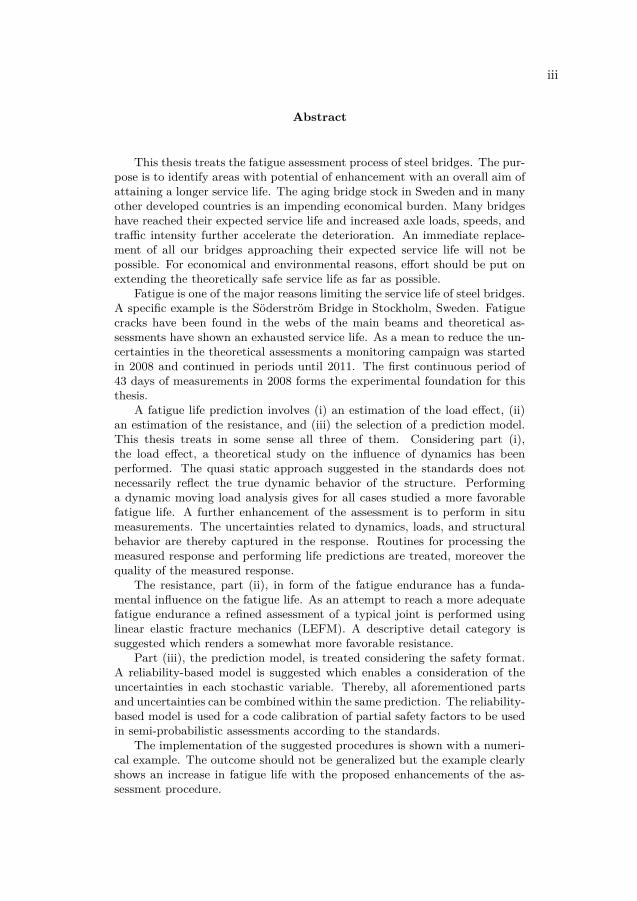
Abstract
This thesis treats the fatigue assessment process of steel bridges. The pur-pose is to identify areas with potential of enhancement with an overall aim ofattaining a longer service life. The aging bridge stock in Sweden and in manyother developed countries is an impending economical burden. Many bridgeshave reached their expected service life and increased axle loads, speeds, andtraffic intensity further accelerate the deterioration. An immediate replace-ment of all our bridges approaching their expected service life will not bepossible. For economical and environmental reasons, effort should be put onextending the theoretically safe service life as far as possible.
Fatigue is one of the major reasons limiting the service life of steel bridges.A specific example is the Söderström Bridge in Stockholm, Sweden. Fatiguecracks have been found in the webs of the main beams and theoretical as-sessments have shown an exhausted service life. As a mean to reduce the un-certainties in the theoretical assessments a monitoring campaign was startedin 2008 and continued in periods until 2011. The first continuous period of43 days of measurements in 2008 forms the experimental foundation for thisthesis.
A fatigue life prediction involves (i) an estimation of the load effect, (ii)an estimation of the resistance, and (iii) the selection of a prediction model.This thesis treats in some sense all three of them. Considering part (i),the load effect, a theoretical study on the influence of dynamics has beenperformed. The quasi static approach suggested in the standards does notnecessarily reflect the true dynamic behavior of the structure. Performinga dynamic moving load analysis gives for all cases studied a more favorablefatigue life. A further enhancement of the assessment is to perform in situmeasurements. The uncertainties related to dynamics, loads, and structuralbehavior are thereby captured in the response. Routines for processing themeasured response and performing life predictions are treated, moreover thequality of the measured response.
The resistance, part (ii), in form of the fatigue endurance has a funda-mental influence on the fatigue life. As an attempt to reach a more adequatefatigue endurance a refined assessment of a typical joint is performed usinglinear elastic fracture mechanics (LEFM). A descriptive detail category issuggested which renders a somewhat more favorable resistance.
Part (iii), the prediction model, is treated considering the safety format.A reliability-based model is suggested which enables a consideration of theuncertainties in each stochastic variable. Thereby, all aforementioned partsand uncertainties can be combined within the same prediction. The reliability-based model is used for a code calibration of partial safety factors to be usedin semi-probabilistic assessments according to the standards.
The implementation of the suggested procedures is shown with a numeri-cal example. The outcome should not be generalized but the example clearlyshows an increase in fatigue life with the proposed enhancements of the as-sessment procedure.

iv
Sammanfattning
Föreliggande avhandling behandlar processen för bärighetsutredning avstålbroar med avseende på utmattning. Syftet är att identifiera delar i be-räkningsprocessen med potential till förbättring, med en längre teoretisk livs-längd som övergripande mål. Det åldrande brobeståndet i Sverige och i andraländer med en utvecklad infrastruktur utgör en annalkande ekonomisk börda.Ett stort antal befintliga broar har nått sin förväntade livslängd och ökandeaxellaster, farter och trafikvolym påskyndar nedbrytningsprocessen. Att ome-delbart ersätta alla broar som nått sin förväntade livslängd är inte möjligt.På grund av ekonomiska och miljömässiga skäl bör resurser läggas på attsäkerställa en förlängd teoretisk livslängd så långt det är möjligt.
Utmattning är en av de viktigaste orsakerna för begränsningar i livsläng-den för stålbroar. Ett specifikt exempel är Bro över Söderström i Stockholm.Utmattningssprickor i huvudbalkarnas liv har upptäckts och teoretiska bärig-hetsberäkningar har påvisat en uttömd utmattningskapacitet. För att minskaosäkerheterna i de teoretiska beräkningarna startades 2008 en mätningskam-panj som periodvis fortgick till och med 2011. Den första kontinuerliga mät-perioden som varade i 43 dygn 2008 utgör det experimentella underlaget fördenna studie.
En utmattningsbedömning baseras på (i) uppskattning av lasteffekten, (ii)bedömning av kapaciteten, samt (iii) valet av en beräkningsmodell. Samtligatre delområden berörs i något avseende i denna avhandling. Med avseende på(i), lasteffekten, har en teoretisk studie av dynamikens inverkan genomförts.Den kvasistatiska metoden som föreslås i gällande föreskrifter återspeglar intenödvändigtvis det verkliga dynamiska verkningssättet. En dynamisk analysmed rörliga laster ger för samtliga studerade fall en längre livslängd. En yt-terligare förbättring av utmattningsbedömningen är att utföra mätningar påbron under verkliga lastförutsättningar. Därigenom fås ett resultat där osäker-heterna gällande dynamik, lastegenskaper och konstruktionens verkningssättär inkluderade. Rutiner för behandling av det uppmätta resultatet och förlivslängdsberäkning presenteras och kvaliteten på det uppmätta resultatetdiskuteras.
Utmattningskapaciteten, delområde (ii), har en avgörande betydelse förlivslängden. En typisk brodetalj har studerats med linjärelastisk brottmeka-nik i ett försök att nå en mer detaljspecifik kapacitet. En geometriberoendeförbandsfaktor föreslås vilken ger en något fördelaktigare kapacitet.
Delområde (iii), beräkningsmodellen, behandlas med avseende på säker-hetsformatet. En tillförlitlighetsbaserad modell föreslås vilken möjliggör attosäkerheten i varje stokastisk variabel kan beaktas. Därigenom kan de tidigarenämnda delområdena och osäkerheterna kombineras i en och samma bärig-hetsbedömning. Tillförlitlighetsmodellen används för kalibrering av partialko-efficienterna i den deterministiska modell som föreslås i gällande föreskrifter.
Implementeringen av de föreslagna åtgärderna förevisas genom ett exem-pel. Resultatet kan inte förväntas vara allmängiltigt men visar på en ökningav livslängden med de föreslagna åtgärderna.

Preface
The research presented in this thesis have been conducted at the Department ofCivil and Architectural Engineering, KTH Royal Institute of Technology. It hasbeen financed by the Swedish Transport Administration (Trafikverket), the KTHRailway Group and the Division of Structural Engineering and Bridges at KTH.
I express my sincere gratitude to my supervisor Professor Raid Karoumi and myassistant supervisor Associate Professor Bert Norlin for the support and construc-tive guidance throughout my studies. I am impressed by your sound knowledgeof the various fields I have come across. I especially thank Professor Karoumi forgiving me the opportunity to immerse myself in my favorite subject. As a formerconsulting bridge engineer, I sincerely appreciate the privilege of deeper studies.
Thanks are also due to friends and colleagues at the Division of Structural Engi-neering and Bridges and the Division of Concrete Structures for help and fruitfuldiscussions. Laboratory technicians Stefan Trillkott and Claes Kullberg deserve aspecial mentioning, they provided the experimental foundation for this study.
I also express my gratitude to my former colleagues Mme Karin Strandberg, Mr.Rune Fredriksson and Dr. Per-Olof Thomasson, for the support and guidanceduring my years as a bridge engineer. I thank especially Dr. Thomasson for awakenmy curiosity about the field of research.
My deepest appreciation goes to my wife Maria and our children Saga, Hugo, andVidar, for giving me a life beyond my profession and filling it with joy and meaning.
v


Publications
This thesis is based on the work presented in the following publications:
Paper I Leander, J., Karoumi, R., 2013. Dynamics of thick bridge beams and itsinfluence on fatigue life predictions. Journal of Constructional Steel Research,89.
Paper II Leander, J., Andersson, A. and Karoumi, R., 2010. Monitoring andenhanced fatigue evaluation of a steel railway bridge. Engineering Structures,32(3).
Paper III Leander, J., Karoumi, R., 2012. Quality assurance of measured re-sponse intended for fatigue life prediction. Journal of Bridge Engineering,17(4).
Paper IV Leander, J., Aygül, M., Norlin, B., 2013. Refined fatigue assessment ofjoints with welded in-plane attachments by LEFM. International Journal ofFatigue, 56.
Paper V Leander, J., Norlin, B., Karoumi, R., 2013. Reliability-based calibrationof fatigue safety factors for existing steel bridges. Submitted to Journal ofBridge Engineering
The planing of the papers, the processing of the monitored data, the major partof the analyses and of the writing has been performed by Leander. Section 3 Pre-vious theoretical studies in Paper II is a summary of the thesis Andersson (2009)and is written by the second co-author. The experimental data presented in Pa-per IV is supplied by the second co-author and is a result of the work presented inAygül (2012). The co-authors have participated in the planning of the work andcontributed to the papers with comments and revisions.
vii

viii PUBLICATIONS
In addition to the publications mentioned above, Leander has contributed to thefollowing publications related to the project:
• Leander, J., 2008. Bro över Söderström, mätning och utvärdering m.a.p.utmattning, in Swedish. TRITA-BKN Report 126. Royal Institute of Tech-nology (KTH). ISSN 1103-4289.
• Leander, J., Andersson, A. and Karoumi, R., 2009. Enhanced assessment ofthe remaining service life of a steel railway bridge. Key Engineering Materials,Damage Assessment of Structures VIII.
• Wallin, J., Leander, J. and Karoumi, R., 2010. Strengthening of a steelrailway bridge and its impact on the dynamic response to passing trains.Engineering Structures, 33(2).
• Leander, J., Karoumi, R., 2012. Rate of convergence of measured stress rangespectra. Bridge Maintenance, Safety, Management, Resilience and Sustain-ability - Proceedings of the Sixth International Conference on Bridge Mainte-nance, Safety and Management.

Contents
Preface v
Publications vii
Contents ix
1 Introduction 11.1 Background . . . . . . . . . . . . . . . . . . . . . . . . . . . . . . . . 21.2 Aims and scope . . . . . . . . . . . . . . . . . . . . . . . . . . . . . . 51.3 Research contribution . . . . . . . . . . . . . . . . . . . . . . . . . . 61.4 Outline of thesis . . . . . . . . . . . . . . . . . . . . . . . . . . . . . 7
2 Fatigue assessment 92.1 Influence of dynamics . . . . . . . . . . . . . . . . . . . . . . . . . . 112.2 Fatigue assessment based on measured stress . . . . . . . . . . . . . 152.3 Fatigue endurance by LEFM . . . . . . . . . . . . . . . . . . . . . . 182.4 Reliability-based assessment . . . . . . . . . . . . . . . . . . . . . . . 21
3 Case study: The Söderström Bridge 253.1 The Söderström Bridge . . . . . . . . . . . . . . . . . . . . . . . . . 263.2 Numerical example . . . . . . . . . . . . . . . . . . . . . . . . . . . . 28
4 Conclusions 354.1 General conclusions . . . . . . . . . . . . . . . . . . . . . . . . . . . . 354.2 Further research . . . . . . . . . . . . . . . . . . . . . . . . . . . . . 37
Bibliography 39
I Dynamics of thick bridge beams and its influence on fatigue lifepredictions 47
II Monitoring and enhanced fatigue evaluation of a steel railwaybridge 49
ix

x CONTENTS
IIIQuality assurance of measured response intended for fatigue lifeprediction 51
IVRefined fatigue assessment of joints with welded in-plane attach-ments by LEFM 53
V Reliability-based calibration of fatigue safety factors for existingsteel bridges 55

Chapter 1
Introduction
The service life of existing steel bridges is commonly restricted by fatigue. Theassessment of the fatigue life is performed when the traffic load is to be increased,when the anticipated service life is ended, or when inspections have revealed dam-age. If however, an assessment based on the governing standards doesn’t allowthe expected service life, what is the next step? This is the starting point for thisthesis. It is a survey of possible measures to ensure a reliable service life when themethods in the standards cannot.
The Söderström Bridge in Stockholm, Sweden, is a typical example. A photo of thebridge is shown in Figure 1.1. Inspections have revealed several fatigue cracks andtheoretical assessments have shown an exhausted fatigue life (Andersson, 2009).So far a replacement of the bridge is well motivated. However, the bridge is apart of the so-called wasp waist1 in Stockholm, carrying the only two tracks forrailway traffic southwards from the Central Station. A replacement of the bridgewould cause large disturbances in the railway traffic not only in Stockholm butprobably in the whole country. It is therefore desirable to extend the service lifeof the bridge as far as possible and maintain its safety until a replacement can beperformed without large disturbances. The completion of Citybanan (Banverket,2007) is expected to relieve the traffic volume on the Söderström Bridge during afuture replacement.
Even though the Söderström Bridge is unique, the intricate situation is not. Therailway system in Sweden and in the rest of Europe contains a large portion ofbridges reaching their expected service life (Sustainable Bridges, 2007a). Accordingto Dunker and Rabbat (1993) and Farhey (2007), the same trend prevails in the
1Literally translated from the Swedish expression getingmidja.
1

2 CHAPTER 1. INTRODUCTION
Figure 1.1: A view of the Söderström Bridge with the Stockholm Old Town in thebackground.
United States. All existing bridges reaching their theoretical service life cannot bereplaced simultaneously. Keeping our existing bridges in service with an adequatesafety is motivated by economical as well as environmental reasons.
1.1 Background
The Söderström Bridge is a so-called open deck bridge2 with sleepers resting di-rectly on stringer beams. It was constructed around 1950 in the early days of thewelding technique. Until then, riveting was the commonly used connection tech-nique for steel bridges (JRC–ECCS, 2008). The knowledge about fatigue caused byweldments was limited at the time of construction. In the comprehensive review bySchütz (1996), the first contribution to fatigue of welded and riveted joints is datedto 1929 with the textbook by Otto Graf3. It is, however, not believed to reflect thecommon knowledge of fatigue at that time. The Swedish paper by Schaub (1951)is contemporary with the construction of the Söderström Bridge. The fundamentalinfluence of the stress range was evidently not well established at the time, nor wasthe insignificant influence of the static strength of the base material. Figure 1.2 isreproduced after Svetskommissionen (1949) showing the fatigue strength expressedin maximum allowed stress as a function of the stress ratio R and the static material
2In Swedish: Bro med direkt slipersuppläggning (Trafikverket, 2013)3Die Dauerfestigkeit der Werkstoffe und Konstruktionselemente

1.1. BACKGROUND 3
strength. The stress ratio is defined as
R = Smin
Smax(1.1)
where Smin and Smax are the minimum and maximum value of the applied externalstress, respectively. The curves define the upper limit of the safe region. Added inthe figure is also a straight line for a constant stress range of 40MPa. This curverepresents today’s definition of fatigue strength, independent of the static strengthof the material but highly dependent on the geometry of the joint.
−80 −40 0 40 80 120 1600
40
80
120
160
Smin/MPa
S max
/MPa
St37 (1949)St52 (1949)Sr constant
R = –1
R = 0
R = 1
Figure 1.2: A schematic visualization of the fatigue strength for 2 million cyclesaccording to Svetskommissionen (1949). Shown is also a constant stress range Srof 40MPa as an example of today’s definition of fatigue strength. St37 and St52denominates two commonly used material strengths.
As seen in Figure 1.2, the definition used in the old standard is unconservativeconsidering today’s standards for low and negative stress ratios. It is conservativewhen the stress ratio approached unity. The constant value of Sr = 40MPa ischosen as an example. The value is dependent on the studied detail.
With StBK-N2 (1974) the first Swedish publication resembling today’s standardsfor fatigue assessment was released. It was to a large extent based on test resultsfrom Fisher et al. (1970), Hirt et al. (1971), and Fisher et al. (1972), see Alpsten(1974). The fatigue resistance of steel structures constructed before the release ofthese publications can be justly questioned. A survey of more than 100 fatiguedamage cases for steel and composite bridges is presented in the Swedish report Al-Emrani (2006). A summary can be found in Al-Emrani and Kliger (2009). Mostcases are from bridges constructed during the 1970-ties and before.

4 CHAPTER 1. INTRODUCTION
A fatigue life prediction is afflicted by large uncertainties. In the assessment of anexisting bridge the loads, the behavior of the structure, the detail specific endurance,and the deterioration model have to be judged. Figure 1.3 shows a schematic view ofthe assessment process. By measurements on the studied bridge, the uncertaintiesassociated to the loads and the structural behavior can be reduced (Zhou, 2006;Helmerich et al., 2007). The monitoring campaign of the Söderström Bridge startedin 2008 constitutes the experimental foundation for the studies in this thesis. Thecampaign and the treatment of the measured response are addressed in Paper II.A deterministic assessment of the bridge based on the measured response is alsoincluded in the paper. Even though the measurements are assumed to give anaccurate representation of the true response, they are afflicted with uncertaintiesrelated to measurement errors. This is addressed in Paper III and further developedin Paper V.
(i) Structural analysisCalculation of stresses
Assessment steps Refinements
(ii) ResistanceFatigue endurance
(iii) Fatigue verificationPrediction model
Paper I: Dynamic analysisPaper II and III: Monitoring
Paper IV: Descriptive detailcategory
Paper V: Safety format
Figure 1.3: A schematic view of the assessment process and the relation betweenthe papers.
The monitoring campaign of the Söderström Bridge has enabled studies of thedynamic behavior caused by passing trains, e.g., Wallin et al. (2011). For realistictrain speeds no significant dynamic effects are seen in the measured response. Thisis contradictory to the quasi static approach in the Eurocode which gives a highdynamic amplification factor for short continuous beams. This contradiction isaddressed in Paper I with the purpose of suggesting adequate dynamic amplificationfactors for initial fatigue assessments.
While Paper I, II, and III treat the load effect, Paper IV addresses the fatigueendurance. An in-plane gusset plate joint was studied by linear elastic fracturemechanics and an initial crack size distribution was fitted against test results. Adescriptive detail category is proposed based on the result.
In Paper V, a reliability-based assessment is presented. It enables an estimation

1.2. AIMS AND SCOPE 5
of the uncertainties related to the deterioration model, the fatigue endurance, andthe load effect. A sensitivity analysis also indicates the influence of the differentuncertainties. A calibration of partial safety factors was performed and values arepresented for use in deterministic fatigue assessments based on a measured response.
1.2 Aims and scope
The overall aim of this thesis is to evaluate the potential for improvements inthe fatigue assessment procedure. While the standards sometimes entail over-conservative fatigue life predictions, monitoring and advanced evaluation methodsare expected to provide predictions with higher accuracy.
Some specific objectives with the project is:
• Data acquisition from the monitoring system on the Söderström Bridge.
• Verifying the quality of the measured response.
• Performing a deterministic fatigue evaluation based on measured stresses.
• Improving the fatigue life prediction by advanced evaluation methods, suchas linear elastic fracture mechanics (LEFM).
• Performing a probabilistic evaluation of the fatigue life considering the mea-sured response.
This thesis treats the fatigue assessment of the Söderström Bridge specifically. Someresults and conclusions presented are object specific, however, the proposed methodsare expected to be applicable to similar structures.
The fatigue life predictions have been performed using established methods such asthe Palmgren–Miner rule (Palmgren, 1924; Miner, 1945) and linear elastic fracturemechanics (LEFM). The author has not tried to develop new prediction methods orto improve the existing ones. The focus has been on reducing the uncertainties inthe required variables. The linear damage accumulation rule according to Palmgrenand Miner is used because its the most established approach for fatigue assessment.LEFM is used as a complement and enables a more elaborate description of thecrack propagation phase and a distinct definition of the failure.
Residual stresses caused by the welding process can have a significant influence onthe fatigue life. This uncertainty is neglected in the present study. A conservativeapproach has been adopted, always assuming the whole stress variation acting in

6 CHAPTER 1. INTRODUCTION
tension. For details regarding residual stresses, the interested reader is referred toJames et al. (2007), Barsoum (2008) and Sonsino (2009).
The results from a monitoring system are a time signal and strain variations fromstrain gauges mounted on the bridge. The denomination measured stress is usedthroughout the thesis, which refers to the measured strain multiplied by Young’smodulus according to Hooke’s law.
1.3 Research contribution
The monitoring campaign of the Söderström Bridge and the theoretical studiespresented in this thesis have resulted in the scientific contributions summarizedbelow.
• A semi-analytical routine for dynamic analysis of continuous Timoshenkobeams has been derived and implemented. It enables time effective analy-ses of beams traversed by moving loads.
• The monitoring campaign of the Söderström Bridge has provided a vastamount of data made available for research by the publications producedin this project.
• Efficient routines and tools for treatment of the data produced by the monitor-ing campaign have been developed and presented. From the measured strains,train passages are extracted, statistics about the passages are summarized,cycle counting is performed, and the accumulated damage is calculated.
• A procedure for quality evaluation of the measured response in terms of stressrange spectra has been developed. It enables a screening for deviant spectracaused by malfunction or unexpected structural behavior. The evaluationalso treats the required duration of monitoring to reach a stable result.
• The fatigue life of a welded in-plane gusset plate joint has been studied indetail. An empirical expression for the stress magnification factor was derivedfor use in LEFM studies. A fictitious initial crack width distribution was fittedagainst fatigue tests and a descriptive detail category was derived.
• In the reliability-based assessment a model incorporating the measurementuncertainty is proposed. It was used for a code calibration and resulted inpartial safety factors to be used in assessment of existing steel bridges.

1.4. OUTLINE OF THESIS 7
1.4 Outline of thesis
This thesis is based on the work and results presented in the appended papers. Theintention of the thesis is to set the papers in the context of the research project. Italso provides a space for additional explanations to the work presented. A summaryof the appended papers is given in Chapter 2. Some underlying assumptions andconditions left out in the papers are also given.
The case study, the Söderström Bridge, is in some sense appearing in all papers. Theproperties of the bridge and some background information are given in Chapter 3.A numerical example showing the merits of the proposed methods is also includedin the same chapter.
General conclusions based on the research project are presented in Chapter 4. Pro-posals for further research are given in the same chapter. Specific conclusionsregarding each study are found in the appended papers.


Chapter 2
Fatigue assessment
Based on the well-known fatigue tests by Wöhler, a mathematical expression forthe fatigue endurance was proposed by Basquin (1910) as
N = KS−mr (2.1)
where K and m are the intercept and the slope, respectively, of the S–N curvein log–log scale, N is the number of cycles to failure, and Sr is the stress range.The formula was originally based on the maximum stress since the fundamentalimportance of the stress range wasn’t known at the time. Figure 2.1 shows anexample of an S–N curve based on a reevaluation of the fatigue tests presented inNilsson (1969).
With the relationK = 2 · 106 SmC (2.2)
where SC is the fatigue strength for 2 million cycles, the Basquin law (2.1) can beexpressed as
N = 2 · 106(SC
Sr
)m
(2.3)
which is equivalent to the expression for fatigue endurance given in EN 1993-1-9 (CEN, 2006). In the case of code based assessment or design (2.3) should beexpanded further to
N = 2 · 106(
SC
γFfγMfΦSr
)m
(2.4)
where γFf and γMf are the partial safety factors for load and strength, respectively,and Φ is the dynamic amplification factor.
9

10 CHAPTER 2. FATIGUE ASSESSMENT
104 105 106 107 108 109101
102
103
N/cycles
S r/M
Pa
Test 035−8Test 035−9MeanEN 1993-1-9
100
100200400
Figure 2.1: A reevaluation of the fatigue tests presented in Nilsson (1969) denomi-nated 035-8 and 035-9.
The appended papers can be put in a context by expression (2.4). Paper I addressesthe influence of dynamics which is represented by Φ in (2.4). Paper II and IIIaddresses monitoring and the determination of realistic stress range spectra whichis represented by Sr in (2.4). The fatigue strength, SC in (2.4), is studied inPaper IV for a specific welded detail. Finally, Paper V addresses the safety formatand the partial safety factors γFfγMf in (2.4).
The stress–life approach for fatigue life prediction as (2.4) implies, is valid for bothnominal stresses and so-called local stress approaches. A review of local approachesis given in Radaj et al. (2009). Local approaches are generally recommended forcomplex details when the nominal stress is hard to define or when no representativedetail category is at hand (Niemi, 1995; Hobbacher, 2008; Radaj et al., 2009). Thecurrent design codes CEN (2006) and DNV (2011), supports the nominal stressmethod and the local geometric stress1 method. The publication Hobbacher (2008)gives besides the nominal and the geometric stress methods also recommendationsfor the use of the effective notch stress method.
Monitoring is suggested as a measure to overcome uncertainties in theoretical cal-culation models. Nominal stresses are attained if the sensors are located away fromlocal stress concentrations. The geometric (hot-spot) stress can also be attainedby measurements using strain gauges. Guidelines for the setup of gauges can befound in Hobbacher (2008) and in Niemi (1995). Discussions and examples on ap-
1The term geometric stress is used in the Eurocode. Other frequent denominations are struc-tural stress or hot-spot stress.

2.1. INFLUENCE OF DYNAMICS 11
plications can be found in Radaj et al. (1998) and in Schumacher and Nussbaumer(2006). If only nominal stresses are measured, local stresses can be estimated bya stress concentration factor calculated by parametrical formulae or by numericalanalysis (Partanen and Niemi, 1996). This intermediate step does, however, adduncertainty to the life prediction. The uncertainties related to theoretical stress de-termination are discussed by, e.g., Wirsching (1984); Folsø and Parmentier (2002);Fricke et al. (2002); Sørensen (2012).
An alternative to the stress–life approach treated hitherto is linear elastic fracturemechanics (LEFM). It is treated further in Section 2.3. An extensive review ofother possible life prediction methods can be found in Fatemi and Yang (1998).
2.1 Influence of dynamics
The fatigue deterioration is caused by variations in the load effect, the same effectthat triggers dynamic behavior. A pronounced dynamic behavior with high stressamplitudes and a great number of cycles has a detrimental influence on the fatiguelife. In an ultimate limit state verification, the maximum attained load value isdecisive for the capacity. When it comes to fatigue life, rare extreme values arenot necessarily decisive. The accumulated damage is dependent on the whole stresshistory which is dependent on the interaction between the load and the dynamicbehavior of the structure.
Dynamics of railway bridges is an extensive research area. It spans from the influ-ence of steam locomotives in the early days of the railways, to advanced vehicle–bridge interaction models for future high speed railways. A historical review canbe found in Frýba (1996). The interaction between the dynamic behavior of astructure and fatigue deterioration is, however, rarely treated. Some exceptionsare Malm and Andersson (2006) studying dynamic oscillations of the hangers ofa tied arch railway bridge and its influence on fatigue life, Herwig and Brühwiler(2011) presents a parametric study on, e.g., the influence of track irregularities andthe weight of the vehicle, furthermore, a dynamic amplification factor for fatigueassessment is proposed, and Liu et al. (2013) studies the influence of load modelingtechniques on the fatigue damage caused by high speed trains.
In a code based assessment the influence of dynamics is considered by a dynamicamplification factor (DAF) denoted Φ in (2.4). It is a quasi static approach wherethe static response is magnified to comprise dynamic effects. Concerning fatigueit enlarges the stress range but it cannot consider an increase in number of cycles.Furthermore, it cannot capture discrepancies between static and dynamic behavior.The dynamic factor was originally established for simply supported girders (ORE,

12 CHAPTER 2. FATIGUE ASSESSMENT
1970; UIC, 2006). With a so-called determinant length, the values are adjustedfor application on other structural members with different support conditions. Aspecial DAF was suggested in ORE (1970) for secondary structures such as stringers(rail bearers) and crossbeams in open deck bridges, that only depended on thespeed of the train. In measurements on steel bridges in service the dynamic effectsof secondary structures was not as pronounced as for main beams. The reasonwas attributed to the complex interaction between main beams, crossbeams andstringers, and furthermore, the short duration of the load. The suggested DAF forsecondary beams is, however, not incorporated in today’s standards.
To investigate the validity of the sometimes high values of the DAF, a theoreticalstudy on dynamics has been performed and presented in Paper I. The focus is onopen deck bridges and typical beams in the secondary structure as stringers andcrossbeams. To the experience of the author, these beams often attain a high DAFand become decisive for the fatigue capacity of the whole bridge. Acknowledgingthe importance of the dynamic effect, a more refined analysis was expected to showa smaller influence of dynamic effects than prescribed in the standards.
An analytical model was developed in Paper I enabling parametric studies on theinteraction between dynamic properties and fatigue life. The theoretical approachwas inspired by the work of Christoffer Johansson on Euler-Bernoulli beams tra-versed by high speed trains (Johansson et al., 2013). The secondary beams in opendeck bridges are typically short and have a high bending stiffness. The approachpresented in Paper I is therefore based on the Timoshenko beam theory. The equa-tion of motion was derived in Timoshenko (1921) based on the equilibrium of abeam segment and is reproduced below for the sake of completeness. An alterna-tive derivation based on strain energy can be found in Rao (2007). A prismaticbeam shown in Figure 2.2 is studied. The deformation of an arbitrary point alongthe beam axis is described by the vertical deflection w and its rotation φ. Thex-axis represents the undeformed state. The slope of the total deflection can beexpressed as
∂w
∂x= φ+ γ (2.5)
where γ is the slope due to shear deformation.
In Figure 2.3, the shaded beam segment in Figure 2.2 is extracted and the forcesacting upon it are shown. The considered forces are the external load f , the bendingmoment M , the shear force V , and Iw and Iφ which correspond to the deflectioninertia and the rotation inertia, respectively. For small deformations and a smalllength dx, the conditions for equilibrium can be expressed as
↑: V − V − ∂V
∂xdx− fdx+ ρA
∂2w
∂t2dx = 0 (2.6a)

2.1. INFLUENCE OF DYNAMICS 13
f(x,t)
x
w
γϕ
dx
Figure 2.2: A deformed prismatic beam.
x: M + ∂M
∂xdx−M − V dx+ ρI
∂2φ
∂t2dx = 0 (2.6b)
where ρ is the density, A is the cross-section area, and I is the second moment ofinertia.
dx
f
M + dx∂M∂x
V + dx∂V∂x
M
V
Iw
Iϕ
Figure 2.3: A beam segment and the acting forces. The deflection inertia and therotation inertia are denoted Iw and Iφ, respectively.
The bending moment in a beam is proportional to the curvature which is the first
14 CHAPTER 2. FATIGUE ASSESSMENT
derivative of the bending slope
M = −EI ∂φ∂x
(2.7)
where E is the Young’s modulus. The shear force is proportional to the shear slopeas
V = kAGγ = kAG
(∂w
∂x− φ
)(2.8)
where k is the shear coefficient, A is the cross-section area, and G is the shearmodulus. Inserting (2.7) and (2.8) in (2.6) gives
−kAG∂2w
∂x2 + kAG∂φ
∂x+ ρA
∂2w
∂t2= f (2.9a)
−EI ∂2φ
∂x2 − kAG∂w
∂x+ kAGφ+ ρI
∂2φ
∂t2= 0 (2.9b)
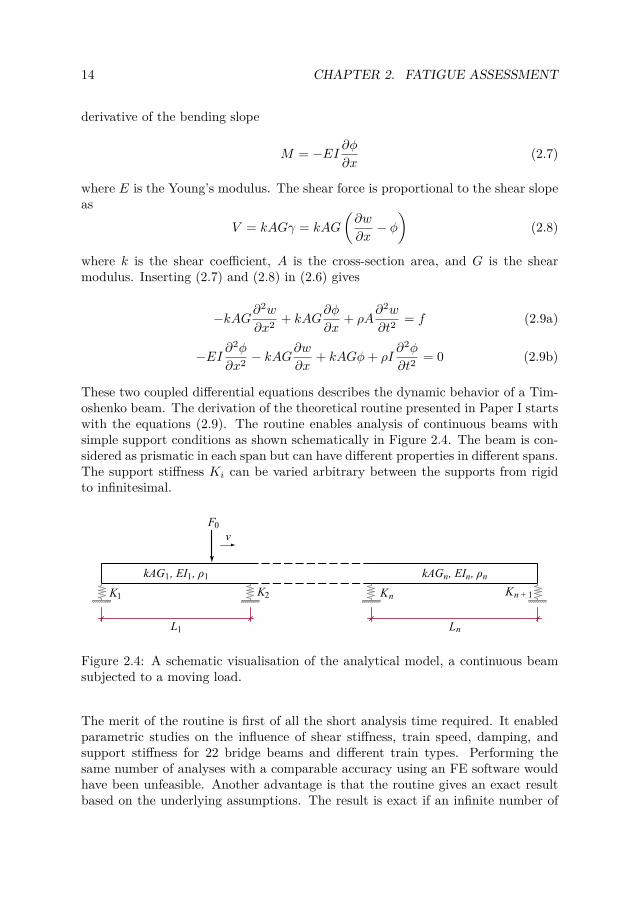
These two coupled differential equations describes the dynamic behavior of a Tim-oshenko beam. The derivation of the theoretical routine presented in Paper I startswith the equations (2.9). The routine enables analysis of continuous beams withsimple support conditions as shown schematically in Figure 2.4. The beam is con-sidered as prismatic in each span but can have different properties in different spans.The support stiffness Ki can be varied arbitrary between the supports from rigidto infinitesimal.
L1 Ln
F0v
K1 K2 Kn Kn + 1
kAGn n n, EI , ρkAG1 1 1, EI , ρ
Figure 2.4: A schematic visualisation of the analytical model, a continuous beamsubjected to a moving load.
The merit of the routine is first of all the short analysis time required. It enabledparametric studies on the influence of shear stiffness, train speed, damping, andsupport stiffness for 22 bridge beams and different train types. Performing thesame number of analyses with a comparable accuracy using an FE software wouldhave been unfeasible. Another advantage is that the routine gives an exact resultbased on the underlying assumptions. The result is exact if an infinite number of
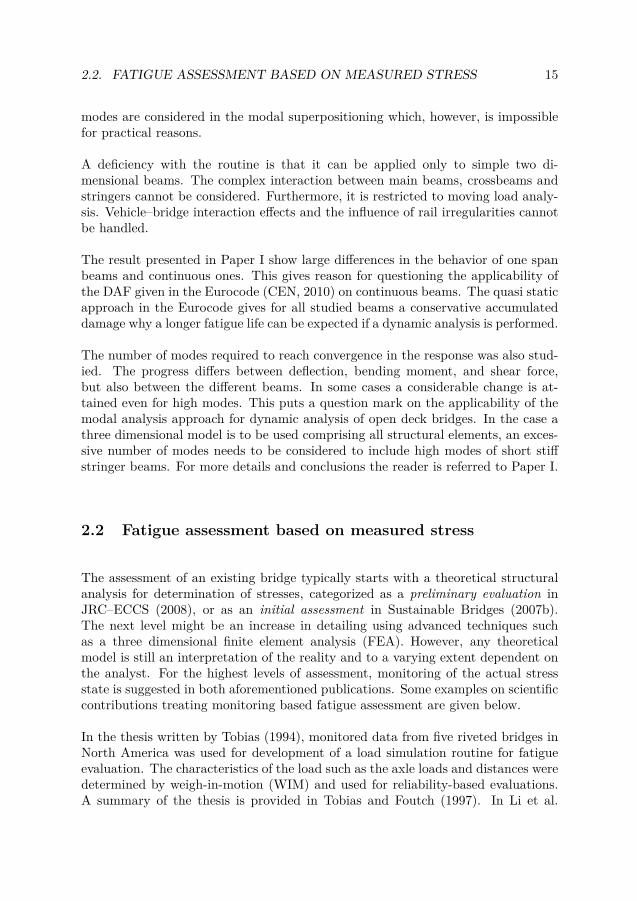
2.2. FATIGUE ASSESSMENT BASED ON MEASURED STRESS 15
modes are considered in the modal superpositioning which, however, is impossiblefor practical reasons.
A deficiency with the routine is that it can be applied only to simple two di-mensional beams. The complex interaction between main beams, crossbeams andstringers cannot be considered. Furthermore, it is restricted to moving load analy-sis. Vehicle–bridge interaction effects and the influence of rail irregularities cannotbe handled.
The result presented in Paper I show large differences in the behavior of one spanbeams and continuous ones. This gives reason for questioning the applicability ofthe DAF given in the Eurocode (CEN, 2010) on continuous beams. The quasi staticapproach in the Eurocode gives for all studied beams a conservative accumulateddamage why a longer fatigue life can be expected if a dynamic analysis is performed.
The number of modes required to reach convergence in the response was also stud-ied. The progress differs between deflection, bending moment, and shear force,but also between the different beams. In some cases a considerable change is at-tained even for high modes. This puts a question mark on the applicability of themodal analysis approach for dynamic analysis of open deck bridges. In the case athree dimensional model is to be used comprising all structural elements, an exces-sive number of modes needs to be considered to include high modes of short stiffstringer beams. For more details and conclusions the reader is referred to Paper I.
2.2 Fatigue assessment based on measured stress
The assessment of an existing bridge typically starts with a theoretical structuralanalysis for determination of stresses, categorized as a preliminary evaluation inJRC–ECCS (2008), or as an initial assessment in Sustainable Bridges (2007b).The next level might be an increase in detailing using advanced techniques suchas a three dimensional finite element analysis (FEA). However, any theoreticalmodel is still an interpretation of the reality and to a varying extent dependent onthe analyst. For the highest levels of assessment, monitoring of the actual stressstate is suggested in both aforementioned publications. Some examples on scientificcontributions treating monitoring based fatigue assessment are given below.
In the thesis written by Tobias (1994), monitored data from five riveted bridges inNorth America was used for development of a load simulation routine for fatigueevaluation. The characteristics of the load such as the axle loads and distances weredetermined by weigh-in-motion (WIM) and used for reliability-based evaluations.A summary of the thesis is provided in Tobias and Foutch (1997). In Li et al.

16 CHAPTER 2. FATIGUE ASSESSMENT
(2001) and Chan et al. (2001), monitored data from the Tsing Ma Bridge in HongKong is used together with an FE model for local damage assessment using contin-uum damage mechanics. The Tsing Ma Bridge is a relatively new bridge completed1997 and shows no sign of fatigue damage which makes the study somewhat hypo-thetical. Measurements for fatigue assessment in general and for retrofit measuresspecifically, is treated in Connor and Fisher (2006). Questions adequate for fatigueevaluation such as the stress cutoff limit and the duration of monitoring are dis-cussed. Furthermore, web gap cracking is treated which is of interest concerningthe cracks found on the Söderström Bridge, see Chapter 3. Zhou (2006) empha-sis monitoring as a mean to reduce uncertainties in the load effect. A procedurefor fatigue life assessment in compliance with the American standards (AASHTO,2003) is proposed. Professor Dan M. Frangopol has contributed to several studiestreating monitoring and fatigue assessment, e.g., Frangopol et al. (2008), Kwonand Frangopol (2010), and Liu et al. (2010). The focus is typically on reliabilityanalyses and cost estimations for intervention planning.
The monitoring campaign of the Söderström Bridge is described in Paper II. Thepurpose was to establish the actual stress variation in some of the critical sectionsidentified in Andersson (2009). Stress levels lower than estimated in the theoreticalanalysis were expected, with a reduced predicted fatigue damage as a result. Themeasurements did, however, rather confirm the discouraging result of the theoreticalstudy. As shown in Figure 20 in Paper II, the estimated damage based on themeasurements shows a good resemblance to Method 2 of the theoretical calculations.Even though no extended service life could be ensured, the measurements havecontributed with reduced uncertainties in the actual load effect.
Continuous measurements require effective routines to handle the vast amount ofdata produced. Reducing the amount of data at an early stage makes subsequentanalyses less time consuming. In the case of fatigue assessment, the variation instress is decisive which makes the time history essential. However, only variationscontributing to the fatigue deterioration are of interest. For the Söderström Bridge,short term strain variations are seen for the train passages. Long term variationsare seen for daily temperature variations and over seasons. The daily variation isapparent in Figure 2.5 showing the median strain for every 10 minutes of measure-ment over a period of 43 days.
Even though the change in temperature causes variations in strain, it doesn’t neces-sarily give stress variations. Imposed deformations cause stresses only if the studiedmember is restrained from movement. Measuring the strain, the stresses caused byrestrained deformations are not easily determined. Nevertheless, the variation dueto temperature changes causes no more than one cycle per day which in comparisonto the roughly 520 trains passing the bridge every day is negligible. To neutralizethe influence of the temperature and the inherent low zero-stability of the gauges(Ko and Ni, 2005), a routine was developed that extracts the train passages from

2.2. FATIGUE ASSESSMENT BASED ON MEASURED STRESS 17
30/07 04/08 09/08 14/08 19/08 24/08 29/08 03/09 08/09 13/09
−40
0
40
80
120
Date
Med
ian
stra
in/(μ
m/m)
Gauge 35Gauge 36
Figure 2.5: Median strain variation in gauges 35 and 36 on a stringer beam duringthe monitoring period starting 30th of July and ending 11th of September 2008.
the raw data. Furthermore, it renders a reduction in data amount, more time ef-fective analyses, and makes statistical evaluations of the passages possible. Theextracted train passages could also be used for bridge weigh-in-motion (B-WIM)treated in, e.g., Karoumi et al. (2005); Liljencrantz et al. (2007); Gonzalez (2011).
A cycle counting technique is required to convert the measured time history to astress range spectrum. In the work within this thesis the rainflow cycle countingmethod has been adopted, suggested by Matsuishi and Endo (1968). Examples onother methods can be found in Stephens et al. (2001). Algorithms for implemen-tation of the rainflow method have been presented in Downing and Socie (1982)and Rychlik (1987). The cycle counting has been performed with Matlab and theWAFO toolbox (Brodtkorb et al., 2000).
A deterministic fatigue assessment is performed and presented in Leander (2008)for every gauge in the monitoring campaign. The result is summarized in Paper II.In the assessment of a bridge in whole, a judgment is required on which gaugesare reliable and representative for each structural part. This issue is addressed inPaper III which covers three related parts for the quality assurance of the measuredresponse. The first part treats the differences between gauges. Some gauges areseen to be afflicted by electrical disturbance and others by unexpected local effects.For the Söderström Bridge, malfunction and vandalism were additional reasons fordeviant responses. The quality assurance approach suggested in Paper III is basedon established statistical methods as analysis of variance (ANOVA) and post hocanalysis. The ANOVA enables a thorough comparison of the stress range spectra
18 CHAPTER 2. FATIGUE ASSESSMENT
for a whole group of gauges with defined levels for deviant spectra. The approachcan easily be atomized and incorporated in the data acquisition enabling a runningevaluation of the response.
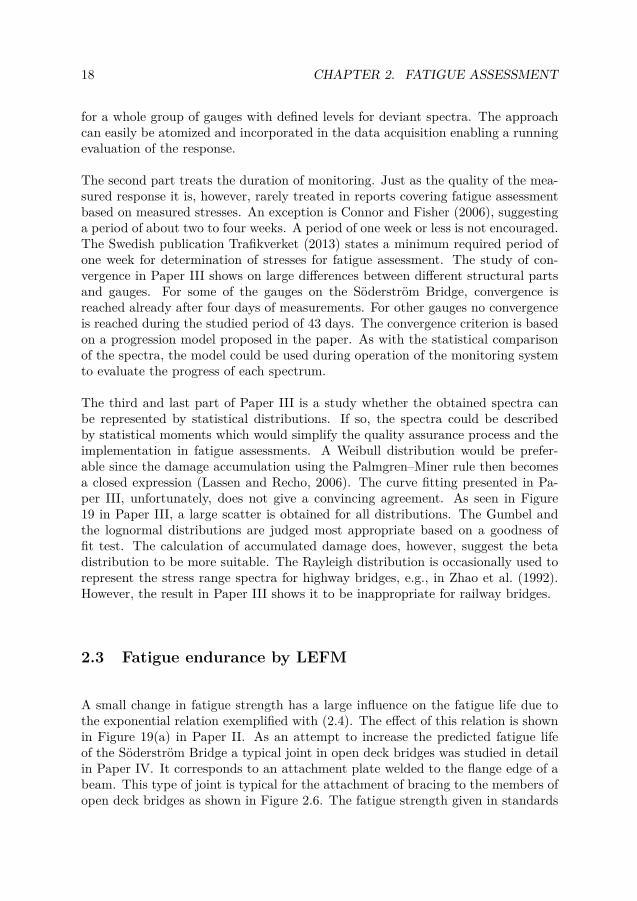
The second part treats the duration of monitoring. Just as the quality of the mea-sured response it is, however, rarely treated in reports covering fatigue assessmentbased on measured stresses. An exception is Connor and Fisher (2006), suggestinga period of about two to four weeks. A period of one week or less is not encouraged.The Swedish publication Trafikverket (2013) states a minimum required period ofone week for determination of stresses for fatigue assessment. The study of con-vergence in Paper III shows on large differences between different structural partsand gauges. For some of the gauges on the Söderström Bridge, convergence isreached already after four days of measurements. For other gauges no convergenceis reached during the studied period of 43 days. The convergence criterion is basedon a progression model proposed in the paper. As with the statistical comparisonof the spectra, the model could be used during operation of the monitoring systemto evaluate the progress of each spectrum.
The third and last part of Paper III is a study whether the obtained spectra canbe represented by statistical distributions. If so, the spectra could be describedby statistical moments which would simplify the quality assurance process and theimplementation in fatigue assessments. A Weibull distribution would be prefer-able since the damage accumulation using the Palmgren–Miner rule then becomesa closed expression (Lassen and Recho, 2006). The curve fitting presented in Pa-per III, unfortunately, does not give a convincing agreement. As seen in Figure19 in Paper III, a large scatter is obtained for all distributions. The Gumbel andthe lognormal distributions are judged most appropriate based on a goodness offit test. The calculation of accumulated damage does, however, suggest the betadistribution to be more suitable. The Rayleigh distribution is occasionally used torepresent the stress range spectra for highway bridges, e.g., in Zhao et al. (1992).However, the result in Paper III shows it to be inappropriate for railway bridges.
2.3 Fatigue endurance by LEFM
A small change in fatigue strength has a large influence on the fatigue life due tothe exponential relation exemplified with (2.4). The effect of this relation is shownin Figure 19(a) in Paper II. As an attempt to increase the predicted fatigue lifeof the Söderström Bridge a typical joint in open deck bridges was studied in detailin Paper IV. It corresponds to an attachment plate welded to the flange edge of abeam. This type of joint is typical for the attachment of bracing to the members ofopen deck bridges as shown in Figure 2.6. The fatigue strength given in standards

2.3. FATIGUE ENDURANCE BY LEFM 19
as CEN (2006) are conservative estimates based on tests on a large number ofspecimens. The intention with the study in Paper IV was to reach a more specificfatigue strength dependent on the dimensions of the joint.
Figure 2.6: The joint between the wind bracing and a cross beam in the SöderströmBridge.
The study performed is based on linear elastic fracture mechanics (LEFM). It en-ables a description of the crack propagation phase and a definition of the finalfracture. LEFM is in, e.g., JRC–ECCS (2008) and Sustainable Bridges (2007b)mentioned as a final resource for fatigue assessment. The application is not asstraight forward as the stress–life approach and little, if any, guidance can be foundin today’s standards for bridge design or assessment. Furthermore, the work effortfor crack growth analyses from initiation to a final fracture is substantially higherin comparison to a linear damage accumulation (Martinsson, 2005).
Fracture mechanics is used to study the propagation of a defined crack. Bridges aretypically subjected to elastic loading conditions which together with an assumptionof small-scale yielding at the crack tip implies that linear elastic fracture mechanicsis applicable. Decisive for the fatigue crack growth are the stress intensity factors(SIF:s) which characterize the stress state at the tip of a crack (Nilsson, 2001). Itcan be expressed as (Hobbacher, 1993)
Kr = Sr√πaYu(a) (2.10)
where Sr is the remote stress range, a is the crack depth, and Yu(a) is a universalcorrection factor dependent on the geometry, boundary conditions, and the crackmode. The three different crack modes are illustrated in Figure 2.7. In the case ofmixed-mode cracking the interaction between the modes requires consideration inthe analysis of the crack path, see Suresh (1998) among others.

20 CHAPTER 2. FATIGUE ASSESSMENT
(a) Mode I. (b) Mode II. (c) Mode III. (d) Mode I and IIcombined.
Figure 2.7: Three modes of crack tip loading and one combined mode.
For welded structures, the universal correction factor is commonly split into
Yu(a) = Y (a)Mk (2.11)
in which the properties of the cracked plate is considered by Y (a) and the influenceof the weld and the attachment is considered by the magnification factor Mk. Thisenables a combination of different parametric formulae to obtain the appropriateuniversal correction factor. Expressions for Y (a) for various unwelded geometriescan be found in handbooks as, e.g., Rooke and Cartwright (1976); Murakami (1987);Tada et al. (2000). However, the correction factor for the influence of welds Mk isnot at all as extensively covered in the literature. The lack of parametric formulaeis emphasized in Hobbacher (1993). There are, however, a few examples gatheredin (BSi, 2005).
The SIF and thereby the universal correction factor can be determined by numericalmethods or by weight functions, and for a few special cases by analytical solutions(Nilsson, 2001). In Paper IV the finite element method (FEM) is used to determinethe stress intensity factor for a joint as depicted in Figure 2.8. A parametric formulafor the magnification factor is determined by a curve fitting to the results from theFE analyses. An exemplary study based on a similar approach for a T-butt jointis presented by Bowness and Lee (2000).
The relation between the crack length and the number of cycles is described by somecrack growth law. The most established is the linear so-called Paris law suggestedby Paris et al. (1961)
dadN = AKm
r (2.12)
where N is the number of cycles andKr is the aforementioned stress intensity factorrange. The variables A and m are treated as constants dependent on the material,

2.4. RELIABILITY-BASED ASSESSMENT 21
tm ta
L
ta
ta
tm
ta
Figure 2.8: An idealized model of the studied joint.
the stress ratio R and the environmental conditions. A bilinear law is suggested inBSi (2005) which is considered in Paper IV. A more exhaustive coverage of LEFMcan be found in the textbooks Anderson (2005), Suresh (1998), and in the morecondensed textbook by Nilsson (2001). Examples on applications on bridges canbe found in Fisher (1984).
The proposed parametrical formula in Paper IV enabled time effective crack propa-gation analyses, which in turn enabled parametrical studies on different dimensionsof the joint. By calibrating a fictitious initial crack depth, or a so-called equivalentinitial flaw size (EIFS), to available fatigue tests new data could be simulated. Thenew data was evaluated statistically and a descriptive fatigue strength is proposed.It enables a consideration of different lengths of the attachment plate and differentthickness ratios between the plates in the joint.
2.4 Reliability-based assessment
An initial bridge assessment is typically performed by a semi-probabilistic approachusing partial safety factors, also called level I methods (CEN, 2004; Melchers, 2002).Partial safety factors for fatigue assessment of railway bridges in Sweden are givenin Trafikverket (2013). In Paper V a level II method is used, the first order reli-ability method (FORM), for calibration of the partial safety factors to be used ina level I assessment. The focus is on consideration of measured stresses in fatigueassessments of existing bridges.

22 CHAPTER 2. FATIGUE ASSESSMENT
A fatigue assessment is to a large extent based on empirical data with substantialscatter which makes a probabilistic approach eminently appropriate. This allowsuncertainties inherent in the resistance as well as in the loads to be considered. Theoutcome of a probabilistic approach is a probability of failure Pf or an interrelatedreliability index β. To reach appropriate safety factors a target reliability has tobe stipulated. General discussions about target reliability for existing structuresare held in Diamantidis and Bazzurro (2007); Klatter et al. (2009); Vrouwenvelderand Scholten (2010). Bridges in specific are treated in Allen (1993) and Toft andSørensen (2012).
A common conclusion in the aforementioned references is that a lower reliabilitylevel should be accepted for existing structures in comparison to new structures.Cost is mentioned as one reason. Increasing the structural strength in the designstage is usually less costly than a strengthening of the completed structure (Klatteret al., 2009). Reasons as user disruption, energy consumption, and heritage valueare added in Allen (1993). A reduced expected residual service life could also beconsidered (Diamantidis and Bazzurro, 2007).
In Paper V the target reliability values suggested in Sustainable Bridges (2007b)and ISO 13822 (2010) were adopted. A value of β = 2.3 is suggested if inspectionsare possible and β = 3.1 if not. The β values correspond to probabilities of failureof about 10−2 and 10−3, respectively. Theses values should not be seen as theactual probability of failure, rather as nominal values or as formal failure probabilitymeasures (Melchers, 2002). Some conservative assumptions are made, even in theprobabilistic approach, and only a subset of uncertainties are considered.
The FORM adopted in Paper V enables a consideration of the uncertainties andthe distributions of the stochastic variables (Melchers, 2002). The result is theHasofer–Lind reliability index (Hasofer and lind, 1974) also called the geometricreliability index (Ditlevsen and Madsen, 2005). It is calculated based on a linearapproximation of the limit state function at the design point. In the case of amultidimensional limit state function the approximation is a hyperplane through thedesign point. If the limit state function is linear, the FORM gives an exact solution.For a nonlinear function the solution will be an approximation. For pronouncednonlinearity an alternative method might be called for such as the second orderreliability method (SORM) or some simulation technique (Sørensen, 2004). Anadvantage of the FORM is the time effective analyses and the consistency in theresult. A simulation technique is more general but it is sensitive to the number ofsamples. The number of samples required is treated in, e.g., Melchers (2002) andSørensen (2004).
A comparison with the result shown in Figure 2 in Paper V and the results ofa crude Monte Carlo simulation is presented in Figure 2.9. Only the stress rangespectrum for gauge 30 is considered. The reliability index for the spectrum of gauge

2.4. RELIABILITY-BASED ASSESSMENT 23
30 is calculated to β = 3.24 in Paper V and indicated in Figure 2.9. The MonteCarlo simulation is performed with different sample sizes ranging from 104 to 107
and for ten independent runs for each sample size. The scatter band in Figure 2.9is caused by the different runs.
104 105 106 1073
3.1
3.2
3.3
3.4
3.5
3.6
Sample size
β
FORMSimulationsScatter band
Figure 2.9: The reliability index calculated by FORM and by simulation for gauge30, cf. Paper V.
As seen in Figure 2.9, the result of the simulation converges towards a higherreliability index. This implies a nonlinear limit state surface with a convex shapetowards origin and a conservative estimate by the FORM. Since the limit statefunction defined with expression (6) in Paper V has three independent stochasticvariables, a graphical visualization of the limit state surface is possible. Figure 2.10shows the limit state function equal to zero as a surface for normalized variables.As seen in Figure 2.10(b), only a small deviation from a plane surface is retrieved.
An outcome of the FORM is the direction cosines or so-called sensitivity factors.They indicate how sensitive the limit state function is to changes in the stochasticvariables. As seen in Figure 3 in Paper V, the fatigue endurance represented byK1 has the greatest influence, thereafter the accumulated damage and the stressuncertainty in descending order. This implies that an effort in decreasing the scatterin the fatigue endurance has the greatest potential to increase the reliability.
Attention has been put on the consideration of the stress range spectra. The sug-gested model is based on a full spectrum consideration and a bilinear fatigue en-durance. Other options such as an effective stress range spectrum (Schilling andKlippstein, 1977; Moses et al., 1987) and using continuous distribution functions

24 CHAPTER 2. FATIGUE ASSESSMENT
−6−4
−20
−4 −2 0 2 4 6
−8
−6
−4
−2
0
2
4
uK1uXs
uD
(a) View 1.
−6−4−20
−8
−6
−4
−2
0
2
4
uK1
uD
Plane approx.
(b) View 2.
Figure 2.10: A graphical visualization of the limit state function for gauge 30, cf.Paper V. The color of the contour indicates the distance to origin with dark red asthe closest point.
was also studied. The reliability index calculated for an effective stress range spec-trum is shown to be highly dependent on the fatigue limit and is conservative incomparison to the full spectrum approach. No consistent results are obtained forthe case with continuous distribution functions. The result is for some spectrumshapes conservative, but unconservative for others.
A practical outcome of Paper V is suggestions for the joint value of the partialsafety factors γFfγMf to be used in assessment of existing steel bridges when mea-sured stresses are used. The factors are reached through a calibration against theaforementioned target reliability values.

Chapter 3
Case study: The SöderströmBridge
This thesis is focused on open deck bridges which carries the track without anyballast layer. These bridges are typically built up by main beams, crossbeams(floor beams), and stringers (rail bearers). Many of the concepts treated in thethesis are applicable to any steel bridge or structure, e.g., monitoring as a meanto determine stresses, or the reliability-based model for fatigue assessment. Otherparts are, however, limited to the behavior of open deck bridges loaded by railwaytraffic, e.g., the dynamic studies in Paper I, or the specific stress range spectraobtained through the measurements on the Söderström Bridge.
There are, according to a recent excerpt from the Swedish Bridge and Tunnel Man-agement system (BaTMan), about 450 open deck bridges in the Swedish railwaysystem (Safi, 2013). The distribution of the year of construction for these bridgesis shown in Figure 3.1. As indicated in Figure 3.1(b) the median bridge was con-structed in 1928 which means that fifty percent of the bridges are older than 85years.
The structural system of these bridges involves many fatigue prone details suchas connections between stringers and crossbeams, between crossbeams and mainbeams, and attachments of bracing. The stringers and crossbeams are typicallyexposed to a great number of stress cycles and a codified assessment gives highdynamic amplifications. These effects render a high theoretical fatigue damage andrestrictions in the service life.
The Söderström Bridge is one of the bridges in the statistics. Its superstructure
25

26 CHAPTER 3. CASE STUDY: THE SÖDERSTRÖM BRIDGE
1850 1900 1950 20000
20
40
60
80
Construction year
Num
ber
(a) Histogram.
1850 1900 1950 20000
0.2
0.4
0.6
0.8
1
Construction year(b) Cumulative distribution.
Figure 3.1: Year of construction for the open deck bridges registered in BaTMan.
as it is today was constructed in the 1950ies and is a part of the so-called waspwaist1 between the Central Station and the South Station in Stockholm, Sweden.It has been studied extensively since fatigue cracks have been found in the websof the main beams (Ekelund, 2008), but also because it is representative for otheropen deck bridges with its characteristic system of stringers, crossbeams and mainbeams.
3.1 The Söderström Bridge
The Söderström Bridge is a continuous steel beam bridge in six spans. The struc-ture is composed by two main girders, transversal crossbeams and four longitudi-nal stringer beams. The bridge type is sometimes referred to as a through girderbridge. Figure 3.2 shows a plan view of the bridge. The spans have the lengths27+33,7+33,7+33,7+33,6+26,9 meters.
An extensive system of bracing restrains the bridge from lateral movement. A windbracing spans between the crossbeams and the main beams. A zigzag bracing sup-ports the stringer beams and an additional bracing, adjacent the supports, transferthe braking force from the stringer beams to the main beams and further on tothe substructure. The substructure is made of concrete columns on piled slabs.Support 10 has fixed bearings in the longitudinal direction. The other supportshave roller bearings.
1Literally translated from the Swedish expression getingmidja.

3.1. THE SÖDERSTRÖM BRIDGE 27
(b)
10985 764
(a) The whole bridge.
Main beam Crossbeam Stringer7 8
(b) A section between support 7 and 8.
Figure 3.2: A plan view of the bridge. The supports are numbered according tothe original drawings.
The rails are attached to wooden sleepers by a so-called Hey-back fastener. Thesleepers are placed directly on the stringer beams. Figure 3.3 shows a sectionthrough the superstructure.
PedestrianMain beamfootpath
Crossbeam Stringers
Cen
terli
ne tr
ack
Cen
terli
ne tr
ack
Figure 3.3: A section through the superstructure.
The railway line between the Central Station and the South Station in Stockholmhas the highest traffic intensity in Sweden. In Grimm and Wahlborg (2009), a ca-
28 CHAPTER 3. CASE STUDY: THE SÖDERSTRÖM BRIDGE
pacity analysis of the Swedish railway network is presented. A grading system withthree levels is used for classification and the line between the stations is assigned tothe highest level. The two tracks are occupied with traffic 81–100% percent of thetime during rush hours. At most, 28 passages on each track can be allowed duringone hour and about 520 trains pass the line every day. A disturbance in the trafficon the bridge would affect the railway traffic in the whole region, to some extentthe whole country. Commuter trains in the Stockholm region, long distance trainsand freight transports are dependent on the functionality of the line.
A more elaborate description of the bridge can be found in Leander (2010).
Besides the papers appended to this thesis, the Söderström Bridge has been treatedin several other scientific reports. Partly because of the cracks found in the mainbeams, but also due to the vast amount of measured data made available by themonitoring campaign. Analyses of the dynamic behavior have been presented inWallin et al. (2011) and Kaliyaperumal et al. (2011). Local stress measurementshave been treated in Andersson et al. (2013). The cracking of the main beams hasbeen studied in Imam and Kaliyaperumal (2012). The traffic intensity have beenstudied using the measured data and B-WIM in Gonzalez (2011).
3.2 Numerical example
To show the merit of the strategies proposed in the appended papers, a superficialassessment of the fatigue life for one specific detail in the Söderström Bridge ispresented. The detail is the connection of the bracing to the mid span of thestringer beams as shown in Figure 3.4. This detail has in the theoretical assessment(Andersson, 2009) and in the evaluation based on measurements (Leander, 2008)shown to be decisive for the fatigue life.
The stringer beams are continuous along the bridge between splices at the middleof each main span. The longest stringers are about 33,7 meters divided in 10spans between the crossbeams. A simplified two dimensional structural analysis isperformed using the routine presented in Paper I. The load considered is a fullyloaded X60 train which is the most frequent train on the bridge. Figure 3.5 showsthe calculated stress variation caused by the train passage at a point correspondingto gauge 35 in the monitoring program (Leander, 2008). The quasi static responseis the static response multiplied with a DAF of 1,13 calculated in compliance withEN 1991-2, Annex D. The dynamic analysis is performed considering the first 100modes which has frequencies in the range 120Hz to 2600Hz. A damping ratio of0,5% is used as suggested in CEN (2010).

3.2. NUMERICAL EXAMPLE 29
(a) A photo of the joint. (b) A cutting from the original drawings.
Figure 3.4: The connection of the bracing to the mid span of the stringer.
A thorough review of Figure 3.5 shows that the dynamic response is oscillatingaround the static response while the quasi static response is a uniform enlargementof the static response. Furthermore, apparently the train passage causes mainlycompressive stresses. However, since it is a welded detail to be checked and thestress state due to residual stresses is unknown the whole stress range is assumeddetrimental.
A cycle counting using the rainflow method (Matsuishi and Endo, 1968) is per-formed and the accumulated damage is calculated in compliance with EN 1993-1-9,Annex A. The partial safety factors are set to γFf = 1 and γMf = 1.35 for the loadeffect and the strength, respectively. The detail category is estimated to 40, seedetail 5 in EN 1993-1-9, Table 8.4. The predicted number of passages to failure isNp = 120 000 and Np = 193 000 for the quasi static and the dynamic stress history,respectively. The dynamic analysis allows about 60% more passages. With a con-servative estimate of 520/2 trains passing on each track every day, and every trainis a fully loaded X60 train, the service life is merely 1,3 years and 2 years for thequasi static and the dynamic stress history, respectively.
The calculation presented so far is afflicted with several uncertainties. The struc-tural analysis is a crude simplification of the complex interaction between thestringers, crossbeams and main beams. The load is generalized to a single fullyloaded X60 and the dynamic effects are calculated without any vehicle–track–bridgeinteraction and without any rail roughness. By monitoring, as treated in paper IIand Paper III, a response is attained including the effects of these uncertainties.A comparison between the theoretically calculated dynamic response and the mea-sured response on the real bridge at the same location is show in Figure 3.6. Theloaded state of the real X60 train is unknown.
The comparison in Figure 3.6 shows a relatively good agreement. The structural

30 CHAPTER 3. CASE STUDY: THE SÖDERSTRÖM BRIDGE
0 1 2 3 4 5 6 7 8 9 10 11−30
−20
−10
0
10
t/s
S/M
Pa
(a) The whole train passage.
0 0.1 0.2 0.3 0.4 0.5 0.6 0.7 0.8 0.9 1−30
−20
−10
0
10
t/s
S/M
Pa
StaticDynamicQuasi static
(b) The first second of the train passage.
Figure 3.5: The theoretically calculated stress in a stringer beam for a passage ofthe Swedish X60 commuter train.
model reflects the overall behavior of the beam even though the crests and valleysattain slightly different peak values. The predicted number of passages for themeasured response of one single X60 train is Np = 190 000, slightly less than forthe theoretical dynamic response. To capture the effect of a varying traffic intensityand various vehicles, a long term monitoring was employed. During the 43 dayslong monitoring period in 2008, about 17 000 vehicles were registered. Figure 3.7shows the measured stress range spectra for the whole period and the theoreticalresponse for the same number of passages but all of them as X60 trains.
The spectrum from measurements shown in Figure 3.7 has a few cycles with higherstress ranges than the theoretical spectra. It also has more cycles in total. As

3.2. NUMERICAL EXAMPLE 31
0 1 2 3 4 5 6 7 8 9 10 11−30
−20
−10
0
10
t/s
S/M
Pa
MeasuredTheoretical
Figure 3.6: The measured stress at gauge 35 for a passage of an X60 train, and thetheoretically calculated stress at the same location.
0 0.5 1 1.5 2 2.5 3 3.55
0
10
20
30
40
50
N/10
S r/M
Pa
Theor., dynamicTheor., quasi staticMeasured
Figure 3.7: Stress range spectrum for the measured stress of real traffic and theo-retical stress range spectra for X60 passages.
expected, the theoretical spectra have the majority of cycles allocated at a fewstress ranges. The median passage based on the measurements can pass the bridgeabout Nep = 216 000 times.
So far this example is based on a detail category of 40 in compliance with EN1993-1-9. By considering the descriptive detail category in Paper IV the fatigue

32 CHAPTER 3. CASE STUDY: THE SÖDERSTRÖM BRIDGE
strength at 2 million cycles can be raised to SC = 47MPa. This gives an increase inthe allowed number of passages to Nep = 368 000 for the measured stress spectrum.Decreasing the partial safety factors in accordance to Paper V further increases theallowed number of passages to Nep = 399 000, and Nep = 720 000 for γFfγMf = 1.32and γFfγMf = 1.14, respectively. The latter can be allowed in combination withreoccurring inspections.
A further enhancement is to change the safety format from the semi-probabilisticlevel I method to a level II method using the FORM. The full spectrum approachin Paper V gives a reliability index for the measured stress range spectrum asshown in Figure 3.8. The stochastic variables are defined in Table 1 in Paper V.The influence of the target reliability levels as well as the influence of the fatiguestrength is apparent in the figure. With a fatigue strength of SC = 40MPa thetarget values are reached after Nep = 244 000 and Nep = 420 000 passages forβ = 3.1 and β = 2.3, respectively. For a fatigue strength of SC = 47MPa thecorresponding number of cycles is Nep = 436 000 and Nep = 848 000, respectively.A summary of the results is given in Table 3.1.
0 2 4 6 8 10 120
1
2
3
4
5
Nep /105
β
SC = 40 MPa
SC = 47 MPa
β = 2.3
β = 3.1
Figure 3.8: The reliability index as a function of number of vehicle passages Nepcalculated for the measured stress range spectra for gauge 35.
The quasi static structural analysis in combination with a deterministic evaluationas suggested in the standards (Trafikverket, 2013), gives as expected the shortestfatigue life. For each suggested enhancement the fatigue life is gradually increasingas shown in Table 3.1. Reducing the uncertainties in the behavior of the structureand the actual loading by considering long term monitoring increases the fatiguelife from 1,3 years to 2,7 years. Using a more refined detail category further increasethe fatigue life to 4,5 years. The reliability analysis presented in Paper V suggests

3.2. NUMERICAL EXAMPLE 33
Table 3.1: Predicted fatigue life for the detail at the location for gauge 35.Nep = Number of passages, F.L.= Fatigue Life.
Method Traffic SC/MPa γFfγMf Nep/1000 F.L./yearsDeterministic- Quasi static X60 40 1,35 120 1,3- Dynamic X60 40 1,35 193 2- Measured X60 40 1,35 190 2Deterministic Real 40 1,35 216 2,7
Real 47 1,35 368 4,5Real 47 1,32 399 4,9Real 47 1,14 720 8,9
FORM Real 40 β = 3.1 244 3Real 40 β = 2.3 420 5,2Real 47 β = 3.1 436 5,7Real 47 β = 2.3 848 10,5
lower partial safety factors which further increases the fatigue life to 8,9 years and4,9 years in combination with or without inspections, respectively. Calibrating theresult to the specified target reliabilities render the corresponding fatigue lives of10,5 years and 5,7 years respectively. In comparison to the quasi static deterministicprediction, the reliability-based method increases the fatigue life by a factor of 8when reoccurring inspections are presupposed.
It should be noted that the values presented for the theoretical calculations arebased on a crude simplification of the structure. A more refined model consideringthe three dimensional behavior of the structure might decrease the gap between thetheoretically calculated response and the measured one. However, the variation intraffic intensity and the influence of different vehicles still needs to be estimated.The results presented are, furthermore, valid only for the conditions and propertiesof the specified detail. However, the outcome shows an evident tendency of anincreased fatigue life.
The result shows a severely limited fatigue life. Despite the strong indications ofdamage, the inspections have not revealed any fatigue cracks at the studied detail.This discrepancy could be explained by inaccurate detection methods. However,a more plausible explanation is the conservative assumption regarding compressivestresses. If no tensional residual stress exists at the critical initiation point or ifrelaxation has occurred, the compressive part of the remote stress variation will notcontribute to any crack growth. This is a matter for further research as suggested

34 CHAPTER 3. CASE STUDY: THE SÖDERSTRÖM BRIDGE
in Section 4.2.
Chapter 4
Conclusions
4.1 General conclusions
The purpose of this thesis is to propose enhancements to the fatigue assessmentprocedure with the overall aim of reaching a longer fatigue life. The focus lies onmeasurements to determine the actual stress state in a structure and the incorpo-ration of the outcome in the assessment. The following conclusions are based onthe studies of dynamics of short bridge beams in Paper I, the processing of mea-sured data in Papers II and III, the refined fatigue assessment based on LEFMin Paper IV, and the reliability-based assessment in Paper V. For more specificconclusions the reader is referred to the appended papers.
• The studies on dynamics have shown fundamentally different behavior of sim-ply supported and continuous beams. For typical continuous beams in opendeck bridges, a dynamic analysis gives a considerably lower response than thequasi static method in the standards. The quasi static approach developedfor simply supported beams gives an overly conservative response and seemsinappropriate for fatigue assessment of continuous beams.
• The monitoring campaign of the Söderström Bridge has produced a vastamount of data. It did not fulfill the expectation of more favorable stressrange spectra than the previous theoretical studies presented in Andersson(2009). It has, however, given important insight in the behavior of the struc-ture and the properties of the traffic.
• Sections in the stringer beams have the highest indication of fatigue damage,both in the previous theoretical calculations (Andersson, 2009) and from the
35

36 CHAPTER 4. CONCLUSIONS
measurements. No indication of damage has, however, been found on thestringers during inspection.
• A method based on established statistical methods for sorting out deviantspectra is suggested in Paper III. The procedure is shown to effectively finddeviations caused by electrical disturbance as well as geometrical effects.
• A model for estimating the convergence progress of a stress range spectrumis presented. The model is intended for validation of the spectrum duringoperation of the monitoring system. It can also be used for a convergencecheck after a finalized measurement campaign. The rate of convergence for astress range spectrum can vary substantially between different structural partsand gauge locations. In compliance with Trafikverket (2013), a minimum ofone week is suggested. However, for some cases the results presented indicatelonger required duration.
• In Paper IV a parametrical formula for the stress intensity factor (SIF) ispresented for a cracked joint with a welded in-plane attachment. The SIFcan be used for fatigue assessment by LEFM in combination with a fatiguecrack growth law. The parametrical formula shows, e.g., that a decreasinglength of the attached plate gives a decreasing stress intensity. A decreasingthickness ratio between the attached plate and the main plate gives the sametendency.
• The reliability-based model for fatigue assessment suggested in Paper V isbased on a full spectrum consideration and a bilinear fatigue endurance. Theoften used approach based on an effective, or equivalent, stress range is shownto be overly conservative for some cases. Continuous distributions fitted tothe measured response gives inconsistent reliabilities, conservative for somecases and unconservative for others.
• The highest importance indicated by the sensitivity factors from the relia-bility analysis is gained for K1, representing the fatigue endurance in themodel. Thereafter comes in order the accumulated damage ∆ and the stressuncertainty XS.
Besides the conclusions stated above the study have given some practical contribu-tions. In Paper IV a descriptive detail category is derived by LEFM and a fictitiousinitial crack size fitted to test results from similar details. A contribution of Pa-per V is the suggested partial safety factors to be used for deterministic fatigueassessment based on measured stresses.

4.2. FURTHER RESEARCH 37
4.2 Further research
The first two suggestions for further research given below are motivated by thesensitivity analysis in Paper V. The greatest values for the sensitivity factors aregained for the fatigue endurance and the accumulated damage. The final suggestionis related to the fundamental assumption of high residual stresses in assessment ofwelded structures.
Object specific fatigue endurance
The standard deviation used for the fatigue endurance in Paper V is a universalvalue suggested in DNV (2011). Object specific testing of the studied detail withdimensions appropriate for bridges would hopefully reduce the scatter in the fatigueendurance, or at least suggest a value appropriate for the specific detail.
Damage accumulation for bridge specific loads
The stochastic variable for the accumulated damage is commonly assigned prop-erties suggested in Wirsching (1984). Studies have, however, shown a strong de-pendency on the load characteristics (Sonsino, 2006; Zhang and Maddox, 2009).To increase the knowledge of the accumulated damage variable, variable amplitudefatigue tests with load histories adequate for bridges are suggested. The loadingsequence on bridges is typically recurrent over time.
Influence of residual stresses
As stated in Section 1.2, a conservative approach regarding the influence of residualstresses has been adopted, always assuming the whole stress range acting in tension.Structural parts subjected to mainly compressive remote stresses can thereby bedecisive for the fatigue life, e.g., the joint at the mid span of the stringers on theSöderström Bridge. Intuitively, a failure in that joint is not likely but cannot beproved safe without knowing the stress field due to residual stresses.
For a precise assessment of the fatigue life the influence of residual stresses should beconsidered. The importance have been emphasized in, e.g., Barsoum and Barsoum(2009) and Sonsino (2009). At the same time, studies have shown indications onrelaxing residual stresses under variable amplitude loading (Kihl and Sarkani, 1999;

38 CHAPTER 4. CONCLUSIONS
Sonsino, 2009; Zhang and Maddox, 2009). The influence of typical bridge loadingon this matter is an urgent field to study for more precise life predictions.

Bibliography
AASHTO, 2003. Guide manual for condition evaluation and load and resistancefactor rating (LRFR) of highway bridges. Washington, D.C.
Al-Emrani, M., 2006. Utmattningskritiska brodetaljer i stål, in Swedish. Report2006:7, Chalmers University of Technology.
Al-Emrani, M., Kliger, R., 2009. Fatigue prone details in steelbridges. In: Nordic Steel Construction Conference. pp. 112–119,http://www.nordicsteel2009.se/pdf/147.pdf.
Allen, D. E., 1993. Safety criteria for the evaluation of existing structures. In:Proceedings of IABSE Colloquium on Remaining Structural Capacity. Vol. 67.pp. 77–84.
Alpsten, G., 1974. Utmattningsdimensionering enligt nya Byggsvetsnormen–experimentell bakgrund och beräkningsfilosofi, in Swedish. Väg- och vattenbyg-garen (11).
Anderson, T., 2005. Fracture mechanics: fundamentals and applications. Taylor &Francis, Boca Raton, Fla.
Andersson, A., 2009. Fatigue assessment of railway bridges (Utmattningsanalys avjärnvägsbroar, en fallstudie av stålbroarna mellan Stockholm Central och SöderMälarstrand, baserat på teoretiska analyser och töjningsmätningar, in Swedish.Licentiate thesis, KTH Royal Institute of Technology, TRITA-BKN. Bulletin 96.
Andersson, A., Leander, J., Karoumi, R., 2013. Extending the fatigue service lifeof a railway bridge by local approaches. In: Proceedings of IABSE Colloquiumon Assessment, Upgrading and Refurbishment of Infrastructures. Vol. 99.
Aygül, M., 2012. Fatigue analysis of welded structures using the finite elementmethod. Licentiate thesis, Chalmers University of Technology, Lic.No: 2012:4.
Banverket, 2007. Citybanan i Stockholm – Järnvägsplan, in Swedish. Diarienr: F07-1809/SA20.
39

40 BIBLIOGRAPHY
Barsoum, Z., 2008. Residual stress analysis and fatigue assessment of welded steelstructures. Doctoral thesis, KTH Royal Institute of Technology, TRITA-AVE2008:11.
Barsoum, Z., Barsoum, I., 2009. Residual stress effects on fatigue life of weldedstructures using LEFM. Engineering Failure Analysis 16 (1).
Basquin, O. H., 1910. The exponential law of endurance tests. Proc. Annual Meet-ing, American Society for Testing Materials 10, 625–630.
Bowness, D., Lee, M., 2000. Prediction of weld toe magnification factors for semi-elliptical cracks in T-butt joints. International Journal of Fatigue 22 (5), 369–387.
Brodtkorb, P., Johannesson, P., Lindgren, G., Rychlik, I., Rydén, J., Sjö, E., 2000.WAFO - a Matlab toolbox for the analysis of random waves and loads. In: Proc.10’th Int. Offshore and Polar Eng. Conf., ISOPE, Seattle, USA. Vol. 3. pp. 343–350.
BSi, 2005. BS 7910 Guide to methods for assessing the acceptability of flaws inmetallic structures.
CEN, 2004. EN 1990. Eurocode – Basis of structural design. European committeefor standardization (CEN), Brussels.
CEN, 2006. EN 1993-1-9. Eurocode 3: Design of steel structures–Part 1.9: Fatigue.European committee for standardization (CEN), Brussels.
CEN, 2010. EN 1991-2. Eurocode 1: Action on structures–Part 2: Traffic loads onbridges. European committee for standardization (CEN), Brussels.
Chan, T., Li, Z., Ko, J., 2001. Fatigue analysis and life prediction of bridges withstructural health monitoring data – part ii: application. International Journal ofFatigue 23 (1), 55–64.
Connor, R. J., Fisher, J. W., 2006. Identifying effective and ineffective retrofits fordistortion fatigue cracking in steel bridges using field instrumentation. Journalof Bridge Engineering 11 (6), 745–752.
Diamantidis, D., Bazzurro, P., 2007. Safety acceptance criteria for existing struc-tures. Workshop on Risk Acceptance and Risk Communication, Stanford Univer-sity, USA.
Ditlevsen, O., Madsen, H., 2005. Structural Reliability Methods. Technical Univer-sity of Denmark, http://www.web.mek.dtu.dk/staff/od/books.htm.
DNV, 2011. Fatigue design of offshore steel structures.
Downing, S. D., Socie, D. F., 1982. Simple rainflow counting algorithms. Interna-tional Journal of Fatigue 4 (1).

BIBLIOGRAPHY 41
Dunker, K. F., Rabbat, B. G., 1993. Why America’s bridges are crumbling. ScienificAmerican 268 (3), 66–72.
Ekelund, T., 2008. Rapport–särskild inspektion, Bro över Söderström, Ulriks-dal – Stuvsta, oförstörande provning av östra huvudbalken, livavstyvningar, inSwedish. Rapport 104032-2, Projektengagemang Anläggning i Stockholm AB.
Farhey, D. N., 2007. Quantitative assessment and forecast for structurally defi-cient bridge diagnostics. Structural Health Monitoring – An International Journal6 (1), 39–48.
Fatemi, A., Yang, L., 1998. Cumulative fatigue damage and life prediction theories:a survey of the state of the art for homogeneous materials. International Journalof Fatigue 20 (1), 9–34.
Fisher, J. W., 1984. Fatigue and fracture in steel bridges – Case studies. John Wiley& Sons, Inc.
Fisher, J. W., Albrecht, P. A., Yen, B. T., Klingerman, D. J., McNamee, B. M.,1972. Effect of weldements on the fatigue strength of steel beams – transversestiffeners and attachments. Fritz Engineering Laboratory Report 334.10, LehighUniversity.
Fisher, J. W., Frank, K. H., Hirt, M. A., McNamee, B. M., 1970. Effect of welde-ments on the fatigue strength of steel beams. NCHRP Report 102, HighwayResearh Board, Washington (DC).
Folsø, R., Parmentier, G., 2002. Reliability-based calibration of fatigue designguidelines for ship structures. Marine Structures 15 (6), 627–651.
Frangopol, D. M., Strauss, A., Kim, S., 2008. Bridge reliability assessment basedon monitoring. Journal of Bridge Engineering 13 (3), 258–270.
Frýba, L., 1996. Dynamics of railway bridges. Thomas Telford.
Fricke, W., Cui, W., Kierkegaard, H., Kihl, D., Koval, M., Mikkola, T., Parmentier,G., Toyosada, M., Yoon, J., 2002. Comparative fatigue strength assessment ofa structural detail in a containership using various approaches of classificationsocieties. Marine Structures 15 (1), 1–13.
Gonzalez, I., 2011. Study and application of modern bridge monitoring techniques.Licentiate thesis, KTH Royal Institute of Technology, TRITA-BKN. Bulletin 110.
Grimm, M., Wahlborg, M., 2009. Kapacitetssituationen 2009, Banverkets järn-vägsnät, in Swedish. Report, Banverket Leveransdivisionen.
Hasofer, A. M., lind, N. C., 1974. Exact and invariant second-moment code format.Journal of the Engineering Mechanics Division 100 (1), 111–121.

42 BIBLIOGRAPHY
Helmerich, R., Kühn, B., Nussbaumer, A., 2007. Assessment of existing steel struc-tures. a guideline for estimation of the remaining fatigue life. Structure and In-frastructure Engineering 3 (3), 245–255.
Herwig, A., Brühwiler, E., 2011. In-situ dnamic behavior of a railway bridge girderunder fatigue causing traffic loading. In: Faber, Köhler, Nishijima (Eds.), 11thInternational Conference on Applications of Statistics and Probability in CivilEngineering. pp. 389–396.
Hirt, M. A., Yen, B. T., Fisher, J. W., 1971. Fatigue strength of rolled and weldedsteel beams. Journal of the Structural Division 97 (7), 1897–1911.
Hobbacher, A. F., 1993. Stress intensity factors of welded joints. Engineering Frac-ture Mechanics 46 (2).
Hobbacher, A. F., 2008. Recommendations for fatigue design of welded jointsand components. International Institute of Welding, Paris, IIW document XIII-2151r4-07/XV-1254r4-07.
Imam, B. M., Kaliyaperumal, G., 2012. Fatigue assessment of a railway bridgedetail using dynamic analysis and probabilistic fracture mechanics. In: Biondini,F., Frangopol, D. M. (Eds.), Bridge Maintenance, Safety, Management, Resilienceand Sustainability - Proceedings of the Sixth International Conference on BridgeMaintenance, Safety and Management. pp. 3206–3213.
ISO 13822, 2010. Bases for design of structures – Assessment of existing structures.
James, M. N., Hughes, D. J., Chen, Z., Lombard, H., Hattingh, D. G., Asquith,D., Yates, J. R., Webster, P. J., 2007. Residual stresses and fatigue performance.Engineering Failure Analysis 14 (2), 384–395.
Johansson, C., Pacoste, C., Karoumi, R., 2013. Closed-form solution for the modesuperposition analysis of the vibration in multi-span beam bridges caused byconcentrated moving loads. Computers and Structures 119, 85–94.
JRC–ECCS, 2008. Assessment of Existing Steel Structures: Recommendations forEstimation of Remaining Fatigue Life. Prepared under the JRC–ECCS coopera-tion agreement for the evolution of Eurocode 3.
Kaliyaperumal, G., Imam, B., Righiniotis, T., 2011. Advanced dynamic finite el-ement analysis of a skew steel railway bridge. Engineering Structures 33 (1),181–190.
Karoumi, R., Wiberg, J., Liljencrantz, A., 2005. Monitoring traffic loads anddynamic effects using an instrumented railway bridge. Engineering Structures27 (12).

BIBLIOGRAPHY 43
Kihl, D. P., Sarkani, S., 1999. Mean stress effects in fatigue of welded steel joints.Probabilistic Engineering Mechanics 14 (1–2).
Klatter, L., Vrouwenvelder, T., Van Noortwijk, J. M., 2009. Societal and reliabilityaspects of bridge management in the Netherlands. Structure and InfrastructureEngineering 5 (1), 11–24.
Ko, J. M., Ni, Y. Q., 2005. Technology developments in structural health monitoringof large-scale bridges. Engineering Structures 27 (12).
Kwon, K., Frangopol, D. M., 2010. Bridge fatigue reliability assessment using prob-ability density functions of equivalent stress range based on field monitoring data.International Journal of Fatigue 32 (8), 1221–1232.
Lassen, T., Recho, N., 2006. Fatigue life analyses of welded structures. ISTE Ltd.
Leander, J., 2008. Bro över Söderström, mätning och utvärdering m.a.p. utmat-tning, in swedish. TRITA-BKN. Rapport 126, Kungliga Tekniska högskolan.
Leander, J., 2010. Improving a bridge fatigue life prediction by monitoring. Licen-tiate thesis, KTH Royal Institute of Technology, TRITA-BKN. Bulletin 106.
Li, Z., Chan, T., Ko, J., 2001. Fatigue analysis and life prediction of bridges withstructural health monitoring data – part i: methodology and strategy. Interna-tional Journal of Fatigue 23 (1), 45–53.
Liljencrantz, A., Karoumi, R., Olofsson, P., 2007. Implementing bridge weigh-in-motion for railway traffic. Computers & Structures 85 (1–2).
Liu, K., Zhou, H., Shi, G., Wang, Y., Shi, Y., De Roeck, G., 2013. Fatigue assess-ment of a composite railway bridge for high speed trains. part ii: Conditions forwhich a dynamic analysis is needed. Journal of Constructional Steel Research 82,246–254.
Liu, M., Frangopol, D. M., Kwong, K., 2010. Fatigue reliability assessment ofretrofitted steel bridges integrating monitored data. Structural Safety 32 (1).
Malm, R., Andersson, A., 2006. Field testing and simulation of dynamic propertiesof a tied arch railway bridge. Engineering Structures 28 (1), 143–152.
Martinsson, J., 2005. Fatigue assessment of complex welded steel structures. Ph.D.thesis, KTH Royal Institute of Technology, TRITA-AVE 2005:02.
Matsuishi, M., Endo, T., 1968. Fatigue of metals subjected to varying stress. Paperpresented to Japan Soc Mech Engrs Jukvoka.
Melchers, R. E., 2002. Structural reliability analysis and prediction. John Wiley &Sons, Inc., West Sussex.

44 BIBLIOGRAPHY
Miner, M. A., 1945. Cumulative damage in fatigue. Journal of Applied Mechanics12 (1).
Moses, F., Schilling, C. G., Raju, K. S., 1987. Fatigue evaluation procedures forsteel bridges. NCHRP Report 299, Transportation Research Board, Washington(DC).
Murakami, Y., 1987. Stress intensity factors handbook. Pergamon Press, Oxford.
Niemi, E., 1995. Stress determination for fatigue analysis of welded components.Abington Publishing, Cambridge, IIW document XIII-1458-92/XV-797-92.
Nilsson, F., 2001. Fracture mechanics – from theory to applications. Depatment ofSolid Mechanics, KTH.
Nilsson, R., 1969. Collection of experimental data on fatigue strength coveringlaboratory investigations. In: Monograph on fatigue strength of welds. RoyalSwedish Academy of Engineering Sciences, p. 035.
ORE, 1970. Question D 23, Determination of dynamic forces in bridges. Report no.17, Office for Research and Experiments.
Palmgren, A., 1924. Die Lebensdauer von Kugellagern. VDI Zeitschrift 68 (14).
Paris, P. C., Gomez, M. P., E., A. W., 1961. A rational analytic theory of fatigue.The Trend in Engineering 13 (1).
Partanen, T., Niemi, E., 1996. Hot spot stress approach to fatigue strength analysisof welded components: fatigue test data for steel plate thicknesses up to 10 mm.Fatigue & Fracture fo Enginnering Materials & Structures 19 (6), 709–722.
Radaj, D., Sonsino, C. M., Flade, D., 1998. Prediction of service fatigue strengthof a welded tubular joint on the basis of the notch strain approach. InternationalJournal of Fatigue 20 (6), 471–480.
Radaj, D., Sonsino, C. M., Fricke, W., 2009. Recent developments in local conceptsof fatigue assessment of welded joints. International Journal of Fatigue 31 (1),2–11.
Rao, S. S., 2007. Vibration of continuous systems. John Wiley & Sons, Inc., NewYork.
Rooke, D., Cartwright, D., 1976. Compendium of stress intensity factors. HerMajesty’s Stationary Office, London.
Rychlik, I., 1987. A new definition of the rainflow cycle counting method. Interna-tional Journal of Fatigue 9 (2).

BIBLIOGRAPHY 45
Safi, M., 2013. Excerpt from the Swedish bridge and tunnel management system(BaTMan). Unpublished.
Schaub, C., 1951. Några synpunkter på utmattningshållfastheten hos konstruktion-sstål i svetsat tillstånd, in Swedish. Svetsen 10 (1), 3–7.
Schilling, C. G., Klippstein, K. H., 1977. Fatigue of steel beams by simulated bridgetraffic. Journal of the Structural Division – ASCE 103 (ST8), 1561–1575.
Schütz, W., 1996. A history of fatigue. Engineering Fracture Mechanics 54 (2).
Schumacher, A., Nussbaumer, A., 2006. Experimental study on the fatigue be-haviour of welded tubular k-joints for bridges. Engineering Structures 28 (5),745–755.
Sonsino, C., 2006. Fatigue testing under variable amplitude loading. InternationalJournal of Fatigue 29 (1), 1080–1089.
Sonsino, C., 2009. Effect of residual stresses on the fatigue behaviour of weldedjoints depending on loading conditions and weld geometry. International Journalof Fatigue 31 (1).
Sørensen, J. D., 2004. Notes in structural reliability theory and risk analysis. Aal-borg.
Sørensen, J. D., 2012. Reliability-based calibration of fatigue safety factors foroffshore wind turbines. International Jounal of Offshore and Polar Engineering22 (3), 234–241.
StBK-N2, 1974. Byggsvetsnorm, in Swedish. Statens Stålbyggnadskommitté ochSvetskommissionen, AB Svensk Byggtjänst.
Stephens, R. I., Fatemi, A., Stephens, R. R., Fuchs, H. O., 2001. Metal fatigue inengineering. John Wiley & Sons, Inc.
Suresh, S., 1998. Fatigue of materials. Cambridge University Press, Cambridge.
Sustainable Bridges, 2007a. European Railway Bridge Demography. SustainableBridges – a project within EU FP6, http://www.sustainablebridges.net.
Sustainable Bridges, 2007b. Guideline for Load and Resistance Assessment of Exist-ing European Railway Bridges. Sustainable Bridges – a project within EU FP6,http://www.sustainablebridges.net.
Svetskommissionen, 1949. Normer för projektering, utförande och kontroll av svet-sade stålkonstruktioner till byggnadsverk (Byggsvetsnormer), in Swedish. Svet-skommissionen.

46 BIBLIOGRAPHY
Tada, H., Paris, P. C., Irwin, G. R., 2000. The stress analsyis of cracks handbook.Professional Engineering Publishing.
Timoshenko, S. P., 1921. On the correction for shear of the differential equation fortransverse vibrations of prismatic bars. Philosophical Magazine XLI.
Tobias, D. H., 1994. A method for the fatigue evaluation of riveted steel girderrailway bridges. Ph.D. thesis, University of Illinois at Urbana-Champaign.
Tobias, D. H., Foutch, D. A., 1997. Reliability-based method for fatigue evaluationof railway bridges. Journal of Bridge Engineering 2 (2).
Toft, H. S., Sørensen, J. D., 2012. Reliability-based assessment of fatigue life forbridges. In: Biondini, F., Frangopol, D. M. (Eds.), Bridge Maintenance, Safety,Management, Resilience and Sustainability - Proceedings of the Sixth Interna-tional Conference on Bridge Maintenance, Safety and Management. pp. 2609–2615.
Trafikverket, 2013. BVS 583.11 Bärighetsberäkning av järnvägsbroar, in Swedish.TRV2012/58673.
UIC, 2006. Loads to be considered in railway bridge design. Leaflet 776-1R, Inter-national union of railways.
Vrouwenvelder, T., Scholten, N., 2010. Assessment criteria for existing structures.Structural Engineering International 20 (1), 62–65.
Wallin, J., Leander, J., Karoumi, R., 2011. Strengthening of a steel railway bridgeand its impact on the dynamic response to passing trains. Engineering Structures33 (2).
Wirsching, P. H., 1984. Fatigue reliability for offshore structures. Journal of Struc-tural Engineering 110 (10), 2340–2356.
Zhang, Y.-H., Maddox, S. J., 2009. Investigation of fatigue damage to welded jointsunder variable amplitude loading spectra. International Journal of Fatigue 31 (1),138–152.
Zhao, Z., Haldar, A., Breen Jr., F. L., 1992. Fatigue-reliability evaluation of steelbridges. Journal of Structural Engineering 120 (5), 1608–1623.
Zhou, Y. E., 2006. Assessment of bridge remaining fatigue life through field strainmeasurement. Journal of Bridge Engineering 11 (6), 737–744.

Appendix I
Dynamics of thick bridge beamsand its influence on fatigue lifepredictions
Journal of Constructional Steel Research, Volume 89, October 2013
http://dx.doi.org/10.1016/j.jcsr.2013.07.012
47


Appendix II
Monitoring and enhanced fatigueevaluation of a steel railway bridge
Journal of Engineering Structures, Volume 32, Issue 3, March 2010.
http://dx.doi.org/10.1016/j.engstruct.2009.12.011
49


Appendix III
Quality assurance of measuredresponse intended for fatigue lifeprediction
Journal of Bridge Engineering, Volume 17, Issue 4, July 2012
http://dx.doi.org/10.1061/(ASCE)BE.1943-5592.0000291
51


Appendix IV
Refined fatigue assessment ofjoints with welded in-planeattachments by LEFM
International Journal of Fatigue, Volume 56, November 2013
http://dx.doi.org/10.1016/j.ijfatigue.2013.07.013
53


Appendix V
Reliability-based calibration offatigue safety factors for existingsteel bridges
Submitted to Journal of Bridge Engineering, August 2013.
55