Renewables and energy storage: An ideal marriage for a low ...
34
Renewables and energy storage: An ideal marriage for a low carbon world? Dr Joeri Rogelj, Grantham Institute for Climate Change and the Environment: What role do renewables play in keeping warming to 1.5°C? Steve Sawyer, Global Wind Energy Council: An energy system dominated by wind and solar: How can it work? Rana Adib, REN21: Renewable energy and storage – a driver for the electrification of heat and transport? Prof Evelina Trutnevyte, University of Geneva: How can we pioneer systemic innovation for renewable energy and storage? Dr Michael Whiston, Carnegie Mellon University: What are the potential co-benefits of and pathways for growth in renewables, energy storage, and fuel cells? Chair: Dr Rob Gross, Imperial College London
Transcript of Renewables and energy storage: An ideal marriage for a low ...
Renewables and energy storage: An ideal marriage for a low carbon world?
Dr Joeri Rogelj, Grantham Institute for Climate Change and the Environment: What role do renewables play in keeping warming to 1.5°C?
Steve Sawyer, Global Wind Energy Council: An energy system dominated by wind and solar: How can it work?
Rana Adib, REN21: Renewable energy and storage – a driver for the electrification of heat and transport?
Prof Evelina Trutnevyte, University of Geneva: How can we pioneer systemic innovation for renewable energy and storage?
Dr Michael Whiston, Carnegie Mellon University: What are the potential co-benefits of and pathways for growth in renewables, energy storage, and fuel cells?
Chair: Dr Rob Gross, Imperial College London
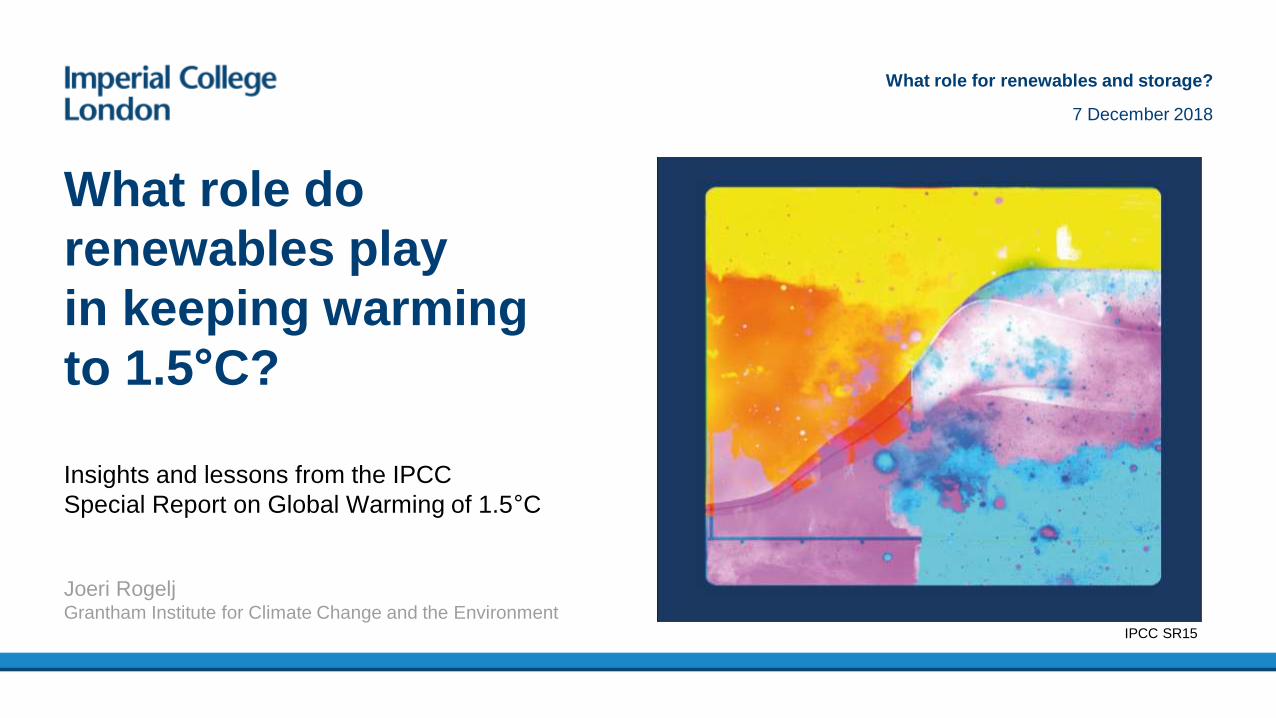
Insights and lessons from the IPCC
Special Report on Global Warming of 1.5°C
What role do
renewables play
in keeping warming
to 1.5°C?
Joeri RogeljGrantham Institute for Climate Change and the Environment
What role for renewables and storage?
7 December 2018
IPCC SR15
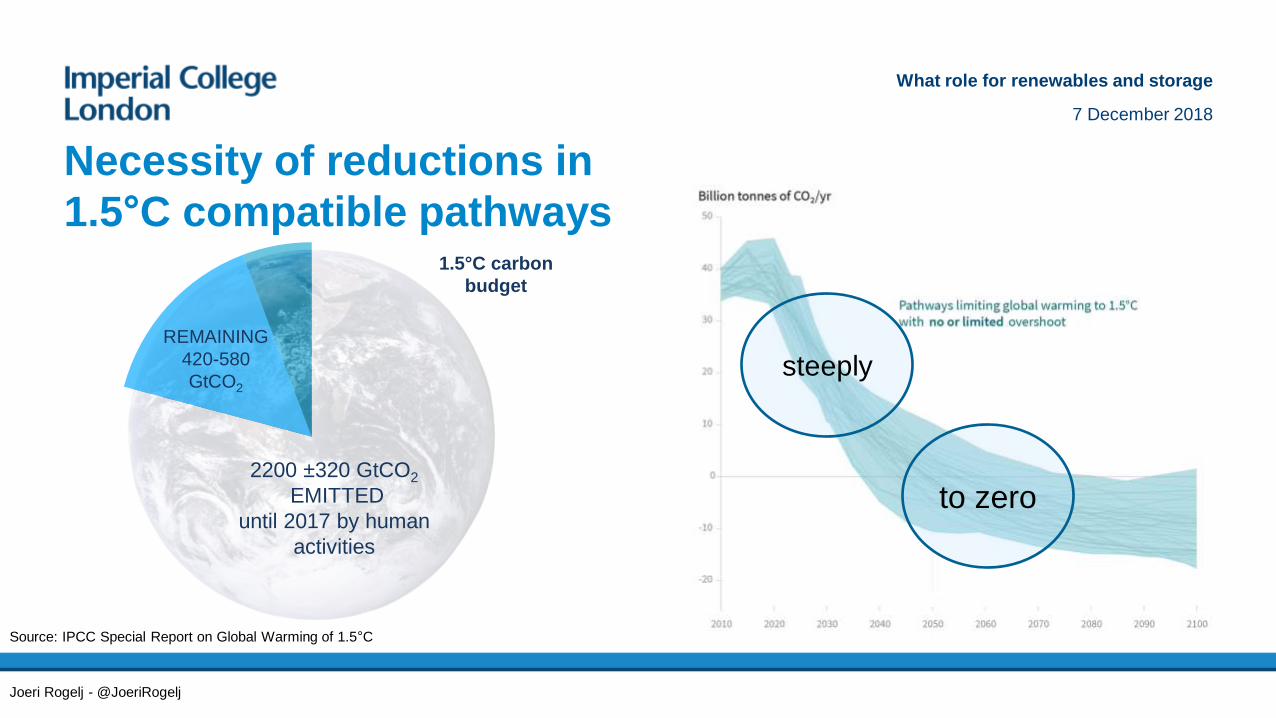
Necessity of reductions in
1.5°C compatible pathways
What role for renewables and storage
7 December 2018
2200 ±320 GtCO2
EMITTED
until 2017 by human
activities
REMAINING
420-580
GtCO2
Joeri Rogelj - @JoeriRogelj
steeply
to zero
Source: IPCC Special Report on Global Warming of 1.5°C
1.5°C carbon
budget
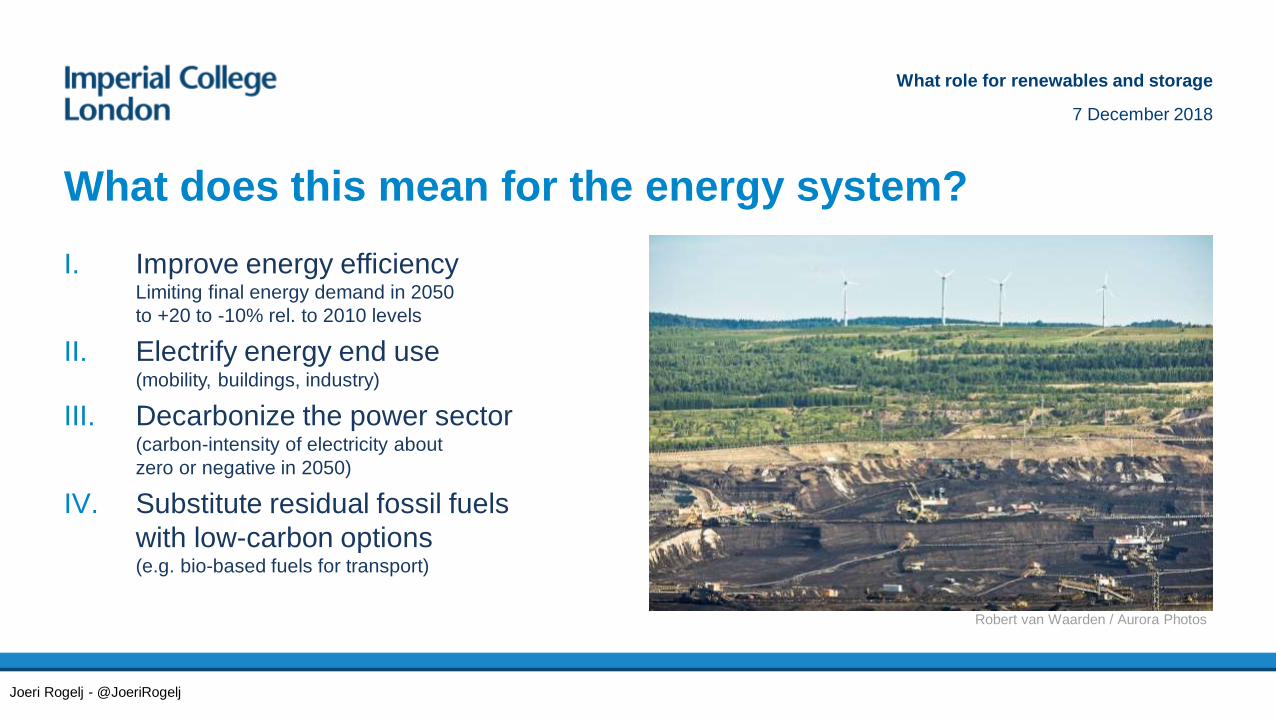
I. Improve energy efficiencyLimiting final energy demand in 2050
to +20 to -10% rel. to 2010 levels
II. Electrify energy end use (mobility, buildings, industry)
III. Decarbonize the power sector(carbon-intensity of electricity about
zero or negative in 2050)
IV. Substitute residual fossil fuels
with low-carbon options(e.g. bio-based fuels for transport)
What does this mean for the energy system?
Robert van Waarden / Aurora Photos
What role for renewables and storage
7 December 2018
Joeri Rogelj - @JoeriRogelj
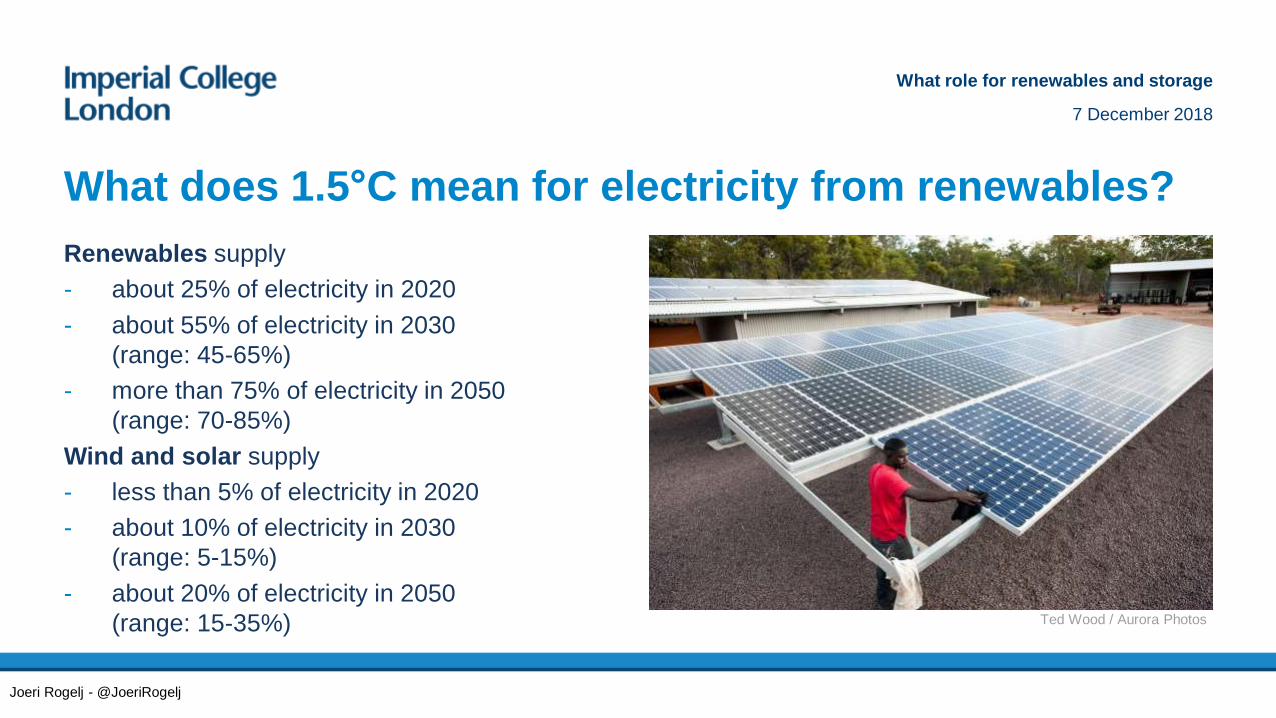
Renewables supply
- about 25% of electricity in 2020
- about 55% of electricity in 2030
(range: 45-65%)
- more than 75% of electricity in 2050
(range: 70-85%)
Wind and solar supply
- less than 5% of electricity in 2020
- about 10% of electricity in 2030
(range: 5-15%)
- about 20% of electricity in 2050
(range: 15-35%)
What does 1.5°C mean for electricity from renewables?
Ted Wood / Aurora Photos
What role for renewables and storage
7 December 2018
Joeri Rogelj - @JoeriRogelj
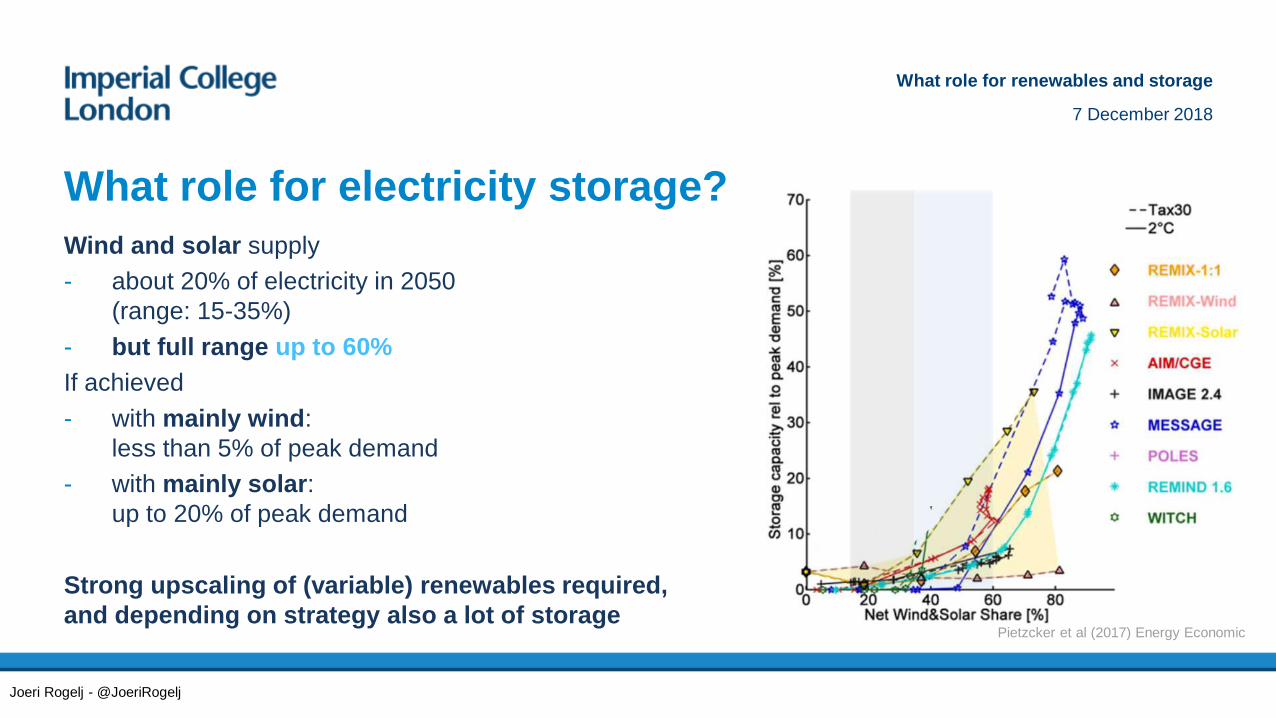
Wind and solar supply
- about 20% of electricity in 2050
(range: 15-35%)
- but full range up to 60%
If achieved
- with mainly wind:
less than 5% of peak demand
- with mainly solar:
up to 20% of peak demand
Strong upscaling of (variable) renewables required,
and depending on strategy also a lot of storage
What role for electricity storage?
Pietzcker et al (2017) Energy Economic
What role for renewables and storage
7 December 2018
Joeri Rogelj - @JoeriRogelj
Rue d’Arlon 80
1040 Brussels, Belgium
T. +32 2 213 18 97
www.gwec.net
Steve Sawyer
Senior Policy Advisor
Scaling up renewables to meet the climate
challenge:An energy system dominated by wind and solar: How can it
work?
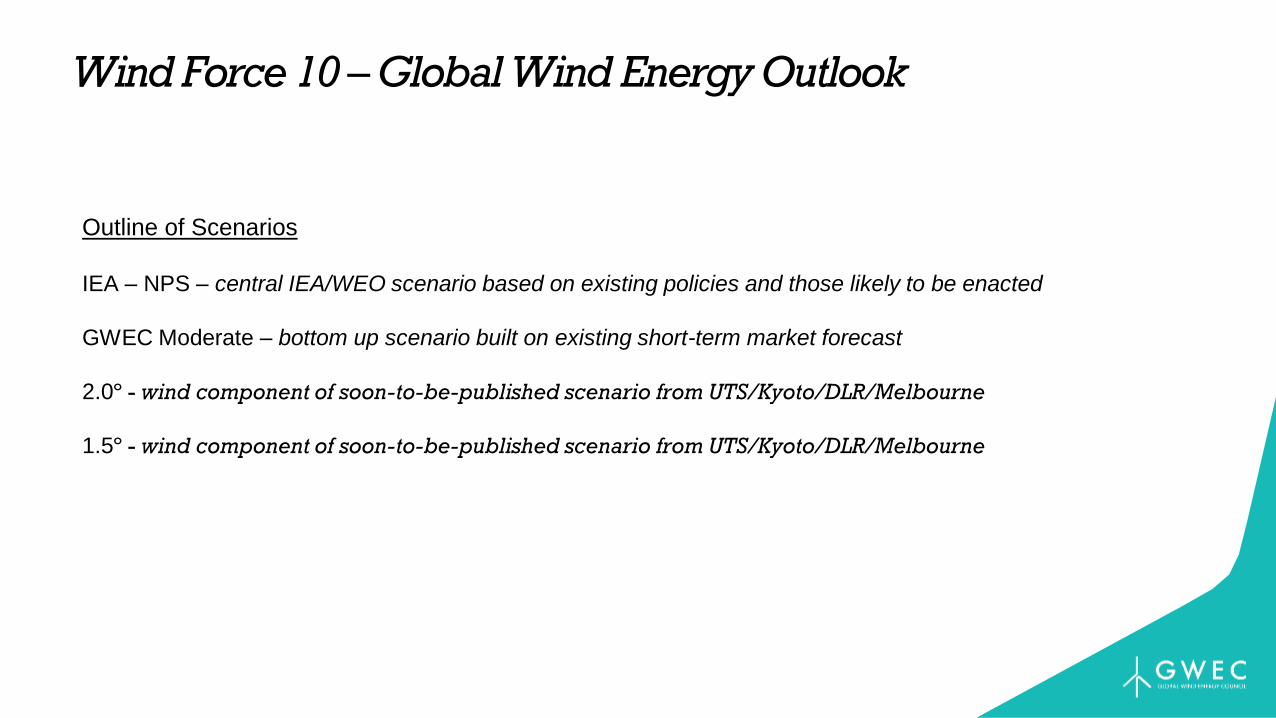
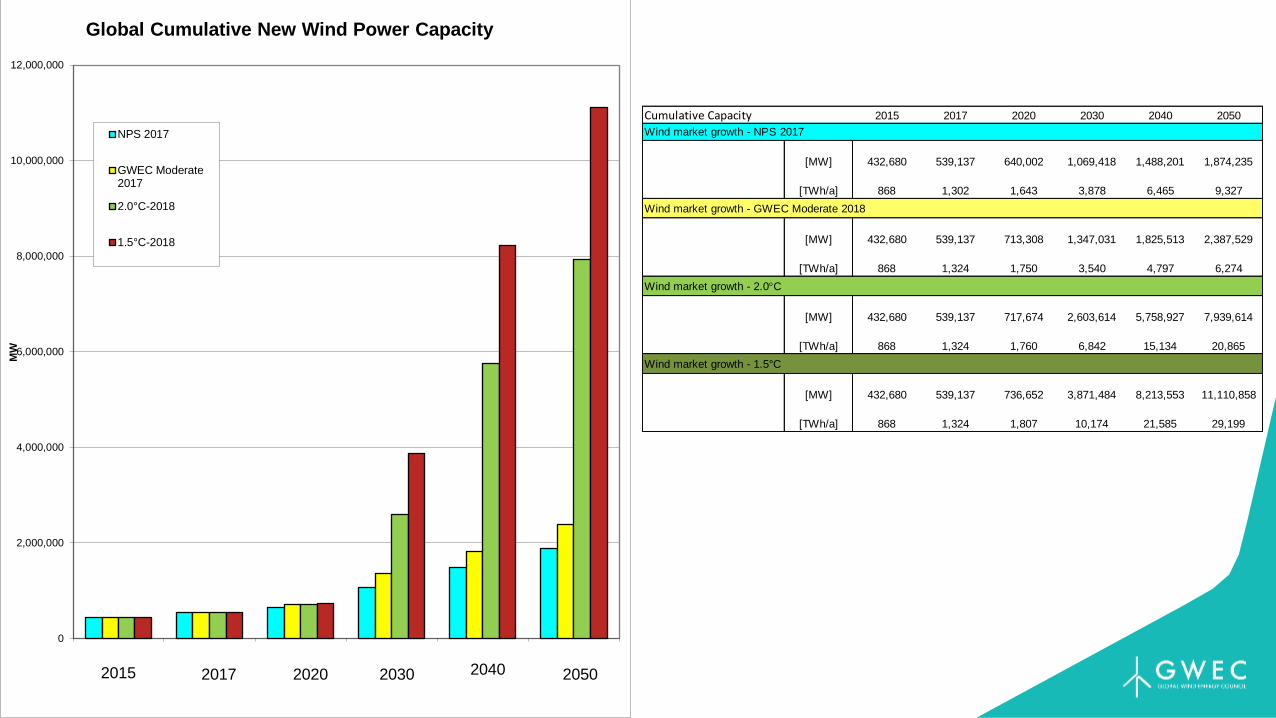
Outline of Scenarios
IEA – NPS – central IEA/WEO scenario based on existing policies and those likely to be enacted
GWEC Moderate – bottom up scenario built on existing short-term market forecast
2.0º - wind component of soon-to-be-published scenario from UTS/Kyoto/DLR/Melbourne
1.5º - wind component of soon-to-be-published scenario from UTS/Kyoto/DLR/Melbourne
Wind Force 10 –Global Wind Energy Outlook
0
2,000,000
4,000,000
6,000,000
8,000,000
10,000,000
12,000,000
MW
Global Cumulative New Wind Power Capacity
NPS 2017
GWEC Moderate2017
2.0°C-2018
1.5°C-2018
2015 2017 2020 2030 2040 2050
Cumulative Capacity 2015 2017 2020 2030 2040 2050
Wind market growth - NPS 2017
[MW] 432,680 539,137 640,002 1,069,418 1,488,201 1,874,235
[TWh/a] 868 1,302 1,643 3,878 6,465 9,327
Wind market growth - GWEC Moderate 2018
[MW] 432,680 539,137 713,308 1,347,031 1,825,513 2,387,529
[TWh/a] 868 1,324 1,750 3,540 4,797 6,274
Wind market growth - 2.0C
[MW] 432,680 539,137 717,674 2,603,614 5,758,927 7,939,614
[TWh/a] 868 1,324 1,760 6,842 15,134 20,865
Wind market growth - 1.5°C
[MW] 432,680 539,137 736,652 3,871,484 8,213,553 11,110,858
[TWh/a] 868 1,324 1,807 10,174 21,585 29,199
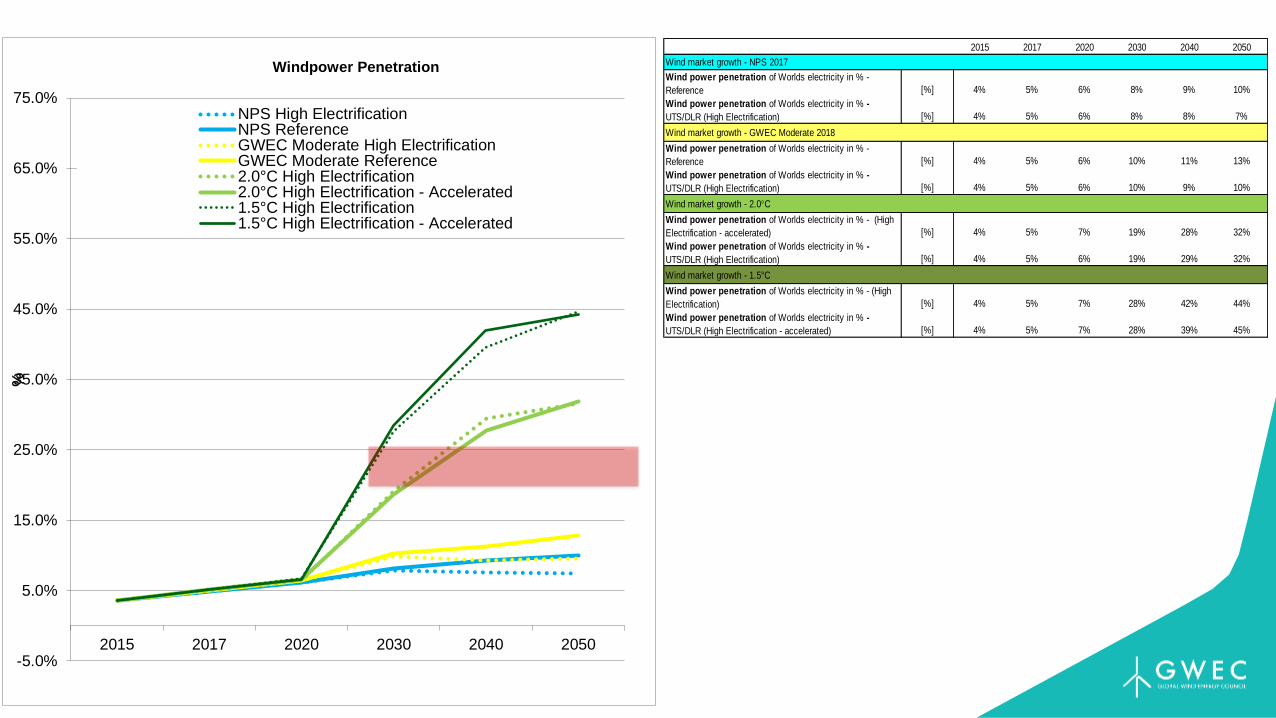
2015 2017 2020 2030 2040 2050
Wind market growth - NPS 2017
Wind power penetration of Worlds electricity in % -
Reference [%] 4% 5% 6% 8% 9% 10%
Wind power penetration of Worlds electricity in % -
UTS/DLR (High Electrification) [%] 4% 5% 6% 8% 8% 7%
Wind market growth - GWEC Moderate 2018
Wind power penetration of Worlds electricity in % -
Reference [%] 4% 5% 6% 10% 11% 13%
Wind power penetration of Worlds electricity in % -
UTS/DLR (High Electrification) [%] 4% 5% 6% 10% 9% 10%
Wind market growth - 2.0C
Wind power penetration of Worlds electricity in % - (High
Electrification - accelerated) [%] 4% 5% 7% 19% 28% 32%
Wind power penetration of Worlds electricity in % -
UTS/DLR (High Electrification) [%] 4% 5% 6% 19% 29% 32%
Wind market growth - 1.5°C
Wind power penetration of Worlds electricity in % - (High
Electrification) [%] 4% 5% 7% 28% 42% 44%
Wind power penetration of Worlds electricity in % -
UTS/DLR (High Electrification - accelerated) [%] 4% 5% 7% 28% 39% 45%
-5.0%
5.0%
15.0%
25.0%
35.0%
45.0%
55.0%
65.0%
75.0%
2015 2017 2020 2030 2040 2050
%
Windpower Penetration
NPS High ElectrificationNPS ReferenceGWEC Moderate High ElectrificationGWEC Moderate Reference2.0°C High Electrification2.0°C High Electrification - Accelerated1.5°C High Electrification1.5°C High Electrification - Accelerated
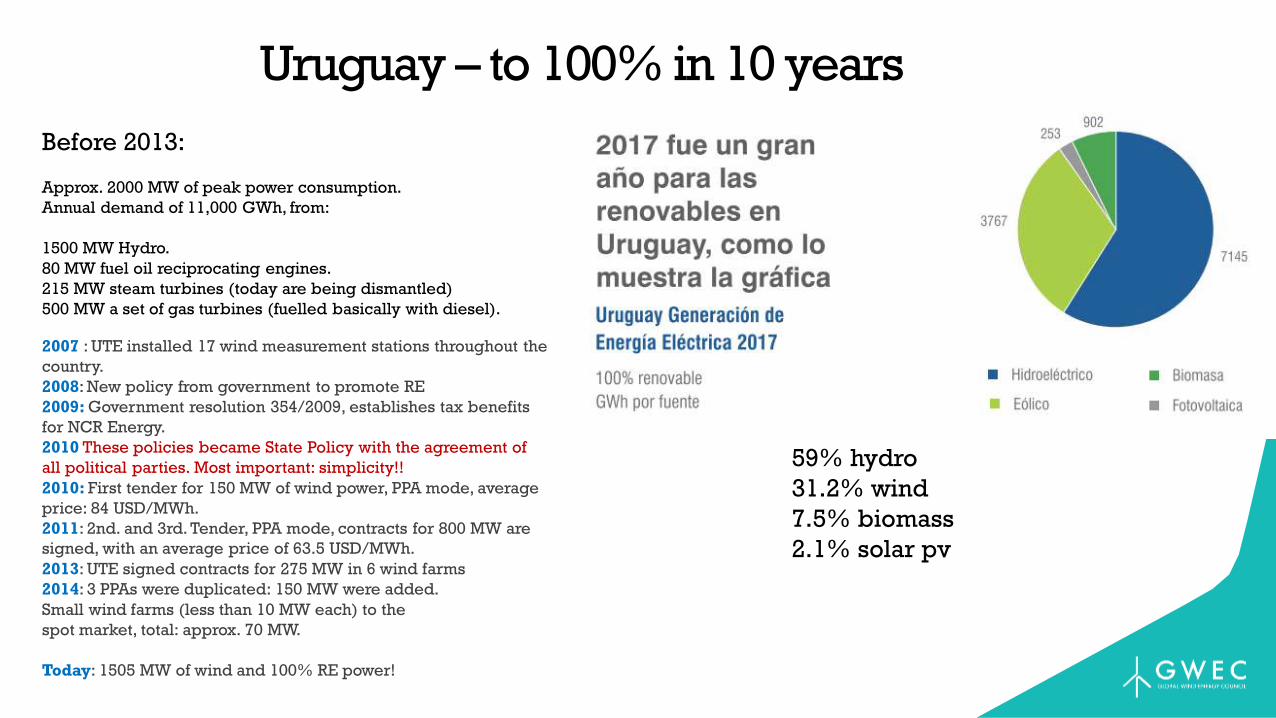
Uruguay – to 100% in 10 years
Before 2013:
Approx. 2000 MW of peak power consumption.
Annual demand of 11,000 GWh, from:
1500 MW Hydro.
80 MW fuel oil reciprocating engines.
215 MW steam turbines (today are being dismantled)
500 MW a set of gas turbines (fuelled basically with diesel). The Wind Energy Revolution
2007 : UTE installed 17 wind measurement stations throughout the
country.
2008: New policy from government to promote RE
2009: Government resolution 354/2009, establishes tax benefits
for NCR Energy.
2010 These policies became State Policy with the agreement of
all political parties. Most important: simplicity!!
2010: First tender for 150 MW of wind power, PPA mode, average
price: 84 USD/MWh.
2011: 2nd. and 3rd. Tender, PPA mode, contracts for 800 MW are
signed, with an average price of 63.5 USD/MWh.
2013: UTE signed contracts for 275 MW in 6 wind farms
2014: 3 PPAs were duplicated: 150 MW were added.
Small wind farms (less than 10 MW each) to the
spot market, total: approx. 70 MW.
Today: 1505 MW of wind and 100% RE power!
59% hydro
31.2% wind
7.5% biomass
2.1% solar pv
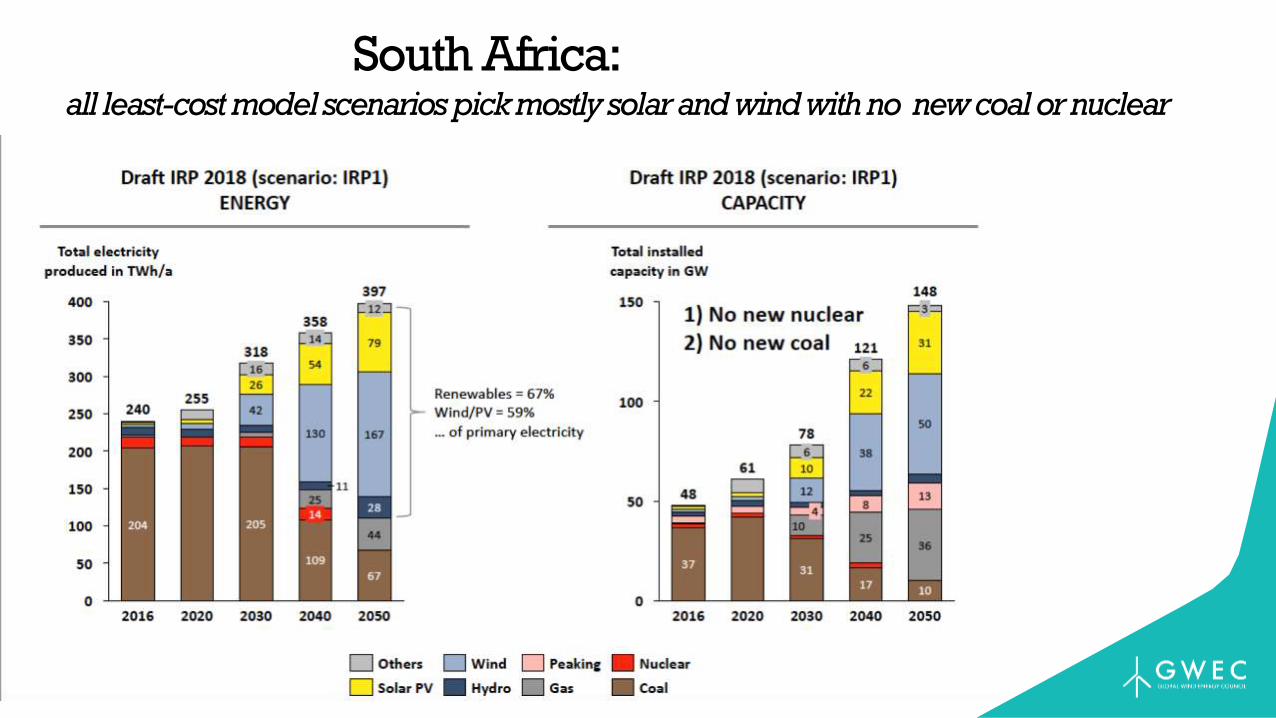
South Africa: all least-cost model scenarios pick mostly solar and wind with no new coal or nuclear
Rue d’Arlon 80
1040 Brussels, Belgium
T. +32 2 213 18 97
www.gwec.net
Thank you!
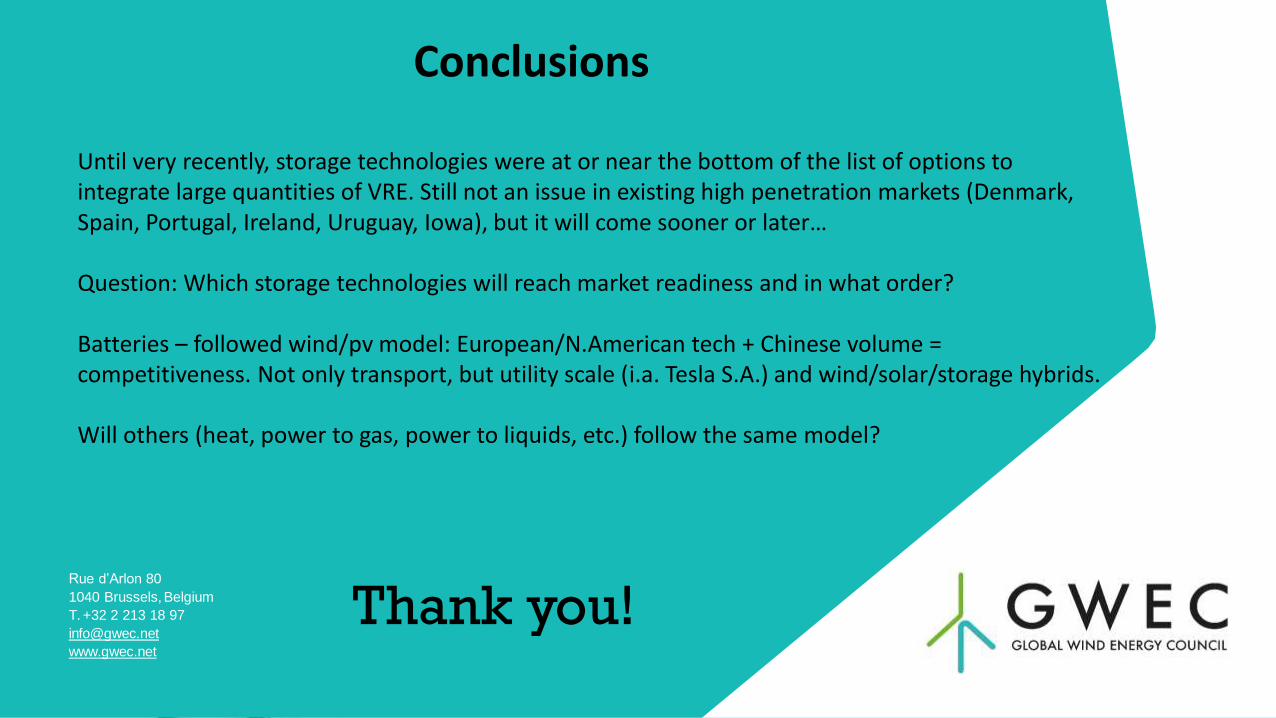
Until very recently, storage technologies were at or near the bottom of the list of options to integrate large quantities of VRE. Still not an issue in existing high penetration markets (Denmark, Spain, Portugal, Ireland, Uruguay, Iowa), but it will come sooner or later…
Question: Which storage technologies will reach market readiness and in what order?
Batteries – followed wind/pv model: European/N.American tech + Chinese volume = competitiveness. Not only transport, but utility scale (i.a. Tesla S.A.) and wind/solar/storage hybrids.
Will others (heat, power to gas, power to liquids, etc.) follow the same model?
Conclusions
Election of the Steering CommitteeProcedure
Renewable energy and storage – a driver for the electrification of heat and transport ?
7 December 2018Katowice, Poland
Rana AdibExecutive Secretary, REN21
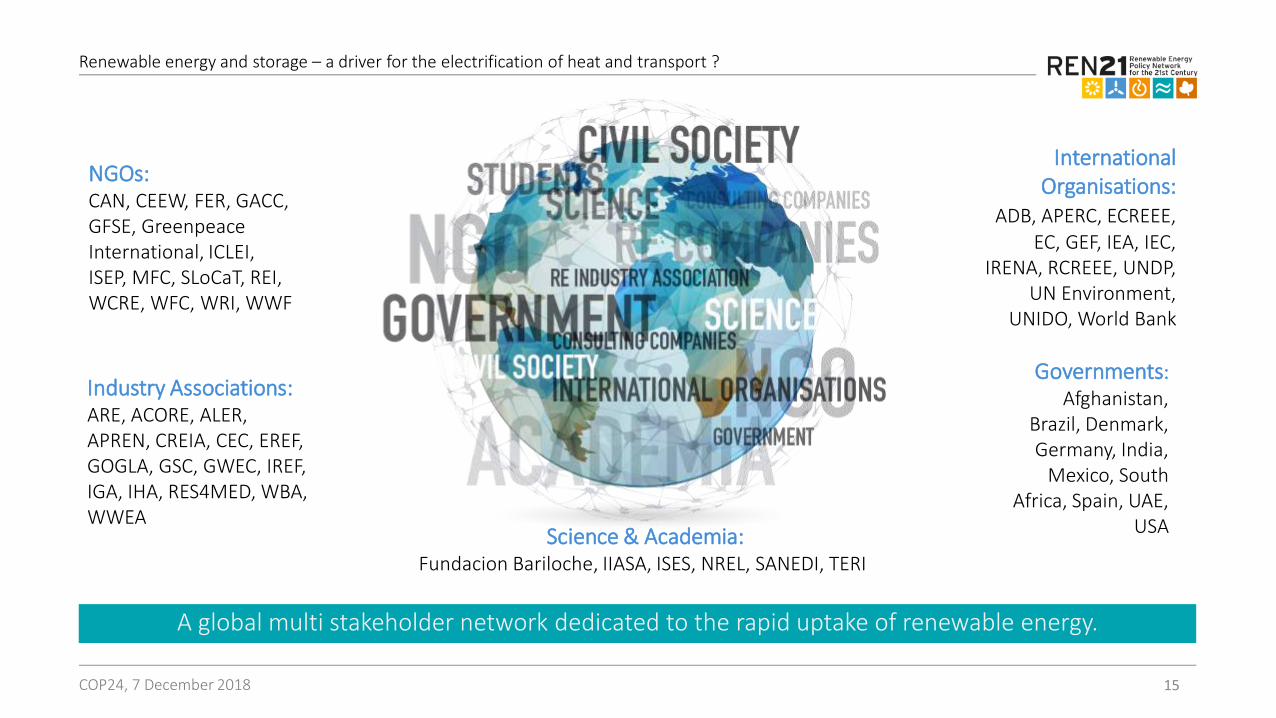
Industry Associations:ARE, ACORE, ALER, APREN, CREIA, CEC, EREF, GOGLA, GSC, GWEC, IREF, IGA, IHA, RES4MED, WBA, WWEA
Science & Academia:Fundacion Bariloche, IIASA, ISES, NREL, SANEDI, TERI
NGOs: CAN, CEEW, FER, GACC, GFSE, Greenpeace International, ICLEI, ISEP, MFC, SLoCaT, REI, WCRE, WFC, WRI, WWF
International Organisations:
ADB, APERC, ECREEE, EC, GEF, IEA, IEC,
IRENA, RCREEE, UNDP, UN Environment,
UNIDO, World Bank
Governments:Afghanistan,
Brazil, Denmark, Germany, India,
Mexico, South Africa, Spain, UAE,
USA
A global multi stakeholder network dedicated to the rapid uptake of renewable energy.
15COP24, 7 December 2018
Renewable energy and storage – a driver for the electrification of heat and transport ?
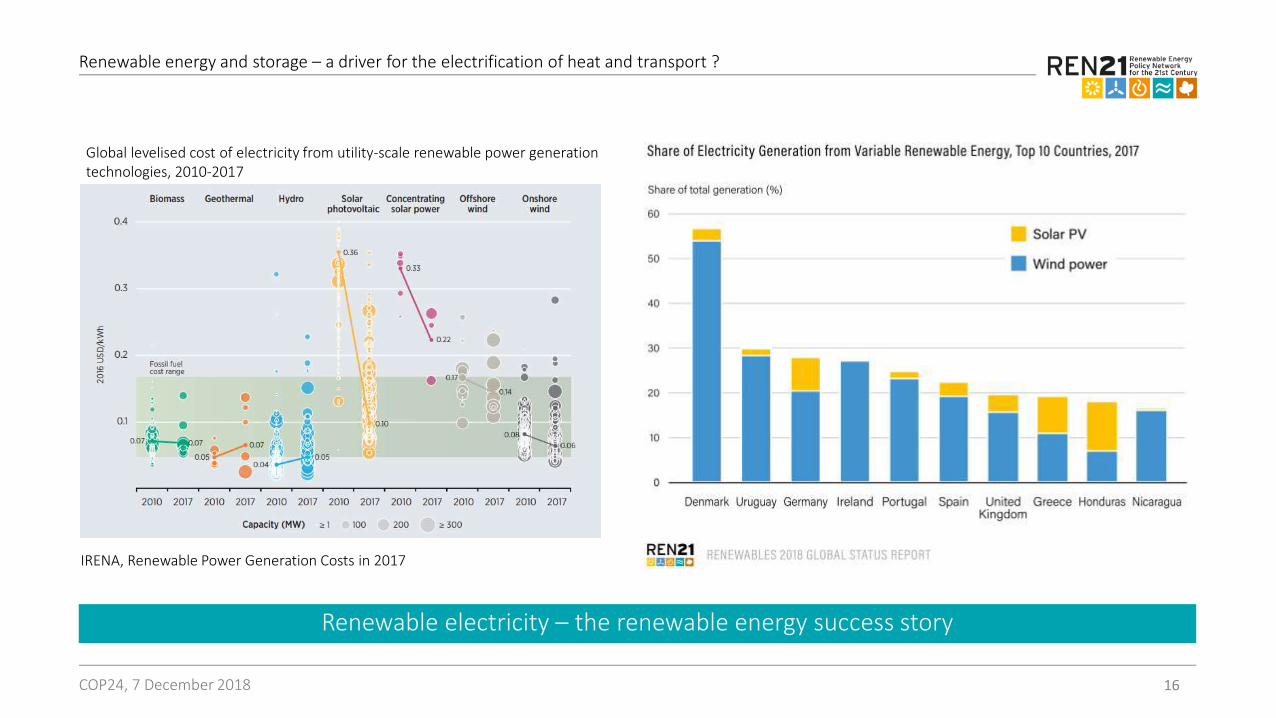
Renewable electricity – the renewable energy success story
16COP24, 7 December 2018
Global levelised cost of electricity from utility-scale renewable power generation technologies, 2010-2017
IRENA, Renewable Power Generation Costs in 2017
Renewable energy and storage – a driver for the electrification of heat and transport ?
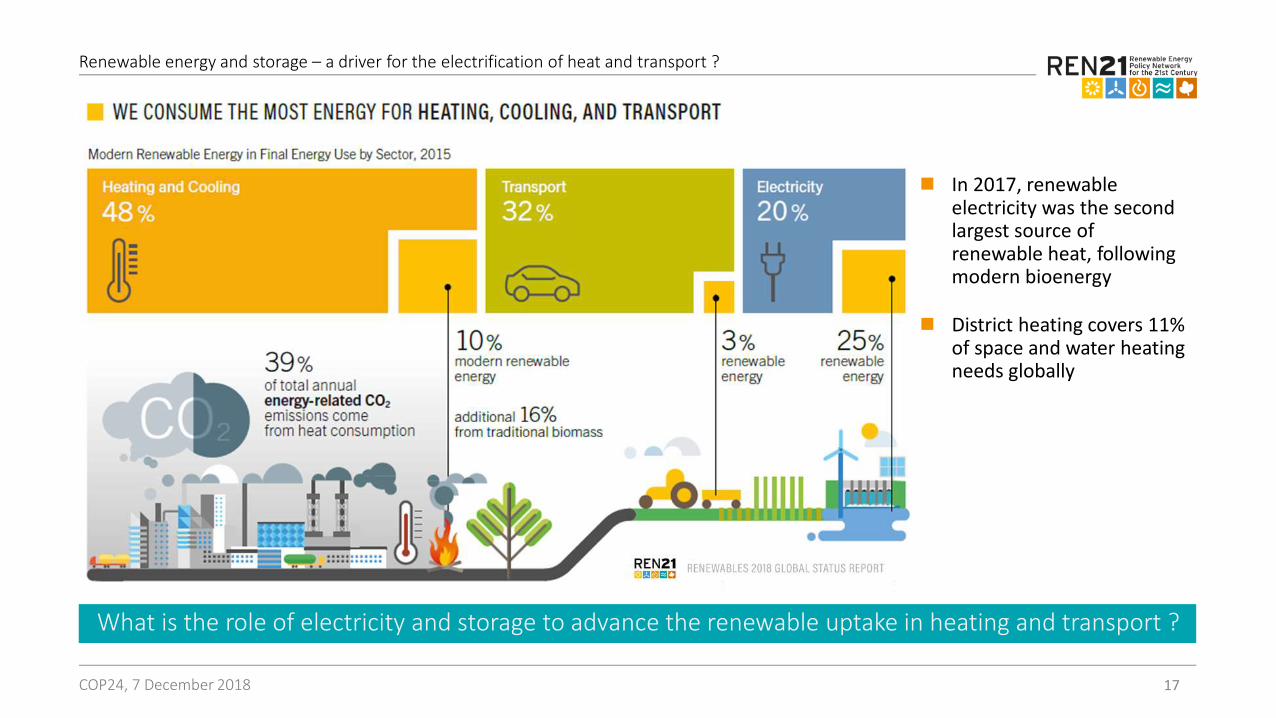
What is the role of electricity and storage to advance the renewable uptake in heating and transport ?
17COP24, 7 December 2018
◼ In 2017, renewable electricity was the second largest source of renewable heat, following modern bioenergy
◼ District heating covers 11% of space and water heating needs globally
Renewable energy and storage – a driver for the electrification of heat and transport ?
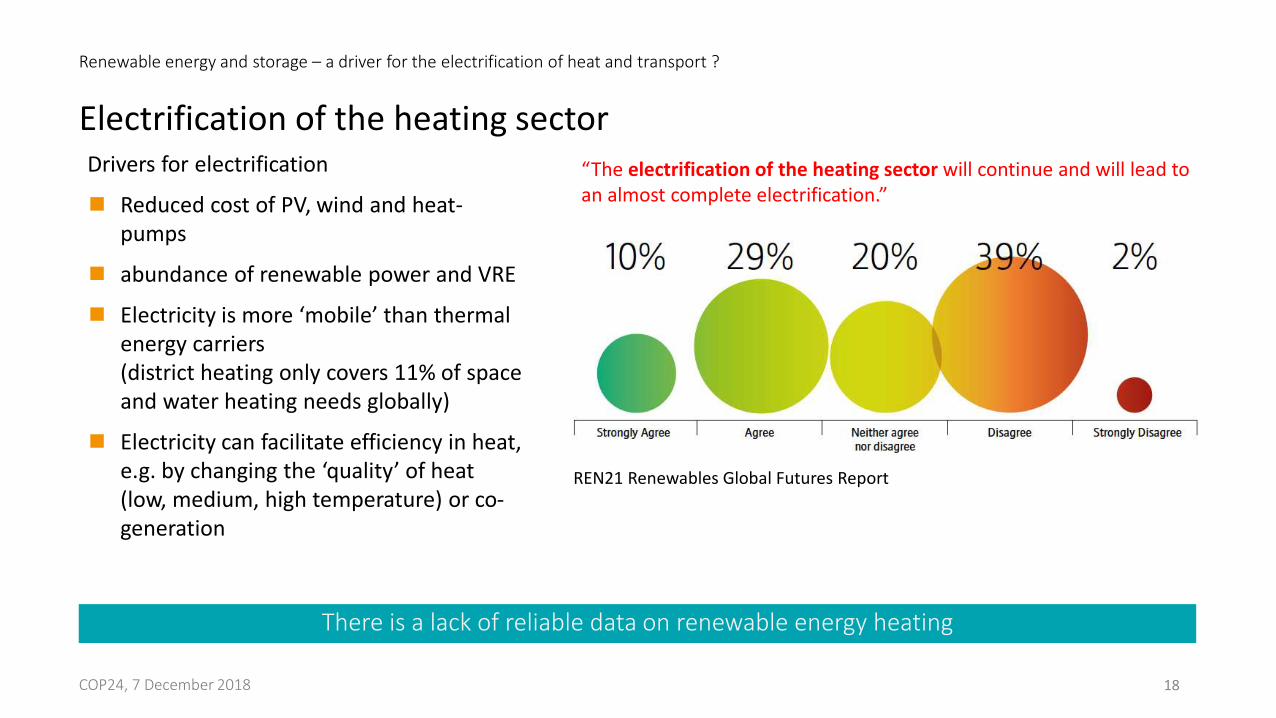
There is a lack of reliable data on renewable energy heating
18COP24, 7 December 2018
“The electrification of the heating sector will continue and will lead to an almost complete electrification.”
Drivers for electrification
◼ Reduced cost of PV, wind and heat-pumps
◼ abundance of renewable power and VRE
◼ Electricity is more ‘mobile’ than thermal energy carriers(district heating only covers 11% of space and water heating needs globally)
◼ Electricity can facilitate efficiency in heat, e.g. by changing the ‘quality’ of heat (low, medium, high temperature) or co-generation
Electrification of the heating sector
REN21 Renewables Global Futures Report
Renewable energy and storage – a driver for the electrification of heat and transport ?
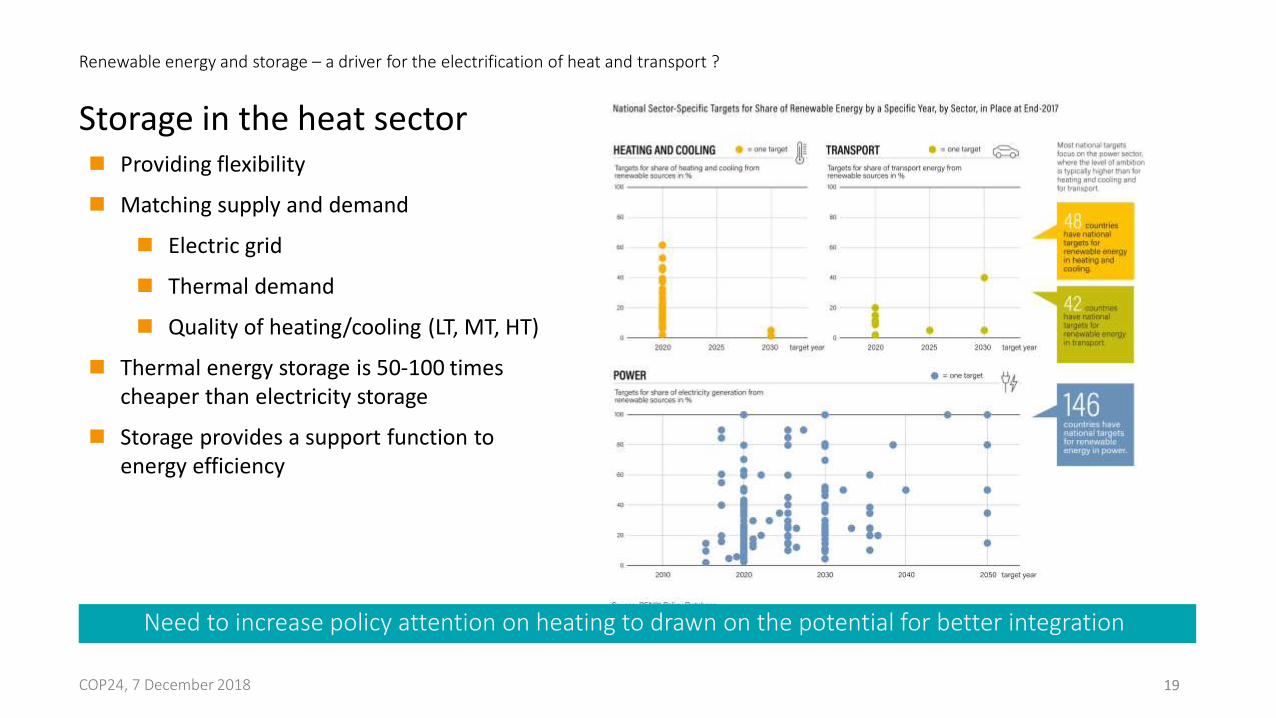
Need to increase policy attention on heating to drawn on the potential for better integration
19COP24, 7 December 2018
◼ Providing flexibility
◼ Matching supply and demand
◼ Electric grid
◼ Thermal demand
◼ Quality of heating/cooling (LT, MT, HT)
◼ Thermal energy storage is 50-100 times cheaper than electricity storage
◼ Storage provides a support function to energy efficiency
Storage in the heat sector
Renewable energy and storage – a driver for the electrification of heat and transport ?
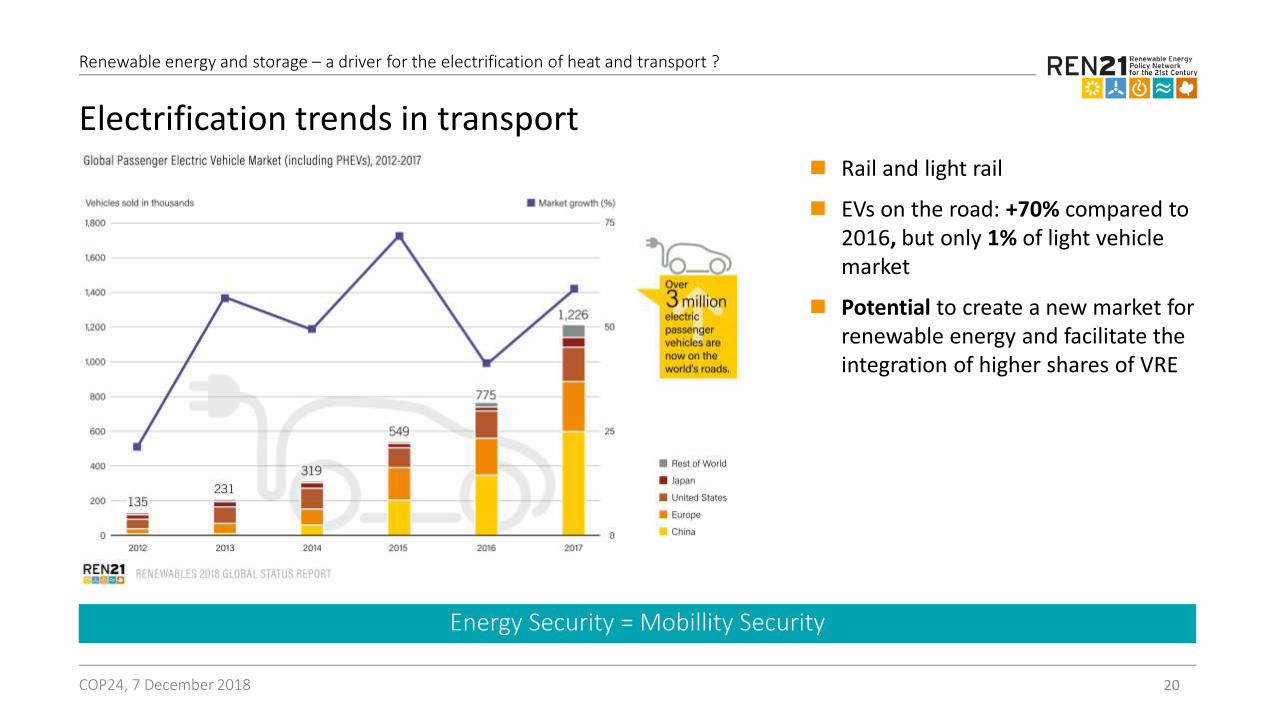
Energy Security = Mobillity Security
20COP24, 7 December 2018
◼ Rail and light rail
◼ EVs on the road: +70% compared to 2016, but only 1% of light vehiclemarket
◼ Potential to create a new market for renewable energy and facilitate the integration of higher shares of VRE
Electrification trends in transport
Renewable energy and storage – a driver for the electrification of heat and transport ?
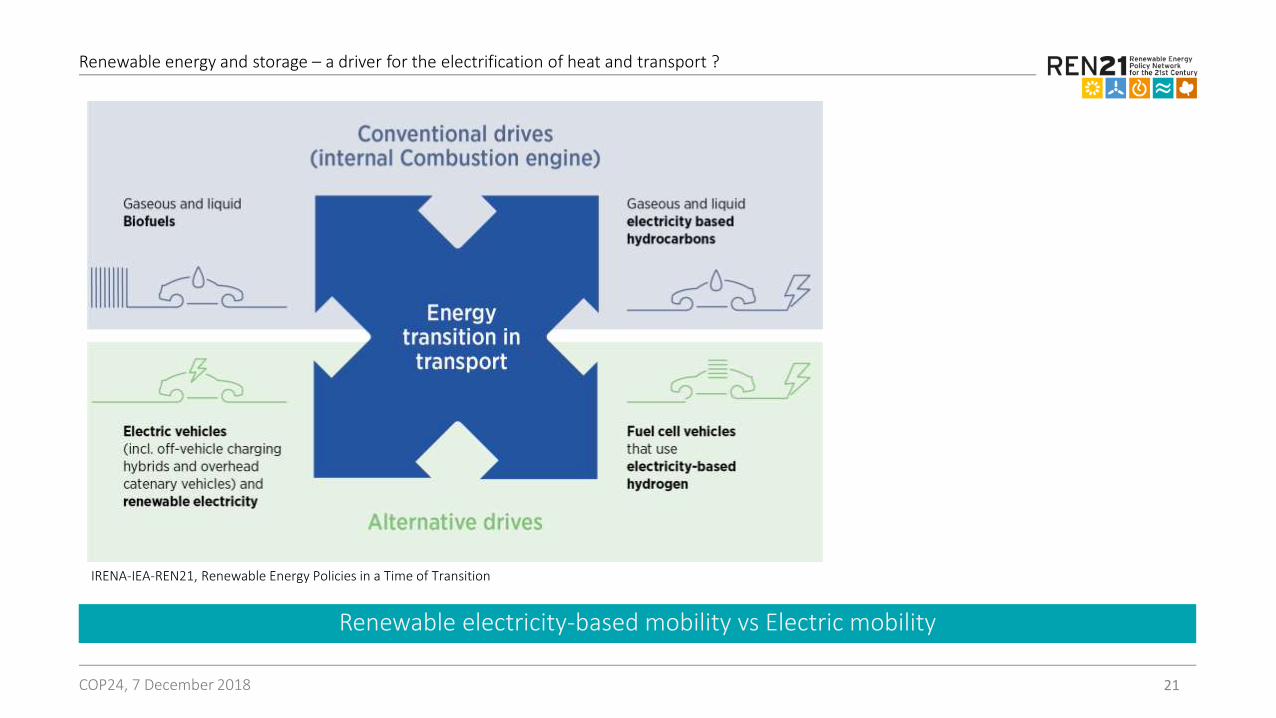
Renewable electricity-based mobility vs Electric mobility
21COP24, 7 December 2018
IRENA-IEA-REN21, Renewable Energy Policies in a Time of Transition
Renewable energy and storage – a driver for the electrification of heat and transport ?
RENEWABLE ENERGY SYSTEMS
22
How can we pioneer systemic
innovation for renewable energy and storage?
Prof. Evelina Trutnevyte
Renewable Energy Systems, University of Geneva
COP24 side event «Renewable energy and storage», 7 December 2018, Katowice
RENEWABLE ENERGY SYSTEMS
23
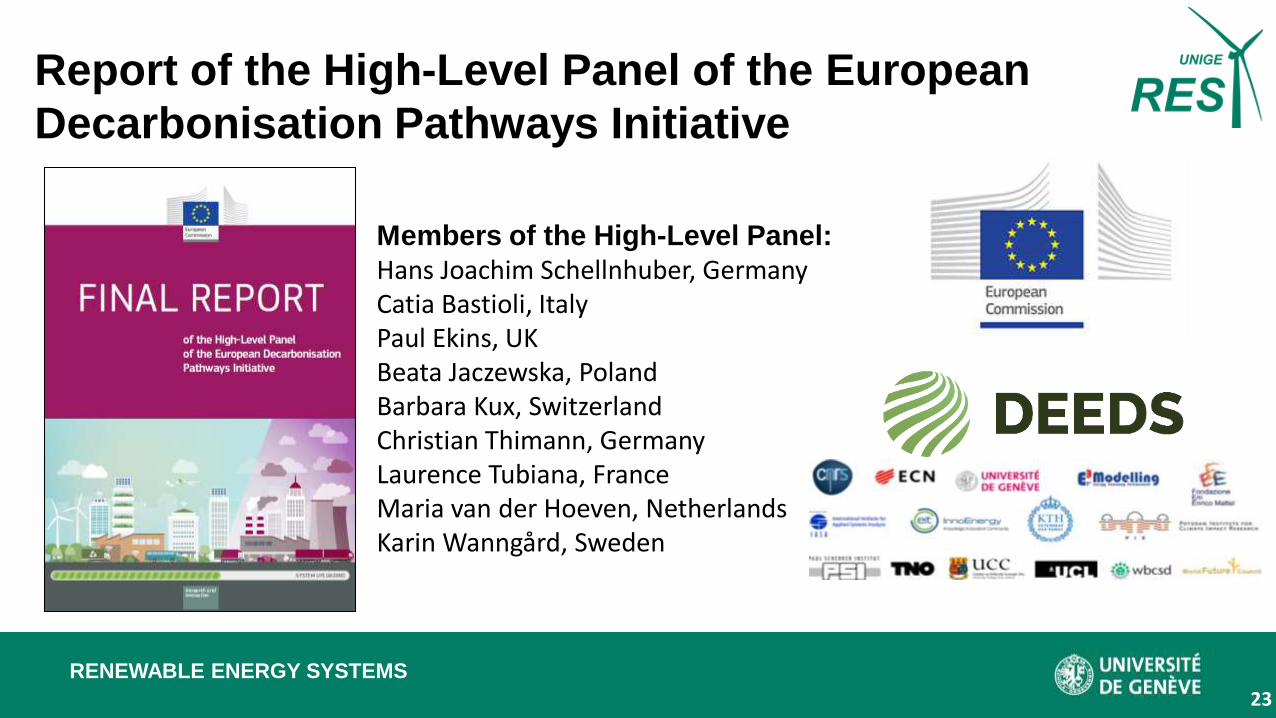
Report of the High-Level Panel of the European
Decarbonisation Pathways Initiative
Members of the High-Level Panel:
Hans Joachim Schellnhuber, GermanyCatia Bastioli, ItalyPaul Ekins, UKBeata Jaczewska, PolandBarbara Kux, SwitzerlandChristian Thimann, GermanyLaurence Tubiana, France Maria van der Hoeven, NetherlandsKarin Wanngård, Sweden
RENEWABLE ENERGY SYSTEMS
24
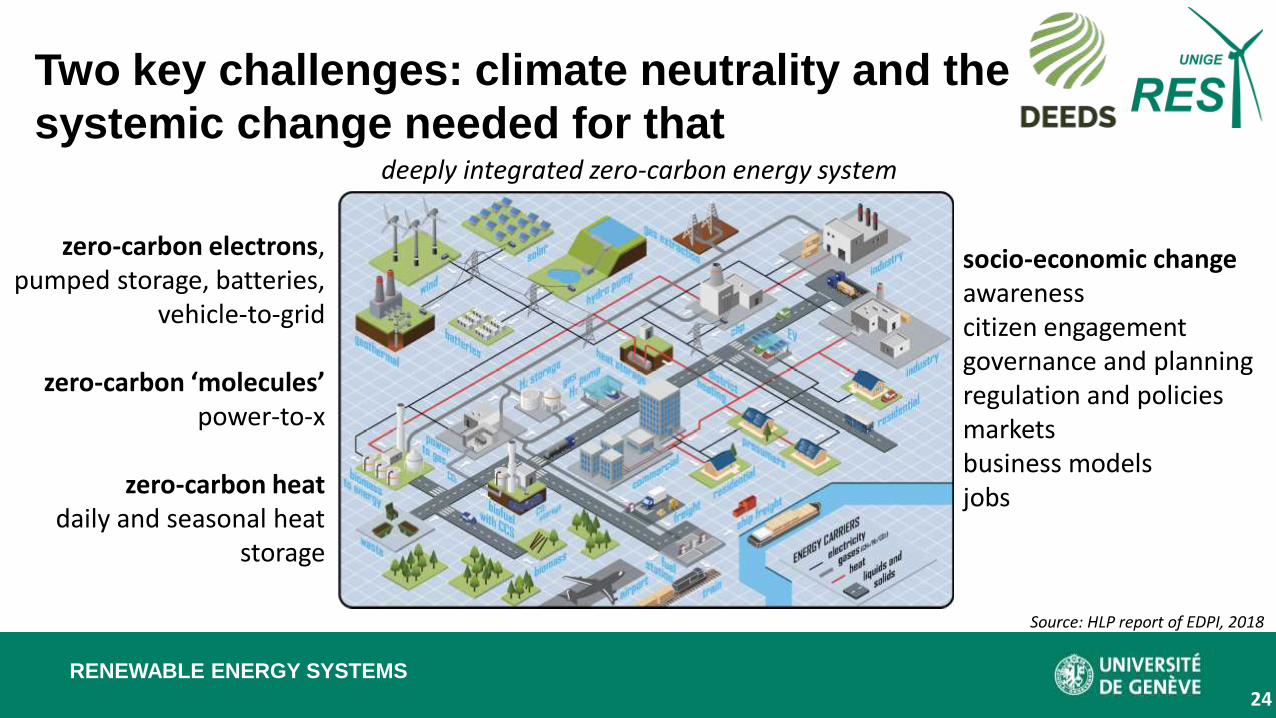
Two key challenges: climate neutrality and the
systemic change needed for that
43
new technologies but also new business models, rules and regulations, in which
the digital dimension is paramount.
Figure 3: Sketch of a deeply integrated zero-carbon energy system.8
R& I is needed both on the technology side (energy storage and energy conversion, at all timescales and looking at all the different technologies) and
on the m anagem ent side (connecting the different energy markets and
infrastructures, setting robust regulation and policies that do not hinder sector-
coupling, addressing barriers beyond technology and market design, setting the ground for new business models), with the holistic integrated energy system
approach emphasised above. More R&I is also needed on networks to include
spatial issues.
Bioenergy w ill p lay an im portant role in the decarbonisation of certa in activ ities such as aviation or sh ipping, w here currently no other
decarbonisation options seem econom ically deployable at large scale.
R& I should thus focus on finding synergies w ith agriculture and
forestry and on rem oving potentia l trade-offs. In recent years, impressive
8 From an economic viewpoint, it can make sense to still use (relatively low-carbon) natural
gas while at the same time creating negative emissions through bio-CCS, afforestation and
soil carbon management to achieve net GHG neutrality. Differences in process costs and efficiencies of the various conversion steps (biogas production, CO2 capture from biofuels,
synthetic fuel production) are the main reasons for this seemingly counter-intuitive
assessment.
Source: HLP report of EDPI, 2018
zero-carbon electrons, pumped storage, batteries,
vehicle-to-grid
zero-carbon ‘molecules’power-to-x
zero-carbon heatdaily and seasonal heat
storage
deeply integrated zero-carbon energy system
socio-economic changeawarenesscitizen engagementgovernance and planning regulation and policiesmarketsbusiness modelsjobs
RENEWABLE ENERGY SYSTEMS
25
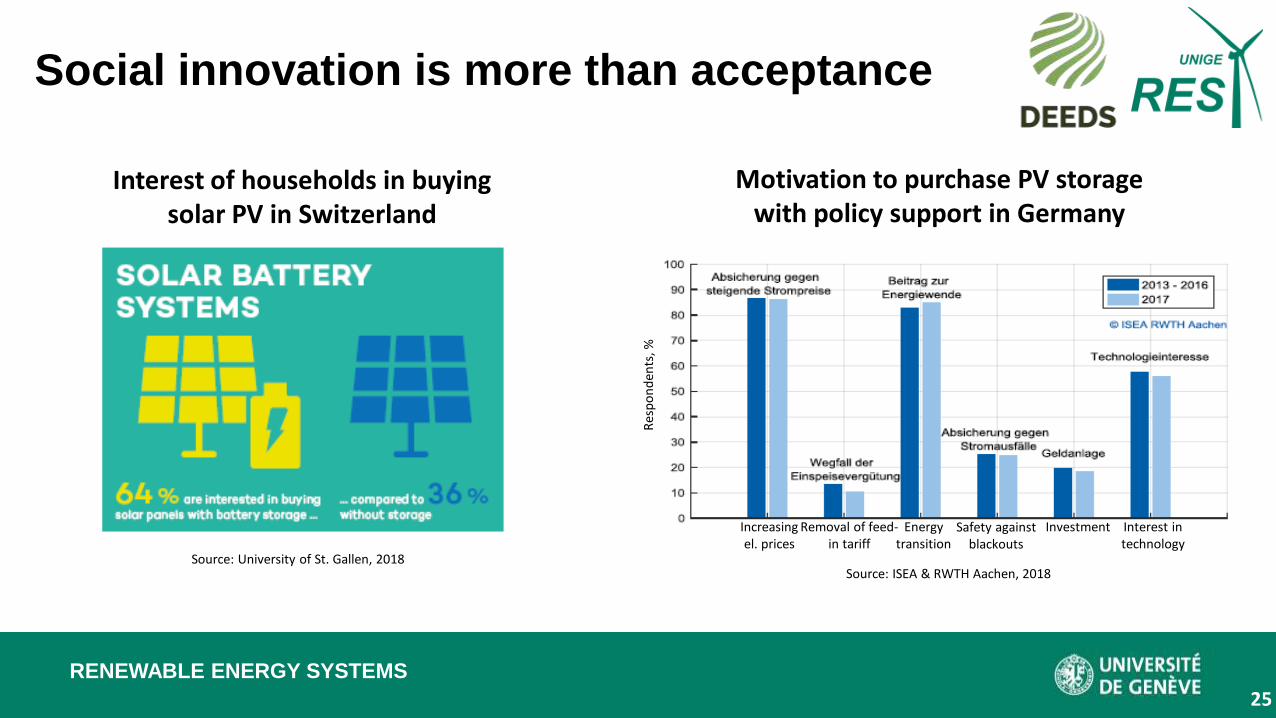
Social innovation is more than acceptance
Source: University of St. Gallen, 2018
Interest of households in buying solar PV in Switzerland
Source: ISEA & RWTH Aachen, 2018
Increasing el. prices
Interest in technology
InvestmentRemoval of feed-in tariff
Energytransition
Safety against blackouts
Res
po
nd
ents
, %
Motivation to purchase PV storage with policy support in Germany
RENEWABLE ENERGY SYSTEMS
26
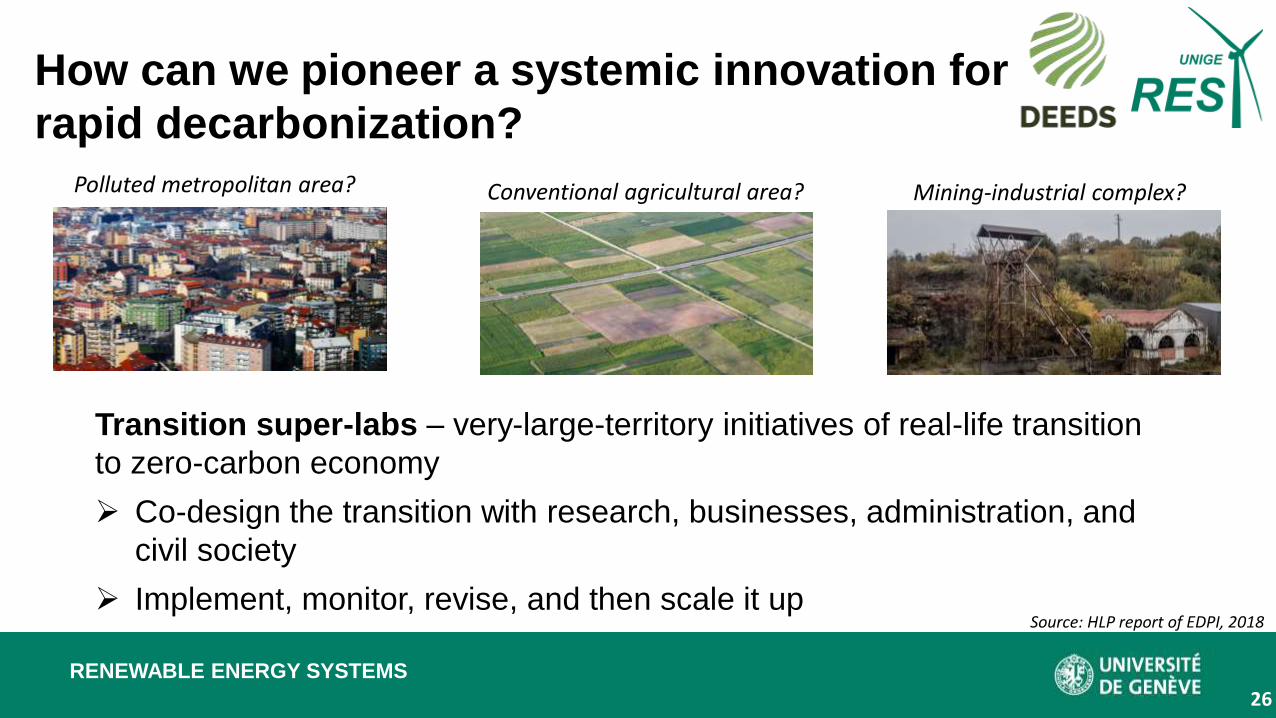
How can we pioneer a systemic innovation for
rapid decarbonization?
Polluted metropolitan area? Conventional agricultural area? Mining-industrial complex?
Source: HLP report of EDPI, 2018
Transition super-labs – very-large-territory initiatives of real-life transition
to zero-carbon economy
➢ Co-design the transition with research, businesses, administration, and
civil society
➢ Implement, monitor, revise, and then scale it up
RENEWABLE ENERGY SYSTEMS
27
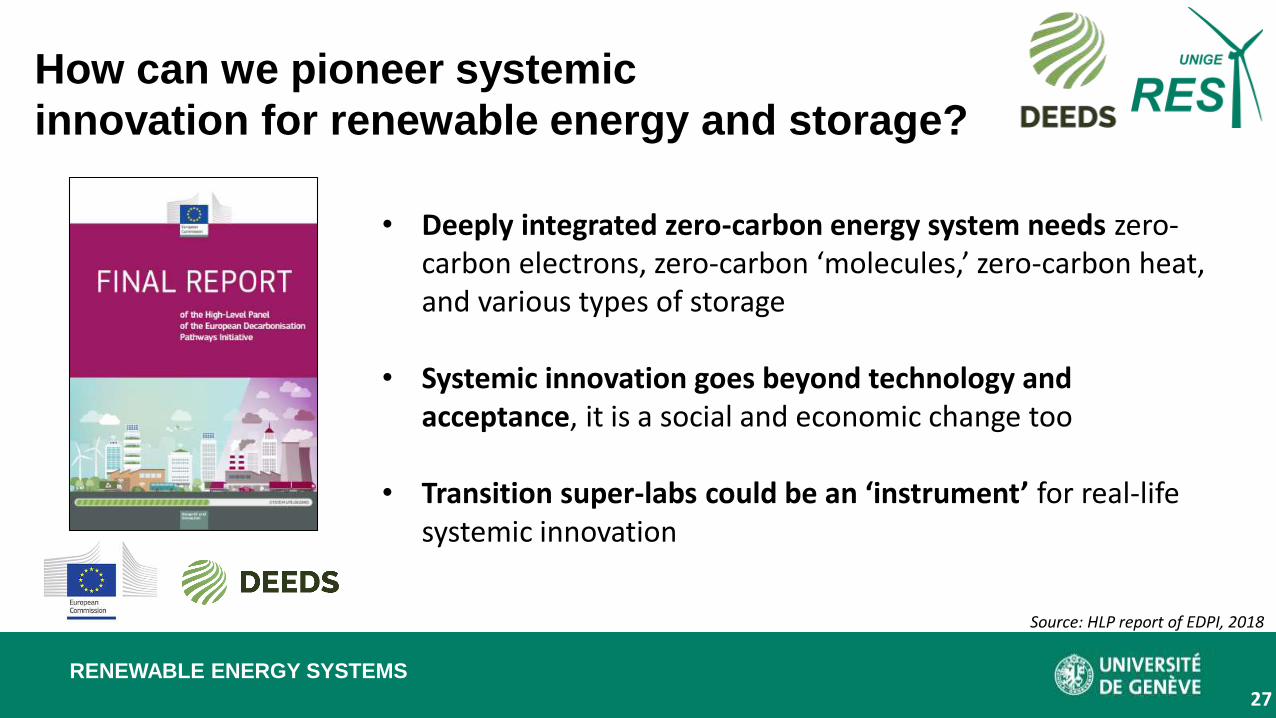
How can we pioneer systemic
innovation for renewable energy and storage?
• Deeply integrated zero-carbon energy system needs zero-carbon electrons, zero-carbon ‘molecules,’ zero-carbon heat, and various types of storage
• Systemic innovation goes beyond technology and acceptance, it is a social and economic change too
• Transition super-labs could be an ‘instrument’ for real-life systemic innovation
Source: HLP report of EDPI, 2018
RENEWABLE ENERGY SYSTEMS
28
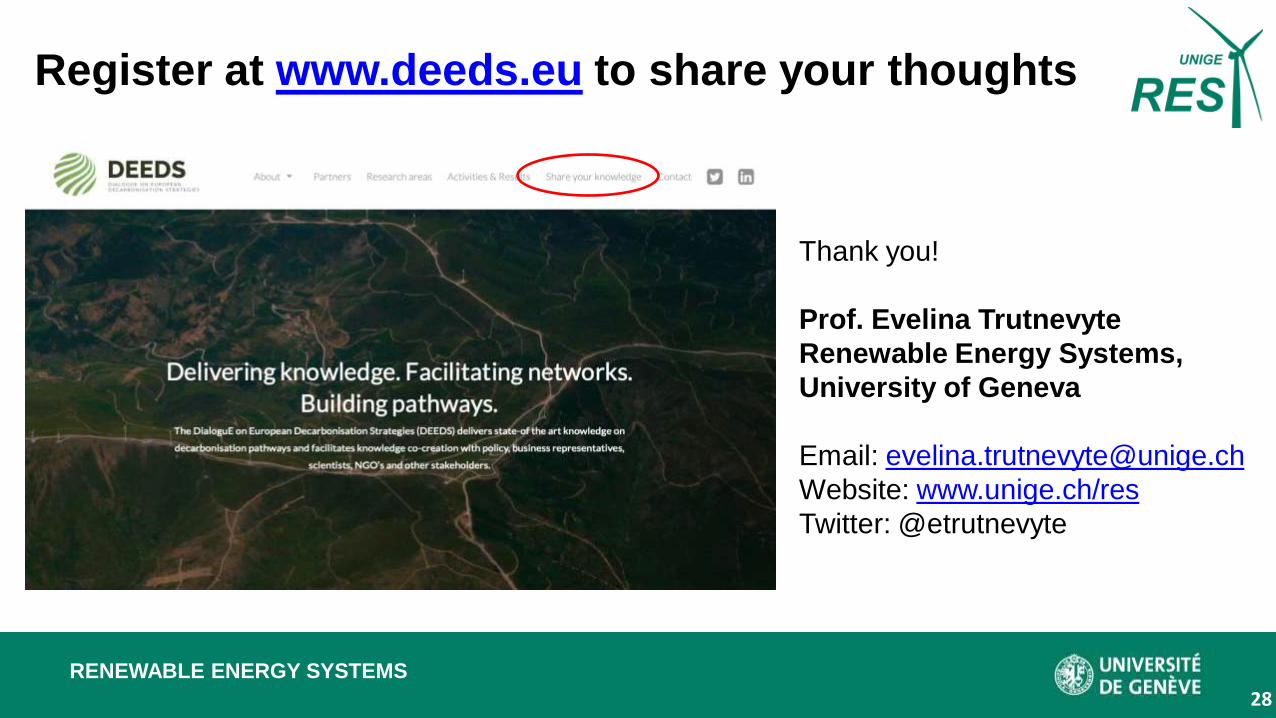
Register at www.deeds.eu to share your thoughts
Thank you!
Prof. Evelina Trutnevyte
Renewable Energy Systems,
University of Geneva
Email: [email protected]
Website: www.unige.ch/res
Twitter: @etrutnevyte
What are the potential co-benefits of and pathways for growth in renewables, energy storage, and fuel cells?
Michael M. Whiston, Postdoctoral Researcher
Engineering and Public Policy
Carnegie Mellon University
Carnegie Mellon
Electricity Industry Center
Inês Azevedo, Professor
Engineering and Public Policy
Carnegie Mellon University
Shawn Litster, Professor
Mechanical Engineering
Carnegie Mellon University
Constantine Samaras, Associate Professor
Civil and Environmental Engineering
Carnegie Mellon University
Kate S. Whitefoot, Assistant Professor
Mechanical Engineering
Engineering and Public Policy
Carnegie Mellon University
Jay F. Whitacre, Professor
Engineering and Public Policy
Materials Science and Engineering
Carnegie Mellon University
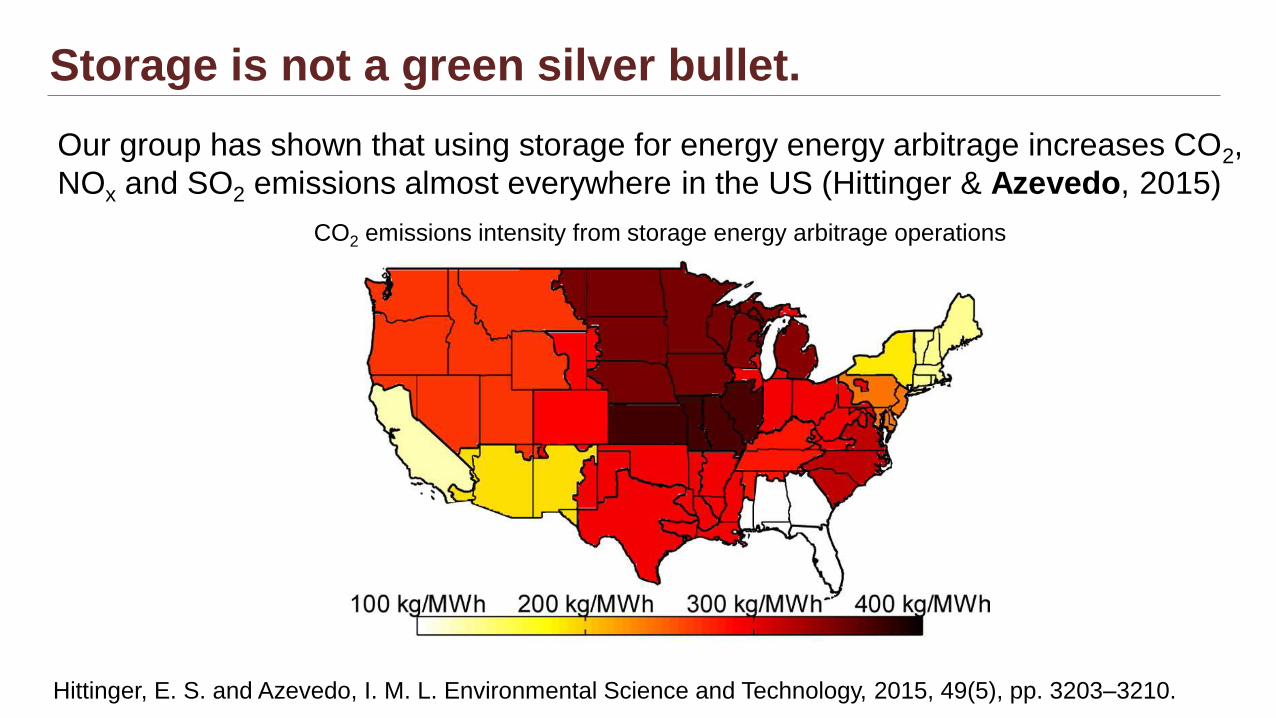
Storage is not a green silver bullet.
Our group has shown that using storage for energy energy arbitrage increases CO2,
NOx and SO2 emissions almost everywhere in the US (Hittinger & Azevedo, 2015)
Hittinger, E. S. and Azevedo, I. M. L. Environmental Science and Technology, 2015, 49(5), pp. 3203–3210.
CO2 emissions intensity from storage energy arbitrage operations
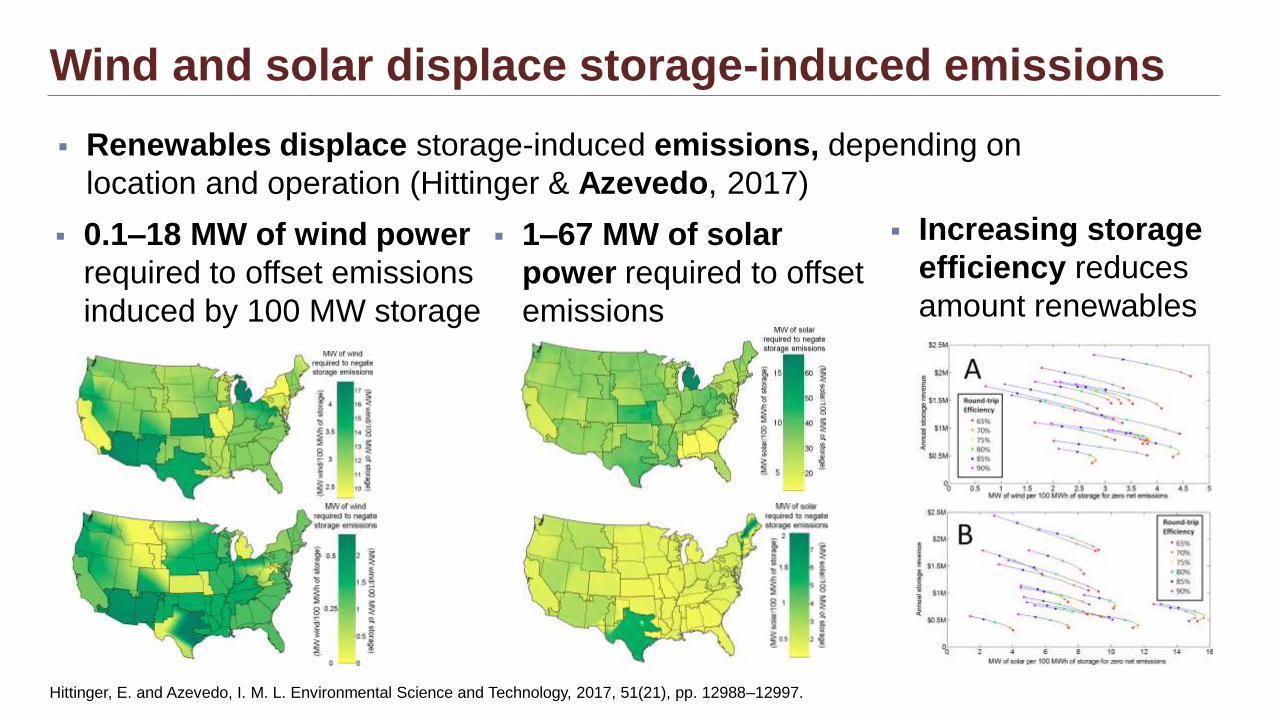
Wind and solar displace storage-induced emissions
▪ Renewables displace storage-induced emissions, depending on
location and operation (Hittinger & Azevedo, 2017)
▪ 0.1–18 MW of wind power
required to offset emissions
induced by 100 MW storage
▪ 1–67 MW of solar
power required to offset
emissions
Hittinger, E. and Azevedo, I. M. L. Environmental Science and Technology, 2017, 51(21), pp. 12988–12997.
▪ Increasing storage
efficiency reduces
amount renewables
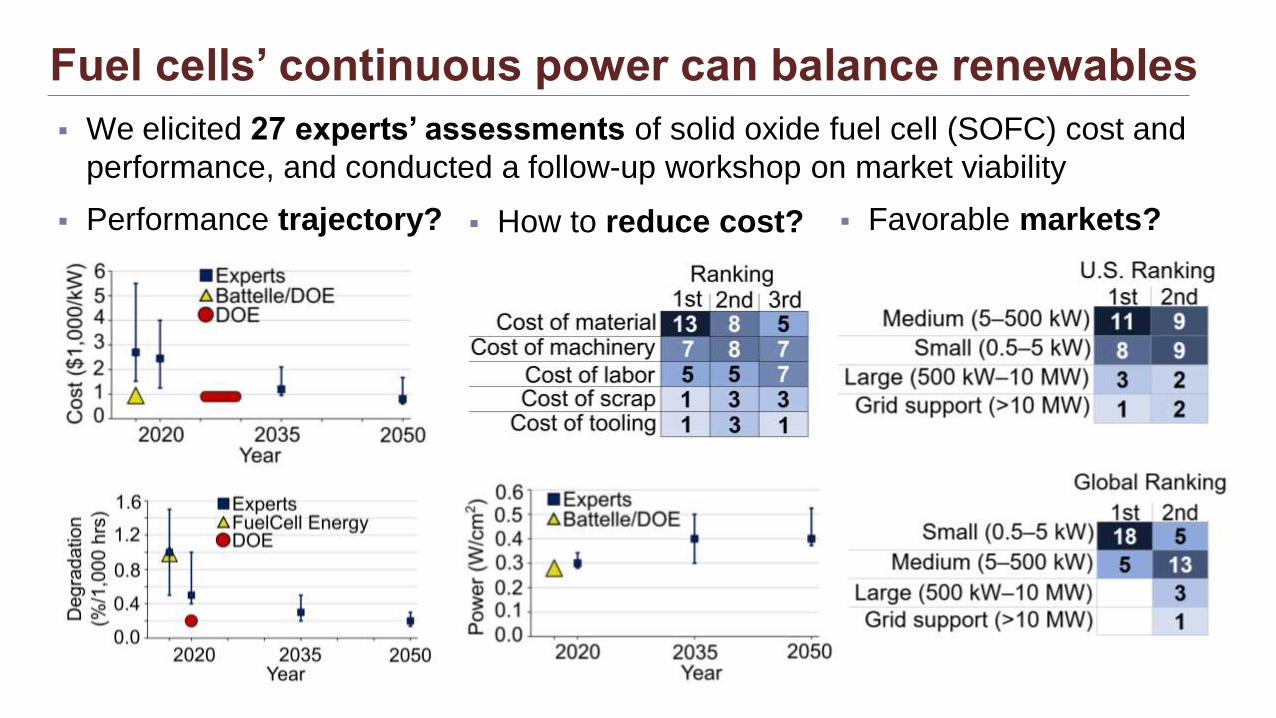
Fuel cells’ continuous power can balance renewables
▪ We elicited 27 experts’ assessments of solid oxide fuel cell (SOFC) cost and
performance, and conducted a follow-up workshop on market viability
▪ Favorable markets?▪ How to reduce cost?▪ Performance trajectory?
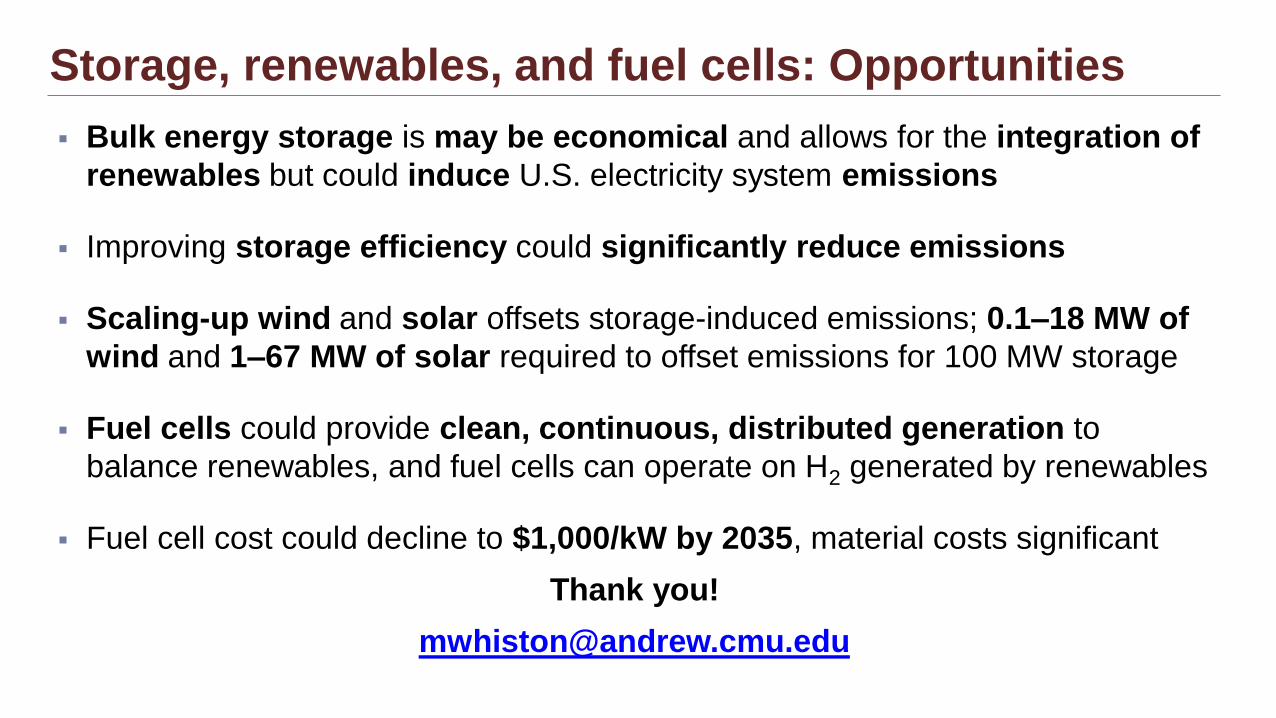
Storage, renewables, and fuel cells: Opportunities
▪ Bulk energy storage is may be economical and allows for the integration of
renewables but could induce U.S. electricity system emissions
▪ Improving storage efficiency could significantly reduce emissions
▪ Scaling-up wind and solar offsets storage-induced emissions; 0.1–18 MW of
wind and 1–67 MW of solar required to offset emissions for 100 MW storage
▪ Fuel cells could provide clean, continuous, distributed generation to
balance renewables, and fuel cells can operate on H2 generated by renewables
▪ Fuel cell cost could decline to $1,000/kW by 2035, material costs significant
Thank you!
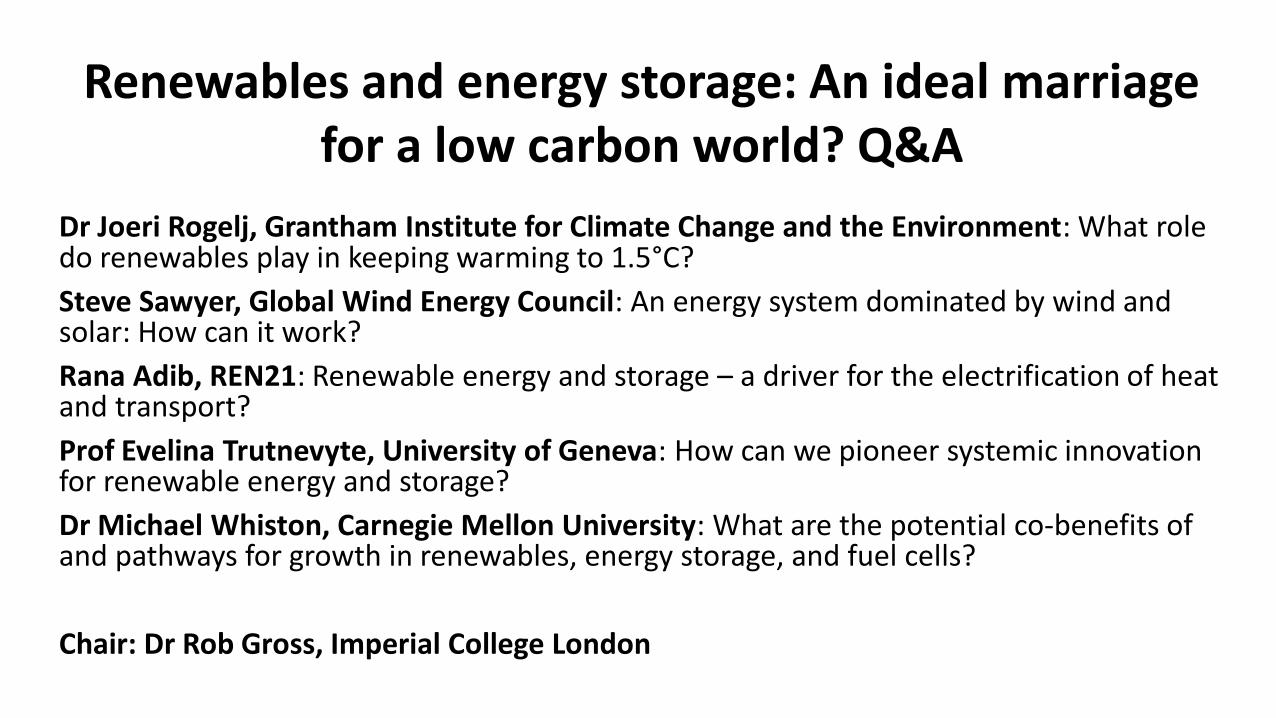
Renewables and energy storage: An ideal marriage for a low carbon world? Q&A
Dr Joeri Rogelj, Grantham Institute for Climate Change and the Environment: What role do renewables play in keeping warming to 1.5°C?
Steve Sawyer, Global Wind Energy Council: An energy system dominated by wind and solar: How can it work?
Rana Adib, REN21: Renewable energy and storage – a driver for the electrification of heat and transport?
Prof Evelina Trutnevyte, University of Geneva: How can we pioneer systemic innovation for renewable energy and storage?
Dr Michael Whiston, Carnegie Mellon University: What are the potential co-benefits of and pathways for growth in renewables, energy storage, and fuel cells?
Chair: Dr Rob Gross, Imperial College London