Renewable Energy Market Outlook 1-2. Ali...Market Outlook The 5th Northeast Asia Energy Security...
27
Renewable Energy Market Outlook The 5th Northeast Asia Energy Security Forum Ali Izadi December 12, 2017
Transcript of Renewable Energy Market Outlook 1-2. Ali...Market Outlook The 5th Northeast Asia Energy Security...

Renewable Energy Market OutlookThe 5th Northeast Asia Energy Security Forum
Ali Izadi
December 12, 2017

1 December 12, 2017
Analysis to help you understand the future of energy
Solar Wind Power and
Utilities
Electric
Vehicles
Energy Smart
Technologies
Gas Carbon
Markets &
Climate
Frontier
Power
Mobility and
Autonomous
Driving
Emerging
Technologies
Storage
Europe, Middle East
& AfricaAsia PacificAmericas
2 December 12, 2017
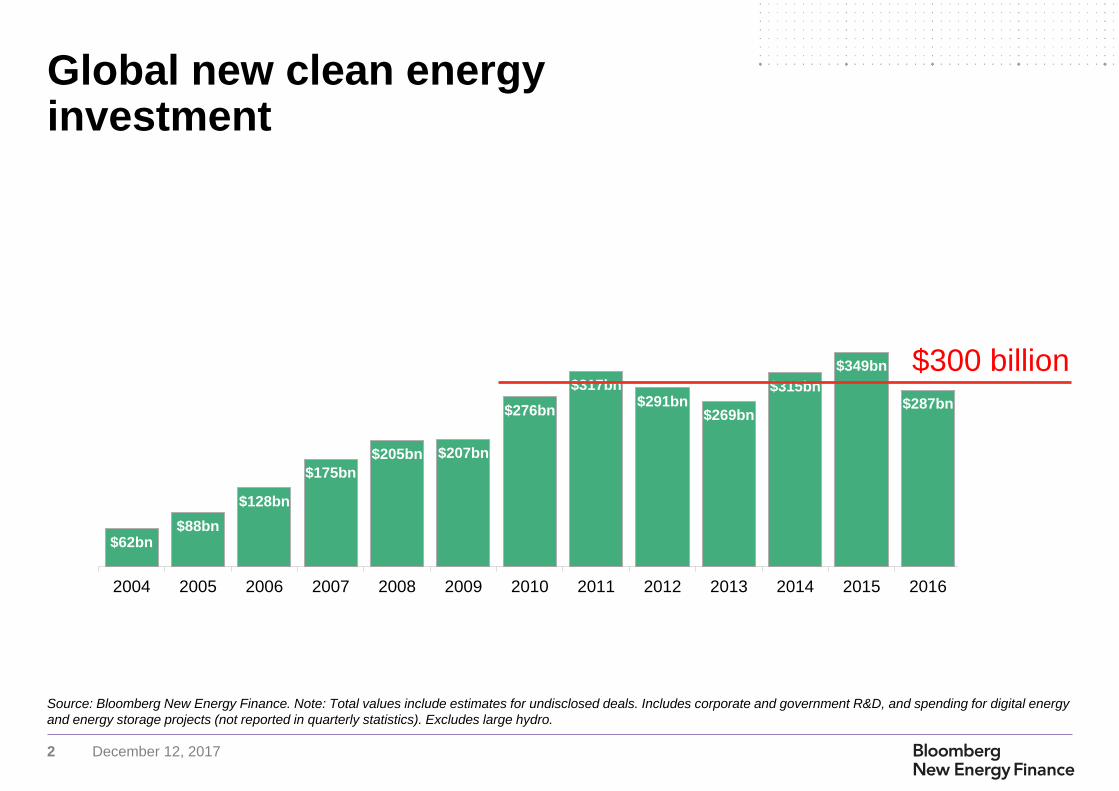
$62bn$88bn
$128bn
$175bn
$205bn $207bn
$276bn
$317bn$291bn
$269bn
$315bn
$349bn
$287bn
$258bn(estimate)
0.00
20.00
40.00
60.00
80.00
100.00
120.00
140.00
160.00
0.00
100.00
200.00
300.00
400.00
500.00
2004 2005 2006 2007 2008 2009 2010 2011 2012 2013 2014 2015 2016 2017
Source: Bloomberg New Energy Finance. Note: Total values include estimates for undisclosed deals. Includes corporate and government R&D, and spending for digital energy
and energy storage projects (not reported in quarterly statistics). Excludes large hydro.
Global new clean energy investment
$300 billion

3 December 12, 2017
$62bn$88bn
$128bn
$175bn
$205bn $207bn
$276bn
$317bn$291bn
$269bn
$315bn
$349bn
$287bn
$258bn(estimate)
0.00
20.00
40.00
60.00
80.00
100.00
120.00
140.00
160.00
0.00
100.00
200.00
300.00
400.00
500.00
2004 2005 2006 2007 2008 2009 2010 2011 2012 2013 2014 2015 2016 2017
0.00
20.00
40.00
60.00
80.00
100.00
120.00
140.00
160.00
0.00
100.00
200.00
300.00
400.00
500.00
2004 2005 2006 2007 2008 2009 2010 2011 2012 2013 2014 2015 2016 2017
20GW
88GW
Source: Bloomberg New Energy Finance. Note:Total values include estimates for undisclosed deals. Includes corporate and government R&D, and spending for digital energy
and energy storage projects (not reported in quarterly statistics). Excludes large hydro.
Global new clean energy investment and capacity installations
$300 billion
160GW

4 December 12, 2017
Source: Maycock, Bloomberg New Energy Finance
Solar technology is getting cheaper, faster
0.1
1
10
100
1 10 100 1,000 10,000 100,000 1,000,000
historic prices (Maycock) Chinese c-Si module prices (BNEF) Experience curve at 28%
2016 ($/W)
2003
1976
1985
2008
Cumulative capacity
2015
2017
(estimate)

5 December 12, 2017
Source: Bloomberg New Energy Finance
BNEF global benchmark capexforecast for fixed-axis utility-scale systems
$1.85
$0.48 $0.29 $0.22 $0.18 $0.15 $0.12
$3.24
$1.14$0.86
$0.70 $0.59 $0.51 $0.45
2010 2016 2020 2025 2030 2035 2040
$/W (DC - 2016 real)
Module Inverter Balance of plant EPC Other System cost

6 December 12, 2017
Source: Bloomberg New Energy Finance Note: Data by contract signing date
Turbine price by delivery date
0.0
0.5
1.0
1.5
2.0
2.5
3.0
1980 1984 1988 1992 1996 2000 2004 2008 2012 2016 2020
Global (ex. China) Germany (ExTool) Denmark (Extool) US (LBL) China (BNEF) Vestas global
million Euro/MW

7 December 12, 2017
Source: Bloomberg New Energy Finance Notes: Line shows central case, error bars
reflect the range between low speed and high speed sites
Source: Bloomberg New Energy Finance Note: Note: Averages are capacity-
weighted. We calculate the capacity factor with our proprietary Wind Farm Capacity
Factor Tool using real project data and wind resource data provided by 3TIER and
Vaisala. We assume P90 value in the capacity factor tool.
Onshore wind capacity factor Capacity factor forecast for the U.S
Onshore wind is getting cheaper as capacity factors rise
0%
10%
20%
30%
40%
50%
60%
19801984198819921996200020042008201220162020
Germany Denmark UK Spain US Canada
299MW
0%
10%
20%
30%
40%
50%
60%
70%
2017 2020 2025 2030 2035 2040

8 December 12, 2017
Evolution of wind turbine heights and output
20001995199019th C
300m
200m
100m
1-12kW0.5 MW
1.2 MW2 MW
Sources: Various; Bloomberg New Energy Finance
9 December 12, 2017
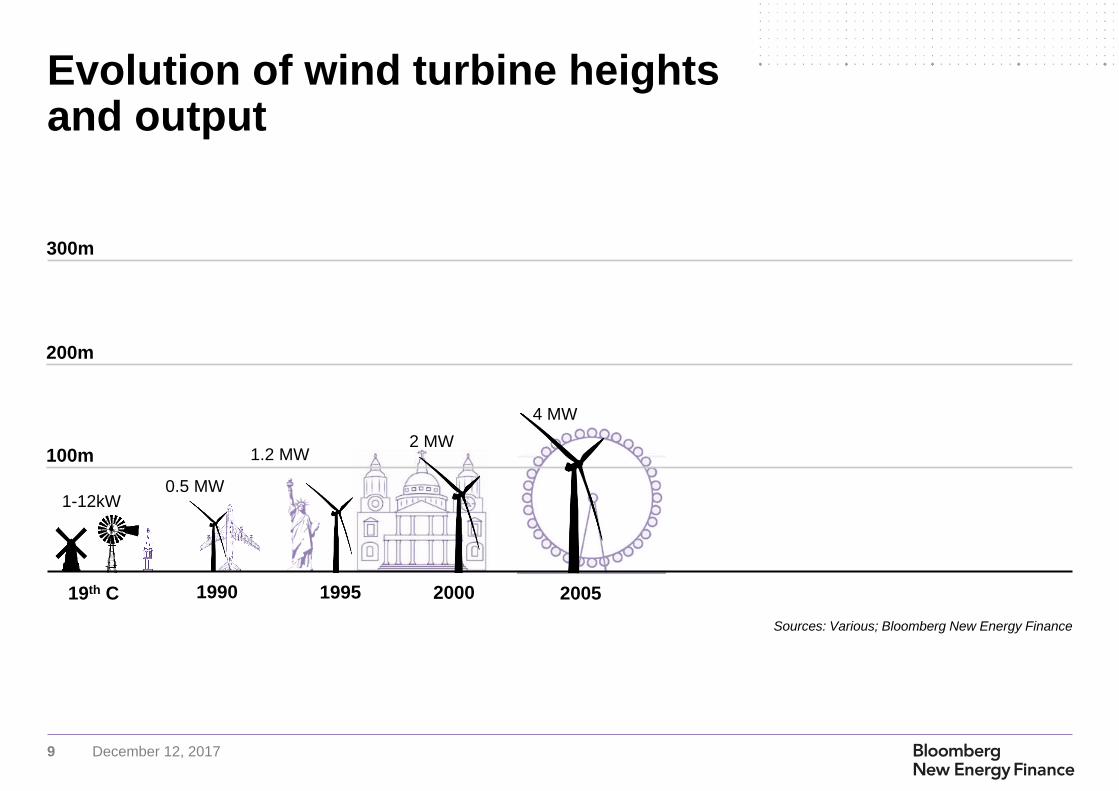
Evolution of wind turbine heights and output
2000 20051995199019th C
300m
200m
100m
1-12kW0.5 MW
1.2 MW2 MW
4 MW
Sources: Various; Bloomberg New Energy Finance
10 December 12, 2017
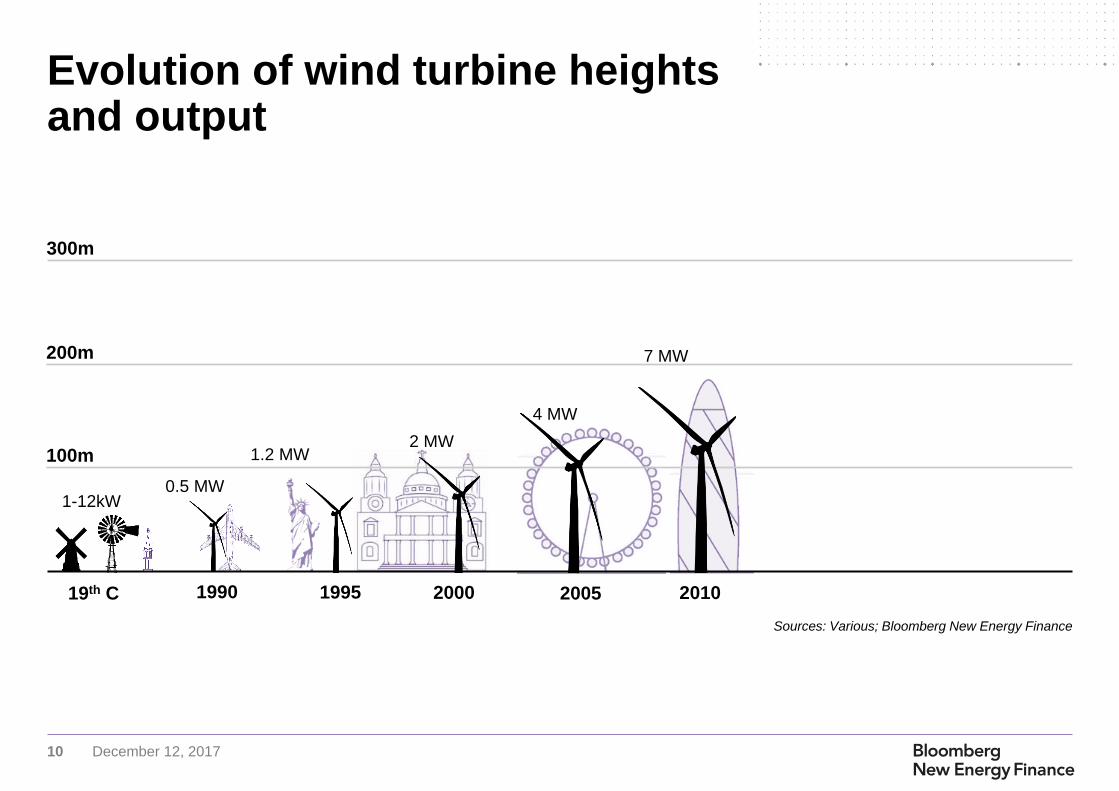
Evolution of wind turbine heights and output
2000 2005 20101995199019th C
300m
200m
100m
1-12kW0.5 MW
1.2 MW2 MW
4 MW
7 MW
Sources: Various; Bloomberg New Energy Finance

11 December 12, 2017
Evolution of wind turbine heights and output
20152000 2005 20101995199019th C
300m
200m
100m
1-12kW0.5 MW
1.2 MW2 MW
4 MW
7 MW 9 MW
Sources: Various; Bloomberg New Energy Finance
12 December 12, 2017
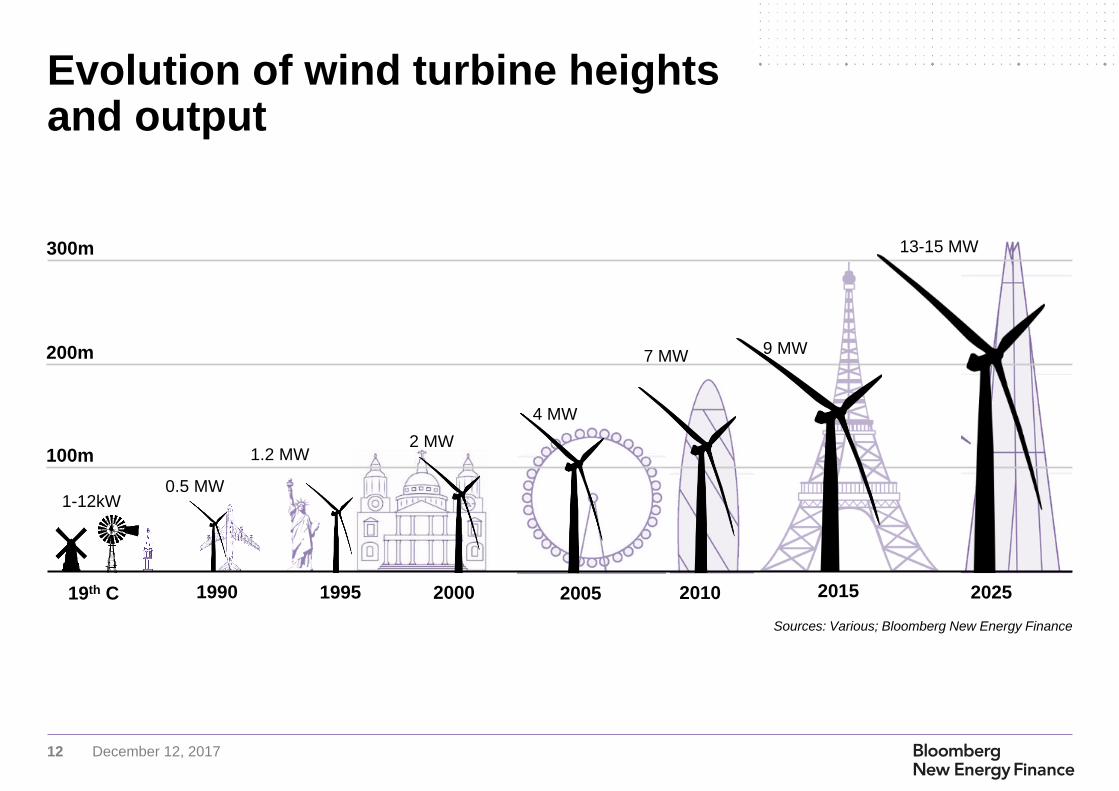
Evolution of wind turbine heights and output
202520152000 2005 20101995199019th C
300m
200m
100m
1-12kW0.5 MW
1.2 MW2 MW
4 MW
7 MW 9 MW
13-15 MW
Sources: Various; Bloomberg New Energy Finance

13 December 12, 2017
Source: Bloomberg New Energy Finance Note: Projects by commissioning date. Full dots show the project level LCOEs have been estimated using winning tariffs, tariff
duration, indexation (if applicable) and a power price assumption for the merchant tail.
Offshore wind has surprised us
Completed auction
Anholt
Horns Rev III
Danish near-shore
Krieger's Flak
Borssele I & II
Borssele III & IV
Zuid I & II
Zuid III & IV
Noord
CfD-R1-East Anglia 1
CfD-R1-Neart na Goithe
CfD-Round 2
CfD-Round 3
Gode Wind 3
BRW II, OWP West
He Dreiht
0
50
100
150
200
250
2012 2014 2016 2018 2020 2022 2024 2026 2028
Netherlands
Denmark
U.K.
Planned auction
BNEF central view
Germany
Historical BNEF central LCOE BNEF LCOE range (H2 2016)
$/MWh (2016 $)
14 December 12, 2017
Source: Bloomberg New Energy Finance,
survey participants.
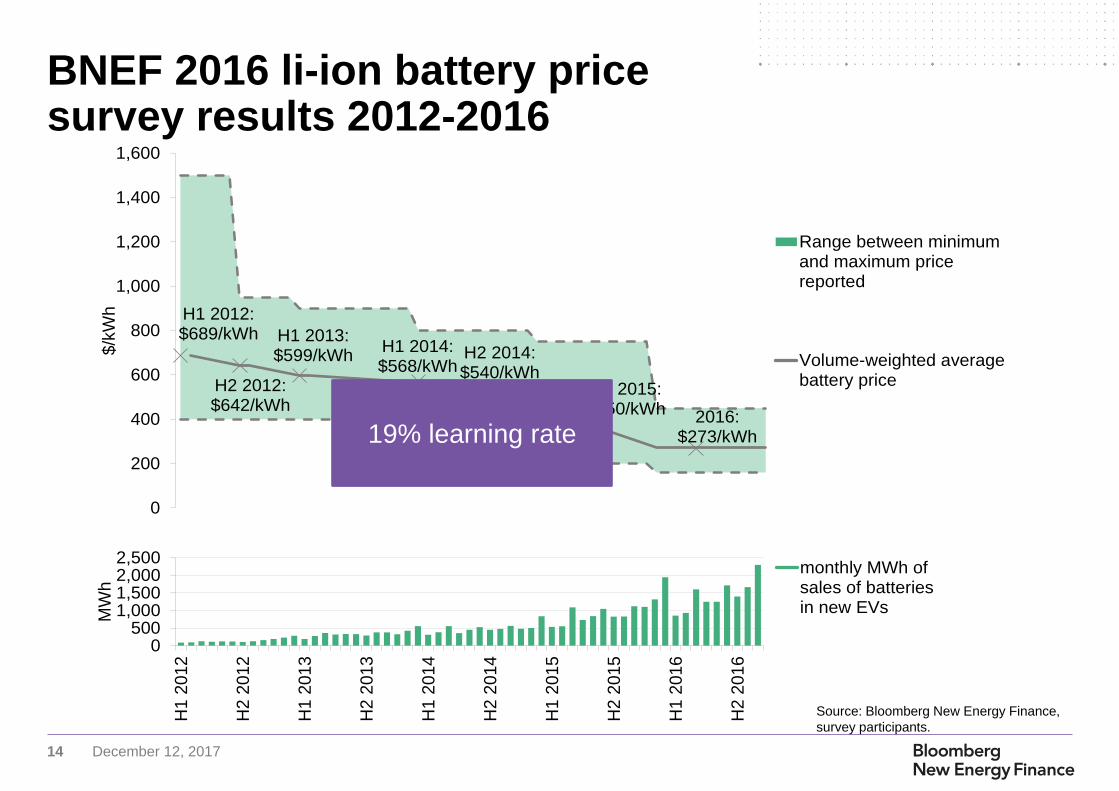
BNEF 2016 li-ion battery price survey results 2012-2016
H1 2012: $689/kWh
H2 2012: $642/kWh
H1 2013:$599/kWh
H1 2014: $568/kWh
H2 2014:$540/kWh
H2 2015:$350/kWh 2016:
$273/kWh
0
200
400
600
800
1,000
1,200
1,400
1,600
$/k
Wh
0500
1,0001,5002,0002,500
H1 2
012
H2 2
012
H1 2
013
H2 2
013
H1 2
014
H2 2
014
H1 2
015
H2 2
015
H1 2
016
H2 2
016
MW
h
689642599
Range between minimumand maximum pricereported
Volume-weighted averagebattery price
0500
1,0001,500
H1…H2…H1…H2…H1…H2…H1…
monthly MWh ofsales of batteriesin new EVs
19% learning rate
15 December 12, 2017
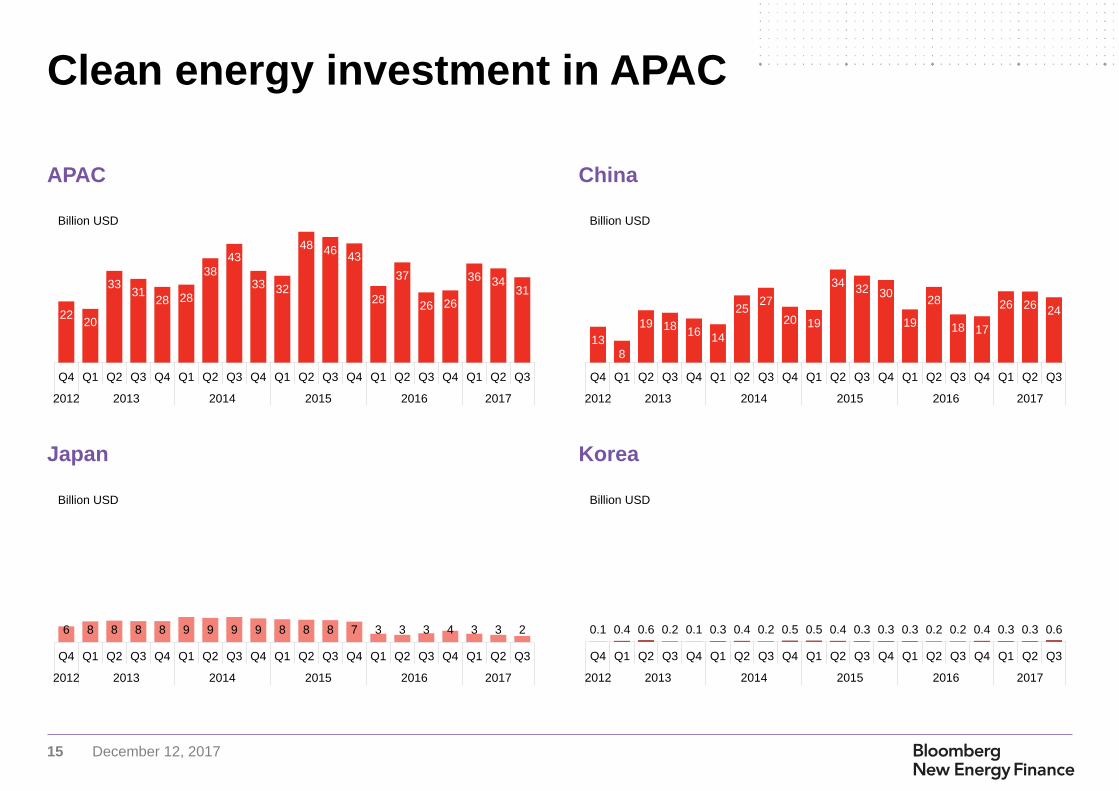
APAC China
Japan Korea
Clean energy investment in APAC
2220
3331
28 28
38
43
33 32
48 4643
28
37
26 26
36 3431
Q4 Q1 Q2 Q3 Q4 Q1 Q2 Q3 Q4 Q1 Q2 Q3 Q4 Q1 Q2 Q3 Q4 Q1 Q2 Q3
2012 2013 2014 2015 2016 2017
Billion USD
13
8
19 1816
14
2527
20 19
3432 30
19
28
18 17
26 2624
Q4 Q1 Q2 Q3 Q4 Q1 Q2 Q3 Q4 Q1 Q2 Q3 Q4 Q1 Q2 Q3 Q4 Q1 Q2 Q3
2012 2013 2014 2015 2016 2017
Billion USD
6 8 8 8 8 9 9 9 9 8 8 8 7 3 3 3 4 3 3 2
Q4 Q1 Q2 Q3 Q4 Q1 Q2 Q3 Q4 Q1 Q2 Q3 Q4 Q1 Q2 Q3 Q4 Q1 Q2 Q3
2012 2013 2014 2015 2016 2017
Billion USD
0.1 0.4 0.6 0.2 0.1 0.3 0.4 0.2 0.5 0.5 0.4 0.3 0.3 0.3 0.2 0.2 0.4 0.3 0.3 0.6
Q4 Q1 Q2 Q3 Q4 Q1 Q2 Q3 Q4 Q1 Q2 Q3 Q4 Q1 Q2 Q3 Q4 Q1 Q2 Q3
2012 2013 2014 2015 2016 2017
Billion USD

16 December 12, 2017
Source: Bloomberg New Energy Finance
Renewable energy (excluding large hydro) proportion of power generation, 2006-16
Lowest
Mid
Highest
No data
13%
30%
Spain
3%12%
Australia
6%
18%
Brazil
5% 6%
Canada
6%10%
China
9%
29%
Germany2%
25%
UK
4% 6%
India12%
25%
Italy
7%12%
Japan
3%9%
US
1% 3%
South Africa

17 December 12, 2017
Climatescope coverage, 2017
26Latin American
& Caribbean
nations
19Sub-Saharan
Africa
nations
10Asian countries,
including 25
states/provinces in
India & China
3 MENA nations
OECD Since 2012 Since 2014 Since 2016 Since 2017 Non-OECD not in Climatescope
13countries in Central Asia
and Eastern Europe
Climatescope 2017

18 December 12, 2017
Ranking and Parameters
0
0.5
1
1.5
2
2.5
3
Chin
aB
razil
Jord
an
Me
xic
oIn
dia
So
uth
Afr
ica
Chile
Ke
nya
Uru
gua
yV
ietn
am
Se
ne
ga
lIn
do
nesia
Pa
kis
tan
Hon
du
ras
Tu
rke
yR
wa
nda
Uga
nd
aC
osta
Ric
aE
gypt
Arg
en
tina
Mo
ng
olia
Sri
La
nka
Nig
eri
aN
ep
al
Pe
ruC
olo
mbia
Ba
rba
do
sG
ua
tem
ala
Ta
nzan
iaE
thio
pia
Ba
ng
lade
sh
Gh
ana
Pa
na
ma
Russia
Sie
rra
Leo
ne
Leb
an
on
Nic
ara
gu
aE
l S
alv
ad
or
Lib
eria
Ukra
ine
Ge
org
iaB
oliv
iaE
cua
dor
Cam
ero
on
Bo
tsw
an
aJam
aic
aZ
am
bia
Cote
d'Iv
oir
eD
om
inic
an R
ep
ub
licB
eliz
eM
old
ova
Haiti
Zim
bab
we
Ka
za
kh
sta
nM
ozam
biq
ue
Arm
en
iaA
zerb
aija
nB
ela
rus
Kyrg
yzsta
nM
ya
nm
ar
Ma
law
iB
aha
mas
Ta
jikis
tan
Trin
idad
& T
ob
ago
Con
go
(D
em
. R
ep.)
Gu
yan
aU
zbe
kis
tan
Ve
ne
zue
laS
urin
am
eP
ara
gu
ay
Tu
rkm
en
ista
n
Enabling Framework Financing & Investment Value Chains Greenhouse-Gas Management
Source: Bloomberg New Energy Finance, Climatescope 2017
Climatescope 2017

19 December 12, 2017
2016 2040
Global electricity generation mix
Coal37%
Gas23%
Oil4%
Nuclear10%
Hydro17%
Onshore wind4%
Utility-scale PV1%
Small-scale PV1%
24,155TWh
Coal22%
Gas16%
Nuclear9%
Hydro15%
Onshore wind15%
Utility-scale PV
12%
Small-scale PV5%
38,079TWh
Source: Bloomberg New Energy Finance
New Energy Outlook 2017

20 December 12, 2017
Source: Bloomberg New Energy Finance
Global electricity generation by fuel type
Fossil fuel
Nuclear
Solar & Wind
Other Renewables
0
2,000
4,000
6,000
8,000
10,000
12,000
14,000
16,000
18,000
2012 2016 2020 2025 2030 2035 2040
(TWh)
New Energy Outlook 2017
21 December 12, 2017
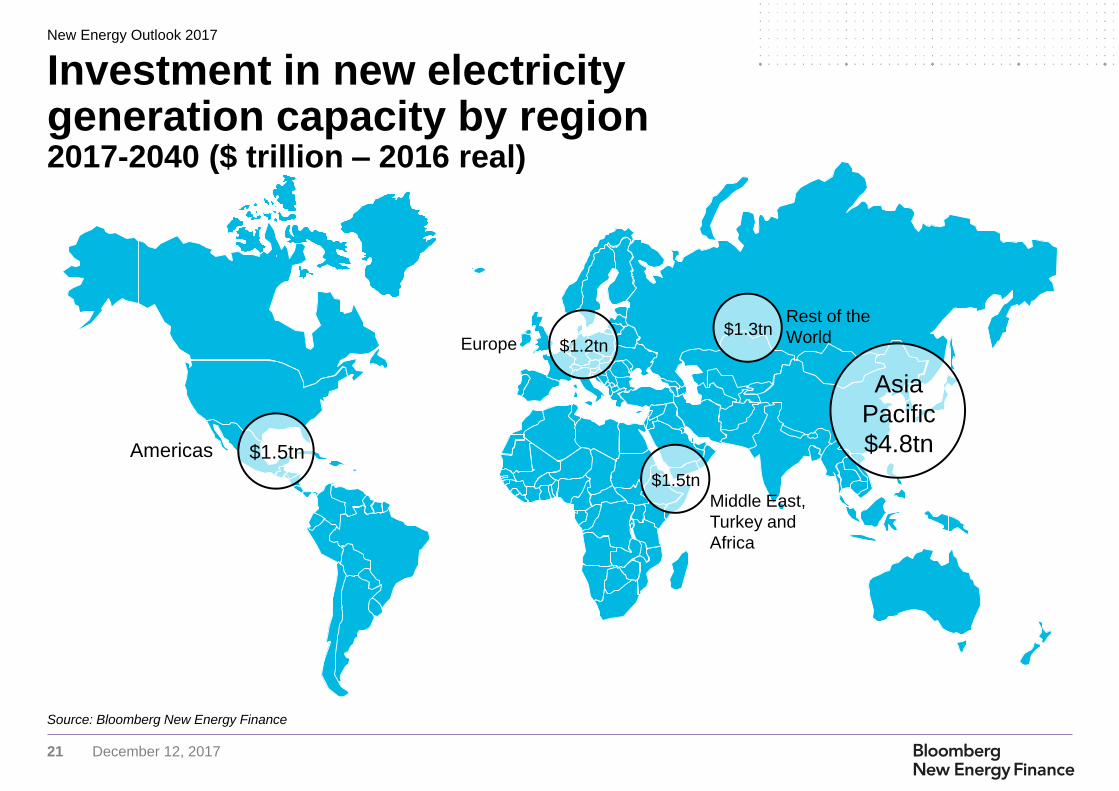
Source: Bloomberg New Energy Finance
Investment in new electricity generation capacity by region2017-2040 ($ trillion – 2016 real)
Source: Bloomberg New Energy Finance
Asia
Pacific
$4.8tn$1.5tnAmericas
$1.2tnEurope
$1.5tn
Middle East,
Turkey and
Africa
$1.3tnRest of the
World
New Energy Outlook 2017

22 December 12, 2017
Source: Bloomberg New Energy Finance
Global investment by region, 2017-2040 APAC investment by region, 2017-2040
APAC: 47% of investmentChina & India: 83% of investment in APAC
$2,823
$1,157
$431
$195
$142
$79
China
India
SE Asia
Japan
SouthKorea
Australia
($ billion - 2016 real)
Coal Gas Nuclear Hydro
Wind Solar Other
$4,828
$1,454
$1,454
$1,264
$1,185
APAC
AMER
META
RoW
Europe
($ billion - 2016 real)
Coal Gas Nuclear Hydro
Wind Solar Other
New Energy Outlook 2017

23 December 12, 2017
Source: Bloomberg New Energy Finance
Country All renewables Country PV and wind
Italy 96% Mexico 73%
Brazil 96% Iberia 63%
Iberia 86% Germany 61%
Chile 86% Italy 59%
Mexico 82% Chile 55%
Canada 79% Australia 55%
Germany 74% UK 50%
France 65% France 46%
UK 63% Brazil 43%
Australia 62% India 41%
China 55% China 39%
India 49% Thailand 39%
Thailand 49% SSA 34%
Turkey 48% South Korea 32%
Philippines 47% United States 31%
Japan 42% Japan 30%
United States 38% Philippines 30%
Malaysia 37% Turkey 28%
South Korea 34% MENA 27%
Indonesia 31% Canada 24%
Renewable penetration ranking by 2040
New Energy Outlook 2017

24 December 12, 2017
Source: Bloomberg New Energy Finance
Power sector emissions peak in 2026 but remain far from 2 trajectory
NEO2017
NDC trajectory
0
2,000
4,000
6,000
8,000
10,000
12,000
14,000
16,000
2012 2016 2020 2025 2030 2035 2040
(MtCO2)
NEO2017
NEO2017 - 2deg trajectory
0
2,000
4,000
6,000
8,000
10,000
12,000
14,000
16,000
2012 2016 2020 2025 2030 2035 2040
(MtCO2)
Global power sector CO2 emissions trends and
Paris Agreement targets (NDC)
Global power sector CO2 emissions trends and
the 2 degree pathway
New Energy Outlook 2017

25 December 12, 2017
This publication is the copyright of Bloomberg New Energy Finance. No portion of this document may be photocopied,
reproduced, scanned into an electronic system or transmitted, forwarded or distributed in any way without prior consent of
Bloomberg New Energy Finance.
The information contained in this publication is derived from carefully selected sources we believe are reasonable. We do not
guarantee its accuracy or completeness and nothing in this document shall be construed to be a representation of such a
guarantee. Any opinions expressed reflect the current judgment of the author of the relevant article or features, and does not
necessarily reflect the opinion of Bloomberg New Energy Finance, Bloomberg Finance L.P., Bloomberg L.P. or any of their
affiliates ("Bloomberg"). The opinions presented are subject to change without notice. Bloomberg accepts no responsibility
for any liability arising from use of this document or its contents. Nothing herein shall constitute or be construed as an
offering of financial instruments, or as investment advice or recommendations by Bloomberg of an investment strategy or
whether or not to "buy," "sell" or "hold" an investment.
Copyright and disclaimer
Coverage.
Renewable Energy
Power & Utilities
Gas
Carbon Markets & Climate Negotiations
Energy Smart Technologies
Storage
Electric Vehicles
Mobility and Autonomous Driving
Frontier Power
Emerging Technologies
Bloomberg New Energy Finance is a
research firm that helps energy
professionals generate opportunities. With a
team of experts spread across six
continents, BNEF provides independent
analysis and insight, enabling decision-
makers to navigate change in an evolving
energy economy.
BNEF research and analysis is accessible
via web and mobile platforms, as well as on
the Bloomberg Terminal.
about.bnef.com
@BloombergNEF
Ali Izadi