Investment Incentives for Renewable Energy in Southeast Asia: Case

World Bank’s Engagement on
Renewable Energy in Central Asia
Mits Motohashi
Senior Energy Specialist
World Bank Group Energy & Extractives

1. Overview of World Bank’s Renewable Energy Portfolio

Renewable Energy-related Targets in Climate
Change Action Plan
Targets Progress Next Steps
De-risk Renewable
Energy (RE)
investments, add 20 GW
RE generation and
enable 10 GW RE
integrated into grids by
2020
• In 2016-2017,
approximately 10 GW of
RE approved or under
advanced stages of
preparation (hydro,
geothermal, with solar
PV contributing the
largest share)
• Scale up solar PV, wind and
geothermal by crowding in the
private sector through risk
mitigation and buying down
cost
• Expand into newer riskier
markets (storage, floating solar
PV, hybrid systems)
Mobilizing US$25 billion
commercial funds for
clean energy over FY16-
20
• In 2016-2017, projects
approved and under
advanced stages of
preparation expected to
mobilize $6.5 billion
• Expanded use of guarantees
• Scale up of climate funds
necessary for continued
mobilization ($1 of climate
funds have leveraged up to $4
of private financing)

4
World Bank’s Financial Instruments for
Renewable Energy Development
Financing Modalities
Direct Loan Lines of Credits
Dedicated Debt or
Equity/Quasi-Equity
Funds
Competitive SubsidiesOutput Based Aid
(OBA)Matching Grants
First or Second Loss
GuaranteesRisk Sharing Products
...and many more
tailored ones

5
Share of Renewable Energy: $9.6 billion out of $45 billion
(Energy and Extractives Lending FY10-16)

6
Hydro is the Dominant Sub-technology
(Energy and Extractives FY10-16)
Bioenergy1%
Geothermal7%
Hydropower42%
Solar22%
Technical Assistance
3%
Unspecified RE
21%
Wind4%
$9.6
billion

7
Share of Non-Hydro Renewable Energy is Increasing
(Energy and Extractives Lending FY10-16)
1257
18051740
447
2044
1040
1262
0
500
1000
1500
2000
2500
FY10 FY11 FY12 FY13 FY14 FY15 FY16
USD
m
Unspecified RE
Technical Assistance
Hydropower
Wind
Solar PV
Solar CSP
Geothermal
Bioenergy

8
Regional Shares of Non-Hydro Renewable Energy
(Energy and Extractives FY10-16)
23%
22%
5%11%
9%
29%
Africa
East Asia and Pacific
Europe and Central Asia
Latin America and the Caribean
Middle East and North Africa
South Asia

2. Regulatory Indicators for Sustainable Energy (RISE) – with Special Reference to Renewable
Energy in Central Asia

Regulatory Indicators for Sustainable Energy
(RISE)
• Pilot was conducted in 17 countries in
2014, first global edition was published
early 2017.
• 27 indicators and 80 sub-indicators to
capture the quality of policies and
regulations for energy access,
renewable energy and energy efficiency.
• Covers 111 countries across the
developed and developing countries,
accounting for more than 90 percent of
global population and energy
consumption.
• Will be published biennially (next report
scheduled in 2018).
http://rise.esmap.org/

RISE IndicatorsPolicies and Regulations Administrative
Procedures
Energy
Access
• Existence and
monitoring of
officially approved
electrification plan
• Scope and officially
approved
electrification plan
• Framework for grid
electrification
• Framework for mini-
grids
• Framework for stand-
alone systems
• Consumer
affordability of
electricity
• Utility transparency
and monitoring
• Utility
creditworthiness
• Establishing a new
household grid
connection
• Permitting a new
mini-grid
Energy
Efficiency
• National energy
efficiency planning
• Energy efficiency
entities
• Information provided
to electricity
consumers
• Incentives from
electricity rate
structures
• Mandates &
incentives: large
consumers
• Mandates &
incentives: public
sector
• Mandates &
incentives: utilities
• Financing
mechanisms for
energy efficiency
• Minimum energy
performance
standards
• Energy labeling
systems
• Building energy
codes
• Carbon pricing and
monitoring
• Securing energy
efficiency appliance
standards
certification
Renewable
Energy
• Legal framework for
renewable energy
• Planning for
renewable energy
expansion
• Incentives &
regulatory support for
renewable energy
• Attributes of financial
and regulatory
incentives
• Network connection
and access
• Counterparty risk
• Carbon pricing and
monitoring
• Permitting a new
renewable energy
project

Policies and RegulationsAdministrative
Procedures
Planning for
renewable energy
expansion
• Renewable energy
targets and plans
• Renewable energy
in generation
planning
• Renewable energy
in transmission
planning
• Resource data and
siting
Attributes of financial
and regulatory
incentives
• Predictability and
efficiency (policy-
neutral)
• Predictability and
efficiency (policy-
specific)
• Long-term sustainability
Legal framework for
renewable energy
• Primary legislation
• Legal private
ownership of
generation
Incentives & regulatory
support for renewable
energy
• Financial and
regulatory incentives
• Grid access and
dispatch
Network connection
and access
• Connection cost
allocation
• Network usage and
pricing
• Renewable grid
integration
Counterparty Risk
• Payment risk
reduction
• Utility creditworthiness
• Utility transparency
and monitoring
Carbon pricing and
monitoring
• Carbon pricing
mechanism
• Monitoring, reporting
and verification (MRV)
system
RISE score: 7 indicators and 18 sub-indicators Not scored: 1 indicator and 1
sub-indicator
Permitting a new
renewable energy
project
• Time and number of
procedures
RISE Renewable Energy Indicators

13
Questions Scoring Traffic light
I. Legal framework for renewable energySum and divide
by 2
1. Primary legislation
1.1 Does a legal framework for renewable energy development
exist?
Yes – 100, No – 0 If the score X
is:
x 67
33 < x < 67
33 ≤ x
2. Legal private ownership of generation
2.1 Is the private sector ownership of renewable energy generation
legally authorized?
Yes – 100, No – 0
Legal framework for renewable energy
RISE Renewable Energy Indicators
Scoring Calculation Details
14
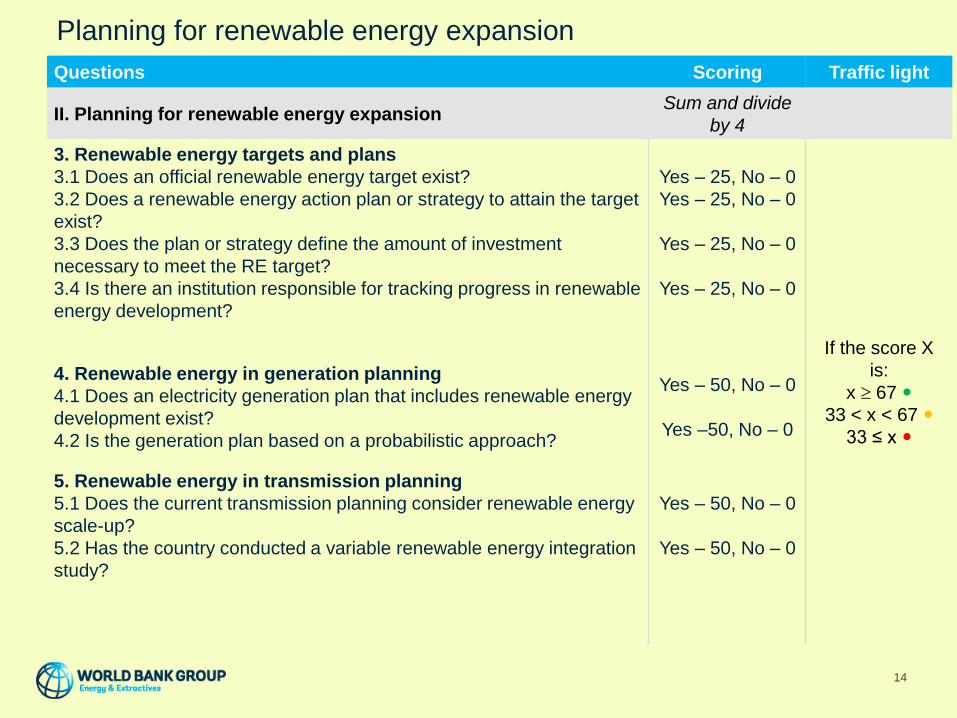
Questions Scoring Traffic light
II. Planning for renewable energy expansionSum and divide
by 4
3. Renewable energy targets and plans
3.1 Does an official renewable energy target exist?
3.2 Does a renewable energy action plan or strategy to attain the target
exist?
3.3 Does the plan or strategy define the amount of investment
necessary to meet the RE target?
3.4 Is there an institution responsible for tracking progress in renewable
energy development?
Yes – 25, No – 0
Yes – 25, No – 0
Yes – 25, No – 0
Yes – 25, No – 0
If the score X
is:
x 67
33 < x < 67
33 ≤ x
4. Renewable energy in generation planning
4.1 Does an electricity generation plan that includes renewable energy
development exist?
4.2 Is the generation plan based on a probabilistic approach?
Yes – 50, No – 0
Yes –50, No – 0
5. Renewable energy in transmission planning
5.1 Does the current transmission planning consider renewable energy
scale-up?
5.2 Has the country conducted a variable renewable energy integration
study?
Yes – 50, No – 0
Yes – 50, No – 0
Planning for renewable energy expansion

15
Questions Scoring Traffic light
II. Planning for renewable energy expansion Cont…
6. Resource data and siting
For each relevant RE technology:*
6.1 Does the government publish or endorse a resource atlas or other
data on the abundance and quality of the resource?
6.2 To what existent does the map follow best practices of data quality
and availability?
6.3 Has the country carried out strategic planning or produced zoning
guidance to inform the commercial development of the resource?
6.4. Has the planning or zoning guidance been carried out according to
best practice by 1) being undertaken as part of a strategic
environmental and social assessment or equivalent process; and 2)
making the outputs publically available?
* A relevant technology is one for which the country has a specific
resource target or, if no resource targets exist, has high resource
potential according to IRENA country profiles.
Yes – 25, No – 0
0–25 – scale
Yes – 25, No – 0
0–25 – scale
Sum and divide
by number
of relevant
technologies
If the score X
is:
x 67
33 < x < 67
33 ≤ x
Planning for renewable energy expansion

16
Questions Scoring Traffic light
III. Incentives and regulatory support for renewable energy Sum and divide
by 2
7. Financial and regulatory incentives for renewable energy
7.1 Is there at least one scheme to support renewable energy per unit
of electricity generated? (e.g. feed-in tariff, competitive bidding/auction,
mandates, generation premiums, production tax credits)?
7.2 Does the government offer other direct fiscal incentives for
renewable energy (e.g. capital subsidies, grants or rebates, investment
tax credits, tax reductions?)
Yes – 50, No – 0
Yes – 50, No – 0
If the score X
is:
x 67
33 < x < 67
33 ≤ x
8. Grid access and dispatch
8.1 Does the country provide guaranteed access to the grid for RE?
8.2 Do RE projects receive priority in dispatch?
8.3 Are there provisions to compensate seller if offtake infrastructure is
not built in time?
8.4 Are there mechanisms to compensate RE projects for lost
generation due to certain curtailments after project commissioning?
Yes – 25, No – 0
Yes – 25, No – 0
Yes – 25, No – 0
Yes – 25, No – 0
Incentives and regulatory support for renewable energy

17
Questions Scoring Traffic light
IV. Attributes of financial and regulatory incentivesSum and divide by
3
9. Predictability and efficiency (policy- neutral)
9.1 Is the market entry mechanism for private RE projects defined? (e.g. 1st
come 1st served, tenders)
9.2 Are projects subject to development timelines or milestones?
9.3 Are tariffs indexed (in part or in whole) to an international currency or to
inflation?
Yes – 33.3, No – 0
Yes – 33.3, No – 0
Yes – 33.3, No – 0
If the score X
is:
x 67
33 < x < 67
33 ≤ x
10. Predictability and efficiency (policy- specific)
10.1 If there is a guaranteed tariff, is there a mechanism to adjust the level
of the tariff for new entrants (e.g. declination)?
10.2 If there is a guaranteed tariff, is there a mechanism to differentiate
tariffs based on the size of the generation plant?
10.3 If there is competitive bidding/auctions, are there provisions to ensure
full and timely project completion (e.g. bid-bonds, project milestones,
eligibility requirements)
10.4 If there is a renewable energy mandate, can it be met with tradable
certificates (e.g. RECs, ROCs, TECs)
11. Long-term Sustainability
11.1 Is the price subsidy/benefit implied by a renewable energy incentive
program passed through in full or in part to the final electricity consumer?
Yes – 100, No – 0
Yes – 100, No – 0
Yes – 100, No – 0
Yes – 100, No – 0
Divide by the
number of relevant
incentives in place
Yes – 100, No – 0
Attributes of financial and regulatory incentives

18
Questions Scoring Traffic light
V. Network connection and accessSum and divide by
3
12. Connection cost allocation
12.1 Are there rules defining the allocation of connection costs?
12.2 What is the type of the connection cost allocation policy (i.e.
shallow/deep)?
13. Network usage and pricing
13.1 Are there rules that allow electricity customers to purchase power
directly from a third party (i.e. an entity other than the designated utility
in a service area)?
13.2 Do the rules define the size and allocation of costs for use of the
transmission and distribution system (e.g. wheeling charges, locational
pricing?)
14. Renewable grid integration
14.1 Does the country have a grid code that includes measures or
standards addressing variable renewable energy?
14.2 Are there rules for exchanging power between balancing areas that
penalize variable renewable energy (e.g. through imbalance penalties)?
*
14.3 Are there provisions in the power exchange rules that allow for
plant forecasting?*
*Only scored in countries with multiple balancing areas.
Yes – 50, No – 0
Shallow – 50,
Deep – 0
Yes – 50, No – 0
Yes – 50, No – 0
Yes – 33.3, No – 0
Yes – 0, No – 33.3
Yes – 33.3, No – 0
If the score
X is:
x 67
33 < x < 67
33 ≤ x
Network connection and access

Counterparty risk
19
Questions ScoringTraffic
light
VI. Counterparty riskSum and divide by
3
15. Payment risk mitigation
15.1 Does the government offer or allow backing of utility power
purchase payments (e.g. through a letter of credit, escrow account,
payment guarantee, or other)?
16. Utility Transparency and Monitoring
16.1. Are the financial statements of the largest utility publicly
available?
Yes – 100, No – 0
If the score
X is:
x 67
33 < x < 67
33 ≤ x
a) generation Yes – 25/8, No – 0
b) transmission Yes – 25/8, No – 0
c) distribution Yes – 25/8, No – 0
d) retail sales Yes – 25/8, No – 0
If yes, are they audited by an independent auditor?
e) generation Yes – 25/8, No – 0
f) transmission Yes – 25/8, No – 0
g) distribution Yes – 25/8, No – 0
h) retail sales Yes – 25/8, No – 0

Counterparty risk
20
Questions ScoringTraffic
light
VI. Counterparty risk Cont…
16.2. Are the following metrics published in a primary official
document (by the utility, regulator or ministry and/or government)?
If the score
X is:
x 67
33 < x < 67
33 ≤ x
a) Transmission - Transmission loss rate Yes – 25/4, No – 0
b) Distribution - Distribution loss rate Yes – 25/4, No – 0
c) Retail sales – Bill collection rate Yes – 25/4, No – 0
d) Retail sales– Energy available to end users Yes – 25/4, No – 0
16.3. Is the utility operating an incidence/outage recording system
(or SCADA/EMS with such functionality)?
Yes – 25, No – 0
16.4. Is the utility measuring the SAIDI and SAIFI or any other
measurements for service reliability?
Yes – 25/3, No – 0
a) Are the measurements reported to the regulatory body? Yes – 25/3, No – 0
a) Are the measurements available to public? Yes – 25/3, No – 0

Counterparty risk (cont.)
21
Questions Scoring Traffic light
VI. Counterparty Risk Cont…
17. Utility Financial ViabilitySum
17.1. Current ratio <1 -- 0
in between -- scale
>= 1.2 – 25
If the score X
is:
x 67
33 < x < 67
33 ≤ x
17.2. EBITDA margin <0 -- 0
in between -- scale
>= 15% -- 25
17.3. Debt service coverage ratio <1 -- 0
in between -- scale
>= 1.2 -- 25
17.4. Days payable outstanding >180 -- 0
in between -- scale
<=90 -- 25

Carbon Pricing and Monitoring
22
Questions Scoring Traffi7 light
VII. Carbon pricing and monitoring Sum
18.1 GHG emissions coverage under any carbon pricing mechanism100% coverage
– 50,
< 100% – scaled
If the score X
is:
x 67
33 < x < 67
33 ≤ x 18.2 Monitoring, reporting and verification system for greenhouse gas
emissions in placeYes – 50, No – 0

RISE Renewable Energy Score Distribution by
Indicators – Global (1/2)

RISE Renewable Energy Score Distribution by
Indicators – Global (2/2)

RISE Renewable Energy Score Distribution by
Indicators – Central Asia
Indicators Kazakhstan Kyrgyz
Republic
Tajikistan Uzbekistan Global
Average
1.Legal framework for renewable energy 100 100 100 100 83
2.Planning for renewable energy expansion 65 43 38 31 53
3.Incentives and regulatory support for renewable energy 75 75 38 38 59
4.Attributes of financial and regulatory incentives 83 33 67 33 57
5.Network connection and pricing 92 58 0 0 43
6.Counterparty risk 36 64 12 8 54
7.Carbon pricing and monitoring 78 0 0 0 16
Total 76 53 36 30 52

3. World Bank Energy Program in Central Asia

Examples of World Bank Energy Program in
Central Asia
• Renewable energy development (Wind resource assessment and proposed development in UZB, IFC’s proposed solar advisory in UZB)
• Regional cooperation (below)
Diversification of Energy-mix
• Energy efficiency for industrial enterprises (UZB)
• District heating and building energy efficiency (KAZ, KYR, TAJ, UZB)
Demand-side Energy Efficiency
• Renewable energy generation (SHPP TA in KYR, HPP in TAJ)
• Modernization of key transmission and distribution networks (KYR, UZB)
Supply Adequacy and Efficiency
• Power system planning (KAZ, UZB) and dispatch efficiency assessment (UZB)
• Tariff and subsidies studies (KYR, TAJ, UZB)
• Support to regulator (KYR)
• Advanced metering (KYR, UZB)
• Support to utility corporate governance (KYR, UZB)
Institutional Development
• Central Asia Regional Economic Cooperation Program (CAREC)
• Central Asia Energy and Water Development Program (CAEWDP)
• Regional interconnection (CASA-1000)
Regional Cooperation

4. Cases from Other Regions

De-risking: Maldives Accelerating Sustainable
Private Investment in RE (ASPIRE)
29Source: World Bank
• Up to 35-50MW of PV
• WB provides off-take and
liquidity guarantee
• Potential subsidy for smaller
islands and batteries

30
De-risking: Scaling Solar (Zambia Case)
Sites: West Lunga Mosi-oa Tunya
Neoen/ First Solar Usc 6.02/kWh
ENEL Green Power USc 7.84/kWh
• Projects were developed and tender was prepared and executed to
conclusion in 9 months; round 2 for 200MW already announced
• USc 6/kWh non-indexed is equivalent to an average in current dollars
over contract lifetime of USc 4.7/kWh
• All bidders who submitted an offer requested the IDA payment
guarantee; no IDA loan guarantee was needed

I
Surface Reconnaissance
($1-2 mil)
II
Exploration Drilling
($20-30 mil)
III
Production Drilling
(~$20-120 mil)
IV
SAGS +Power Plant
(~$20-200 mil)
V
Operation + Maintenance
Identification of Resource
High Resource RiskLower Resource Risk
Financing RiskFinancing Risk Operational Risk
Pro
ject R
isk
Develo
pm
ent
Phases
Type
of
Ris
k
Cum
ula
tive C
osts
of D
evelo
pm
ent
De-risking: Geothermal Resource Risk
31
Source: Energy Sector Management Assistance Program
Global Geothermal Development PlanMarch 2015
About $1 billion
5-8 times leverage

Reducing Financing Cost: Morocco Noor CSP Complex
32
• 2,000 MW target
• 500 MW plus storage
under development
• WB financing only
$400 milllion
• About $3 billion
financing
• Tariff evolution:
Source: CNN

Reducing Financing Cost: Solar Rooftops in India
• $500 million World Bank (IBRD)
• $125 million Clean Technology Fund
• $25 million Global Environmental Fund
• 1,000MW (Government target is 40,000GW)
• State Bank of India is the borrower and implementing agency
• Multiple delivery
models
33
Picture credit: Renewable Energy Magazine
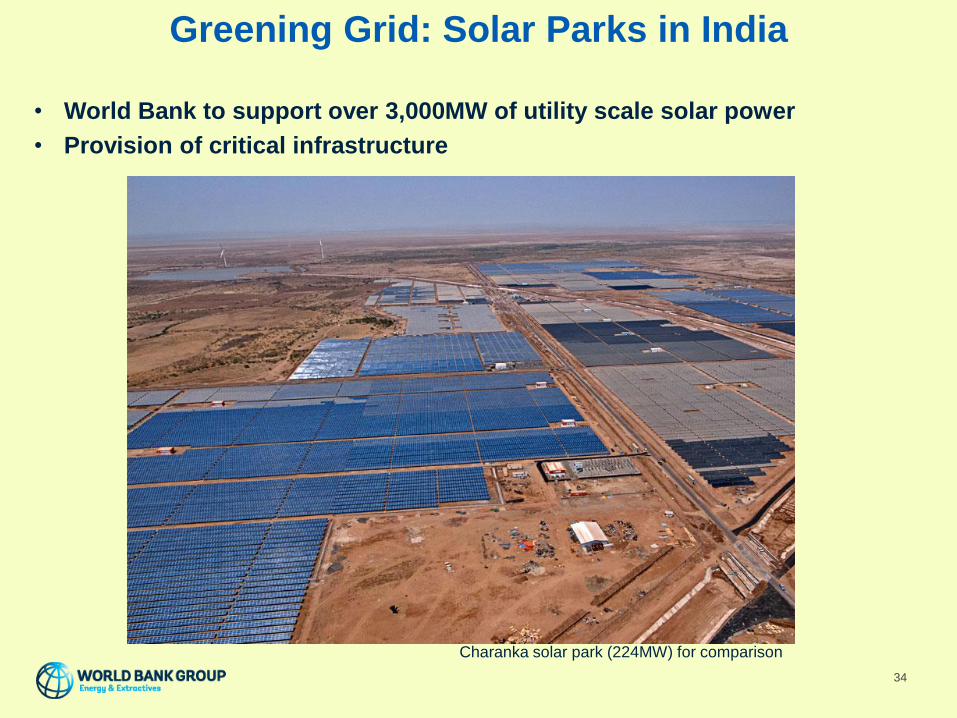
Greening Grid: Solar Parks in India
• World Bank to support over 3,000MW of utility scale solar power
• Provision of critical infrastructure
34
Charanka solar park (224MW) for comparison

Greening Grid: Smart grids in Ukraine, Vietnam
and Turkey
35
Source: World Bank
Traditional Distribution System
Distribution System of the Future

THANK YOU!