Removal of Strontium Ions in Aqueous Solution by Polymer Enhanced
73
i | Page Removal of Strontium Ions in Aqueous Solution by Polymer Enhanced Ultra-filtration A Major Qualifying Project Report Submitted to the Faculty of Worcester Polytechnic Institute In partial fulfillment of the requirements for the Degree of Bachelor of Science By ___________________ Ningwei Li April 14 th 2010 Approved: ____________________________ Professor Susan Zhou, Advisor Professor David DiBiasio, Co-Advisor
Transcript of Removal of Strontium Ions in Aqueous Solution by Polymer Enhanced

i | P a g e
Removal of Strontium Ions in Aqueous Solution by Polymer
Enhanced Ultra-filtration
A Major Qualifying Project Report
Submitted to the Faculty of
Worcester Polytechnic Institute
In partial fulfillment of the requirements for the
Degree of Bachelor of Science
By
___________________ Ningwei Li
April 14th 2010
Approved:
____________________________
Professor Susan Zhou, Advisor
Professor David DiBiasio, Co-Advisor

ii | P a g e
Abstract
It is shown in many laboratories and pilot plants that membrane techniques are more effective
than other traditional treatments for low level radioactive liquid waste. By applying membrane
techniques, energy consumption can be reduced and better removal rate can be achieved. In
this project, research on a polymer enhanced ultra-filtration process for strontium ions removal
was conducted. A dead end ultra-filtration system was used. Operating parameters such as feed
pH values and polymer loading ratio were varied in order to optimize the system. Up to 10% of
strontium ions in the feed were removed and the system can be further improved.
iii | P a g e
Acknowledgements
Thank you to Professor Zhou, Professor DiBiasio and Professor Shao for offering me this
opportunity to complete my project in Shanghai, as well as providing me instructions and
supports throughout the project. In addition, thank you to Miss Wenxi Li, the graduate student
from SJTU who worked with me, for offering me help and answering my questions during my
experiments. Finally, thank you to the staffs of IGSD, who offered this fantastic study abroad
opportunity to me.

iv | P a g e
Table of contents
ABSTRACT .............................................................................................................................................................. II
ACKNOWLEDGEMENTS ......................................................................................................................................... III
TABLE OF CONTENTS ............................................................................................................................................. IV
TABLE OF FIGURES ................................................................................................................................................ VI
TABLE OF TABLES ................................................................................................................................................. VII
INTRODUCTION ..................................................................................................................................................... 1
BACKGROUND ....................................................................................................................................................... 3
NUCLEAR ENERGY .......................................................................................................................................................... 3
RADIOACTIVE WASTES ..................................................................................................................................................... 4
Uranium fuel cycle ................................................................................................................................................ 5
Sources and characteristics of LLRLW ................................................................................................................... 6
TREATMENTS FOR LLRLW ............................................................................................................................................... 7
Chemical precipitation .......................................................................................................................................... 7
Evaporation ........................................................................................................................................................... 8
Electrodialysis ....................................................................................................................................................... 9
Activated carbon adsorption ............................................................................................................................... 10
Ion-exchange ....................................................................................................................................................... 10
APPLICATION OF MEMBRANE TECHNIQUES IN LLRLW TREATMENTS ....................................................................................... 11
Variety of membrane techniques ........................................................................................................................ 11 Reverse osmosis ............................................................................................................................................................... 11 Membrane Distillation...................................................................................................................................................... 13
Polymer enhanced ultra-filtration (PEUF) using Chitosan ................................................................................... 14
METHODOLOGY ................................................................................................................................................... 18
SET-UP OF THE PEUF PROCESS ....................................................................................................................................... 18
MEMBRANE PREPARATION ............................................................................................................................................. 19
SOLUTION PREPARATION ................................................................................................................................................ 19
MEMBRANE FLUX MEASUREMENT ................................................................................................................................... 20
CHITOSAN PERMEATION ................................................................................................................................................ 21
CHITOSAN ENHANCED ULTRA-FILTRATION .......................................................................................................................... 22
EXPERIMENTS ON DIFFERENT PH VALUES: .......................................................................................................................... 23
EXPERIMENTS ON DIFFERENT LOADINGS ............................................................................................................................ 24
MEMBRANE CLEANING .................................................................................................................................................. 24
RETENTION RATE CALCULATION ....................................................................................................................................... 25
RESULTS AND DISCUSSIONS ................................................................................................................................. 26
CHITOSAN PERMEATION ................................................................................................................................................ 26
ULTRA-FILTRATION EXPERIMENTS ON DIFFERENT FEED PH VALUES .......................................................................................... 28

v | P a g e
ULTRA-FILTRATION EXPERIMENTS ON DIFFERENT FEED LOADINGS ........................................................................................... 30
MEMBRANE FOULING ................................................................................................................................................... 32
MEMBRANE CLEANING .................................................................................................................................................. 36
CONCLUSIONS AND RECOMMENDATIONS ........................................................................................................... 39
REFERENCES ......................................................................................................................................................... 41
APPENDIX ............................................................................................................................................................ 44
A. MEMBRANE FLUXES DATA .................................................................................................................................... 44
B. MEMBRANE CLEANING ......................................................................................................................................... 65
C. STANDARD CURVES FOR STRONTIUM CONCENTRATION MEASUREMENT ......................................................................... 66

vi | P a g e
Table of figures
FIGURE 1 WORLD ELECTRICITY GENERATION4 .......................................................................................................................... 4
FIGURE 2 THE NUCLEAR FUEL CYCLE8 ..................................................................................................................................... 6
FIGURE 3 EVAPORATION OF CONTAMINATED LIQUID EFFLUENT14
................................................................................................. 9
FIGURE 4 MEMBRANE SEPERATION PROCESSES21
................................................................................................................... 12
FIGURE 5 MOLECULAR STRUCTURE OF CHITOSAN25
................................................................................................................. 15
FIGURE 6 PICTURE OF THE ULTRA-FILTRATION UNIT ................................................................................................................. 18
FIGURE 7 PERCENTAGE OF CHITOSAN PERMEATES FROM FEED ................................................................................................... 27
FIGURE 8 STRONTIUM NITRATE CONCENTRATION IN THE EFFLUENTS VERSUS DIFFERENT OPERATING PH VALUES .................................. 29
FIGURE 9 STRONTIUM NITRATE CONCENTRATION IN THE EFFLUENT VERSUS DIFFERENT LOADINGS ..................................................... 31
FIGURE 10 RETENTION RATES VERSUS DIFFERENT LOADINGS ...................................................................................................... 32
FIGURE 11 MEBRANE FOULING IN CHITOSAN PERMEATION EXPERIMENT ..................................................................................... 33
FIGURE 12 MEMBRANE FLUXES CHANGES OF MEMBRANE 1 FOR CHITOSAN PERMEATION ............................................................... 34
FIGURE 13 MEMBRANE FLUXES CHANGES OF MEMBRANE 4 ...................................................................................................... 35
FIGURE 14 RESUTLS OF CLEANING EXPERIMENT OF MEMBRANE 4 ............................................................................................... 38

vii | P a g e
Table of tables
TABLE 1 STRONTIUM NITRATE CONCENTRATION IN THE EFFLUENTS UNDER DIFFERENT OPERATING PH VALUES ..................................... 29
TABLE 2 DATA OF RETENSION RATES AND EFFUENT CONCENTRATION UNDER DIFFERENT LOADINGS ................................................... 32
TABLE 3 FOULING OF THE MEMBRANES ................................................................................................................................. 36

1 | P a g e
Introduction
As a clean and promising energy source, nuclear energy is getting more and more widely
used around the world nowadays. Radioactive wastes generated from the nuclear power plant
therefore become an environmental concern. Due to the hazard of the radioactive waste to the
environment and public health, the waste need to be treated before discharged to the
environment.1
Traditional treatments on radioactive liquid waste usually are direct evaporation,
conventional filtration, chemical precipitation, activated carbon adsorption and electrodialysis,
or combinations of these processes. However, these traditional processes generate large
amount of radioactive solid waste, and the treated liquid usually is not safe enough to be
discharged directly to the environment.2
In the past five to ten years, membrane technology has been applied to radioactive
liquid waste treatment in order to get a better solution to radioactive liquid waste.2 In the case
of this major qualifying project (MQP), a polymer-enhanced ultra-filtration (PEUF) process for
low level radioactive waste water treatment is studied. In this project, treatments for
radioactive waste containing 90Sr were focused. In the experiments, non-radioactive solution of
strontium nitrate was used instead of 90Sr for simplification and safety concerns. The
membrane used in the process is polyethersulfone (PES) due to its resistance to radioactivity.
Polymer used to enhance the ultra-filtration process was water soluble Chitosan, a polymer
that can be obtained from sea food waste.
2 | P a g e
The main objective of this project is to find the optimal operating conditions of the PEUF
process for strontium ion removal. Operating parameters that affect the effluent
concentrations significantly are pH values, concentration and polymer to metal ratio in the feed
stream, as well as complexation reaction time and stirring rate of the continuous stirred
reactor. In this project, pH values and polymer to metal ratio of the feed stream were varied
aiming to find the optimal conditions. Also, fouling of membranes and cleaning techniques
were investigated.

3 | P a g e
Background
Nuclear Energy
Nuclear energy is an energy obtained from a process called fission, in which uranium
atoms split. The energy released from the fission process can be used to heat up steam, which
can be put through a turbine and generate electricity.3 Compared to traditional power plants, in
which fossil fuels are burned to generate electricity, nuclear power plants are much less
harmless to the environment if operated correctly. There is no carbon dioxide, sulfur dioxide or
nitrogen oxides emitted from a nuclear power plant.3 Even though fossil fuels are needed in the
uranium mining and enrichment process, the amount of fossil fuels used is still much less than
the amount used in a fossil fuel based power plant. Uranium is a non-renewable resource.
However, a nuclear power plant is much more efficient than a traditional fossil fuel based
power plant. The heat produced by the fission of a uranium ion is 10 million times of the heat
produced by combustion of a carbon ion from coal. Studies show that the existing uranium
resource is abundant for the present nuclear reactors for hundreds of years. Also, except for
the conventional uranium resources, there exist many other cheap uranium resources, such as
uranium in sea water and uranium impurity in coal. Such resources will not be exhausted in
some thousands of years.4 As fossil fuels resources are getting scarce and other clean energy
alternatives such as solar energy are not mature enough to be used, nuclear energy is very
likely to be the most certain future source.

4 | P a g e
After the first commercial nuclear energy station started operation in the 1950s, many
nuclear power plants were built every year all around the world. Up until today, there are more
than 400 commercial nuclear reactors under operation in 30 countries, and provide about 14%
of the world’s electricity as shown in figure 1.5-6
Figure 1 World Electricity Generation6
Radioactive wastes
However, due to the wide spread of nuclear power plants, public raised concerns over
nuclear safety. Radioactive materials used and generated during nuclear reaction are highly
hazardous to the environment and public health, and therefore need to be carefully handled,
recycled or disposed.1 A nuclear accident in a nuclear power plant will of course release
5 | P a g e
radioactive materials to the environment, 7 but wastes generated from nuclear reactors are also
radioactive.1 It can be very dangerous If such wastes are not well treated before discharged to
the environment. In United States, radioactive wastes are categorized into high-level,
transuranic and low-level waste.8 In this project, treatments for low level radioactive liquid
waste (LLRLW) are focused.
Uranium fuel cycle
The nuclear fuel cycle is a set of processes that involve producing electricity by uranium
fission reaction in nuclear reactors. 9The cycle is divided into two parts, the front end and the
back end. The front end of the cycle involves mining, milling, conversion, enrichment and fuel
fabrication, while the back end refers to procedures after uranium is spent, such as temporary
storage, reprocessing, recycling and waste disposal.10
Figure 2 is a block diagram indicating different processes of the uranium fuel cycle.

6 | P a g e
Figure 2 The Nuclear Fuel Cycle9
Sources and characteristics of LLRLW
LLRLW is generated from both parts of the fuel cycle, but a large proportion of the
waste is waste water from cooling and cleansing of the nuclear reactor. 11 According to the
regulations given by Chinese government, LLRLW is defined as radioactive liquid waste that has
radioactivity below 4×10⁷ Becquerel per meter cube. In this project, the concentration of the
waste stream was calculated according to this definition. In the LLRLW from a nuclear power
plant, the majority of nucleotides are fission products. These fission products can be
categorized into three different groups: long-lived members such as 90Sr and 137Cs; medium-

7 | P a g e
lived members such as 95Zr, 95Nb, 144Ce, 144Pr, 106Ru, 106Rh, 147Pm and 154Sm; and short-lived
nuclides with half-lives ranging from a few seconds to days that can be neglected. 12 In this
project, only 90Sr was considered for simplification.
Treatments for LLRLW
Although the radioactivity of LLRLW is not high, the amount produced is enormous. The
total volume of low level waste generated in United States is larger than the volumes of high
level waste and transuranic waste combined.13 Therefore, the main objective of LLRLW
treatment is to reduce the waste volume. The radioactivity of the waste will increase as
concentrated, and therefore can be further treated as a high level radioactive waste. Due to the
complexity of the components in LLRLW, the wastes usually have to go through a combination
of several different treatments before discharged. There are currently five well-established and
widely used treatments for LLRLW: chemical precipitation, evaporation, electrodialysis,
activated carbon adsorption and ion-exchange.
Chemical precipitation
Chemical precipitation techniques are particularly suitable for radioactive waste that
comes in large volumes and contains small amount of radioactive elements.14 Nucleotides in
LLRLW, which usually exist as heavy metal ions, can react with soluble chemicals to form
precipitation. Radioactive nucleotides then can be separated from aqueous solution via
filtration. 15 Chemical precipitation methods are well established and widely used for low to
intermediate level wastes treatments. Being a batch process, it is simple to operate and allows
radioactive sludge to be removed periodically. There are a number of different precipitation
8 | P a g e
processes according to different compositions of radioactive liquid wastes. For radioactive
wastes containing mostly strontium-90 ions, calcium phosphate, iron hydroxide or calcium
carbonate precipitation methods are usually applied.15 The drawbacks of chemical precipitation
are: the decontamination factors in these processes are generally low; decontamination factors
are sensitive to pH, ionic strength, degree of flocculation, temperature, and the presence of
suspended matter, which increases the difficulties for process control; to reduce the
radioactivity of the effluent liquid to a satisfactory level, it is necessary to combine chemical
precipitation process with other efficient methods.15
Evaporation
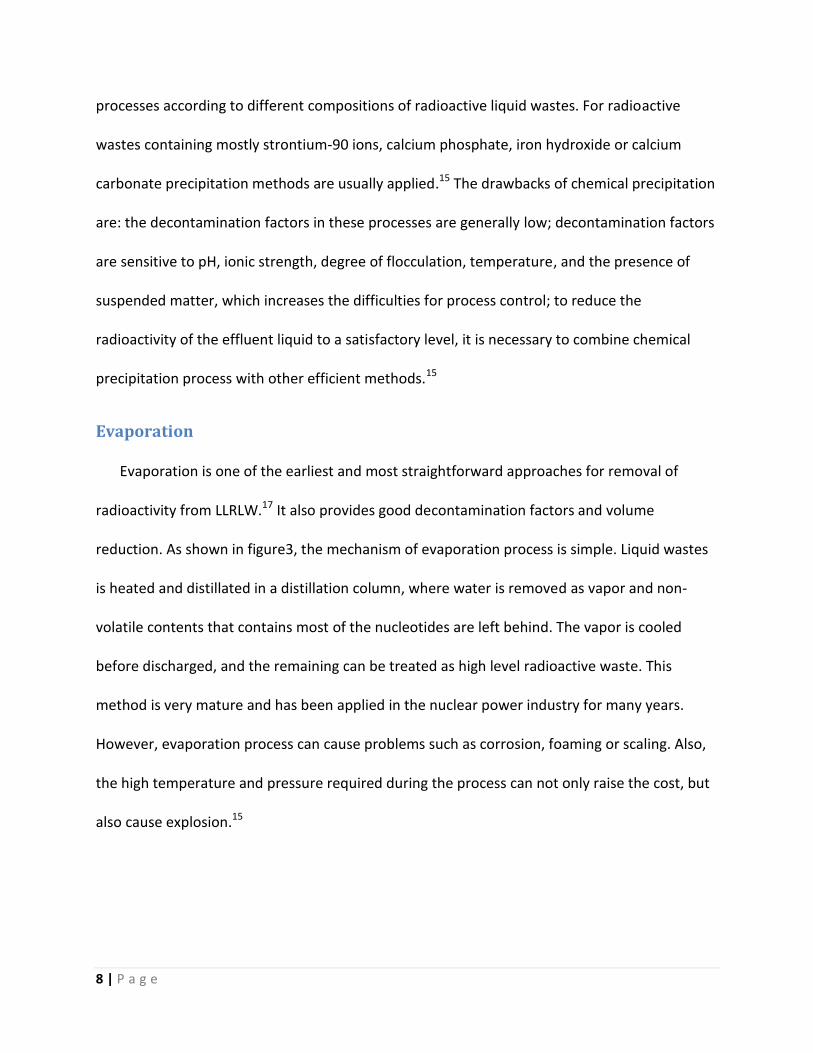
Evaporation is one of the earliest and most straightforward approaches for removal of
radioactivity from LLRLW.17 It also provides good decontamination factors and volume
reduction. As shown in figure3, the mechanism of evaporation process is simple. Liquid wastes
is heated and distillated in a distillation column, where water is removed as vapor and non-
volatile contents that contains most of the nucleotides are left behind. The vapor is cooled
before discharged, and the remaining can be treated as high level radioactive waste. This
method is very mature and has been applied in the nuclear power industry for many years.
However, evaporation process can cause problems such as corrosion, foaming or scaling. Also,
the high temperature and pressure required during the process can not only raise the cost, but
also cause explosion.15

9 | P a g e
Figure 3 Evaporation of contaminated liquid effluent15
Electrodialysis
Electrodialysis is a process in which salts ions are transferred through ion-exchange
membranes according to the electric potential difference in the solution. LLRLW discharged
from a nuclear power plant usually has high electric conductivity due to the existence of a large
amount of inactive ions. 18 Thus radioactive heavy metal elements can be separated and
recovered from the aqueous solution via electrodialysis method. It is simple to operate
instruments used in these processes and no regeneration processes are necessary.18 Also, the
interference by other coexistent ions is insignificant, which is suitable for waste streams that
have complex compositions. However, there exist equilibrium concentrations for heavy metal
ions, below which electrodialysis process will slow down. 18 This method is very suitable for high
level radioactive waste with a large amount of radioactive heavy metal ions but not for dilute
LLRLW. The concentration of heavy metal ions in LLRLW is already so low that may not be
brought down further by electrodialysis process.

10 | P a g e
Activated carbon adsorption
Adsorption techniques are generally utilized in waste water treatments for removal of
color, odor and organic maters. Adsorbents, which are usually porous solid materials, are used
to adsorb impurities in waste water. The most commonly used adsorbent is activated carbon.
Oxygenated functional groupings, which can be found on the entire surface of activated carbon,
are capable of adsorbing metal ions from aqueous solution. Activated carbon adsorption
techniques are also applied in LLRLW treatments. This method is very effective and gives good
decontamination factors.19 However, the cost of applying activated carbon is also relatively high
due to the high cost of activated carbon and the difficulty of adsorbent recovering.
Ion-exchange
In ion-exchange processes, ions exchange between two electrolytes or between an
electrolyte solution and a complex. Radioactive heavy metal ions in LLRLW can be removed by
putting the contaminated stream through a fixed bed reactor packed with ion-exchange resins.
Ion-exchange methods have been widely applied in the treatments for waste liquid streams
from nuclear power plants for many years, but these methods can only treat liquid wastes that
meet the following criteria: there should be small amount of suspended solid in the liquid; total
salt contents in the wastes should be low; the radioactive elements in the wastes should be in
ionic form. In addition, ion-exchange resins need to be regenerated when the saturation of the
active groups is reached, or they will be incapable of ions exchanging. Therefore, an ion-
exchange process requires a great effort in maintenance such as flushing, regeneration, rinsing
and refilling. 15 Also, during the regeneration of ion-exchange resins, chemicals used can be
toxic and expensive, resulting in the increase of operating cost.

11 | P a g e
Application of membrane techniques in LLRLW treatments
As membrane separation technologies develop, their applications are expanding rapidly
all over the world among variety of industries including liquid radioactive waste processing.
During the last five to ten years, membrane techniques have been gradually introduced to
nuclear power plants.2Compared to traditional LLRLW treatments, membrane methods are
more energy-saving and effective.20 Traditional LLRLW treatments processes usually generate
large amount of radioactive solid waste that needs to be disposed. In addition, the treated
liquid does not have a low enough radioactivity to be discharged to the environment.2
Membrane techniques can also be combined with other treatment methods such as
evaporation and ion-exchange to achieve better decontamination result.20
Variety of membrane techniques
Membrane techniques application in LLRLW treatment needs to be customized for
different sites according to the local conditions such as chemical and radiochemical
compositions, radioactivity and total salinity of the effluents.2 Different membranes, membrane
modules and other related instruments need to be selected accordingly. 20
Currently, there are two main membrane techniques that are tested in pilot plants all
over the world: reverse osmosis (RO) and membrane distillation (MD).20 In this project, a
polymer enhanced ultra-filtration process was studied.
Reverse osmosis
In a RO process, contaminated liquid is pressed to a porous membrane that only allow small
molecules to pass through. Radioactive elements thus can be blocked and remain in the

12 | P a g e
concentrate. According to the different size of membrane pores and permeable particles sizes,
RO process can be categorized into reverse osmosis, nano-filtration, ultra-filtration, micron-
filtration and particle filtration as seen in figure 4.21
Figure 4 Membrane Seperation Processes21
Results from pilot plants all around the world showed that RO process gave good
volume reduction and decontamination factors if multistage process was applied. The
productivity is between 0.05 and 4 m3/h, which is sufficiently big for the application of this
method in a commercial scale with low cost. However, the RO process require a relatively high
pressure, ranging from 4 to 5 MPa, and the permeate flux is greatly influenced by the
concentration of contaminated liquid being treated.20
13 | P a g e
Overall, RO processes are effective for low to intermediate level radioactive waste
treatments. The radioactivity of the effluent stream is significantly lowered after the treatment
with a sufficiently big contamination factor.
Membrane Distillation
Although RO processes were proved to be efficient, there still exist drawbacks and
limitations: membrane fouling occurs and cleaning is needed, resulting in interruption of the
processes and extra waste generated from membrane cleaning process; high pressure is
required in the processes, which can increase the cost and risk; pre-treatment may be
necessary due to existence of complexants. By applying thermal evaporation method involving
hydrophobic porous membranes, also known as membrane distillation, such limitations can be
overcome. 20
Membrane distillation is achieved by putting a hot concentrated stream on one side of a
membrane and cold clean water stream on the other side. Vapor pressure difference due to
temperature difference will drive molecules from the hot side evaporate and permeate to the
cold side. Big particles will be blocked by the small pores on the membrane and left in the
concentrate. However, there are requirements for membranes used in MD processes. These
membranes need to be hydrophobic, thin, with low thermal conductivity and have high surface
tension with the feed stream.23
MD techniques were also tested in a few pilot plants. Data shows that retention of
radioactive ion was complete that the effluent stream was safe to be discharged to the
environment directly. No high pressure was required in the process and the high concentration

14 | P a g e
of the feed did not influence the process. However, MD methods are still premature and have
not yet been utilized in nuclear industry. The process time is too long that productivity is as low
as 0.01 to 0.06 m3/h. Also, the large amount of energy consumed in heating up the feed can
result in high cost if cheap energy sources are not available.20, 22
Polymer enhanced ultra-filtration (PEUF) using Chitosan
Since most of metal ions mostly have molecular weight below 200, which are even too
small for reverse osmosis. Pre-treatments are needed before the contaminated liquid going
into membrane filtration processes. By letting heavy metal ions in the waste streams react with
large organic molecules, large complexes can be formed and filtered by membranes.24 Such
process is called polymer enhanced ultra-filtration. Polymer used in these processes usually
required to have large molecular weight, good solubility in water, good binding with metal ions,
good stability in complexes formed and no toxicity, and to be available in low price. 24In this
project, Chitosan is used as the ligand for soluble strontium ions.
Chitosan is a polymer produced from chitin that usually can be found in the shells of sea
crustaceans such as shrimp. Thus cheap sources of chitin such as sea food waste are usually
available. Chistosan is constructed mostly by glucosamine residues. N-acetyl-glucosamine also
exists but in a smaller percentage. The molecular structure of Chitosan is shown in figure 5,
where part A is glucosamine and part B is N-acetyl-glucosamine. Chitosan is capable of binding
with all kinds of metal ions in aqueous solution. The amine group on the glucosamine is the
major binding site for metal ions. Although Chitosan has a very poor solubility in neutral water,

15 | P a g e
it can however be dissolved in acid. 25In this project, hydrochloric acid was used to dissolve
Chitosan powder.
Figure 5 Molecular structure of Chitosan25
Currently, few researches have been done on strontium ions removal by PEUF and no
publication can be found on such researches. However, related researches on Chitosan
interactions with metal ions and removal 25, 27of heavy metal from aqueous solution by PEUF 20,
24-26 show that this method is effective and more advanced than existing nuclear liquid waste
treatments.
PEUF methods are proved to be effective for removal of metal ions from aqueous
solution. 20, 24-26 A research on removal of mercury from aqueous solution showed that the
retention rates were 0.97 in average and can reach 0.99 under optimal conditions for
mercury.26 Also, Chitosan is highly effective in binding with metal ions even in low
concentration according to related researches.25, 27 It was also proved that Chitosan was
effective in a PEUF process for removal of mercury from diluted solution.26

16 | P a g e
PEUF methods are low cost and very likely can be done in an industrial scale. Although
membrane distillation methods were proved to be even more effective, the high cost of the
process makes it difficult to be widely applied.20 On the other hand, PEUF methods have no
high temperature requirement and relatively low pressure is used. In this project, the gauge
pressure inside the stirred cell was 0.1 MPa. Also, chemicals required in these processes are
common and inexpensive. Chitosan can be obtained in very low-price sources such as sea food
wastes. Moreover, membranes used in these methods do not need to be changes frequently,
since they have a relatively long life that usually lasts for two to three years. 20
The advantages of PEUF methods give strong incentives for conducting related
researches. The researching team of Professor Shao from Shanghai Jiaotong University is one of
the research groups that first study the performances of PEUF methods for strontium removal.
This project was supported by Professor Shao’s researching team.
The operation for PEUF processes is not complicated. Water soluble polymer and
solution containing metal ions can react in batch reactors. After the feed is prepared, it can be
pumped into a batch membrane separator. The parameters that have significant effect on the
effluent concentrations are pH value of the feed, the proportion of amount of polymer to
amount of metals in the solution and reaction time.
This project was aimed to study the performance of PEUF techniques for strontium ions
removal as well as to optimize the process by finding the optimal operation conditions. The
examined operation parameters were pH values and loadings of the feed. Also, fouling of

17 | P a g e
membranes was also studied. Simple membrane cleaning techniques using common chemicals
were investigated as well.

18 | P a g e
Methodology
Set-up of the PEUF process
Figure 6 Picture of the ultra-filtration unit
Figure 6 shows the equipments used and the set up of the ultra-filtration process. As
seen in figure 6, a gas tank containing nitrogen was connected to the stirred cell membrane
separator. As nitrogen flowed into the stirred cell, pressure increased. A pressure valve with a
pressure gauged was used to adjust the pressure inside the stirred cell. Under the stirred cell,
there was a magnetic stirrer, which allow the solution in the stirred cell be continuously stirred
during the separation process.

19 | P a g e
Membrane preparation
New membrane is usually soaked in solution containing some organic chemicals to keep
it from drying. The pores on the membrane might be blocked by these big molecules.
Therefore, prior to be used, the membrane needs to be treated so that the pores are open.
When the membrane is soaked in isopropanol, molecules of isopropanol can travel through the
membrane pores and open them up.
New PES membrane was cut to fit the stirred cell. After cut, membrane was soaked with
isopropanol in a plastic Petri dish with cover for one hour. Afterwards, membrane was washed
with DI-water and soaked in DI-water in a plastic Petri dish for at least 9 hours.
Solution preparation
Feed solutions were prepared and stored in volumetric flask for convienience.
For Chitosan solution, 1g of Chitosan was dissolved in nitric acid in a beaker and diluted
with DI-water in a 1000ml volumetric flask. The Chistosan solution with concentration of 1g/L
was stored in the volumetric flask for future use.
For strontium nitrate solution, 0.9g of strontium nitrate was dissolved in DI-water in a
beaker and diluted with DI-water in a 1000ml volumetric flask. The strontium nitrate solution
with concentration of 0.9g/L was stored in the volumetric flask for future use.

20 | P a g e
Membrane flux measurement
Membrane flux (Nw) refers to the amount of water permeate the membrane per unit
area and time. The flux needed to be measured before and after the membrane is used in order
to study membrane fouling. If a membrane is fouled, its pores are blocked, thus results in a
smaller membrane flux. When the membrane flux difference between before and after used is
bigger than 15%, this membrane is considered fouled and needs to be cleaned.
Membrane flux is calculated by:
𝑁𝑤 = 𝑉/(𝑡 × 𝐴)
Where V is the volume of water that permeates through the membrane, t is the time
required for the water to permeate the membrane, and A is the effective area of the
membrane.
Since it is difficult to measure the volume of water accurately, the changes in the
weights of test tubes that contain the permeate water are used instead:
𝑁𝑤 = (𝑚𝑎 −𝑚𝑏)/(𝑡 × 𝐴 × 𝜌𝑤)
Where ma is the weight of a test tube before filled with water, mb is the weight of test
tube after filled with water and ρw is the density of water.
Membrane was fit into the bottom of the stirred cell. About 250ml of DI-water was filled
in the stirred cell. 5 test tubes were weighted and the weights were recorded as mb. The valve
on the Nitrogen tank was turned on and pressure was adjusted to 0.05 MPa by a valve on the
pressure gauge. The pressure was left unchanged for 20 minutes to ensure that it was stable

21 | P a g e
and the system had reached equilibrium. Water came out during this period was disposed.
When the system reached equilibrium, a test tube was used to catch the water coming out
from the stirred cell. Time needed to fill the test tube up to 10ml was measured by a stop watch
and recorded as t. Pressure was changed to 0.075, 0.01, 0.125 and 0.15MPa, and permeated
water was collected for each pressure.
After the pressure was changed each time, it was left unchanged for 10 minutes before
the permeate water was collected to ensure that the system has reached equilibrium. The
weights of the test tubes with water were measured and recorded as ma. Membrane flux under
each pressure was calculated with the equation mentioned above. The calculated fluxed were
plotted against the pressures, and a linear line was fit to these date points. If the R2 value of the
line is greater than 0.9, there membrane fluxes are consider valid.
Chitosan permeation
Chitosan obtained from natural sources such as sea food wastes usually contains
molecules in different sizes. Before Chitosan reacts with strontium ions to form complexes, it is
essential to ensure that the molecules of Chitosan are big enough to be blocked by the
membrane pores, so that the complexes cannot permeate the membrane. If a large amount
Chitosan permeates the membrane, the Chitosan solution needed to be filtered by the
membrane, and only concentrate should be used to react with strontium ions.
Before filtering the Chitosan solution, the flux of the membrane used was measured.
The stirred cell was rinsed with Chitosan solution with concentration of 1g/L and pH of 1.18 for

22 | P a g e
three times to ensure that all the impurities were washed away. 250ml of the same Chitosan
solution was filled into the stirred cell. Pressure inside the stirred cell was adjusted to 0.1 MPa
and was stabilized for 10 minutes before samples were collected. 4 test tubes for collecting
sample were marked as J1, J2, J3 and J4. When the pressure was stable, liquid coming out from
the cell was collected by test tube J1 and a clock was started to record the total time of the
process. A stop watch was used to record the time needed for the collection of approximately
10ml of permeate. When the total time of the process hit 10, 20, 30minutes, approximately
10ml of permeate were collected by test tube J2, J3 and J4 respectively. Waste permeate
coming out in between was disposed. After all the samples were collected, the stirred cell was
rinsed with DI-water for three times, and another group of membrane fluxes were measured.
Same steps were repeated for Chitosan solution with PH values of 8 and 5.
Chitosan enhanced ultra-filtration
Chitosan can react with strontium ions in aqueous solution to form complexes with
large molecular weights. These complexes are too big to go through the membrane pores so
that strontium ions can be removed from the aqueous solution. The objective of this part of the
project is to find the optimal operating pH value and loading.
Loading (L) is a dimensionless value that indicates the proportion of the amount of
metal ions and polymer in the aqueous solution. It can be calculated using:
𝐿 = 𝑚𝑝/𝑚𝑚

23 | P a g e
Where mp is the mass of polymer in the aqueous solution and mm is the mass of metal
salt in the solution. In this case, the polymer is Chitosan and the salt is strontium nitrate.
Experiments on different pH values:
Loading was set at 1 during these experiments. 9ml of Chitosan solution with
concentration of 1g/L and 10ml of strontium nitrate solution with concentration of 0.9g/L were
added to a 500ml beaker. 400ml of DI-water was added to the beaker to dilute the mixture.
Similarly, 8 other beakers with 419ml of Chitosan and strontium nitrate solution were made.
The pH values of the solution in these beakers were adjusted to 1, 2, 3, 4, 5, 6, 7, 8 and 9
respectively by HCl and NaOH. A pH meter was used to measure the pH values. After the pH
values were adjusted, DI-water was added to each beaker so that the total volume of the
solution reached 500ml. The solution in the beakers was stirred at a rate of approximately
200rad/min for 2 hours to let Chitosan and strontium ions react. The prepared solution was
used as the feed to the stirred cell. Stirred cell was rinsed with the feed for three times to wash
off impurities. 250ml of the solution was filled in the stirred tank. Pressure was set at 1 MPa
throughout the whole process. The system was stabilized for 20 minutes first, then about 25ml
of permeate was collected by a test tube as the permeate sample. The remaining liquid in the
stirred cell, the concentrate, and the feed was collected by test tubes as well. All samples were
sealed by plastic films for further concentration determination. Same procedure was repeated
for each pH. Before the permeation experiment of each pH, membrane fluxes of the membrane
were measured. If the differences of the fluxes were greater than 15%, the membrane will be
replaced by a new one.

24 | P a g e
Experiments on different loadings
After the optimal pH was found, experiments on different loadings were done at this pH
value. 0.72ml and 0.8ml of Chitosan solution with a concentration of 1g/L was added to two
different beakers, and another beaker was left empty. 10ml of strontium nitrate solution was
added to each beaker, and the mixture was diluted by 400ml of DI-water. The loadings of the
solution in these beakers were then 0, 0.2 and 0.8 respectively. The three beakers of solution
were adjusted to the optimal pH, and were stirred for two hours in order to let the
complexation reaction occur. Same ultra-filtration step from the different pH values experiment
was repeated for the feed with different loadings. Samples collected were also sealed by plastic
films for future analysis.
Membrane cleaning
Membrane cleaning procedures by common chemicals such as nitric acid and sodium
hydroxide were studied. The fouled membrane was first soaked in nitric acid solution with a pH
value of 2 for 20 minutes. Then membrane fluxes of the membrane were measured and
compared with the membrane fluxes before the membrane was treated. If no significant
improvement was shown, the membrane would be soaked in sodium hydroxide solution with a
pH value of 8 for 20 minutes, and the membrane fluxes would be measured and compared
again.

25 | P a g e
Retention rate calculation
The most straight forward way to show the effectiveness of the separation unit is
strontium concentration in the outlet stream. However, retention rate is a better way to
demonstrate the results, since it indicates how much strontium is removed from the feed.
The equation for retention rate is:
𝑅 = 1 −𝑐𝑆𝑟 𝑝𝑒𝑟𝑚𝑒𝑎𝑡𝑒
𝑐𝑆𝑟 𝑓𝑒𝑒𝑑
where cSr permeate is the concentration of strontium in the permeate and cSr feed is the
concentration of strontium in the feed.

26 | P a g e
Results and Discussions
This section of the report contains 4 different parts: Chitosan permeation, ultra-
filtration of feeds with different pH values, ultra-filtration of feeds with different loadings,
Membrane fouling and membrane cleaning procedures.
Chitosan permeation
Since samples from the first Chitosan permeation experiments were stored for a long
time before they were measured, these samples could not show accurate results. Therefore,
the experiment was repeated, but with a 50kd PES membrane instead due to the exhaustion of
30 kd PES membrane. Difference of membranes used did affect the results, but not too
significantly and these results can be used in the analysis. In the new experiments, the
concentration of the Chitosan feed was 10mg/L and the pH values were 8 and 5.
To determine the concentration of Chitosan, the total amount of nitrogen was detected
first, and then the total amount of Chitosan was calculated accordingly. This method cannot
measure Chitosan in dilute aqueous solution accurately. It is chosen because this method was
the most reliable method that could be found. Therefore, to minimize the inaccuracy of this
method, the concentration of Chitosan in the feed was also determined using this method, and
was compared to the concentrations of Chitosan in the permeated samples.
Results are shown in figure 7.

27 | P a g e
Figure 7 Percentage of Chitosan permeates from feed
From this figure, it can be seen that at pH of 8, almost 100% of chitosan could permeate
through the membrane. When pH is equal to 5, less Chitosan could permeate through the
membrane, and the lowest percentage of Chitosan permeated was 10%. This indicates that this
Chitosan solution was not efficient for the PEUF process. Since the size of the Chitosan
molecules were too small that they could go through the membrane pores, the complexes
formed by these Chitosan molecules and strontium ions can possibly permeate through the
membrane pores as well, leading to the failure of ultra-filtration. This Chitosan solution should
be filtered by membrane first, and only the part that cannot permeate through the membrane
should be used in the PEUF process.
0
20
40
60
80
100
120
Concentrate Permeate 1 Permeate 2 Permeate 3
% o
f C
hit
osa
n in
pe
rmat
e t
o in
fe
ed
Percentage of Chitosan permeates from feed
pH 8
pH 5

28 | P a g e
Ultra-filtration experiments on different feed pH values
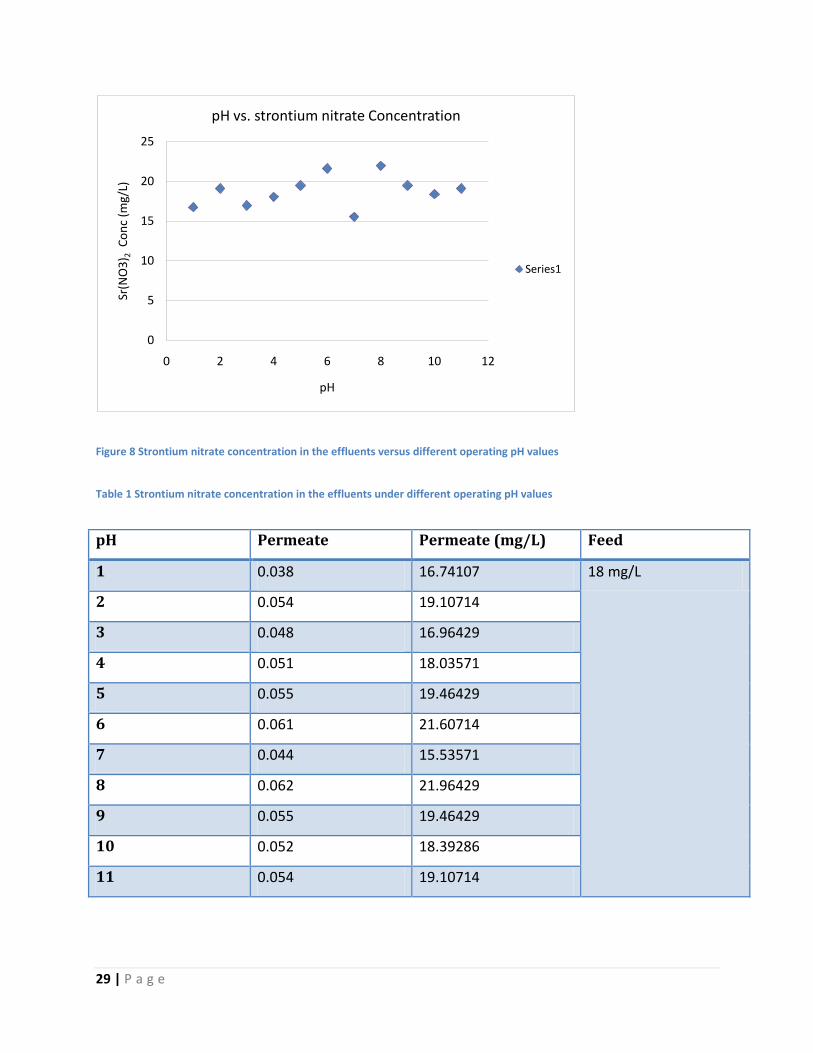
In this part of the project, the pH value of the feed to the stirred cell was varied from 1
to 11. When pH value reached 11, participation occurred. Therefore, experiments were not
performed on feed with a pH value greater than 11. Results of strontium concentrations in the
effluents were shown in figure 8 and table 1. Figure 8 is a plot where the concentration of
strontium nitrate is plotted against the pH values, and the values are listed in table 1.
Concentrations of strontium nitrates in the effluents were measured by
spectrophotometer. However, the results were strange since some of the strontium nitrate
concentrations in the effluents were greater than the concentrations in the feed. Such
abnormal results may be due to the long waiting period between when the samples were taken
and when the samples were measured. Chemical changes in the samples might occur during
this period. The second reason for such results may be the inaccuracy of this determination
method. It is not common to use a spectrophotometer to detect the amount of strontium ions
in aqueous solutions, especially in dilute solutions. This method involved complicated steps of
making and mixing of several types of solutions. Errors from each step would accumulate and
therefore lead to the inaccuracy of the final results. Due to the limited time and budget, no
other concentration determination method could be examined.
However, the main objective of this part of the experiments was to find the optimal
operating pH, which would be applied in the next part of the experiments. It is sufficient to
conclude from these results that the optimal operating pH for these processes was 7, since it
gave the lowest concentration of strontium nitrate in the effluent.
29 | P a g e
Figure 8 Strontium nitrate concentration in the effluents versus different operating pH values
Table 1 Strontium nitrate concentration in the effluents under different operating pH values
pH Permeate Permeate (mg/L) Feed
1 0.038 16.74107 18 mg/L
2 0.054 19.10714
3 0.048 16.96429
4 0.051 18.03571
5 0.055 19.46429
6 0.061 21.60714
7 0.044 15.53571
8 0.062 21.96429
9 0.055 19.46429
10 0.052 18.39286
11 0.054 19.10714
0
5
10
15
20
25
0 2 4 6 8 10 12
Sr(N
O3
) 2C
on
c (m
g/L)
pH
pH vs. strontium nitrate Concentration
Series1

30 | P a g e
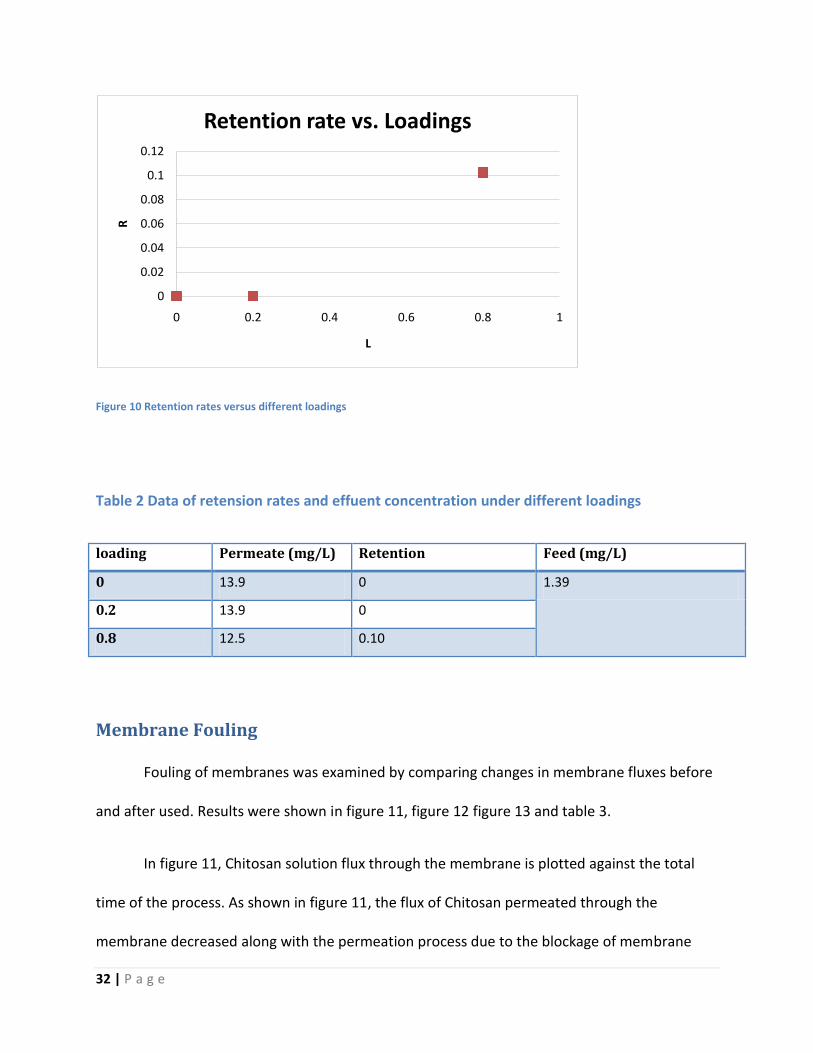
Ultra-filtration experiments on different feed loadings
In this part of the project, polymer loading of the feed to the stirred cell was varied in
order to find the optimal values. The examined loadings were 0, 0.2 and 0.8. Results were
shown in figure 9, table 2 and figure 10. Concentration of strontium nitrate is plotted against
loading values of 0, 0.2 and 0.8 in figure 9, while retention rate is plotted against loadings in
figure 10. Specific numbers from these two figures are listed in table 1.
As seen in the results, when polymer loading increased, concentration of strontium
nitrate in the effluent decreased. The results were reasonable since when there are more
polymer molecules available to react with the metal ions, more complexes will be formed. The
polymer loading in this part of the experiment that gave the lowest strontium nitrate
concentration in the effluent was 0.8. However, this polymer loading value could be concluded
as the optimal due to small amount of data obtained. It could nevertheless be concluded that
the bigger the polymer loading is the more metal ions will be removed until it reaches the
equilibrium.
The results can also be presented as the retention rates under different polymer
loadings. When loading was 0 and 0.2, the retention rates were 0, indicating that no metal ions
were removed from the feed. When loading was increased to 0.8, retention rate also rose to
0.1, indicating that 10% of the strontium ions were removed from the feed. However, 10%
removal is not impressive, showing that this system was not efficient enough. The inefficiency
of the system possibly results from the small molecule sizes of the Chitosan solution. Due to
limited time available, the ultra-filtration experiments were performed before the results from

31 | P a g e
the Chitosan permeation experiment were available. Results from Chitosan permeation showed
that large amount of Chitosan molecules were permeable, indicating that the Chitosan
molecule sizes were not large enough. Therefore, complexes formed by reacting with this
Chitosan solution might be too small to be blocked by the membrane pores, resulting in the
inefficiency of strontium removal.
Figure 9 Strontium nitrate concentration in the effluent versus different loadings
8
9
10
11
12
13
14
15
0 0.2 0.4 0.6 0.8 1
Sr(N
O3
) 2C
on
c (m
g/L)
Loading
Sr(NO3)2 Concentration vs. Loading
32 | P a g e
Figure 10 Retention rates versus different loadings
Table 2 Data of retension rates and effuent concentration under different loadings
loading Permeate (mg/L) Retention Feed (mg/L)
0 13.9 0 1.39
0.2 13.9 0
0.8 12.5 0.10
Membrane Fouling
Fouling of membranes was examined by comparing changes in membrane fluxes before
and after used. Results were shown in figure 11, figure 12 figure 13 and table 3.
In figure 11, Chitosan solution flux through the membrane is plotted against the total
time of the process. As shown in figure 11, the flux of Chitosan permeated through the
membrane decreased along with the permeation process due to the blockage of membrane
0
0.02
0.04
0.06
0.08
0.1
0.12
0 0.2 0.4 0.6 0.8 1
R
L
Retention rate vs. Loadings

33 | P a g e
pores by Chitosan molecules. Membrane flux under the same pressure also decreased after the
membrane was used compared to before used, as can be seen in figure 12. The average
difference between the membrane fluxes before and after used was 21%, indicating that this
membrane was fouled and should not be used unless treatments were applied to bring the
membrane flux back up.
Figure 11 Mebrane fouling in Chitosan permeation experiment
0
1
2
3
4
5
6
7
8
9
0 5 10 15 20 25 30 35
Flu
x o
f C
hit
osa
n s
olu
tio
n(m
/s)
Total time (min)
Membrane fouling during chitosan permeation

34 | P a g e
Figure 12 Membrane fluxes changes of membrane 1 for Chitosan permeation
Membrane fouling also occurred during the ultra-filtration process. In figure 13,
membrane fluxes before and after used are plotted against different pressure values. As shown
in figure 13, the membrane flux under the same pressure decreased after the membrane was
used due to membrane fouling. Membrane 4 was used in the ultra-filtration process for a feed
with loading of 1 and pH value of 2.
Same results were also obtained from ultra-filtration experiments under different
operating pH values and polymer loadings, which were listed in table 3. The average membrane
flux differences that were marked in red color were above 15%, indicating that membrane
should be replaced. In the experiments for feeds with pH values varying from 1 to 8, membrane
had to be replaced after one time used. The severe membrane fouling could be caused by the
poor anti-fouling property of the PES membrane. No relation could be found between
y = 0.0007x - 3E-06R² = 0.9932
y = 0.0005x - 3E-06R² = 0.9885
0.0000E+00
2.0000E-05
4.0000E-05
6.0000E-05
8.0000E-05
1.0000E-04
1.2000E-04
0 0.05 0.1 0.15 0.2
Flu
x (m
/s)
Pressure (MPa)
Membrane fluxes changes of membrane 1
Flux before Chitosan permeation
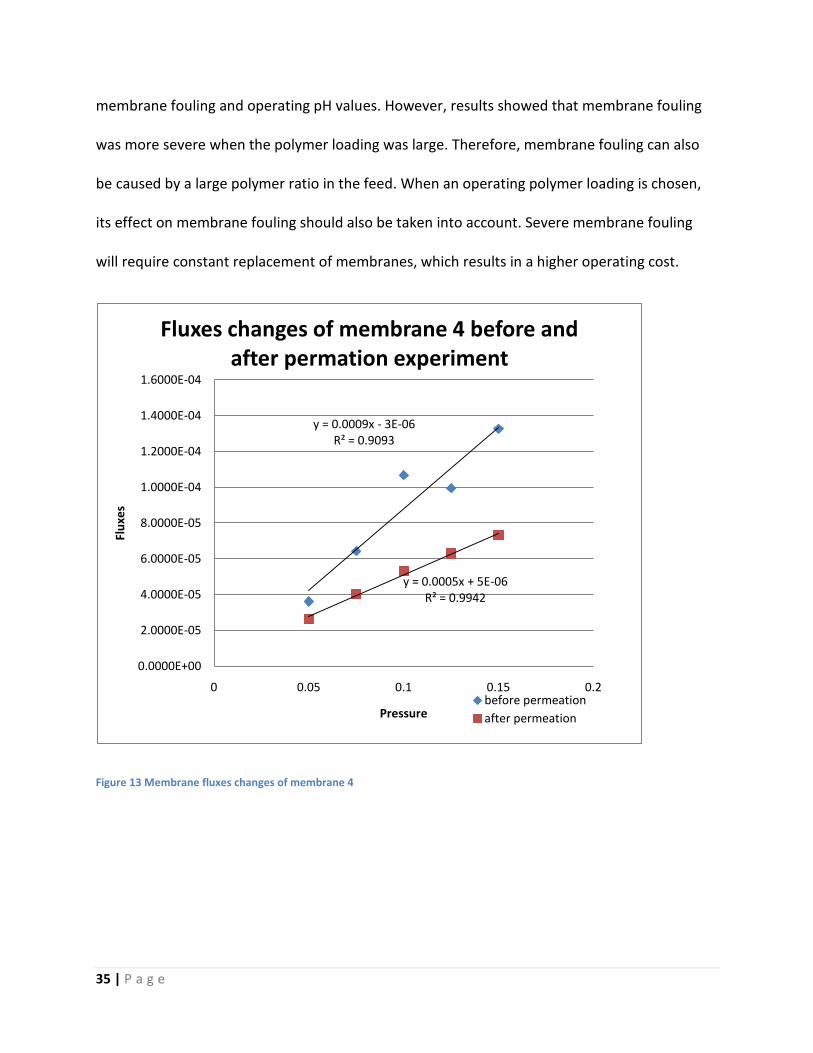
35 | P a g e
membrane fouling and operating pH values. However, results showed that membrane fouling
was more severe when the polymer loading was large. Therefore, membrane fouling can also
be caused by a large polymer ratio in the feed. When an operating polymer loading is chosen,
its effect on membrane fouling should also be taken into account. Severe membrane fouling
will require constant replacement of membranes, which results in a higher operating cost.
Figure 13 Membrane fluxes changes of membrane 4
y = 0.0009x - 3E-06R² = 0.9093
y = 0.0005x + 5E-06R² = 0.9942
0.0000E+00
2.0000E-05
4.0000E-05
6.0000E-05
8.0000E-05
1.0000E-04
1.2000E-04
1.4000E-04
1.6000E-04
0 0.05 0.1 0.15 0.2
Flu
xes
Pressure
Fluxes changes of membrane 4 before and after permation experiment
before permeation
after permeation

36 | P a g e
Table 3 Fouling of the membranes
Membrane
No.
Operating PH Operating
Loading
Avg. Flux %Diff.
2 1 1 20.27%
4 2 1 22.43%
5 3 1 22.85%
6 4 1 15.82%
7 5 1 31.62%
8 6 1 36.63%
9 7 1 38.92%
10 8 1 18.81%
11 9 1 2.55%
11 10 1 9.57%
11 11 1 19.40%
14 7 0.2 2.36%
14 7 0.8 11.59%
Membrane cleaning
Membrane cleaning procedures were studied in order to reactivate the fouled
membranes. The objective of these procedures is to unblock the membrane pores using
common and low-cost chemicals. Since it is believed that the membrane pores were blocked by
Chitosan molecules, theoretically membrane needed to be treated by acid in order to dissolve
the Chitosan attached to the membrane surface. Figure 14 shows the plot of membrane fluxes
before and after cleaned against various pressure values.

37 | P a g e
However, no significant improvement was shown in the membrane fluxes after treated as
shown in figure 14. Membrane was therefore treated with base aiming to remove other
organics from the surface of the membrane, but no significant improvement was shown either.
As a matter of fact, membrane flux even decreased further after treated. Similar results were
obtained from cleaning procedures on other membranes as seen in figure 39 attached in the
appendix.
The failure in these membrane cleaning procedures can be explained by the disability to
dissolve the adhered Chitosan. In fact, by soaking the membrane into acid and base solution
may even help Chitosan to diffuse deeper to the membrane, causing a decrease in membrane
fluxes after treated. Another reason that leads to the failure might be the chemical changes
occurred on the membrane. Chitosan could undergo chemical changes by reacting with
microorganisms and chemicals in the environment and form complex composite that cannot be
dissolved in acid or base. In order to clean the membranes effectiveness, researches needed to
be done in other chemicals that may be more effective.

38 | P a g e
Figure 14 Resutls of cleaning experiment of membrane 4
y = 0.0009x - 3E-06R² = 0.9093
y = 0.0005x + 5E-06R² = 0.9942
0.0000E+00
2.0000E-05
4.0000E-05
6.0000E-05
8.0000E-05
1.0000E-04
1.2000E-04
1.4000E-04
1.6000E-04
0 0.02 0.04 0.06 0.08 0.1 0.12 0.14 0.16
FLu
x
P (MPa)
Membrane 4 cleaning experiment
before used
after used
After HNO3
after NaOH

39 | P a g e
Conclusions and Recommendations
The objective of this project was to optimize the PEUF process for strontium ions
removal. The optimal operating pH value was 7 and the optimal operating loading was 0.8.
However, the removal was not effective even under these optimal operating conditions. The
best retention rate found was only around 10%. The ineffectiveness of this process can be
explained by the large number of permeable molecules in the Chitosan solution. Results from
Chitosan permeation experiments showed that a large amount of Chitosan molecules could
permeate through the membrane, which indicates that a large amount of complexes formed by
Chitosan and strontium ions were also permeable. To achieve a better removal result, the
Chitosan solution should be filtered by membrane first, and only the non-permeable part
should be used in the PEUF process.
The PEUF process can also be further optimized by changing other operating parameters
such as reaction time, reactor stirring rate and the ion strength of the feed. In addition, a multi-
steps system can be used to improve the performance of this process. Also, a cross-flow
filtration system can be considered instead of the dead end filtration system used in this project.
Membrane fouling was found to be serious. 8 out of 10 membranes used needed to be
replaced after one time use. The severe fouling can be due to the poor fouling resistance of the
membrane material, as well as the high concentration of polymer in the feed. Nitric acid with
pH of 2 and sodium hydroxide with pH of 8 were not effective in membrane cleaning processes.

40 | P a g e
The cleaning process can be improved by using other chemicals as the cleanser. Disodium is a
good alternative.

41 | P a g e
References
1. Environmental Protection Agency (EPA) USA. Radioactive Waste Disposal: An
Environmental Perspective
http://www.epa.gov/radiation/docs/radwaste/ (Feb 3rd 2010)
2. Anil Kumar Pabby. Membrane techniques for treatment in nuclear waste processing:
global experience. Serono. Sym. 2008, November, 9-13
3. Environmental Protection Agency (EPA) USA. Nuclear Energy
http://www.epa.gov/RDEE/energy-and-you/affect/nuclear.html (Feb 2nd 2010)
4. John McCarthy. Frequently asked questions about nuclear energy
http://www-formal.stanford.edu/jmc/progress/nuclear-faq.html (Feb 2nd 2010)
5. ICTJ nuclear training centre. Nuclear plants in the word
http://www.icjt.org/an/tech/jesvet/jesvet.htm (Feb 2nd 2010)
6. World Nuclear Association. Nuclear power in the word today
http://www.world-nuclear.org/info/inf01.html (Feb 2nd 2010)
7. Nuclear disasters and accidents
http://library.thinkquest.org/17940/texts/nuclear_disasters/nuclear_disasters.html
(Feb 3rd 2010)
8. United States Nuclear Regulation Commission. Radioactive wastes
http://www.nrc.gov/waste.html (Feb 3rd 2010)
9. World Nuclear Association. The nuclear fuel cycle
42 | P a g e
http://www.world-nuclear.org/info/inf03.html (Feb 3rd 2010)
10. Uranium USA. What is the Nuclear Fuel Cycle?
http://www.uraniumsa.org/ (Feb 3rd 2010)
11. Ohio State University. Who Creates Low-Level Radioactive Waste and what are they
doing with it?
http://ohioline.osu.edu/rer-fact/rer_12.html (Feb 3rd 2010)
12. C.B Amphlett. Radioactive Wastes; Pergamon Press: London 1961; 9
13. John F. Ahearne. Radioactive Waste: The Size of the Problem. Phys Today 1997, June,
24-29
14. A.S Mollah; Aleya Begum; M.M. Rahman. Removal of radionuclides from low level
radioactive liquid waste by precipitation. J Radioanal. Nuc.l Ch. 1998, 229, 187-189
15. V.M. Efremenkov. Radioactive waste management at nuclear power plants. IEAE Bulletin
1989, 4, 37-40
16. S.V.S. Rao; Biplob Paul; K.B. Lal; S.V. Narasimhan; Jaleel Ahmed. Effective removal of
cesium and strontium from radioactive wastes using chemical treatment followed by
ultra filtration. J Radioanal. Nucl. Ch. 2000, 246, 413-418
17. G. E. McCullough. Concentration of Radioactive Liquid Waste by Evaporation. Ind. Eng.
Chem. 1951, 43, 1505-1509
18. Sen-ichi Sugimoto. Removal of Radioactive Ions from Nuclear Waste Solutions by
Electrodialysis. J Nucl. Sci. Technol. 1978, 15, 753-759

43 | P a g e
19. S. Chegrouche; A. Mellah; M. Barkat. Removal of strontium aqueous solutions by
adsorption onto activated carbon: kinetic and thermodynamics studies. Desalination
2009, 235, 306-318
20. Grazyna Zakrzewska-Trznadel; Marian Harasimowicz; Andrzej G. Chmielewski.
Membrane processes in nuclear technology-application for liquid radioactive waste
treatment. Sep. Purif. Technol. 2001, 22-23, 617-625
21. KOCH membrane systems. Ultrafiltration-Filtration overview.
http://www.kochmembrane.com/sep_uf.html (Feb 16th 2010)
22. Grazyna Zakrzewska-Trznadel; Marian Harasimowicz; Andrzej G. Chmielewski.
Concentration of radioactive components in liquid low-level radioactive waste by
membrane distillation. J Membrane Sci. 1999, 163, 257-264
23. A. M. Alklaibi. Using Spacers in MD Channels
http://cds.comsol.com/access/dl/papers/1550/Alklaibi.pdf (Feb 16th 2010)
24. Grazyna Zakrzewska-Trznadel; Marian Harasimowicz. Removal of radionuclides by
membrane permeation combined with complexation. Desalination 2002, 144, 207-212
25. Carol L. Lasko; Matthew P. Hurst. An Investigation into the Use of Chitosan for the
Removal of Soluble Silver from Industrial Wastewater. Environ. Sci. Technol. 1999, 33,
3622-3626
26. Yusuf Uludag; Hilmi Onder Ozbelge; Levent Yilmaz. Removal of mercury from aqueous
solutions via polymer-enhanced ultrafiltration. J Membrane Sci. 1997, 129, 93-99
27. E. Guibal; E. Touraud; J. Roussy. Chitosan interactions with metal ions and dyes:
dissolved-state vs. solid-state application. World J Microb. Biot. 2005, 21, 913-920

44 | P a g e
Appendix
A. Membrane Fluxes Data Table 4 Fluxes of membrane 1 before used
mb (g) ma (g) P (Mpa) t (s) V (m^3) Flux (m/s)
22.0648 32.3111 0.05 79.03 1.0246E-05 3.1017E-05
24.7807 34.7397 0.075 50.79 9.9590E-06 4.6910E-05
23.1744 33.4777 0.1 36.03 1.0303E-05 6.8413E-05
24.9858 35.1926 0.125 30.75 1.0207E-05 7.9409E-05
21.9846 33.6322 0.15 28.06 1.1648E-05 9.9305E-05
Figure 15 Fluxes of membrane 1 before used vs. pessure
Table 5 Fluxes of membrane 1 after used
mb (g) ma (g) P (Mpa) t (s) V (m^3) Flux (m/s)
23.8583 33.9008 0.05 93.15 1.0043E-05 2.5792E-05
25.9170 35.9451 0.075 71.28 1.0028E-05 3.3657E-05
26.7156 37.4285 0.1 48.44 1.0713E-05 5.2909E-05
23.1840 33.6260 0.125 38.59 1.0442E-05 6.4734E-05
22.2644 33.1118 0.15 33.15 1.0847E-05 7.8283E-05
y = 0.0007x - 3E-06R² = 0.9932
0.0000E+00
2.0000E-05
4.0000E-05
6.0000E-05
8.0000E-05
1.0000E-04
1.2000E-04
0 0.02 0.04 0.06 0.08 0.1 0.12 0.14 0.16
Flu
x (m
/s)
Pressure (MPa)

45 | P a g e
Figure 16 Fluxes of membrane 1 after used vs. pressure
Membrane 2
Table 6 Fluxes of membrane 2 before used
mb ma g P t V m^3 Flux m/s
21.8406 31.4068 0.05 82.73 9.5662E-06 2.7663E-05
23.3391 33.5146 0.075 63.74 1.0176E-05 3.8192E-05
21.8453 32.4768 0.1 52.41 1.0632E-05 4.8529E-05
23.6190 32.4695 0.125 40.73 8.8505E-06 5.1985E-05
27.6632 37.4142 0.15 31.38 9.7510E-06 7.4340E-05
y = 0.0005x - 3E-06R² = 0.9885
0.0000E+00
1.0000E-05
2.0000E-05
3.0000E-05
4.0000E-05
5.0000E-05
6.0000E-05
7.0000E-05
8.0000E-05
9.0000E-05
0 0.02 0.04 0.06 0.08 0.1 0.12 0.14 0.16
Flu
x (m
/s)
Pressure (MPa)

46 | P a g e
Figure 17 Fluxes of membrane 2 before used vs. pressure
Table 7 Fluxes of membrane 2 after used
mb ma g P t V m^3 Flux m/s
21.8406 31.4068 0.05 82.73 9.5662E-06 2.7663E-05
23.3391 33.5146 0.075 63.74 1.0176E-05 3.8192E-05
21.8453 32.4768 0.1 52.41 1.0632E-05 4.8529E-05
23.6190 32.4695 0.125 40.73 8.8505E-06 5.1985E-05
27.6632 37.4142 0.15 31.38 9.7510E-06 7.4340E-05
y = 0.0005x + 3E-06R² = 0.9966
0.0000E+00
1.0000E-05
2.0000E-05
3.0000E-05
4.0000E-05
5.0000E-05
6.0000E-05
7.0000E-05
8.0000E-05
0 0.02 0.04 0.06 0.08 0.1 0.12 0.14 0.16
Flu
x (m
/s)
Pressure (MPa)

47 | P a g e
Figure 18 Fluxes of membrane 2 after used vs. pressure
Membrane 4
Table 8 Fluxes of membrane 4 before used
mb ma g P t V m^3 Flux m/s
23.9502 34.4269 0.05 69.22 1.0477E-05 3.6209E-05
23.8972 34.1535 0.075 38.13 1.0256E-05 6.4350E-05
23.5749 36.2032 0.1 28.31 1.2628E-05 1.0672E-04
25.5452 35.1839 0.125 23.19 9.6387E-06 9.9435E-05
23.0732 34.3964 0.15 20.41 1.1323E-05 1.3272E-04
y = 0.0004x - 4E-07R² = 0.9938
0.0000E+00
1.0000E-05
2.0000E-05
3.0000E-05
4.0000E-05
5.0000E-05
6.0000E-05
7.0000E-05
0 0.02 0.04 0.06 0.08 0.1 0.12 0.14 0.16
Flu
x (m
/s)
Pressure (MPa)

48 | P a g e
Figure 19 Fluxes of membrane 4 before used vs. Pressure
Table 9 Fluxes of membrane 4 after used
mb ma g P t V m^3 Flux m/s
23.8428 33.8381 0.05 86.00 9.9953E-06 2.7805E-05
23.6156 34.3173 0.075 45.87 1.0702E-05 5.5815E-05
23.1779 33.7521 0.1 35.85 1.0574E-05 7.0564E-05
23.4844 33.3481 0.125 27.75 9.8637E-06 8.5036E-05
22.6565 33.7836 0.15 27.59 1.1127E-05 9.6484E-05
Figure 20 Fluxes of membrane 4 after used vs. pressure
y = 0.001x - 1E-05R² = 0.998
0.0000E+00
2.0000E-05
4.0000E-05
6.0000E-05
8.0000E-05
1.0000E-04
1.2000E-04
1.4000E-04
1.6000E-04
0 0.02 0.04 0.06 0.08 0.1 0.12 0.14 0.16
Flu
x (m
/s)
Pressure (MPa)
y = 0.0005x + 2E-05R² = 0.9967
0.0000E+00
2.0000E-05
4.0000E-05
6.0000E-05
8.0000E-05
1.0000E-04
1.2000E-04
0 0.02 0.04 0.06 0.08 0.1 0.12 0.14 0.16
Flu
x (m
/s)
Pressure (MPa)

49 | P a g e
Membrane 5
Table 10 Fluxes of membrane 5 before used
mb ma g P t V m^3 Flux m/s
22.8313 32.5979 0.05 92.03 9.7666E-06 2.5389E-05
22.3580 32.0849 0.075 62.88 9.7269E-06 3.7007E-05
27.6600 37.3579 0.1 45.5 9.6979E-06 5.0991E-05
21.9247 31.7676 0.125 37.1 9.8429E-06 6.3471E-05
26.7052 36.1260 0.15 29.84 9.4208E-06 7.5529E-05
Figure 21 Fluxes of membrane 5 before used vs Pressure
Table 11 Fluxes of membrane 5 after used
mb ma g P t V m^3 Flux m/s
21.9263 31.8588 0.05 125.4 9.9325E-06 1.8949E-05
21.8221 31.6046 0.075 76.21 9.7825E-06 3.0709E-05
23.3504 33.4128 0.1 63.77 1.0062E-05 3.7749E-05
22.8352 33.3867 0.125 52.85 1.0552E-05 4.7763E-05
22.8352 33.4717 0.15 42.74 1.0637E-05 5.9537E-05
y = 0.0005x - 2E-07R² = 0.9993
0.0000E+00
1.0000E-05
2.0000E-05
3.0000E-05
4.0000E-05
5.0000E-05
6.0000E-05
7.0000E-05
8.0000E-05
0 0.02 0.04 0.06 0.08 0.1 0.12 0.14 0.16
Flu
x (m
/s)
Pressure (MPa)

50 | P a g e
Figure 22Fluxes of membrane 5 after used vs. Pressure
Membrane 6
Table 12 Fluxes of membrane 6 before used
mb ma P t V m^3 Flux m/s
23.4783 33.3156 0.05 53.19 9.8373E-06 4.4246E-05
21.8365 32.0532 0.075 36.16 1.0217E-05 6.7594E-05
23.9219 33.3756 0.1 25.28 9.4537E-06 8.9464E-05
25.4948 35.5556 0.125 21.53 1.0061E-05 1.1179E-04
22.2583 31.6066 0.15 17.16 9.3483E-06 1.3033E-04
y = 0.0004x - 4E-07R² = 0.9938
0.0000E+00
1.0000E-05
2.0000E-05
3.0000E-05
4.0000E-05
5.0000E-05
6.0000E-05
7.0000E-05
0 0.02 0.04 0.06 0.08 0.1 0.12 0.14 0.16
Flu
x (m
/s)
Pressure (MPa)

51 | P a g e
Figure 23 Fluxes of membrane 6 before used vs. pressure
Table 13 Fluxes of membrane 6 after used
mb ma P t V m^3 Flux m/s
23.5906 33.5452 0.05 58.5 9.9546E-06 4.0709E-05
25.5323 34.6734 0.075 39.69 9.1411E-06 5.5099E-05
25.0883 34.6981 0.1 30.19 9.6098E-06 7.6151E-05
23.8447 33.7415 0.125 25.94 9.8968E-06 9.1274E-05
23.6165 34.0336 0.15 23.72 1.0417E-05 1.0506E-04
y = 0.0009x + 2E-06R² = 0.9985
0.0000E+00
2.0000E-05
4.0000E-05
6.0000E-05
8.0000E-05
1.0000E-04
1.2000E-04
1.4000E-04
0 0.02 0.04 0.06 0.08 0.1 0.12 0.14 0.16
Flu
x (m
/s)
Pressure (MPa)

52 | P a g e
Figure 24 Fluxes of membrane 6 after used vs. pressure
Membrane 7
Table 14 Fluxes of membrane 7 before used
mb ma P t V m^3 Flux m/s
22.3535 32.8203 0.05 47.65 1.0467E-05 5.2550E-05
27.6577 37.7713 0.075 31.09 1.0114E-05 7.7823E-05
26.7019 37.0439 0.1 24.16 1.0342E-05 1.0241E-04
22.3904 32.1255 0.125 18.31 9.7351E-06 1.2720E-04
25.4539 35.4832 0.15 15.32 1.0029E-05 1.5662E-04
y = 0.0007x + 8E-06R² = 0.9948
0.0000E+00
2.0000E-05
4.0000E-05
6.0000E-05
8.0000E-05
1.0000E-04
1.2000E-04
0 0.02 0.04 0.06 0.08 0.1 0.12 0.14 0.16
Flu
x (m
/s)
Pressure (MPa)

53 | P a g e
Figure 25 Fluxes of membrane 7 before used vs. Pressure
Table 15 Fluxes of membrane 7 after used
mb ma P t V m^3 Flux m/s
26.0728 35.9446 0.05 63.47 9.8718E-06 3.7209E-05
23.1681 32.9346 0.075 42.00 9.7665E-06 5.5631E-05
23.8898 34.1952 0.1 34.53 1.0305E-05 7.1399E-05
21.982 32.5151 0.125 29.29 1.0533E-05 8.6032E-05
23.2806 33.8933 0.15 26.04 1.0613E-05 9.7501E-05
Figure 26 Fluxes of membrane 7 before used vs. Pressure
y = 0.001x + 3E-07R² = 0.9988
0.0000E+00
2.0000E-05
4.0000E-05
6.0000E-05
8.0000E-05
1.0000E-04
1.2000E-04
1.4000E-04
1.6000E-04
1.8000E-04
0 0.02 0.04 0.06 0.08 0.1 0.12 0.14 0.16
Flu
x (m
/s)
Pressure (MPa)
y = 0.0006x + 9E-06R² = 0.9929
0.0000E+00
2.0000E-05
4.0000E-05
6.0000E-05
8.0000E-05
1.0000E-04
1.2000E-04
0 0.02 0.04 0.06 0.08 0.1 0.12 0.14 0.16
Flu
x (m
/s)
Pressure (MPa)

54 | P a g e
Membrane 8
Table 16 Fluxes of membrane 8 before used
mb ma P t V m^3 Flux m/s
22.3279 32.7582 0.05 51.62 1.0430E-05 4.8340E-05
24.7763 35.0707 0.075 34.22 1.0294E-05 7.1969E-05
22.8965 33.5755 0.1 26.32 1.0679E-05 9.7066E-05
22.8357 33.2982 0.125 21.15 1.0463E-05 1.1834E-04
23.5692 33.4854 0.15 16.28 9.9162E-06 1.4572E-04
Figure 27 Fluxes of membrane 8 before used vs. pressure
Table 17 Fluxes of membrane 8 after used
mb ma P t V m^3 Flux m/s
21.5834 31.7638 0.05 84.53 1.0180E-05 2.8812E-05
21.9209 32.3744 0.075 54.03 1.0454E-05 4.6286E-05
23.3462 34.278 0.1 42.19 1.0932E-05 6.1988E-05
22.7265 35.7164 0.125 40.31 1.2990E-05 7.7093E-05
22.0551 32.6063 0.15 27.10 1.0551E-05 9.3144E-05
y = 0.001x - 2E-07R² = 0.9989
0.0000E+00
2.0000E-05
4.0000E-05
6.0000E-05
8.0000E-05
1.0000E-04
1.2000E-04
1.4000E-04
1.6000E-04
0 0.02 0.04 0.06 0.08 0.1 0.12 0.14 0.16
Flu
x (m
/s)
Pressure (MPa)
55 | P a g e
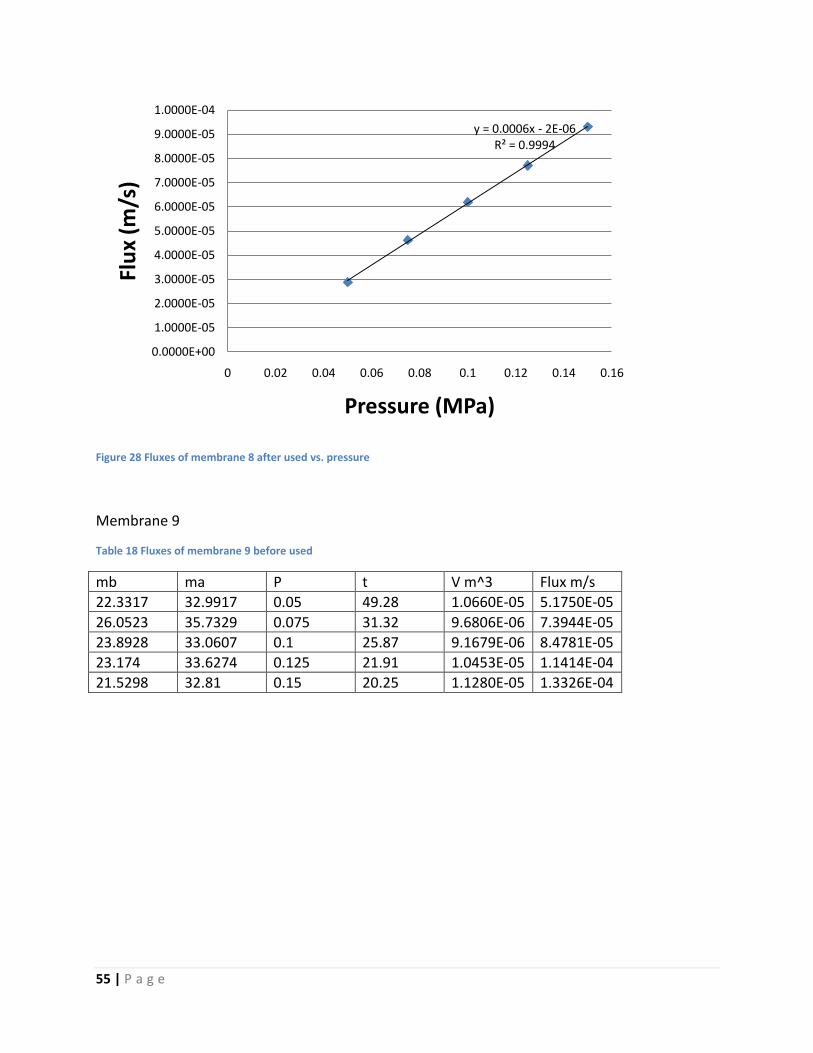
Figure 28 Fluxes of membrane 8 after used vs. pressure
Membrane 9
Table 18 Fluxes of membrane 9 before used
mb ma P t V m^3 Flux m/s
22.3317 32.9917 0.05 49.28 1.0660E-05 5.1750E-05
26.0523 35.7329 0.075 31.32 9.6806E-06 7.3944E-05
23.8928 33.0607 0.1 25.87 9.1679E-06 8.4781E-05
23.174 33.6274 0.125 21.91 1.0453E-05 1.1414E-04
21.5298 32.81 0.15 20.25 1.1280E-05 1.3326E-04
y = 0.0006x - 2E-06R² = 0.9994
0.0000E+00
1.0000E-05
2.0000E-05
3.0000E-05
4.0000E-05
5.0000E-05
6.0000E-05
7.0000E-05
8.0000E-05
9.0000E-05
1.0000E-04
0 0.02 0.04 0.06 0.08 0.1 0.12 0.14 0.16
Flu
x (m
/s)
Pressure (MPa)

56 | P a g e
Figure 29 Fluxes of membrane 9 before used vs. pressure
Table 19 Fluxes of membrane 9 after used
mb ma P t V m^3 Flux m/s
24.1444 34.0097 0.05 84.22 9.8653E-06 2.8023E-05
25.988 35.3203 0.075 57.09 9.3323E-06 3.9107E-05
24.7293 35.1134 0.1 41.66 1.0384E-05 5.9631E-05
24.0063 34.6783 0.125 35.68 1.0672E-05 7.1556E-05
23.6187 34.3346 0.15 29.44 1.0716E-05 8.7079E-05
y = 0.0008x + 1E-05R² = 0.9856
0.0000E+00
2.0000E-05
4.0000E-05
6.0000E-05
8.0000E-05
1.0000E-04
1.2000E-04
1.4000E-04
0 0.02 0.04 0.06 0.08 0.1 0.12 0.14 0.16
Flu
x (m
/s)
Pressure (MPa)
57 | P a g e
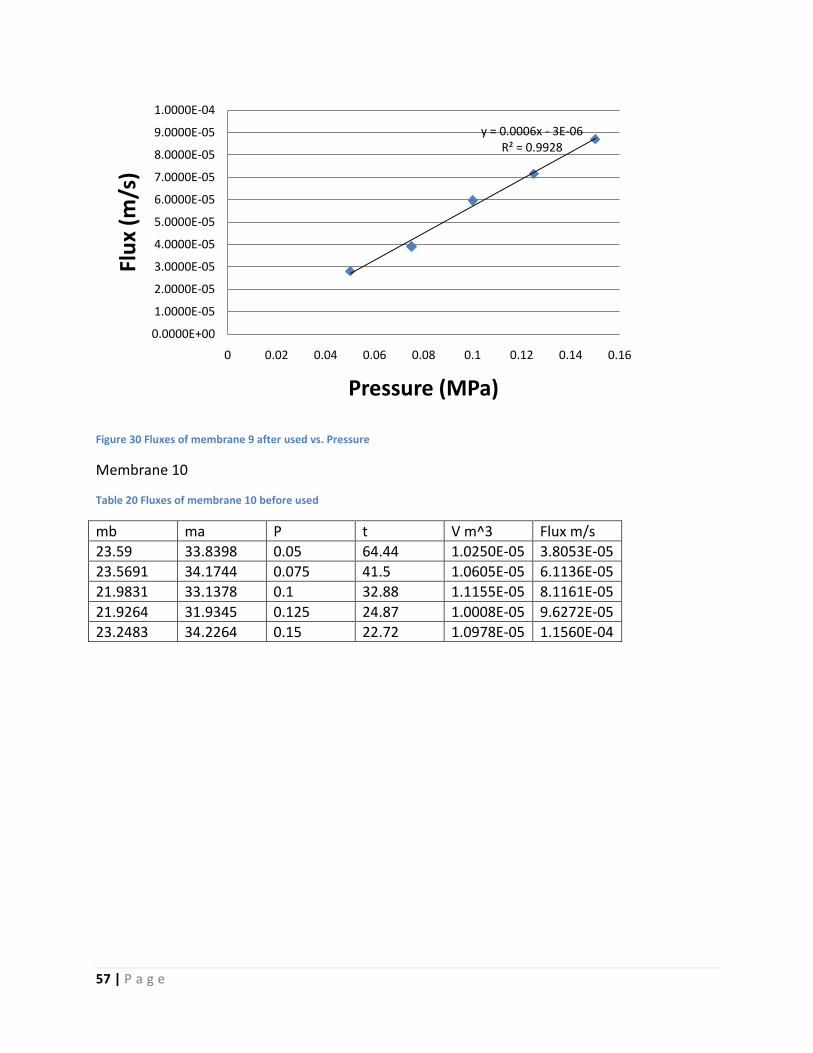
Figure 30 Fluxes of membrane 9 after used vs. Pressure
Membrane 10
Table 20 Fluxes of membrane 10 before used
mb ma P t V m^3 Flux m/s
23.59 33.8398 0.05 64.44 1.0250E-05 3.8053E-05
23.5691 34.1744 0.075 41.5 1.0605E-05 6.1136E-05
21.9831 33.1378 0.1 32.88 1.1155E-05 8.1161E-05
21.9264 31.9345 0.125 24.87 1.0008E-05 9.6272E-05
23.2483 34.2264 0.15 22.72 1.0978E-05 1.1560E-04
y = 0.0006x - 3E-06R² = 0.9928
0.0000E+00
1.0000E-05
2.0000E-05
3.0000E-05
4.0000E-05
5.0000E-05
6.0000E-05
7.0000E-05
8.0000E-05
9.0000E-05
1.0000E-04
0 0.02 0.04 0.06 0.08 0.1 0.12 0.14 0.16
Flu
x (m
/s)
Pressure (MPa)

58 | P a g e
Figure 31 Fluxes of membrane 10 before used vs. Pressure
Table 21 Fluxes of membrane 10 after used
mb ma P t V m^3 Flux m/s
25.0421 35.3524 0.05 81.26 1.0310E-05 3.0354E-05
23.8447 34.6445 0.075 53.38 1.0800E-05 4.8402E-05
25.5318 37.1056 0.1 41.50 1.1574E-05 6.6719E-05
22.8969 33.7797 0.125 32.78 1.0883E-05 7.9425E-05
26.7054 38.129 0.15 28.72 1.1424E-05 9.5157E-05
y = 0.0008x + 2E-06R² = 0.995
0.0000E+00
2.0000E-05
4.0000E-05
6.0000E-05
8.0000E-05
1.0000E-04
1.2000E-04
1.4000E-04
0 0.02 0.04 0.06 0.08 0.1 0.12 0.14 0.16
Flu
x (m
/s)
Pressure (MPa)

59 | P a g e
Figure 32 Fluxes of membrane 10 after used vs. pressure
Membrane 11
Table 22 Fluxes of membrane 11 before used
mb ma P t V m^3 Flux m/s
25.0448 35.4711 0.05 58.94 1.0426E-05 4.2320E-05
23.6167 34.0461 0.075 43.22 1.0429E-05 5.7730E-05
22.3594 33.1543 0.1 30.90 1.0795E-05 8.3576E-05
21.8382 32.9707 0.125 25.60 1.1133E-05 1.0403E-04
23.4847 35.2198 0.15 23.09 1.1735E-05 1.2159E-04
y = 0.0006x - 2E-07R² = 0.9957
0.0000E+00
2.0000E-05
4.0000E-05
6.0000E-05
8.0000E-05
1.0000E-04
1.2000E-04
0 0.02 0.04 0.06 0.08 0.1 0.12 0.14 0.16
Flu
x (m
/s)
Pressure (MPa)

60 | P a g e
Figure 33 Fluxes of membrane 11 before used vs. Pressure
Table 23 Fluxes of membrane 11 after 1st
time used
mb ma P t V m^3 Flux m/s
23.3542 33.7539 0.05 69.28 1.0400E-05 3.5912E-05
24.7777 35.4087 0.075 43.66 1.0631E-05 5.8252E-05
21.9444 32.6547 0.1 33.34 1.0710E-05 7.6853E-05
24.7279 35.5067 0.125 26.75 1.0779E-05 9.6399E-05
23.5909 34.4173 0.15 22.6 1.0826E-05 1.1460E-04
y = 0.0008x - 9E-08R² = 0.9946
0.0000E+00
2.0000E-05
4.0000E-05
6.0000E-05
8.0000E-05
1.0000E-04
1.2000E-04
1.4000E-04
0 0.02 0.04 0.06 0.08 0.1 0.12 0.14 0.16
Flu
x (m
/s)
Pressure (MPa)

61 | P a g e
Figure 34 Fluxes of membrane 11 after 1st
time used vs. Pressure
Table 24 Fluxes of membrane 11 after 2nd
time used
mb ma P t V m^3 Flux m/s
25.2101 35.7345 0.05 71.44 1.0524E-05 3.5244E-05
21.8258 32.8561 0.075 49.06 1.1030E-05 5.3788E-05
23.5836 34.3967 0.1 37.72 1.0813E-05 6.8581E-05
23.3401 34.354 0.125 31.69 1.1014E-05 8.3146E-05
24.1505 34.3833 0.15 26.71 1.0233E-05 9.1653E-05
y = 0.0008x - 2E-06R² = 0.9987
0.0000E+00
2.0000E-05
4.0000E-05
6.0000E-05
8.0000E-05
1.0000E-04
1.2000E-04
1.4000E-04
0 0.02 0.04 0.06 0.08 0.1 0.12 0.14 0.16
Flu
x (m
/s)
Pressure (MPa)
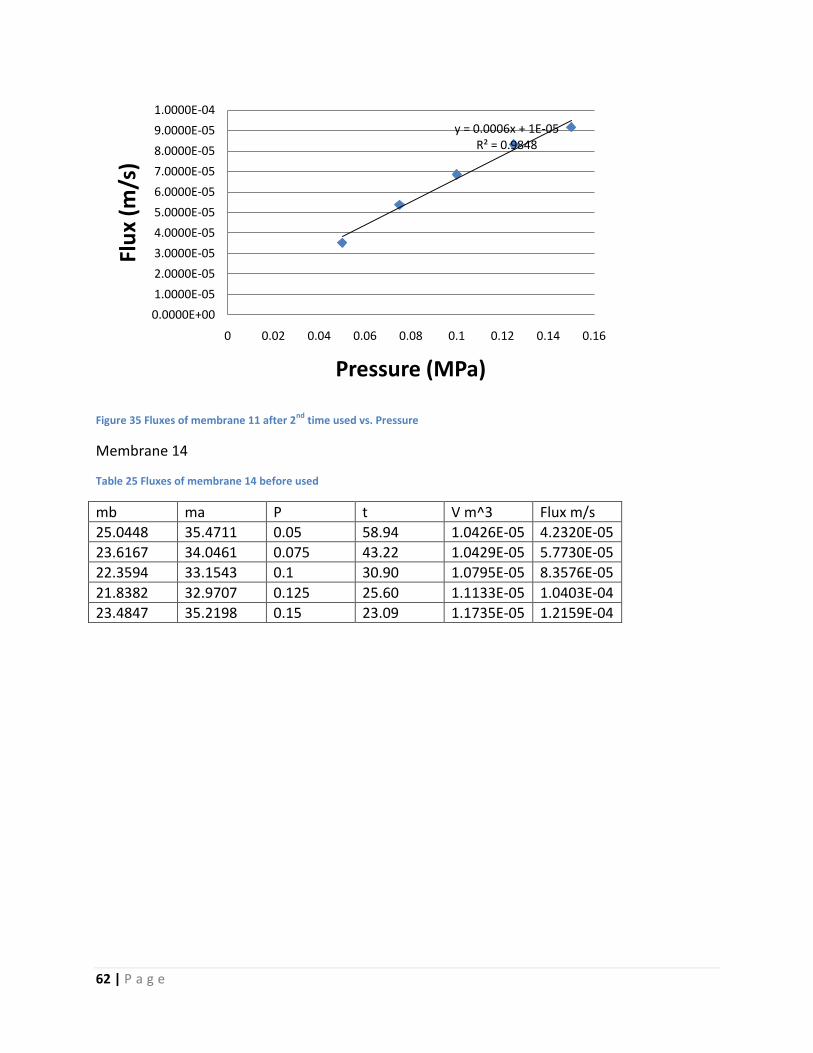
62 | P a g e
Figure 35 Fluxes of membrane 11 after 2nd
time used vs. Pressure
Membrane 14
Table 25 Fluxes of membrane 14 before used
mb ma P t V m^3 Flux m/s
25.0448 35.4711 0.05 58.94 1.0426E-05 4.2320E-05
23.6167 34.0461 0.075 43.22 1.0429E-05 5.7730E-05
22.3594 33.1543 0.1 30.90 1.0795E-05 8.3576E-05
21.8382 32.9707 0.125 25.60 1.1133E-05 1.0403E-04
23.4847 35.2198 0.15 23.09 1.1735E-05 1.2159E-04
y = 0.0006x + 1E-05R² = 0.9848
0.0000E+00
1.0000E-05
2.0000E-05
3.0000E-05
4.0000E-05
5.0000E-05
6.0000E-05
7.0000E-05
8.0000E-05
9.0000E-05
1.0000E-04
0 0.02 0.04 0.06 0.08 0.1 0.12 0.14 0.16
Flu
x (m
/s)
Pressure (MPa)

63 | P a g e
Figure 36 Fluxes of membrane 14 before used vs. pressure
Table 26 Fluxes of membrane 14 after 1st time used
mb ma P t V m^3 Flux m/s
18.0007 27.0587 0.04 103.4 9.0580E-06 2.0957E-05
17.4417 27.3915 0.06 62.79 9.9498E-06 3.7909E-05
17.8436 27.3527 0.08 45.16 9.5091E-06 5.0374E-05
17.942 28.3198 0.1 39.91 1.0378E-05 6.2208E-05
17.9983 27.7723 0.12 32.25 9.7740E-06 7.2505E-05
y = 0.0008x - 9E-08R² = 0.9946
0.0000E+00
2.0000E-05
4.0000E-05
6.0000E-05
8.0000E-05
1.0000E-04
1.2000E-04
1.4000E-04
0 0.02 0.04 0.06 0.08 0.1 0.12 0.14 0.16
Flu
x (m
/s)
Pressure (MPa)

64 | P a g e
Figure 37 Fluxes of membrane 14 after 1st time used vs. pressure
Table 27 Fluxes of membrane 14 after 2nd time used
mb ma P t V m^3 Flux m/s
17.8659 27.4557 0.04 129.93 9.5898E-06 1.7657E-05
18.186 29.0656 0.06 76.6 1.0880E-05 3.3979E-05
17.9047 27.103 0.08 50.44 9.1983E-06 4.3627E-05
18.2911 28.8905 0.1 43.69 1.0599E-05 5.8039E-05
17.7911 28.4528 0.12 35.53 1.0662E-05 7.1789E-05
y = 0.0006x - 2E-06R² = 0.9908
0.0000E+00
1.0000E-05
2.0000E-05
3.0000E-05
4.0000E-05
5.0000E-05
6.0000E-05
7.0000E-05
8.0000E-05
0 0.02 0.04 0.06 0.08 0.1 0.12 0.14
Flu
x (m
/s)
Pressure (MPa)
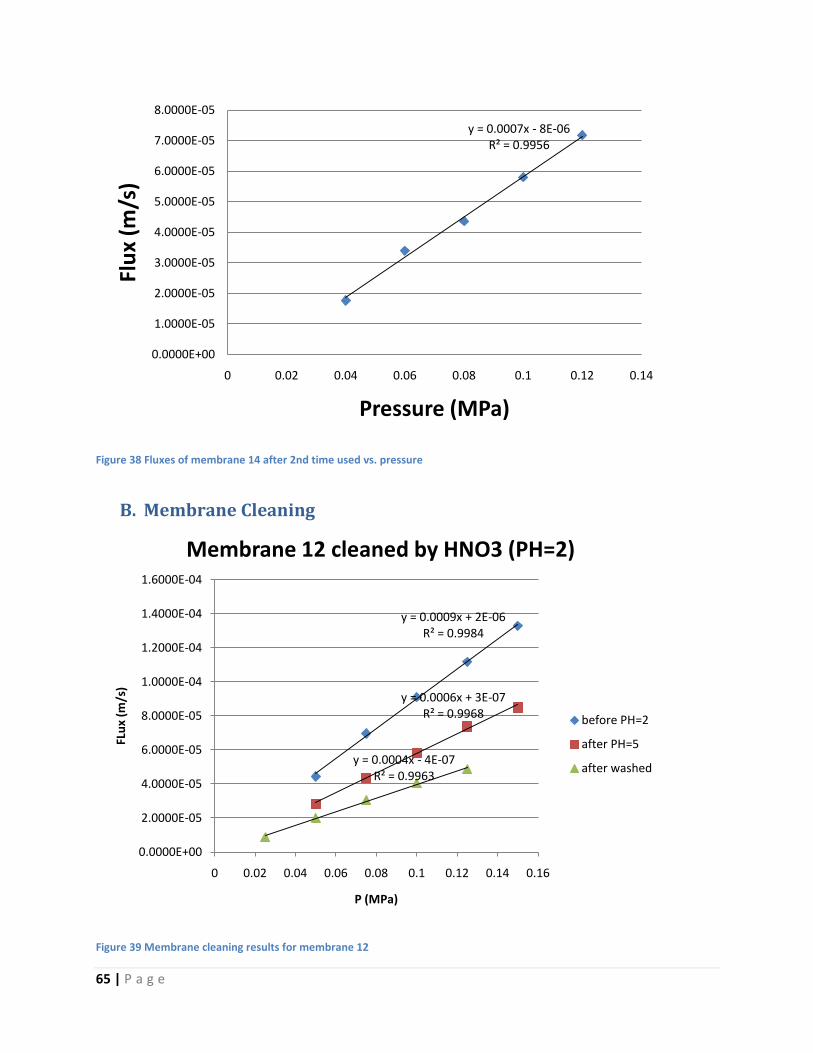
65 | P a g e
Figure 38 Fluxes of membrane 14 after 2nd time used vs. pressure
B. Membrane Cleaning
Figure 39 Membrane cleaning results for membrane 12
y = 0.0007x - 8E-06R² = 0.9956
0.0000E+00
1.0000E-05
2.0000E-05
3.0000E-05
4.0000E-05
5.0000E-05
6.0000E-05
7.0000E-05
8.0000E-05
0 0.02 0.04 0.06 0.08 0.1 0.12 0.14
Flu
x (m
/s)
Pressure (MPa)
y = 0.0009x + 2E-06R² = 0.9984
y = 0.0006x + 3E-07R² = 0.9968
y = 0.0004x - 4E-07R² = 0.9963
0.0000E+00
2.0000E-05
4.0000E-05
6.0000E-05
8.0000E-05
1.0000E-04
1.2000E-04
1.4000E-04
1.6000E-04
0 0.02 0.04 0.06 0.08 0.1 0.12 0.14 0.16
FLu
x (m
/s)
P (MPa)
Membrane 12 cleaned by HNO3 (PH=2)
before PH=2
after PH=5
after washed

66 | P a g e
C. Standard Curves for Strontium Concentration Measurement
Figure 40: 1st and 2nd measurement for standard curve
Figure 41 Final standard curve
y = 0.0146x + 0.0185R² = 0.9979
y = 0.0069x + 0.0395R² = 0.9948
0
0.02
0.04
0.06
0.08
0.1
0.12
0.14
0.16
0 1 2 3 4 5 6 7 8 9
h
ug of Sr2+
Standard Curve, 1st and 2nd Measurement
y = 0.0068x + 0.0005R² = 0.9777
0
0.01
0.02
0.03
0.04
0.05
0.06
0 2 4 6 8 10
h
ug of Sr2+
Final Standard Curve