
Removal of Ciprofloxacin from Water using Zeolites and ...
48
Removal of Ciprofloxacin from Water using Zeolites and Ozone Major Qualifying Project completed in partial fulfillment of the Bachelor of Science Degree at Worcester Polytechnic Institute, Worcester, MA Submitted by: Kassandra Ruggles Katelyn Tolbert Richard Valdes Professors John Bergendahl and Robert Thompson, Faculty advisors This report represents the work of three WPI undergraduate students submitted to the faculty as evidence of a degree requirement. WPI routinely publishes these reports on its web site without editorial or peer review.
Transcript of Removal of Ciprofloxacin from Water using Zeolites and ...

Removal of Ciprofloxacin from Water using Zeolites and Ozone
Major Qualifying Project completed in partial fulfillment of the Bachelor of Science Degree at
Worcester Polytechnic Institute, Worcester, MA
Submitted by: Kassandra Ruggles Katelyn Tolbert Richard Valdes
Professors John Bergendahl and Robert Thompson, Faculty advisors
This report represents the work of three WPI undergraduate students submitted to the faculty as evidence of a degree requirement. WPI routinely publishes these reports on its web site without editorial or peer review.

i
Abstract Ciprofloxacin is a commonly prescribed antibiotic. The discharge of this compound in wastewater can lead to serious health risk and is thus a contaminant of concern. Wastewater treatment plants are currently not sufficient in effectively degrading ciprofloxacin. The objective of this project was to determine if zeolites can aid in the removal of ciprofloxacin from water. This project also demonstrated the effectiveness of ozone in degrading ciprofloxacin as a means for zeolite regeneration. To assess the adsorption abilities of Zeolite 13X, Zeolite Y and Mordenite, the zeolites were studied under varying conditions. These conditions included varying pH, initial concentration of ciprofloxacin, initial mass of zeolites and initial volume of the samples. This study demonstrated that Zeolite 13X, Zeolite Y and Mordenite all exhibit an affinity for adsorbing ciprofloxacin. The optimal pH range was found to be from 4 to 7, and a basic pH was demonstrated to be unfavorable. It was determined that Zeolite Y possessed the highest adsorption capacity. Ozonation was demonstrated to be moderately effective in regenerating zeolites to their original condition.

ii
Acknowledgements
We would like to thank our advisors, Professor Robert Thompson and Professor John Bergendahl for their guidance and feedback throughout our project. We would also like to thank Professor John MacDonald for his laboratory assistance.

iii
Table of Contents
Chapter 1: Introduction .......................................................................................................... 1
Chapter 2: Background ........................................................................................................... 2 2.1 Pharmaceutical contaminants in water ....................................................................................... 2 2.1.1 Pharmaceuticals in wastewater treatment plants .................................................................. 3 2.1.2 Ciprofloxacin .............................................................................................................................. 3
2.2 Oxidation using ozone ................................................................................................................. 5 2.2.1 Ozone degradation .................................................................................................................... 5 2.2.2 Degradation of ciprofloxacin with ozone ................................................................................. 6
2.3 Zeolites ....................................................................................................................................... 7 2.3.1 Overview .................................................................................................................................... 7 2.3.2 Hydrophilicity of zeolites .......................................................................................................... 8 2.3.3 Faujasite ..................................................................................................................................... 8 2.3.4 Zeolite X ...................................................................................................................................... 9 2.3.5 Zeolite Y ...................................................................................................................................... 9 2.3.6 Mordenite ................................................................................................................................... 9 2.3.7 Uses of zeolites ........................................................................................................................ 10 2.3.8 Regeneration of zeolites .......................................................................................................... 12
Chapter 3: Methodology ........................................................................................................ 13 3.1 Removal of ozone from solution ............................................................................................... 13 3.1.1 Identifying a suitable quenching reagent .............................................................................. 13
3.2 Removal of ozone from solution ............................................................................................... 13 3.3 Demonstrating the effectiveness of ozone as an oxidizing agent in the degradation of ciprofloxacin ................................................................................................................................... 13 3.3.1 Continuous ozone flow system ............................................................................................... 13 3.3.2 Batch ozone system ................................................................................................................. 14
3.4 Demonstrating the mass transfer limitations of ozone gas into water ....................................... 14 3.5 Catalytic effect of zeolites ......................................................................................................... 14 3.6 Demonstrating the ability of Zeolite 13X, hydrophobic Zeolite Y and Mordenite to adsorb ciprofloxacin ................................................................................................................................... 14 3.6.1 The effect of pH on the ability of zeolites to adsorb ciprofloxacin ....................................... 14 3.6.2 Zeolite adsorption capacity ..................................................................................................... 15
3.7 Regeneration of zeolites by raising the pH ................................................................................. 15 3.8 Regeneration of zeolites using ozone to degrade adsorbed ciprofloxacin .................................. 16
Chapter 4: Results and Discussion ......................................................................................... 18 4.1 Removal of ozone from solution ............................................................................................... 18 4.1.1 Identifying a suitable quenching reagent .............................................................................. 18
4.2 Creating the standard curve for ciprofloxacin at 270 nm ........................................................... 18

iv
4.3 Demonstrating the effectiveness of ozone as an oxidizing agent in the degradation reaction of ciprofloxacin ................................................................................................................................... 19 4.3.1 Continuous ozone flow system ............................................................................................... 19 4.3.2 Batch ozone system ................................................................................................................. 20
4.4 Demonstrating the mass transfer limitations of ozone gas into water ....................................... 20 4.5 Catalytic effect of zeolites ......................................................................................................... 21 4.6 Demonstrating the ability of Zeolite 13X, Zeolite Y and Mordenite to adsorb ciprofloxacin ....... 22 4.6.1 The effect of pH on the ability of zeolites to adsorb ciprofloxacin ....................................... 22 4.6.2 Zeolite adsorption capacity ..................................................................................................... 24
4.7 Regeneration of zeolites by raising the pH ................................................................................. 25 4.8 Regeneration of zeolites using ozone to degrade adsorbed ciprofloxacin .................................. 26 4.8.1 Trial 1 ....................................................................................................................................... 26 4.8.2 Trial 2 ....................................................................................................................................... 27
Chapter 5: Conclusions and Recommendations ..................................................................... 28
Bibliography .......................................................................................................................... 30
Appendices ........................................................................................................................... 34 A.1 Creating the standard curve for ciprofloxacin at 270 nm ........................................................... 34 A.2 Demonstrating the effectiveness of ozone as an oxidizing agent in the degradation reaction of ciprofloxacin ................................................................................................................................... 35 A.3 Catalytic effect of zeolites ......................................................................................................... 36 A.4 The effect of pH on the ability of zeolites to adsorb ciprofloxacin ............................................. 38 A.5 Zeolite adsorption capacity ...................................................................................................... 39 A.6 Regeneration of zeolites by raising the pH ................................................................................ 40 A.7 Regeneration of zeolites using ozone to degrade adsorbed ciprofloxacin molecules ................. 41

v
Table of Figures Figure 1: Molecular structure of ciprofloxacin ............................................................................................................. 3 Figure 2: Molecular structure of ciprofloxacin at varying pH ................................................................................ 4 Figure 3: Cyclic mechanism for the decomposition of aqueous ozone initiated by hydroxyl ion .......... 5 Figure 4: Oxidation reactions of compounds during ozonation of water ......................................................... 5 Figure 5: Ciprofloxacin molecule ........................................................................................................................................ 7 Figure 6: 3-‐Dimensional depiction of Faujasite structure ....................................................................................... 8 Figure 7: 3-‐Dimensional depiction of Mordenite structure .................................................................................... 9 Figure 8: Zeolite pore size selectivity separation enhancement ........................................................................ 10 Figure 9: Absorbance reading at 254nm over time of a solution of deionized water saturated with gaseous ozone ........................................................................................................................................................................... 18 Figure 10: Standard curve for the absorbance reading at 270 nm on the UV spectrophotometer for ciprofloxacin at varying concentrations with the addition of 60uL sodium thiosulfate .......................... 19 Figure 11: The concentration of ciprofloxacin versus time as it decomposes due to the oxidation via ozone ............................................................................................................................................................................................. 19 Figure 12: The concentration of ciprofloxacin versus time as it decomposes due to the oxidation via ozone ............................................................................................................................................................................................. 20 Figure 13: Ozonation of a 1000 mL solution of ciprofloxacin with a starting concentration of 42 mg/L .............................................................................................................................................................................................. 21 Figure 14: Ozonation of a 1000 mL solution of ciprofloxacin with a starting concentration of 42 mg/L .............................................................................................................................................................................................. 22 Figure 15: Percentage of the ciprofloxacin adsorbed in 24 hours by Zeolite 13X, Mordenite and Zeolite Y at varying pH .......................................................................................................................................................... 23

vi
Table of Tables Table 1: Sample specifications for 24 hour adsorbance trials at varying pH ................................................ 15 Table 2: Effectiveness of oxidation by ozone in a batch system to degrade ciprofloxacin in solution ......................................................................................................................................................................................................... 20 Table 3: Mass of ciprofloxacin adsorbed by 100 mg of Zeolite Y at varying initial masses of ciprofloxacin .............................................................................................................................................................................. 24 Table 4: Mass of ciprofloxacin adsorbed by 100 mg of Zeolite 13X at varying initial masses of ciprofloxacin .............................................................................................................................................................................. 24 Table 5: Mass of ciprofloxacin adsorbed by 100 mg of Mordenite at varying initial masses of ciprofloxacin .............................................................................................................................................................................. 25 Table 6: Comparison of ciprofloxacin adsorption in zeolites regenerated using pH adjustments to the ciprofloxacin adsorption of zeolites in a control sample ............................................................................... 26 Table 7: The original mass of ciprofloxacin adsorbed by zeolites compared to the mass of ciprofloxacin adsorbed after regeneration by ozone oxidation .......................................................................... 27 Table 8: The original mass of ciprofloxacin adsorbed by zeolites compared to the mass of ciprofloxacin adsorbed after regeneration by ozone oxidation .......................................................................... 27
1
Chapter 1: Introduction With an increase in the standard of living there has been an increased dependence on different chemical compounds for day to day life. This increase can be seen in the administration of pharmaceuticals in the agriculture sector, prescribed medicines, antibacterials, and other household products. However, the production of these conveniences rarely considers the potential for these compounds to end up in drinking water.
In 1990-‐2000 a national reconnaissance of US streams was performed. The study tested samples from 139 streams in 30 states. It found that 80% of the 139 streams sampled contained 95 different organic contaminants. These contaminants included hormones, personal care products, detergents, flame retardants, prescription and non-‐prescription drugs, steroids, and antibiotics (Barber et al., 2002). The samples typically contained a very low concentration (microgram/liter) and rarely exceeded the drinking water guidelines. Due to the low concentrations, the contaminants were often undetectable using current technology. However, the non-‐detection of a compound cannot be assumed to indicate that the compounds were not in the water samples.
Additionally, most samples contained multiple contaminants, with as many as 38 components in a single sample. Most standards for levels of a contaminant in drinking water are recognized for a single contaminant; however, little is known about the toxicity when multiple contaminants are combined (Barber et al., 2002). The detection of these compounds in the environment suggests that they are resilient to removal by typical wastewater treatment plants (WWTP).

2
Chapter 2: Background 2.1 Pharmaceutical contaminants in water Pharmaceuticals can enter the environment from many pathways including excreted un-‐metabolized components from both human and animal sources. When antibiotics are metabolized by the body the parent compound is broken down into metabolites. These metabolites are typically active, meaning that they continue to produce effects of the parent drug. Researchers have found that metabolites “tend to be more persistent in environmental media (Buhner, 2002).” Therefore there is potential for both the parent drug and active metabolites to be excreted. The typical amount of a pharmaceutical that can be excreted un-‐metabolized can range from fifty to seventy five percent (Aminov et al., 2009). Another way for pharmaceuticals to end up in the environment is the direct release by humans. For example, in the San Francisco Bay area it was found that “45% of unused or expired medicines were flushed down toilets and 28% were disposed directly into the trash” (Kreisberg, 2007).
There is also the potential for pharmaceuticals from animals raised for human consumption to make their way to water sources. The addition of antimicrobials to animal feed or drinking water has been a regular practice in animal husbandry since the 1950’s. Feed lot animals are typically given antibiotics for treatment and prevention of disease, as well as improving feed efficiency and growth (Aminov et al., 2009). Aminov et al. reported that different pharmaceuticals can be metabolized by animals in varying degrees. Additionally, it is very common for waste from farm animals to be used in fields for farming. Many farm animals are given antibiotics or hormones and therefore excrete the un-‐metabolized portion of these drugs. Therefore, the manure that is used in agricultural farming may contain pharmaceuticals and active metabolites (Halling-‐Sorensen et al., 2000).
There is a common misconception that antibiotics are biodegradable because they metabolize to some extent within the human body. However, most pharmaceuticals are persistent chemicals that will “remain biologically active after they leave the body” or are otherwise disposed (Washington State University). Additionally, pharmaceuticals are lipophilic, meaning that the compounds will dissolve into the fat of a species. These characteristics can lead to bioaccumulation, the accumulation of organic chemicals in an organism, as well as persistence in the environment (Christensen, 1998). Both of these conditions allow the compound to travel up the food chain as one organism eats another (Kreisberg, 2007). For example, research has found pharmaceuticals in the tissue of fish, earthworms, and plants (Glassmeyer et al., 2008). Pharmaceuticals can be described as “pseudo-‐persistent” meaning that “their rate of transformation and removal from the environment is overwhelmed by their replacement rate-‐ a direct result of long term use of higher quantities …and of improper disposal” (Kreisberg, 2007).
3
2.1.1 Pharmaceuticals in wastewater treatment plants Pharmaceuticals and other organic compounds can survive the WWTP process and end up in effluent from the plant where these components have the potential to negatively impact the environment. A typical WWTP aims to remove the bulk of organic contaminants. Wastewater that is sent to a WWTP goes through a series of settling tanks, activated sludge, aeration, and UV sterilization. However, most WWTPs were not designed to remove biological nutrients (McConnell et al., 2010). Therefore, pharmaceuticals have the potential to escape the treatment plant and to be introduced into the environment in the effluent. A study was performed on the effluent from WWTPs. The study suggests that Organic Waste Contaminants “are frequently detected in streams whose flow contains effluent from municipal” WWTPs (Furlong et al., 2004). These findings corroborate those of the national reconnaissance on contaminants in US streams.
Another study was performed in Europe to address why newer WWTPs remove certain contaminants better than older plants. For example, in an updated plant in Wiesbaden, Germany, wastewater is treated in three activated sludge tanks over 11 to 13 days (Harder, 2009). Previously, water was only treated in one tank for a maximum of 4 days. The study states that older plants typically have one tank and therefore do not have the ability to expose the water for a long enough duration to decompose the more persistent pharmaceuticals.
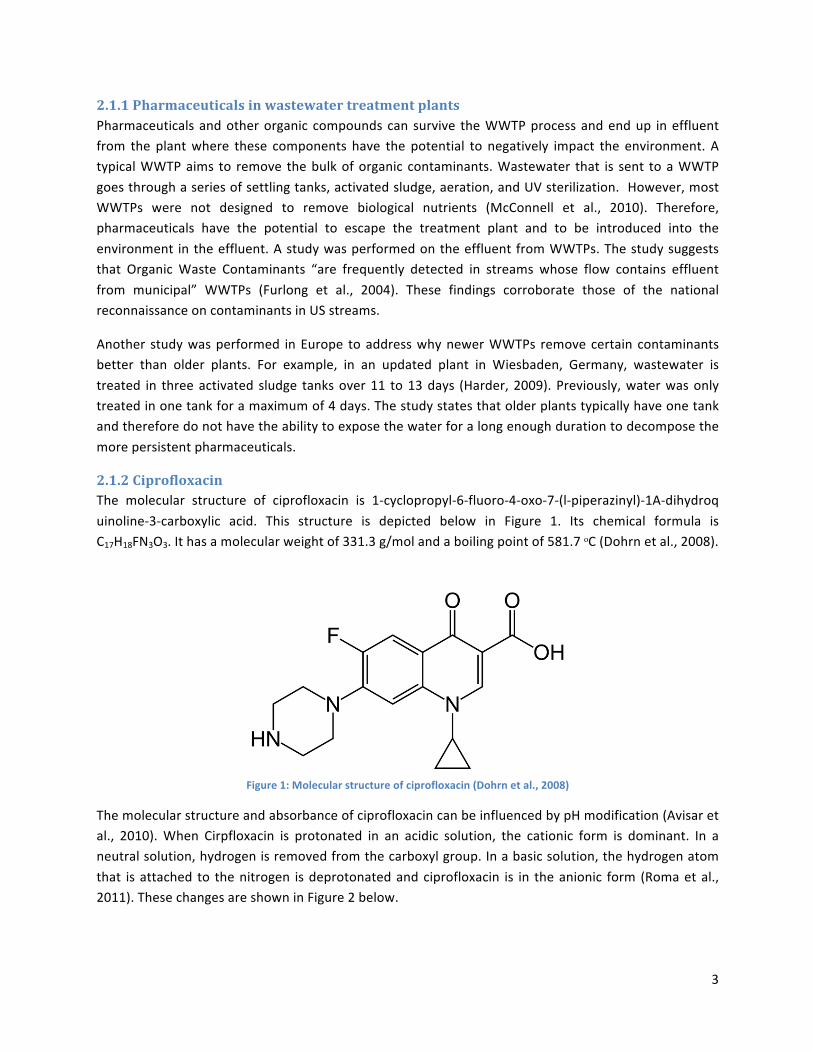
2.1.2 Ciprofloxacin The molecular structure of ciprofloxacin is 1-‐cyclopropyl-‐6-‐fluoro-‐4-‐oxo-‐7-‐(l-‐piperazinyl)-‐1A-‐dihydroq uinoline-‐3-‐carboxylic acid. This structure is depicted below in Figure 1. Its chemical formula is C17H18FN3O3. It has a molecular weight of 331.3 g/mol and a boiling point of 581.7 ᵒC (Dohrn et al., 2008).
Figure 1: Molecular structure of ciprofloxacin (Dohrn et al., 2008)
The molecular structure and absorbance of ciprofloxacin can be influenced by pH modification (Avisar et al., 2010). When Cirpfloxacin is protonated in an acidic solution, the cationic form is dominant. In a neutral solution, hydrogen is removed from the carboxyl group. In a basic solution, the hydrogen atom that is attached to the nitrogen is deprotonated and ciprofloxacin is in the anionic form (Roma et al., 2011). These changes are shown in Figure 2 below.

4
Figure 2: Molecular structure of ciprofloxacin at varying pH (Avisar et al., 2010)
Ciprofloxacin is an antibiotic used for treating and preventing infections caused by bacteria. Ciprofloxacin is widely prescribed as an antibiotic in the United States, as it can be used to treat a wide spectrum of bacterial infections (Bhandari et al., 2008). It rose in popularity due to its ability to address symptoms caused by anthrax. Ciprofloxacin is also capable of treating infections of bones and joints, urinary tract infections, and prostatitis. It functions by targeting DNA gyrase and DNA topoisomerase IV, which are both essential bacterial enzymes necessary for DNA separation (Drlica & Zhao, 1997). This inhibits cell division in the bacteria, effectively slowing reproduction.
According to a study conducted by Araujo et al., a test on the environment for ciprofloxacin found harmful amounts of the antibiotic in hospital effluents, sewage treatment plant influents and effluents, and surface waters (Araujo et al., 2010). WWTPs are not capable of sufficiently eliminating ciprofloxacin, thus a significant amount of the compound is often discharged into the environment. Although ciprofloxacin is designed to treat and prevent bacterial infections, high levels of the compound in water can also present significant health and environmental concerns (Ahmed et al., 2009). If ciprofloxacin is present in drinking water, it can lead to human consumption in small quantities. Bacteria have the potential to become resistant to antibiotics when they have had long-‐term, low-‐level exposure to antimicrobials. As the antibiotic concentration in growth media is increased, bacterial mortality increases. This means periodically taking in small amounts of ciprofloxacin can cause bacteria to become more resistant to treatments. Antibiotic resistant bacteria pose a serious threat to the treatment of infections and quality of public health (Ahmed et al., 2009)
There have been many methods developed for the removal of contaminants such as ciprofloxacin. Ultraviolet degradation is one such method, which uses UV light to perform radiation, photolysis, or oxidation (Roma et al. 2011). This method is most efficient at a pH of 7, which allows for the most complete degradation.

5
2.2 Oxidation using ozone
2.2.1 Ozone degradation The ozonation process has become a popular method for the treatment of water over the past few years. Research on this process has found that ozone decomposes spontaneously with water. The mechanism is complex, but results in the production of hydroxyl radicals which are “the most reactive oxidizing agents in water (EPA Guidance Manual, 1999).” The cyclic mechanism for the decomposition of aqueous ozone is shown below in Figure 3.
Figure 3: Cyclic chain mechanism for the decomposition of aqueous ozone initiated by hydroxyl ion (EPA Guidance Manual,
1999)
As Figure 3 illustrates, the ozone molecule is unstable. Therefore, the exact ozonation mechanism has not been established, although many mechanisms have been proposed. Figure 4, below, illustrates two possible reaction pathways.
Figure 4: Oxidation reactions of compounds during ozonation of water (EPA Guidance Manual, 1999)

6
If ozone follows the second pathway and decomposes via an initial reaction with the hydroxyl radical, research states that “high pH values (11) are thought to catalyze the formation of HO-‐ radicals directly from O3. The set of reactions for the HO-‐ production from OH-‐ is listed in the following reaction sequence” (Crittenden et al., 2005):
𝑂𝐻! + 𝑂! → 𝐻𝑂!! + 𝑂! (1)
𝐻𝑂!! + 𝑂! → 𝑂!! + 𝐻𝑂! ∙ (2)
𝐻𝑂! ∙ ↔ 𝑂!! ∙ + 𝐻! (3)
𝑂!! + 𝑂! → 𝑂!! + 𝑂! (4)
𝑂!! ∙ + 𝐻! → 𝐻𝑂! ∙ (5)
𝐻𝑂! ∙ → 𝐻𝑂 ∙ + 𝑂!(6)
(Crittenden et al., 2005)
Although the hydroxyl radical is the most powerful oxidant, the most desired ozonation reaction is direct oxidation of the substrate, which results in the destruction of the contaminant. The second pathway is the decomposition of ozone by the hydroxyl radical that is produced when ozone itself decomposes. The second reaction will still result in the oxidation of the contaminant, however it also has the potential to produce undesired byproducts. As illustrated in reactions 1-‐6 (Crittenden et. al., 2005), the reaction between the hydroxyl radical and ozone can create many additional products that are readily consumed in other reactions and thus could produce the negative byproducts depicted in Figure 4. The decomposition of ozone into the hydroxyl radical results in “the net production of 1.5 mole hydroxyl free radicals per mole ozone (EPA Guidance Manual, 1999).”
2.2.2 Degradation of ciprofloxacin with ozone A study of the degradation of ciprofloxacin in water with ozone was published by DeWitte et al. The ozonation of ciprofloxacin was performed in a bubble reactor with deionized water. The samples were flushed with nitrogen immediately after being collected to remove any remaining ozone. This study found that most of the ciprofloxacin in the solution was degraded after 60-‐75 minutes. Additionally, the study identified 17 degradation products. The main products were formed by degradation occurring at two locations of the molecule, either the piperazinyl substituent or the quinolone moiety (DeWitte et al,. 2008). In Figure 5, below, the piperazinyl substituent can be found at position 7 and the quinolone moiety is found at the two fused benzene rings (Dohrn, 2008).

7
Figure 5: Ciprofloxacin molecule (Dohrn, 2008)
The introduction of a hydroxyl group at the piperazinyl substituent eventually leads to the loss of C4H7N, which results in the production of desethylene ciprofloxacin. However, degradation at the quinolone moiety results in the formation of “anthranilic acid analogue” (DeWitte et al, 2008). This study suggested that degradation is more likely to occur at the quinolone moiety at a pH of 7. DeWitte et al. suggested that this is because the piperazinyl radical is less degradable and therefore, “degradation at the quinolone moiety is favored.” It is also possible that “direct ozone attack is less probable at the quinolone moiety than at the piperazinyl”. This is because the latter is crowded with large substituents and pi-‐electrons (DeWitte et Al, 2008). The study was able to support their findings by utilizing t-‐butanol as a radical scavenger. With the addition of t-‐butanol to the experiment, there was no formation of anthranilic acid analogues. Therefore, Dewitte et al. concluded that “hydroxyl radicals are necessary for degradation of ciprofloxacin at the quinolone moiety while direct ozonation easily occurs at the piperazinyl substituent.” Degradation at the quinolone moiety is favored because this “reduces the antibacterial potential of the drug” while degradation at the piperazinyl substituent “will still have the essential quinolone antibacterial structure (DeWitte et al, 2008).”
2.3 Zeolites 2.3.1 Overview Zeolites are inorganic crystalline solids with well-‐defined structures comprised of aluminum, silicon and hydrogen (Bell, 2011). Zeolites form a framework of alumina-‐silica tetrahedra that create 1-‐20 angstrom (Å) channels leading to a center cavity (Wahab, 2009). Aluminum has a lower valency than silicon and therefore “the number of AlO4 tetrahedra controls the negative charge on the zeolite framework” (Cejka & Wichterlova, 2007). The alumina-‐silica framework is negatively charged and this attracts positive ions to the channels and internal cavity (Peskov, 2007). The ratio of silicon to aluminum in the zeolite structure can have significant effects on the zeolite’s properties. The catalyst’s hydrophilicity and the volume of its internal cavity are both affected by this ratio. (Mallada & Menendez, 2008) The inner cavity of a zeolite is larger than the pores. This allows multiple molecules to travel down the channels and remain inside the cavity. Currently, there are “191 unique zeolite frameworks” with over 40 of these present in nature (Peskov, 2007). Zeolites are naturally formed near volcanos where the

8
volcanic ash reacts with alkaline water to form the crystalline structures. Naturally occurring zeolites are mined in many parts of the world, but most of the zeolites found in nature cannot be used commercially as they contain high levels of impurities. Therefore, configurations of high purity zeolites are produced synthetically. 2.3.2 Hydrophilicity of zeolites Hydrophilicity is defined as a strong affinity for water. In the case of zeolites, this means that the molecule is capable of adsorbing and trapping water. A zeolite’s degree of hydrophilicity can be fine-‐tuned by adjusting the silica to alumina ratio; zeolites are more hydrophilic at lower ratios (Mallada & Menendez, 2008).
Zeolites that have more hydrophilic pores have a greater affinity for adsorbing water. At higher Si/Al ratios the pores of zeolites can become hydrophobic and repel or fail to adsorb much water. However, the external surfaces may still be hydrophilic. (Ritter, 2012).
2.3.3 Faujasite Faujasite was discovered in 1842 and is named after Barthelemy Faujas, a respected French geologist. Faujasite is commonly created by volcanic activity and the natural compound is sold commercially by the Natural Faujasite Company. Natural Faujasite has a high ion exchange capacity and is able to help catalyze reactions by attracting cations from organic molecules. The pore size of Faujasite is approximately 7.4 Å in diameter and the internal cavity is 13 Å in diameter (Structure Commission of the International Zeolite Association , 2007). Figure 6, below, shows the pore structure of Faujasite.
Figure 6: 3-‐Dimensional depiction of Faujasite structure (Structure Commission of the International Zeolite Association, 2007)
Due the impurities in the structure of naturally occurring Faujasite, the zeolite is often chemically synthesized as new zeolites with similar structures. The synthetic zeolites are generally either Zeolite X or Zeolite Y, depending on the silicone to aluminum ratio of their framework. “In Zeolite X, the ratio is between 2 and 3 while in Zeolite Y it is 3 or higher (Htay & Htay, 2012).”

9
2.3.4 Zeolite X Zeolite X has a 3-‐dimensional pore structure similar to Faujasite. The pores are comprised of an oxygen ring and are approximately 8 Å in diameter. Zeolite X is has a Si/Al ratio that falls approximately between 2 and 3, it is hydrophilic, and the internal cavity is 13 Å in diameter (Jong-‐Hwa Kim, 2003). It is used commercially as an ion-‐exchanger for water treatment processes as it has a high ion exchange capacity. Zeolite X is used to remove large ions such as magnesium and iron (Htay & Htay, 2012).
2.3.5 Zeolite Y Zeolite Y has a 3-‐dimensional pore structure similar to Faujasite. Zeolite Y has a diameter of approximately 7.4 Å. The pores are comprised of 12 member oxygen rings (Price, 2000) and the internal cavity is 13 Å in diameter. Zeolite Y is hydrophilic and its silicone to aluminum ratio is approximately 3 or higher. This compound possesses a lower alumina content than Zeolite X. Zeolite Y has ion-‐exchange, catalytic and adsorptive properties (Htay & Htay, 2012). The structure is fairly resistant to heat degradation and it will not begin to decompose until 793 C (Price, 2000). This zeolite is most often used for catalyzing cracking reactions. While Zeolite Y is typically hydrophilic, there is a commercially available hydrophobic type called Dealuminated Y, or DAY. It is hydrophobic as its aluminum content is significantly lower. This causes the zeolite to have a higher silicone to aluminum ratio (Hunger, Paulus, Stelzer, & Weitkamp, 1998). Zeolite DAY also has a very open structure, with a pore volume of 0.38 cm3/g (Fleys, 2003).
2.3.6 Mordenite Mordenite is an orthorhombic crystal structure with straight 12-‐membered ring channels and crossed 8-‐membered ring channels. The pores of the channels are 6.5 by 7.0 Å and 2.8 by 5.7 Å respectively (Zeochem, 2011). It has a silicone to aluminum ratio of about 5, and it is considered to be hydrophilic (Coronas, Piera, & Salomoan, 1998).The relatively large pores of the Mordenite structure result in “thermal, hydrothermal and acid stability” (Peskov, 2007). Therefore Mordenite is often used as an adsorbent and hydrocarbon conversion catalyst (Peskov, 2007). Figure 7, below, illustrates the structure of Mordenite.
Figure 7: 3-‐Dimensional depiction of Mordenite structure (Peskov, 2007)

10
2.3.7 Uses of zeolites
2.3.7.1 Separation enhancement The unique structures of zeolites allow them to be used in a wide variety of processes. The pore size and molecular shape of a zeolite can be chosen to enhance separation according to different reaction specifications; these include the molecular shape of the reactant, product or a restricted transition shape. (Weitkamp, 1998). The images in Figure 8 below show how the selectivity of zeolites is effective in enhancing separation.
Figure 8: Zeolite pore size selectivity separation enhancement (Wilkinson, 2012)
The shape selective property of zeolites makes them useful in many applications. One of the most common industrial applications of zeolites is fluid catalytic cracking (FCC). This process is typically carried out using Zeolite Y. The process of FCC breaks down heavy hydrocarbons into lighter fragments and the zeolite presence inhibits the formation of coke” (Wilkinson, 2012). Zeolites are also often utilized in other separation processes. For example, zeolites can be used to soften water by ion-‐exchange. The zeolites will exchange ions for “hard” minerals in water. Zeolites can also be utilized in adsorption processes. Adsorption is a process by which a substance in a gas or a liquid becomes attached to a solid surface (Wahab, 2009). The structure of zeolites yields a large amount of surface area for adsorption to take place. Molecules can also adsorb to the inner surfaces of zeolites if they are small enough to fit through the pores. Each zeolite has a different adsorption capacity which is the amount of contaminants that it is able to adsorb. This value can be adjusted by modifying the Si/Al ratio; zeolites that have larger Si/Al ratios and are more hydrophobic tend to have higher adsorption capacities (Xu & Langford, 1997).

11
2.3.7.2 Reaction Catalysis In addition to being utilized directly, zeolites can also be used as catalysts for reactions. The crystalline porous structures enhance molecular sieving. In addition, zeolites are able to ion-‐exchange to produce cations with suitable properties to catalyze acid or metal driven reactions (Peskov, 2007). Zeolites are therefore often used as acid catalysts (Wilkinson, 2012). The zeolites can ion-‐exchange so that the extra-‐framework contains protons which attract water molecules and release the protons simulating “Lewis acidity at defect sites” (Wilkinson, 2012). The acid strength is dependent on the type of “trivalent cation substituting silicon and its concentration in the silicate framework” (Cejka & Wichterlova, 2007). Therefore, the ions chosen to alter the diameters of the zeolite pores must also be assessed for their acidic ability. While “it has been well documented that the simultaneous presence of Bronsted and Lewis acid sites enhances the zeolite acidic activity” (Cejka & Wichterlova, 2007), approximately only 3-‐5% of the total acid sites are located on the external surface of the zeolites. This is because a larger portion of the total surface area of zeolite is internal, that is, in the pores. However, the contribution of the external surface acidic sites “to the overall catalytic reaction might not be negligible” (Cejka & Wichterlova, 2007). In fact, a study was done by Farcasiu and Degnan in 1987 to determine the role of external surface activity in the effectiveness of zeolites. A theoretical model was developed for “diffusion and reaction in small zeolite crystals (in Faujasite) where external surface activity may be significant”. This model illustrated that “for small zeolite crystallites, less than 1000 Å in diameter, the effects of the external activity can become important particularly for very rapid catalytic reactions or highly diffusion-‐limited reactions” (Farcasiu & Degnan, 1987). Farcasiu et al. found that the following equation defined the diffusion and reaction in porous catalysts where the external contribution is significant:
𝑘!"#$ = 1 − 𝑓 ∗ 𝜂𝑘!"# + 𝑓𝑘! Where 𝜂 is an effectiveness factor 𝑓 is the fraction of active sites on external surface 𝑘! is the reaction rate constant of surface sites 𝑘!"# is the intrinsic reaction rate constant of the internal sites It is also important to consider that the external structures of zeolites contain “free silanols or terminal silanols consisting of an OH group bonded to an external Si atom” (Hoffmann & Lobo, 2007). Research has indicated that these sites can behave as weak Bronsted acids (Hoffman et al., 2007). A study performed by Kondo, Yoda and Ishikawa found that the silanol groups were observed to have participated in the decomposition reaction of isobutene while the internal acidic sites remained unchanged. “This indicates that isobutene could not intrude inside the pores of [the zeolite] but that it adsorbed onto the silanol groups on the outer surface” (Kondo et al., 2000). They also concluded that the silanol groups could be slightly more acidic than those on the amorphous silica, indicating a potential for reactions on the external zeolite surface (Kondo et al., 2000).

12
2.3.8 Regeneration of zeolites Zeolites can become deactivated due to the accumulation of contaminants in their pores. This accumulation can slow the rate at which the zeolite is capable of catalyzing a reaction, and therefore it is important to explore methods of zeolite regeneration (Ivanov & Sobolev, 2002). One such method of removing contaminants from the pores of zeolites is oxidation. In a study completed by Ivanov and Sobolev regeneration of Zeolite ZSM-‐5 was performed using two methods: oxygen diluted with helium and nitrous oxide diluted with helium. This study found that zeolites were most effectively regenerated after oxidation because of lower coke contents (Ivanov & Sobolev, 2002).
Ozonation can also be used to regenerate Mordenite that has adsorbed organic compounds, as shown in a study conducted by Reungoat and Pic. For their experiments, Mordenite that had been regenerated using ozonation was able to reach its original adsorption capacity in 2 hours (Pic, 2007). These techniques are very useful, as the ability to return zeolites to their original state is important for removing pollutants from water.

13
Chapter 3: Methodology
3.1 Removal of ozone from solution The ozone generator was set to run at 5 standard cubic feet per hour (SCFH) at 100% conversion of oxygen gas to ozone. A sparger was used to disperse the ozone throughout the sample of water. In order to obtain a saturated solution of ozone, the system was operated continuously for 20 minutes. The Varian-‐Cary 50 Scan UV-‐visible spectrophotometer was used to analyze the absorbance of ozone at a wavelength of 254 nm. Once the absorbance reading was consistent, the solution was considered to be saturated. The ozone generator was shut off and the absorbance reading of the solution was then tested every 5 minutes for 1 hour to determine the length of time needed for ozone to separate from the solution.
3.1.1 Identifying a suitable quenching reagent The ozone generator was set to run at 5 SCFH at 100% conversion of oxygen gas to ozone. A sparger was used to disperse the ozone throughout the sample of water. In order to obtain a saturated solution of ozone, the system was operated continuously for 20 minutes. The Varian-‐Cary 50 Scan UV-‐visible spectrophotometer was used to analyze the absorbance of ozone at a wavelength of 254 nm. Samples of ozonated water were taken and quenched with varying volumes (10-‐200uL) of the quenching reagents. Acetone, Sodium Bisulfite and Sodium Thiosulfate were analyzed for their ability to quench ozone in solution.
The optimal reagent was chosen and used in subsequent experiments.
3.2 Removal of ozone from solution 1.0 mL samples of known concentration of ciprofloxacin ranging from 45 mg/L to 0.5 mg/L were created. 60 uL of Sodium Thiosulfate was added to each sample. These samples were then analyzed using the Varian-‐Cary 50 Scan UV-‐visible spectrophotometer to measure absorbance at 270 nm. The absorbance readings were then correlated to the known concentrations and plotted to generate a concentration standard curve. This curve allowed any unknown concentration within this range to then be determined.
3.3 Demonstrating the effectiveness of ozone as an oxidizing agent in the degradation of ciprofloxacin 3.3.1 Continuous ozone flow system A 250 mL solution of 20 mg/L ciprofloxacin was prepared in a beaker. The ozone generator was set to run at 1 SCFH at 100% conversion of oxygen gas to ozone. A sparger was used to disperse the ozone throughout the sample of water. The Varian-‐Cary 50 Scan UV-‐visible spectrophotometer was used to analyze the absorbance of ciprofloxacin at a wavelength of 270 nm. An absorbance reading was taken initially and then every minute for the duration of the experiment. The absorbance was correlated to ciprofloxacin concentration in order to determine the rate of ciprofloxacin degradation.
The experiment was repeated at 2% conversion of oxygen gas to ozone.

14
3.3.2 Batch ozone system The ozone generator was set to run at 5 SCFH at 100% conversion of oxygen gas to ozone. A sparger was used to disperse the ozone throughout the sample of water. In order to obtain a saturated solution of ozone, the system was operated continuously for 20 minutes.
Two samples of an 87.5 mg/L ciprofloxacin solution, 240 mL and 10 mL respectively, were prepared. 640 mL of ozone saturated water added to the 240 mL solution to create a 1 L batch system. 90 mL of ozone saturated water added to the 10 mL solution to create a 100 mL batch system. The absorbance of each system recorded every minute for 20 minutes. The absorbance was correlated to ciprofloxacin concentration in order to determine the rate of ciprofloxacin degradation. These values were compared with the expected concentration change due to added volume.
3.4 Demonstrating the mass transfer limitations of ozone gas into water A 1000 mL ciprofloxacin solution was prepared at 43.75 mg/L in a 2500 mL Erlenmeyer flask. The ozone generator was set to run at 5 SCFH at 100% conversion of oxygen gas to ozone. A sparger was used to disperse the ozone throughout the sample of water. The Varian-‐Cary 50 Scan UV-‐visible spectrophotometer was used to analyze the absorbance of ciprofloxacin at a wavelength of 270 nm. An absorbance reading was taken initially and then every minute for the duration of the experiment. The absorbance was correlated to ciprofloxacin concentration in order to determine the rate of ciprofloxacin degradation in a larger volume of solution.
3.5 Catalytic effect of zeolites 1000 mL samples of 43.75 mg/L ciprofloxacin were prepared in a 2500 mL Erlenmeyer flask. 100 mg of a zeolite was added to each sample. The ozone generator was set to run at 5 SCFH at 100% conversion of oxygen gas to ozone. A sparger was used to disperse the ozone throughout the sample of water. The Varian-‐Cary 50 Scan UV-‐visible spectrophotometer was used to analyze the absorbance of ciprofloxacin at a wavelength of 270 nm. An absorbance reading was taken initially and then every minute for the duration of the experiment. The absorbance was correlated to ciprofloxacin concentration in order to determine catalytic effect of zeolites on the rate of ciprofloxacin degradation.
The experiment was conducted for Zeolite 13X, hydrophobic Zeolite Y and Mordenite.
3.6 Demonstrating the ability of Zeolite 13X, hydrophobic Zeolite Y and Mordenite to adsorb ciprofloxacin 3.6.1 The effect of pH on the ability of zeolites to adsorb ciprofloxacin A stock solution of known concentration was used to prepare 30 mL samples in separate vials. A known mass of zeolite was added to each vial and the pH was adjusted according to sample specifications. The spectrophotometer was zeroed for 60 uL of sodium thiosulfate and water at a wavelength of 270 nm. See Table 1 below for specific trial conditions.

15
pH 11 pH 7 pH 4
Zeolite 13X 100 g 200 g 100 g 200 g 100 g 200 g Zeolite Y 100 g 200 g 100 g 200 g 100 g 200 g Mordenite 100 g 200 g 100 g 200 g 100 g 200 g
Table 1: Sample specifications for 24 hour adsorbance trials at varying pH
In order to vary the pH of the samples, NaOH or HCl was added in known quantities. The volume change was used to calculate the new initial concentration for each sample. The samples were then mixed for 24 hours. 1.0 mL samples were extracted from the vials and filtered using 13 mm, 0.22 um PVDF sterile syringe filters in order to remove zeolites. The filtered samples were added to Varian quartz cuvettes. 60 uL of sodium thiosulfate was added to each sample. To calculate the initial mass of ciprofloxacin in the solution, the initial concentration was multiplied by the sample volume. The new absorbance was used to determine the correlating sample concentration after 24 hours. This concentration was multiplied by the sample volume to calculate the mass of ciprofloxacin remaining in the solution. The difference between the original mass of ciprofloxacin and the mass remaining was considered to be adsorbed in the pores of the zeolite.
3.6.2 Zeolite adsorption capacity The spectrophotometer was zeroed for 60 uL of sodium thiosulfate and water at a wavelength of 270 nm. A stock solution of known concentration was used to prepare samples of varying volume. This concentration was multiplied by the sample volume to calculate the mass of ciprofloxacin in the solution. The initial mass of ciprofloxacin was varied from approximately 1 mg to 20 mg. In each sample, 100 mg of zeolite was added and the pH was adjusted to 7. The concentration of the sample was multiplied by the sample volume to calculate the initial mass of ciprofloxacin in the solution. The samples were mixed for 24 hours. 1.0 mL was extracted from each sample and filtered using 13 mm, 0.22 um PVDF sterile syringe filters in order to remove zeolites. The filtered samples were added to Varian quartz cuvettes. 60 uL of sodium thiosulfate was added to each sample. The new absorbance was used to determine the correlating sample concentration after 24 hours. The difference between the original mass of ciprofloxacin and the mass remaining was considered to be adsorbed in the pores of the zeolite.
3.7 Regeneration of zeolites by raising the pH The spectrophotometer was zeroed for 60 uL of sodium thiosulfate and water at a wavelength of 270 nm. A stock solution of known concentration was used to prepare samples 30 mL samples. In each sample, 100 mg of zeolite was added and the pH was adjusted to 4. The concentration of the sample was multiplied by the sample volume to calculate the initial mass of ciprofloxacin in the solution. The samples were mixed for 24 hours. 1.0 mL was extracted from each sample and filtered using 13 mm,
16
0.22 um PVDF sterile syringe filters in order to remove zeolites. The filtered samples were added to Varian quartz cuvettes. 60 uL of sodium thiosulfate was added to each sample. The new absorbance was used to determine the correlating sample concentration after 24 hours. This concentration was multiplied by the sample volume to calculate the mass of ciprofloxacin remaining in the solution. The difference between the original mass of ciprofloxacin and the mass remaining was considered to be adsorbed in the pores of the zeolite. In order to regenerate the zeolite, the pH of each sample was then adjusted to pH 11. The samples were mixed for an additional 24 hours. 1.0 mL was extracted from each sample and filtered using 13 mm, 0.22 um PVDF sterile syringe filters in order to remove zeolites. The filtered samples were added to Varian quartz cuvettes. 60uL of sodium thiosulfate was added to each sample. The new absorbance was used to determine the correlating sample concentration after 24 hours. This concentration was multiplied by the sample volume to calculate the mass of ciprofloxacin remaining in the solution. The difference between the original mass of ciprofloxacin and the mass remaining was considered to be adsorbed in the pores of the zeolite. The amount of ciprofloxacin adsorbed at pH 4 was compared to the amount adsorbed at pH 11. These values were compared against a control sample that was prepared originally at pH 11 and was not altered.
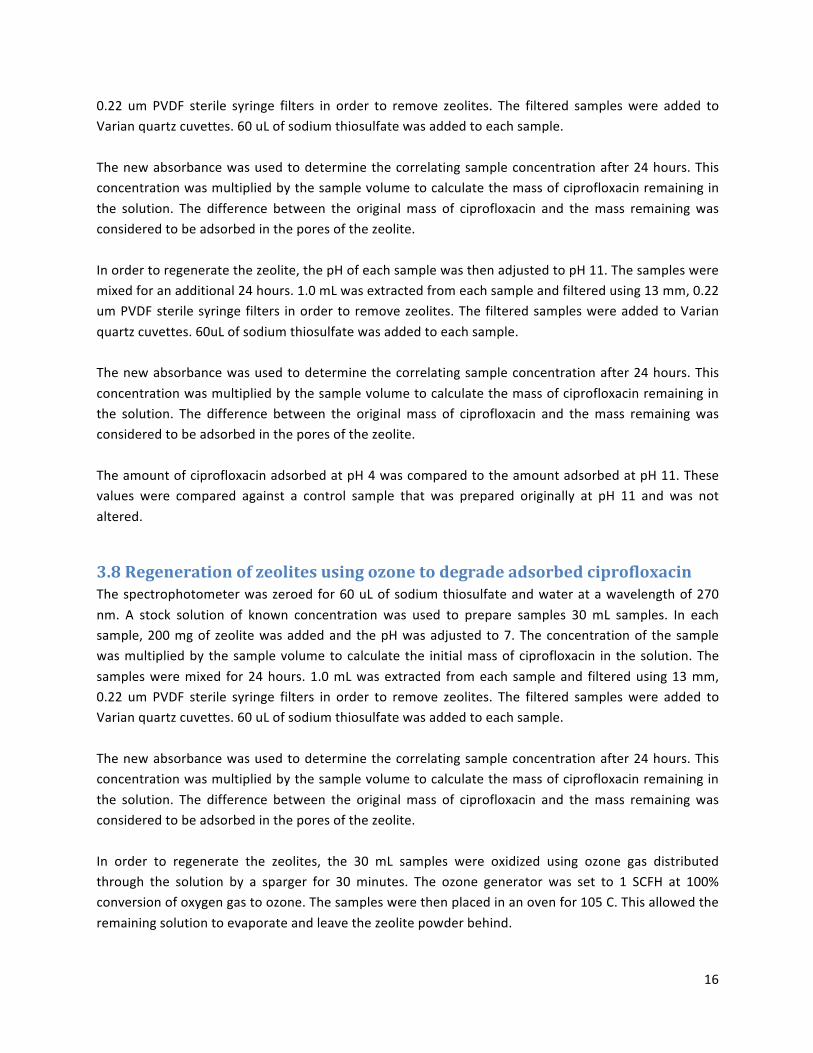
3.8 Regeneration of zeolites using ozone to degrade adsorbed ciprofloxacin The spectrophotometer was zeroed for 60 uL of sodium thiosulfate and water at a wavelength of 270 nm. A stock solution of known concentration was used to prepare samples 30 mL samples. In each sample, 200 mg of zeolite was added and the pH was adjusted to 7. The concentration of the sample was multiplied by the sample volume to calculate the initial mass of ciprofloxacin in the solution. The samples were mixed for 24 hours. 1.0 mL was extracted from each sample and filtered using 13 mm, 0.22 um PVDF sterile syringe filters in order to remove zeolites. The filtered samples were added to Varian quartz cuvettes. 60 uL of sodium thiosulfate was added to each sample. The new absorbance was used to determine the correlating sample concentration after 24 hours. This concentration was multiplied by the sample volume to calculate the mass of ciprofloxacin remaining in the solution. The difference between the original mass of ciprofloxacin and the mass remaining was considered to be adsorbed in the pores of the zeolite. In order to regenerate the zeolites, the 30 mL samples were oxidized using ozone gas distributed through the solution by a sparger for 30 minutes. The ozone generator was set to 1 SCFH at 100% conversion of oxygen gas to ozone. The samples were then placed in an oven for 105 C. This allowed the remaining solution to evaporate and leave the zeolite powder behind.

17
30 mL of the stock solution was added to the regenerated zeolites. The samples were adjusted to pH 7. The concentration of the sample was multiplied by the sample volume to calculate the initial mass of ciprofloxacin in the solution. The samples were mixed for 24 hours. 1.0 mL was extracted from each sample and filtered using 13 mm, 0.22 um PVDF sterile syringe filters in order to remove zeolites. The filtered samples were added to Varian quartz cuvettes. 60 uL of sodium thiosulfate was added to each sample. The new absorbance was used to determine the correlating sample concentration after 24 hours. This concentration was multiplied by the sample volume to calculate the mass of ciprofloxacin remaining in the solution. The difference between the original mass of ciprofloxacin and the mass remaining was considered to be adsorbed in the pores of the zeolite. To determine the regeneration ability of oxidation using ozone on the zeolites, the adsorption of the original sample was compared to the adsorption of the regenerated zeolites. This experiment was then repeated using an initial sample volume of 500 mL of a known concentration of ciprofloxacin solution to allow for a larger initial mass of ciprofloxacin. To account for the larger volume, the samples were oxidized for 1 hour instead of 30 minutes.

18
Chapter 4: Results and Discussion
4.1 Removal of ozone from solution Ozone, the oxidizing reagent for upcoming experiments, interferes with the absorbance readings of ciprofloxacin because ozone adsorbs UV light at 254 nm. Experiments were conducted to determine the optimal way of removing ozone from the samples. It was determined that taking a sample and waiting for the ozone to escape into the air was not a feasible option. According to the results in Figure 9 below, the time it takes for ozone to naturally separate out of the water is too lengthy.
Figure 9: Absorbance reading at 254nm over time of a solution of deionized water saturated with gaseous ozone
4.1.1 Identifying a suitable quenching reagent The purpose of this experiment was to determine a suitable reagent to quench ozone out of each sample instantaneously so that the sample did not continue to react prior to analysis in the spectrophotometer. We therefore tested several reagents known for their ability to quench ozone from solution to find one that suitably quenched the remaining ozone in each sample.
Acetone did not adequately reduce the ozone concentration and sodium bisulfite required too large of a volume to quench the ozone; this added volume altered the concentration of ciprofloxacin. Sodium thiosulfate was chosen to be the quenching reagent as 60 microliters of the reagent effectively quenched ozone without significantly altering the sample volume.
4.2 Creating the standard curve for ciprofloxacin at 270 nm In order to relate absorbance readings from the spectrophotometer, known concentrations of ciprofloxacin were measured. The absorbance wavelength for analysis was chosen to be 270 nm because previous research indicated that this is the wavelength for identifying ciprofloxacin in solution. The standard curve shown below in Figure 10 reflects the addition of 60 microliters of sodium thiosulfate in each sample.
0
0.1
0.2
0.3
0.4
0.5
0.6
0.7
0 10 20 30 40 50 60 70
Absorban
ce Reading at 2
54nm
Time (Minutes)

19
Figure 10: Standard curve for the absorbance reading at 270 nm on the UV spectrophotometer for ciprofloxacin at varying concentrations with the addition of 60uL sodium thiosulfate
4.3 Demonstrating the effectiveness of ozone as an oxidizing agent in the degradation reaction of ciprofloxacin
4.3.1 Continuous ozone flow system It was determined that the oxidation of ciprofloxacin using ozone was occurring in under a minute when the experiment was conducted using 500 mL of a 20 mg/L ciprofloxacin solution. The results of trial 1 are shown below in Figure 11. In this trial the ozone generator was set to produce a flow rate of 1 standard cubic foot per hour (SCFH) at 100% conversion of oxygen gas to ozone.
Figure 11: The concentration of ciprofloxacin versus time as it decomposes due to the oxidation via ozone
y = 0.0761x
0
0.5
1
1.5
2
2.5
3
3.5
0 5 10 15 20 25 30 35 40 45
Absorban
ce Reading
Known Concentracon of Ciprofloxacin (mg/L)
0
5
10
15
20
25
0 1 2 3 4 5 6 7 CIP Co
ncen
trac
on (m
g/L)
Time (Minutes)

20
It was hypothesized that 100% ozone conversion produced an abundant amount of ozone, far exceeding the amount needed to oxidize the small sample. Therefore, in trial 2 the oxygen to ozone conversion was lowered to 2% to decrease the flow rate of ozone. In this trial the ozone generator remained at a flow rate of 1 SCFH. However, as Figure 12, below, indicates the ciprofloxacin was still rapidly degraded.
Figure 12: The concentration of ciprofloxacin versus time as it decomposes due to the oxidation via ozone
It is evident from these two trials that the reaction of ciprofloxacin decomposition via oxidation using ozone is an extremely fast reaction.
4.3.2 Batch ozone system The results of trial 2 indicated that the lowest obtainable flow rate of ozone in this process was inadequate to slow the reaction to a measureable rate. In an effort to further reduce the amount of ozone in the system, batch experiments were conducted. In these experiments, ozone was bubbled through water until the solution was saturated. Small volumes of the solution were added to samples of ciprofloxacin. Table 2 below depicts the results of these experiments.
Trial 1 Trial 2 Initial Concentration 87.5 mg/L 87.5 mg/L Initial Solution Volume 0.24 L 0.01 L Added Volume of Saturated Ozone 0.76 L 0.09 L
Expected Concentration with Added Volume 8.75 mg/L 21.0 mg/L
Observed Sample Concentration 0.102 mg/L 0.045 mg/L
Table 2: Effectiveness of oxidation by ozone in a batch system to degrade ciprofloxacin in solution
It is evident that the ozone was highly effective in degrading the ciprofloxacin because the observed concentration was significantly lower than the expected solution concentration.
4.4 Demonstrating the mass transfer limitations of ozone gas into water It was determined that doubling the starting concentration of ciprofloxacin and increasing the starting volume of the solution to 1000 mL effectively slowed the reaction between ciprofloxacin and ozone
0
5
10
15
20
0 1 2 3 CIP Co
ncen
trac
on (m
g/L)
Minutes

21
enough to obtain a curve depicting the degradation of ciprofloxacin over time. In this trial, the ozone generator was run at the 1 SCFH and 50% conversion of oxygen to ozone. It is evident from Figure 13, shown below, that increasing the volume of the solution was effective in slowing the reaction between ciprofloxacin and ozone.
Figure 13: Ozonation of a 1000 mL solution of ciprofloxacin with a starting concentration of 42 mg/L
4.5 Catalytic effect of zeolites It was hypothesized that in the previous experiment, the reaction rate was limited by the flow rate of ozone into the system. The degradation of ciprofloxacin occurred at a near constant rate, consistent with the near constant inlet flow rate of ozone. Figure 14 below, illustrates the degradation of ciprofloxacin over time with and without zeolites added as potential catalysts. The control experiment is the original data from Figure 13. In the experiments with Zeolite Y, Zeolite 13X and Mordenite, the ozone generator was run at the 1 SCFH and 50% conversion of oxygen to ozone. These conditions were the same as used in the control experiment.
0 5
10 15 20 25 30 35 40 45
0 5 10 15 20 25 30
Ciprofl
oxacin Con
centraco
n (m
g/L)
Time (Minutes)

22
Figure 14: The ozonation of a 1000 mL solution of ciprofloxacin with a starting concentration of 42 mg/L with the addition of 100 mg of different zeolites
As the plot above indicates, the zeolites did not appear to have a catalytic effect on the degradation reaction of ciprofloxacin. It is possible that the zeolites do not exhibit a catalytic effect on the reaction. It is also possible that the homogeneous reaction of ciprofloxacin and ozone in solution occurs so quickly that a catalyst is unnecessary, and the effect of such catalysis cannot be measured.
4.6 Demonstrating the ability of Zeolite 13X, Zeolite Y and Mordenite to adsorb ciprofloxacin
4.6.1 The effect of pH on the ability of zeolites to adsorb ciprofloxacin This study was conducted to determine the optimal pH for ciprofloxacin adsorption. The starting concentration of the solution was 15 mg/L and each sample was 30mL. The initial mass of ciprofloxacin for each sample was approximately 0.49 mg. The results of this study are shown below in Figure 15.
10
15
20
25
30
35
40
45
50
0 2 4 6 8 10 12 14
Ciprofl
oxacin Con
centraco
n (m
g/L)
Time (Minutes)
Control
Zeolite 13X
Mordenite
Zeolite Y

23
Figure 15: Percentage of the ciprofloxacin adsorbed out of solution in 24 hours by Zeolite 13X, Mordenite and Zeolite Y at varying pH
It is evident from this study that pH 4 and pH 7 are more suitable pH levels for ciprofloxacin adsorption. This study also indicated that Zeolite Y and Mordenite were more effective at adsorbing ciprofloxacin than Zeolite 13X. The zeolites showed to adsorb between 90-‐100% of the available 0.49 mg of ciprofloxacin in the sample. It was hypothesized that because the different amounts of zeolites were able to adsorb the majority of the ciprofloxacin, they had not reached their adsorption capacities.
0
10
20
30
40
50
60
70
80
90
100
13X -‐ 100mg 13X -‐ 200mg Mordenite -‐ 100mg
Mordenite -‐ 200mg
Y -‐ 100mg Y -‐ 200mg
Percen
tage of C
iproflo
xacin Ad
sorbed
Zeolite Idencficacon
pH 11
pH 7
pH 4

24
4.6.2 Zeolite adsorption capacity The initial mass of ciprofloxacin was varied in order to determine the adsorption capacity of 100 mg of Zeolite Y. The results are shown below in Table 3.
100 mg Zeolite Y Initial Mass of Ciprofloxacin (mg) Mass of Ciprofloxacin Adsorbed (mg)
1.17 1.15 2.93 2.86 5.85 2.71 11.71 2.50 15.61 2.47 19.51 2.50 AVG: 2.61
Table 3: Mass of ciprofloxacin adsorbed by 100 mg of Zeolite Y at varying initial masses of ciprofloxacin
The average mass of ciprofloxacin adsorbed for Zeolite Y was calculated excluding the data point with an initial mass of 1.17. This point was excluded because the remainder of the data points show an increase in adsorption ability and it was concluded that at 1.17mg starting mass, the zeolite was able to adsorb nearly 100% of the ciprofloxacin.
The initial mass of ciprofloxacin was varied in order to determine the adsorption capacity of 100 mg of Zeolite 13X. The results are shown below in Table 4.
100 mg Zeolite 13X Initial Mass of Ciprofloxacin (mg) Mass of Ciprofloxacin Adsorbed (mg)
1.31 0.44 3.22 0.73 6.43 0.94 12.87 1.63 17.15 2.75 21.44 1.20 AVG: 1.28
Table 4: Mass of ciprofloxacin adsorbed by 100 mg of Zeolite 13X at varying initial masses of ciprofloxacin
The initial mass of ciprofloxacin was varied in order to determine the adsorption capacity of 100 mg of Mordenite. The results are shown below in Table 5.
25
100 mg Mordenite Initial Mass of Ciprofloxacin (mg) Mass of Ciprofloxacin Adsorbed (mg)
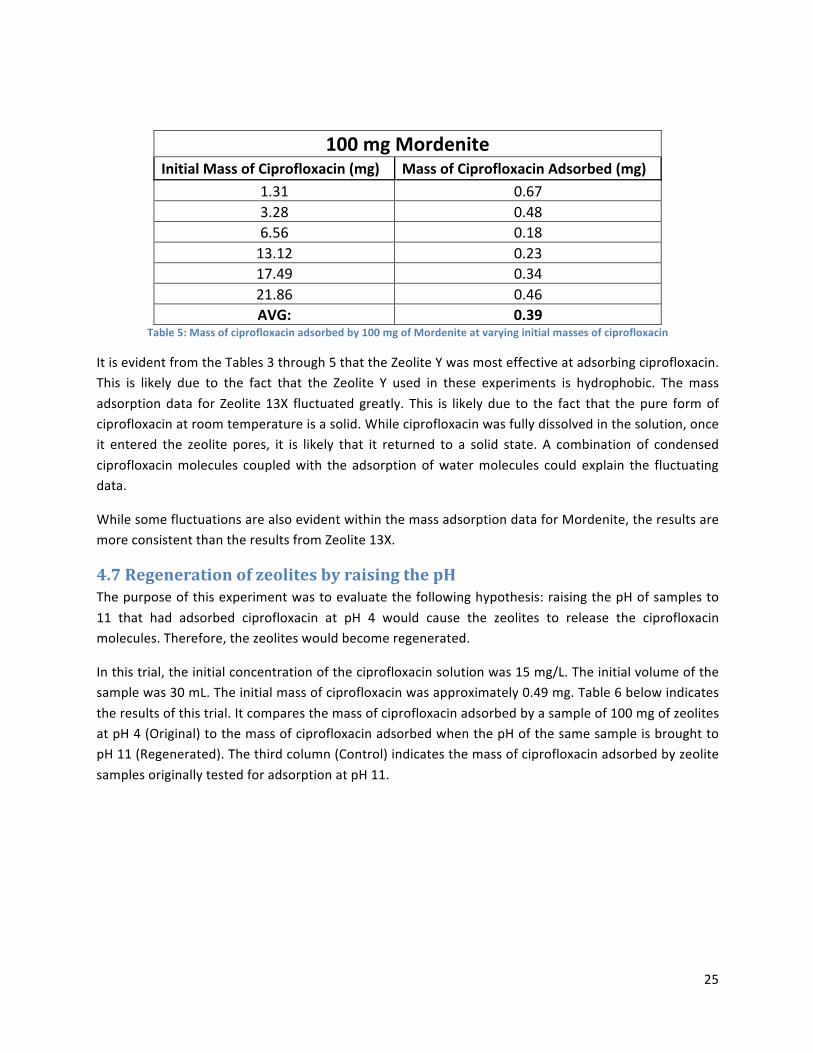
1.31 0.67 3.28 0.48 6.56 0.18 13.12 0.23 17.49 0.34 21.86 0.46 AVG: 0.39
Table 5: Mass of ciprofloxacin adsorbed by 100 mg of Mordenite at varying initial masses of ciprofloxacin
It is evident from the Tables 3 through 5 that the Zeolite Y was most effective at adsorbing ciprofloxacin. This is likely due to the fact that the Zeolite Y used in these experiments is hydrophobic. The mass adsorption data for Zeolite 13X fluctuated greatly. This is likely due to the fact that the pure form of ciprofloxacin at room temperature is a solid. While ciprofloxacin was fully dissolved in the solution, once it entered the zeolite pores, it is likely that it returned to a solid state. A combination of condensed ciprofloxacin molecules coupled with the adsorption of water molecules could explain the fluctuating data.
While some fluctuations are also evident within the mass adsorption data for Mordenite, the results are more consistent than the results from Zeolite 13X.
4.7 Regeneration of zeolites by raising the pH The purpose of this experiment was to evaluate the following hypothesis: raising the pH of samples to 11 that had adsorbed ciprofloxacin at pH 4 would cause the zeolites to release the ciprofloxacin molecules. Therefore, the zeolites would become regenerated.
In this trial, the initial concentration of the ciprofloxacin solution was 15 mg/L. The initial volume of the sample was 30 mL. The initial mass of ciprofloxacin was approximately 0.49 mg. Table 6 below indicates the results of this trial. It compares the mass of ciprofloxacin adsorbed by a sample of 100 mg of zeolites at pH 4 (Original) to the mass of ciprofloxacin adsorbed when the pH of the same sample is brought to pH 11 (Regenerated). The third column (Control) indicates the mass of ciprofloxacin adsorbed by zeolite samples originally tested for adsorption at pH 11.

26
Mass of Ciprofloxacin (mg) Adsorbed
Zeolite (100mg) Original Regenerated Control
pH 4 pH 11 pH 11
Zeolite 13X 0.472 0.081 0.014 Zeolite Y 0.486 0.354 0.167 Mordenite 0.457 0.026 0.272
Table 6: Comparison of ciprofloxacin adsorption in zeolites regenerated using pH adjustments to the ciprofloxacin adsorption of zeolites in a control sample
The results of the experiments studying the effect of pH on the ability of zeolites to adsorb ciprofloxacin indicated that pH 11 was an unsuitable pH for adsorption. These results are detailed above in Figure 15.
While the adjusted Zeolite 13X sample released 82% of the ciprofloxacin in its pore, it retained approximately 5 times the mass of ciprofloxacin adsorbed in the control experiment. This illustrates that raising the pH of a Zeolite 13X solution is an ineffective method of zeolite regeneration. It is likely that the retention of a higher quantity of ciprofloxacin than expected is due to the bond of ciprofloxacin molecules to the zeolite and the presence of a condensed solid form of ciprofloxacin.
The adjusted Zeolite Y sample released 29% of the ciprofloxacin in its pore, retaining approximately 3 times the mass of ciprofloxacin adsorbed in the control experiment. This illustrates that raising the pH of a Zeolite Y solution is an ineffective method of zeolite regeneration. Due to the hydrophobic nature of Zeolite Y, it is likely that once the ciprofloxacin was adsorbed into the zeolite pores, Zeolite Y was unwilling to release the molecule. It is also likely that ciprofloxacin formed a condensed solid within the pores of the zeolite and was unwilling to return to liquid solution.
The adjusted Zeolite Y sample released 94% of the ciprofloxacin in its pore, retaining approximately 10 times less than the mass of ciprofloxacin adsorbed in the control experiment. This illustrates that raising the pH of a Mordenite solution is very effective in removing ciprofloxacin from the zeolite pores. It is possible that this occurred because Mordenite is hydrophilic and was readily willing to release ciprofloxacin molecules into water molecules.
4.8 Regeneration of zeolites using ozone to degrade adsorbed ciprofloxacin
4.8.1 Trial 1 The purpose of these experiments was to assess the ability of ozone to degrade the ciprofloxacin within the zeolite pores. In this trial, the initial concentration of the ciprofloxacin solution was 15 mg/L. The initial volume of the sample was 30 mL. The initial mass of ciprofloxacin was approximately 0.48 mg. Table 7 below compares the mass of ciprofloxacin adsorbed by each zeolite sample in its original state with the same zeolite sample after it was exposed to ozone for a period of 30 minutes.

27
Mass of Ciprofloxacin Adsorbed (mg) Zeolite Original Regenerated
13X -‐ 100mg 0.48 0.48 13X -‐ 200mg 0.48 0.48 Y -‐ 100mg 0.48 0.48 Y -‐ 200mg 0.48 0.48
Mord -‐ 100mg 0.48 0.48 Mord -‐ 200mg 0.48 0.48
Table 7: The original mass of ciprofloxacin adsorbed by zeolites compared to the mass of ciprofloxacin adsorbed after regeneration by ozone oxidation
The results indicate that each zeolite sample was able to adsorb 0.48 mg of ciprofloxacin initially and after regeneration. As the initial mass of ciprofloxacin was 0.48 mg, it is possible that the pores of the zeolites were under-‐saturated in this trial. This could allow the zeolites to adsorb additional amounts of ciprofloxacin without having released the ciprofloxacin adsorbed originally.
4.8.2 Trial 2 To test this hypothesis, the experiment was conducted again at a higher initial mass of ciprofloxacin, 20 mg. This mass was chosen as it greatly exceeded the observed adsorption ability of any of the zeolites. This experiment excluded Zeolite 13X as the adsorption data from 13X fluctuated greatly in the adsorption capability trials and it was concluded that it would be unlikely to produce useful results. Table 8 below compares the mass of ciprofloxacin adsorbed by each 200 mg zeolite sample in its original state with the same zeolite sample after it was exposed to ozone for a period of 1 hour. The original adsorptions of ciprofloxacin by Zeolite Y and Mordenite in this trial are consistent with the results of the adsorption capability trials.
Mass of Ciprofloxacin Adsorbed (mg) Zeolite (200mg) Original Regenerated
Zeolite Y – Sample 1 4.40 1.79 Zeolite Y – Sample 2 4.09 1.76
Mordenite – Sample 1 1.34 -‐0.41 Mordenite – Sample 2 0.92 0.72
Table 8: The original mass of ciprofloxacin adsorbed by zeolites compared to the mass of ciprofloxacin adsorbed after regeneration by ozone oxidation
As the above results illustrate, the oxidation process was unsuccessful in completely regenerating the zeolites. It is probable that the oxidation process was able to break down the ciprofloxacin; however the by-‐products of degradation remained in the pores. It is likely that the by-‐products had a lower boiling point than ciprofloxacin (581 C) and may be able to be calcined from the zeolite pores more easily than ciprofloxacin.

28
Chapter 5: Conclusions and Recommendations Degrading ciprofloxacin from the effluent streams of waste water treatment plants is important both to uphold progressively stringent environmental regulations and to reduce the risk of generating drug-‐resistant bacteria due to the bioaccumulation of the drug. Therefore, this project explored options for the degradation of ciprofloxacin from water.
This project indicated that ozone is not only effective in degrading ciprofloxacin, but that the oxidation reaction occurs almost instantaneously. However, in waste water treatment plants that utilize oxidation, the available ozone is insufficient to effectively oxidize ciprofloxacin. This is due to the large volumes of the treatment tanks and the inability to efficiently create a homogenous solution of dissolved ozone. This project illustrated the mass transfer limitations of dissolving gaseous ozone into a homogenous solution where it is able to oxidize ciprofloxacin.
The use of zeolites to adsorb ciprofloxacin from solution was explored as an alternative method for waste water purification. It was demonstrated that Zeolite 13X, Zeolite Y and Mordenite all exhibit an affinity for adsorbing ciprofloxacin. The optimal pH range was found to be from 4 to 7, and a basic pH was demonstrated to be unfavorable. It was determined that Zeolite Y possessed the highest adsorption capacity.
Leaving ciprofloxacin in zeolites is not feasible, as the ciprofloxacin will eventually leach out in the landfills. Zeolites are also costly and will be more affordable if they are regenerated and re-‐used. In order to optimize the adsorption procedure, the regeneration of zeolites was studied. It was determined that oxidation of the zeolite samples using ozone was not effective in regenerating the zeolites to their original adsorption capacities. However, the oxidation process was able to release a percentage of the ciprofloxacin from the zeolite pores.
Due to the limitations of available equipment, the adsorption capacities of the zeolites are only estimated. The method of determining the adsorption capacities of the zeolites was based upon the concentration change of the solution rather than a direct measurement of the change in mass of the zeolites. It is recommended that thermo-‐gravimetric analyses be conducted to determine the exact amount of containment in the zeolite pores.
This project was also limited to samples sizes under 2 liters. Although the experiments produced relevant data, it is only an assumption that these results can be used to scale up to industrial size. Further analysis should be conducted to ensure the properties of the zeolites remain consistent. This would guarantee that the increased volume does not exceed an unknown limitation of zeolite adsorption capacity.
It is also possible that other zeolites many have higher adsorption capacities for ciprofloxacin than Zeolite Y. It is recommended that all possibilities be explored prior to implementation in an industrial setting.
Overall, the adsorption of ciprofloxacin into zeolite pores was demonstrated to be an effective method for the removal of ciprofloxacin from water. In addition, the oxidation of ciprofloxacin using ozone was

29
also shown to be extremely effective. This project demonstrated that the oxidation reaction with ozone on zeolites with adsorbed ciprofloxacin molecules was moderately effective. It is likely that the ciprofloxacin was oxidized and the byproducts of the degradation remained lodged in the pores. It is recommended that future researchers calcine the ozonated zeolites to remove the by-‐products of degradation. This method could be used to achieve complete regeneration.
30
Bibliography Ahmad, A., Bhandari, A., Henry, A., Marchin, G. L., Nagulapally, S. R., & Zurek, L. (2008). Occurence of Ciprofloxacin-‐Trimethoprim-‐Sulfamethaxozole-‐,and Vancomycin-‐Resistant Bacteria in Municipal Wastewater Treatment Plant. Water Environment Research , 82-‐90.
Araujo, A., Fachini, A., Matos, C., Montenegro, M., Pena, A., & Santos, L. (2010). Ecotoxicological aspects related to the presence of pharmaceuticals in the aquatic environment. Journal of Hazardous Materials , 45-‐95.
Avisar, D., Lester, Y., & Mamane, H. (2010). pH induced polychromatic UV treatment for the removal of a mixture of SMX, OTC and CIP from water. Journal of Hazardous Materials , 1068-‐1074.
Barber, L., Buxton, H., Furlong, E., Kolpin, D., Meyer, M., Thurman, T. M., et al. (2002). Pharmaceuticals, Hormones, and Other Organis Wastewater Contaminants in US Streams, 1990-‐2000: A National Reconnaissance. Environment Science Technology , 1202-‐1211.
Bell, R. (2011, May). What are Zeolites. Retrieved from bza.org: http://www.bza.org/zeolites.html
Bhandari, A., Close, L. I., Hunter, R. P., Kim, W., Koch, D. E., & Surampalli, R. Y. (2008). Occurrence of Ciprofloxacin, Sulfamethoxazole, and Azithromycin in Municipal Wastewater Treatment Plants. Practice Periodical of Hazardous, Toxic, and Radioactive Waste Management , 275-‐281.
Buhner, S. H. (2002). The Environmental Impacts of Technological Medicine. In The Lost Language of Plants.
Cejka, J., & Wichterlova, B. (2007). Acid-‐Catalyzed Synthesis of Mono and Dialkyl Benzenes over Zeolites: Active Sites, Zeolite Topology, and Reaction Mechanisms. Prague: Academy of Sciences of the Czech Republic.
Chee-‐Sanford, J., Mackie, R., Koike, S., Krapac, I., Lin, Y.-‐F., Yannarell, A., et al. (2009). Fate and transport of antiobiotic residues and antibiotic resistant genes following land application of manure waste. Enviornmental Quality , 1086-‐1108.
Christensen, F. (1998). Pharmaceuticals in the Envirnoment-‐ A Human Risk? Regulatory Toxicology and Pharmacology , 212-‐221.
Coronas, J., Piera, E., & Salomoan, M. (1998). Synthesis, characterization and separation properties of a composite mordenite/ZSM-‐5/chabazite hydrophilic membrane. Journal of Membrane Science , 99-‐114.
Crittenden, J. C., George, T., Hand, D., Howe, K., & Trussell, R. (2005). Chemical Oxidation and Reduction. In Water Treatment: Principles and Design. John Wiley & Sons.
Currao, A. (2010). Understanding Zeolite Frameworks. University of Bern.

31
DeWitte, B., DeWulf, J., Demeestere, K., Van de Vyvere, V., De Wispelaere, P., & Van Langenhove, H. (2008). Ozonation of Ciprofloxacin in Water: HRMS Identification of Reaction Products and Pathways. Environmental Science Technology , 4889-‐4895.
Dohrn, R., Marrucho, I. M., Melo, M. J., & Varanda, F. R. (2008). Solubility of Ciprofloxacin and Moxifloxacin in Different Solvents: The Efects of the HCl Group. ENPROMER , 1-‐5.
Drlica, K., & Zhao, X. (1997). DNA Gyrase, Topoisomerase IV, and the 4-‐Quinolones. MICROBIOLOGY AND MOLECULAR BIOLOGY REVIEWS , 377-‐392.
EPA Guidance Manual. (1999). 3. Ozone. In Alternative Disinfectants and Oxidants (pp. 1-‐52). Envionmental Protection Agency.
Farcasiu, M., & Degnan, T. (1987). The Role of External Surface Activity in the Effectiveness of Zeolites. Princeton, New Jersey: Mobil Research and Development Corporation.
Fleys, M. (2003). Water behavior in hydrophobic porous materials.Comparison between Silicalite and Dealuminated zeolite Y by Molecular Dynamic Simulations. Worcester: WPI.
Fujita, H., Izumi, J., Sagehashi, M., Fujii, T., & Sakoda, A. (2003). Decomposition of trichloroethene on ozone-‐adsorbed high. Water Research , 166-‐172.
Furlong, E., Henderson, A., Meyer, M., Reissman, D., Stakelberg, P., & Zaugg, S. (2004). Persistence of pharmaceutical compounds and other organic wastewater contaminants in a conventional drinking-‐water-‐ treatment plant. Science of the Total Environment , 99-‐113.
Glassmeyer, S., Kostich, M., & Lazorchak, J. (2008). Pharmaceuticals in the Environment-‐ Exposure, Effects, and Risks to Humans and Ecosystems. National Exposure Research Laboratory.
Harder, B. (2009). Extracting Estrogens. Science News , 67-‐68.
Hoffmann, P., & Lobo, J. A. (2007). Identification of diverse silanols on protonated ZSM-‐5 zeolites by means of FTIR spectroscopy. Microporous and Mesoporous Materials , 122-‐128.
Htay, M., & Htay, M. (2012). Preparation of Zeolite (NaX,Faujasite) from Pure Silica and Alumina Sources. Singapore: International Conference on Chemical Processes and Environmental issues.
Huling, S. G., & Pivetz, B. E. (2006). In-‐Situ Chemical Oxidation. Ada: U.S. Environmental Protection Agency.
Hunger, M., Paulus, M., Stelzer, J., & Weitkamp, J. (1998). Hydrophobic properties of all-‐silica zeolite beta. Microporous and Mesoporous Materials , 1-‐8.
Ivanov, D. P., & Sobolev, V. I. (2002). Deactivation by coking and regeneration of zeolite. Boreskov Institute of Catalysis , 113-‐121.

32
Jong-‐Hwa Kim. (2003). Adsorption Equilibria of Water Vapor on Alumina, Zeolite 13X, and. J. Chem. Eng. Data , 137-‐141.
Kreisberg, J. (2007). Greener Pharmacy-‐ Proper Medicine Disposal Protects the Environment. Integrative Medicine , 50-‐52.
Kurthz, M., & Momani, B. (2010). Removal of Estrogens from Water. Worcester: WPI.
Mallada, R., & Menendez, M. (2008). Inorganic Membranes: Synthesis, Characterization and Applications.
McConnell, W., Moody, M., & Woodard, S. (2010). Full-‐scale BioMag demonstration at the mystic WPCF and establishing the basis-‐of-‐design for a permanent installation. Cambridge: Cambridge Water Tecnology.
P. Monneyron, S. M. (2003). Regeneration of High Silica Zeolites. Institution of Chemical Engineers , 1193-‐1198.
Peskov, M. (2007). Zeolites. Retrieved from ASDN: http://www.asdn.net/asdn/chemistry/zeolites.shtml
Pic, J. R. (2007). Adsorption of Nitrobenzene from Water onto High Silica Zeolites and Regeneration by Ozone. Separation Science and Technology , 1447-‐1463.
Price, G. L. (2000). TU Chemical Engineering Zeolite Page. Retrieved 09 10, 2012, from Zeolite A: http://www.personal.utulsa.edu/~geoffrey-‐price/zeolite/lta.htm
Ritter, S. K. (2012, May 14). Hydrophobic zeolites for biofuel upgrading reactions at the liquid-‐liquid interface in water/oil emulsions. Retrieved February 10, 2013, from The University of Oklahoma: http://www.ou.edu/catalysis/hydrophobiczeolites.htm
Roma, M., Weller, M., & Wentzell, S. (2011). Removal of Ciprofloxacin from Water using Adsorption, UV Photolysis and UV/H2O2 Degradation. Worcester: WPI.
Roma, M., Weller, M., & Wentzell, S. (2011). Removal of Ciprofloxacin from Water using Adsorption, UV Photolysis and UV/H2O2 Degradation. Worcester: WPI.
Structure Commission of the International Zeolite Association . (2007). Database of Zeolite Structures. Retrieved from International Zeolite Association: http://izasc.ethz.ch/fmi/xsl/IZA-‐SC/ftc_main_image.xsl?-‐db=Atlas_main&-‐lay=fw&STC=FAU&-‐find
Wahab, N. M. (2009). Antibiotic Purificiation by Using Zeolites Adsorbent. Universiti Malaysia Pahang.
Washington State University. (n.d.). Life Down the Drain-‐ Pharmaceuticals and Personal Care Products in the Environment. Retrieved from Campus and Community Ecology: https://dl-‐web.dropbox.com/get/CIP%20removal%20from%20Water/Research/Contaminants%20in%20Water/Life%20Down%20the%20Drain.pdf?w=37a8ef9b

33
Weitkamp, J. (1998). Zeolites and Catalysis. Struttgart, Germany: Defense Technical Information Center.
Wilkinson, A. P. (2012). Zeolitic Materials: Ion Exchange. Atlanta, GA: Zeolitic Materials: Ion Exchange.
Wollenberger, L., Halling-‐Sorensen, B., & Kusk, K. (2000). Acute and chronic toxicity of veterinary antibiotics to Daphnia magna. Chemosphere , 723-‐730.
Xu, Y., & Langford, C. H. (1997). Photoactivity of Titanium Dioxide Supported on MCM41, Zeolite X, and Zeolite Y. J. Phys. Chem , 3115-‐3121.
Zeochem. (2011, 06 16). Zeochem. Retrieved 09 10, 2012, from Zeolite Modernite: http://www.zeochem.com/en/products/high_silica_zeolites/zeolite_mordenite.htm

34
Appendices
A.1 Creating the standard curve for ciprofloxacin at 270 nm Ciprofloxacin Concentration
(mg/L) Absorbance (270nm)
47.25 3.29 43.75 3.23 40.25 3.07 38.50 2.99 36.75 2.97 33.25 2.75 31.50 2.60 29.75 2.56 26.25 2.16 22.75 1.91 20.13 1.64 17.50 1.40 14.00 1.13 12.25 0.89 10.50 0.81 9.63 0.73 8.75 0.68 7.00 0.55 5.25 0.40 3.50 0.26 1.75 0.12 0.88 0.06 0.44 0.03

35
A.2 Demonstrating the effectiveness of ozone as an oxidizing agent in the degradation reaction of ciprofloxacin In the following experiment, a 1000 mL ciprofloxacin solution was used. The starting concentration of ciprofloxacin was 43.75 mg/L. The ozone generator was set to run at 5 SCFH at 100% conversion of oxygen gas to ozone.
Time (Minutes) Absorbance (270 nm) Ciprofloxacin Concentration (mg/L) 0 3.13 41.14 1 2.98 39.11 2 2.79 36.69 3 2.62 34.41 4 2.46 32.28 5 2.25 29.51 6 2.09 27.43 7 1.84 24.18 8 1.70 22.29 9 1.54 20.20 10 1.37 17.97 11 1.22 15.97 12 1.08 14.16 13 0.95 12.54 14 0.87 11.37 15 0.73 9.57 16 0.64 8.35 17 0.56 7.32 18 0.48 6.32 19 0.42 5.47 20 0.37 4.82 21 0.32 4.23 22 0.30 3.94 23 0.26 3.42 24 0.23 3.05 25 0.22 2.83 26 0.19 2.55 27 0.18 2.31 28 0.16 2.11 29 0.14 1.90 30 0.13 1.75 40 0.05 0.68

36
A.3 Catalytic effect of zeolites In the following experiments with Zeolite Y, Zeolite 13X and Mordenite, the ozone generator was run at the 1 SCFH and 50% conversion of oxygen to ozone. The initial ciprofloxacin concentration was approximately 42 mg/L.
Zeolite 13X Time
(Minutes) Absorbance (270 nm)
Ciprofloxacin Concentration (mg/L)
0 3.23 42.41 1 3.10 40.73 2 2.98 39.21 3 2.75 36.10 4 2.55 33.54 5 2.31 30.37 6 2.22 29.21 7 2.08 27.33 8 1.94 25.51 9 1.77 23.31 10 1.62 21.30 11 1.51 19.79 12 1.36 17.93 13 1.26 16.55 14 1.13 14.87 15 1.06 13.95
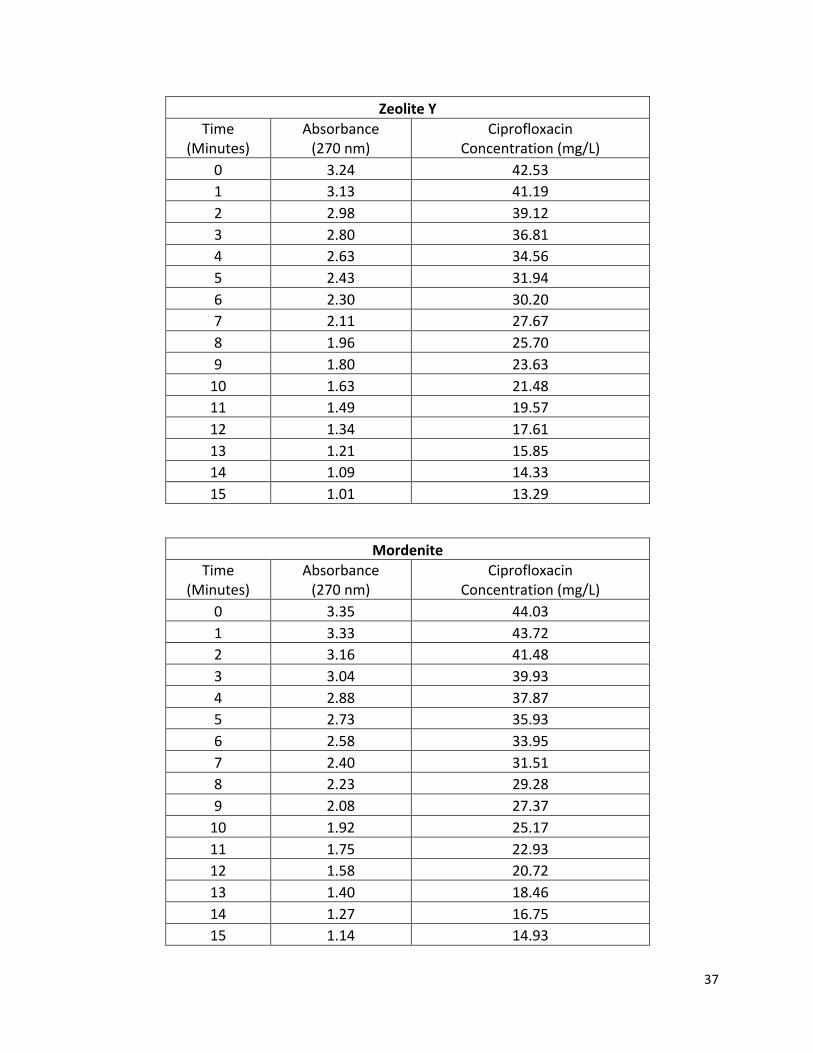
37
Zeolite Y Time
(Minutes) Absorbance (270 nm)
Ciprofloxacin Concentration (mg/L)
0 3.24 42.53 1 3.13 41.19 2 2.98 39.12 3 2.80 36.81 4 2.63 34.56 5 2.43 31.94 6 2.30 30.20 7 2.11 27.67 8 1.96 25.70 9 1.80 23.63 10 1.63 21.48 11 1.49 19.57 12 1.34 17.61 13 1.21 15.85 14 1.09 14.33 15 1.01 13.29
Mordenite Time
(Minutes) Absorbance (270 nm)
Ciprofloxacin Concentration (mg/L)
0 3.35 44.03 1 3.33 43.72 2 3.16 41.48 3 3.04 39.93 4 2.88 37.87 5 2.73 35.93 6 2.58 33.95 7 2.40 31.51 8 2.23 29.28 9 2.08 27.37 10 1.92 25.17 11 1.75 22.93 12 1.58 20.72 13 1.40 18.46 14 1.27 16.75 15 1.14 14.93

38
A.4 The effect of pH on the ability of zeolites to adsorb ciprofloxacin
pH 11Initial Mass of Zeolite (mg) 100 200 100 200 100 200Initial Volume (mL) 30.50 30.10 30.04 30.05 30.70 31.30Initial Absorbance 1.21 1.23 1.27 1.23 1.20 1.18Initial Concentration (mg/L) 15.94 16.15 16.66 16.19 15.83 15.53Initial Mass of Ciprofloxacin in Solution (mg) 0.49 0.49 0.50 0.49 0.49 0.4924 Hour Absorbance 1.25 1.23 0.58 0.58 0.79 0.9024 Hour Concentration (mg/L) 16.40 16.16 7.60 7.60 10.38 11.8924 Mass of Ciprofloxacin in Solution (mg) 0.50 0.49 0.23 0.23 0.32 0.37Percentage of Ciprofloxacin Absorbed -‐2.95 -‐0.08 54.34 53.02 34.44 23.46
Zeolite YZeolite 13 X Mordenite
pH 7Initial Mass of Zeolite (mg) 100 200 100 200 100 200Initial Volume (mL) 30.50 32.00 30.00 30.70 30.34 30.11Initial Absorbance 1.21 1.15 1.22 1.23 1.22 1.23Initial Concentration (mg/L) 15.92 15.18 16.01 16.13 16.01 16.13Initial Mass of Ciprofloxacin in Solution (mg) 0.49 0.49 0.48 0.50 0.49 0.4924 Hour Absorbance 0.27 0.08 0.02 -‐0.01 0.09 0.0024 Hour Concentration (mg/L) 3.50 0.99 0.29 -‐0.09 1.14 -‐0.0524 Mass of Ciprofloxacin in Solution (mg) 0.11 0.03 0.01 0.00 0.03 0.00Percentage of Ciprofloxacin Absorbed 77.99 93.46 98.19 100.54 92.88 100.31
Zeolite YZeolite 13 X Mordenite
pH 4Initial Mass of Zeolite (mg) 100 200 100 200 100 200Initial Volume (mL) 30.02 30.02 30.45 31.00 33.00 35.50Initial Absorbance 1.16 1.07 1.22 1.23 1.25 1.23Initial Concentration (mg/L) 15.18 14.11 16.01 16.13 16.45 16.16Initial Mass of Ciprofloxacin in Solution (mg) 0.46 0.42 0.49 0.50 0.54 0.5724 Hour Absorbance 0.29 0.08 0.00 -‐0.01 0.10 0.0124 Hour Concentration (mg/L) 3.87 1.11 0.03 -‐0.18 1.35 0.0924 Mass of Ciprofloxacin in Solution (mg) 0.12 0.03 0.00 -‐0.01 0.04 0.00Percentage of Ciprofloxacin Absorbed 74.49 92.15 99.82 101.10 91.81 99.46
Zeolite 13 X MordeniteZeolite Y

39
A.5 Zeolite adsorption capacity

40
A.6 Regeneration of zeolites by raising the pH
Zeolite 13X Y MordeniteMass of Zeolite (mg) 100 mg 100 mg 100 mg
Initial pH 4 4 4Initial Volume (mL) 30.50 30.04 30.70Initial Concentration Ciprofloxacin (mg/L) 16.60 16.60 16.60Initial Mass of Ciprofloxacin in Solution 0.50 0.50 0.5024 Hour Absorbance 0.07 0.03 0.1024 Hour Concentration of Ciprofloxacin (mg/L) 0.86 0.39 1.3524 Hour Mass of Ciprofloxacin in Solution 0.03 0.01 0.04Mass Ciprofloxacin Absorbed (mg) 0.47 0.49 0.46
Adjusted pH 11.00 11.00 11.0024 Hour Absorbance 1.05 0.36 1.2024 Hour Concentration of Ciprofloxacin (mg/L) 13.83 4.79 15.7324 Hour Mass of Ciprofloxacin in Solution 0.43 0.14 0.48Mass Ciprofloxacin Absorbed (mg) 0.07 0.35 0.01

41
A.7 Regeneration of zeolites using ozone to degrade adsorbed ciprofloxacin molecules
OriginalpH 7 Trial 1 Trial 2 Trial 1 Trial 2 Trial 1 Trial 2Mass of Zeolite (mg) 100.00 200.00 100.00 200.00 100.00 200.00Initial Volume of Solution (mL) 30.00 30.00 30.00 30.00 30.00 30.00Initial Absorbance 1.22 1.22 1.22 1.22 1.22 1.22Initial Concentration Ciprofloxacin (mg/L) 16.00 16.00 16.00 16.00 16.00 16.00Initial Mass of Ciprofloxacin in Solution (mg) 0.48 0.48 0.48 0.48 0.48 0.4824 Hour Absorbance 0.24 0.08 0.07 0.01 0.04 0.0524 Hour Concentration of Ciprofloxacin (mg/L) 0.02 0.01 0.01 0.00 0.00 0.0024 Mass of Ciprofloxacin in Solution (mg) 0.00 0.00 0.00 0.00 0.00 0.0024 Hour Mass of Ciprofloxacin Absorbed (mg) 0.48 0.48 0.48 0.48 0.48 0.48
Zeolite YZeolite 13X Mordenite
RegeneratedpH 7 Trial 1 Trial 2 Trial 1 Trial 2 Trial 1 Trial 2Mass of Zeolite (mg) 100.00 200.00 100.00 200.00 100.00 200.00Initial Volume of Solution (mL) 30.00 30.00 30.00 30.00 30.00 30.00Initial Absorbance 1.16 1.16 1.16 1.16 1.16 1.16Initial Concentration Ciprofloxacin (mg/L) 15.25 15.25 15.25 15.25 15.25 15.25Initial Mass of Ciprofloxacin in Solution (mg) 0.48 0.48 0.48 0.48 0.48 0.4824 Hour Absorbance 0.09 0.09 0.37 0.03 0.03 0.0424 Hour Concentration of Ciprofloxacin (mg/L) 0.16 0.17 0.45 0.11 0.10 0.1124 Mass of Ciprofloxacin in Solution (mg) 0.00 0.00 0.00 0.00 0.00 0.0024 Hour Mass of Ciprofloxacin Absorbed (mg) 0.48 0.48 0.48 0.48 0.48 0.48
Zeolite 13X Mordenite Zeolite Y
RegeneratedpH 7 Trial 1 Trial 2 Trial 1 Trial 2Mass of Zeolite (mg) 200.00 200.00 200.00 200.00Initial Volume of Solution (mL) 500.00 500.00 500.00 500.00Initial Absorbance 3.18 3.18 3.18 3.18Initial Concentration Ciprofloxacin (mg/L) 41.80 41.80 41.80 41.80Initial Mass of Ciprofloxacin in Solution (mg) 20.90 20.90 20.90 20.9024 Hour Absorbance 3.09 3.07 2.91 2.9124 Hour Concentration of Ciprofloxacin (mg/L) 40.54 40.36 38.22 38.2824 Mass of Ciprofloxacin in Solution 21.32 20.18 19.11 19.1424 Hour Mass of Ciprofloxacin Absorbed -‐0.41 0.72 1.79 1.76
Mordenite Zeolite Y
OriginalpH 7 Trial 1 Trial 2 Trial 1 Trial 2Mass of Zeolite (mg) 200.00 200.00 200.00 200.00Initial Volume of Solution (mL) 500.00 500.00 500.00 500.00Initial Absorbance 3.20 3.20 3.20 3.20Initial Concentration Ciprofloxacin (mg/L) 42.11 42.11 42.11 42.11Initial Mass of Ciprofloxacin in Solution (mg) 21.06 21.06 21.06 21.0624 Hour Absorbance 3.00 3.07 2.53 2.5824 Hour Concentration of Ciprofloxacin (mg/L) 39.43 40.28 33.31 33.9424 Mass of Ciprofloxacin in Solution (mg) 19.71 20.14 16.66 16.9724 Hour Mass of Ciprofloxacin Absorbed (mg) 1.34 0.92 4.40 4.09
Mordenite Zeolite Y


