Removal of carbon disulfide: Experimental and modeling results
5
Removal of carbon disulfide: Experimental and modeling results Wang Li a, * , Wang Shudong b , Yuan Quan b a Research Institute of Industrial Catalysis, East China University of Science and Technology, Shanghai 200237, China b Dalian Institute of Chemical Physics, Chinese Academy of Sciences, 457 Zhongshan Road, Dalian 116023, China article info Article history: Received 11 May 2009 Received in revised form 19 July 2009 Accepted 21 July 2009 Available online 3 August 2009 Keywords: Carbon disulfide Catalyst Deactivation Kinetic modeling abstract A mathematical model describing the rate of carbon disulfide (CS 2 ) removal has been developed. Kinetic studies were carried out in a fixed-bed reactor under atmospheric pressure and a range of temperatures (30–70 °C). The effects of flow rate, CS 2 inlet concentration, temperature and relative humidity were ana- lyzed. A kinetic model based on axial dispersion, external and internal mass-transfer resistances, as well as effects of S deposition on the inner-face of the catalyst was in agreement with the CS 2 experimental breakthrough curves. The mathematical model can be used for process design and scale-up of similar systems. Crown Copyright Ó 2009 Published by Elsevier Ltd. All rights reserved. 1. Introduction Carbon disulfide (CS 2 ) exists widely in chemical processing gases from coal, natural gas and synthesis gas. H 2 S, the hydrolysis product of CS 2 , has detrimental effect on industrial heterogeneous catalysts. Levels of sulfur as low as 1 ppm can effectively poison the activity of a modern bimetallic reforming catalyst. The pres- ence of feedstock CS 2 can also lead to increased corrosion of the reactors used in refinery processes. CS 2 has been classified as a hazardous air pollutant according to the Clean Air Act and is considered to be one of most toxic solvents, causing accelerated atherosclerosis and coronary artery disease for those exposed to it in poorly ventilated factories [1]. Alternative proposals for reducing the levels of CS 2 include hydrogenation, oxidation, and hydrolysis. Most studies concen- trate on reaction conditions in excess of 200 °C, and more pro- cesses are required to remove S-component completely by CS 2 hydrogenation and hydrolysis. Recently there has been intense interest in the use of mild reaction conditions for catalyzed reactions of economic and envi- ronmental value. For example Miura et al. [2] present a single process to remove COS utilizing an iron oxide catalyst at around 50 °C. Research Triangle Institute takes advantage of ZnO as adsorbent for both COS and H 2 S, to fulfill simultaneous removal these S-compounds. CS 2 removal at lower temperatures (30–70 °C) was also accomplished, and this process is described as follows: CS 2 ! H 2 O H 2 S ! O 2 S=SO 2 4 . CS 2 is finally converted to sulfur or sulfate so completely during this coupling process that only CS 2 could be detected in the outlet gas. High efficient removal (sulfur emis- sion on ppb level) and high sulfur capacity up to 4% (g g 1 Cat. ) is obtained at temperature 50 °C, space velocity 2000 h 1 , inlet S concentration 500 mgS/m 3 and relative humidity 18%. CS 2 is rather inactive compared to H 2 S, probably due to its sim- ilarity to CO 2 . So it could be surmised that the rate of CS 2 hydrolysis is the rate-determining step during this coupling process. Elemen- tal sulfur or sulfate formed from H 2 S oxidation is deposited on the catalyst, which causes the deactivation of the catalyst. The contin- uous deposition of sulfur on catalyst causes not only the changing of catalyst texture but also a gradual decrease in the number of ac- tive sites [3]. In this work, a mathematical model for the rate of deactivation of the catalyst was developed based on the following concepts that account for both external and internal mass-transfer resistance, as well as effects of S deposition on inner-face of the catalyst. e p0 (ini- tial bulk porosity relative to particle) and b (sulfide deposition coefficient) were used to show the effect of S deposition on the inner-face of the catalyst, which resulted in an increase of mass- transfer resistance. a (deactivation coefficient) was used to de- crease the number of active sites. Performance of the catalyst at wide range of relative humidity (RH) values (5–64%) and lower temperatures (30–70 °C) were studied in this paper. The influences of operating variables on the performance of removing CS 2 were investigated. The application of the model to removing CS 2 in a fixed-bed can provide a reason- able basis for analysis and scale-up of similar industrial gas purifi- cation systems. 0016-2361/$ - see front matter Crown Copyright Ó 2009 Published by Elsevier Ltd. All rights reserved. doi:10.1016/j.fuel.2009.07.012 * Corresponding author. Tel.: +86 21 64253390; fax: +86 21 64253824. E-mail address: [email protected] (W. Li). Fuel 89 (2010) 1716–1720 Contents lists available at ScienceDirect Fuel journal homepage: www.elsevier.com/locate/fuel
Transcript of Removal of carbon disulfide: Experimental and modeling results

Fuel 89 (2010) 1716–1720
Contents lists available at ScienceDirect
Fuel
journal homepage: www.elsevier .com/locate / fuel
Removal of carbon disulfide: Experimental and modeling results
Wang Li a,*, Wang Shudong b, Yuan Quan b
a Research Institute of Industrial Catalysis, East China University of Science and Technology, Shanghai 200237, Chinab Dalian Institute of Chemical Physics, Chinese Academy of Sciences, 457 Zhongshan Road, Dalian 116023, China
a r t i c l e i n f o a b s t r a c t
Article history:Received 11 May 2009Received in revised form 19 July 2009Accepted 21 July 2009Available online 3 August 2009
Keywords:Carbon disulfideCatalystDeactivationKinetic modeling
0016-2361/$ - see front matter Crown Copyright � 2doi:10.1016/j.fuel.2009.07.012
* Corresponding author. Tel.: +86 21 64253390; faxE-mail address: [email protected] (W. Li).
A mathematical model describing the rate of carbon disulfide (CS2) removal has been developed. Kineticstudies were carried out in a fixed-bed reactor under atmospheric pressure and a range of temperatures(30–70 �C). The effects of flow rate, CS2 inlet concentration, temperature and relative humidity were ana-lyzed. A kinetic model based on axial dispersion, external and internal mass-transfer resistances, as wellas effects of S deposition on the inner-face of the catalyst was in agreement with the CS2 experimentalbreakthrough curves. The mathematical model can be used for process design and scale-up of similarsystems.
Crown Copyright � 2009 Published by Elsevier Ltd. All rights reserved.
1. Introduction
Carbon disulfide (CS2) exists widely in chemical processinggases from coal, natural gas and synthesis gas. H2S, the hydrolysisproduct of CS2, has detrimental effect on industrial heterogeneouscatalysts. Levels of sulfur as low as 1 ppm can effectively poisonthe activity of a modern bimetallic reforming catalyst. The pres-ence of feedstock CS2 can also lead to increased corrosion of thereactors used in refinery processes.
CS2 has been classified as a hazardous air pollutant according tothe Clean Air Act and is considered to be one of most toxic solvents,causing accelerated atherosclerosis and coronary artery disease forthose exposed to it in poorly ventilated factories [1].
Alternative proposals for reducing the levels of CS2 includehydrogenation, oxidation, and hydrolysis. Most studies concen-trate on reaction conditions in excess of 200 �C, and more pro-cesses are required to remove S-component completely by CS2
hydrogenation and hydrolysis.Recently there has been intense interest in the use of mild
reaction conditions for catalyzed reactions of economic and envi-ronmental value. For example Miura et al. [2] present a singleprocess to remove COS utilizing an iron oxide catalyst at around50 �C. Research Triangle Institute takes advantage of ZnO asadsorbent for both COS and H2S, to fulfill simultaneous removalthese S-compounds.
CS2 removal at lower temperatures (30–70 �C) was alsoaccomplished, and this process is described as follows: CS2 !
H2O
009 Published by Elsevier Ltd. All r
: +86 21 64253824.
H2S!O2 S=SO2�4 . CS2 is finally converted to sulfur or sulfate so
completely during this coupling process that only CS2 could bedetected in the outlet gas. High efficient removal (sulfur emis-sion on ppb level) and high sulfur capacity up to 4% (g g�1
Cat.)is obtained at temperature 50 �C, space velocity 2000 h�1, inletS concentration 500 mgS/m3 and relative humidity 18%.
CS2 is rather inactive compared to H2S, probably due to its sim-ilarity to CO2. So it could be surmised that the rate of CS2 hydrolysisis the rate-determining step during this coupling process. Elemen-tal sulfur or sulfate formed from H2S oxidation is deposited on thecatalyst, which causes the deactivation of the catalyst. The contin-uous deposition of sulfur on catalyst causes not only the changingof catalyst texture but also a gradual decrease in the number of ac-tive sites [3].
In this work, a mathematical model for the rate of deactivationof the catalyst was developed based on the following concepts thataccount for both external and internal mass-transfer resistance, aswell as effects of S deposition on inner-face of the catalyst. ep0 (ini-tial bulk porosity relative to particle) and b (sulfide depositioncoefficient) were used to show the effect of S deposition on theinner-face of the catalyst, which resulted in an increase of mass-transfer resistance. a (deactivation coefficient) was used to de-crease the number of active sites.
Performance of the catalyst at wide range of relative humidity(RH) values (5–64%) and lower temperatures (30–70 �C) werestudied in this paper. The influences of operating variables on theperformance of removing CS2 were investigated. The applicationof the model to removing CS2 in a fixed-bed can provide a reason-able basis for analysis and scale-up of similar industrial gas purifi-cation systems.
ights reserved.

Nomenclature
C concentration in the bulk phase, g m�3
Cm concentration at catalyst external surface, g m�3
Ccalout calculated outlet concentration, g m�3
Cexpout experimental outlet concentration, g m�3
Cp internal concentration in particle, g m�3
dp particle diameter, mDm film mass-transfer coefficient, m�3 s�1
Dp pore-diffusion coefficient relative to particle, m2 s�1
Dz axial diffusion coefficient, m2 s�1
kf external mass-transfer coefficient, m s�1
KH2O adsorption constant of H2O, Pa�1
ms function of sulfide deposition, mol g�1
M molecular weight, g mol�1
Ne number of experiment runsNs number of samplesP pressure, Par radius of particle, mRep Reynolds number of particleRCS2
rate of reaction, mol h�1 g�1
Sc Schmidt number
Shp Sherwood number of particlet time, hT temperature, Ku velocity, m s�1
U flow ratePV special diffusion parameters
Ws saturation sulfur capacity, g g�1Cat.
Z bed length, m
Greek lettersa deactivation coefficientb sulfide deposition coefficienteb bulk porosityep0
initial bulk porosity of particleep bulk porosity of particle/ðmsÞ deactivation functionu objective function for optimization Eq. (17)qf particle density, kg m�3
lf dynamic viscosity, Pa s
W. Li et al. / Fuel 89 (2010) 1716–1720 1717
2. Experimental methods
Catalysts were brought from Dalian Prit Co., China. The cata-lyst was composed of cerium–potassium–organic amine-activatedcarbon. A laboratory fixed-bed glass tube reactor was used forthis study. CS2 (BOC, 5000 ppm in N2) was adjusted over a widerange of concentrations (200–1000 ppm). Water was introducedusing a saturator system. The fixed O2/CS2 stoichiometric mole ra-tio of 5 was supplied to the catalysts. In each experiment, 1.7 g ofcatalyst with particle 14–20 mesh (0.8–1 mm) was used. The gashourly space velocity (GHSV) was standardized at 3150 h�1. Reac-tants and products were analyzed by a sulfur Micro-coulomb ana-lyzer and a Varian 3800 gas chromatograph with a pulsed flamephotometric detector, permitting detection at levels as low as0.5 ppm.
3. Mathematical model
In the modeling, the following assumptions were made: theprocess operates under isothermal conditions and packed porosityis constant along the longitudinal axis of the bed; an axial disper-sion plug-flow model is adopted to account for non-ideal flow inthe bed; mass transport between the bulk phase and the solid par-ticle is described by the external-film mass-transfer coefficient kf;intraparticle mass transfer is characterized by the pore-diffusioncoefficient Dp.
3.1. Reactor model
The overall mass balance around the fixed-bed can be expressedas:
@C@tþ u
@C@z¼ Dz
@2C@z2 þ
3kf
RP
1� eb
ebCp
��r¼RP� C
� �ð1Þ
The initial and Danckwerts boundary conditions at both ends ofthe bed are given by the following equation
at t ¼ 0 C ¼ 0 ð2Þ
at t > 0 z ¼ 0; Dz@C@z¼ uðC � CinÞ ð3Þ
z ¼ L;@C@z¼ 0 ð4Þ
The Wakao–Funazkri correlation [4] was adopted to estimatethe film mass-transfer coefficient Dm and axial dispersion coeffi-cient Dz:
Shp ¼ 2þ 1:1Sc1=3Re0:6p ;
ebDz
Dm¼ 20þ 0:5ScRep ð5Þ
where Shp and Rep are the Sherwood and Reynolds numbers relativeto the catalyst particle, and can be calculated as follows:
Shp ¼kf dp
Dm; Rep ¼
dpUqf
lfð6Þ
Sc is the Schmidt number, which can be calculated according to:
Sc ¼lf
qf Dmð7Þ
The film mass-transfer coefficient Dm, was calculated by the Ful-ler–Schettler–Gridding method [5].
DAB ¼0:00143T1:75
PM1=2AB ð
PVAÞ1=3 þ ð
PVBÞ1=3
h i2
3.2. Intraparticle mass transfer
The mass transport within a catalyst particle can be representedby the following reaction–diffusion equation:
@ðepCpÞ@t
¼ 1r2
@
@rr2Dpðr; tÞ
@Cp
@r
� �� RCS2 ð8Þ
The sulfide deposition in the particle was governed by
@ms
@t¼ RCS2 ð9Þ
The random pore model [6] was used to estimate the pore-dif-fusion coefficient Dp, which is calculated by the followingequation:
Dpðr; tÞ ¼ Dme2p ð10Þ
where ep is given by
epðr; tÞ ¼ ep0 � bmsðr; tÞ ð11Þ

1718 W. Li et al. / Fuel 89 (2010) 1716–1720
together with the initial conditions:
at t ¼ 0; Cp ¼ 0; ms ¼ 0 ð12Þ
The mass-transfer boundary conditions on the surface of thecatalyst are expressed as:
at t > 0; r ¼ Rp; Dp@Cp
@r¼ kf ðC � Cp
��r¼RPÞ ð13Þ
The symmetry conditions at the center of the particles are asfollows:
r ¼ 0;@Cp
@r¼ 0 ð14Þ
Fig. 3. Experimental (dots) and modeled (line) outlet concentrations of CS2 fordifferent inlet concentrations at RH = 18% and T = 50 �C.
3.3. Kinetic model
CS2 hydrolysis is hypothesized to be the rate-determining stepin the coupled reactions for removing CS2, so the rate equation ofthe overall process would be taken as the rate of CS2 hydrolysis.The intrinsic rate functions of hydrolysis of CS2 were found to bebest fit as the proposed rate functions of carbonyl sulfide (COS)hydrolysis [7]. The reactivity of CS2 hydrolysis is considered more
Fig. 2. Experimental (dots) and modeled (line) outlet concentrations of CS2 fordifferent inlet concentrations at RH = 18% and T = 40 �C.
Fig. 4. Experimental (dots) and modeled (line) outlet concentrations of CS2 fordifferent inlet concentrations at RH = 18% and T = 60 �C.
Fig. 5. Experimental (dots) and modeled (line) outlet concentrations of CS2 fordifferent inlet concentrations at RH = 18% and T = 70 �C.
Fig. 1. Experimental (dots) and modeled (line) outlet concentrations of CS2 fordifferent inlet concentrations at RH = 18% and T = 30 �C.
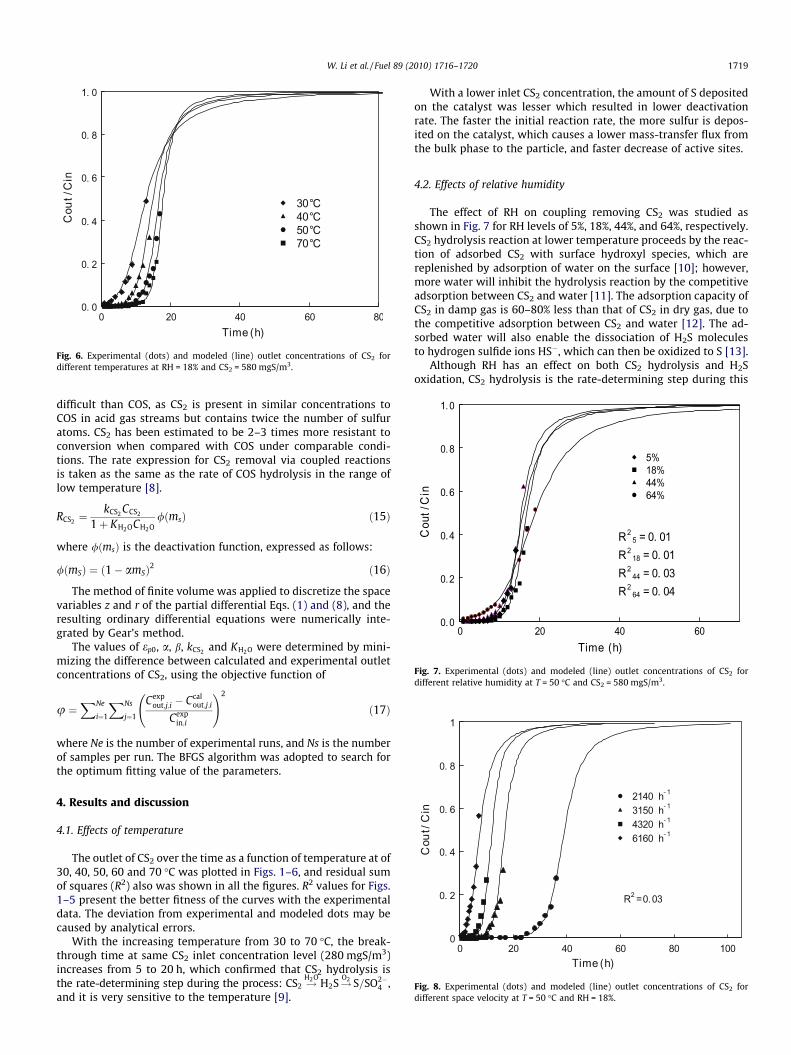
Fig. 6. Experimental (dots) and modeled (line) outlet concentrations of CS2 fordifferent temperatures at RH = 18% and CS2 = 580 mgS/m3.
Fig. 7. Experimental (dots) and modeled (line) outlet concentrations of CS2 fordifferent relative humidity at T = 50 �C and CS2 = 580 mgS/m3.
Fig. 8. Experimental (dots) and modeled (line) outlet concentrations of CS2 fordifferent space velocity at T = 50 �C and RH = 18%.
W. Li et al. / Fuel 89 (2010) 1716–1720 1719
difficult than COS, as CS2 is present in similar concentrations toCOS in acid gas streams but contains twice the number of sulfuratoms. CS2 has been estimated to be 2–3 times more resistant toconversion when compared with COS under comparable condi-tions. The rate expression for CS2 removal via coupled reactionsis taken as the same as the rate of COS hydrolysis in the range oflow temperature [8].
RCS2 ¼kCS2 CCS2
1þ KH2OCH2O/ðmsÞ ð15Þ
where /ðmsÞ is the deactivation function, expressed as follows:
/ðmSÞ ¼ ð1� amSÞ2 ð16Þ
The method of finite volume was applied to discretize the spacevariables z and r of the partial differential Eqs. (1) and (8), and theresulting ordinary differential equations were numerically inte-grated by Gear’s method.
The values of ep0, a, b, kCS2 and KH2O were determined by mini-mizing the difference between calculated and experimental outletconcentrations of CS2, using the objective function of
u ¼XNe
i¼1
XNs
j¼1
Cexpout;j;i � Ccal
out;j;i
Cexpin;i
!2
ð17Þ
where Ne is the number of experimental runs, and Ns is the numberof samples per run. The BFGS algorithm was adopted to search forthe optimum fitting value of the parameters.
4. Results and discussion
4.1. Effects of temperature
The outlet of CS2 over the time as a function of temperature at of30, 40, 50, 60 and 70 �C was plotted in Figs. 1–6, and residual sumof squares (R2) also was shown in all the figures. R2 values for Figs.1–5 present the better fitness of the curves with the experimentaldata. The deviation from experimental and modeled dots may becaused by analytical errors.
With the increasing temperature from 30 to 70 �C, the break-through time at same CS2 inlet concentration level (280 mgS/m3)increases from 5 to 20 h, which confirmed that CS2 hydrolysis isthe rate-determining step during the process: CS2 !
H2OH2S!O2 S=SO2�
4 ,and it is very sensitive to the temperature [9].
With a lower inlet CS2 concentration, the amount of S depositedon the catalyst was lesser which resulted in lower deactivationrate. The faster the initial reaction rate, the more sulfur is depos-ited on the catalyst, which causes a lower mass-transfer flux fromthe bulk phase to the particle, and faster decrease of active sites.
4.2. Effects of relative humidity
The effect of RH on coupling removing CS2 was studied asshown in Fig. 7 for RH levels of 5%, 18%, 44%, and 64%, respectively.CS2 hydrolysis reaction at lower temperature proceeds by the reac-tion of adsorbed CS2 with surface hydroxyl species, which arereplenished by adsorption of water on the surface [10]; however,more water will inhibit the hydrolysis reaction by the competitiveadsorption between CS2 and water [11]. The adsorption capacity ofCS2 in damp gas is 60–80% less than that of CS2 in dry gas, due tothe competitive adsorption between CS2 and water [12]. The ad-sorbed water will also enable the dissociation of H2S moleculesto hydrogen sulfide ions HS�, which can then be oxidized to S [13].
Although RH has an effect on both CS2 hydrolysis and H2Soxidation, CS2 hydrolysis is the rate-determining step during this
Table 1Optimum model parameters at different operating temperatures RH = 18% andGHSV = 3510 h�1.
T (�C) ep0 a � 104 b � 105 kCS2 (mol h�1 g�1) KH2O (Pa�1)
30 0.35 5.98 2.16 5.4 23.340 0.36 6.11 2.11 11.2 20.950 0.36 6.21 2.13 20.3 16.660 0.37 6.17 2.12 30.1 13.970 0.38 6.07 2.01 35.9 9.6
Table 2Optimum model parameters at different RH T = 50 �C and GHSV = 3510 h�1.
RH values (%) ep0 a � 104 b � 105 kCS2 (mol h�1 g�1) KH2O (Pa�1)
5 0.38 6.58 3.92 20.3 16.618 0.35 6.21 2.13 20.3 16.644 0.31 5.58 1.98 19.9 15.964 0.28 4.86 1.66 19.6 15.4
1720 W. Li et al. / Fuel 89 (2010) 1716–1720
coupling process. According to Fig. 7, when RH increases, the CS2
removal rate decreases. Thus, the negative impact of competitiveadsorption of water with CS2 on the catalyst surface predominatesover the positive impact of water supplying more hydroxyl species.
4.3. Effects of space velocity
The effect of the space velocity on CS2 removal was studied asshown in Fig. 8. Within the experimental range, the CS2 conversionincreases with a decrease of space velocity. When the space veloc-ity decreases from 6160 to 2140 h�1, breakthrough time increasesby a factor of 10 from 2 to 20 h. At lower space velocity, the resi-dence times of CS2 and H2O are longer and there is a great proba-bility of collisions on the surface resulting in an increase in CS2
conversion.The flow rate and, thus, the linear velocity of the fluid phase af-
fect the thickness of the boundary layer surrounding the particlesand the external mass-transfer coefficient that is a function ofthe latter. The effect of the flow rate on the coupling process ischaracterized by kf. Within the experimental range, the value ofkf is suitable at low Reynolds numbers.
4.4. Model parameters analysis
The mathematical model describing the kinetics of the oxida-tion process was used to fit the experimental breakthrough curvesin order to determine the parameters by minimization of the objec-tive function, as previously described. The best fit values of theparameters are shown in Tables 1 and 2.
With a lower inlet CS2 concentration, the amount of S depositedon the catalyst was lesser, which resulted in lower deactivationrate. The faster the initial reaction rate, the more sulfur is depos-ited on the catalyst, which causes a lower mass-transfer flux fromthe bulk phase to the particle and faster decreases of active sites.Inlet CS2 concentration has effect on reaction rate, while it doesnot affect kCS2 and other parameters such as a and b and so on.
It is shown in Table 1 that increasing temperature increases thereaction rate constant, although the adsorption rate constant de-creases, as would be expected. However, temperature has little ef-fect on a and b. The Arrhenius equation was used to obtain theparameters of adsorption heat and activation energy. The parame-ters for this model are: kCS2 ¼ 8:84� 107 expð�41;480=RTÞ,kH2O ¼ 1:83� 10�2 expð18;190=RTÞ.
The effect of RH on kinetic parameters was shown in Table 2.With the increase of RH in the feed, more water can be adsorbed,
which causes a slight decrease of ep0. CS2 hydrolysis reaction atlower temperature proceeds by the reaction of adsorbed CS2 withsurface hydroxyl species, which are replenished by adsorption ofwater on the surface; however, more water will inhibit the hydro-lysis reaction by the competitive adsorption between CS2 andwater [11]. The presence of adsorbed water enables the dissocia-tion of H2S molecules to HS�, which are then oxidized to sulfurpolymers having chain or ring-like shapes soluble in water. Thepresence of water slows down the deactivation process by promot-ing deposition and adsorption of sulfur on different carbon sites,and/or by mechanically removing sulfur from active sites whichall result in the decrease of a and b. With increasing of RH, It wouldinhibited catalysts deactivation, while it has slight effect on kCS2
and KH2O. The presence of water dissolved sulfur species also wasobserved in the regeneration of exhausted carbon [14].
5. Conclusions
A mathematical model was developed for CS2 removal usingcoupled reactions on a bi-functional catalyst, accounting for exter-nal-film and pore-diffusion mass-transfer mechanisms and axialdispersion. The model was used to fit experimental breakthroughcurves.
The parameters ep0, a, b with respect to the catalyst were usedto quantify the performance of the process at different operatingconditions. The inlet CS2 concentration and flow rate have no effecton ep0, a, b.
Within the experimental range, the value of kf is suitable at lowReynolds numbers. The effect of RH on ep0, a, b decrease is muchmore significant than temperature in the study range, whichmeans RH slows the rate of deactivation.
The model described satisfactorily the experimental break-through curves and explained the performance of CS2 removalvia coupled reactions on a bi-functional catalyst. The applicationof the model to CS2 removal in a fixed-bed can provide a reason-able basis for analysis and scale-up of similar industrial gas purifi-cation systems.
References
[1] Ghittori S, Maestri L, Contardi I. Biological monitoring of workers exposed tocarbon disulfide (CS2) in a viscose rayon fibers factory. Am J Ind Med1998;33:478–87.
[2] Miura K, Mae K, Inoue T, Yoshimi T, Nakagawa H, Hashimoto K. Simultaneousremoval COS and H2S from coke oven gas at low temperature by use of ironoxide. Ind Eng Chem Res 1992;31:415–9.
[3] Dreeramamurthy R, Menon PG. Oxidisation of H2S on activated carboncatalyst. J Catal 1975;37:287–96.
[4] Wakao N, Funazkrib T. Effect of fluid dispersion coefficients on particle-to-fluidmass transfer coefficients in packed beds. Chem Eng Sci 1978;33:1375–84.
[5] Fuller EN, Schettler PD, Giddings JC. A new method for prediction of binary gas-phase diffusion coefficients. Ind Eng Chem 1966;58:18–27.
[6] Froment GF, Bischoff KB. Chemical reactor analysis and design. 2nd ed. NewYork: John Wiley and Sons; 1990.
[7] Rhodes C, Riddel AS, West J, et al. The low-temperature hydrolysis of carbonylsulfide and carbon disulfide: a review. Catal Today 2000;59:443–64.
[8] Willamis BP, Young CN, West J, Rhodes C, Hutchings G. Carbonyl sulphidehydrolysis using alumina catalysts. Catal Today 1999;49:99–104.
[9] Tone S, Dalla IG, Chung KT. Appraisal of catalysts for the hydrolysis of carbondisulfide. Can J Chem Eng 1992;70:516–21.
[10] West J, Williams BP, Young N. Low temperature hydrolysis of carbonyl sulfideusing c-alumina catalysts. Catal Lett 2001;74:111–4.
[11] Pechler N, Emig G. Adsorptive purification of large waste gas streams. Gas SepPurif 1991;5:247–51.
[12] Fan HL, Jin GJ, Shangguan J. Adsorption kinetics of CS2 from damp gas onactivated carbon in a fixed bed. ACTA Scientiae Circumstantiae (In Chin)1999;19:489–93.
[13] Tan XY. The process to remove H2S on impregnated activated carbon. Beijing:Dalian Institute of Chemical Physics, Chinese Academy of Sciences; 1999.
[14] Bandosz TJ, Le Q. Evaluation surface properties of exhausted carbons used asH2S adsorbents in sewage treatment plants. Carbon 1998;36:39–44.


![Experimental outgassing of toxic chemicals to simulate the ... · the toxic industrial solvents benzene, toluene and carbon disulfide[13]. The method was also developed to simultaneously](https://static.fdocuments.us/doc/165x107/5e2f7ab82c07fb0a52374264/experimental-outgassing-of-toxic-chemicals-to-simulate-the-the-toxic-industrial.jpg)