
Removal of artifacts in EEG by averaging and
31
REMOVAL OF ARTIFACTS IN EEG BY AVERAGING AND ADAPTIVE ALGORITHMS By Namratha D'cruz 1
-
Upload
namdcruz -
Category
Engineering
-
view
286 -
download
2
Transcript of Removal of artifacts in EEG by averaging and

REMOVAL OF ARTIFACTS IN
EEG BY AVERAGING AND
ADAPTIVE ALGORITHMS
By Namratha D'cruz1

COMMON ARTIFACTS IN EEG
SIGNALS
EEG is designed to record cerebral activity in the brain.
All signals that appear in the EEG record which don't
come from the brain are referred as artifacts.
Artifacts can be divided into :
1. physiologic artifacts
2. Extra physiologic artifacts.
2
COMMON ARTIFACTS IN EEG
SIGNALS
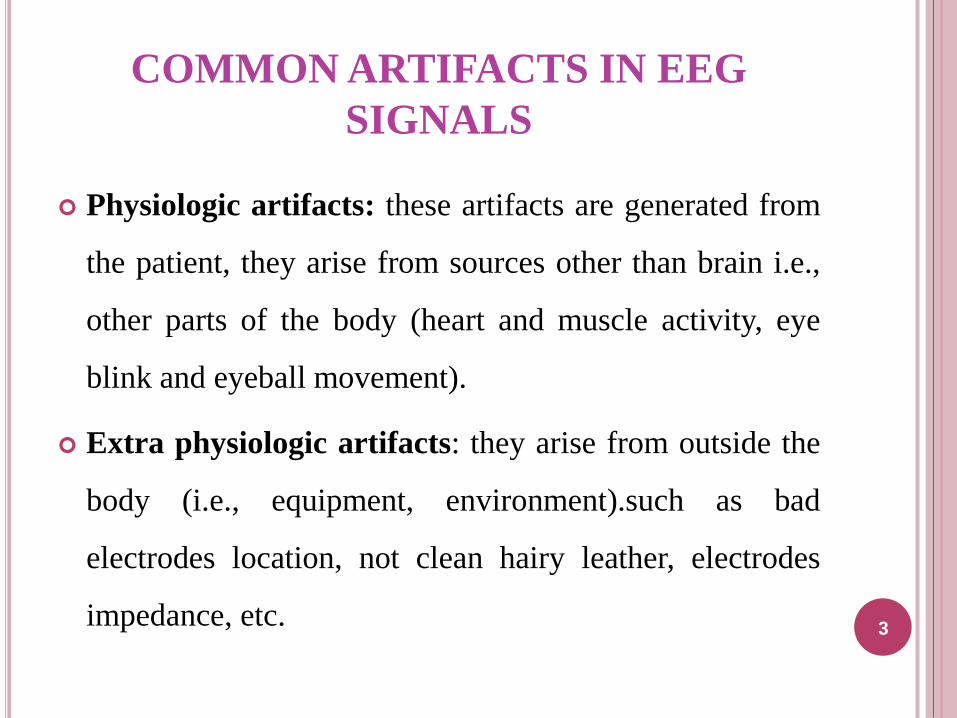
Physiologic artifacts: these artifacts are generated from
the patient, they arise from sources other than brain i.e.,
other parts of the body (heart and muscle activity, eye
blink and eyeball movement).
Extra physiologic artifacts: they arise from outside the
body (i.e., equipment, environment).such as bad
electrodes location, not clean hairy leather, electrodes
impedance, etc.3

COMMON ARTIFACTS IN EEG
SIGNALS
External device artifacts
Numerous types of external devices produce EEG artifact and may
do so through the electrical fields they generate or through
mechanical effects on the body.
The most common external artifact is due to the alternating current
present in the electrical power supply.
This noise is usually medium to low amplitude and has the
monomorphic frequency of the current, which is 60 Hz in North
America and 50 Hz in much of the rest of the world.
4

COMMON ARTIFACTS IN EEG
SIGNALS
External device artifacts
The artifact may be present in all channels or in
isolated channels that include electrodes that
have poorly matched impedances.
Devices like circulatory pump and ventilator can
also cause artifacts.5

COMMON ARTIFACTS IN EEG
SIGNALS
Electrode artifact
The different types of electrode artifacts are :
1. Electrode pop:
2. Electrode contact
3. Electrode/lead movement
4. Perspiration
5. Movement artifact
6

COMMON ARTIFACTS IN EEG
SIGNALSCardiac artifacts
Cardiac activity may have pronounced effects on the
electroencephalogram (EEG) because of its relatively high electrical
energy, especially upon the no-cephalic reference recordings of
EEG.
The QRS complexes appear in the EEG signal like regular spikes.
ECG artifact may occur inconsistently by not being present with
every contraction of the heart and may have an irregular interval
when a cardiac arrhythmia is present7

COMMON ARTIFACTS IN EEG
SIGNALSCardiac artifacts
Cardiac pacemakers produce a different electrical
artifact. it is distinct from ECG artifact in both
distribution and morphology.
Pacemaker artifact is generalized across the scalp and
comprises high frequency with a duration that is shorter
than ECG artifact.
8

9

COMMON ARTIFACTS IN EEG
SIGNALS
Ocular artifacts
The human eye generates an electrical dipole caused by a
positive cornea and negative retina.
Eye movements and blinks change the dipole causing an
electrical signal known as an EOG.
The shape of the EOG waveform depends on factors such as
the direction of eye movements.
A fraction of the EOG spreads across the scalp and it is
superimposed on the EEG. 10

COMMON ARTIFACTS IN EEG
SIGNALS
Two kinds of ocular artifacts can be observed in EEG
records, eye blinks and eye movements.
Eye blinks are represented by a low frequency signal
(< 4 Hz) with high amplitude.
It is a symmetrical activity mainly located on the front
electrodes (FP1, FP2) with low propagation.
Eye movements are also represented by a low frequency
signal (< 4 Hz) but with higher propagation 11

12

COMMON ARTIFACTS IN EEG
SIGNALS
EMG artifacts
EMG activity is the most common and significant source
of noise in EEG.
Repetitive EMG artifact may occur with photic
stimulation as a time locked facial muscle response to the
flash of light.
Activities like chewing and swallowing can also cause
muscular artifacts. 13

REMOVAL OF ARTIFACTS USING ADAPTIVE
FILTERING
Adaptive filters are based on the optimization theory and
they have the capability of modifying their properties
according to selected features of the signals being
analyzed.
Figure below illustrates the structure of an adaptive filter.
14

REMOVAL OF ARTIFACTS USING ADAPTIVE
FILTERING
The objective of an adaptive filter is to change (adapt)
the coefficients of the linear filter, and hence its
frequency response, to generate a signal similar to the
noise present in the signal to be filtered.
The adaptive filter adjusts its coefficients to minimize the
squared error between its output and a primary signal.
In an adaptive filter, there are basically two processes:
1. A filtering process, in which an output signal is the
response of a digital filter. Usually, FIR filters are used
in this process because they are linear, simple and
stable.
2. An adaptive process, in which the transfer function
H(z) is adjusted according to an optimizing algorithm.
The most used optimizing criterion is the Least Mean
Square (LMS) algorithm
15

LMS ALGORITHM
Structure of FIR filter
16

LMS ALGORITHM
The structure of the FIR can be represented as,
where L is the order of the filter, x(n) is the secondary
input signal, wk are the filter coefficients and y(n) is the
filter output.
The error signal e(n) is defined as the difference between
the primary signal d(n) and the filter output y(n), that is,
e(n) = d(n)-y(n)
Where
17
(1)
(2)
(3)

LMS ALGORITHM
The squared error is,
The squared error expectation for N samples is given by
18
(4)
(5)
(6)

LMS ALGORITHM
where rdx(n) and rxx(n) are, respectively, the cross-correlation
function between the primary and secondary input signals, and the
autocorrelation function of the secondary input, that is
The objective of the adaptation process is to minimize the squared error. To
get this goal there are different optimization techniques. we use the method
of steepest descent.
19
(7)
(8)

LMS ALGORITHM
With this, it is possible to calculate the filter coefficient
vector for each iteration k having information about the
previous coefficients and gradient, multiplied by a
constant, that is,
where μ is a coefficient that controls the rate of
adaptation.
The gradient is defined as,
20
9
10
LMS ALGORITHM
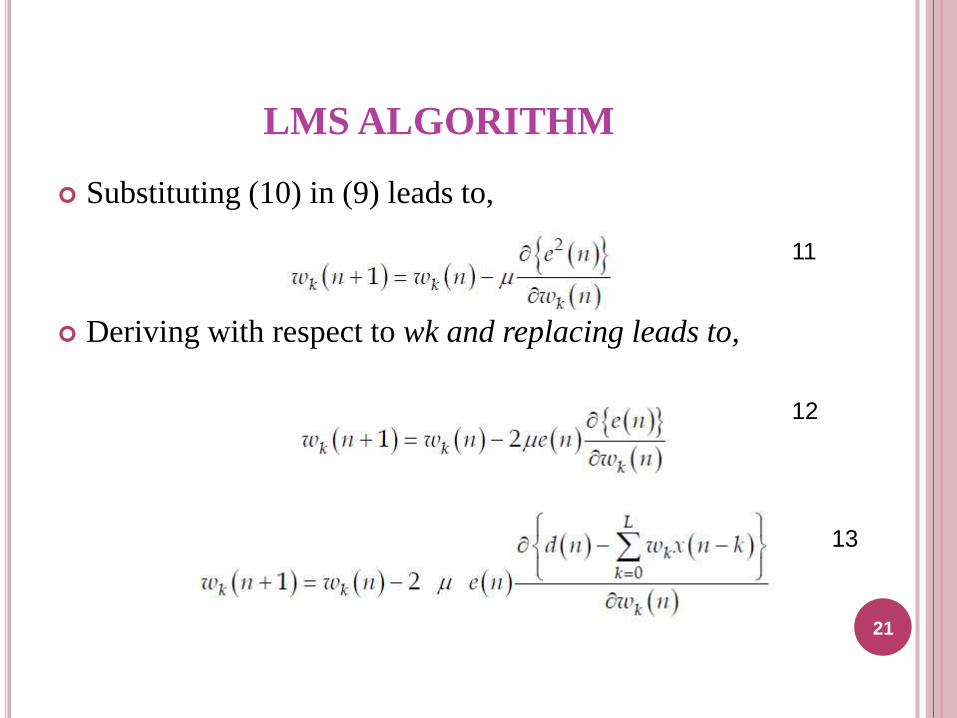
Substituting (10) in (9) leads to,
Deriving with respect to wk and replacing leads to,
21
11
12
13
LMS ALGORITHM
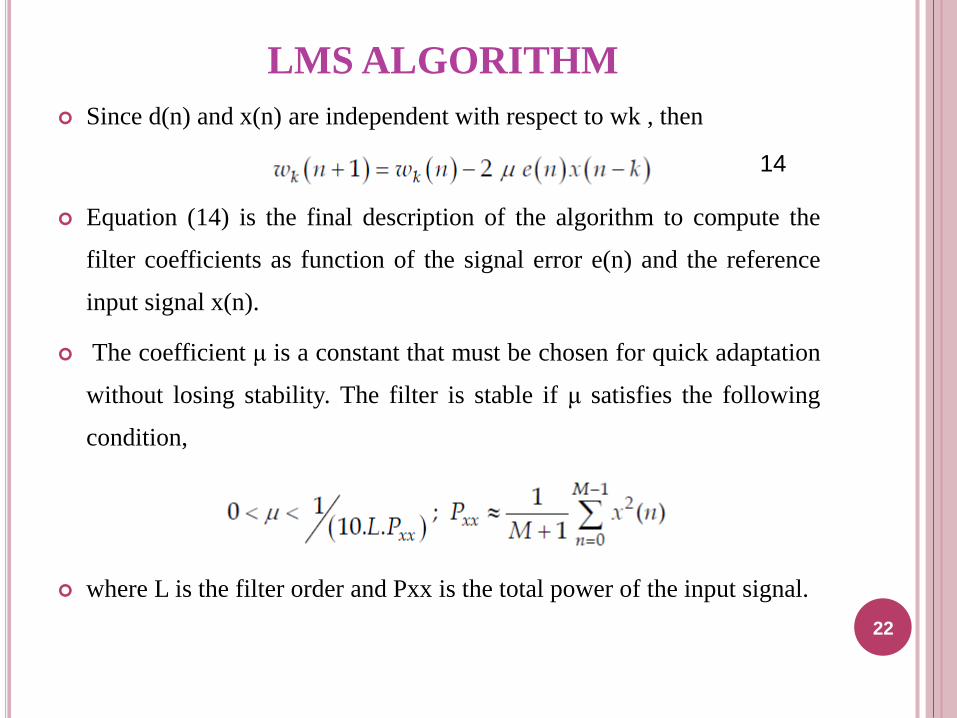
Since d(n) and x(n) are independent with respect to wk , then
Equation (14) is the final description of the algorithm to compute the
filter coefficients as function of the signal error e(n) and the reference
input signal x(n).
The coefficient μ is a constant that must be chosen for quick adaptation
without losing stability. The filter is stable if μ satisfies the following
condition,
where L is the filter order and Pxx is the total power of the input signal.
22
14

To remove the main artifacts of the EEG signal, a cascade
of three adaptive filters is used as shown in the figure
below.
23

REMOVAL OF ARTIFACTS FROM EEG
The input d1(n) in the first stage is the EEG corrupted
with artifacts (EEG + line-frequency + ECG + EOG).
The reference x1(n) in the first stage is an artificial sine
function generated with 50 Hz (or 60 Hz, depends on
line frequency).
The output of H1(z) is y1(n), which is an estimation of
the line artifacts present in the EEG.
This signal y1(n) is subtracted from the corrupted d1(n)
to produce the error e1(n), which is the EEG without
line-interference
24

Example of a segment of EEG filtered with stage 1
a) Red: Original EEG contaminated with 50 Hz power
line interference, d1(n).
b) Blue: EEG without line interference, e1(n).
25
REMOVAL OF ARTIFACTS FROM EEG
The e1(n) error is forwarded as the corrupted input signal
d2(n) to the second stage.
The reference input x2(n) of the second stage can be
either a real or artificial ECG. The output of H2(z) is
y2(n), representing a good estimate of the ECG artifacts
present in the EEG record.
Signal y2(n) is subtracted from d2(n); its result produces
error e2(n).
Thus, the EEG without line and ECG artifacts is
obtained.
26

Example of a segment of EEG filtered with stage 2. In Red: Contaminated EEG, d2(n).
In Green: ECG signal. In Black: output signal from H2(z), that is y2(n). In Blue: EEG
without ECG artifacts, e2(n).
27

REMOVAL OF ARTIFACTS FROM EEG
Then, e2(n) enters into the third stage as the signal d3(n).
The reference input x3(n) of filter H3(z) is also a real or
artificial EOG and its output is y3(n), which is a replica
of the EOG artifacts present in the EEG record.
when y3(n), subtracted from d3(n), gives error e3(n). It is
the final output of the cascade filter, that is, the clean
EEG without artifacts.
28

Example of segment of EEG filtered with stage 3. In Red: Contaminated EEG, d3(n). In
Green: EOG signal. In Black: output signal from H3(z), that is y3(n). In Blue: EEG
without EOG artifacts, e3(n).29

30

31

![Automatic removal of eye movement artifacts from the EEG ......arate epileptic spikes from the EEG background [11] and to remove artifacts, such as eye blinks [12]. In this last study,](https://static.fdocuments.us/doc/165x107/6044797169a65c1c8229e5fe/automatic-removal-of-eye-movement-artifacts-from-the-eeg-arate-epileptic.jpg)


![Physiological artifacts in scalp EEG and ear-EEG · eear-EEGwererecordedfrompassivesilverelectrodesembeddedonthesurface ofcustommadeearpiecesasdescribedbyLooneyetal.[5].eear-EEGelectrodelabel](https://static.fdocuments.us/doc/165x107/5be4759d09d3f2f4628cb7a3/physiological-artifacts-in-scalp-eeg-and-ear-eeg-eear-eegwererecordedfrompassivesilverelectrodesembeddedonthesurface.jpg)