
Remote Sensing for Transportation: APPENDIX A (Part 3) · major advances in remote-sensing data...
6
78 Remote Sensing for Transportation: Report of a Conference FIGURE 19 Characteristics of NASA’s AVIRIS sensor system flown onboard a DeHavilland Twin Otter DHC-6. Radar and IFSAR Remote Sensing In the United States, much of the information required to conduct practical transportation-related projects can be obtained using optical remote-sensing systems, including traditional aerial photography, digital frame cameras, and multispectral and hyperspectral remote sensing. These systems provide excellent data and potential information if there is little cloud cover. Conversely, during bad weather active microwave (radar) remote sensing is usually the sensor of choice because it has all-weather capability and can obtain imagery both day and night. Such information is critical, especially during prolonged flooding. In addition, if two radars are placed on the same aircraft or spacecraft platform, it is now possible to perform analyses to extract detailed topographic information.
Transcript of Remote Sensing for Transportation: APPENDIX A (Part 3) · major advances in remote-sensing data...

78 Remote Sensing for Transportation: Report of a Conference
FIGURE 19 Characteristics of NASA’s AVIRIS sensor systemflown onboard a DeHavilland Twin Otter DHC-6.
Radar and IFSAR Remote Sensing
In the United States, much of the information required to conduct practical transportation-relatedprojects can be obtained using optical remote-sensing systems, including traditional aerialphotography, digital frame cameras, and multispectral and hyperspectral remote sensing. Thesesystems provide excellent data and potential information if there is little cloud cover.Conversely, during bad weather active microwave (radar) remote sensing is usually the sensor ofchoice because it has all-weather capability and can obtain imagery both day and night. Suchinformation is critical, especially during prolonged flooding. In addition, if two radars are placedon the same aircraft or spacecraft platform, it is now possible to perform analyses to extractdetailed topographic information.

Jensen 79
FIGURE 20 Application of AVIRIS hyperspectral imagery to identify stressed vegetationon clay-capped hazardous waste sites at Savannah River site: (a) composite of
AVIRIS data of Mixed Waste Management Facility clay caps at Savannah River site;(b) spectral reflectance curves of four bahia grass endmembers (one healthy andthree stressed), derived from AVIRIS data; (c) classification map derived fromAVIRIS data, showing those areas with most potential bahia grass stress; and
(d) second derivative image, derived from AVIRIS data (RGB = Bands 42, 30, 38).
Conventional Satellite and Airborne Radar Imagery
The Canadian RADARSAT active microwave system is a good example of the state of the art ofsatellite active microwave remote sensing. It is a C-band (5.6 cm) wavelength horizontal send–horizontal receive polarization radar in a near-polar orbit. This system acquires imagery at avariety of spatial resolutions from 8 to 100 m. RADARSAT imagery obtained in the vicinity ofthe Flemish Cap in the North Atlantic revealed oil slicks and several ships in the region (Figure
(a) (b)
(c) (d)

Jensen 80
21). As previously mentioned and referred to in Figure 2, most remote-sensing datapreprocessing and analysis requires significant training and expertise. Unfortunately, extractinguseful information from radar imagery is very difficult, requiring extensive knowledge of radarphysics and of the most appropriate radargrammetric image-processing methods.
IFSAR to Extract Topographic Information
An exciting event of the past decade has been the development of radar interferometry, wherebyradar images of the same location on the ground are recorded by (a) two different antennas onthe same platform (aircraft or satellite) at the same time (called single-pass interferometry) or (b)by a single antenna on an aircraft or spacecraft at different times. An analysis of the resulting twointerferograms allows precise measurement of the range (distance) to any specific x, y, z pointfound in each image of the interferometric pair.
The first satellite single-pass IFSAR was the Shuttle Radar Topography Mission (SRTM). Ithad a C-band and an X-band antenna separated by 60 m (200 ft) (see Figure 22). SRTM data arebeing used to produce a DEM of 80 percent of the Earth at 20×20-m postings. Such informationis valuable for regional elevation, slope, and aspect information, particularly in developingcountries where such data have never before been available. Two examples of DEMs producedfrom SRTM data and overlaid with Landsat ETM+ data (RGB = Bands 1, 2, 3) are
FIGURE 21 RADARSAT imagery of oil slicks and ships atFlemish Cap in north Atlantic (courtesy of RADARSAT, Inc.).

Jensen 81
found in Figure 22c and d. The first DEM depicts the San Fernando Valley (Calif.), which has apopulation of more than 1 million people. It shows a view toward the northeast with a 3× verticalexaggeration. The second DEM is a 2× vertically exaggerated image of a portion of the SanAndreas fault near Bakersfield, California.
Private commercial companies also acquire IFSAR data. For example, the Intermap X-bandStar 3i System generates high-quality 3×3-m X-band microwave imagery, plus a detailed DEMof the terrain. IFSAR data can provide extremely high-precision topographic information (x, y, z)that is just as accurate as DEMs derived using traditional optical photogrammetric techniquesand LIDAR if certain conditions are met (e.g., the data are acquired when the leaves are off).Figure 11c depicts topographic information for an area in North Carolina extracted from IFSARdata.
Finally, if the look angles of multiple data acquisitions are held constant, there is nosensitivity to topography and the interferometry can be used to extract information about thingsthat have changed in the scene. Quantitative information about the velocity of objects that movedbetween the two observations may be made. Interferometry has been successfully applied tomeasuring movement along fault lines, measuring seismic displacement due to earthquakes,mapping glacier velocity, monitoring ocean currents, and assessing wave spectra. In addition,interferometry can be used to determine if man-made objects, such as automobiles, ships, andaircraft, in the scene have moved. This is very powerful for change-detection purposes.
SUMMARY
This paper reviewed general business-like characteristics of remote-sensing data-collectionsystems. It then identified several reasons why user communities do not rapidly embracepotentially useful remote-sensing calibrated data and information. Basically, there is aknowledge gap between the remote-sensing technologists and the user communities that must bebridged. In an attempt to reduce the dimension of this gap, this paper briefly introduced severalof the more important advances in remote-sensing science instrumentation. In addition, a fewmajor advances in remote-sensing data preprocessing and analysis were identified. Hopefully,the material has value for both the remote-sensing science and transportation user communities.
REFERENCES
1. Jensen, J. R. Introductory Digital Image Processing: A Remote Sensing Perspective, 2nd ed.Prentice-Hall, Inc., Saddle River, N.J., 1996.
2. Liverman, D., E. F. Moran, R. R. Rindfuss, and P. C. Stern. People and Pixels: LinkingRemote Sensing and Social Science. National Academy Press, Washington, D.C., 1998.
3. Schowengerdt, R. A. Remote Sensing: Models and Methods for Image Processing. AcademicPress, Inc., New York, 1997.
4. Jensen, J. R. Remote Sensing of the Environment: An Earth Resource Perspective. Prentice-Hall, Inc., Saddle River, N.J., 2000.
5. Lillesand, T., and R. Kiefer. Elements of Image Interpretation, 4th ed. John Wiley & Sons,N.Y., 2000.
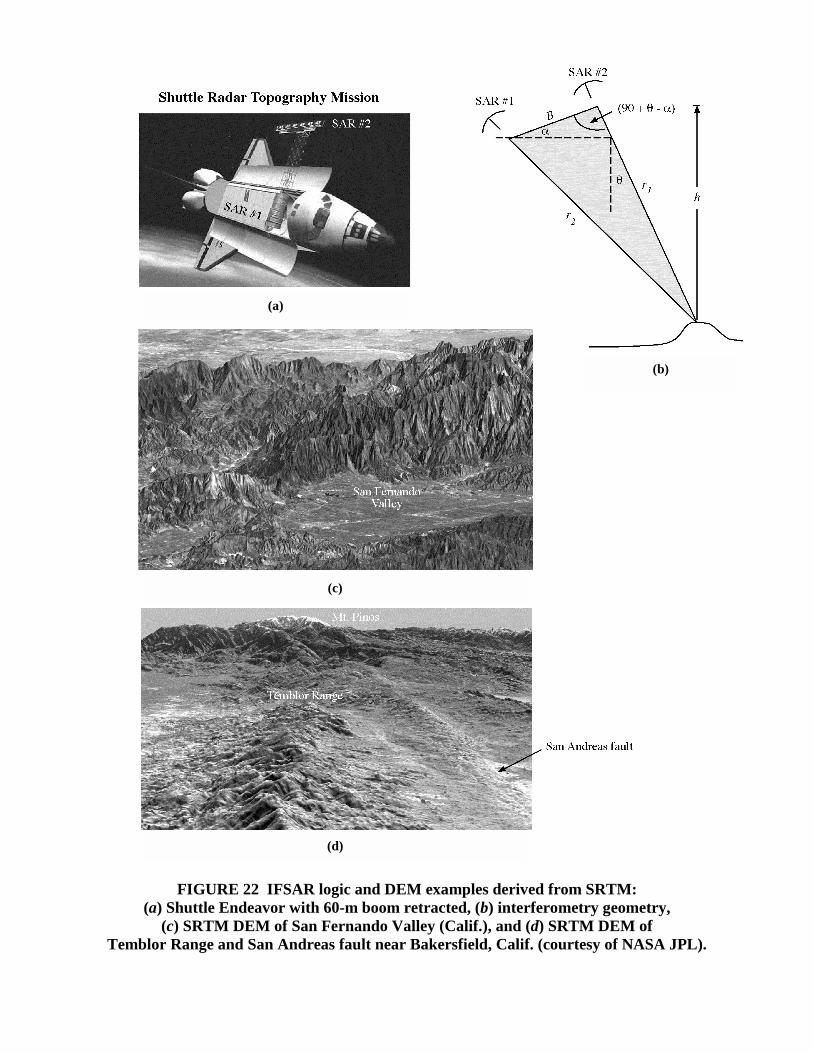
FIGURE 22 IFSAR logic and DEM examples derived from SRTM:(a) Shuttle Endeavor with 60-m boom retracted, (b) interferometry geometry,
(c) SRTM DEM of San Fernando Valley (Calif.), and (d) SRTM DEM ofTemblor Range and San Andreas fault near Bakersfield, Calif. (courtesy of NASA JPL).
(a)
(b)
(c)
(d)

Jensen 83
6. Jensen, J. R., and D. J. Cowen. Remote Sensing of Urban/Suburban Infrastructure and Socio-Economic Attributes. Photogrammetric Engineering & Remote Sensing, Vol. 65, No. 611-622, 1999.
7. Light, D. L. An Airborne Digital Imaging System. Proc., International Symposium onSpectral Sensing Research, Las Vegas, Nev., Oct. 1999.
8. Fulghum, D. A. Digital Aircraft Camera Offers Cheap, Fast Images. Aviation Week & SpaceTechnology, July 31, 2000.
9. Cowen, D. J., J. R. Jensen, C. Hendrix, M. E. Hodgson, and S. R. Schill. A GIS-Assisted RailConstruction Econometric Model That Incorporates LIDAR Data. PhotogrammetricEngineering & Remote Sensing, Vol. 66, No. 11, 2000, pp. 1323–1328.
10. Colwell, R. N. History and Place of Photographic Interpretation. In Manual of PhotographicInterpretation. American Society for Photogrammetry & Remote Sensing, Bethesda, Md.,1997, pp. 33–48.
11. Rencz, A. N. Remote Sensing for the Earth Sciences. John Wiley & Sons, N.Y., 1999.
ADDITIONAL RESOURCES
Colwell, R. N. Manual of Remote Sensing. American Society of Photogrammetry, Falls Church, Va.,1983.
Research Systems, Inc. Applying Neural Network Classification. In The Environment for VisualizingImages (ENVI), Version 3.4. Research Systems, Inc., Boulder, Colo., 2000, pp. 514–516.
Russ, J. C. The Image Processing Handbook. CRC Press, Boca Raton, Fla., 1992.


