Remote Sensing and GIS Integration for Modelling the ...
5
Journal of Coastal Research SI 39 1627 - 1631 ICS 2004 (Proceedings) Brazil ISSN 0749-0208 NOERNBERG, M. A.; LAUTERT, L. F. C.; ARAÚJO, A. D.; MARONE, E.; ANGELOTTI, R.; NETTO Jr, J. P. B.; and KRUG, L.A., 2006. Remote sensing and GIS integration for modelling the Paranaguá estuarine complex Brazil, SI 39 (Proccendigs of the 8th International Coastal Symposium), 1627 - 1631. Itajaí, SC, Brazil, ISSN 0749-0208. Before implementation hydrodynamical and ecological models in estuarine systems it is necessary a set of morphological and hydrological information at different spatial scales. The quality of this information will affect directly the model quality. A classification with three hierarchical levels was done for the Paranaguá Estuarine Complex focusing on both the morphological and hydrological characteristics. This classification allowed a physical characterization in different spatial scales, which is necessary for the watershed and coastal waters zonation, as well as the application of models, at each level. Remote sensing and GIS techniques were used to extract features from Landsat ETM such as the coastline, the upper limit of wetlands; the vegetated flooded area, composed basically of mangroves and salt marshes on upper areas; and mud flats. The top level in the hierarchy is the Paranaguá Estuarine Complex as a whole. The next level consists in a division of the system in five sections, and in the last hierarchy level seven sub-estuaries were delimited. Attributes were obtained for all the units defined in each hierarchy level, such as area, perimeter, depth (when available), water body area (without wetlands), wetlands area, tidal flat, drainage area, drainage density, hydraulic gradient and river discharge (when available). ADDITIONAL INDEX WORDS: Coastal management, estuary, coastal water zonation. ABSTRACT Remote Sensing and GIS Integration for Modelling the Paranaguá Estuarine Complex -Brazil M. A. Noernberg; L. F. C. Lautert; A. D. Araújo; E. Marone; R. Angelotti; J. P. B. Netto Jr. and L. A. Krug INTRODUCTION PARANAGUÁ The social, economic and environmental importance of estuaries is already well known. In order to protect and to make a wise use of such environments it is necessary to know their dynamical characteristics. The use of ecological and hydrodynamical models became a powerful tool to give more accurate information not only of scientific nature, but also to decision makers and for the environmental management. The hydrodynamical models usually need morphologic and hydrologic information such as fresh water input, coastline morphology, bathymetry, tides, currents and winds. When the reduction of the spatial scale is performed there is, consequently, a larger need on details and definitions of boundary regions. The use of remote sensing as a tool for studies in coastal areas is also well known. Its capability to obtain different kinds of information for a large area, at the same time, is one of the main characteristic. The diversity of applications using remote sensing in coastal studies is great, including qualitative and quantitative studies. These applications cover determination of bathymetry and coastline, studies and mapping of mangroves, water quality, chlorophyll a, sediment transport, subtidal habitats (J ., 1991; K , 1992; B 1993; T 1993; S , 1997; R , 1998; D ., 2000; R , 2002). Other useful characteristic of remote sensing is the possibility of studies about dynamic processes, thanks to the recurrence of images. These various products obtained from remote sensing, integrated with the capability of GIS spatial analysis, are important tools for the study and modelling of the estuarine and coastal environments. The main goal of this work is to establish three hierarchies levels in the physical definition allowing the watershed and coastal waters zonation, as well as the modelling, for each level. Paranaguá Estuarine Complex (PEC), located at Paraná State coast, south-eastern Brazil (48 25' W, 25 30' S), is a large interconnected subtropical estuarine system, comprising two main water bodies (L , 2000). The population is 155.000 inhabitants, who live in three main cities, many fishermen villages and country homes. The system is connected to the open sea by three tidal channels. The structural properties of the estuarine system are typical for a marine ingression environment. An extensive coastal plain surrounds the Paranaguá Estuarine Complex, reaching up to 50 km inland at the piedmont of the Serra do Mar mountain range. Mangrove swamps and marshes mainly fringe the interior of the system, while ocean exposed areas adjacent to the mouth are composed of extensive sand beaches and some rocky shores (A , 1992). The mean tidal range is 2.2 m, with a tidal prism of 1.34 km and a tidal intrusion of 12.6 km. It is a partially mixed estuary with a residence time of 3.49 days and a mean fresh water runoff up to 200 m s (M , 1995). The Paranaguá Estuarine Complex is classified in three hierarchy levels (Figure 1). The top level in the hierarchy is the Paranaguá Estuarine Complex as a whole, a coastal plain estuary and its watershed, with geographic region containing comparable landform and climate. The next level consists in a division of the system in five sections, including the main bays: Paranaguá, Antonina, Laranjeiras, Pinheiros, and a mixture section. The names of the sections follow the geographic denomination. The distal limits were determined in the zones of the shortest cross sections and the internal limits were defined at the wetlands boundaries. In the last hierarchy level, the sub-estuaries of each section were delimited considering morphological features such as embayment, and specific drainage area. A set of attributes were obtained for all the units defined in each hierarchy level (sub-estuary, section and estuarine complex), which are: area, perimeter, depth (when available), water body area (without wetlands), wetlands area (mangroves and salt marshes), mud flat, drainage area, drainage density, ENSEN HAN ABAN, ASSAN, OTHERAN AMSEY URAND YU ANA NGULO ARONE et al et al. et al. et al. et al. et al et al et al. THE ESTUARINE COMPLEX METHODS o o 3 -1 3 Centro de Estudos do Mar Universidade Federal do Paraná, Pontal do Paraná 83255-000, Brazil [email protected] Journal of Coastal Research Special Issue 39, 2006 ,
Transcript of Remote Sensing and GIS Integration for Modelling the ...
Journal of Coastal Research SI 39 1627 - 1631 ICS 2004 (Proceedings) Brazil ISSN 0749-0208
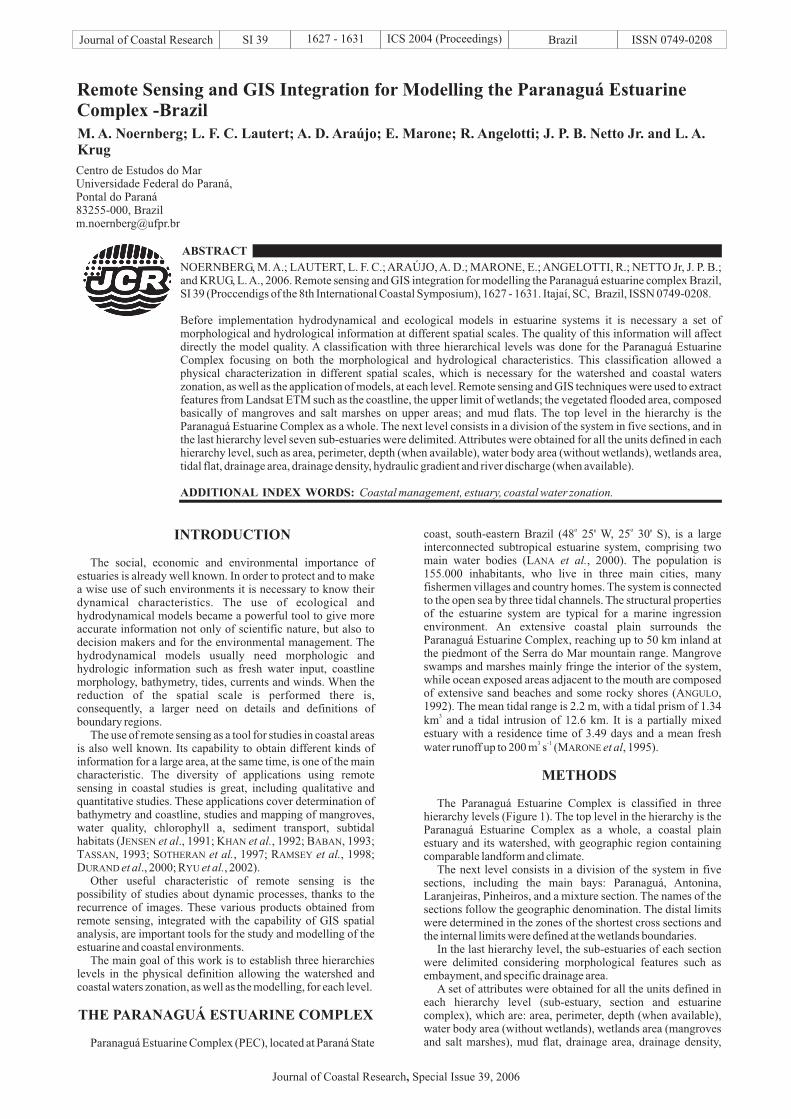
NOERNBERG, M. A.; LAUTERT, L. F. C.; ARAÚJO, A. D.; MARONE, E.; ANGELOTTI, R.; NETTO Jr, J. P. B.;and KRUG, L.A., 2006. Remote sensing and GIS integration for modelling the Paranaguá estuarine complex Brazil,SI 39 (Proccendigs of the 8th International Coastal Symposium), 1627 - 1631. Itajaí, SC, Brazil, ISSN 0749-0208.
Before implementation hydrodynamical and ecological models in estuarine systems it is necessary a set ofmorphological and hydrological information at different spatial scales. The quality of this information will affectdirectly the model quality. A classification with three hierarchical levels was done for the Paranaguá EstuarineComplex focusing on both the morphological and hydrological characteristics. This classification allowed aphysical characterization in different spatial scales, which is necessary for the watershed and coastal waterszonation, as well as the application of models, at each level. Remote sensing and GIS techniques were used to extractfeatures from Landsat ETM such as the coastline, the upper limit of wetlands; the vegetated flooded area, composedbasically of mangroves and salt marshes on upper areas; and mud flats. The top level in the hierarchy is theParanaguá Estuarine Complex as a whole. The next level consists in a division of the system in five sections, and inthe last hierarchy level seven sub-estuaries were delimited. Attributes were obtained for all the units defined in eachhierarchy level, such as area, perimeter, depth (when available), water body area (without wetlands), wetlands area,tidal flat, drainage area, drainage density, hydraulic gradient and river discharge (when available).
ADDITIONAL INDEX WORDS: Coastal management, estuary, coastal water zonation.
ABSTRACT
Remote Sensing and GIS Integration for Modelling the Paranaguá EstuarineComplex -BrazilM. A. Noernberg; L. F. C. Lautert; A. D. Araújo; E. Marone; R. Angelotti; J. P. B. Netto Jr. and L. A.Krug
INTRODUCTION
PARANAGUÁ
The social, economic and environmental importance ofestuaries is already well known. In order to protect and to makea wise use of such environments it is necessary to know theirdynamical characteristics. The use of ecological andhydrodynamical models became a powerful tool to give moreaccurate information not only of scientific nature, but also todecision makers and for the environmental management. Thehydrodynamical models usually need morphologic andhydrologic information such as fresh water input, coastlinemorphology, bathymetry, tides, currents and winds. When thereduction of the spatial scale is performed there is,consequently, a larger need on details and definitions ofboundary regions.
The use of remote sensing as a tool for studies in coastal areasis also well known. Its capability to obtain different kinds ofinformation for a large area, at the same time, is one of the maincharacteristic. The diversity of applications using remotesensing in coastal studies is great, including qualitative andquantitative studies. These applications cover determination ofbathymetry and coastline, studies and mapping of mangroves,water quality, chlorophyll a, sediment transport, subtidalhabitats (J ., 1991; K , 1992; B 1993;T 1993; S , 1997; R , 1998;D ., 2000; R , 2002).
Other useful characteristic of remote sensing is thepossibility of studies about dynamic processes, thanks to therecurrence of images. These various products obtained fromremote sensing, integrated with the capability of GIS spatialanalysis, are important tools for the study and modelling of theestuarine and coastal environments.
The main goal of this work is to establish three hierarchieslevels in the physical definition allowing the watershed andcoastal waters zonation, as well as the modelling, for each level.
Paranaguá Estuarine Complex (PEC), located at Paraná State
coast, south-eastern Brazil (48 25' W, 25 30' S), is a largeinterconnected subtropical estuarine system, comprising twomain water bodies (L , 2000). The population is155.000 inhabitants, who live in three main cities, manyfishermen villages and country homes. The system is connectedto the open sea by three tidal channels. The structural propertiesof the estuarine system are typical for a marine ingressionenvironment. An extensive coastal plain surrounds theParanaguá Estuarine Complex, reaching up to 50 km inland atthe piedmont of the Serra do Mar mountain range. Mangroveswamps and marshes mainly fringe the interior of the system,while ocean exposed areas adjacent to the mouth are composedof extensive sand beaches and some rocky shores (A ,1992). The mean tidal range is 2.2 m, with a tidal prism of 1.34km and a tidal intrusion of 12.6 km. It is a partially mixedestuary with a residence time of 3.49 days and a mean freshwater runoff up to 200 m s (M , 1995).
The Paranaguá Estuarine Complex is classified in threehierarchy levels (Figure 1). The top level in the hierarchy is theParanaguá Estuarine Complex as a whole, a coastal plainestuary and its watershed, with geographic region containingcomparable landform and climate.
The next level consists in a division of the system in fivesections, including the main bays: Paranaguá, Antonina,Laranjeiras, Pinheiros, and a mixture section. The names of thesections follow the geographic denomination. The distal limitswere determined in the zones of the shortest cross sections andthe internal limits were defined at the wetlands boundaries.
In the last hierarchy level, the sub-estuaries of each sectionwere delimited considering morphological features such asembayment, and specific drainage area.
A set of attributes were obtained for all the units defined ineach hierarchy level (sub-estuary, section and estuarinecomplex), which are: area, perimeter, depth (when available),water body area (without wetlands), wetlands area (mangrovesand salt marshes), mud flat, drainage area, drainage density,
ENSEN HAN ABAN,ASSAN, OTHERAN AMSEY
URAND YU
ANA
NGULO
ARONE
et al et al.et al. et al.
et al.
et al
et al et al.
THE ESTUARINE COMPLEX
METHODS
o o
3 -1
3
Centro de Estudos do MarUniversidade Federal do Paraná,Pontal do Paraná83255-000, [email protected]
Journal of Coastal Research Special Issue 39, 2006,

hydraulic gradient and river discharge (when available).
The Landsat Image Processing
RESULTS
The morphological boundaries which present variations indistinct time scale were extracted from Landsat ETM+ imageacquired in september/1999. The extracted features were: i) thecoastline, considered as the upper limit of wetlands; ii) thevegetated flooded area, composed basically of mangroves andsalt marshes on upper areas; and iii) mud flats. Each of thesemorphologic boundaries was obtained using a specific Landsatimage channels composition. The different compositionsallowed the enhancement of specific features, mainly theboundary between the specific feature and its neighborhood.However, the method for boundaries delimitation comprisedthe same: threshold, binary and vector transformation. Theimage processing software used was the Er-Mapper and theSpans program for GIS.
For the upper limit of wetlands extraction the channelscomposition used was the Landsat band 5 in the red channel, theNormalized Difference Vegetation Index (NDVI) in the greenand the first principal components (PC1) of the Landsat bands 1,2, 3, 4, 5 e 7 on the blue channel. With this composition the tidalinundation area of the basin was enhanced as well as itsboundaries.
The mud flat areas were extracted using only the firstprincipal components (PC1). The histogram image resultantwas a bimodal shape, each one representing the water and land
portions respectively. A linear stretch was applied for the waterportion, enhancing the tidal flats areas.
These boundaries, extracted from Landsat images, wereintegrated in a previous GIS database (N ,1997).
The attributes obtained for top level in the hierarchy, theParanaguá Estuarine Complex (PEC) as a whole, are: watershedarea 3870 km , water body (without wetlands) 551.8 km ,vegetated flooded area 295.5 km , drainage density 1.12rivers/km and tidal flat area 136 km , this tidal flat arearepresents 24.6% of the water body area.
The results for the sections and sub-estuaries levels areshowed in Tables 1 and 2, respectively. The sections withbiggest drainage area are Antonina and Laranjeiras,consequently in this sections there exists the higher number ofsub-estuaries. The higher proportion between wetlands andwater body is found in Antonina section followed by Pinheirosand Laranjeiras, respectively. The smallest relative tidal flatareas are found in Mixture and Paranaguá sections.
The sub-estuaries with biggest drainage area are Antoninaand Benito, although the highest drainage densities are found inGuaraqueçaba and Benito. The sub-estuaries with highestproportions between wetlands and water body are, respectively,Nhundiaquara, Cachoeira and Medeiros. The smallest relative
OERNBERG et al.
2 2
2
2 2
Noernberg et al.
Figure 1. The Paranaguá Estuarine Complex divided in sectors (1, 2, 3, 4 and 5) and sub-estuaries (6, 7, 8, 9, 10, 11 and 12). 1-Mixture; 2-Paranaguá; 3- Antonina; 4- Laranjeiras; 5- Pinheiros; 6- Cotinga; 7- Nhundiaquara; 8- Cachoeira; 9- Medeiros; 10- Itaqui;11- Benito and 12- Guaraqueçaba.
Journal of Coastal Research Special Issue 39, 2006,
1628
Table 1. Sections morphological and hydrological characteristics. (DA- drainage area; DD- drainage density; WLD- wetlands area;WBA- water body area; TFA- tidal flat area, RTFA- relative tidal flat area and MD maximum depth).
SECTION DA DD WLD WBA TFA RTFA MD
Antonina 1513.4 1.69 67.2 48.07 14.4 30.0 12.1Paranaguá 222.9 0.06 21.6 83.97 16.5 19.6 23.0Laranjeiras 1462.1 2.06 99.7 159.65 57.4 36.0 11.2
Mixture 474.5 0.50 47.7 175.96 27.0 15.3 30.2Pinheiros 272.6 1.56 50.4 56.48 20.7 36.7 17.5
km river/km km km km % m2 2 2 2 2
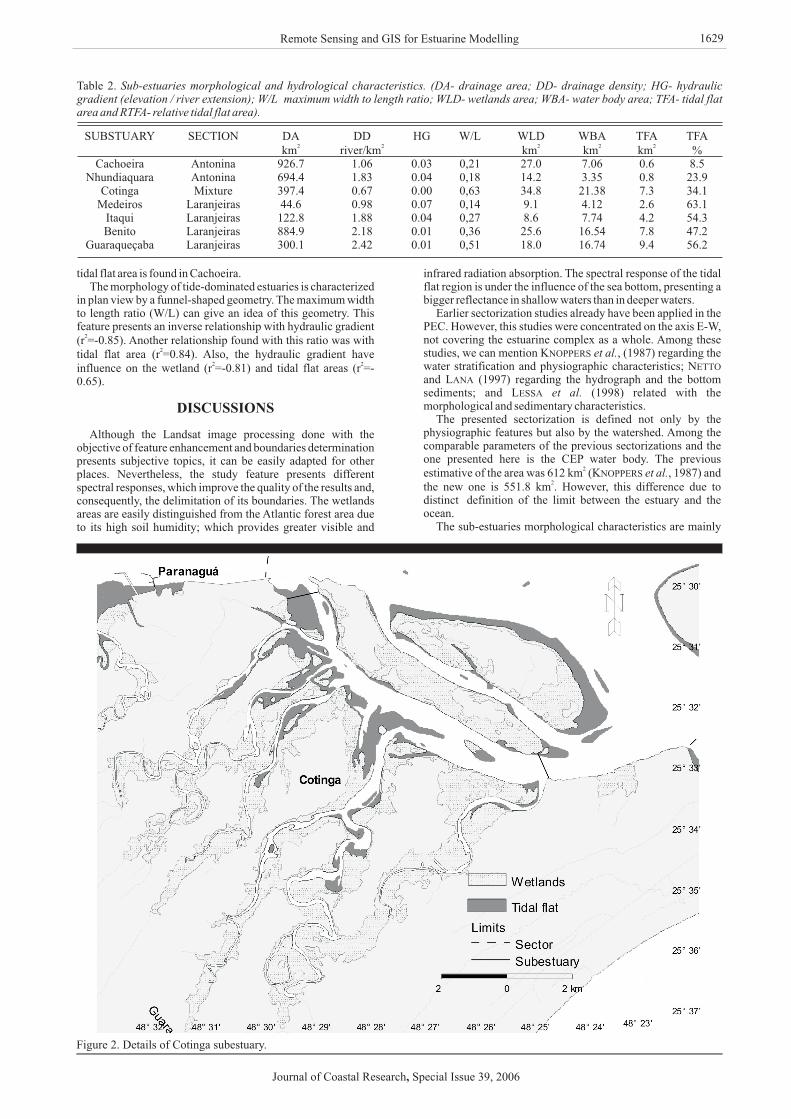
tidal flat area is found in Cachoeira.The morphology of tide-dominated estuaries is characterized
in plan view by a funnel-shaped geometry. The maximum widthto length ratio (W/L) can give an idea of this geometry. Thisfeature presents an inverse relationship with hydraulic gradient(r =-0.85). Another relationship found with this ratio was withtidal flat area (r =0.84). Also, the hydraulic gradient haveinfluence on the wetland (r =-0.81) and tidal flat areas (r =-0.65).
Although the Landsat image processing done with theobjective of feature enhancement and boundaries determinationpresents subjective topics, it can be easily adapted for otherplaces. Nevertheless, the study feature presents differentspectral responses, which improve the quality of the results and,consequently, the delimitation of its boundaries. The wetlandsareas are easily distinguished from the Atlantic forest area dueto its high soil humidity; which provides greater visible and
infrared radiation absorption. The spectral response of the tidalflat region is under the influence of the sea bottom, presenting abigger reflectance in shallow waters than in deeper waters.
Earlier sectorization studies already have been applied in thePEC. However, this studies were concentrated on the axis E-W,not covering the estuarine complex as a whole. Among thesestudies, we can mention K , (1987) regarding thewater stratification and physiographic characteristics; Nand L (1997) regarding the hydrograph and the bottomsediments; and L (1998) related with themorphological and sedimentary characteristics.
The presented sectorization is defined not only by thephysiographic features but also by the watershed. Among thecomparable parameters of the previous sectorizations and theone presented here is the CEP water body. The previousestimative of the area was 612 km (K , 1987) andthe new one is 551.8 km . However, this difference due todistinct definition of the limit between the estuary and theocean.
The sub-estuaries morphological characteristics are mainly
2
2
2 2
2
2
DISCUSSIONS
NOPPERS
ETTO
ANA
ESSA
NOPPERS
et al.
et al.
et al.
Figure 2. Details of Cotinga subestuary.
Remote Sensing and GIS for Estuarine Modelling
Journal of Coastal Research Special Issue 39, 2006,
1629
Table 2. Sub-estuaries morphological and hydrological characteristics. (DA- drainage area; DD- drainage density; HG- hydraulicgradient (elevation / river extension); W/L maximum width to length ratio; WLD- wetlands area; WBA- water body area; TFA- tidal flatarea and RTFA- relative tidal flat area).
SUBSTUARY SECTION DAkm river/km km km km %
Cachoeira Antonina 926.7 1.06 0.03 0,21 27.0 7.06 0.6 8.5Nhundiaquara Antonina 694.4 1.83 0.04 0,18 14.2 3.35 0.8 23.9
Cotinga Mixture 397.4 0.67 0.00 0,63 34.8 21.38 7.3 34.1Medeiros Laranjeiras 44.6 0.98 0.07 0,14 9.1 4.12 2.6 63.1
Itaqui Laranjeiras 122.8 1.88 0.04 0,27 8.6 7.74 4.2 54.3Benito Laranjeiras 884.9 2.18 0.01 0,36 25.6 16.54 7.8 47.2
Guaraqueçaba Laranjeiras 300.1 2.42 0.01 0,51 18.0 16.74 9.4 56.2
DD HG W/L WLD WBA TFA TFA2 2 2 2 2

dominated by tidal range and drainage area energy (hydraulicgradient). This can be observed by the occurrence of tidal sand(mud) ridges elongated parallel to bidirecional currents and bythe smallest relationship width to length ratio on sub-estuarieswith high hydraulic gradient. These sub-estuaries with highhydraulic gradient also have bigger tidal flat and wetlands areas.
A distinct morphologic pattern is observed on Cotinga sub-estuary. It does not present the funnel-shaped tide dominatedestuary characteristic. This sub-estuary is composed by manymeandering creeks with extensive wetlands areas. This occursdue to the large coastal plain where the main river flow andpresent almost null hydraulic gradient. Because the Cotingasub-estuary is to close to the PEC outlet its tidal range is smallerthan that of the sub-estuaries located at the inner part of PEC.This occurs for sub-estuaries located on E-W (Figure 3) axis aswell as on S-N axis (Figure 4). This effect is due to shallowwaters and, also, the narrowing estuaries which can increase thetidal range to circa 2.7 meters on spring tides, whereas on theoutlet it reaches 1.5 m (M , 1995).
The sectorization also allowed a synoptic view of the actualPEC knowledge level. There is a marked difference in theknowledge level among the different sectors and sub-estuaries.
The sectors with more number of environmental informationare Antonina, Paranaguá and Mixture, all located on E-W axis.In these sectors there are a good number of nutrients, salinity,water quality, river discharge, currents, bottom sediments andbiota surveys. On the contrary, sectors Laranjeiras andPinheiros are less studied. For some places of Laranjeiras sectorthere are information about salinity, currents, bottom sedimentsand biota. However, the Medeiros, Itaqui and Benito sub-estuaries have few numbers of studies. The Pinheiros bay is thesector with the smallest number of information with fewsurveys of salinity, chlorophyll-a e zooplankton.
The identification of this information gaps is important toknow how consistent is the estuarine water zonation on thePEC, as well as the hydrodynamic models implementation. Inthis way, we can consider the lack of river discharge data themost critical point, since consistent rivers discharge data areonly available for Cachoeira e Nhundiaquara sub-estuaries.There are other parameters that need surveys, such as:bathymetry, salinity and temperature time series, nutrients andcurrents.
With the actual level of information it is possible to runhydrodynamical models for the different hierarchical levels.Some of the future steps are to integrate in the GIS thedynamical variability of water constituents (salinity,temperature, total suspended particulate matter, chlorophyll a,etc.).
The authors are grateful to the cooperation APPA-CEM(Administração dos Portos de Paranaguá e Antonina Centro deEstudos do Mar) for the concession of grants and support.
R.J., 1992. Geologia da planície costeira do Estado doParaná. São Paulo, Brazil: Instituto de Geociências,Universidade de São Paulo, Ph. D. Thesis, 332 p.
D.; J. and F., 2000. Opticalremote sensing of shallow-water environmental parameter:a feasibility study. Remote Sensing of Environment, 73,152-161.
J.R.; ,B.A., and C.W., 1991. The measurement ofmangrove characteristics in southwest Florida using SPOTmultiespectral data. Geocarto, 2, 13-21.
C. A., 1987.Ecological studies in the bay of Paranaguá. Some physicaland chemical caracteristics. Nerítica, 2, 1-36.
P. C. and , E. C.,2000. The subtropical estuarine complex of Paranaguá Bay,Brazil. In: . and B.Coastal marine ecosystems of Latin America. SpringerVerlag, Berlin, pp. 131-145.
and E., 1998. Holocenestratigraphy in the Paranaguá Bay estuary, Southern Brazil.Journal of Sedimentary Research, 68(6), 1060-1076.
M.A.; Y.H. and K.G., 1992.Thematic mapping of subtidal coastal habitats in the westernArabian Gulf using Landsat TM data, Abu Ali Bay, SaudiArabia. International Journal of Remote Sensing, 13(4),605-614.
, M. R.; V. P.;M. S.; R., 1995. Caracterização
Física das Condições Oceanográficas, Meteorológicas e
ARONE
ANGULO,
DURAND, BIJAOUI, CAUNEAU,
JENSEN, LIN, H.; YANG, X.; RAMSEY E.W.; DAVISTHOEMKE,
KNOPPERS, B. A.; BRANDINI, F. P.; THAMM,
LANA, ; MARONE, E.; LOPES, R. M. MACHADO
SEELIGER, U.; LACERDA, L. D KJERFVE,
LESSA, G. C.; MEYERS, S. R. MARONE,
KHAN, FADLALLAH, AL-HINAI,
MARONE, E.; GUIMARÃ ES PRATA JR.,KLINGENFUSS, CAMARGO,
et al.
ACKNOWLEDGEMENTS
LITERATURE CITED
III,
Noernberg et al.
Figure 3. Details of Nhundiaquara and Cachoeira sub-estuaries.
Figure 4. Details of Medeiros, Benito, Itaqui and Guaraqueçabasub-estuaries.
Journal of Coastal Research Special Issue 39, 2006,
1630
Remote Sensing and GIS for Estuarine Modelling
Costeiras das Zonas Estuarinas da Baía de Paranaguá, PR.VI Congresso Latinoamericano de Ciencias del Mar.Argentina.
M.A.; L.F.C.; A.D.;L.L., 1997. Base de dados digital do litoral
paranaense em sistema de informações geográficas.Nerítica, 11, 191-195.
S. A. and P. C., 1997. Influence of Spartinaalterniflora on superficial sediment characteristics of tidalflats in Paranaguá Bay (South-eastern Brazil). Estuarine,Coastal and Shelf Science, 44, 641-648.
III, E.W.; G.A. and S.K., 1998.Classifying coastal resources by integrating optical and
radar imagery and color infrared photography. Mangrovesand Salt Marshes, 2, 109-119.
I.S.; R.L., and J., 1997.Mapping of marine benthic habitats using image processingtechniques within a raster-based geographic informationsystem. Estuarine, Coastal and Shelf Science, 44(A), 25-31.
, K.D., 2002. Waterline extraction fromLandsat TM data in a tidal flat, a case study in Gomso Bay,Korea. Remote Sensing of Environment, 83, 442-456.
S., 1993. An improved in-water algorithm for thedetermination of chlorophyll and suspended sedimentconcentration from thematic mapper data in coastal waters.International Journal of Remote Sensing, 14(6), 1221-1229.
NOERNBERG, LAUTERT, ARAÚ JO,ODRESKY,
NETTO, LANA,
RAMSEY NELSON, SAPKOTA,
SOTHERAN, FOSTER-SMITH, DAVIES,
RYU, J.; WON, J.; MIN
TASSAN,
Journal of Coastal Research Special Issue 39, 2006,
1631