REMOTE SENSING AND GIS CONTRIBUTION TO EARTHQUAKE DISASTER
6
REMOTE SENSING AND GIS CONTRIBUTION TO EARTHQUAKE DISASTER PREPAREDNESS IN HUNGARY B.Theilen-Willige a , H. Wenzel b a Berlin University of Technology (TU Berlin), Institute of Applied Geosciences, 13355 Berlin, Germany - [email protected] b VCE Holding GmbH, Hadikgasse 60, 1140 Vienna, Austria, [email protected] KEY WORDS: Earthquake Hazard, GIS, Remote Sensing, Disaster Preparedness, Hungary ABSTRACT: When catastrophic earthquakes happen and affect cities and settlements, immediate and efficient actions are required which ensure the minimization of the damage and loss of human lives. Responding local and national authorities should be provided in advance with information and maps where the highest damages due to unfavourable, local site conditions and earthquake related secondary effects such as landslides, liquefaction, soil amplifications or compaction can be assumed. There is a strong need to improve the systematic, standardized inventory of those areas. As a prerequisite for such a planning base a uniform data base with a common set of strategies, standards and formats should be implemented. The evaluation of satellite imageries, digital topographic data and of open-source geo-data can contribute to the acquisition of the specific tectonic, geologic and geomorphologic settings influencing local site conditions and, thus, to a first data base stock facilitating the planning of further geotechnical investigations. This is demonstrated by the example of Central-Hungary. RapidEye- and GeoEye-satellite data form an important part of this data base being a valuable tool for the detection of traces of tectonic features and of slope failure. Another important aspect for the emergency preparedness and damage loss estimations is the actual inventory of land use and infrastructure, of industrial facilities and of settlements and cities considering age, structure, type and function of buildings. Data for hospitals and health centres, schools, governmental buildings, police, fire stations and industrial buildings from Central-Hungary were stored in a GIS, as well as geological maps, earthquake and seismotectonic data. 1. INTRODUCTION Europe is experiencing an increasing number and impact of disasters due to natural hazards and technological accidents caused by a combination of changes in its physical, technological and human/ social systems. This study is embedded into the EU-funded IRIS- project (Integrated European Industrial Risk Reduction System) led and driven by the industry to consolidate and generate knowledge and technologies which enable the integration of new safety concepts related to technical, human, organizational and cultural aspects. The concept of IRIS is to focus on diverse industrial sector’s main safety problems as well as to transform its specific requirements into integrated and knowledge-based safety technologies, standards and services. Industrial accidents triggered by natural events, such as e.g. earthquakes, floods, lightning etc., are referred to as “Natech” accidents. Natech accidents have occurred in relation to natural hazards and disasters and have resulted in the release of hazardous substances leading to fatalities, injuries, environmental pollution and economic losses (Krausmann et al., 2011). One of the principal problems of most Natech accidents is the simultaneous occurrence of a natural disaster and a technological accident, both of which require simultaneous response efforts in a situation in which lifelines needed for disaster mitigation are likely to be unavailable. The catastrophic events in March 2011 in Japan have demonstrated this case. Natech risk differs from technological or natural risk as its multi-hazard nature requires an integrated approach to risk management. Meanwhile natural disaster geoinformation systems have been implemented in nearly all European countries, however, still with different standards and definitions, terminology, data bases and details, in spite of the ongoing European INSPIRE activities. Therefore the compatibility of data and information is one of the major problems. The consideration of property rights of data is another obstacle for the international use and data exchange. The assessment of potential natural hazards, however, is fundamental for planning purposes and disaster preparedness, especially with regard to supervision and maintenance of industrial facilities and of extended lifelines. Hence it is imperative to identify those areas most susceptible to different types of natural hazards as earthquakes, landslides, flooding, tsunamis or storms. Earthquake hazard zonation is the first and most important step towards a seismic risk analysis and mitigation strategy. Therefore, it is clearly crucial to identify the areas most vulnerable to earthquake occurrence, where the adoption of mitigation measurements is more urgent. 1.1. Local Site Conditions As a prerequisite for earthquake preparedness a detailed inventory of sites more susceptible to earthquake damage and to earthquake related secondary effects due to local site conditions has to be carried out (Yong et al, 2008). The variability in earthquake-induced damage is mainly determined by the local lithological properties, thickness of the soil and lithologic unit layer, by hydrogeological and by geomorphological conditions. It has been observed that at many sites surface motions are influenced primarily by top 20-30 m of the sub-surface. These conditions, intern influence the amplitude, the frequency and duration of ground motion at a site. Local site conditions play an important role when considering earthquake shaking and damage intensities and their local variations: The ground- shaking during an earthquake predominantly depends on factors such as the magnitude, properties of fault plane solutions, the distance from the fault and local geologic conditions. The most intense shaking experienced during earthquakes generally occurs near the rupturing fault area, and decreases with distance away from the fault. Within a single earthquake event, however, the shaking at one site can easily be stronger than at another site, even when their distance from the ruptured fault is the same. Groundwater level variations and associated saturation changes in sand layers within near-surface aquifers can influence local response spectra of the ground motion, through modification of shear-wave velocity (Hannich et al., 2006). Changes of the groundwater level can also have a considerable influence upon the liquefaction potential of a region due to in-situ pore-water pressure responses in aquifers during earthquakes triggering mechanism of liquefaction. Liquefaction that affects the human- built environments is mostly limited to the upper 15 meters of soil. In order to further reduce the impact of earthquakes, it will
Transcript of REMOTE SENSING AND GIS CONTRIBUTION TO EARTHQUAKE DISASTER

REMOTE SENSING AND GIS CONTRIBUTION TO EARTHQUAKE
DISASTER PREPAREDNESS IN HUNGARY
B.Theilen-Willige a, H. Wenzel b
a Berlin University of Technology (TU Berlin), Institute of Applied Geosciences, 13355 Berlin, Germany -
[email protected] b VCE Holding GmbH, Hadikgasse 60, 1140 Vienna, Austria,
[email protected] KEY WORDS: Earthquake Hazard, GIS, Remote Sensing,
Disaster Preparedness, Hungary ABSTRACT: When catastrophic earthquakes happen and affect cities and settlements, immediate and efficient actions are required which ensure the minimization of the damage and loss of human lives. Responding local and national authorities should be provided in advance with information and maps where the highest damages due to unfavourable, local site conditions and earthquake related secondary effects such as landslides, liquefaction, soil amplifications or compaction can be assumed. There is a strong need to improve the systematic, standardized inventory of those areas. As a prerequisite for such a planning base a uniform data base with a common set of strategies, standards and formats should be implemented. The evaluation of satellite imageries, digital topographic data and of open-source geo-data can contribute to the acquisition of the specific tectonic, geologic and geomorphologic settings influencing local site conditions and, thus, to a first data base stock facilitating the planning of further geotechnical investigations. This is demonstrated by the example of Central-Hungary. RapidEye- and GeoEye-satellite data form an important part of this data base being a valuable tool for the detection of traces of tectonic features and of slope failure. Another important aspect for the emergency preparedness and damage loss estimations is the actual inventory of land use and infrastructure, of industrial facilities and of settlements and cities considering age, structure, type and function of buildings. Data for hospitals and health centres, schools, governmental buildings, police, fire stations and industrial buildings from Central-Hungary were stored in a GIS, as well as geological maps, earthquake and seismotectonic data.
1. INTRODUCTION
Europe is experiencing an increasing number and impact of disasters due to natural hazards and technological accidents caused by a combination of changes in its physical, technological and human/ social systems. This study is embedded into the EU-funded IRIS- project (Integrated European Industrial Risk Reduction System) led and driven by the industry to consolidate and generate knowledge and technologies which enable the integration of new safety concepts related to technical, human, organizational and cultural aspects. The concept of IRIS is to focus on diverse industrial sector’s main safety problems as well as to transform its specific requirements into integrated and knowledge-based safety technologies, standards and services. Industrial accidents triggered by natural events, such as e.g. earthquakes, floods, lightning etc., are referred to as “Natech” accidents. Natech accidents have occurred in relation to natural
hazards and disasters and have resulted in the release of hazardous substances leading to fatalities, injuries, environmental pollution and economic losses (Krausmann et al., 2011). One of the principal problems of most Natech accidents is the simultaneous occurrence of a natural disaster and a technological accident, both of which require simultaneous response efforts in a situation in which lifelines needed for disaster mitigation are likely to be unavailable. The catastrophic events in March 2011 in Japan have demonstrated this case. Natech risk differs from technological or natural risk as its multi-hazard nature requires an integrated approach to risk management. Meanwhile natural disaster geoinformation systems have been implemented in nearly all European countries, however, still with different standards and definitions, terminology, data bases and details, in spite of the ongoing European INSPIRE activities. Therefore the compatibility of data and information is one of the major problems. The consideration of property rights of data is another obstacle for the international use and data exchange. The assessment of potential natural hazards, however, is fundamental for planning purposes and disaster preparedness, especially with regard to supervision and maintenance of industrial facilities and of extended lifelines. Hence it is imperative to identify those areas most susceptible to different types of natural hazards as earthquakes, landslides, flooding, tsunamis or storms. Earthquake hazard zonation is the first and most important step towards a seismic risk analysis and mitigation strategy. Therefore, it is clearly crucial to identify the areas most vulnerable to earthquake occurrence, where the adoption of mitigation measurements is more urgent.
1.1. Local Site Conditions
As a prerequisite for earthquake preparedness a detailed inventory of sites more susceptible to earthquake damage and to earthquake related secondary effects due to local site conditions has to be carried out (Yong et al, 2008). The variability in earthquake-induced damage is mainly determined by the local lithological properties, thickness of the soil and lithologic unit layer, by hydrogeological and by geomorphological conditions. It has been observed that at many sites surface motions are influenced primarily by top 20-30 m of the sub-surface. These conditions, intern influence the amplitude, the frequency and duration of ground motion at a site. Local site conditions play an important role when considering earthquake shaking and damage intensities and their local variations: The ground-shaking during an earthquake predominantly depends on factors such as the magnitude, properties of fault plane solutions, the distance from the fault and local geologic conditions. The most intense shaking experienced during earthquakes generally occurs near the rupturing fault area, and decreases with distance away from the fault. Within a single earthquake event, however, the shaking at one site can easily be stronger than at another site, even when their distance from the ruptured fault is the same. Groundwater level variations and associated saturation changes in sand layers within near-surface aquifers can influence local response spectra of the ground motion, through modification of shear-wave velocity (Hannich et al., 2006). Changes of the groundwater level can also have a considerable influence upon the liquefaction potential of a region due to in-situ pore-water pressure responses in aquifers during earthquakes triggering mechanism of liquefaction. Liquefaction that affects the human-built environments is mostly limited to the upper 15 meters of soil. In order to further reduce the impact of earthquakes, it will
also be crucial to fill the gaps between seismic micro-zonation, macroseismic observations, seismotectonic research and building codes to secure improved safety for buildings. Further on, information of long-term information of geodynamic processes (uplift, subsidence, horizontal movements) are a basic need for the safety of cities, settlements, infrastructure and industrial facilities.
1.2. Seismicity in Hungary
Seismicity in Hungary is relatively low comparing to the adjacent areas (Toth et al., 2009). However, magnitude 6.0-6.5 earthquakes are documented. Fig.1 shows the distribution of earthquake epicentres in Central-Hungary. As cities and settlements, infrastructural facilities and numerous industrial plants are concentrated along the Danube river, where earthquakes Ml>4 are documented, the necessity of earthquake awareness and preparedness is evident. Earthquake hazards in Hungary mainly occur due to ground shaking, to soil amplification because of local site conditions, to liquefaction and compaction, and due to landslides. Aseismic (creeping) movements along active fault zones and horizontal and vertical movements in the subsurface are an often underestimated risk causing long-term damages in the infrastructure (sewage, piping, bridges, etc.).
Figure 1. Seismicity in Hungary based on Earthquake data of
Geophysical surveys (see References)
2. METHODS
A prerequisite for emergency preparedness is the collection, georeferencing and storage of available maps and data in a GIS environment in order to get a reference data base. Spatial data layers come from various sources such as topographic maps and thematic maps (soil maps, geologic and hydrogeologic maps, land use etc.) and field survey. Past hazards have to be included into the data base such as landslides or flooding events. Earthquake data of different international geophysical institutions and surveys were gathered from Hungary and stored into the GIS databank. (The earthquake data were converted into point-shapefiles and integrated into the GIS.) Macroseismic maps gathering local observations during earthquakes were evaluated. GIS integrated remote sensing data and geodata analysis can be used to visualize factors that are related to the occurrence of higher earthquake shock and / or earthquake induced secondary effects: factors such as lithology (loose, unconsolidated sedimentary covers) in basins and valleys linked with higher groundwater tables, faults, or steeper slopes (susceptible to landslides).
2.1. Evaluations of Digital Elevation Model Data (DEM)
To automatically identify the landform types that affect site conditions, the relief elements are grouped into terrain features. Terrain features can be described and categorized into simple topographic relief elements or units by parameterizing DEMs such as height levels, slope gradients, and terrain curvature. From SRTM and ASTER DEM (Digital Elevation Model) data derived morphometric maps (slope gradient maps, drainage, etc.) are combined with lithologic and seisomotectonic information in a GIS data base (Theilen-Willige, 2009). When searching for areas susceptible to soil amplification, liquefaction or compaction the so called causative or preparatory factors have to be taken into account. Some of the causal factors can be determined systematically: From slope gradient maps are extracted those areas with the steepest slopes, and from curvature maps the areas with the highest curvature as these are more susceptible to landslides. Height level maps help to search for topographic depressions covered of almost recently formed sediments, which are usually linked with higher groundwater tables. In case of stronger earthquakes those areas often show the highest earthquake damage intensities. From ASTER DEM data of the investigation areas the flat areas with no curvatures of the terrain and low to no slope gradients and the lowest areas are extracted. From geologic and hydro-geologic maps the youngest, unconsolidated sediments are mapped and converted to ESRI-Grid-format as higher earthquake damages have been documented related to these sediments. An important step towards susceptibility mapping is the weighted overlay method in ArcGIS as the influence of the factors on earthquake ground motion is not equally important in the analysis. According to the local specific conditions and, thus, varying influence these factors are weightened (in %). The percentage of influence of one factor might be changing, for example due to seasonal and climatic reasons, or distance to the earthquake source. As a stronger earthquake during a wet season will probably cause more secondary effects than during a dry season, the percentage of its influence has to be adapted. In very hot and dry seasons the risk of liquefaction or landslides is generally lower than in spring times. The sum over all causal factors / layers that can be included into GIS provides some information of the susceptibility to amplify seismic signals. After weightening (in %) the factors according to their probable influence on ground shaking, susceptibility maps were elaborated, where those areas are considered as being more susceptible to higher earthquake shock intensities, where “negative” factors occur aggregated. Whenever an earthquake happens in these areas, now it can be derived better where the “islands” of higher ground shaking are most likely to occur by adding the specific information of the earthquake to the susceptibility map approach. An example is shown in Fig.2 comparing macroseismic observations with the susceptibility map according to the weighted overlay-approach. Of course further data have to be included whenever available, such as movements along active faults, focal planes, uplift / subsidence, 3D structure, lithologic properties and thickness of lithologic units, shear wave velocities, etc.. The analysis method and integration rules can easily be modified in the GIS architecture as soon as additional information becomes available. 2.2. Digital Image Processing of LANDSAT, RapidEye- and IKONOS-Satellite Data
RapidEye-, IKONOS- and LANDSAT-data were used as a further basic layer in the earthquake GIS, such as for the

Figure 2. Weighted overlay of causal factors influencing local site conditions (dark-red: higher susceptibility to soil amplifi-cation) combined with a macroseismic map (earthquake: 25.11.2009) elaboration of actual land use maps. Some data layers, such as land use and forests, are dynamic in nature and need to be updated frequently. For disaster preparedness the almost detailed detection and documentation of settlements, infrastructure, industrial facilities, etc., that might be exposed to earthquake and other hazards, especially their different exposures to soil amplification, landslides or active tectonic processes is necessary. Based on actual RapidEye satellite data different RGB combinations of the different bands were tested. The RapidEye-image mosaics were resized from 5m to 1 m pixel size in order to enhance the visibility of details such as houses or streets. Low pass and high pass filters and directional variations were used for the detection of subtle surface structures such as meanders or landslides. Merging the image products derived from “Morphologic Convolution” image processing in ENVI software with RGB imageries, the evaluation feasibilities were improved. Vegetation Index (NDVI)-imageries were used to detect linear anomalies that might be related to subsurface structures. Unsupervised and supervised image classifications based on LANDSAT-, RapidEye- and IKONOS-data served as base for land use mapping such as forests, wetlands, fields and infrastructure. Change detection tools help to detect environmental changes such as changes of land use or infrastructure. Environmental and infrastructural changes have to be considered when dealing with emergency planning. Roads exposed to flooding or land-slides have to be known and in case of emergency alternative routes to be arranged. Change detection tools become most important after the occurrence of disasters. The comparison of pre- and post-disaster imageries contributes to the documentation of damages. 3. EVALUATIONS OF SATELLITE DATA
According to the needs of emergency preparedness the satellite imageries were used to detect areas susceptible to hazard such as landslides. 3.1. RapidEye-Imageries for the Detection of Potential Areas Susceptible to Earthquake Induced Landslides A correlation between landslide occurrences and earthquakes with magnitudes M > 5 has been observed in many countries. Therefore, when dealing with earthquake emergency
preparedness, earthquake induced landslides have to be taken into consideration. The use of RapidEye satellite data for the detection of landslide prone areas is the focus of the following investigations. The formation of mass movements in the Hungarian landscapes with recent and active landslides seems to be connected primarily to the irregular recurring and unusually wet periods under moderate continental climate. The western bank of the River Danube is belonging to one of the largest landslide endangered areas in Hungary. The banks are steep, 20-40 m high and built-up of loose sediments that are exposed to river erosion. Both old and new settlements are partly or fully built on the high loess bank and in their surroundings such as in the Dunföldvar or Kulcs area. Landslides cause a lot of problems in the small town of Dunaföldvár where many houses are built on the edge and at the foot of the high bank. Dunaföldvár is situated at the eastern margin of the loess covered Mezőföld geographical unit on the bank of the River Danube where the loess highland falls nearly vertically to the flood plain of the river. This 400 m long section of the loess bank must be considered to be susceptible to further mass movements. The RapidEye-scene of this area clearly shows the scarps and landslides (black arrow, Figure 3). Based on the RapidEye images of Central-Hungary, references and field investigations (Mentes et al, 2009), landslide prone areas were mapped and included as shapefiles into the earthquake hazard GIS data base.
Figure 3. RapidEye-scene of the landslides in Dunaföldvar at
the western Danube river banks and field photos
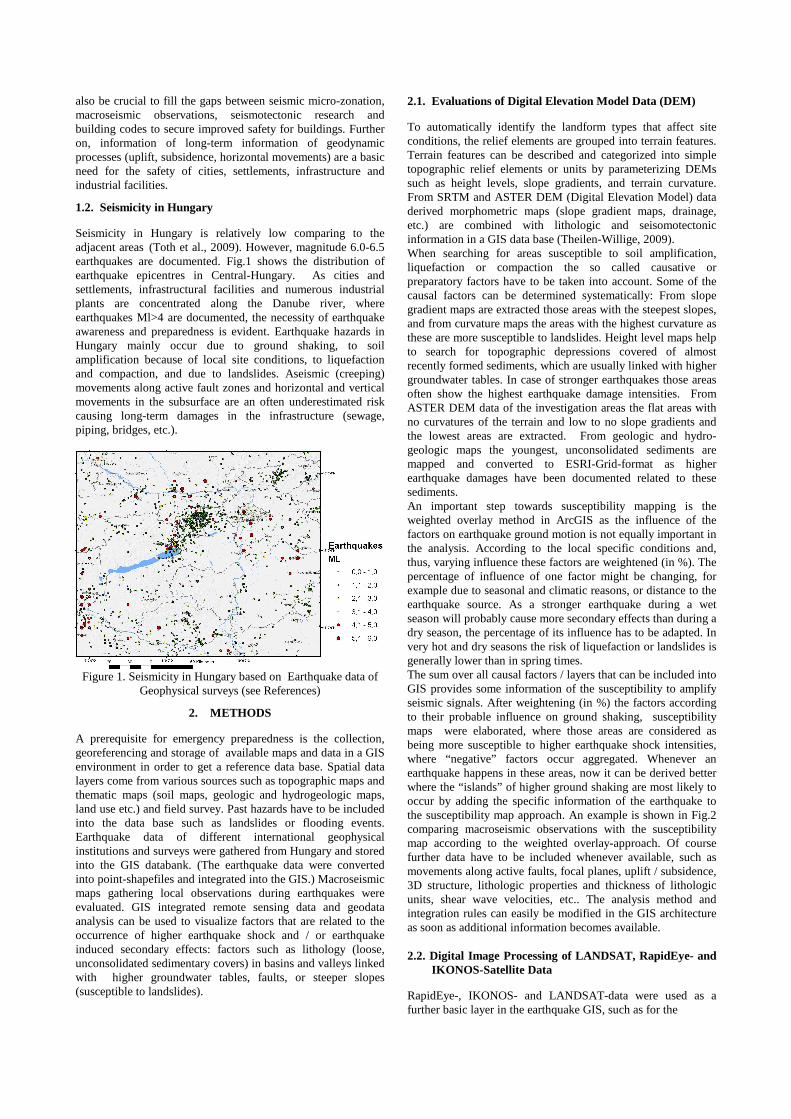
3.2. Traces of Neotectonic Movements Earthquake preparedness comprises knowledge of the tectonic pattern as surface-near fault zones can influence in case of stronger earthquakes not only the susceptibility to landslides, to liquefaction or ground motion intensity, but also to horizontal and vertical movements. An excellent indicator of surficial lithologies, geological structures and ongoing morphotectonic processes is the drainage pattern. Central and Southern Hungary is characterized by large, meandering rivers with relatively low surface slope and river gradient, but high river sinuosity. The Danube river area has slightly tilted terraces with river meanders and many tributaries developed on its surface. Anomalous river sinuosity generally occurs as a result of active tectonics. Regional and local trends of geological fabric are reflected in the variable orientation of channels of different rank in the catchments. Thus, drainage pattern analysis can be a useful tool for the detection of neotectonic movements that might affect the stability of infrastructural facilities. Traces of meanders are clearly visible on RapidEye data. Fig.4 shows
linear anomalies in the meander pattern that can be correlated with known fault zones (segments of the Mid-Hungarian fault zone).
Figure 4. Traces of neotectonic movements
3.3. The Use of RapidEye-Data for Damage Detection after
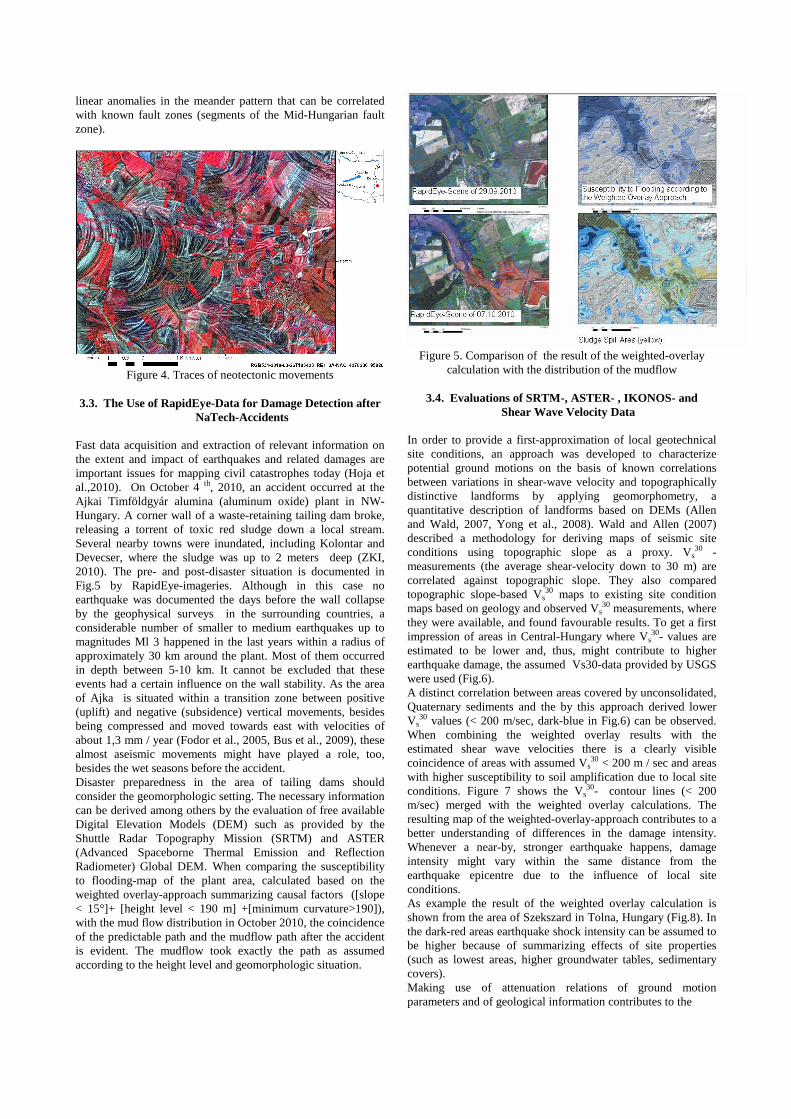
NaTech-Accidents Fast data acquisition and extraction of relevant information on the extent and impact of earthquakes and related damages are important issues for mapping civil catastrophes today (Hoja et al.,2010). On October 4 th, 2010, an accident occurred at the Ajkai Timföldgyár alumina (aluminum oxide) plant in NW-Hungary. A corner wall of a waste-retaining tailing dam broke, releasing a torrent of toxic red sludge down a local stream. Several nearby towns were inundated, including Kolontar and Devecser, where the sludge was up to 2 meters deep (ZKI, 2010). The pre- and post-disaster situation is documented in Fig.5 by RapidEye-imageries. Although in this case no earthquake was documented the days before the wall collapse by the geophysical surveys in the surrounding countries, a considerable number of smaller to medium earthquakes up to magnitudes Ml 3 happened in the last years within a radius of approximately 30 km around the plant. Most of them occurred in depth between 5-10 km. It cannot be excluded that these events had a certain influence on the wall stability. As the area of Ajka is situated within a transition zone between positive (uplift) and negative (subsidence) vertical movements, besides being compressed and moved towards east with velocities of about 1,3 mm / year (Fodor et al., 2005, Bus et al., 2009), these almost aseismic movements might have played a role, too, besides the wet seasons before the accident. Disaster preparedness in the area of tailing dams should consider the geomorphologic setting. The necessary information can be derived among others by the evaluation of free available Digital Elevation Models (DEM) such as provided by the Shuttle Radar Topography Mission (SRTM) and ASTER (Advanced Spaceborne Thermal Emission and Reflection Radiometer) Global DEM. When comparing the susceptibility to flooding-map of the plant area, calculated based on the weighted overlay-approach summarizing causal factors ([slope < 15°]+ [height level < 190 m] +[minimum curvature>190]), with the mud flow distribution in October 2010, the coincidence of the predictable path and the mudflow path after the accident is evident. The mudflow took exactly the path as assumed according to the height level and geomorphologic situation.
Figure 5. Comparison of the result of the weighted-overlay
calculation with the distribution of the mudflow
3.4. Evaluations of SRTM-, ASTER- , IKONOS- and Shear Wave Velocity Data In order to provide a first-approximation of local geotechnical site conditions, an approach was developed to characterize potential ground motions on the basis of known correlations between variations in shear-wave velocity and topographically distinctive landforms by applying geomorphometry, a quantitative description of landforms based on DEMs (Allen and Wald, 2007, Yong et al., 2008). Wald and Allen (2007) described a methodology for deriving maps of seismic site conditions using topographic slope as a proxy. Vs
30 -measurements (the average shear-velocity down to 30 m) are correlated against topographic slope. They also compared topographic slope-based Vs
30 maps to existing site condition maps based on geology and observed Vs
30 measurements, where they were available, and found favourable results. To get a first impression of areas in Central-Hungary where Vs
30- values are estimated to be lower and, thus, might contribute to higher earthquake damage, the assumed Vs30-data provided by USGS were used (Fig.6). A distinct correlation between areas covered by unconsolidated, Quaternary sediments and the by this approach derived lower Vs
30 values (< 200 m/sec, dark-blue in Fig.6) can be observed. When combining the weighted overlay results with the estimated shear wave velocities there is a clearly visible coincidence of areas with assumed Vs
30 < 200 m / sec and areas with higher susceptibility to soil amplification due to local site conditions. Figure 7 shows the Vs
30- contour lines (< 200 m/sec) merged with the weighted overlay calculations. The resulting map of the weighted-overlay-approach contributes to a better understanding of differences in the damage intensity. Whenever a near-by, stronger earthquake happens, damage intensity might vary within the same distance from the earthquake epicentre due to the influence of local site conditions. As example the result of the weighted overlay calculation is shown from the area of Szekszard in Tolna, Hungary (Fig.8). In the dark-red areas earthquake shock intensity can be assumed to be higher because of summarizing effects of site properties (such as lowest areas, higher groundwater tables, sedimentary covers). Making use of attenuation relations of ground motion parameters and of geological information contributes to the

Figure 6. Vs
30 estimations according to Wald and Allen (2007
Figure 7. Weighted Overlay and estimated Vs
30-contour lines (< 200 m/sec) according to Wald and Allen (2007)
elaboration of damage scenarios, even when the input parameters regarding earthquake source, propagation medium and site characteristics are roughly estimated. Assuming a near-field earthquake with a magnitude Ml > 5, the results of the attenuation calculations of seismic waves could be merged with the weighted-overlay results in order to get an idea, where the earthquake shock might be stronger due to local site conditions (provided that the susceptibility to soil amplification is higher, where “negative” factors occur aggregated). When integrating infrastructural and land use data into the GIS data base it can now derived better where the damage after a catastrophic earthquake could probably be higher. In case of emergency rescue teams might be send first to those places situated in areas with probably higher susceptibility to earthquake shock and earthquake related secondary effects. However, the amount of local damage will be determined by the specific earthquake parameters such as depth, magnitude and orientation of the fault plane solution, varied by the specific geologic conditions and the situation of the buildings (construction material, floors, age, etc.). 4. DATA TRANSFER IN CASE OF EMERGENCY GIS and related technologies can be used for monitoring and responding to disasters, as well as for planning, rebuilding or even for relocation in extreme cases. The method described in the present study aiming at the elaboration of a database and the detecting local site conditions which influence earthquake events, could become in the future
part of a comprehensive disaster management system. For disaster preparedness the almost detailed documentation of settlements, infrastructure, industrial facilities, etc., that might be exposed to earthquakes and other hazards, especially their different exposures to soil amplification, landslides or active tectonic processes is necessary.
Figure 8. Assuming an earthquake with magnitude M>5 near
Szekszard, Tolna in Hungary Another important point is the GIS integration of disaster involved institutions such as fire brigades, police stations, hospitals and disaster management centres. Thus, strategic databases were created: Data for hospitals and health centres, schools, kindergartens, governmental buildings, police, fire stations, industrial buildings, gas stations and infrastructure data, provided by the Disaster Management Directorate of Tolna County in Szekszard, were collected and stored as shapefiles in the GeoInformation System. Information of the capacities of hospitals (staff, beds), fire brigades and police stations (staff, equipment) were included as well as population data. Data and maps providing information of functions of buildings, especially of industrial areas, were added. The processing of multi-sourced data, the information of the public and the extraction of information and effective visualisation are major tasks in case of emergency. Information of the public via Youtube, Twitter or Facebook can be gathered and integrated into the existing GIS (Fig.9).
Figure 9. Infrastructure data base
Once the database is prepared, the damage assessment results such as by photos, videos or reports can be linked immediately to the building polygons and related attribute information.
5. CONCLUSIONS
There is a strong need to improve the systematic, standardized inventory of areas that are more susceptible to earthquake ground motions or to earthquake related secondary effects such as landslides, liquefaction, soil amplifications, or compaction. The evaluation of satellite imageries such as RapidEye, digital topographic data and of open-source geodata can contribute to the acquisition of the specific tectonic, geomorphologic / topographic settings influencing local site conditions in Hungary and, thus, to a first data base stock. Remote sensing and GIS form an essential tool for getting actual infrastructural information as base for emergency planning. Acknowledgments The support of EU, FP 7, Large Collaborative Research Project, IRIS – Integrated European Industrial Risk Reduction System, CP-IP 213968-2, is kindly acknowledged. The author thanks the German Aerospace Center (DLR), RESA Science Team, Neustrelitz and RapidEye AG, Brandenburg an der Havel, Germany, for the support by providing RapidEye satellite imageries from Central Hungary in the scope of the project proposal no.438. Thanks are extended to the GeoEye-Foundation, Dulles,Virginia providing IKONOS-data of the city of Szekszard. Laszlo Weisz, DTCDM, Szekszard, is kindly acknowledged for his support of these investigations. REFERENCES Allen, T. I., and Wald, D. J.,2007. Topographic Slope as a Proxy for Seismic Site Conditions (Vs30) and Amplification around the Globe; U.S. Geological Survey, Open File Report 2007-1357,69p.,http://pubs.usgs.gov/of/2007/1357/pdf/OF07-1357_508.pdf (accessed 10. April 2011) Bus,Z., Grenerczy, Gy.,Tóth,L., Mónus,P.,2009. Active crustal deformation in two seismogenic zones of the Pannonian region — GPS versus seismological observations.- Tectonophysics 474 (2009), pp 343–352.
Center for Satellite Based Crisis Information (ZKI),2010: Mudflood in Hungary, October 2010. http://www.zki.dlr.de/article/1655 (accessed: 11.April 2011) Fodor,L., Bada,G., Csillag,G., Horvath,E., Ruszkicay-Rüdiger,Z., and Sikhegy,F.,2005. New data on neotectonic structures and morphotectonics of the western and central Pannonian Basin. Occasional Papers of the Geological Institute of Hungary, volume 204, pp 35-44. http://www.mafi.hu/microsites/digitexts/GPS/Fodor.pdf (accessed: 10.04.2011) Fodor,F., Csillag,G., Nemeth,K., Budai,T., Cserny,T. Martin,U., Brezsnyanszky,K. and Dewey,J. . Tectonic development, morphotectonics and volcanism of the Transdanubian Range: a field guide. Occasional Papers of the Geological Institute of Hungary, volume 204, pp 59-85. Hannich,D., Hötzl, H. & Cudmani,R., 2006. Einfluss des Grundwassers auf die Schadenswirkung von Erdbeben – ein Überblick. Grundwasser,Vol.11,4, pp 286-294. Hoja,D., Schwinger,M., Wendleder,A., Löwe,P., Konstanski, Weichelt, H.,Kiefl, J., Janoth,N. (2010): Optimised Near-Real Time Data Acquisition and Preprocessing of Satellite Data for
Disaster Related Rapid Mapping. – Photogrammetrie - Fernerkundung- Geoinformation-PFG, 2010 / 6, pp 429–438. Krausmann, E.,V. Cozzani, E. Salzano, and E. Renni, 2011. Industrial accidents triggered by natural hazards: an emerging risk issue. Nat. Hazards Earth Syst. Sci., 11, pp 921–929. http://www.nat-hazards-earth-syst-sci.net/11/921/2011/nhess-11-921-2011.html (accessed 10. April 2011) Mentes,G., Theilen-Willige,B., Papp,G., Sikhegyi,F., G. Ujvai, 2009. Investigation of the relationship between subsurface structures and mass movements of the high loess bank along the River Danube in Hungary. Journal of Geodynamics 47, pp 130–141. Theilen-Willige,B. and Wenzel,H., 2009. Local Site Conditions influencing Earthquake Shaking Intensities and Earthquake related Secondary Effects - A Standardized Approach for the Detection of Potentially Affected Areas using Remote Sensing and GIS-Methods. 10.Forum Katastrophenvorsorge, Katastrophen – Datenhintergrund und Informationen UN Campus, Bonn, 23. - 24. November 2009 http://213.23.39.218/download/forum/10/TheilenWillige_Wenzel_ExtAbst.pdf (accessed 10. April 2011)
Tóth, L., Mónus, P., Zsíros, T., Bus Z, Kiszely, M., Czifra, T., 2009. Magyarországi földrengések évkönyve. Hungarian Earthquake Bulletin – 2008, GeoRisk - MTA GGKI, Budapest, 98 oldal. http://www.georisk.hu/Bulletin/bulletine.html (accessed 11. April 2011) Wald,D.J. and Allen,T.I.,2007. Topographic Slope as a Proxy for Seismic Site Conditions and Amplification. Bulletin of the Seismological Society of America, October 2007; v. 97; no. 5; pp 1379-1395. Yong A, Hough S.E., Abrams M. J., Cox H M, Wills C. J. and Simila, G.W.,2008. Quantification of site characterization using integrated imaging analysis methods on satellite data of the Islamabad, Pakistan region Bull. Seismol. Soc. Am. 98(6), pp 2679-2693. Digital Elevation Model Data: http://srtm.csi.cgiar.org/SELECTION/inputCoord.asp http://glcfapp.umiacs.umd.edu:8080/esdi/index.jsp ftp://ftp.glcf.umd.edu/glcf/Landsat/WRS2/p188/r028/L5188028_02820060719.TM-GLS2005/ http://www.gdem.aster.ersdac.or.jp/search.jsp Geophysic and Geological Data: European Mediterranean Seismological Centre (EMSC): http://www.emsc-csem.org/Earthquake/index.php?filter=yes International Seismological Centre (ISC): http://www.isc.ac.uk/search/custom/index.html Institute of Geophysics AS CR (GFU): http://www.ig.cas.cz/en/welcome/ US Geological Survey (USGS): http://earthquake.usgs.gov/earthquakes/eqarchives/epic/ http://earthquake.usgs.gov/hazards/apps/vs30/custom.php Zentralanstalt für Meteorologie und Geodynamik (ZAMG): http://zamg.ac.at/erdbeben/beben_archiv/?ts=1302518821 Geological Institute of Hungary : http://193.225.4.50/website/fdt100/viewer.htm