Remote Monitoring (RMON) - web.cecs.pdx.eduweb.cecs.pdx.edu/~jrb/routing/lectures/pdfs/rmon.pdf ·...
54
1 Jim Binkley Remote Monitoring (RMON) Network Manglement
Transcript of Remote Monitoring (RMON) - web.cecs.pdx.eduweb.cecs.pdx.edu/~jrb/routing/lectures/pdfs/rmon.pdf ·...

1Jim Binkley
Remote Monitoring (RMON)
Network Manglement

2Jim Binkley
Outlinegeneral introduction– overview– rmon 1 and 2 groups– control theory
rmon 1 groups (some)conclusion/summary

3Jim Binkley
RMON – means whatremote monitoring– aggregate stats for a network– aggregate stats for a host– for host X talking to host Y– layer 1 and layer 2– and more
question: do we have the right information?related question: how are networks evolving?one more question: is SNMP the right approach?

4Jim Binkley
bibliographyrfc1513, 1993 - token-ring extensionsrfc1757, 1995, MIB 1rfc2021, 1997, MIB 2rfc2074, 1997, protocol identifiers (directory)David Perkin’s RMON bookSNMP, v2, v3, RMON1/2, Stallings

5Jim Binkley
org(3)
iso(1)
dod(6)
internet(1)system(1)
directory(1) X.500
mgmt(2)
mib-2(1)
rmon and OID tree
rmon(16)
...
rmon1 & 2

6Jim Binkley
rmon intrormon - remote monitoringrmon I - stats at ethernet layer (MAC addresses, but not upstairs)rmon II - stats at network and transport layers (IP addresses and tcp/udp ports)

7Jim Binkley
network analysis picture (trad)
router (or switch)A B
analyzer: in promiscous mode
analyzer: can hear A,B, to/from router trafficon traditional 10BASE shared link
8Jim Binkley
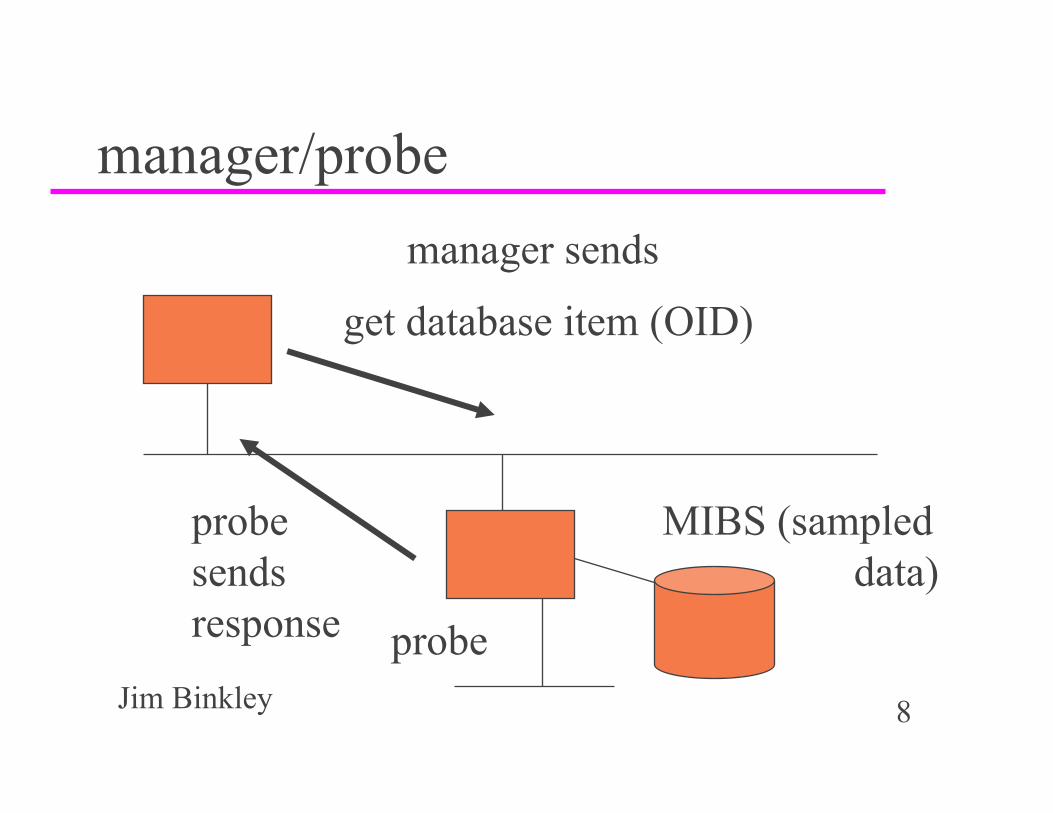
manager/probe
probe
get database item (OID)
MIBS (sampleddata)
manager sends
probesendsresponse

9Jim Binkley
basic idea/s:all kinds of stats - but gathered on per link basis as aggregate– not by manager from every host on link
ethernet focus (token-ring support too)rmon probe can run SOMEWHAT by itself and gather information– however manager needed for more complex
functions (may have to suck out data on periodic basis due to lack of space)

10Jim Binkley
rmon 1 functions - overviewsample stats for all devices on ethernet link– ethernet level - e.g., how many collisions– basic and history
derived statistics– for each host– top N talkers (who sent most bytes?)– matrix of conversations SRC x RCV

11Jim Binkley
rmon 1, contthreshold events– look for N events in elapsed time T– if found, send trap to manager– e.g., N errors in one minute (too many)
packet data capture – filtering mechanism + capture– must work with higher level GUI in manager– goal: capture packets of interest/nice decode
display

12Jim Binkley
rmon 1 - { mib-2 16 }statistics(1) - ethernet stats > interface, roughly equal to dot3 (but global)history(2) - snapshots based on stats(1)alarm(3) - ability to set threshold, generate alarm on interesting eventhost(4) - per i/f host stats (global interface)hostTopN(5) - store/sort by top N hostsmatrix(6) - X talks to Y ( a few stats )

13Jim Binkley
rmon 1, cont.filter(7) - filter pkts and capture/or cause eventcapture(8) - traditional packet analyzerevent(9) - table of events generated by probetokenRing(10) - never mind, but like ethernet stats
14Jim Binkley
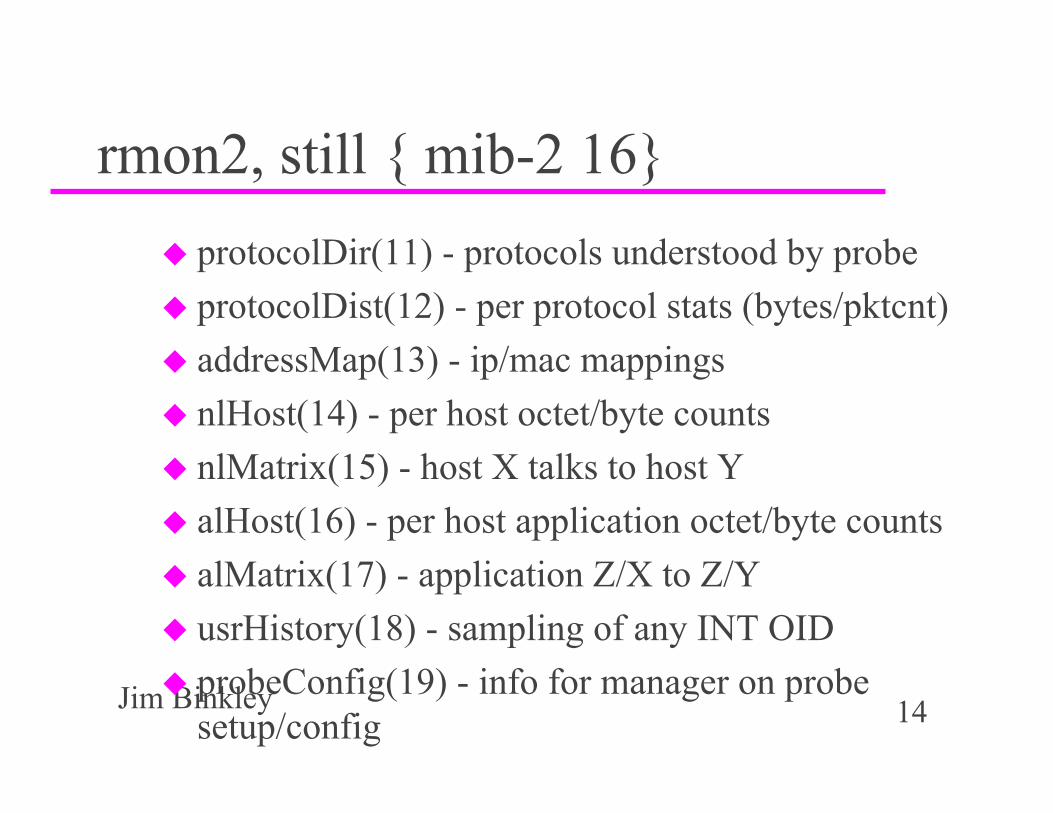
rmon2, still { mib-2 16}protocolDir(11) - protocols understood by probeprotocolDist(12) - per protocol stats (bytes/pktcnt)addressMap(13) - ip/mac mappingsnlHost(14) - per host octet/byte countsnlMatrix(15) - host X talks to host YalHost(16) - per host application octet/byte countsalMatrix(17) - application Z/X to Z/YusrHistory(18) - sampling of any INT OIDprobeConfig(19) - info for manager on probe setup/config

15Jim Binkley
rmon2: notesapplication means “above the network layer”both matrix groups have top N functions as wellnote both protocol directory and probe configuration are there to help odds on manager/probe interoperability

16Jim Binkley
do we need a manager?mostly ...simpler stats in rmon1 could be gathered via net-snmp say buthigher level functions require complex manager with better than average GUI– rmon-2 in general (you want graphical
histograms)– packet capture facilities in probe are lower-
level and need higher level manager sw function

17Jim Binkley
examples:commercial (just one example, others exist)– cisco traffic director on workstation (manager)– cisco netscout probe on link– cisco mini-rmon in some switches
freeware versions ?!– BTNG (it’s dead Jim)– there aren’t any. is this a surprise?– ourmon …(not SNMP-based)

18Jim Binkley
software complexity notes:higher-level functions (e.g., rmon2 or rmon1 data packet capture)– require copious memory/CPU– 100mbit ethernet link ... lots of data
easy to ask too much of systemprobably best to not assume that manager A will interoperate with probe B

19Jim Binkley
possible rmon useswhat kind of questions might you ask?– how much IP vs IPX traffic?– how much traffic is web/news/ftp, whatever?– how utilized (full) is the pipe?– who talks to server X?– we have a problem with DHCP, we need to
capture the packets and look?– global ethernet errors on this link are what?

20Jim Binkley
rmon control theoryin general rmon groups (except for stats group) consists of control rows and per control row data rows e.g., one interface might have a control row that specifies HOW to sample data on a delta T time basis (every 30 secs make a snapshot)one or more data rows will be built up and stored in the probe, associated with that control rownote control row per i/f and possible to have more than one (different sample times)

21Jim Binkley
control rows(tables)/data rows(tables)
owner statusindex i/f time
abstract control row:
associated data samples:
index data #1 data #2 data #3
index more data, etc...

22Jim Binkley
notes:index mechanism must exist to tie together control and data rowsin snmpv2, one may have index that is not in table (an array of structures say with an integer index and no such int in table) (true of RMON2 groups)view mechanism exists in RMON to allow additional time-based table thus– manager need only suck out NEW samples plus
efficient access as index is creation time
manager must sometimes insert/enable control row (this is what status field is for)
23Jim Binkley
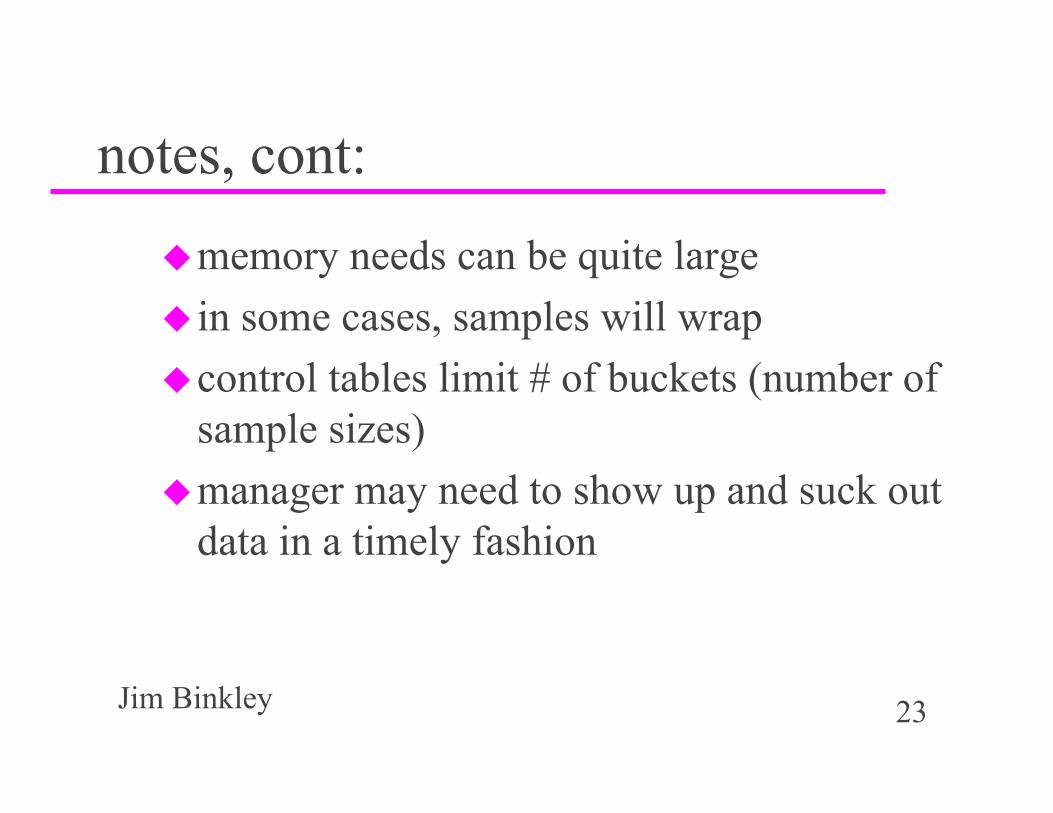
notes, cont:memory needs can be quite largein some cases, samples will wrapcontrol tables limit # of buckets (number of sample sizes)manager may need to show up and suck out data in a timely fashion
24Jim Binkley
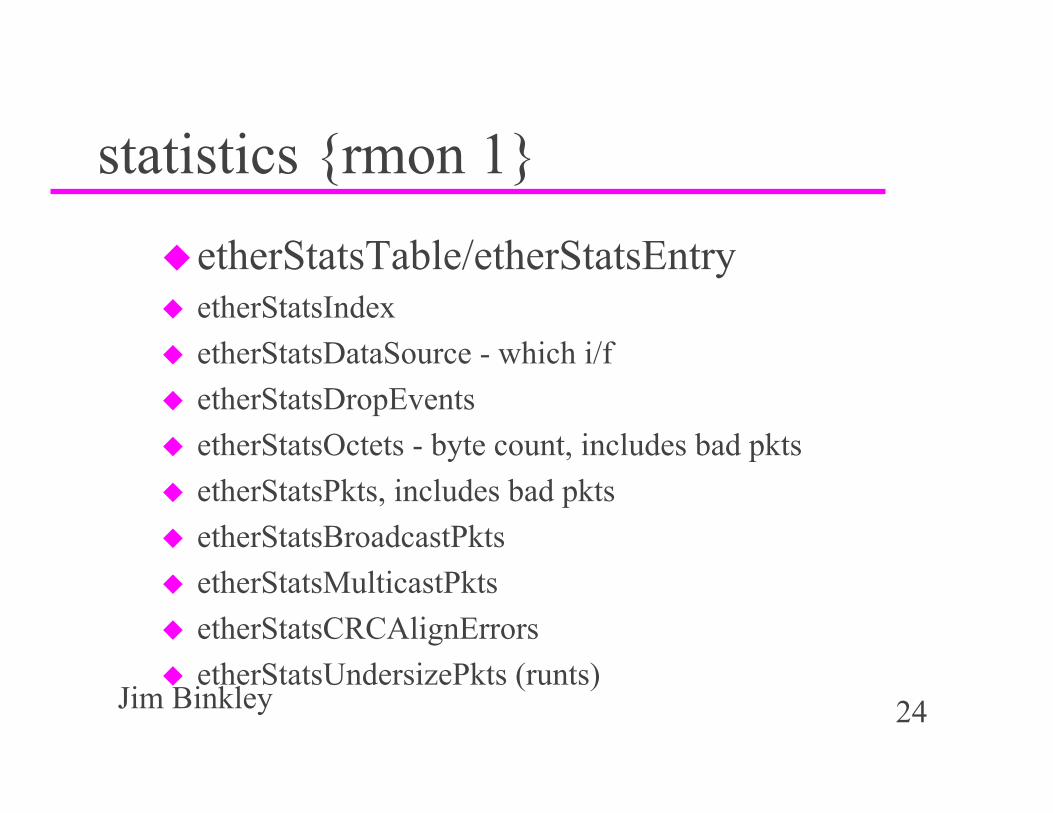
statistics {rmon 1}etherStatsTable/etherStatsEntryetherStatsIndexetherStatsDataSource - which i/fetherStatsDropEventsetherStatsOctets - byte count, includes bad pktsetherStatsPkts, includes bad pktsetherStatsBroadcastPktsetherStatsMulticastPktsetherStatsCRCAlignErrorsetherStatsUndersizePkts (runts)

25Jim Binkley
stats, contetherStatsOversizePkts (giants)etherStatsFragmentsetherStatsJabbers - giants with problems (e.g., CRC errs)etherStatsCollisions - estimate of # of collisionsetherStatsPkts64OctetsetherStatsPkts65to127OctetsetherStatsPkts128to255OctetsetherStatsPkts256to511OctetsetherStatsPkts512to1023OctetsetherStatsPkts1024to1518Octets
26Jim Binkley
stats, cont.etherStatsOwneretherStatsStatus

27Jim Binkley
statistics, notes:simplest rmon groupnote histogram mechanism for countsone entry per interface on probeno separate control tablesimilar to dot3 in some ways, but dot3 is per interface, not per network– can approximate by adding values together in
hub or switch (?)

28Jim Binkley
history { rmon 2 }historyControlTable (1)– historyControlEntry (1)
» row entries
etherHistoryTable (2)– etherHistoryEntry (1)
» row entries

29Jim Binkley
history { rmon 2 }historyControlTable/historyControlEntryhistoryControlIndex - 1-1 with values in data tablehistoryControlDataSource - which interfacehistorycontrolBucketsRequested - request for data slotshistoryControlBucketsGranted - how many did you gethistoryControlInterval - per bucket sample time, secondshistoryControlOwnerhistoryControlStatus

30Jim Binkley
notes:each row when enabled causes sampling to begin on a certain interface– gathering of “buckets” (samples) in associated data table
note you can have more than one sample time on same interface (short period and long period, 1 minute, 1 hour)samples are stored during Interval, and then new entry is createdonce bucketsGranted is used up, the buckets will wrap and start rewriting the oldest buckets (circular buffer scheme)

31Jim Binkley
history data tableetherHistoryTable/etherHistoryEntryetherHistoryIndex - matches control tableetherHistorySampleIndex - unique per sampleetherHistoryIntervalStart - sysUpTime at start of sampleetherHistoryDropEventsetherHistoryOctetsetherHistoryPktsetherHistoryBroadcastPktsetherHistoryMulticastPktsetherHistoryCRCAlignErrors

32Jim Binkley
history data table, cont.etherHistoryUndersizePktsetherHistoryOversizePktsetherHistoryFragmentsetherHistoryJabbersetherHistoryCollisionsetherHistoryUtilization - function of etherStatsOctets and etherStatsPkts

33Jim Binkley
utilizationthis is fairly common in packet capture systemsroughly over time T, how full was the pipe?utilization = packet overhead + bytes sent * 100%
-----------------------------------interval * bits possible on link
on 10BASE, bits possible would be 10**7packet overhead due to preamble & interframe gap
packet overhead = packets * (96+64)
bytes sent = octets * 8

34Jim Binkley
utilization question/s:how long should the period be?how should this be interpreted with switches– interswitch (or switch to router)– servers– hosts– in light of full-duplex wires?
» which should show NO collisions ...

35Jim Binkley
hosts { rmon 4 }hostControlTable– hostControlEntry
» control rows
hostTable– hostEntry
» data rows
hostTimeTable– hostTimeEntry
» data rows

36Jim Binkley
host control tablehostControlTable/hostControlEntry– hostcontrolIndex– hostcontrolDataSource– hostControlTableSize– hostcontrolLastDeleteTime - last time data
deleted – hostControlOwner– hostControlStatus

37Jim Binkley
hostTable (data, not time sorted)hostTable/hostEntry– hostAddress - mac address– hostCreationOrder 1..N, relative creation order– hostIndex– hostInPkts– hostOutPkts - packet count– hostInOctets - byte count– hostOutOctets– hostOutErrors– hostOutBroadcastPkts && hostOutMulticastPkts

38Jim Binkley
time tablehostTimeTable/hostTimeEntry– hostTimeAddress– hostTimeCreationOrder– hostTimeIndex– hostTimeInPkts– hostTimeOutPkts– hostTimeInOctets– hostTimeOutOctets (same as data table ... here
on out)

39Jim Binkley
notes:one entry per host (mac) per interfacebasically counts of bytes/packets in/outtime table is view (same data underneath) and is simply indexed by creation order– data table indexed by mac address

40Jim Binkley
hostTopN { rmon 5 }hostTopNControlTable– hostTopNControlEntry
» rows
hostTopNTable– hostTopNEntry
» rows

41Jim Binkley
host control tablehostTopNControlTable/hostTopNControlEntry– hostTopNControlIndex– hostTopNHostIndex– hostTopNRateBase - one of seven variables (next slide)– hostTopNTimeRemaining - time left in sample period– hostTopNDuration - absolute time of sample period– hostTopNRequestedSize– hostTopNGrantedSize– hostTopNStartTime - when sample time started– owner/status

42Jim Binkley
rateBase - possible variableshostTopNInPktshostTopNOutPktshostTopNInOctetshostTopNOutOctetshostTopNOutErrorshostTopNOutBroadcastPktshostTopNOutMulticastPkts

43Jim Binkley
data tablehostTopNTable/hostTopNEntry– hostTopNReport - matches
hostTopNControlIndex (which report)– hostTopNIndex - per host in report– hostTopNAddress - host mac address– hostTopNRate - amount of change in selected
variable for this report period» variable selected in hostTopNRateBase

44Jim Binkley
matrix group (in brief)basically source by dest mac– count of pkts/octets (pkt count/byte count)

45Jim Binkley
alarm { rmon 3 }alarmTable/alarmEntry– alarmIndex– alarmInterval - data sample period– alarmVariable - OID of variable being sampled– alarmSampleType - absolute or delta (previous sample)– alarmValue - value during last sample period– alarmStartupAlarm - rising/falling or both– alarmRisingThreshold– alarmFallingThreshold

46Jim Binkley
alarm { rmon 3 }alarmTable/alarmEntry– ... cont ....– alarmRisingEventIndex– alarmFallingEventIndex– alarmOwner– alarmStatus

47Jim Binkley
how this works (overview)if value (counter/gauge) crosses rising threshold (and rising specified)– then generate alarm
if value crosses falling threshold (and falling specified)– then generate alarm
delta threshold sampled once per perioduse to look for too many errors during period X (or your idea here ...)

48Jim Binkley
event group (summary)can generate – traps sent to monitor– events stored in local event table (log history of
events)both packet capture and alarm group can cause events stored here

49Jim Binkley
conclusion - summary of capabilities
remember that measurement may have two poles, relative to length of time samples:– 1. baseline of data over time– 2. measurement of what is going on NOW
snmp focus generally on set of objects at one node - rmon focus on wire itselfover-generalization, but rmon helps you focus on NOW and the general LINK
50Jim Binkley
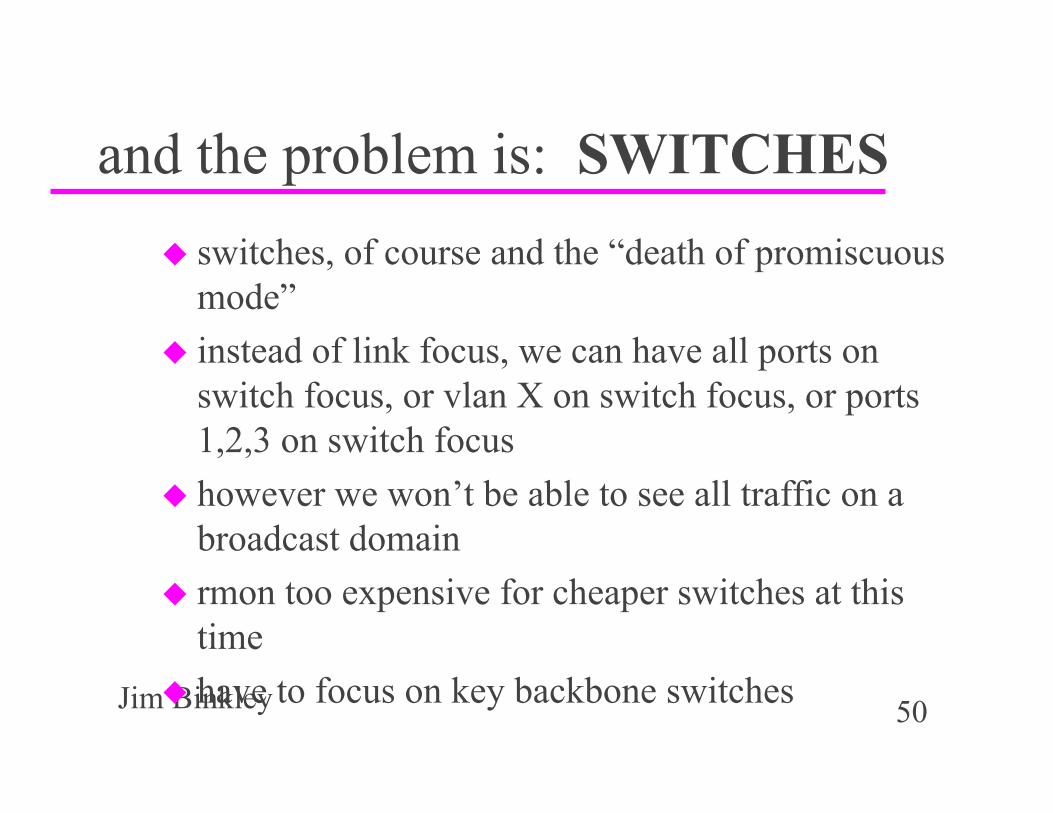
and the problem is: SWITCHESswitches, of course and the “death of promiscuous mode”instead of link focus, we can have all ports on switch focus, or vlan X on switch focus, or ports 1,2,3 on switch focushowever we won’t be able to see all traffic on a broadcast domainrmon too expensive for cheaper switches at this timehave to focus on key backbone switches

51Jim Binkley
bigger cisco switcheshave mini-rmon; e.g., ethernet stats/rmon1SPAN function to allow you to hookup external sniffer/rmon probe and suck down packets– aka port mirroring (ports/vlan, etc)– NOT inter-switch

52Jim Binkley
keep in mind:rmon has LARGE # of function pointsother tools exist that may have rmon-like feature sets (but not all of it)e.g., packet capture freebies– tcpdump, snoop, etherfind (latter 2 on sun)– trafshow, arpwatch (show traffic of various
kinds in some kind of real-time display)

53Jim Binkley
some general tools in this areaCisco netflow– aggregate flow stats, UDP-based collection
HPOV event generationntop – open-source tool– like ourmon in some ways but details differ
ourmon – open-source tool– network mgmt/anomaly detection

54Jim Binkley
what is the real problem?too much data not enough analysis– I don’t want all the flows– networks are evolving
» p2p/skype/irc/games etc.» meaning protocols are not IETF-based
– security problems are evolving too» today TCP worms rule» agobot/phatbot/rxbot – black hats have tools