Remote and Rural Dentistry - Scottish Dental
60
Needs Assessment Report on Remote and Rural Dentistry March 2007
Transcript of Remote and Rural Dentistry - Scottish Dental
Needs Assessment Report on
Remote and Rural DentistryMarch 2007

Published by Health Scotland
Edinburgh Office: Woodburn House, Canaan Lane, Edinburgh EH10 4SG
Glasgow Office: Clifton House, Clifton Place, Glasgow G3 7LS
© NHS Health Scotland, 2007
ISBN: 1-84485-386-1
Health Scotland is a WHO Collaborating Centre for Health Promotion and Public Health Development.
�
DedicationThis report is dedicated to the memory of Robin Brechin, a member of the Remote and Rural Working Group, who died on 10 July 2005.
Working group membersColwyn Jones (Secretary), Consultant in Dental Public Health, NHS Lothian and NHS Borders
Robin Brechin, Dental Practice Adviser, NHS Argyll & Clyde
Eileen Curran, Health Visitor, NHS Borders
Martin Donachie, Consultant in Restorative Dentistry, NHS Grampian
Adrian Hart, Consultant Orthodontist, NHS Highland
John Herrick, Dental Services Manager, NHS Argyll & Clyde
Alex Mathewson, Dental Practice Adviser, NHS Grampian
Martyn Merrett, Consultant in Dental Public Health, NHS Tayside
Louise Pettigrew, Senior House Officer in Dental Public Health, NHS Lanarkshire
Ludovic Seath, Senior Dental Officer, NHS Dumfries & Galloway
Colin Tilley, Health Economist, Dental Health Services Research Unit, Dundee
David Trotter, Consultant in Dental Public Health, NHS Dumfries & Galloway
The Scottish Needs Assessment Programme, Oral Health Remote and Rural Sub-group acknowledges the secretarial support of Fiona Boyle in the preparation of this report.

� Remote and Rural Dentistry
�
ContentsRecommendations 4
1 Introduction and scope of report 7
2 Dental epidemiology 11
3 Dental services 15
4 Patient access: current service provision 21
5 Health economic perspective 33
6 References 39
Appendices 43
1 Council areas, population densities 2003 45
2 NHS board dmft of 5-year-olds 2002/2003 46 and Carstairs Index
3 SHBDEP adult dental survey 1993 47
4 Principal dentists by NHS board 2004 and 2005 48
5 Percentage of population seen in primary care 2005/2006 50
6 National continuing care and capitation registrations 52
7 Orthodontic appliance treatment per 100 courses 53 of NHS treatment, 2006
8 Annual provision of dental examination by provider types 54
Readers should note that all of the information in this report was collated when NHS Argyll & Clyde still existed.
� Remote and Rural Dentistry
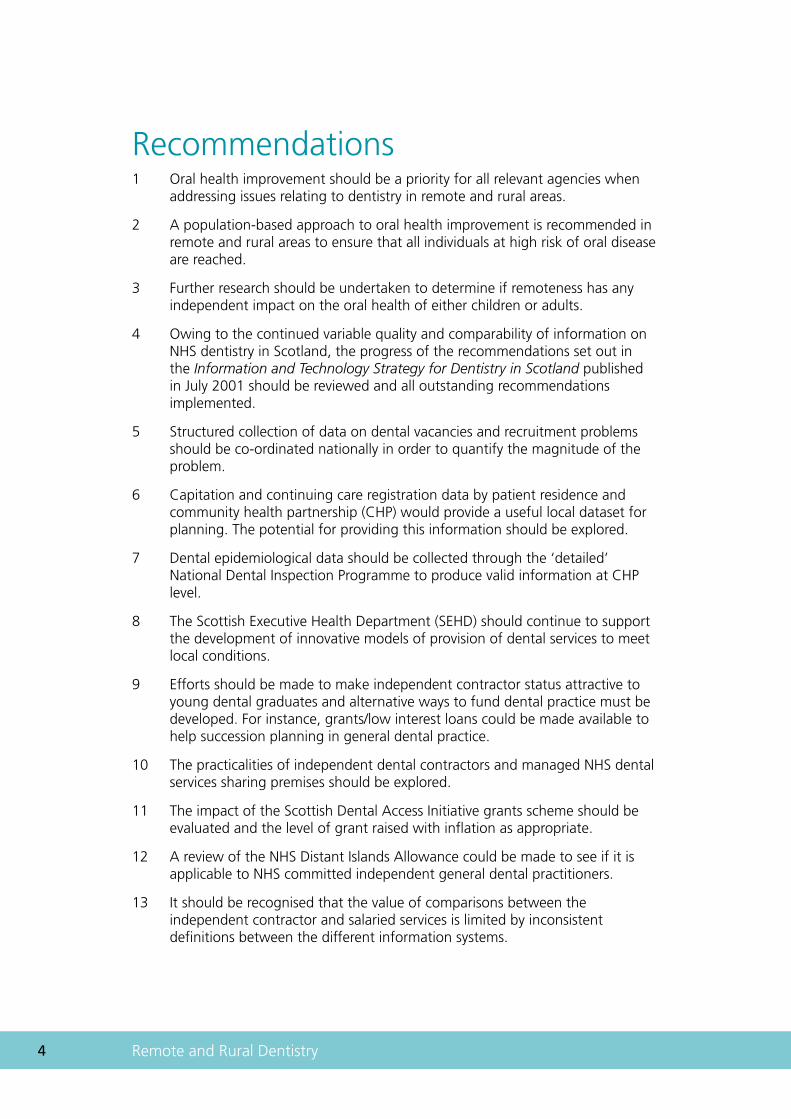
Recommendations1 Oral health improvement should be a priority for all relevant agencies when
addressing issues relating to dentistry in remote and rural areas.
2 A population-based approach to oral health improvement is recommended in remote and rural areas to ensure that all individuals at high risk of oral disease are reached.
3 Further research should be undertaken to determine if remoteness has any independent impact on the oral health of either children or adults.
4 Owing to the continued variable quality and comparability of information on NHS dentistry in Scotland, the progress of the recommendations set out in the Information and Technology Strategy for Dentistry in Scotland published in July 2001 should be reviewed and all outstanding recommendations implemented.
5 Structured collection of data on dental vacancies and recruitment problems should be co-ordinated nationally in order to quantify the magnitude of the problem.
6 Capitation and continuing care registration data by patient residence and community health partnership (CHP) would provide a useful local dataset for planning. The potential for providing this information should be explored.
7 Dental epidemiological data should be collected through the ‘detailed’ National Dental Inspection Programme to produce valid information at CHP level.
8 The Scottish Executive Health Department (SEHD) should continue to support the development of innovative models of provision of dental services to meet local conditions.
9 Efforts should be made to make independent contractor status attractive to young dental graduates and alternative ways to fund dental practice must be developed. For instance, grants/low interest loans could be made available to help succession planning in general dental practice.
10 The practicalities of independent dental contractors and managed NHS dental services sharing premises should be explored.
11 The impact of the Scottish Dental Access Initiative grants scheme should be evaluated and the level of grant raised with inflation as appropriate.
12 A review of the NHS Distant Islands Allowance could be made to see if it is applicable to NHS committed independent general dental practitioners.
13 It should be recognised that the value of comparisons between the independent contractor and salaried services is limited by inconsistent definitions between the different information systems.
�
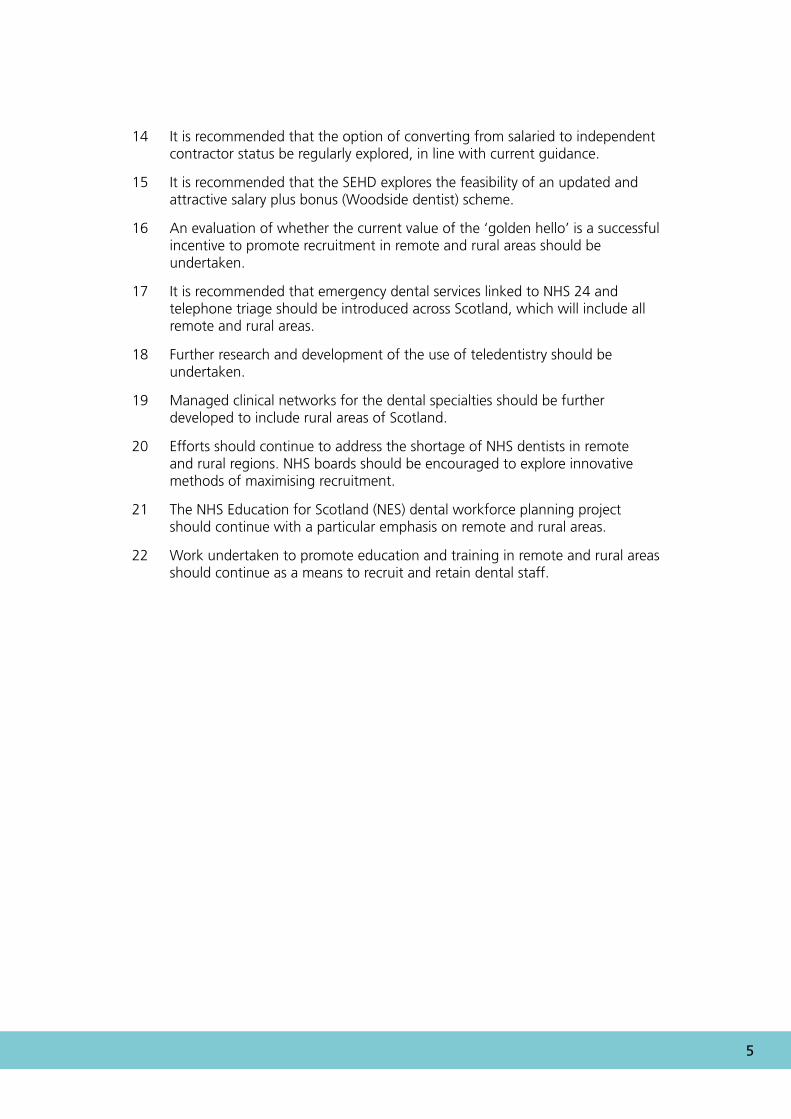
14 It is recommended that the option of converting from salaried to independent contractor status be regularly explored, in line with current guidance.
15 It is recommended that the SEHD explores the feasibility of an updated and attractive salary plus bonus (Woodside dentist) scheme.
16 An evaluation of whether the current value of the ‘golden hello’ is a successful incentive to promote recruitment in remote and rural areas should be undertaken.
17 It is recommended that emergency dental services linked to NHS 24 and telephone triage should be introduced across Scotland, which will include all remote and rural areas.
18 Further research and development of the use of teledentistry should be undertaken.
19 Managed clinical networks for the dental specialties should be further developed to include rural areas of Scotland.
20 Efforts should continue to address the shortage of NHS dentists in remote and rural regions. NHS boards should be encouraged to explore innovative methods of maximising recruitment.
21 The NHS Education for Scotland (NES) dental workforce planning project should continue with a particular emphasis on remote and rural areas.
22 Work undertaken to promote education and training in remote and rural areas should continue as a means to recruit and retain dental staff.

� Remote and Rural Dentistry
Chapter 1
Introduction and scope of report
� Remote and Rural Dentistry
The difficulty of procuring specialist treatment in certain forms of physical defects, such as defective teeth and eyes, is, in the remote parts, particularly acute.
(Dewar, 1912)
1 Introduction and scope of reportThe aim of this Scottish Needs Assessment Programme (SNAP) report is to address the serious issues facing remote and rural communities in protecting their oral health and accessing NHS dental care. The report covers provision of NHS dental services and the levels of oral disease in the population in remote and rural areas of Scotland. Training and Education issues have been addressed previously in the report by a Working Group on Education and Training for the Dental Team in Remote and Rural Regions (NES 2003).
1.1 Remoteness and ruralityThe Scottish Executive (2000) has stated that, ‘Providing health services to sparse populations dispersed over many hundreds of miles of land and sea is one of the distinctive features of the NHS in Scotland’.
With the exception of Ayrshire & Arran, these remote and rural areas coincide with the ‘designated areas’ that benefit from enhanced payments to dentists, introduced on 1 August 2002: Orkney, Shetland, Western Isles, Highland, Borders, Dumfries & Galloway, Grampian and, within Argyll & Clyde, Campbeltown, Dunoon, Lochgilphead, Lochgoilhead, Oban, Rothesay, Tarbert and the Isles of Mull, Iona, Colonsay, Tiree, Islay and Jura (NHS 2003 PCA(D)16). Population density has been recently introduced (NHS 2006 (PCA(D)4) as a new method of determining eligibility for remote and rural allowances by salaried dentists.
1.2 Population densityAs a country overall, Scotland has a low population density, especially within a European context. The average EU population density is 1.1 persons per hectare, almost double the Scottish average of 0.66. One other factor is the ageing population found in remote and rural areas resulting from migration of younger people to urban areas. This is highlighted in the Kerr Report as a major factor driving change in NHS Scotland and the response of the Holyrood Parliament to the Kerr Report requires the development and implementation of a framework of care designed specifically for remote and rural committees (Scottish Executive, 2005).
It is acknowledged that access to dental services in remote and rural parts of Scotland remains problematic. Local access to care is a recommendation from the Kerr Report and the proposed use of community treatment centres could include dental services. In addition, recruitment and retention of appropriate personnel in rural and remote areas is crucial in maintaining access to services.
�
Newton et al. (2005) found that there was a significant positive correlation between Whole Time Equivalent (WTE) dentist to population ratios (corrected for the lower output of salaried dentists working in general dental services (GDS) and population density; Spearman’s Rho = 0.59, p = 0.021). However, there was no association when the corrected output of salaried general dental practitioners (SGDPs) was removed from the equation, and they concluded that the association is questionable.
1.3 Definition of ‘rural and remote’For clarity it is useful to have a definition but there is difficulty in defining ‘rural and remote’ and identifying to which health boards the definition applies. The Randall definition (based on the definition by J. Randall in NES 2003: Scottish Economic Bulletin, 1984, and restated in the Scottish Economics Statistics, 2000) was used in the recent Report by a Working Group on Education and Training for the Dental Team in Rural and Remote Regions of Scotland (NES 2003) and is reproduced as follows: ‘less than 100 people per square kilometre, or less than one person per hectare’.
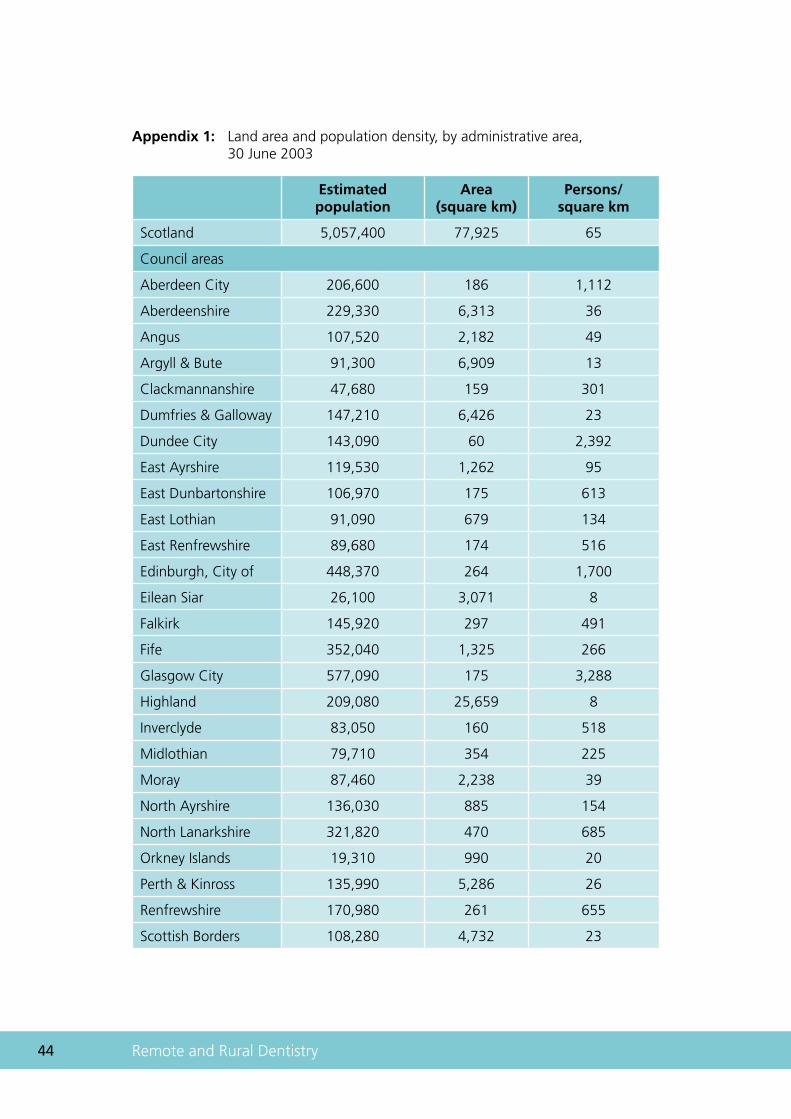
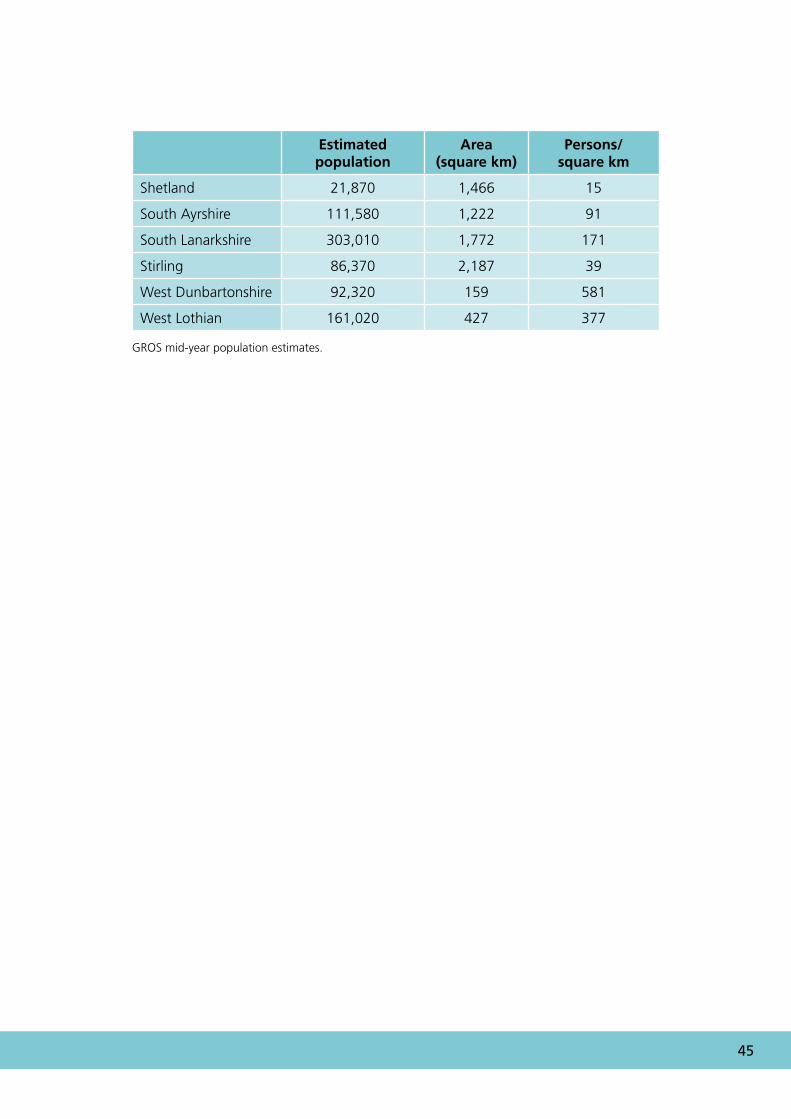
Such districts account for 90% of Scotland’s land mass and are home to just less than one-third of its population. However, there is as much variation in the distribution and characteristics of the rural population as there is in its landscape and land use. Population density within this definition varies widely from two persons per square kilometre in Sutherland to 96 in North East Fife. In contrast, the population density in areas of Edinburgh and Glasgow exceeds 1000 persons per square kilometre (Appendix 1).
The task group set up to look at the creation of a Scottish Faculty for Remote and Rural Healthcare (NES 2003: RARARI 2002) suggested that there were 10 health boards with significant service provision for remote and rural areas: Argyll & Clyde (Argyll & Bute now in Highland), Ayrshire & Arran, Borders, Dumfries & Galloway, Grampian, Highland, Orkney, Shetland, Tayside and the Western Isles. However, even within other Boards there may be areas that are rural.
It should be noted that the Randall definition was based on local authorities and those identified as rural and remote on this basis are: Aberdeenshire, Angus, Argyll & Bute, Dumfries & Galloway, East Ayrshire, Highland, Moray, Orkney Islands, Perth & Kinross, Scottish Borders, Shetland, South Ayrshire, Stirling and the Western Isles.
With respect to populations served by dental services, the approach developed by NES appears to be relevant. ‘Drive time’ has also been used as a method of defining remote communities relative to service centres (in NES 2003: Services in Remote Areas 2000).
More than 169,000 people in Scotland (3%) live more than two hours from a major population centre (defined as over 30,000 people) and 4% of the Scottish population live more than 90 minutes from a major population centre. One concern in using ‘drive time’ is the assumption that access to a car is universal. Although this position would clearly be imprecise if applied to the entire rural population it has been considered reasonable to apply it to general dental practitioners (GDPs) to define those who may claim enhanced postgraduate allowances.
�0 Remote and Rural Dentistry
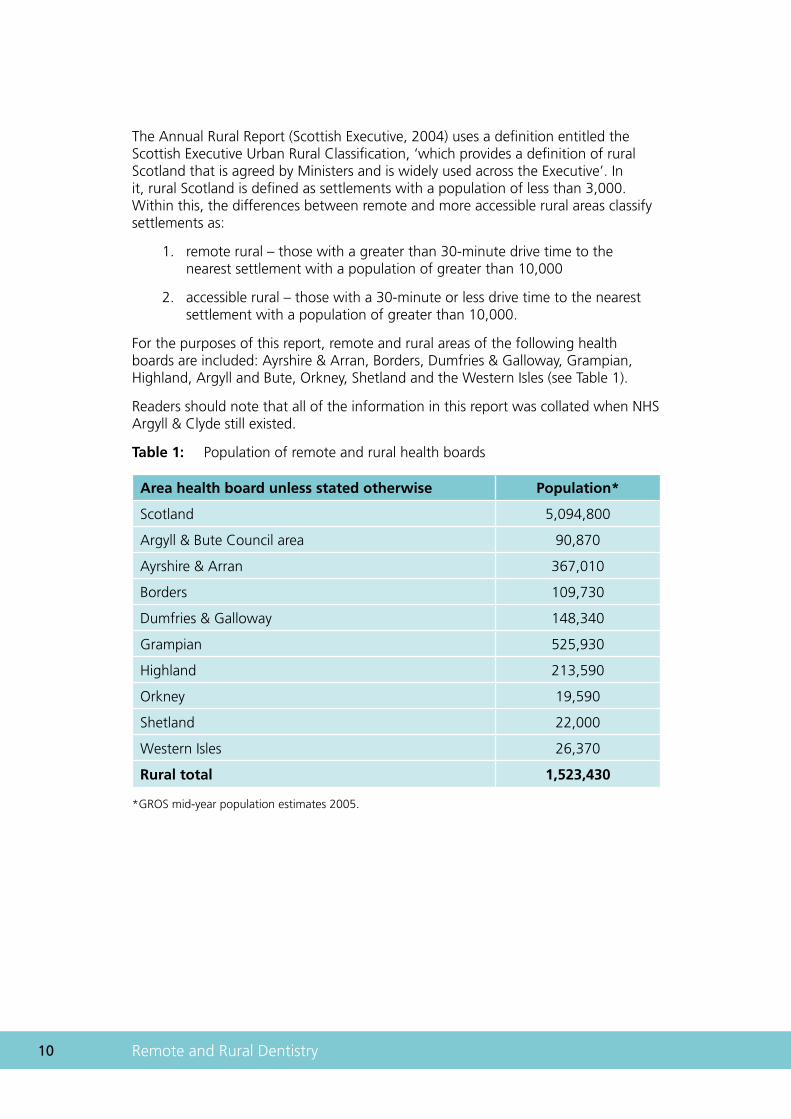
The Annual Rural Report (Scottish Executive, 2004) uses a definition entitled the Scottish Executive Urban Rural Classification, ‘which provides a definition of rural Scotland that is agreed by Ministers and is widely used across the Executive’. In it, rural Scotland is defined as settlements with a population of less than 3,000. Within this, the differences between remote and more accessible rural areas classify settlements as:
remote rural – those with a greater than 30-minute drive time to the nearest settlement with a population of greater than 10,000
accessible rural – those with a 30-minute or less drive time to the nearest settlement with a population of greater than 10,000.
For the purposes of this report, remote and rural areas of the following health boards are included: Ayrshire & Arran, Borders, Dumfries & Galloway, Grampian, Highland, Argyll and Bute, Orkney, Shetland and the Western Isles (see Table 1).
Readers should note that all of the information in this report was collated when NHS Argyll & Clyde still existed.
Table 1: Population of remote and rural health boards
Area health board unless stated otherwise Population*
Scotland 5,094,800
Argyll & Bute Council area 90,870
Ayrshire & Arran 367,010
Borders 109,730
Dumfries & Galloway 148,340
Grampian 525,930
Highland 213,590
Orkney 19,590
Shetland 22,000
Western Isles 26,370
Rural total 1,523,430
*GROS mid-year population estimates 2005.
1.
2.
Chapter 2
Dental epidemiology
�� Remote and Rural Dentistry
2 Dental epidemiology2.1 ChildrenBetween 1987 and 2000, the prevalence of tooth decay in children throughout Scotland was carefully monitored by the Scottish Health Boards’ Dental Epidemiological Programme (SHBDEP). The subsequent National Dental Inspection programme (NDIP) allows continued monitoring of the dental health needs of Scottish children.
These surveys, when taken in conjunction with surveys co-ordinated by the British Association for the Study of Community Dentistry throughout the UK, show that Scottish children have more tooth decay than their contemporaries elsewhere in the UK. There is, however, no evidence that tooth decay in children in remote and rural areas is more prevalent or more severe than in Scotland overall (Pitts et al., 2001). However, rurality, and especially rural poverty, are poorly understood factors and research should continue for both children and adults.
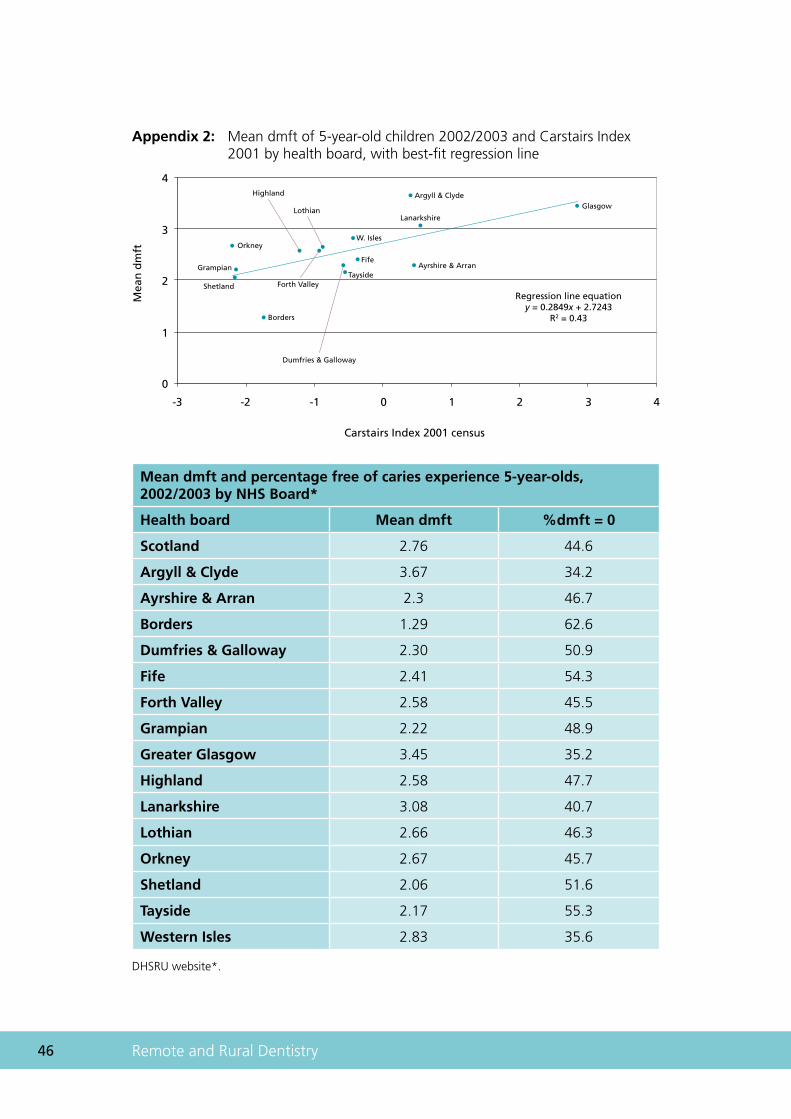
The 2002/2003 NDIP figures show that, within the rural boards, Borders had already achieved the national target for 2010 of 60% of 5-year-olds free of obvious dental caries. However, Western Isles and Argyll & Clyde, again rural boards, have some considerable way to go (Appendix 2).
In addition to having the smallest proportion of children with dental caries, Borders children who had experienced tooth decay had the lowest severity of attack, whereas the Argyll & Clyde children had the highest levels in Scotland. Similar historical findings were observed in the other age groups (11-, 12- and 14-year-olds), showing no consistent association between tooth decay and rurality.
As with most human diseases, tooth decay is strongly linked to poverty as reported previously (Jones et al., 1997) but it has not been possible to find a discernible association with rurality (Appendix 2). There is clear evidence that there are significant differences between children living in the most deprived areas, as measured by DEPCAT, compared with those in the more affluent areas (Sweeney et al., 1997; Pitts et al., 2000). For Scottish children aged 5 years in 2003/2004, those in DEPCAT 1 and DEPCAT 2 areas had reached the national target of 60% being free of obvious dental caries, compared with only 32% of children from DEPCAT 7 areas (Merrett et al., 2005). It is debatable how accurately DEPCAT reflects rural deprivation as it relies on postcode sectors, which can be more socioeconomically heterogeneous in rural than in urban areas. Few rural NHS boards contain significant populations in DEPCAT 7. The sizes of samples drawn do not permit reliable intra-area comparisons to be made between urban and remote populations within single NHS board areas. Results from the new NDIP confirm these earlier findings; this programme should be developed to gather data at locality level, by community health partnership areas.
��
The more heterogeneous socioeconomic characteristics of populations in remote and rural areas means that targeting based on postcode sectors or electoral wards as determined by DEPCAT may fail to reach all those with the disease. Therefore, a population-based approach to oral health improvement is needed to ensure that all individuals at high risk of oral disease are included.
2.2 AdultsConsiderably fewer data are available concerning the oral health of adults. Indeed Newton et al. (2005) stated that there was no information on adult oral health at a health board level. Decennial surveys, most recently in 1998, of adult dental health in the UK have been conducted, but they provide only national information. In 1998, the level of tooth loss among the Scottish adult population was 18%, which represents a considerable improvement (26% in 1988, 42% in 1972). Nevertheless, the rate of improvement in Scotland was less than that in England and represents a widening of the gap between levels of oral health in the two countries.
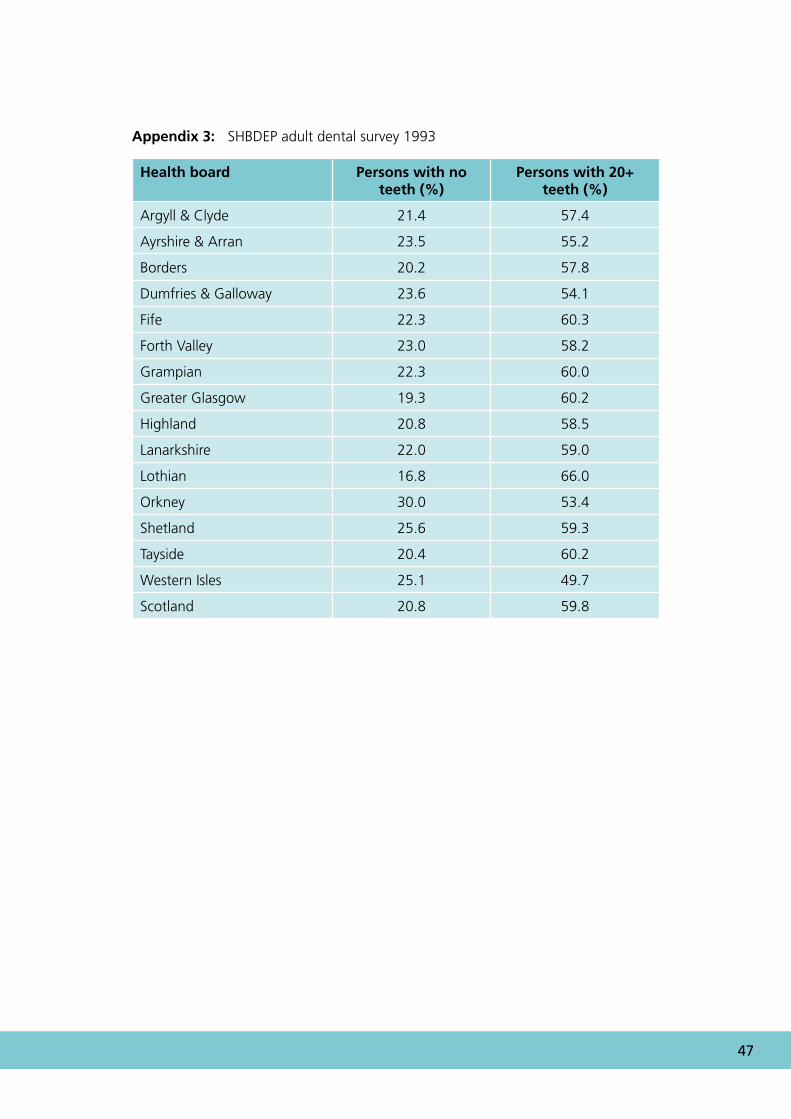
A postal questionnaire survey conducted in 1993 considered adult oral health as indicated by reported presence or absence of natural teeth. The results were available by health board and showed a weak negative correlation with deprivation. They also showed no discernible pattern linked to rurality (Appendix 3).
The conclusion of the group is that recommendations aimed at oral health improvement in the general population are equally applicable to rural populations (SIGN 43 2000, SIGN 47 2000, SIGN 83, SNAP 1999, PHIS 2002).

�� Remote and Rural Dentistry
Chapter 3
Dental services
�� Remote and Rural Dentistry
3 Dental services National Health Services for dentistry are provided by four groups of dental practitioners. They are general dental practitioners (GDPs), the salaried general dental service (SGDS), the community dental service (CDS), and the hospital dental services (HDS). Each group has its own structures for funding, management, career, payment and recording of activity.
The role of NHS dental services is defined in central guidance. This was outlined in circular DGM(89)15 and updated by NHS: 1997 PCA(D)10. More recent guidance on the role of a merged community and salaried service has been issued in HDL(2006)57.
Information on dental workforce and service activity is available in different formats for different services but does not readily allow collation of data for accurate comparison. Many of the recommendations in the Information and Technology Strategy for Dentistry in Scotland, published in July 2001, have not yet been fully addressed. Implementation of the recommendations should improve the quality of dental information, which is vital to improve planning for better patient care.
General dental practitioners are independent contractors to the NHS. They provide their own premises, their own staff and work to a scale of fees provided by the Scottish Executive, i.e. the Statement of Dental Remuneration (SDR). GDPs can also provide non-NHS (private) treatment to patients.
Salaried general dental practitioners work in premises and with staff provided by the NHS and are paid a salary. They provide only NHS treatment except when a clinically necessary dental procedure is not available on the NHS.
The community dental services treat a wide spectrum of patients, often those that the other dental services are unable to reach. They work from fixed and mobile clinics provided by the NHS. Amongst their duties, they treat children and special needs patients, visit nursing homes, perform national dental surveys and deal with the statutory dental inspection of school children. They are salaried and work within a budget managed by NHS boards. They are often closely integrated with salaried dental practitioners with whom they will merge following implementation of the recommendations of the Taylor Report, which reviewed salaried dental services (HDL [2006] 57).
Recruitment and retention of NHS staff in remote and rural areas has become increasingly difficult. Some believe that this has now reached crisis proportions. It is acknowledged that access to dental services in remote and rural parts of Scotland remains problematic.
3.1 Access: general issuesGiven the relatively poor state of oral health in Scotland, the provision of access to dental services is extremely important. Access to dental services in remote and rural areas may be particularly difficult for a number of reasons.
•
•
•
�7
Despite its other drawbacks, the fee-for-service (FFS) structure of remuneration may serve to align the choices of GDPs and purchasers of health care: areas of ‘unmet need’ for dental services should attract FFS dentists. However, for the FFS system to be effective in attracting dentists to specific areas there needs to be a sufficient amount of unmet need. Unfortunately, one characteristic of remote and rural areas is that their resident populations are small in number. Different forms of remuneration may be required to induce dentists to locate in remote and rural areas.
More generally, dentists are likely to choose a rural location only if the expected net financial benefits (benefits minus costs) are greater than those associated with locating elsewhere. There are many reasons why dentists’ costs may be higher (and benefits lower) in remote and rural areas than elsewhere. The outcomes of these perfectly rational location decisions by dentists may be that some areas are prone to significant access problems. This suggests that subsidies or incentives may be required to recruit and retain dentists in remote and rural areas.
In general, there may be a case for subsidies designed to address access issues in remote and rural communities when the location choices of independent GDPs and the service needs of purchasers of health care – health boards – differ.
A number of options are available to health boards and the Scottish Executive to overcome access issues. The first is to provide incentives to recruit and retain dentists in particular areas. The second is to subsidise travel for remote and rural patients. It is not clear that either option would be universally preferred. For example, two of the reasons that FFS dentists may choose not to locate in remote and rural settings are the relatively small number of patients and the relatively high costs of providing dental services. There may be circumstances in which either the costs of employing a salaried dentist are so high or the number of patients served by that dentist is so low that it is more efficient to subsidise patient travel rather than provide a more local dental service.
3.2 RecruitmentThe difficulties of recruiting GDPs are further compounded by recruitment problems. Examples are in the former Argyll & Clyde, Borders, Orkney, Western Isles, Highland and Grampian boards where practices have attempted to replace associates without success.
Recruitment and retention of appropriate personnel into rural and remote areas is crucial in maintaining adequate access to NHS dental services. The Action Plan for Dental Services in Scotland (2005) made a commitment to reviewing current dental access schemes and to expanding current salaried provision in areas where this was felt to be appropriate. This was also raised in ‘The Toothousand Project’:
To cope with the particular staffing shortages in rural areas, inducement payments or an increase in salaried practitioners should be considered.
(Russell et al., 2001)
�� Remote and Rural Dentistry
3.3 Current incentivesAt present, a range of measures exists to improve access to NHS dental services in rural and remote locations. These are listed below and further information can be found in Chapter 4 of the NHS Education report (NES 2003).
�.�.� ScottishdentalaccessinitiativegrantsUp to 2005, a total of 60 grants have been paid to applicants under this initiative (Scottish Parliament Answer S2W – 17114). In remote and rural areas the addition of one extra GDP through an access grant largely resolves local access problems. It is noted that this scheme was introduced in 1997 and the monetary value of grants were static until doubled in 2004. Index linking the grant to inflation or other economic indicators may help it to remain attractive. Further development and promotion of this scheme is recommended.
�.�.� Regulation�(�)appointmentsRegulation 3(2): A Health Board or primary care NHS Trust may, after consultation with the area dental committee and with the approval of the Secretary of State, make special arrangements with a dentist whereby the dentist undertakes to provide general dental services throughout a district specified in the arrangements…
Such arrangements were in place in Highland and Orkney in 2004. It is recommended that these appointments are reviewed and expanded to other remote and rural areas.
The following seven incentives were fully discussed in Chapter 4 of the NES report (NES 2003). Although they are broadly welcomed, the associated complexity and bureaucracy is reported to reduce their attractiveness. Evaluation of their effectiveness should also be undertaken.
Commitment Payment Scheme
Primary Care Premises Strategy
Remote Islands Allowance
Rural and Remote Allowances/CPD Payments
Dental List Payment
NHS LIFT (Local Investment Finance Initiatives Trust, HUB in Scotland)
Practice Improvement Grants.
There is also an NHS ‘distant islands’ annual allowance, which is calculated on the distance from the mainland (at October 2005: Orkney and Western Isles – £567 single, £789 married, civil partnership or single with dependent children of school age; Shetland – £1123 single, £1676 married, civil partnership or single with dependent children of school age). This allowance is not available to independent contractors but we recommend that it might be developed as a suitable incentive for NHS committed GDPs.
•
•
•
•
•
•
•
��
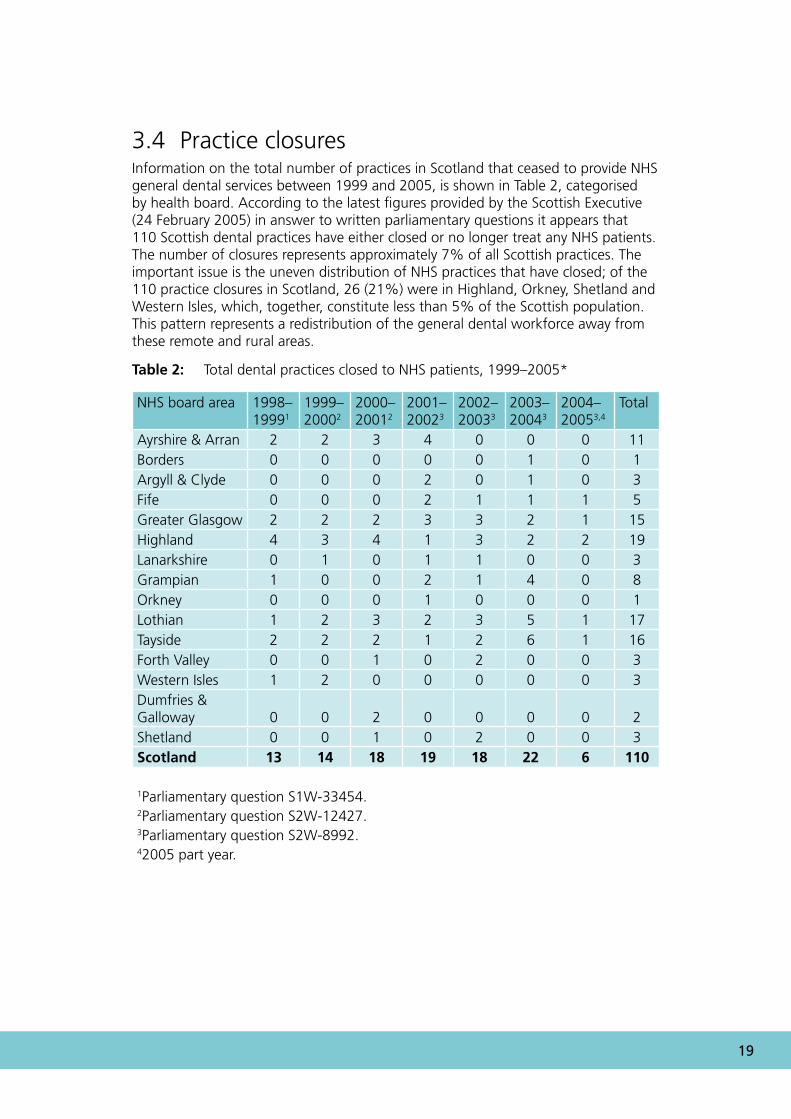
3.4 Practice closuresInformation on the total number of practices in Scotland that ceased to provide NHS general dental services between 1999 and 2005, is shown in Table 2, categorised by health board. According to the latest figures provided by the Scottish Executive (24 February 2005) in answer to written parliamentary questions it appears that 110 Scottish dental practices have either closed or no longer treat any NHS patients. The number of closures represents approximately 7% of all Scottish practices. The important issue is the uneven distribution of NHS practices that have closed; of the 110 practice closures in Scotland, 26 (21%) were in Highland, Orkney, Shetland and Western Isles, which, together, constitute less than 5% of the Scottish population. This pattern represents a redistribution of the general dental workforce away from these remote and rural areas.
Table 2: Total dental practices closed to NHS patients, 1999–2005*
NHS board area 1998–19991
1999–20002
2000–20012
2001–20023
2002–20033
2003–20043
2004–20053,4
Total
Ayrshire & Arran 2 2 3 4 0 0 0 11Borders 0 0 0 0 0 1 0 1Argyll & Clyde 0 0 0 2 0 1 0 3Fife 0 0 0 2 1 1 1 5Greater Glasgow 2 2 2 3 3 2 1 15Highland 4 3 4 1 3 2 2 19Lanarkshire 0 1 0 1 1 0 0 3Grampian 1 0 0 2 1 4 0 8Orkney 0 0 0 1 0 0 0 1Lothian 1 2 3 2 3 5 1 17Tayside 2 2 2 1 2 6 1 16Forth Valley 0 0 1 0 2 0 0 3Western Isles 1 2 0 0 0 0 0 3Dumfries & Galloway 0 0 2 0 0 0 0 2Shetland 0 0 1 0 2 0 0 3Scotland 13 14 18 19 18 22 6 110
1Parliamentary question S1W-33454.2Parliamentary question S2W-12427.3Parliamentary question S2W-8992.42005 part year.

�0 Remote and Rural Dentistry
Chapter 4
Patient access: current service provision
�� Remote and Rural Dentistry
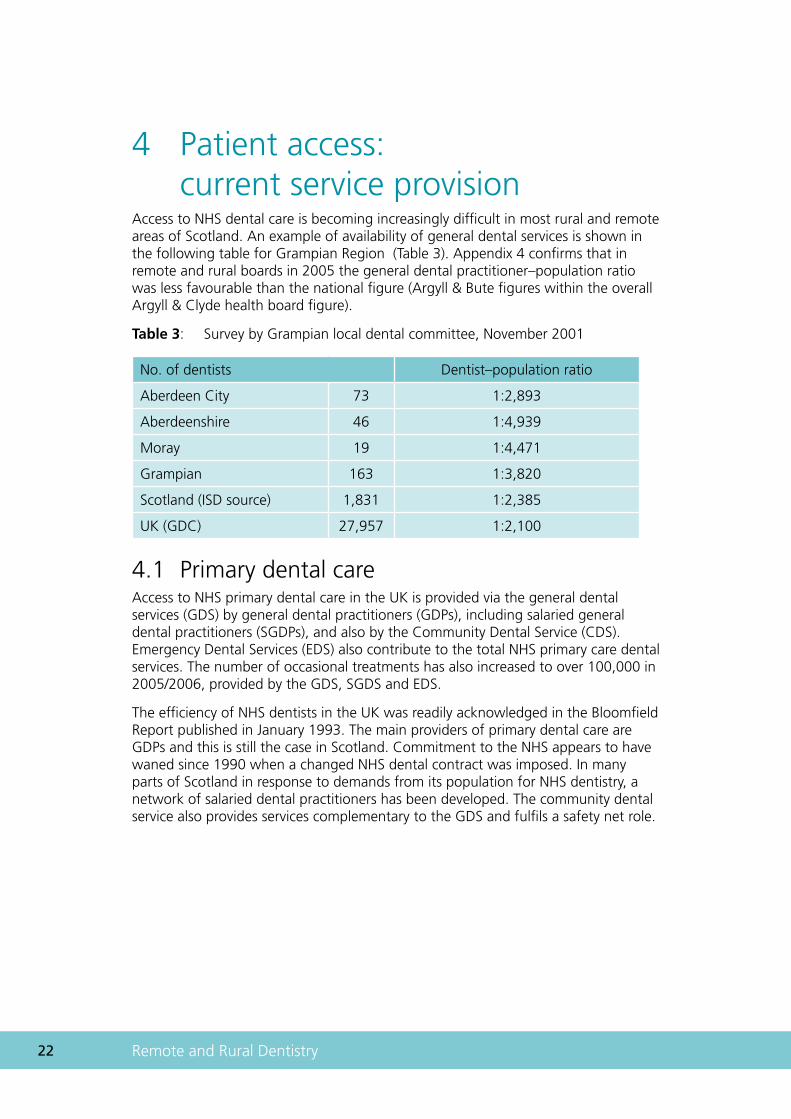
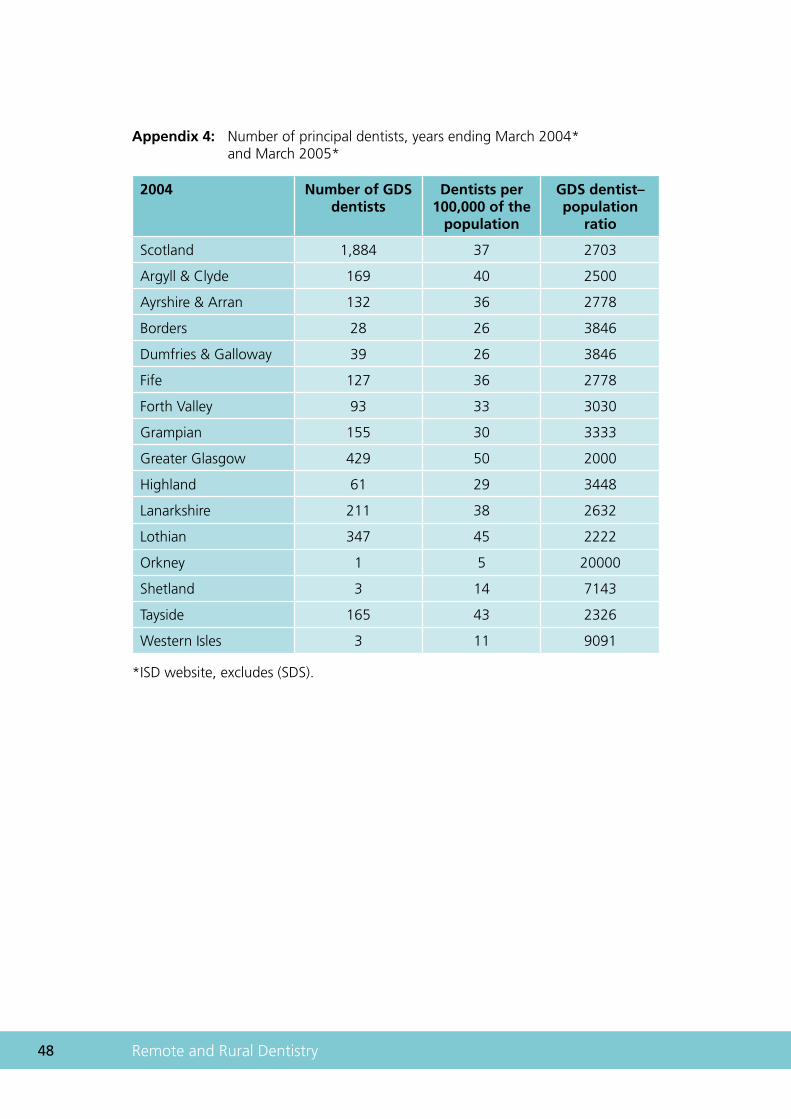
4 Patient access: current service provisionAccess to NHS dental care is becoming increasingly difficult in most rural and remote areas of Scotland. An example of availability of general dental services is shown in the following table for Grampian Region (Table 3). Appendix 4 confirms that in remote and rural boards in 2005 the general dental practitioner–population ratio was less favourable than the national figure (Argyll & Bute figures within the overall Argyll & Clyde health board figure).
Table 3: Survey by Grampian local dental committee, November 2001
No. of dentists Dentist–population ratio
Aberdeen City 73 1:2,893
Aberdeenshire 46 1:4,939
Moray 19 1:4,471
Grampian 163 1:3,820
Scotland (ISD source) 1,831 1:2,385
UK (GDC) 27,957 1:2,100
4.1 Primary dental careAccess to NHS primary dental care in the UK is provided via the general dental services (GDS) by general dental practitioners (GDPs), including salaried general dental practitioners (SGDPs), and also by the Community Dental Service (CDS). Emergency Dental Services (EDS) also contribute to the total NHS primary care dental services. The number of occasional treatments has also increased to over 100,000 in 2005/2006, provided by the GDS, SGDS and EDS.
The efficiency of NHS dentists in the UK was readily acknowledged in the Bloomfield Report published in January 1993. The main providers of primary dental care are GDPs and this is still the case in Scotland. Commitment to the NHS appears to have waned since 1990 when a changed NHS dental contract was imposed. In many parts of Scotland in response to demands from its population for NHS dentistry, a network of salaried dental practitioners has been developed. The community dental service also provides services complementary to the GDS and fulfils a safety net role.
��
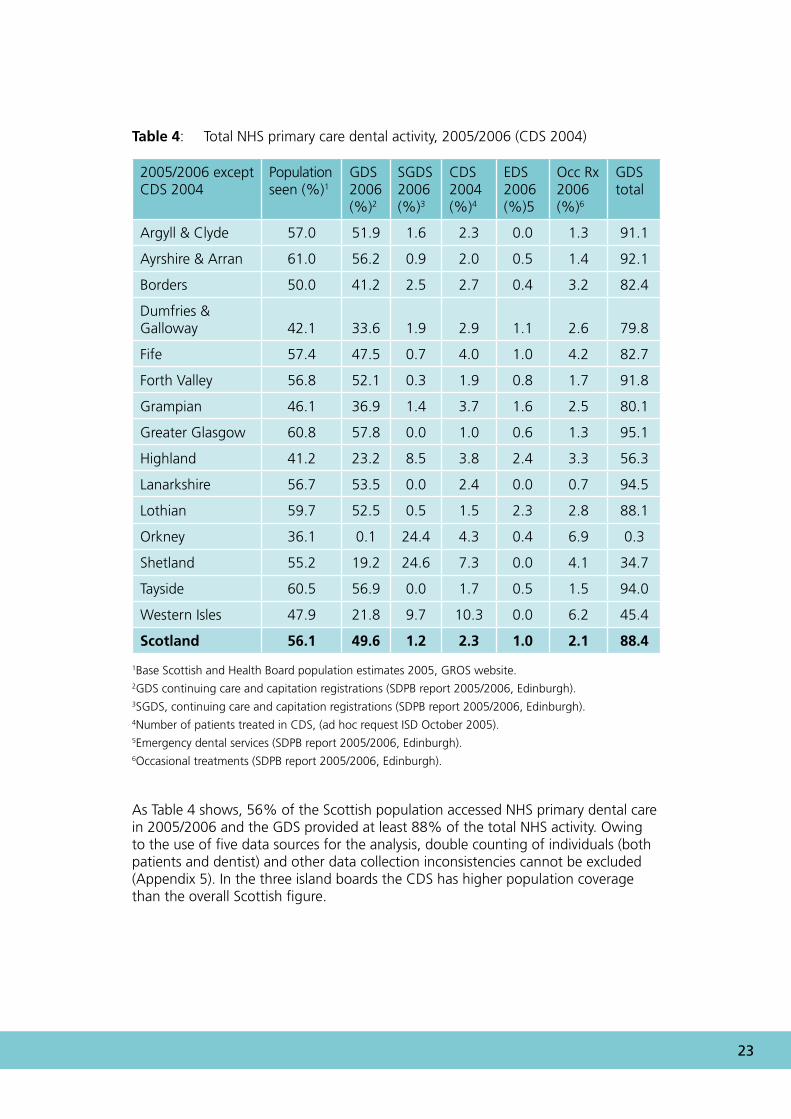
Table 4: Total NHS primary care dental activity, 2005/2006 (CDS 2004)
2005/2006 except CDS 2004
Population seen (%)1
GDS 2006 (%)2
SGDS 2006 (%)3
CDS 2004 (%)4
EDS 2006 (%)5
Occ Rx 2006 (%)6
GDS total
Argyll & Clyde 57.0 51.9 1.6 2.3 0.0 1.3 91.1
Ayrshire & Arran 61.0 56.2 0.9 2.0 0.5 1.4 92.1
Borders 50.0 41.2 2.5 2.7 0.4 3.2 82.4
Dumfries & Galloway 42.1 33.6 1.9 2.9 1.1 2.6 79.8
Fife 57.4 47.5 0.7 4.0 1.0 4.2 82.7
Forth Valley 56.8 52.1 0.3 1.9 0.8 1.7 91.8
Grampian 46.1 36.9 1.4 3.7 1.6 2.5 80.1
Greater Glasgow 60.8 57.8 0.0 1.0 0.6 1.3 95.1
Highland 41.2 23.2 8.5 3.8 2.4 3.3 56.3
Lanarkshire 56.7 53.5 0.0 2.4 0.0 0.7 94.5
Lothian 59.7 52.5 0.5 1.5 2.3 2.8 88.1
Orkney 36.1 0.1 24.4 4.3 0.4 6.9 0.3
Shetland 55.2 19.2 24.6 7.3 0.0 4.1 34.7
Tayside 60.5 56.9 0.0 1.7 0.5 1.5 94.0
Western Isles 47.9 21.8 9.7 10.3 0.0 6.2 45.4
Scotland 56.1 49.6 1.2 2.3 1.0 2.1 88.4
1Base Scottish and Health Board population estimates 2005, GROS website.2GDS continuing care and capitation registrations (SDPB report 2005/2006, Edinburgh).3SGDS, continuing care and capitation registrations (SDPB report 2005/2006, Edinburgh).4Number of patients treated in CDS, (ad hoc request ISD October 2005).5Emergency dental services (SDPB report 2005/2006, Edinburgh).6Occasional treatments (SDPB report 2005/2006, Edinburgh).
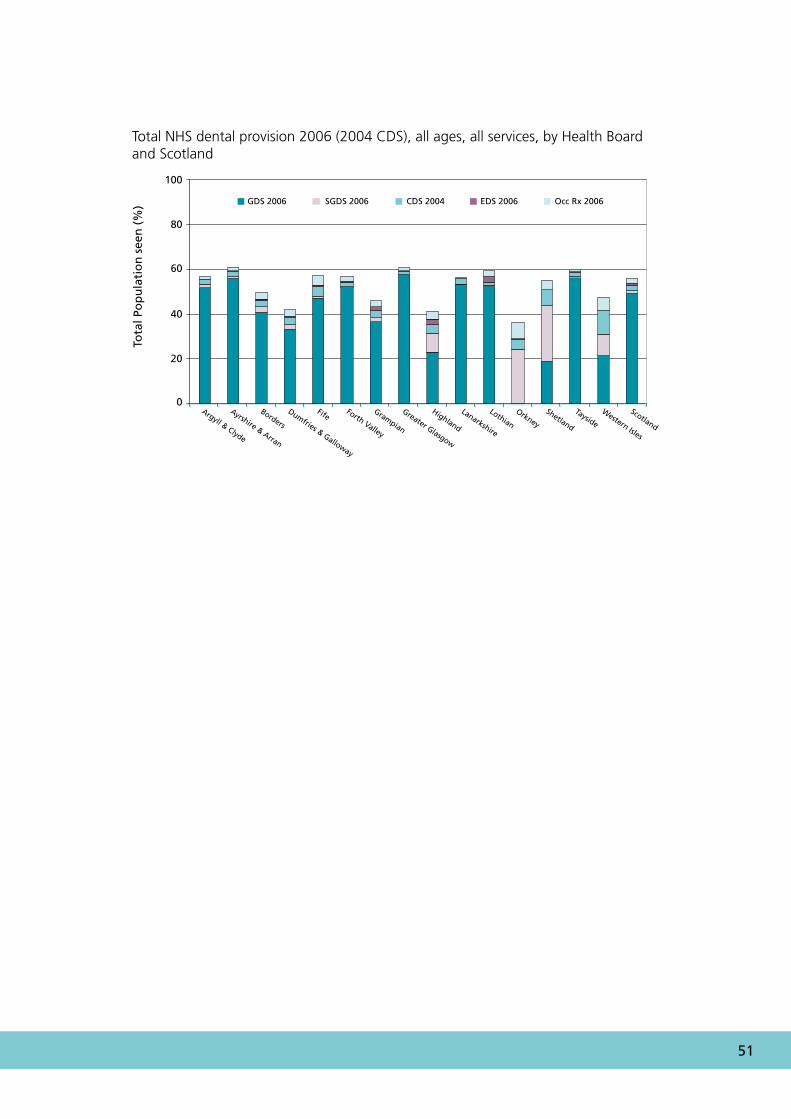
As Table 4 shows, 56% of the Scottish population accessed NHS primary dental care in 2005/2006 and the GDS provided at least 88% of the total NHS activity. Owing to the use of five data sources for the analysis, double counting of individuals (both patients and dentist) and other data collection inconsistencies cannot be excluded (Appendix 5). In the three island boards the CDS has higher population coverage than the overall Scottish figure.
�� Remote and Rural Dentistry
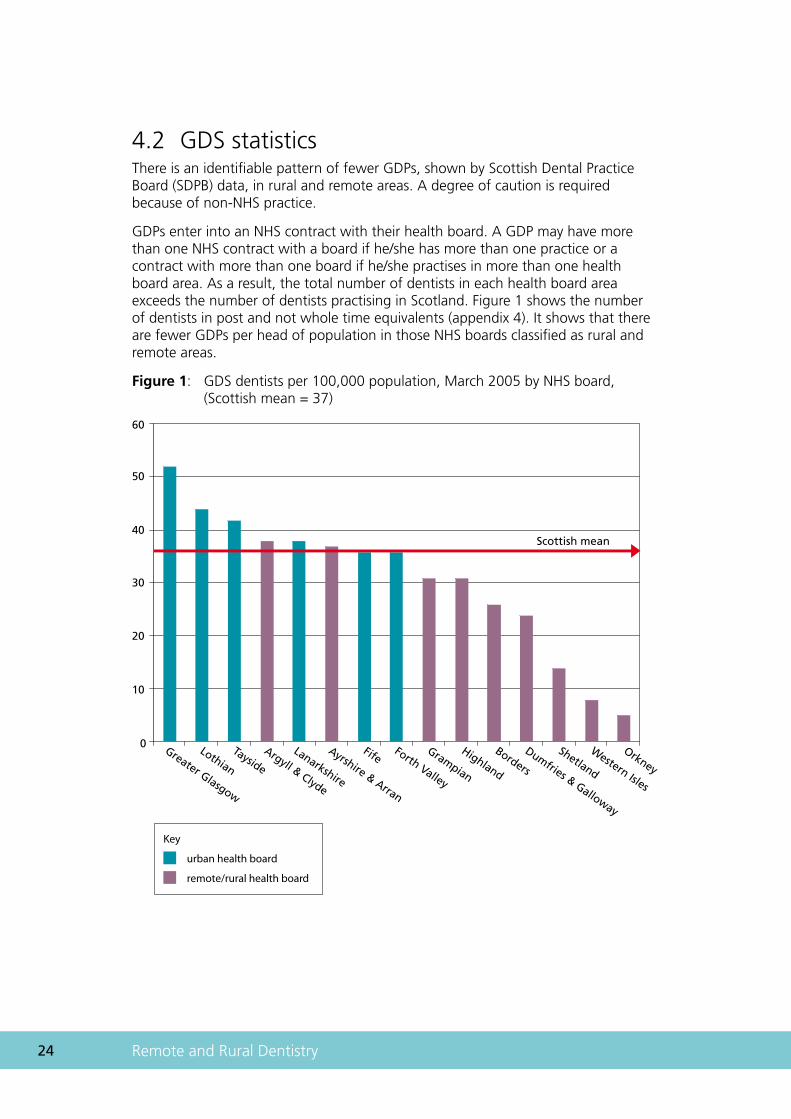
4.2 GDS statisticsThere is an identifiable pattern of fewer GDPs, shown by Scottish Dental Practice Board (SDPB) data, in rural and remote areas. A degree of caution is required because of non-NHS practice.
GDPs enter into an NHS contract with their health board. A GDP may have more than one NHS contract with a board if he/she has more than one practice or a contract with more than one board if he/she practises in more than one health board area. As a result, the total number of dentists in each health board area exceeds the number of dentists practising in Scotland. Figure 1 shows the number of dentists in post and not whole time equivalents (appendix 4). It shows that there are fewer GDPs per head of population in those NHS boards classified as rural and remote areas.
Figure 1: GDS dentists per 100,000 population, March 2005 by NHS board, (Scottish mean = 37)
Greater Glasgow
Lothian
Tayside
Argyll & Clyde
Lanarkshire
Ayrshire & Arran
FifeForth Valley
Grampian
Highland
Borders
Dumfries & Galloway
Shetland
Western Isles
Orkney
Scottish mean
60
50
40
30
20
10
0
Key
urban health board
remote/rural health board
��
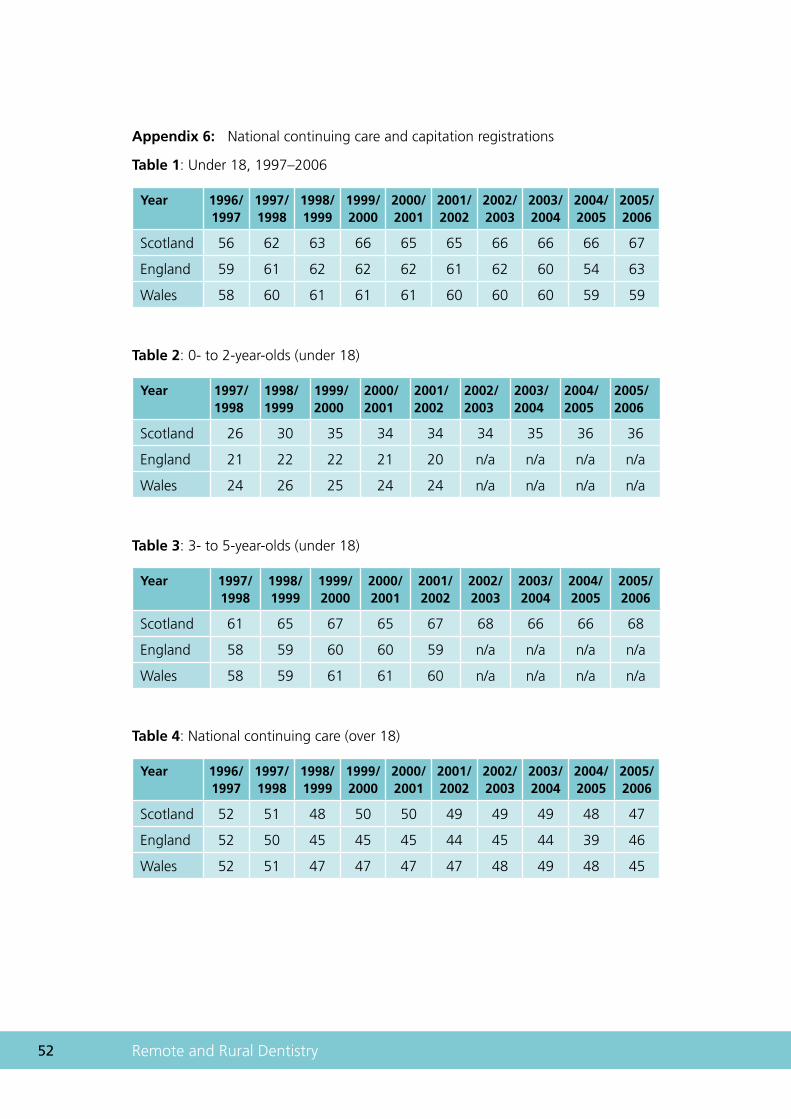
GDPs formerly registered NHS patients for a period of 15 months (this has now increased to 36 months since April 2005). The percentage of capitation patients (under 18 years) registered in Scotland rose by 11% from 1996 to 2000 and has remained static (Appendix 6). The number of young children registered on the NHS in Scotland has also risen since enhanced capitation was introduced in 1996 (Appendix 6). The percentage of adults registered with an NHS dentist in Scotland has remained similar over the last 10 years, whereas it has fallen in England and Wales. Once again NHS dental registration data are available only by health board. Registration data by CHP would provide a useful local dataset to allow planning by the smaller health service-defined localities.
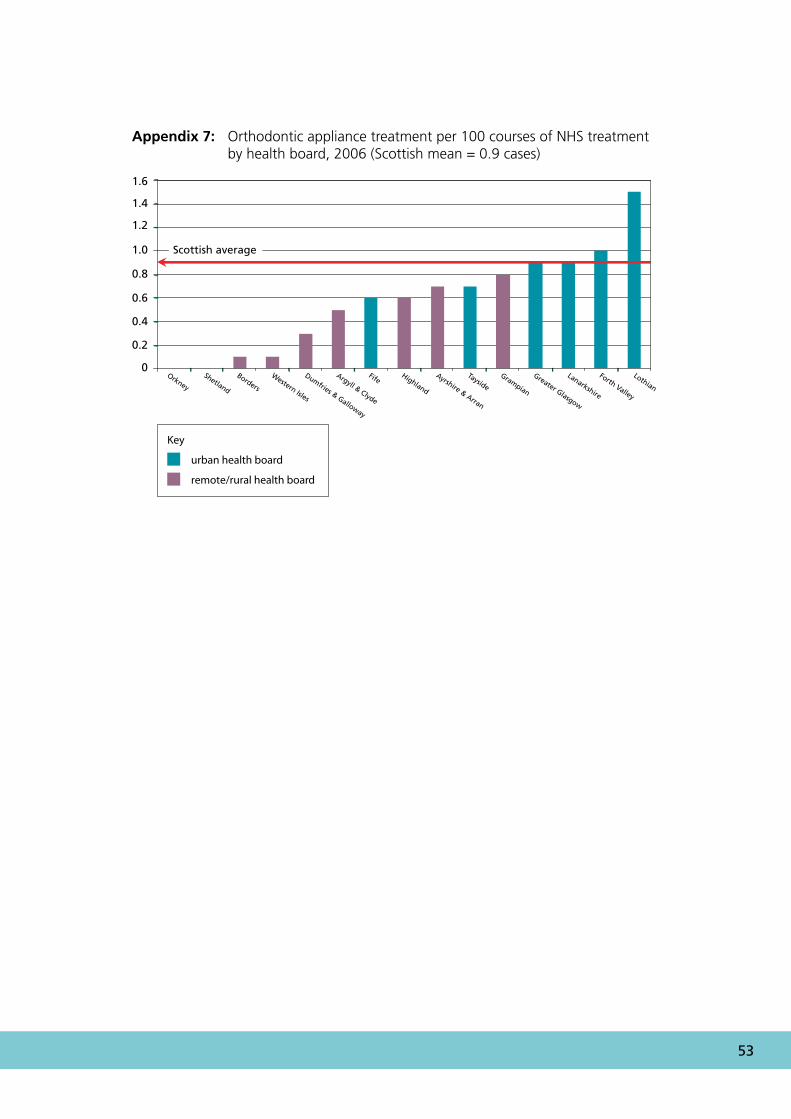
In remote and rural areas there also appears to be considerably less orthodontic treatment undertaken in the GDS, which may be a reflection of training needs or a relative shortage of specialist practitioners. This increases waiting lists for providers of secondary care services in remote and rural areas (Appendix 7).
4.3 Community dental serviceFrom the Scottish total of 282 community dentists (ISD September 2005), 123 (headcount, 47%) practice within rural areas. This figure supports other data that show that there are disproportionately more community dentists working in remote and rural areas.
4.4 Salaried dental servicesCentral guidance (1997 PCA(D) 10) states that health boards have responsibility for monitoring the availability of GDS in their areas. If a health board is concerned that existing GDS provision is insufficient to meet the demand and needs of the population, no independent GDP is available or willing to fill the gap and that the CDS ‘safety net’ is temporarily unable to meet these exceptional circumstances then the health board may ask the Secretary of State, under Section 33 of the NHS (Scotland) Act 1978, to approve the appointment of a salaried dentist: power to deal with the unusual situation where the provision of services to a locality or part of a locality is inadequate.
Although no collation of data is undertaken, it is widely reported that recruitment to salaried posts has been difficult in recent years. The national terms and conditions, under which these dentists work, cannot be varied to address local problems of recruitment. From 1 April 2005 the responsibility for approving salaried dentists was devolved to NHS boards (NHS: 2005 PCA(D)3). NHS boards can approve salaried dentists when there is clear evidence of the need for such a post to ensure GDS provision. The cost of posts including support staff is met by GDS funding and so does not fall directly on the budget of NHS boards. Using a simple headcount, the salaried dental service manpower in Scotland was around 10% (224 out of 2301) of the GDS workforce in March 2006 (ISD).
All of the health boards within rural and remote areas are experiencing problems and are improving access to NHS dentistry using SGDPs. Out of the 84 SGDPs in Scotland, 64% were in boards covering rural areas in 2002.
�� Remote and Rural Dentistry
There is a presumption that the independent GDS is a more efficient service although we found little robust information on which to base a cost–benefit/cost-effectiveness analysis of general dental and salaried services. Similarly, a shortage of information on quality and efficiency of these two branches of dentistry hampers comparison of the performance management of these two services. Cost–benefit/cost-effectiveness comparing general dental and salaried services should be undertaken.
�.�.� Salary-plus-bonusdentists(Woodsidetermsandconditions)These appointments operate under the same terms and conditions of employment as other salaried dentists but the arrangements for remuneration are different. Salary plus bonus arrangements are designed to encourage dentists to deliver a high level of productivity, achieving more effective use of resources. In 2001/2002, only one salaried dentist was employed under this contract in Scotland and at present there is none. It is recommended that the Scottish Executive Health Department (SEHD) explores the feasibility of an updated and attractive salary-plus-bonus scheme.
�.�.� Conversiontofee-earningbasisSalaried dentists may apply to the health board to convert to independent fee-earning status but, before permission is granted, satisfactory arrangements must be in place regarding the financial and other arrangements for the use by the dentist of the premises, staff and equipment. It is recommended that the option of converting from salaried to independent contractor status be regularly explored, in line with current guidance.
In 1993/1994 there were 40 ‘health centre’ or salaried dentists in Scotland (DPB 1994 – 97, ISD website 2006). By March 2006 this had risen to 224 salaried dentists approved under these regulations. Care must be taken when interpreting these figures because they are not all full time, and emergency service dentists who work on a sessional basis may be included in the overall figure.
�.�.� OtherissuesUndergraduate outreach in the salaried and community dental services in rural areas may help future recruitment and should be developed for dental students just as medical students currently benefit from corresponding medical undergraduate outreach.
Salaried dentists and community dental officers provide satellite services in remote areas, which may involve many hours of travel to and from remote settlements. Flexibility in contracts for daily hours worked by dentists and support staff would allow more surgery time to see patients on days spent providing such services.
Salaried dentists can also be employed to provide specialist services. Most recently the SEHD has supported the development of salaried orthodontic, paediatric dentistry, special needs and surgical dentistry practitioners in a primary care setting.
�7
4.5 Secondary dental care servicesNo reports of patient outcomes related to remote and rural dental services were found. However, there are a small number of reports of other secondary medical care services. For example, cancer patients in Scotland who live distant from a treatment centre have been reported to have poorer survival figures than those who live near the centres (Campbell et al., 2000; 2001). The same phenomenon has been noted in other countries (Launoy et al., 1992). This may be due to late presentation or diagnosis which, in turn, may be due to travel difficulties that present an additional burden (Baird and Gillies 2000). Higher death rates from asthma have been reported previously in the rural areas of Scotland (Wilson 1984) and more recent research in the UK has confirmed that asthma mortality increases with distance from hospital (Jones and Bentham, 1997). The risk of developing diabetic retinopathy, a major cause of preventable blindness, is greater in Scottish rural patients (Leese et al., 1993). Clearly, further research is needed to gauge the importance of rurality to oral health.
4.6 Dental specialtiesNewton et al. (2005) reported that there are no data on the numbers of WTE hospital dentists at a health board level. They also commented that although the modelling for the GDS workforce takes into consideration supply, utilisation and demand (NES, 2004), there has been no parallel modelling for hospital dental services and little is known about the need for these services in Scotland.
Information on hospital dental service activity comes from the ISD(S)1 hospital activity statistics and SMR01 general acute inpatient and day case records. There are few readily available data for the hospital sector other than the total numbers of dentists working in the hospital sector, and the total numbers of new patients seen/total attendances for the different dental specialties. The numbers of patients receiving treatment as inpatients and day cases according to dental specialty are also available. Information on waiting times for different dental specialties at a health board level is a general indicator of where demand exceeds supply of those services. Newton et al. (2005) concluded:
The data indicate that on 31 March 2004, waiting times and waiting lists varied widely between Health Boards, and between different specialties. Local problems were evident such as long waiting times for the first orthodontic outpatient appointment in Borders and Dumfries & Galloway, long waiting times for the first oral surgery and oral medicine outpatient appointment in Lothian, and high numbers of patients on oral surgery waiting lists in Greater Glasgow and Lothian. In most Health Boards, patients were generally kept waiting longer for the first outpatient appointment for orthodontics and restorative dentistry consultations than for oral surgery consultations. A study by Nuttall et al. (2002) suggests that access to secondary restorative dental care is poor in rural areas of Scotland, a finding corroborated by the data shown here.
(Newton et al., 2005)

�� Remote and Rural Dentistry
Table 5: Consultants in selected dental specialties
Headcount 1998 1999 2000
Restorative dentistry
O&
MFS
Orthodontics
Restorative dentistry
O&
MFS
Orthodontics
Restorative dentistry
O&
MFS
Orthodontics
Scotland 21 25 24 22 27 27 21 25 26
Argyll & Clyde – – 2 – – 2 – – 2
Ayrshire & Arran – 2 2 – 2 2 – 2 2
Borders – – 1 – – 1 – – 1
Dumfries & Galloway – – 1 – – 1
Fife – – 2 1 – 2 1
Forth Valley – – 1 3 – 1 3
Grampian 1 2 1 1 2 1
Greater Glasgow 12 4 13 9 6 11 7 5
Highland – – 1 2 – 1 2
Lanarkshire – 3 – 1 3 – 2 3
Lothian 3 4 2 4 4 2
Orkney – – – – – – – – –
Shetland – – – – – – – – –
Tayside 6 4 3 5 4 3 5 4 3
Western Isles – – – – – – – – –
Scottish Parliament website, written answer (S1W-20038).
O&MFS, oral and maxillofacial surgery.
Note: Figures include honorary appointments. Rates per head of population are based on population estimates as at mid June of respective years. Consultants in these specialties can and do offer services to patients in health board areas other than those in which they are based. Maxillofacial surgery is not separately classified in central data up to 2000; these surgeons will be classified either as oral surgeons or plastic surgeons.
��
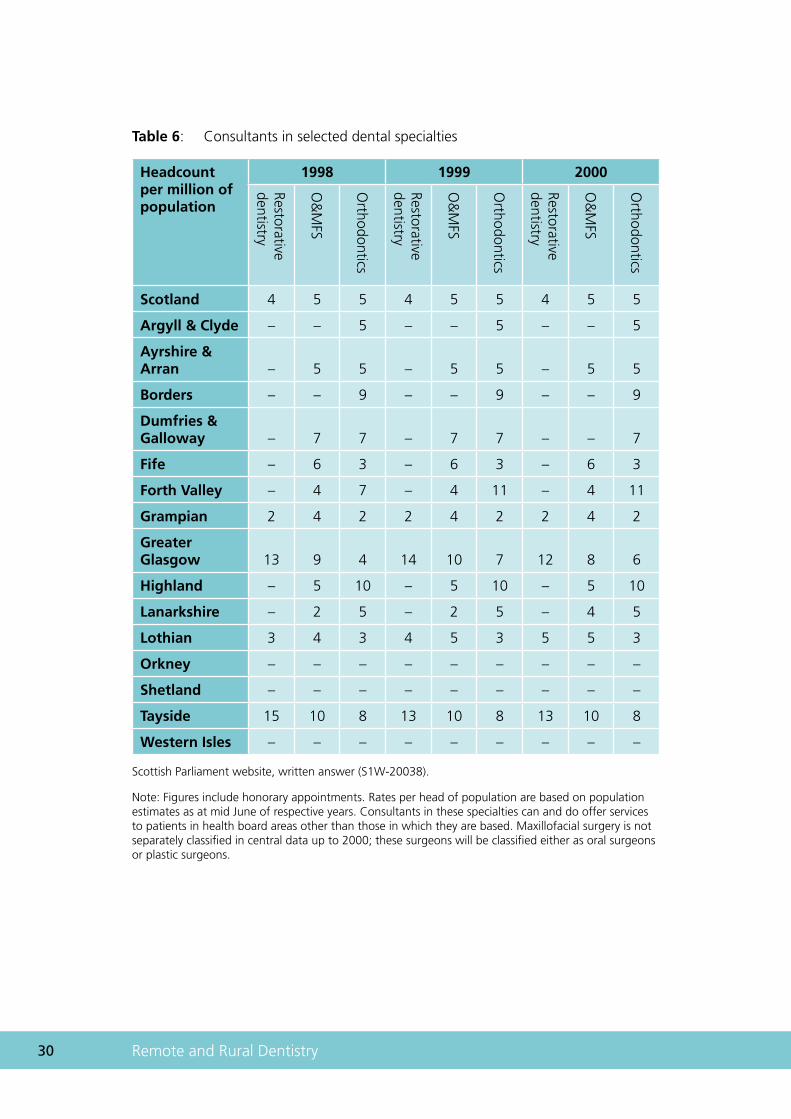
Information on the provision of consultants providing a service in restorative dentistry, oral and maxillofacial surgery (O&MFS) and orthodontics in each health board area from 1998 to 2000 is expressed as a headcount (table 5) and as a ratio of consultants per million of the population (table 6) in each health board area. Consultants in these dental specialties offer services to patients from health board areas other than the one in which they are based. It should therefore be noted that the ratio of consultants to head of population does not necessarily reflect the level of consultant service available in any area. Treatment provided by consultants in a particular board may be provided by other grades of staff in other boards, which further complicates comparisons between areas.
The historical figures suggest that there is a shortage of hospital-based consultants in most rural health boards. There is also little up-to-date information to show access to secondary dental care has generally improved since the year 2000.
�0 Remote and Rural Dentistry
Table 6: Consultants in selected dental specialties
Headcount per million of population
1998 1999 2000
Restorative dentistry
O&
MFS
Orthodontics
Restorative dentistry
O&
MFS
Orthodontics
Restorative dentistry
O&
MFS
Orthodontics
Scotland 4 5 5 4 5 5 4 5 5
Argyll & Clyde – – 5 – – 5 – – 5
Ayrshire & Arran – 5 5 – 5 5 – 5 5
Borders – – 9 – – 9 – – 9
Dumfries & Galloway – 7 7 – 7 7 – – 7
Fife – 6 3 – 6 3 – 6 3
Forth Valley – 4 7 – 4 11 – 4 11
Grampian 2 4 2 2 4 2 2 4 2
Greater Glasgow 13 9 4 14 10 7 12 8 6
Highland – 5 10 – 5 10 – 5 10
Lanarkshire – 2 5 – 2 5 – 4 5
Lothian 3 4 3 4 5 3 5 5 3
Orkney – – – – – – – – –
Shetland – – – – – – – – –
Tayside 15 10 8 13 10 8 13 10 8
Western Isles – – – – – – – – –
Scottish Parliament website, written answer (S1W-20038).
Note: Figures include honorary appointments. Rates per head of population are based on population estimates as at mid June of respective years. Consultants in these specialties can and do offer services to patients in health board areas other than those in which they are based. Maxillofacial surgery is not separately classified in central data up to 2000; these surgeons will be classified either as oral surgeons or plastic surgeons.
��
The recruitment and retention difficulties experienced in primary dental care apply equally to secondary care dental services across remote and rural areas of Scotland, resulting in poorer patient access to secondary care services and increased waiting times for treatment.
4.7 Tertiary dental careIn Scotland, a managed clinical network is the preferred model of service delivery for tertiary dental care in sub-specialties, including head and neck cancer services, oral medicine and oral pathology, and cleft lip and palate services.

�� Remote and Rural Dentistry
Chapter 5
Health economic perspective
�� Remote and Rural Dentistry
5 Health economic perspectiveGiven the lack of available information with which to analyse the effect of remoteness and rurality on oral health outcomes, this section concentrates on the issue of access to dental services. However, it should be noted that these data are now up to six years out of date.
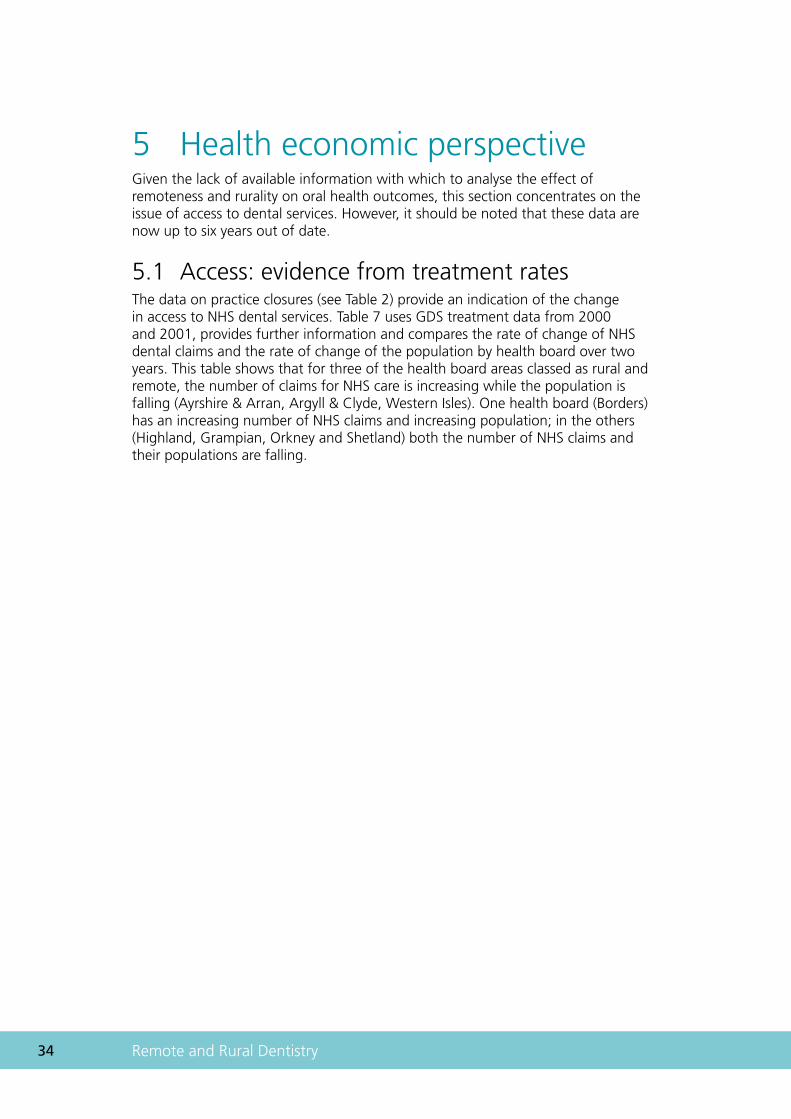
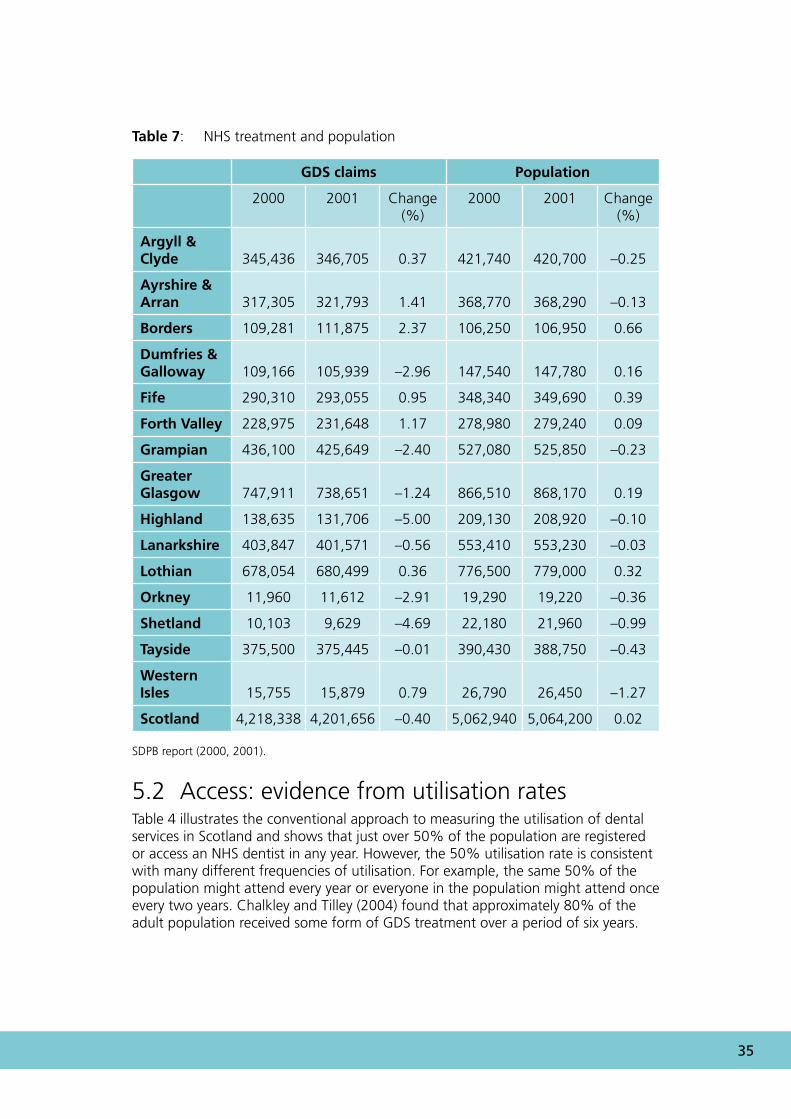
5.1 Access: evidence from treatment ratesThe data on practice closures (see Table 2) provide an indication of the change in access to NHS dental services. Table 7 uses GDS treatment data from 2000 and 2001, provides further information and compares the rate of change of NHS dental claims and the rate of change of the population by health board over two years. This table shows that for three of the health board areas classed as rural and remote, the number of claims for NHS care is increasing while the population is falling (Ayrshire & Arran, Argyll & Clyde, Western Isles). One health board (Borders) has an increasing number of NHS claims and increasing population; in the others (Highland, Grampian, Orkney and Shetland) both the number of NHS claims and their populations are falling.
��
Table 7: NHS treatment and population
GDS claims Population
2000 2001 Change (%)
2000 2001 Change (%)
Argyll & Clyde 345,436 346,705 0.37 421,740 420,700 –0.25
Ayrshire & Arran 317,305 321,793 1.41 368,770 368,290 –0.13
Borders 109,281 111,875 2.37 106,250 106,950 0.66
Dumfries & Galloway 109,166 105,939 –2.96 147,540 147,780 0.16
Fife 290,310 293,055 0.95 348,340 349,690 0.39
Forth Valley 228,975 231,648 1.17 278,980 279,240 0.09
Grampian 436,100 425,649 –2.40 527,080 525,850 –0.23
Greater Glasgow 747,911 738,651 –1.24 866,510 868,170 0.19
Highland 138,635 131,706 –5.00 209,130 208,920 –0.10
Lanarkshire 403,847 401,571 –0.56 553,410 553,230 –0.03
Lothian 678,054 680,499 0.36 776,500 779,000 0.32
Orkney 11,960 11,612 –2.91 19,290 19,220 –0.36
Shetland 10,103 9,629 –4.69 22,180 21,960 –0.99
Tayside 375,500 375,445 –0.01 390,430 388,750 –0.43
Western Isles 15,755 15,879 0.79 26,790 26,450 –1.27
Scotland 4,218,338 4,201,656 –0.40 5,062,940 5,064,200 0.02
SDPB report (2000, 2001).
5.2 Access: evidence from utilisation ratesTable 4 illustrates the conventional approach to measuring the utilisation of dental services in Scotland and shows that just over 50% of the population are registered or access an NHS dentist in any year. However, the 50% utilisation rate is consistent with many different frequencies of utilisation. For example, the same 50% of the population might attend every year or everyone in the population might attend once every two years. Chalkley and Tilley (2004) found that approximately 80% of the adult population received some form of GDS treatment over a period of six years.
�� Remote and Rural Dentistry
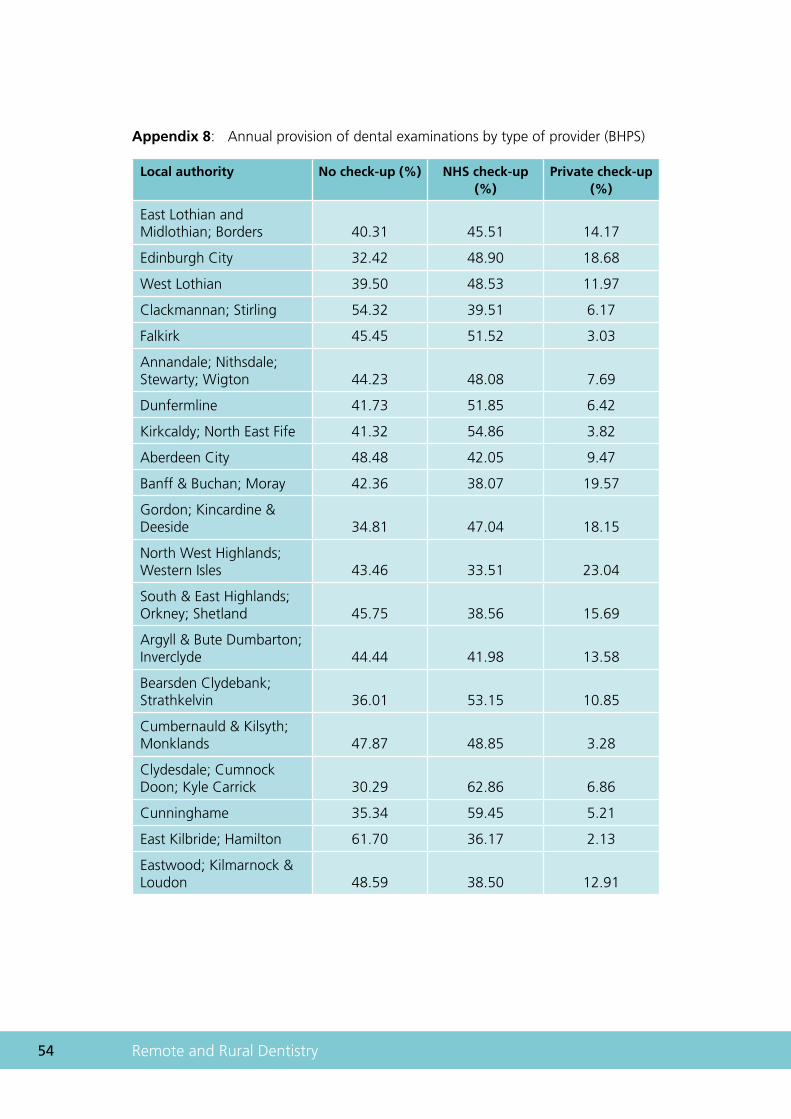
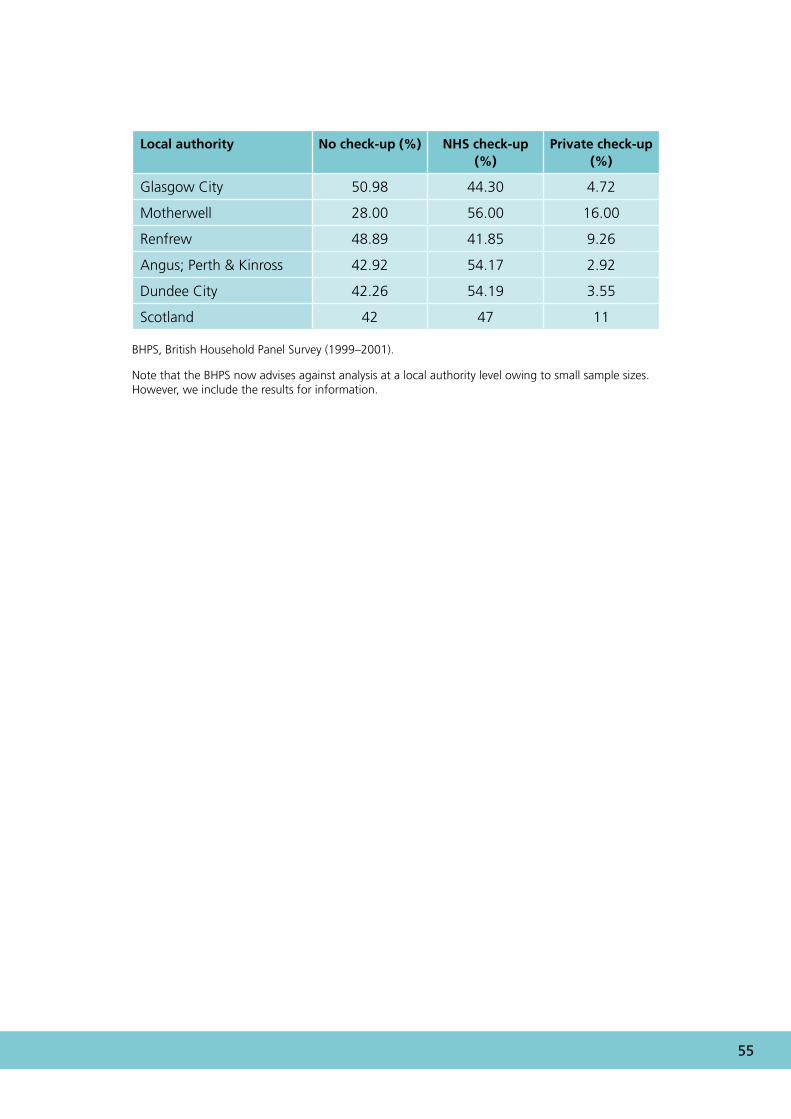
5.3 Access: evidence from the use of public and private dental servicesAlthough the main provider of NHS dental services in Scotland is the GDS, a significant amount of dental services are provided privately. The true extent of the problem of access to dental services may be overstated by the failure of analyses to include those dental treatments that are provided privately. Appendix 8 provides data on the frequency of adult dental examinations by type of provider for a number of local authority areas in Scotland. These data are provided by the British Household Panel Survey1 and relate to the period from 1999 to 2001.
For the three Grampian areas (Banff, Buchan and Moray), the table in Appendix 8 is in contrast with the inference that could be drawn from Table 3: the table in Appendix 8 shows that adults in Banff, Buchan and Moray are more likely to attend for a dental examination per annum (both NHS and private) than adults in Aberdeen City yet the ratio of dentists to population in the rural areas is less favourable. This underscores the importance of considering data from a wide number of data sources before drawing inferences. Note that the British Household Panel Survey (BHPS) now advises against analysis at a local authority level owing to small sample sizes. However, we include the results for information to illustrate contradictions in data.
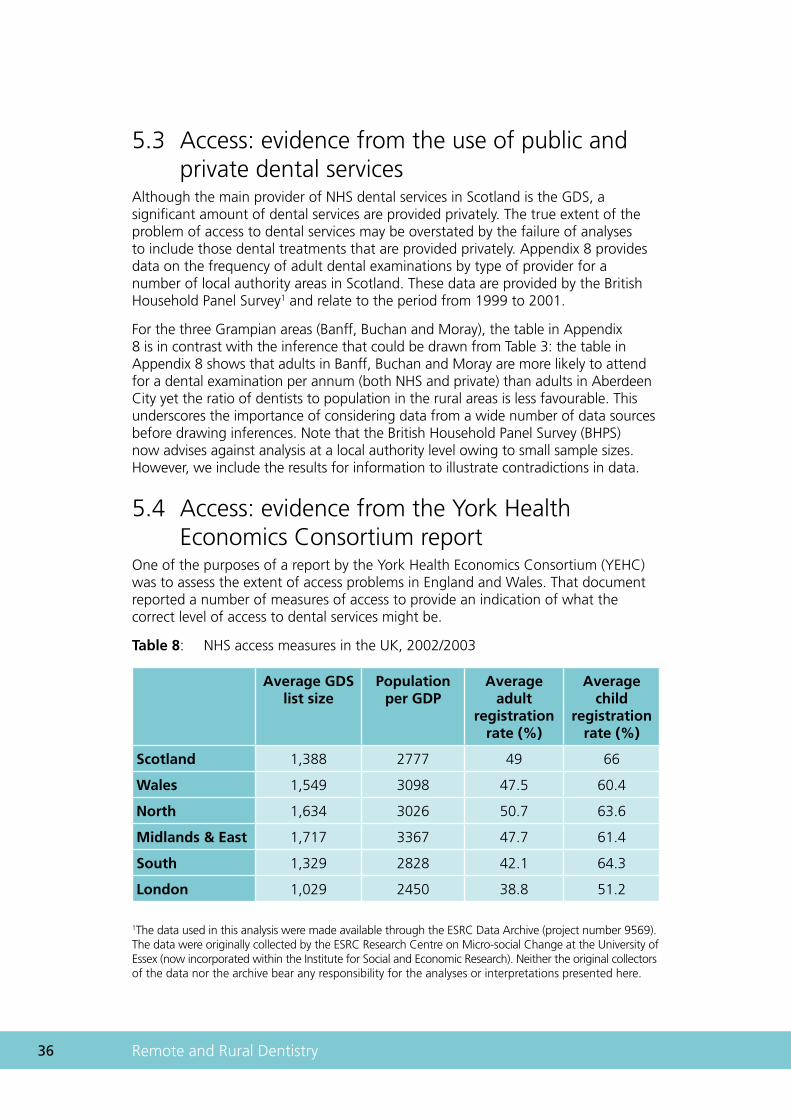
5.4 Access: evidence from the York Health Economics Consortium reportOne of the purposes of a report by the York Health Economics Consortium (YEHC) was to assess the extent of access problems in England and Wales. That document reported a number of measures of access to provide an indication of what the correct level of access to dental services might be.
Table 8: NHS access measures in the UK, 2002/2003
Average GDS list size
Population per GDP
Average adult
registration rate (%)
Average child
registration rate (%)
Scotland 1,388 2777 49 66
Wales 1,549 3098 47.5 60.4
North 1,634 3026 50.7 63.6
Midlands & East 1,717 3367 47.7 61.4
South 1,329 2828 42.1 64.3
London 1,029 2450 38.8 51.2
1The data used in this analysis were made available through the ESRC Data Archive (project number 9569). The data were originally collected by the ESRC Research Centre on Micro-social Change at the University of Essex (now incorporated within the Institute for Social and Economic Research). Neither the original collectors of the data nor the archive bear any responsibility for the analyses or interpretations presented here.
�7
The measures of access reported in Table 8 imply that access to NHS dental services in Scotland is better than in other regions of the UK. However, there are a number of limitations to using these dentist–population ratios as access indicators; they mask a great deal of access variation at local levels, they do not take need into account and the optimal dentist–population ratio is unknown. The Taylor Report also recommended that the, ‘Appropriate levels of NHS dental provision per population in each CHP should be quantified and targets developed by NHS Boards’ (HDL(2006)57).
5.5 InformationThis report has identified that there are a number of sources of information available that indicate the extent of NHS access problems. Unfortunately, the evidence provided by these sources is suggestive rather than definitive. Moreover, because of lags in the data collection process or a lack of information on the right data (or both), some of these access measures are unable to reflect the experience of professionals in remote and rural areas. In particular, there is a great deal of anecdotal evidence of recruitment and retention difficulties, particularly in rural and remote areas. However, there are at present no information systems to collect and analyse these data in order to provide information on the location and scale of these difficulties. Therefore, we recommend that structured collection of data on vacancies and recruitment problems should be co-ordinated nationally to assess this issue more accurately.
These, and other, access-related indicators could usefully be collected and analysed centrally. This would have a number of advantages: (1) the data could be collected and analysed routinely; (2) standardised data systems and data definitions would facilitate inter- and intra-area comparisons; and (3) this would provide health boards and the Scottish Executive with a standardised set of longitudinal data on which to assess applications for resources.

�� Remote and Rural Dentistry
Chapter 6
References
�0 Remote and Rural Dentistry
6. ReferencesBaird AG, Gillies JCM (2000). Obstetrics in rural practice: problem or solution? In Cox J (Ed.), Rural General Practice in the United Kingdom, RCGP Occasional paper 71, 23–25. Royal College of General Practitioners, London
Bloomfield K. (1993) A Fundamental Review of Dental Remuneration. HMSO, London
Campbell NC, Elliot AM, Sharp L, Ritchie LD, Cassidy J and Little J (2000). Rural factors and survival from cancer: analysis of Scottish cancer registrations. British Journal of Cancer, 82, 1863–1866
Campbell NC, Elliott AM, Sharp L, Ritchie LD, Cassidy J and Little J (2001). Rural and urban differences in stage at diagnosis of colorectal and lung cancers. British Journal of Cancer, 84, 910–914
Chalkley MJ and Tilley CJ (2004). Measuring access to health services: general dental services in Scotland. Dundee discussion paper in economics, No. 163
Dewar J (1912). Highlands and Islands Medical Service Committee Report to the Lords Commissioner of His Majesty’s Treasury. Available: www.rarari.org.uk
Jones AP and Bentham G (1997). Health service accessibility and deaths from asthma in 401 local authority districts in England and Wales 1988–1992. Thorax, 52, 218–222
Jones CM, Woods K and Taylor GO (1997). Social deprivation and tooth decay in Scottish school children. Health Bulletin (Edinb), 55, 11–15
Launoy G, Le Coutour X, Gignoux M, Pottier D and Dugleux G (1992). Influence of rural environment on diagnosis, treatment and prognosis of colorectal cancer. Journal of Epidemiology and Community Health, 46, 365–367
Leese GP, Ahmed S, Newton RW, Jung RT, Ellingford A, Baines P, Roxburgh S and Coleiro J. (1993). Use of mobile screening unit for diabetic retinopathy in rural and urban areas. British Medical Journal, 16, 306:187–189
Merrett MCW, Goold S, Jones CM, Levin KA, McCall DR, Macpherson LMD, Nugent Z and Topping GVA (2005). National Dental Inspection Programme of Scotland. Report of the 2004 Survey of P1 children. Scottish Dental Epidemiological Co-ordinating Committee, Dundee
NES (2003). Report by a Working Group on Education and Training for the Dental Team in Remote and Rural Regions of Scotland. NHS Education for Scotland, Edinburgh. Available: www.nes.scot.nhs.uk/docs/publications
NES (2004). Workforce Planning for Dentistry in Scotland. NHS Education for Scotland, Edinburgh
Newton T, Williams A and Bower E (2005). Access to Dental Health Services in Scotland. Available: www.scottish.parliament.uk/business/committees/health/reports-05
��
Nuttall N, Steed M and Donachie M (2002). Referral for secondary restorative dental care in rural and urban areas of Scotland: findings from the Highlands and Islands Teledentistry Project. British Dental Journal, 192, 224–248
PHIS (2002). Community Care and Oral Health, Needs Assessment Report. Public Health Institute for Scotland, Glasgow
Pitts NB, Nugent ZJ and Smith P. (2000). The Scottish Health Boards’ Dental Epidemiological Programme Report of the 1999/2000 survey of 5-year-old children. University of Dundee, Dundee
Pitts NB, Evans DJ and Nugent ZJ (2001). The dental caries experience of 5-year-old children in Great Britain. Surveys co-ordinated by the British Association for the Study of Community Dentistry in 1999/2000. Community Dental Health, 18, 49–55
Russell E, Harrold T and Watson S (2001). A Scottish Survey of General and Community Dental Practitioners 2000. The Toothousand Project. Department of Public Health, University of Aberdeen, Aberdeen
Scottish Executive (2000). Our National Health. A Plan for Action: A Plan for Change. Scottish Executive, Edinburgh
Scottish Executive (2004). Annual Rural Report. Scottish Executive, Edinburgh
Scottish Executive Health Department (2005). Delivering for Health. Scottish Executive, Edinburgh
SDPB (2000). Scottish Dental Practice Board Annual Report, Edinburgh
SDPB (2001). Scottish Dental Practice Board Annual Report, Edinburgh
SIGN 43 (2000). Management of unerupted and impacted third molar teeth. Scottish Intercollegiate Guidelines Network, Edinburgh. Available: www.sign.ac.uk
SIGN 47 (2000). Preventing Dental Caries in 6- to 16-year-old children at high caries risk. Scottish Intercollegiate Guidelines Network, Edinburgh. Available: www.sign.ac.uk
SIGN 83 (2005). Prevention and Management of Dental Decay in the Pre-School Child. Scottish Intercollegiate Guidelines Network, Edinburgh. Available: www.sign.ac.uk
SNAP (1999). Oral Health Promotion, Scottish Needs Assessment Programme. Office for Public Health in Scotland, Glasgow
Sweeney P, McCall D, Nugent Z and Pitts N. (1997) Deprivation and dental caries. SHBDEP report. University of Dundee, Dundee
Wilson JM (1984). Asthma deaths in Scotland 1965–1980. Scottish Medical Journal, 29:2, 84–89.

�� Remote and Rural Dentistry
Appendices
�� Remote and Rural Dentistry
Appendix 1: Land area and population density, by administrative area, 30 June 2003
Estimated population
Area (square km)
Persons/ square km
Scotland 5,057,400 77,925 65
Council areas
Aberdeen City 206,600 186 1,112
Aberdeenshire 229,330 6,313 36
Angus 107,520 2,182 49
Argyll & Bute 91,300 6,909 13
Clackmannanshire 47,680 159 301
Dumfries & Galloway 147,210 6,426 23
Dundee City 143,090 60 2,392
East Ayrshire 119,530 1,262 95
East Dunbartonshire 106,970 175 613
East Lothian 91,090 679 134
East Renfrewshire 89,680 174 516
Edinburgh, City of 448,370 264 1,700
Eilean Siar 26,100 3,071 8
Falkirk 145,920 297 491
Fife 352,040 1,325 266
Glasgow City 577,090 175 3,288
Highland 209,080 25,659 8
Inverclyde 83,050 160 518
Midlothian 79,710 354 225
Moray 87,460 2,238 39
North Ayrshire 136,030 885 154
North Lanarkshire 321,820 470 685
Orkney Islands 19,310 990 20
Perth & Kinross 135,990 5,286 26
Renfrewshire 170,980 261 655
Scottish Borders 108,280 4,732 23
��
Estimated population
Area (square km)
Persons/ square km
Shetland 21,870 1,466 15
South Ayrshire 111,580 1,222 91
South Lanarkshire 303,010 1,772 171
Stirling 86,370 2,187 39
West Dunbartonshire 92,320 159 581
West Lothian 161,020 427 377
GROS mid-year population estimates.
�� Remote and Rural Dentistry
Appendix 2: Mean dmft of 5-year-old children 2002/2003 and Carstairs Index 2001 by health board, with best-fit regression line
0
1
2
3
4
-3 -2 -1 0 1 2 3 4
Mea
n d
mft
Highland
Carstairs Index 2001 census
Regression line equationy = 0.2849x + 2.7243
R2 = 0.43
Orkney
Grampian
Shetland Forth Valley
Borders
Dumfries & Galloway
Tayside
Fife
W. Isles
Ayrshire & Arran
Lanarkshire
Argyll & Clyde
LothianGlasgow
Mean dmft and percentage free of caries experience 5-year-olds, 2002/2003 by NHS Board*
Health board Mean dmft %dmft = 0
Scotland 2.76 44.6
Argyll & Clyde 3.67 34.2
Ayrshire & Arran 2.3 46.7
Borders 1.29 62.6
Dumfries & Galloway 2.30 50.9
Fife 2.41 54.3
Forth Valley 2.58 45.5
Grampian 2.22 48.9
Greater Glasgow 3.45 35.2
Highland 2.58 47.7
Lanarkshire 3.08 40.7
Lothian 2.66 46.3
Orkney 2.67 45.7
Shetland 2.06 51.6
Tayside 2.17 55.3
Western Isles 2.83 35.6
DHSRU website*.
�7
Appendix 3: SHBDEP adult dental survey 1993
Health board Persons with no teeth (%)
Persons with 20+ teeth (%)
Argyll & Clyde 21.4 57.4
Ayrshire & Arran 23.5 55.2
Borders 20.2 57.8
Dumfries & Galloway 23.6 54.1
Fife 22.3 60.3
Forth Valley 23.0 58.2
Grampian 22.3 60.0
Greater Glasgow 19.3 60.2
Highland 20.8 58.5
Lanarkshire 22.0 59.0
Lothian 16.8 66.0
Orkney 30.0 53.4
Shetland 25.6 59.3
Tayside 20.4 60.2
Western Isles 25.1 49.7
Scotland 20.8 59.8
�� Remote and Rural Dentistry
Appendix 4: Number of principal dentists, years ending March 2004* and March 2005*
2004 Number of GDS dentists
Dentists per 100,000 of the
population
GDS dentist–population
ratio
Scotland 1,884 37 2703
Argyll & Clyde 169 40 2500
Ayrshire & Arran 132 36 2778
Borders 28 26 3846
Dumfries & Galloway 39 26 3846
Fife 127 36 2778
Forth Valley 93 33 3030
Grampian 155 30 3333
Greater Glasgow 429 50 2000
Highland 61 29 3448
Lanarkshire 211 38 2632
Lothian 347 45 2222
Orkney 1 5 20000
Shetland 3 14 7143
Tayside 165 43 2326
Western Isles 3 11 9091
*ISD website, excludes (SDS).
��
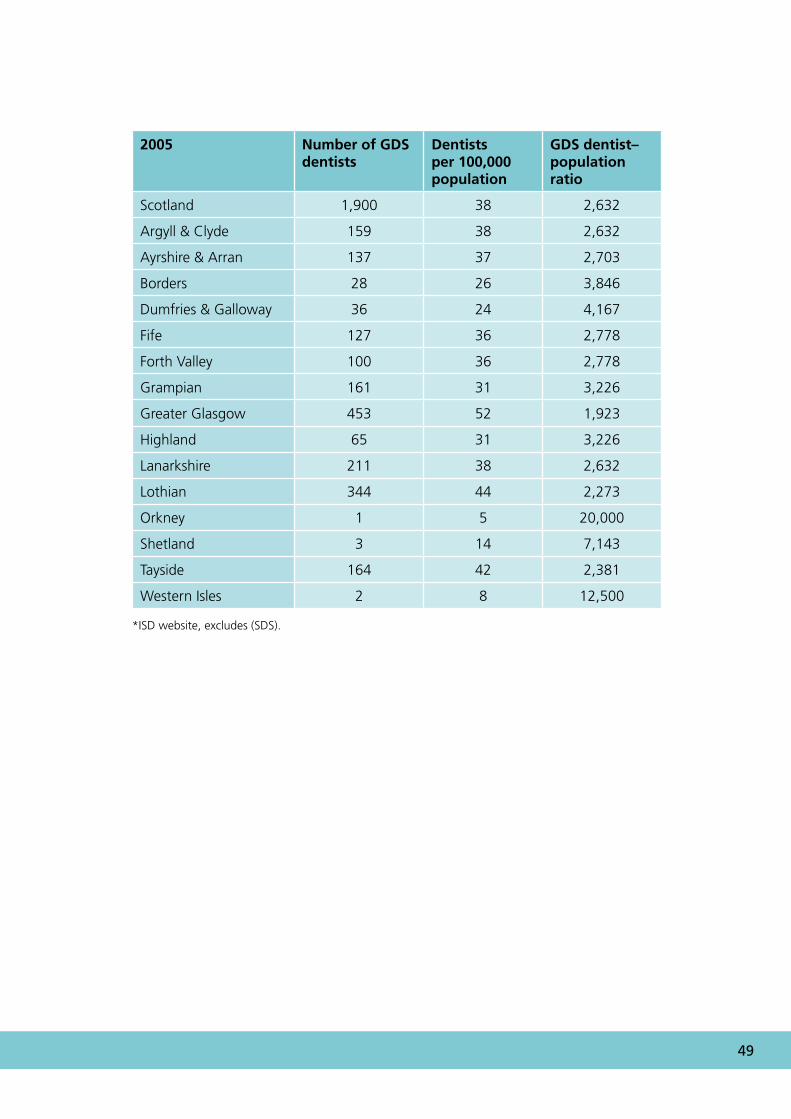
2005 Number of GDS dentists
Dentists per 100,000 population
GDS dentist–population ratio
Scotland 1,900 38 2,632
Argyll & Clyde 159 38 2,632
Ayrshire & Arran 137 37 2,703
Borders 28 26 3,846
Dumfries & Galloway 36 24 4,167
Fife 127 36 2,778
Forth Valley 100 36 2,778
Grampian 161 31 3,226
Greater Glasgow 453 52 1,923
Highland 65 31 3,226
Lanarkshire 211 38 2,632
Lothian 344 44 2,273
Orkney 1 5 20,000
Shetland 3 14 7,143
Tayside 164 42 2,381
Western Isles 2 8 12,500
*ISD website, excludes (SDS).

�0 Remote and Rural Dentistry
Appendix 5: Total NHS primary care dental activity 2005/2006 (CDS 2004)
2005/2006 except
CDS 2004
Population seen (%)1
GDS 2006 (%)2
SGDS 2006 (%)3
CDS 2004 (%)4
EDS
2006 (%)5
Occ Rx
2006 (%)6
GDS total
Argyll & Clyde 57.0 51.9 1.6 2.3 0.0 1.3 91.1
Ayrshire & Arran 61.0 56.2 0.9 2.0 0.5 1.4 92.1
Borders 50.0 41.2 2.5 2.7 0.4 3.2 82.4
Dumfries & Galloway 42.1 33.6 1.9 2.9 1.1 2.6 79.8
Fife 57.4 47.5 0.7 4.0 1.0 4.2 82.7
Forth Valley 56.8 52.1 0.3 1.9 0.8 1.7 91.8
Grampian 46.1 36.9 1.4 3.7 1.6 2.5 80.1
Greater Glasgow 60.8 57.8 0.0 1.0 0.6 1.3 95.1
Highland 41.2 23.2 8.5 3.8 2.4 3.3 56.3
Lanarkshire 56.7 53.5 0.0 2.4 0.0 0.7 94.5
Lothian 59.7 52.5 0.5 1.5 2.3 2.8 88.1
Orkney 36.1 0.1 24.4 4.3 0.4 6.9 0.3
Shetland 55.2 19.2 24.6 7.3 0.0 4.1 34.7
Tayside 60.5 56.9 0.0 1.7 0.5 1.5 94.0
Western Isles 47.9 21.8 9.7 10.3 0.0 6.2 45.4
Scotland 56.1 49.6 1.2 2.3 1.0 2.1 88.4
1Base Scottish and health board population estimates 2005, GROS website.
2GDS continuing care and capitation registrations (SDPB report 2005/2006, Edinburgh).
3SGDS, continuing care and capitation registrations (SDPB report 2005/2006, Edinburgh).
4Number of patients treated in CDS, (ad hoc request ISD October 2005)
5Emergency dental services (SDPB report 2005/2006, Edinburgh).
6Occasional treatments (SDPB report 2005/2006, Edinburgh).
��
Total NHS dental provision 2006 (2004 CDS), all ages, all services, by Health Board and Scotland
100
80
60
40
20
0Argyll & Clyde
Ayrshire & Arran
Borders
Dumfries & Galloway
Fife Forth Valley
Grampian
Greater Glasgow
Highland
Lanarkshire
Lothian
Orkney
Shetland
Tayside
Western Isles
Scotland
Tota
l Po
pu
lati
on
see
n (
%) GDS 2006 SGDS 2006 CDS 2004 EDS 2006 Occ Rx 2006
�� Remote and Rural Dentistry
Appendix 6: National continuing care and capitation registrations
Table 1: Under 18, 1997–2006
Year 1996/ 1997
1997/ 1998
1998/ 1999
1999/ 2000
2000/ 2001
2001/ 2002
2002/ 2003
2003/ 2004
2004/ 2005
2005/ 2006
Scotland 56 62 63 66 65 65 66 66 66 67
England 59 61 62 62 62 61 62 60 54 63
Wales 58 60 61 61 61 60 60 60 59 59
Table 2: 0- to 2-year-olds (under 18)
Year 1997/ 1998
1998/ 1999
1999/ 2000
2000/ 2001
2001/ 2002
2002/ 2003
2003/ 2004
2004/ 2005
2005/ 2006
Scotland 26 30 35 34 34 34 35 36 36
England 21 22 22 21 20 n/a n/a n/a n/a
Wales 24 26 25 24 24 n/a n/a n/a n/a
Table 3: 3- to 5-year-olds (under 18)
Year 1997/ 1998
1998/ 1999
1999/ 2000
2000/ 2001
2001/ 2002
2002/ 2003
2003/ 2004
2004/ 2005
2005/ 2006
Scotland 61 65 67 65 67 68 66 66 68
England 58 59 60 60 59 n/a n/a n/a n/a
Wales 58 59 61 61 60 n/a n/a n/a n/a
Table 4: National continuing care (over 18)
Year 1996/ 1997
1997/ 1998
1998/ 1999
1999/ 2000
2000/ 2001
2001/ 2002
2002/ 2003
2003/ 2004
2004/ 2005
2005/ 2006
Scotland 52 51 48 50 50 49 49 49 48 47
England 52 50 45 45 45 44 45 44 39 46
Wales 52 51 47 47 47 47 48 49 48 45
��
Appendix 7: Orthodontic appliance treatment per 100 courses of NHS treatment by health board, 2006 (Scottish mean = 0.9 cases)
Orkney
Shetland
Borders
Western Isles
Dumfries & Galloway
Argyll & Clyde
Fife Highland
Ayrshire & Arran
Tayside
Grampian
Greater Glasgow
Lanarkshire
Forth Valley
Lothian
Scottish average
1.6
1.4
1.2
1.0
0.8
0.6
0.4
0.2
0
urban health board
Key
remote/rural health board
�� Remote and Rural Dentistry
Appendix 8: Annual provision of dental examinations by type of provider (BHPS)
Local authority No check-up (%) NHS check-up (%)
Private check-up (%)
East Lothian and Midlothian; Borders 40.31 45.51 14.17
Edinburgh City 32.42 48.90 18.68
West Lothian 39.50 48.53 11.97
Clackmannan; Stirling 54.32 39.51 6.17
Falkirk 45.45 51.52 3.03
Annandale; Nithsdale; Stewarty; Wigton 44.23 48.08 7.69
Dunfermline 41.73 51.85 6.42
Kirkcaldy; North East Fife 41.32 54.86 3.82
Aberdeen City 48.48 42.05 9.47
Banff & Buchan; Moray 42.36 38.07 19.57
Gordon; Kincardine & Deeside 34.81 47.04 18.15
North West Highlands; Western Isles 43.46 33.51 23.04
South & East Highlands; Orkney; Shetland 45.75 38.56 15.69
Argyll & Bute Dumbarton; Inverclyde 44.44 41.98 13.58
Bearsden Clydebank; Strathkelvin 36.01 53.15 10.85
Cumbernauld & Kilsyth; Monklands 47.87 48.85 3.28
Clydesdale; Cumnock Doon; Kyle Carrick 30.29 62.86 6.86
Cunninghame 35.34 59.45 5.21
East Kilbride; Hamilton 61.70 36.17 2.13
Eastwood; Kilmarnock & Loudon 48.59 38.50 12.91
��
Local authority No check-up (%) NHS check-up (%)
Private check-up (%)
Glasgow City 50.98 44.30 4.72
Motherwell 28.00 56.00 16.00
Renfrew 48.89 41.85 9.26
Angus; Perth & Kinross 42.92 54.17 2.92
Dundee City 42.26 54.19 3.55
Scotland 42 47 11
BHPS, British Household Panel Survey (1999–2001).
Note that the BHPS now advises against analysis at a local authority level owing to small sample sizes. However, we include the results for information.

�� Remote and Rural Dentistry


www.healthscotland.com 2465
05/
2007