Remittances and Measurement Error: Evidence from...
27
Remittances and Measurement Error: Evidence from India Randall Akee*, Devesh Kapur ** May 5, 2012 Abstract Utilizing a novel data set on remittance data for India that matches household surveys to administrative bank data, we investigate the differences in self-reported and actual deposits to Non-Resident Indian (NRI) accounts. There is a striking difference between the perceived and actual frequency, as well as the amount of deposits, to NRI accounts. Our results indicate the presence of non-classical measurement error in the reporting of remittances in the form of deposits to NRI accounts. As a consequence, regression analyses using remittances as an explanatory variable contain large upward biases instead of the usual attenuation bias. On the other hand, using four different reports of total household remittances contained in the same survey indicates a high level of consistent reporting. We are able to conclude that the measurement error in this variable is classical in nature and can be treated as white noise in regression settings. Keywords: Remittances; Measurement Error; Migration; India. Acknowledgements: *Tufts University Economics Department, 8 Upper Campus Road, Braker Hall, Medford, MA 02155 ([email protected]); ** Director, Center for the Advanced Study of India, University of Pennsylvania. This project was conducted in collaboration with the Reserve Bank of India. We would like to thank the institution and in particular A. P. Gaur, Sharad Kumar, Vivek Kumar, Dr. Balwant Singh and Dr. Charan Singh for their singular commitment and assistance in making available the data for this research. The authors would also like to thank Jenny Aker, Catia Batista, Lakshmi Iyer, Arvind Subramanian and participants at the Harvard University Kennedy School of Government Conference on Migration and Development, seminar participants at the Reserve Bank of India and the Indian Statistical Institute, UC Berkeley Labor Seminar and the Center for Global Development for their helpful comments. This research was finalized while Randall Akee was a visiting fellow at the Center for Global Development and is grateful for the center’s generosity in terms of resources and valuable input. Any errors, omissions or oversights are ours alone.
Transcript of Remittances and Measurement Error: Evidence from...
Remittances and Measurement Error: Evidence from India
Randall Akee*, Devesh Kapur **
May 5, 2012
Abstract Utilizing a novel data set on remittance data for India that matches household surveys to administrative bank data, we investigate the differences in self-reported and actual deposits to Non-Resident Indian (NRI) accounts. There is a striking difference between the perceived and actual frequency, as well as the amount of deposits, to NRI accounts. Our results indicate the presence of non-classical measurement error in the reporting of remittances in the form of deposits to NRI accounts. As a consequence, regression analyses using remittances as an explanatory variable contain large upward biases instead of the usual attenuation bias. On the other hand, using four different reports of total household remittances contained in the same survey indicates a high level of consistent reporting. We are able to conclude that the measurement error in this variable is classical in nature and can be treated as white noise in regression settings. Keywords: Remittances; Measurement Error; Migration; India. Acknowledgements: *Tufts University Economics Department, 8 Upper Campus Road, Braker Hall, Medford, MA 02155 ([email protected]); ** Director, Center for the Advanced Study of India, University of Pennsylvania. This project was conducted in collaboration with the Reserve Bank of India. We would like to thank the institution and in particular A. P. Gaur, Sharad Kumar, Vivek Kumar, Dr. Balwant Singh and Dr. Charan Singh for their singular commitment and assistance in making available the data for this research. The authors would also like to thank Jenny Aker, Catia Batista, Lakshmi Iyer, Arvind Subramanian and participants at the Harvard University Kennedy School of Government Conference on Migration and Development, seminar participants at the Reserve Bank of India and the Indian Statistical Institute, UC Berkeley Labor Seminar and the Center for Global Development for their helpful comments. This research was finalized while Randall Akee was a visiting fellow at the Center for Global Development and is grateful for the center’s generosity in terms of resources and valuable input. Any errors, omissions or oversights are ours alone.
! 2!
I. Introduction
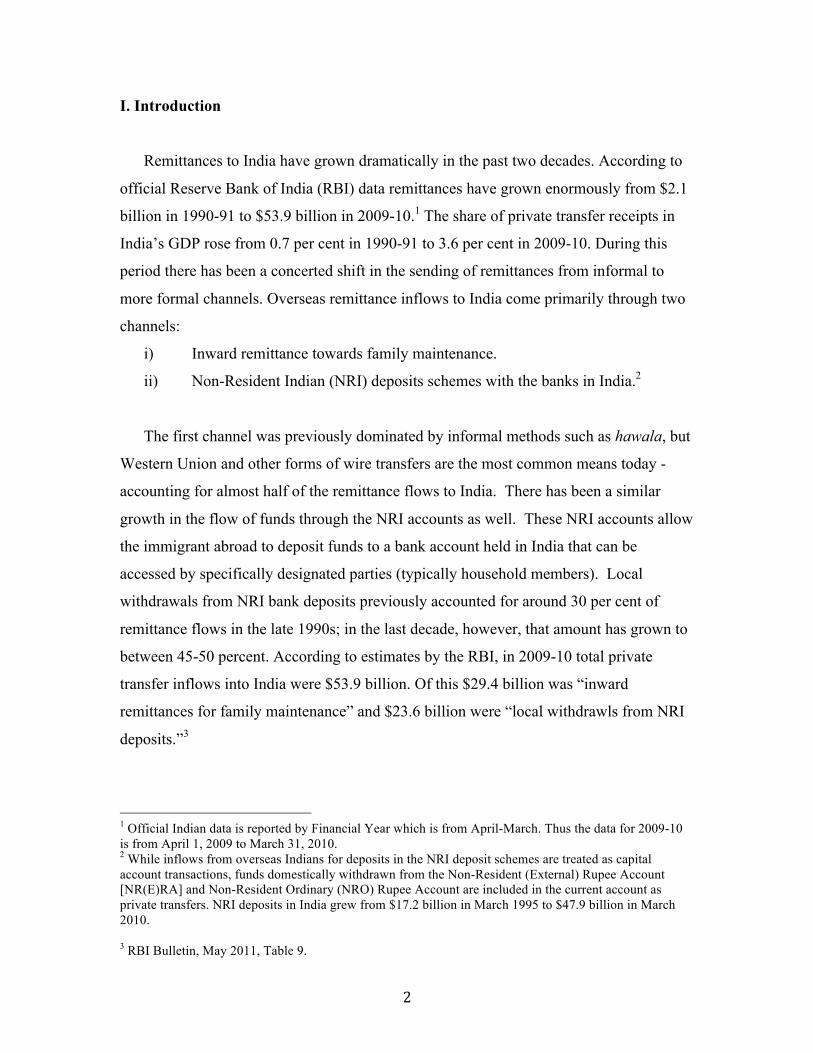
Remittances to India have grown dramatically in the past two decades. According to
official Reserve Bank of India (RBI) data remittances have grown enormously from $2.1
billion in 1990-91 to $53.9 billion in 2009-10.1 The share of private transfer receipts in
India’s GDP rose from 0.7 per cent in 1990-91 to 3.6 per cent in 2009-10. During this
period there has been a concerted shift in the sending of remittances from informal to
more formal channels. Overseas remittance inflows to India come primarily through two
channels:
i) Inward remittance towards family maintenance.
ii) Non-Resident Indian (NRI) deposits schemes with the banks in India.2
The first channel was previously dominated by informal methods such as hawala, but
Western Union and other forms of wire transfers are the most common means today -
accounting for almost half of the remittance flows to India. There has been a similar
growth in the flow of funds through the NRI accounts as well. These NRI accounts allow
the immigrant abroad to deposit funds to a bank account held in India that can be
accessed by specifically designated parties (typically household members). Local
withdrawals from NRI bank deposits previously accounted for around 30 per cent of
remittance flows in the late 1990s; in the last decade, however, that amount has grown to
between 45-50 percent. According to estimates by the RBI, in 2009-10 total private
transfer inflows into India were $53.9 billion. Of this $29.4 billion was “inward
remittances for family maintenance” and $23.6 billion were “local withdrawls from NRI
deposits.”3
!!!!!!!!!!!!!!!!!!!!!!!!!!!!!!!!!!!!!!!!!!!!!!!!!!!!!!!!1 Official Indian data is reported by Financial Year which is from April-March. Thus the data for 2009-10 is from April 1, 2009 to March 31, 2010. 2 While inflows from overseas Indians for deposits in the NRI deposit schemes are treated as capital account transactions, funds domestically withdrawn from the Non-Resident (External) Rupee Account [NR(E)RA] and Non-Resident Ordinary (NRO) Rupee Account are included in the current account as private transfers. NRI deposits in India grew from $17.2 billion in March 1995 to $47.9 billion in March 2010. 3 RBI Bulletin, May 2011, Table 9.
! 3!
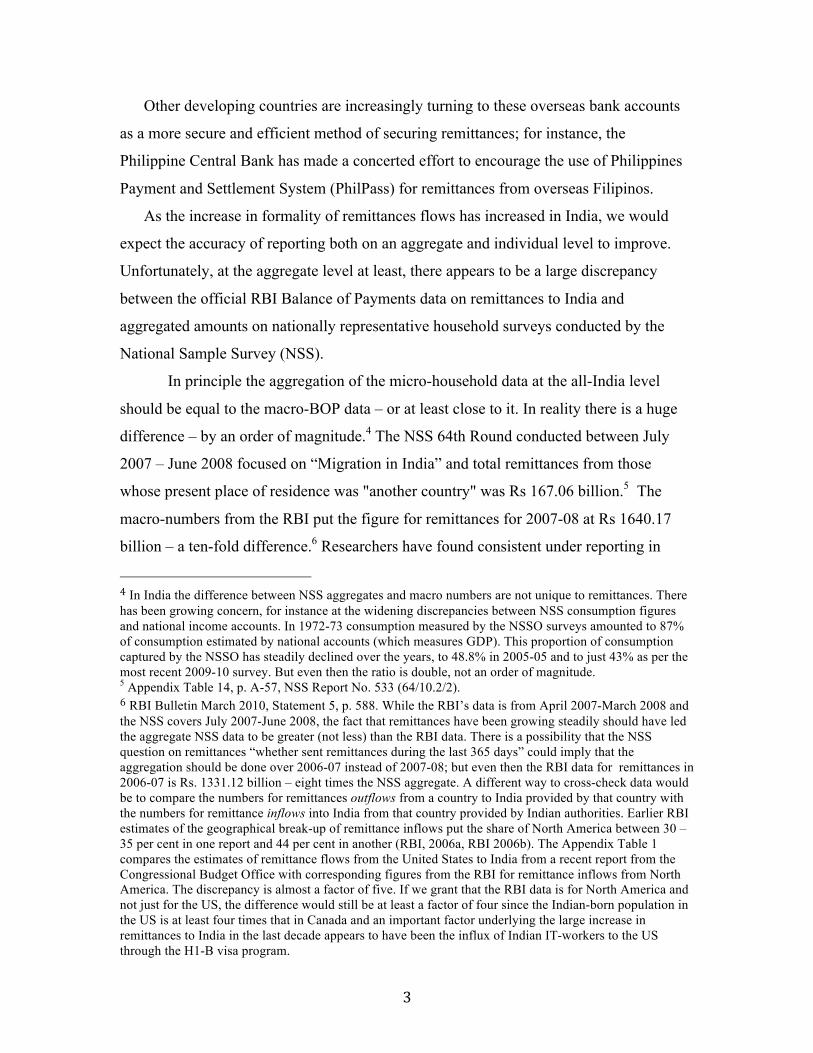
Other developing countries are increasingly turning to these overseas bank accounts
as a more secure and efficient method of securing remittances; for instance, the
Philippine Central Bank has made a concerted effort to encourage the use of Philippines
Payment and Settlement System (PhilPass) for remittances from overseas Filipinos.
As the increase in formality of remittances flows has increased in India, we would
expect the accuracy of reporting both on an aggregate and individual level to improve.
Unfortunately, at the aggregate level at least, there appears to be a large discrepancy
between the official RBI Balance of Payments data on remittances to India and
aggregated amounts on nationally representative household surveys conducted by the
National Sample Survey (NSS).
In principle the aggregation of the micro-household data at the all-India level
should be equal to the macro-BOP data – or at least close to it. In reality there is a huge
difference – by an order of magnitude.4 The NSS 64th Round conducted between July
2007 – June 2008 focused on “Migration in India” and total remittances from those
whose present place of residence was "another country" was Rs 167.06 billion.5 The
macro-numbers from the RBI put the figure for remittances for 2007-08 at Rs 1640.17
billion – a ten-fold difference.6 Researchers have found consistent under reporting in
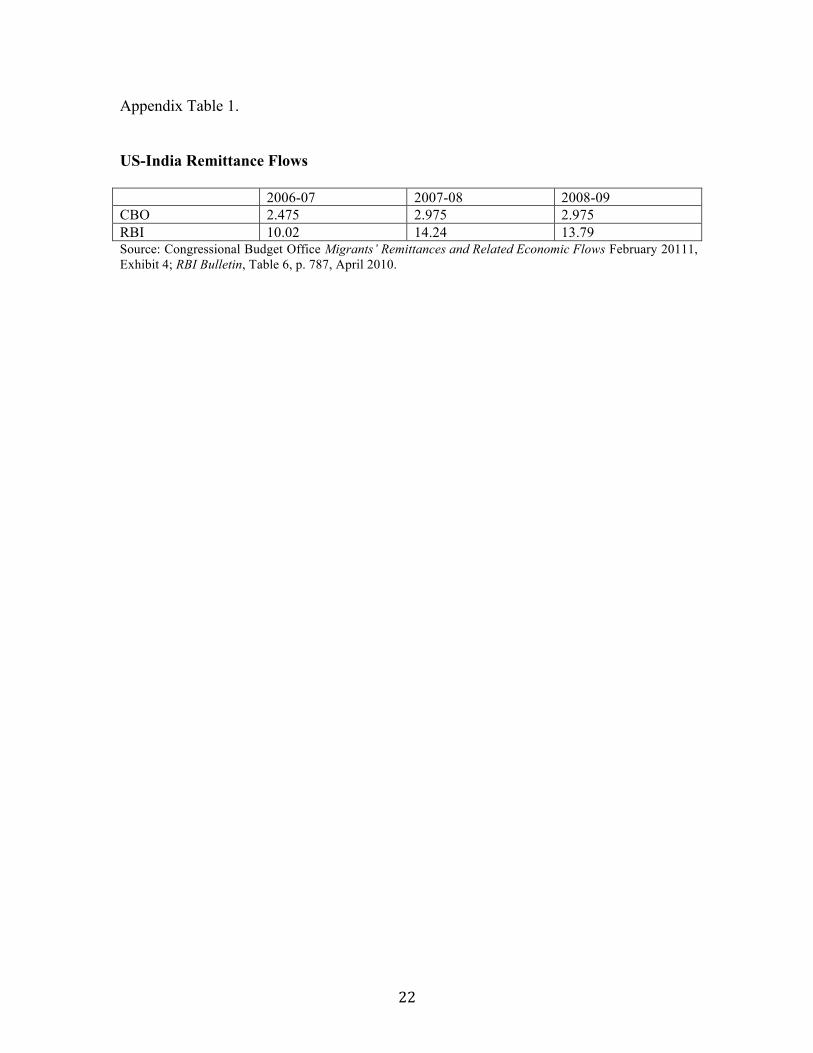
!!!!!!!!!!!!!!!!!!!!!!!!!!!!!!!!!!!!!!!!!!!!!!!!!!!!!!!!4!In India the difference between NSS aggregates and macro numbers are not unique to remittances. There has been growing concern, for instance at the widening discrepancies between NSS consumption figures and national income accounts. In 1972-73 consumption measured by the NSSO surveys amounted to 87% of consumption estimated by national accounts (which measures GDP). This proportion of consumption captured by the NSSO has steadily declined over the years, to 48.8% in 2005-05 and to just 43% as per the most recent 2009-10 survey. But even then the ratio is double, not an order of magnitude. 5 Appendix Table 14, p. A-57, NSS Report No. 533 (64/10.2/2). 6!RBI Bulletin March 2010, Statement 5, p. 588. While the RBI’s data is from April 2007-March 2008 and the NSS covers July 2007-June 2008, the fact that remittances have been growing steadily should have led the aggregate NSS data to be greater (not less) than the RBI data. There is a possibility that the NSS question on remittances “whether sent remittances during the last 365 days” could imply that the aggregation should be done over 2006-07 instead of 2007-08; but even then the RBI data for remittances in 2006-07 is Rs. 1331.12 billion – eight times the NSS aggregate. A different way to cross-check data would be to compare the numbers for remittances outflows from a country to India provided by that country with the numbers for remittance inflows into India from that country provided by Indian authorities. Earlier RBI estimates of the geographical break-up of remittance inflows put the share of North America between 30 – 35 per cent in one report and 44 per cent in another (RBI, 2006a, RBI 2006b). The Appendix Table 1 compares the estimates of remittance flows from the United States to India from a recent report from the Congressional Budget Office with corresponding figures from the RBI for remittance inflows from North America. The discrepancy is almost a factor of five. If we grant that the RBI data is for North America and not just for the US, the difference would still be at least a factor of four since the Indian-born population in the US is at least four times that in Canada and an important factor underlying the large increase in remittances to India in the last decade appears to have been the influx of Indian IT-workers to the US through the H1-B visa program.!
! 4!
household surveys relative to balance of payment figures in other countries as well, but
none have been as large as in the case of India (Andriasik, 2005; Acosta et al, 2006;
Shonkwiler et al, 2011).
Accurately measuring remittances flows is particularly important in developing
countries where the flows may account for a large proportion of household income. In
India, the BOP estimates would indicate that remittances are approximately 4% of GDP,
whereas the NSS household aggregate measure would put it only at 0.4% of GDP. The
large margin of error is a big area of concern for policymakers. Estimates of income
mobility, inequality and growth will all be affected by this mis-measurement. The results
point to the need to more carefully check the accuracy of the international remittance
flows.
At the microeconomic level, mis-reporting at the household level may
significantly affect attempts to estimate the effect of remittances on various types of
household investment and consumption expenditures.7 Specifically, the use of mis-
reported remittance variables in regression equations may significantly overstate (or
understate) the role of remittances in household consumption and investments.
In our analysis we focus on total remittances as reported in a household survey
that are reported in four different ways. We compare the consistency of the reporting of
this amount, which is fairly good. Examining the relationship between the four reports of
total remittances, we conclude that the remittance reporting is highly consistent even
when asked in different ways. While we have no validation data for this data, we are able
to conclude that any measurement error is classical in nature.
Additionally, we examine a single remittance channel where we do have
validation data – deposits to NRI accounts. The withdrawals from deposits by immigrants
abroad to NRI accounts comprise almost half of all remittance flows to India. Restricting
our analysis to the NRI accounts allows us to use administrative data (Reserve Bank of
India data on NRI credits and debits) to verify self-reported amounts on household
surveys. In this study, a random sample of Non-Resident Indian (NRI) households in
four Indian States (Kerala, Gujarat, Maharashtra, Punjab) are surveyed. Households are !!!!!!!!!!!!!!!!!!!!!!!!!!!!!!!!!!!!!!!!!!!!!!!!!!!!!!!!7!See McKenzie, et al (2007) for a discussion of the difficulties in estimating the effect of remittances on desired outcomes. Also see Adams (2006) and Rapoport et al (2006) for reviews of the kinds of estimations typically conducted in the literature on remittances.
! 5!
asked to report in a survey the amount of remittances received annually by several
different remittance channels.8 This household survey is then linked to administrative
data from the Reserve Bank of India for these same NRI accounts. To our knowledge,
this is the first research which has a matched data set between administrative and survey
data on remittances. Because of time and cost, the administrative data is provided for
only a subset of the original household survey respondents. However the matched data is
representative of our sample of NRI account households and provides several important
insights into the nature of measurement error of this remittance channel.
We find that the differences between the self-reported frequency of remittances
and actual deposits are large; the modal value for self-reports is 12 deposits per year
while the administrative data indicate just 1 deposit per year. Second, the average annual
self-reported amount from the household surveys is 266,411 rupees, while the actual
average amount deposited per year is 411,158 rupees. There is strong evidence that the
mis-reporting displays mean-reversion; individuals with above average levels of
remittances tend to underreport the amount that they receive and those with below
average remittances tend to over report the amount that they receive. This non-classical
measurement error entails complications for regression analysis.
We also examine the role that household characteristics, specifically human
capital variables, play in reporting error in remittances. It appears that more highly
educated households tend to be more accurate in their survey responses. Households with
more financial knowledge and banking experience also tend to more accurately report the
amount of remittances to NRI accounts. We also find that the larger the prior remittance
amount in a previous year, the more likely a household is to report an accurate remittance
flow to their NRI account in the current year.
Finally, we explore how the non-classical measurement error in remittance data
can adversely affect ordinary least squares regression results. We use the self-reported
and administrative data on NRI remittances to explain household investment in land and
property. Our results are troubling, given the non-classical nature of the measurement
error in our data, the estimated coefficients are much larger in magnitude than the !!!!!!!!!!!!!!!!!!!!!!!!!!!!!!!!!!!!!!!!!!!!!!!!!!!!!!!!8!The!eight!different!categories!were:!direct!credit!to!NRI!accounts,!demand!drafts,!internet!based!money!transfer!service,!formal!money!transfer!services,!family!member!cash!transfer,!friends!cash!transfer,!international!debit!or!credit!cards,!other!means.!!
! 6!
coefficients from the administrative data. We also use the four different measures of total
household annual remittances in a similar regression. Due to the high level of consistency
across all four measures, we find that the coefficients are all very similar to one another.
While we do not have validation data for this measure, we do have confidence that the
measurement error, if any, is classical in nature. Our results suggest that detailed
questions on remittances may pose a bigger challenge for household survey respondents
than for a general question on total remittances. We explore why this might be the case in
the discussion section.
The next section discusses previous remittance research. The following section
provides information on the data collection and characteristics of the data set. In Section
4 we describe the nature of measurement error contained in the total annual remittance
responses. We then turn to a discussion of the measurement error contained in a single
channel of remittances – NRI deposits in Section 5. We explore the effect of these
different measures on regression results in Section 6. In Section 7 we discuss the
implications of measurement error in surveys and regression results and conclude.
II. Previous Literature
There have been very few studies examining the discrepancies in actual and
reported remittance flows. Existing studies have compared differences in Balance of
Payment data and aggregated household survey amounts. For instance, in Kyrgyz
Republic, Andriasik (2005) finds that the remittances recorded in the Balance of
Payments figures are twice as large as the household survey remittance aggregate.
Shonkwiler, et al (2011) find qualitatively similar results in Armenia and propose an
econometric solution for underreporting. Acosta et al (2006) find similar results for 11
countries in Latin America. Our study differs from these previous ones in that we have
actual microeconomic data between self-reported household surveys and administrative
measures of flows to the NRI accounts.
In this regard, our research fits into the existing measurement error literature on
self-reported salary and wage income. Several authors have investigated the nature of
measurement error in US wage and salary data. Duncan and Hill (1985), Bound and
coauthors (1991;1994;2001), Pischke (1995) and Moffit and Gottschalk (2002) have
! 7!
found that the self-reported data tends to contain non-classical measurement error with
mean reversion. Akee (2011) found similar results in a developing country context;
however, the degree of measurement error was far worse than that in the US. Antman
and McKenzie (2007) examine the implications of measurement error on measures of
earnings mobility. Gine and de Nicola (2012) examine accuracy in income and asset
accumulation for self-employed in India. Their findings indicate that accuracy is related
to the recall period as expected. Additionally, they find that individuals most involved
with the business are more accurate than spouses. These studies are unique in that they
have a generally accepted check on self-reported information which is generally
unavailable in standard data sets.
III. Data Set Collection and Description
a. Data Set Creation
We obtained the data for this analysis from the Reserve Bank of India. The
research division commissioned a survey of households that had an operating NRI
account in the four states of Gujarat, Kerala, Maharashtra and Punjab. Therefore, the
population studied here are households with an operating (any transactions in the last two
years) NRI account in these four Indian states. The household survey was intended to
provide information on the amounts, uses and characteristics of migrants in NRI account-
holding households in four Indian states that receive the highest volume of remittances. A
small subset of this household survey was linked to RBI administrative data on NRI
account transactions. Our analysis in this paper is conducted on the subset of matched
data.
A survey firm, hired by the RBI, conducted the household survey from December
2009-July 2010. The RBI provided the survey firm with approximately 4000 names and
addresses of randomly selected NRI account holder households. Enumerators contacted
households by phone and by going to the address directly. The final household survey
contained 2756 observations for a response rate of almost 70%.
The household survey contained several modules with questions on household
demographics, consumption, asset ownership and liabilities, migrant information, uses of
remittances, pattern of debits and credits to NRI accounts, and finally a section on the
modes of sending remittances. The official, administrative data from the RBI provided
! 8!
information on the number of credits and debits to the NRI accounts in the previous two
years as well as the total amount credited to the account in the previous year. The RBI
provided account data for approximately 50 accounts from each of the 4 different states;
these accounts were merged according to address information. The characteristics of the
matched and non-matched sample do not differ significantly with respect to education
levels, household income levels, or marital status. However, the matched sub-sample is
about 3 years older than the non-matched sample and is 10 percentage points more likely
to be male. Our final sample, which matched observations between the household survey
and RBI data, is 197.9
b. Data Description
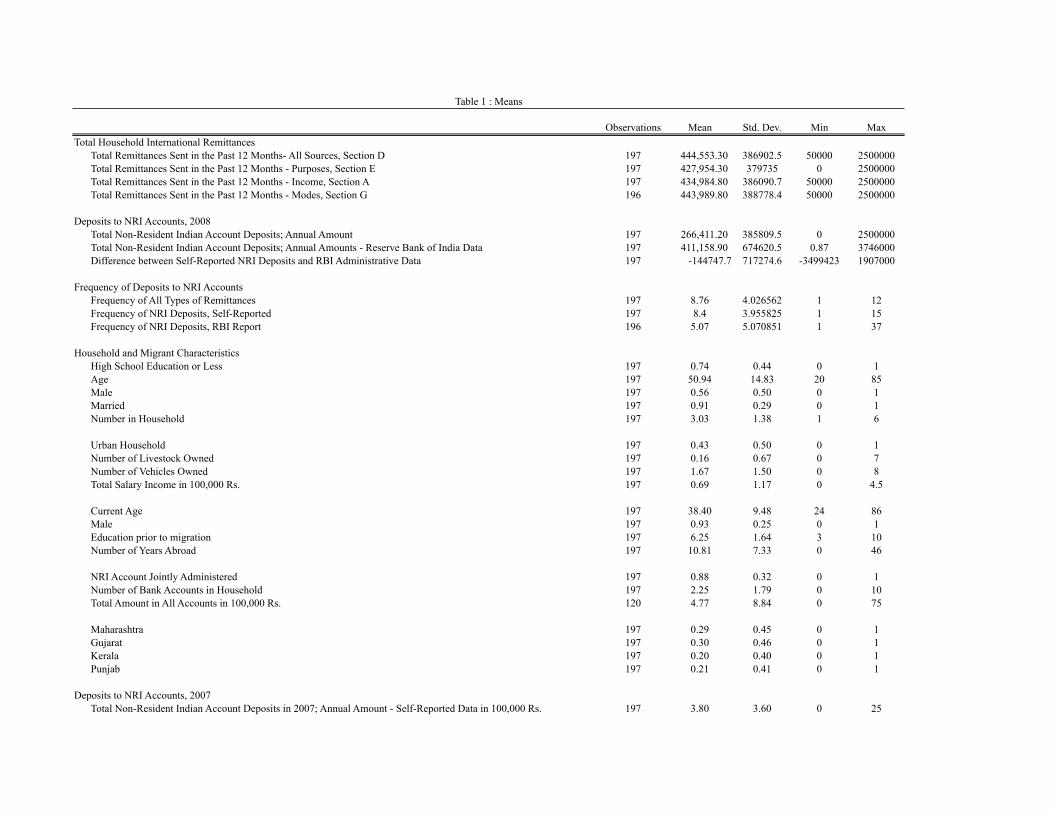
We present a description of the data in Table 1. The first four rows provide the total
amount of remittances received by our survey households from all remittance sources.
This question was asked in four different parts of the household survey in four
completely different ways. The first question asks the respondent to provide the amount
of annual remittances sent by each international migrant from their household in the past
year.10 The second measure asks the respondent to provide the amount of remittances sent
in the past 12 months from abroad in a section on remittance use. The third measure
comes from the section on Household Income and asks the respondent about the amount
received annually from international remittances. Finally, the fourth measure asks the
respondent for the amount of remittances sent from abroad via eight different channels.
We sum these eight different remittance channels by household and compute a total
remittances received for the previous year. Overall, all four measures are fairly close in
value to one another. On average, a household in our survey received approximately
430,000 Rs. in international remittances from all sources in the year 2008. These results
agree with Gine et al (2012) that placing a question in different locations in a survey does
not affect the accuracy of reporting by household members. !!!!!!!!!!!!!!!!!!!!!!!!!!!!!!!!!!!!!!!!!!!!!!!!!!!!!!!!9!It is important to note that previous studies on measurement error in survey responses typically have similar small sample sizes. For instance, Bound and Krueger (1991) have just 444 observations in their Current Population Survey – Social Security match dataset for their research on measurement error in wage reporting; Pischke (1995) has just 234 observations in his panel data using the Panel Study of Income Dynamics (PSID) data and 351 (437) observations in his 1982 (1986) cross-section.!10!We restrict our analysis to migrant households with only a single migrant abroad. We do this in order to reduce the possibility of measurement error. There are very few households with multiple migrants, less than 5% of our sample and as a result we only lose a small amount of observations.!!
! 9!
Our results for the total remittances differs dramatically from our results for deposits
to Non-Resident Indian (NRI) accounts. We find that there is a big discrepancy between
the measure of remittances sent via NRI accounts. Our measure of NRI deposits comes
from a section detailing all possible channels of remitting from abroad. The respondent is
asked to provide the annual amount sent by the international migrant for each possible
channel. The average amount reported by households is 266,411 Rs. which is
considerably smaller than the previous measure. We also have a measure of the actual
amounts deposited to the same households’ NRI accounts in the same time period. The
average amount by household (provided by the RBI) is 411,158 Rs. This administrative
data is lower than the total amount reported by households in the four measures discussed
above. However, it is still worrying that there is such a large difference between the self-
reported remittances via NRI channels and the administrative data. This difference is
about 144,747 Rs. on average.
We also have information on the frequency of total remittances and the frequency of
deposits to the NRI accounts provided in the household survey as well as from the RBI
administrative data. These three measures are provided in the next section of Table 1. The
first measure gives us the survey respondents’ answer to the number of times a household
received any type of remittance in the past year. The average reporting frequency is about
9 times per year, however, the modal response is 12 times per year with over 50%
reporting this amount. The self-reported frequency of NRI deposits closely matches that
of the overall report of receiving remittances from abroad. The results for this measure is
very similar to that of the total remittance frequency at 8.4 for the mean and 12 for the
mode. However, the RBI administrative data indicate that the average number of deposits
to NRI accounts is around 5, with the mode being 1. Survey respondents are greatly
overestimating the number of deposits to NRI accounts. In fact, they are equating it with
the frequency of remittances from all sources. It appears that individuals are reporting the
frequency of remittances from a single channel with that of the overall frequency of
remittances.
The next section provides information on the head of household and family
characteristics. In our sample, 74% of the household heads have a high school education
or less, they are about 51 years of age and 56% are males. Almost all of the household
! 10!
heads are married (91%) and there are on average three people in a household. Forty
three percent of survey households are urban and very few own any livestock, but on
average all households have at least one vehicle. The average household salary income is
about 69,000 Rs. per year. The migrant is on average 38 years old, a male, has had some
college training and has spent about 10 years abroad.
Almost all of the NRI accounts are jointly administered by the head of household and
the migrant. The other 12% of accounts are managed directly by the migrant. Our survey
households have on average 2 bank accounts. Only a sub-sample answered the question
regarding how much they had in all of these accounts and the average is 470,000 Rs.
Finally, we provide the distribution of survey households by the four states. The majority
is found in Maharashtra and Gujarat. We also report the self-reported deposits to NRI
accounts from the household survey in 2007 which was 380,000 Rs. on average.
IV. Discussion of Measurement Error
In the case where a particular variable is measured with error we are typically are
unable to separate out the signal and noise components of the variable. When there is
administrative or validation data, however, one can simply subtract out the difference
between the two separate reported values. On the other hand, if there are multiple
measures of the same variable provided, one could potentially use these measures (if they
are independently provided) to identify the true signal component in a variable with
measurement error.
In this section, we discuss how we can assess the accuracy of the multiple measures
of a single variable. In a regression setting that is common for remittances, we are
concerned with the effect of remittance flows on household investment.11 The regression
equation would be described by the following:
(1) !! = !"!∗ + !!
In this case, we have an outcome variable, Y, which is assumed to be measured with no
error and a variable, !∗, which in our case is the true remittance amount. Finally, there is !!!!!!!!!!!!!!!!!!!!!!!!!!!!!!!!!!!!!!!!!!!!!!!!!!!!!!!!11!This!section!follows!Bound,!et!al.!!(2001)!
! 11!
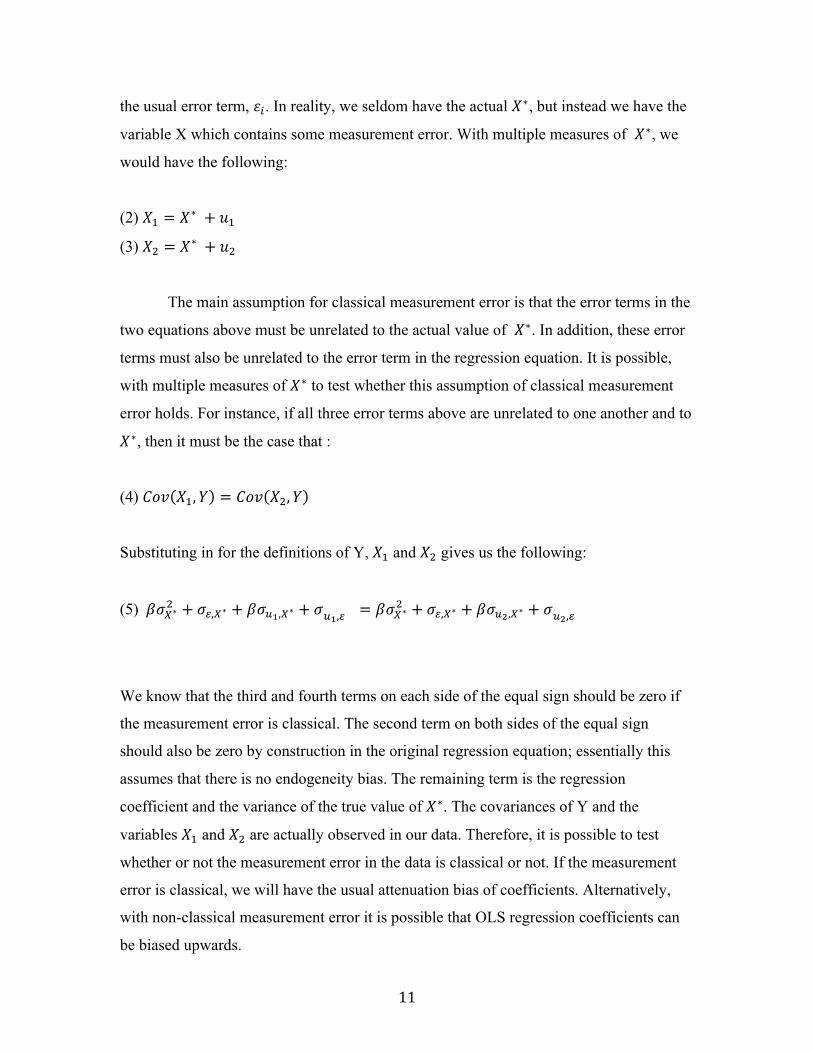
the usual error term, !!. In reality, we seldom have the actual !∗, but instead we have the
variable X which contains some measurement error. With multiple measures of !∗, we
would have the following:
(2) !! = !∗ + !!
(3) !! = !∗ + !!
The main assumption for classical measurement error is that the error terms in the
two equations above must be unrelated to the actual value of !∗. In addition, these error
terms must also be unrelated to the error term in the regression equation. It is possible,
with multiple measures of !∗ to test whether this assumption of classical measurement
error holds. For instance, if all three error terms above are unrelated to one another and to
!∗, then it must be the case that :
(4) !"# !!,! = !"# !!,!
Substituting in for the definitions of Y, !! and !! gives us the following:
(5) !!!!∗! + !!,!∗ + !!!!,!∗ + !!!,! = !!!∗! + !!,!∗ + !!!!,!∗ + !!!,!
We know that the third and fourth terms on each side of the equal sign should be zero if
the measurement error is classical. The second term on both sides of the equal sign
should also be zero by construction in the original regression equation; essentially this
assumes that there is no endogeneity bias. The remaining term is the regression
coefficient and the variance of the true value of !∗. The covariances of Y and the
variables !! and !! are actually observed in our data. Therefore, it is possible to test
whether or not the measurement error in the data is classical or not. If the measurement
error is classical, we will have the usual attenuation bias of coefficients. Alternatively,
with non-classical measurement error it is possible that OLS regression coefficients can
be biased upwards.
! 12!
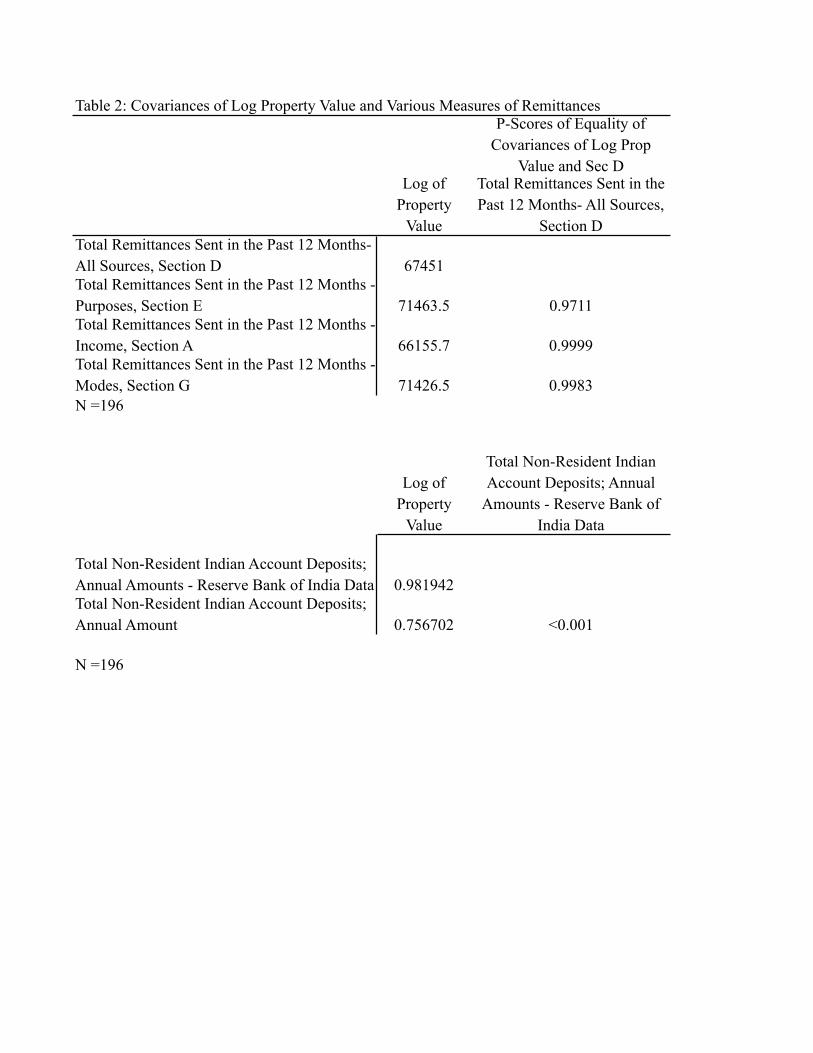
In Table 2, we compute the covariances between an outcome variable that is
contained in our data – the log of household property value – and the four measures of
total remittances contained in our data. The covariances range in value from 66155.7 to
71463.5. We test the hypothesis that the first covariance is equal to the other three
covariances. The p-values are given for each of those tests in the next column. We fail to
reject the null hypothesis of equality in all three cases. This strongly indicates that the
measurement error, if there is any, contained in the four measures of total remittances
received is classical in nature.
These results are good news for the measure of total remittances received by a
household. Additionally, it is instructive to learn that the four different methods of asking
this question resulted in a very consistent and accurate response from survey respondents.
On the other hand, conducting the same analysis for the NRI remittances channel
with the administrative and self-reported data indicates that the measurement error is not
classical. We explicitly compare the self-reported value of !∗ with the administrative
value in this comparison. We reject the null hypothesis that the two covariances are the
same, the p-value is less than 0.001. This was suspected given the large discrepancy
between the self-reported amount and the administrative amount in Table 1.
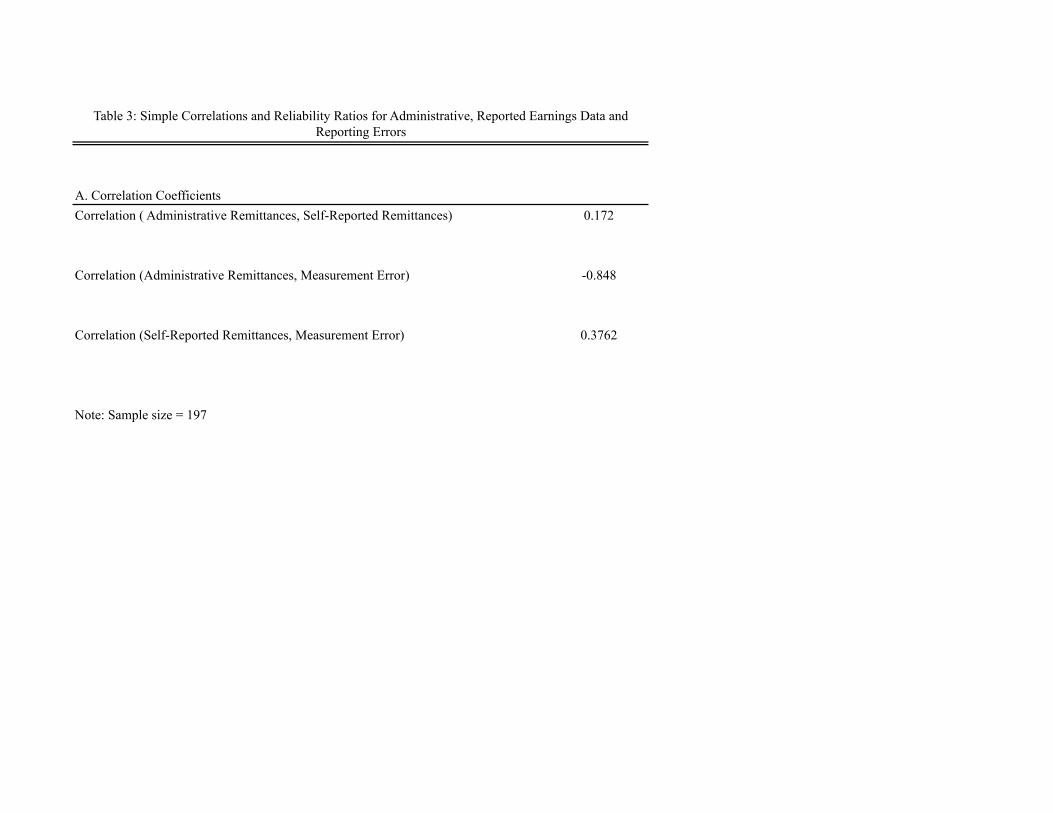
We further investigate the nature of the measurement error for the NRI deposit
channel. In Table 3, we compute the actual measurement error as is standard in the
literature (Bound and Krueger, 1991):
(6) !""#" = !! − !∗
Where !!! is the self-reported value of NRI deposits and !∗ is the administrative data on
NRI deposits. Finally, we compute the correlation between these three variables. The first
figure indicates that there is a positive relationship between the self-reported and
administrative values of NRI deposits; however, the correlation is quite low. Worse, we
find that the relationship between the administrative data and the measurement error is
negatively and large in magnitude. If the measurement error had been classical, this
correlation would have been approximately zero. These results confirm the findings in
! 13!
the previous table. Finally, we report that there is a positive relationship between the
measurement error and the self-reported remittances via NRI accounts.
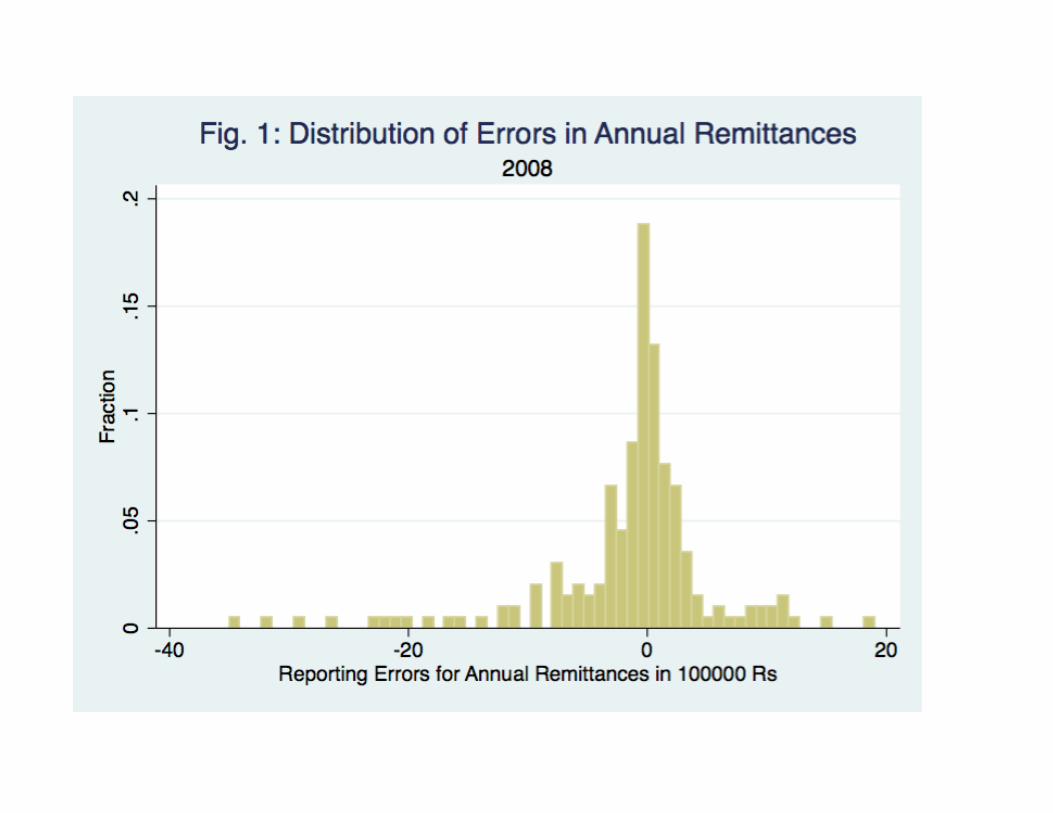
In Figure 1, we plot the distribution of the measurement error. While the errors
are centered on zero, there is a large left-hand tail in the distribution indicating that there
is underreporting of NRI deposits.
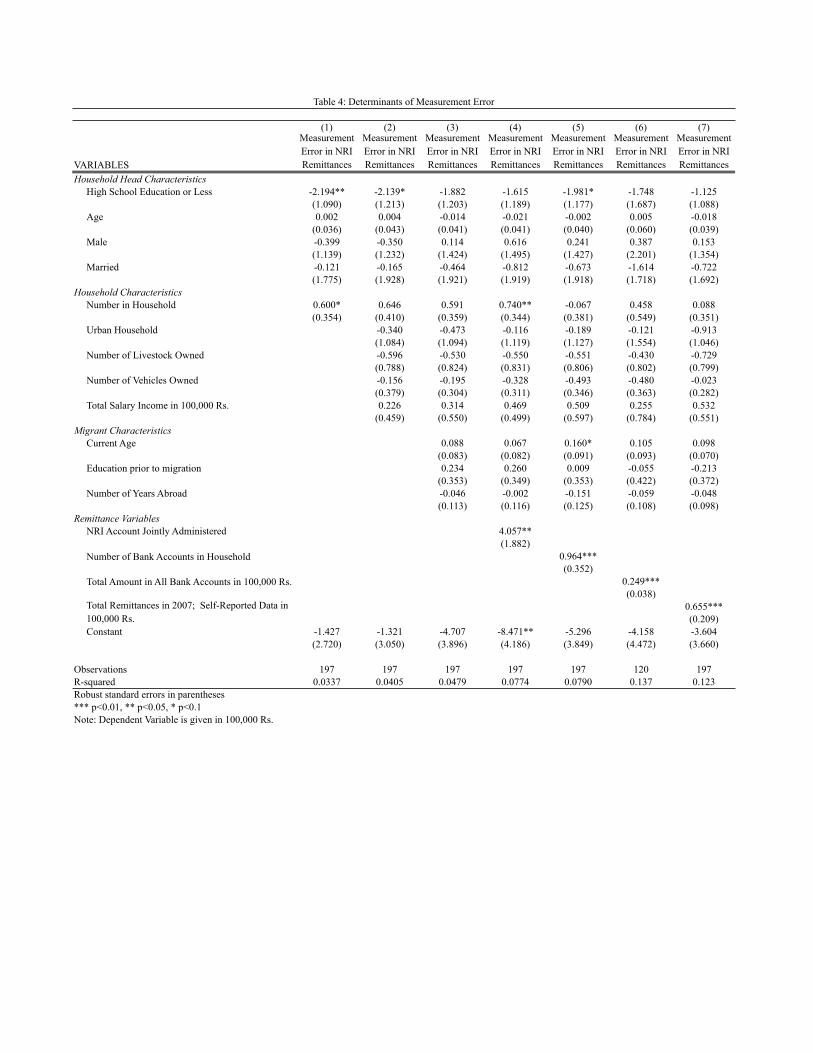
V. Determinants of Measurement Error
For the NRI remittance flow it is possible to explain the differences in the
measurement error using household characteristics and experience. This is a useful
undertaking in order to understand what qualities may be particularly important in biasing
the self-reporting of remittances. In Table 4, we regress the following ordinary least
squares model:
(7) !""#"! = !! + !′! + !!
In the equation above, the vector Q contains household head characteristics such as
education, gender and age, asset ownership and migrant characteristics. We also include a
number of financial knowledge and experience variables to explain the measurement
error and υi is the regression error term.
Given that on average there is severe underreporting of NRI deposits, a negative
coefficient indicates that this particular characteristic intensifies the reporting error and a
positive coefficient does the opposite. In the first column of Table 4, we regress the basic
household head characteristics on measurement error. Relatively low educated household
heads with a high school equivalent or less are more likely to underreport NRI remittance
amounts. In fact, the amount of underreporting is approximately 200,000 Rs. which
closely matches the difference in self-reported and administrative reports of NRI deposits.
A likely candidate for mis-reporting may simply be low education levels in survey data.
We consistently find that the coefficient on this variable is negative in all regression
specifications, however, it loses statistical significance in several specifications.
! 14!
In the next two columns we include additional household characteristics as well as
characteristics of the migrant himself (93% of migrants are male). We don’t find that
these characteristics significantly affect the observed measurement error.
In the next four columns, we sequentially include various financial characteristics
and previous remittance experience in the regression. We find that all of these variables
have positive coefficients and they reduce the reporting error in NRI deposits. Having a
jointly administered NRI account increases the self-reported amount of NRI deposits by
over 400,000 Rs. relative to the household head who is not authorized to access the
account. This result indicates that more access and knowledge of the particular NRI
account results in more accurate reporting on household surveys.
The next two columns include the number of bank accounts owned by the
household and amount in those accounts. Households with more reported bank accounts
are more likely to report accurately by almost 100,000 Rs. For households that reported
the amount in their accounts (only 120 responded), having an additional 100,000 Rs. in
total bank accounts results in a higher self-report of NRI deposits by 20,000 Rs.
In the final column, we explore the effect of the prior year’s remittances on
reporting in the current year. We first regress the total amount of remittances from all
sources reported by the household head in 2007 on the current measurement error in NRI
deposits. Having reported 100,000 Rs. more in previous year’s remittance amounts
results in an increase of 65,000 Rs. in the self-reported NRI deposits in the current year.
Assuming that the self-report on total remittances from the previous year is also accurate
indicates that experience with high remittance volumes tends to improve the accuracy of
reporting in the current period for NRI deposits.
VI. Potential Bias in Estimation Results when Remittances Measures contain
Measurement Error
It is a well-known fact that classical measurement error leads to attenuation bias in
ordinary least squares regressions. When the measurement error is non-classical, however,
there is a possibility that the estimated coefficient will be greater than the true effect.
For instance, assume that we are concerned with the cross-section analysis described
earlier in equation 1. Our interest is in estimating the effect of X* , which can be thought
! 15!
of as remittances received by the individual household i on a measure of investment, Y.
Instead, we actually estimate the following:
(8) !! = !"! + !!
In the presence of classical measurement error in the X variable, ordinary least
squares estimates of the slope coefficient tends to be biased towards zero. Assume that
the measurement error in the right hand side variable is determined in the following
manner:
(9) ! = !∗ + !
where X is the self-reported value of remittances received in a household survey, for
instance. The variable
€
X * is the true (unobserved) measure of remittances and u is the
measurement error. In this case, ordinary least squares will produce the following slope
estimate:
(10) !"#$! !(!!∗! !!!,!∗)
!!∗! !!!!!!!!,!∗
Assuming that there is classical measurement error implies thatσ u,X* = 0 and the
estimated coefficient will be downward biased away from the true population parameter
since
€
σε2 > 0. In our case we know that the measurement error is not classical and is
negatively related to the true value of the variable being measured. Therefore, in this
situation the estimated OLS coefficient may be either larger or smaller than the true
population coefficient depending on which effect is larger σ u,X* or σε2 ; the first is a
negative term and the second is a variance which is always positive.12
!!!!!!!!!!!!!!!!!!!!!!!!!!!!!!!!!!!!!!!!!!!!!!!!!!!!!!!!12!Instrumental variables are not guaranteed to solve the problem in this case either. The estimated coefficient from an IV regression may also potentially be biased upward in the presence of non-classical measurement error.!!
! 16!
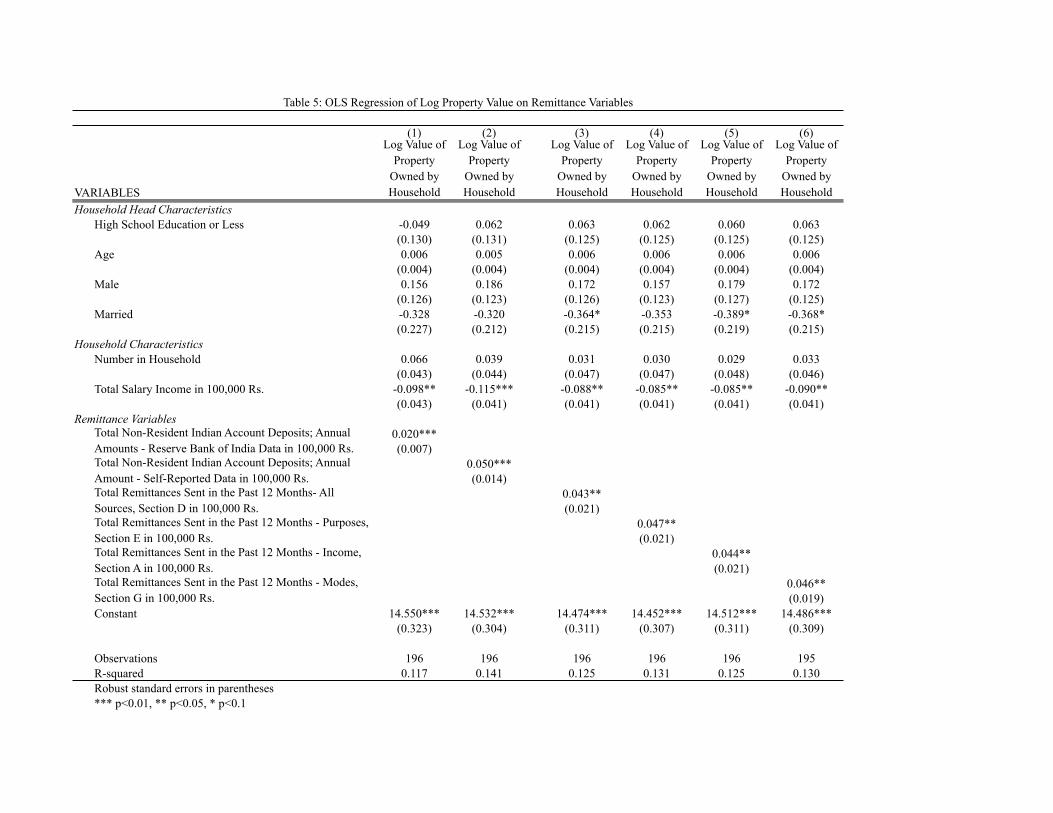
As an example, we provide a regression explaining land and property investment
for households in Table 5. We regress the log value of property owned by the survey
households on the total amount of annual remittances (in 100,000s rupees) reported by
the household. Remittances are often viewed as affecting both direct consumption and
investment in assets in developing countries. In the first column we regress a number of
household characteristics on the log value of property. Only total household salary
income is statistically significant and negative. The coefficient indicates that for every
additional 100,000 Rs. in household salary income there is a 9.8 percent decrease in
property investment. This may mean that households that are more engaged in the wage
sector invest in assets other than land; specifically, they are less likely to be rural
households and less likely to invest in agricultural lands.
We also regress the value of NRI deposits as provided by the RBI data for these
households on the log value of property. The coefficient indicates that an increase of
100,000 Rs. will increase the total invested in property by 2%. The same regression using
the self-reported NRI deposits in the next column indicates that the effect is 5%, two and
half times larger than the effect of the administrative data. Given the non-classical
measurement error, the OLS coefficient is biased upward, not downward, from its true
value.
In the next four columns we regress the four different measures of total
remittances on the log value of property. The coefficients on all of these variables range
in size from 0.043 to 0.047. While we do not have a measure to validate the reporting of
these four total remittance variables, we have shown earlier that they are likely reporting
the true value of total remittances. Any measurement error contained in those measures
would be classical and would not produce any upward bias on the estimated coefficient in
an OLS regression.
This regression provides an example of the problems with using a measure of
remittances that contains non-classical measurement error. On the one hand, using the
self-reported measure of NRI deposits, one would conclude that the effect on property
investment is about a 5% increase for every 100,000 Rs. in additional remittances sent via
this channel. On the other hand, regressing total remittances on the same outcome would
provide a slightly perverse result which indicates that the effect is less than 5% for each
! 17!
additional 100,000 Rs. in total remittances. One might falsely conclude that NRI deposits
have a large effect on property investment in India using just the self-reported data. As
we have shown, it is likely that the first estimate is biased upward by two and a half times.
VII. Discussion and Conclusion
There are two main findings from our research. First, we find that asking households
the total amount of annual remittances is consistent across our four different survey
questions. Also, placement of the question within the survey does not appear to affect the
accuracy of reporting. While we are not able to discern the size of measurement error in
this data, we are able to conclude that any measurement error is classical for this variable.
Our second finding is that the self-reported data for a single, large remittance flow is
severely underreported relative to administrative data for this variable. The deposits to
NRI accounts are underreported on average by almost 35%. We also conclude that the
measurement is not classical and is negatively correlated with the true value of NRI
deposits. Attempting to explain these measurement errors, we find that the knowledge
and experience with the previous year’s remittance amounts and financial experience
tended to reduce the measurement error.
We have evidence that there is greater underreporting of NRI deposits when the
survey respondent has lower levels of education, does not jointly administer the NRI
account and reports lower remittances flows in the previous year. This measurement error
results in an upward bias of coefficients in a simple investment regression by two and a
half times.
Our research suggests that there is considerable room for improvement in the
collection of remittance data and survey questions. While the overall data on total
household remittances appears to contain only classical measurement error, if at all, we
still do not know the overall accuracy of this measure. Experimentally testing and
validating different forms of remittance survey questions would be an important step in
assessing the usefulness of remittance survey questions (see, for instance De Mel, et al
2007).
! 18!
References Adams, Richard. 1998. “Remittances, investment and rural asset accumulation in
Pakistan.” Economic Development and Cultural Change. V. 47, pp. 155-173. Adams, Richard. 2006. “International remittances and the household: analysis and review
of global evidence.” Journal of African Economies. V. 15 no 2, pp. 396-425. Adams, Richard and J. Page. 2005. “Do International Migration and Remittances reduce
poverty in developing countries?” World Development. V. 33 no 10, pp. 1645 – 1669. Adams, Richard and A. Cuecuecha. 2010. “Remittances, Household Expenditure and
Investment in Guatemala.” World Development. V 38 no 11, pp. 1626-1641. Akee, R. 2011. “Errors in self-reported earnings: The role of previous earnings volatility
and individual characteristics. Journal of Development Economics, forthcoming. Angrist, J. and A. Krueger. 1999. "Empirical Strategies in Labor Economics." in
Handbook of Labor Economics. O. Ashenfelter and D. Card, eds. Amsterdam: North-Holland. V. 3A, 1277-1366.
Antman, Francisca and David J. McKenzie. 2007. "Earnings Mobility and Measurement
Error: A Pseudo-Panel Approach." Economic Development and Cultural Change, 56(October): 125-161.
Black, D. and M. Berger and F. Scott. 2000. "Bounding Parameter Estimates with
Nonclassical Measurement Error." Journal of the American Statistical Association, 95(451):739-748.
Bound, John and Alan B. Krueger. 1991. "The Extent of Measurement Error in
Longitudinal Earnings Data: Do Two Wrongs Make a Right?" Journal of Labor Economics, 9(1): 1-24.
Bound, J. and Charles Brown, Greg J. Duncan and Willard L. Rodgers. 1994. "Evidence
on the Validity of Cross-sectional and Longitudinal Labor Market Data." Journal of Labor Economics, 12(3): 345-368.
Bound, J. and Charles Brown and Nancy Mathiowetz. 2001. "Measurement Error in
Survey Data." In The Handbook of Econometrics, Volume 5. eds. James J. Heckman and Edward Leamer, 3705-3843. New York : Elsevier Science. Cappellari, Lorenzo. 1999. "Minimum Distance Estimation of Covariance Structures." Fifth UK Meeting of STATA Users, Royal Statistical Society, London, UK.
Brown, R. and E. Jimenez. 2008. “Estimating the Net Effect of Migration and
Remittances on Poverty and Inequality: Comparison of Fiji and Tonga.” Journal of International Development V 20, pp. 547-571.
! 19!
Cox Edwards, A. and M. Ureta (2003): International migration, remittances and schooling: evidence from El Salvador, Journal of Development Economics, 72, 2: 429-61.
de la Brière, B., E. Sadoulet, A. de Janvry and S. Lambert. 2002. “The roles of
destination, gender, and household composition in explaining remittances: An analysis for the Dominican Sierra.” Journal of Development Economics, 68, 2: 309-28.
De Mel, Suresh and David McKenzie and Christopher Woodruff. 2007. "Measuring
Microenterprise Profits: Must we ask how the sausage is made?" Journal of Development Economics, doi: 10.1016/j.jdeveco.2008.01.007.
Duncan, Greg J. and Daniel H. Hill. 1985. "An Investigation of the Extent and
Consequences of Measurement Error in Labor-economic Survey Data." Journal of Labor Economics, 3,(4) : 508-532.
El- Qorchi, Mohammed, Samuel Munzele Maimbo, and John Wilson, 2003, “Informal
Funds Transfer Systems: An Analysis of the Informal Hawala System.” IMF Occasional Paper No. 222 (Washington: International Monetary Fund).
Funkhouser, E. (1995): Remittances from international migration: a comparison of El
Salvador and Nicaragua, Review of Economics and Statistics, 77, 1: 137-46. Gine, Xavier and Francesca de Nicola. 2012. “How accurate are recall data? Evidence
from coastal India.” World Bank Policy Research Paper, WPS6009. Lucas, R and O. Stark. 1988. “Migration, remittances, and the family.” Economic
Development and Cultural Change. V 36 no 3, pp. 465 – 481. McKenzie, David; Gibson John; Stillman, Steven. 2006. “How Important is Selection?
Experimental versus Non-Experimental Measures of the Income Gains from Migration.” World Bank Policy Research Working Paper 3906.
McKenzie, David and M. Sasin. 2007. Migration, Remittances, Poverty and Human
Capital: Conceptual and Empirical Challenges. World Bank Policy Working Paper No. 4272. Washington, DC: World Bank.
Moffit, Robert and Peter Gottschalk. 2002. "Trends in the Transitory Variance of
Earnings in the United States." The Economic Journal. 112(March) : 68-73. Pischke, Jorn-Steffen. 1995. "Measurement Error and Earnings Dynamics: Some
Estimates from the PSID Validation Study." Journal of Business and Economic Statistics. 13(3) : 305-314.
! 20!
Rapoport, Hilel and F. Docquier. 2006. “The economics of migrants’ remittances. In: Kolm, S. and J. Mercier Ythier (Eds.), Handbook of the Economics of Giving, Altruism and Reciprocity. North Holland, pp. 1135-1198.
Reserve Bank of India, 2006a, “Report of the Working Group on Cost of NRI Remittances,” May. Available at: http://rbidocs.rbi.org.in/rdocs/PublicationReport/Pdfs/72983.pdf Reserve Bank of India, 2006b, “Remittances from Overseas Indians: A Study of Methods of Transmission, Cost, and Time,” RBI Bulletin November 2006, Annex 3. Reserve Bank of India. 2008. “India's Balance of Payments Developments during Fourth
Quarter of 2007-08” Unpublished Document. Shonkwiler, J. Scott and David Grigorian and Tigran Melkonyan. 2011. “Controlling for
the underreporting of remittances.” Applied Economics, 43(30), 4817-4826.
Yang, Dean. 2008. "International Migration, Remittances, and Household Investment: Evidence from Philippine Migrants' Exchange Rate Shocks." Economic Journal, 118(528): 591-630.
Observations Mean Std. Dev. Min MaxTotal Household International Remittances
Total Remittances Sent in the Past 12 Months- All Sources, Section D 197 444,553.30 386902.5 50000 2500000Total Remittances Sent in the Past 12 Months - Purposes, Section E 197 427,954.30 379735 0 2500000Total Remittances Sent in the Past 12 Months - Income, Section A 197 434,984.80 386090.7 50000 2500000Total Remittances Sent in the Past 12 Months - Modes, Section G 196 443,989.80 388778.4 50000 2500000
Deposits to NRI Accounts, 2008Total Non-Resident Indian Account Deposits; Annual Amount 197 266,411.20 385809.5 0 2500000Total Non-Resident Indian Account Deposits; Annual Amounts - Reserve Bank of India Data 197 411,158.90 674620.5 0.87 3746000Difference between Self-Reported NRI Deposits and RBI Administrative Data 197 -144747.7 717274.6 -3499423 1907000
Frequency of Deposits to NRI AccountsFrequency of All Types of Remittances 197 8.76 4.026562 1 12Frequency of NRI Deposits, Self-Reported 197 8.4 3.955825 1 15Frequency of NRI Deposits, RBI Report 196 5.07 5.070851 1 37
Household and Migrant CharacteristicsHigh School Education or Less 197 0.74 0.44 0 1Age 197 50.94 14.83 20 85Male 197 0.56 0.50 0 1Married 197 0.91 0.29 0 1Number in Household 197 3.03 1.38 1 6
Urban Household 197 0.43 0.50 0 1Number of Livestock Owned 197 0.16 0.67 0 7Number of Vehicles Owned 197 1.67 1.50 0 8Total Salary Income in 100,000 Rs. 197 0.69 1.17 0 4.5
Current Age 197 38.40 9.48 24 86Male 197 0.93 0.25 0 1Education prior to migration 197 6.25 1.64 3 10Number of Years Abroad 197 10.81 7.33 0 46
NRI Account Jointly Administered 197 0.88 0.32 0 1Number of Bank Accounts in Household 197 2.25 1.79 0 10Total Amount in All Accounts in 100,000 Rs. 120 4.77 8.84 0 75
Maharashtra 197 0.29 0.45 0 1Gujarat 197 0.30 0.46 0 1Kerala 197 0.20 0.40 0 1Punjab 197 0.21 0.41 0 1
Deposits to NRI Accounts, 2007Total Non-Resident Indian Account Deposits in 2007; Annual Amount - Self-Reported Data in 100,000 Rs. 197 3.80 3.60 0 25
Table 1 : Means
P-Scores of Equality of Covariances of Log Prop
Value and Sec DLog of
Property Value
Total Remittances Sent in the Past 12 Months- All Sources,
Section DTotal Remittances Sent in the Past 12 Months- All Sources, Section D 67451Total Remittances Sent in the Past 12 Months - Purposes, Section E 71463.5 0.9711Total Remittances Sent in the Past 12 Months - Income, Section A 66155.7 0.9999Total Remittances Sent in the Past 12 Months - Modes, Section G 71426.5 0.9983N =196
Log of Property
Value
Total Non-Resident Indian Account Deposits; Annual
Amounts - Reserve Bank of India Data
Total Non-Resident Indian Account Deposits; Annual Amounts - Reserve Bank of India Data 0.981942Total Non-Resident Indian Account Deposits; Annual Amount 0.756702 <0.001
N =196
Table 2: Covariances of Log Property Value and Various Measures of Remittances
A. Correlation CoefficientsCorrelation ( Administrative Remittances, Self-Reported Remittances) 0.172
Correlation (Administrative Remittances, Measurement Error) -0.848
Correlation (Self-Reported Remittances, Measurement Error) 0.3762
Note: Sample size = 197
Table 3: Simple Correlations and Reliability Ratios for Administrative, Reported Earnings Data and Reporting Errors
(1) (2) (3) (4) (5) (6) (7)
VARIABLES
Measurement Error in NRI Remittances
Measurement Error in NRI Remittances
Measurement Error in NRI Remittances
Measurement Error in NRI Remittances
Measurement Error in NRI Remittances
Measurement Error in NRI Remittances
Measurement Error in NRI Remittances
Household Head CharacteristicsHigh School Education or Less -2.194** -2.139* -1.882 -1.615 -1.981* -1.748 -1.125
(1.090) (1.213) (1.203) (1.189) (1.177) (1.687) (1.088)Age 0.002 0.004 -0.014 -0.021 -0.002 0.005 -0.018
(0.036) (0.043) (0.041) (0.041) (0.040) (0.060) (0.039)Male -0.399 -0.350 0.114 0.616 0.241 0.387 0.153
(1.139) (1.232) (1.424) (1.495) (1.427) (2.201) (1.354)Married -0.121 -0.165 -0.464 -0.812 -0.673 -1.614 -0.722
(1.775) (1.928) (1.921) (1.919) (1.918) (1.718) (1.692)Household Characteristics
Number in Household 0.600* 0.646 0.591 0.740** -0.067 0.458 0.088(0.354) (0.410) (0.359) (0.344) (0.381) (0.549) (0.351)
Urban Household -0.340 -0.473 -0.116 -0.189 -0.121 -0.913(1.084) (1.094) (1.119) (1.127) (1.554) (1.046)
Number of Livestock Owned -0.596 -0.530 -0.550 -0.551 -0.430 -0.729(0.788) (0.824) (0.831) (0.806) (0.802) (0.799)
Number of Vehicles Owned -0.156 -0.195 -0.328 -0.493 -0.480 -0.023(0.379) (0.304) (0.311) (0.346) (0.363) (0.282)
Total Salary Income in 100,000 Rs. 0.226 0.314 0.469 0.509 0.255 0.532(0.459) (0.550) (0.499) (0.597) (0.784) (0.551)
Migrant CharacteristicsCurrent Age 0.088 0.067 0.160* 0.105 0.098
(0.083) (0.082) (0.091) (0.093) (0.070)Education prior to migration 0.234 0.260 0.009 -0.055 -0.213
(0.353) (0.349) (0.353) (0.422) (0.372)Number of Years Abroad -0.046 -0.002 -0.151 -0.059 -0.048
(0.113) (0.116) (0.125) (0.108) (0.098)Remittance Variables
NRI Account Jointly Administered 4.057**(1.882)
0.964***(0.352)
0.249***(0.038)
0.655***(0.209)
Constant -1.427 -1.321 -4.707 -8.471** -5.296 -4.158 -3.604(2.720) (3.050) (3.896) (4.186) (3.849) (4.472) (3.660)
Observations 197 197 197 197 197 120 197R-squared 0.0337 0.0405 0.0479 0.0774 0.0790 0.137 0.123Robust standard errors in parentheses*** p<0.01, ** p<0.05, * p<0.1Note: Dependent Variable is given in 100,000 Rs.
Table 4: Determinants of Measurement Error
Total Remittances in 2007; Self-Reported Data in 100,000 Rs.
Total Amount in All Bank Accounts in 100,000 Rs.
Number of Bank Accounts in Household
(1) (2) (3) (4) (5) (6)
VARIABLES
Log Value of Property
Owned by Household
Log Value of Property
Owned by Household
Log Value of Property
Owned by Household
Log Value of Property
Owned by Household
Log Value of Property
Owned by Household
Log Value of Property
Owned by Household
Household Head CharacteristicsHigh School Education or Less -0.049 0.062 0.063 0.062 0.060 0.063
(0.130) (0.131) (0.125) (0.125) (0.125) (0.125)Age 0.006 0.005 0.006 0.006 0.006 0.006
(0.004) (0.004) (0.004) (0.004) (0.004) (0.004)Male 0.156 0.186 0.172 0.157 0.179 0.172
(0.126) (0.123) (0.126) (0.123) (0.127) (0.125)Married -0.328 -0.320 -0.364* -0.353 -0.389* -0.368*
(0.227) (0.212) (0.215) (0.215) (0.219) (0.215)Household Characteristics
Number in Household 0.066 0.039 0.031 0.030 0.029 0.033(0.043) (0.044) (0.047) (0.047) (0.048) (0.046)
Total Salary Income in 100,000 Rs. -0.098** -0.115*** -0.088** -0.085** -0.085** -0.090**(0.043) (0.041) (0.041) (0.041) (0.041) (0.041)
Remittance Variables0.020***(0.007)
0.050***(0.014)
0.043**(0.021)
0.047**(0.021)
0.044**(0.021)
0.046**(0.019)
Constant 14.550*** 14.532*** 14.474*** 14.452*** 14.512*** 14.486***(0.323) (0.304) (0.311) (0.307) (0.311) (0.309)
Observations 196 196 196 196 196 195R-squared 0.117 0.141 0.125 0.131 0.125 0.130Robust standard errors in parentheses*** p<0.01, ** p<0.05, * p<0.1
Table 5: OLS Regression of Log Property Value on Remittance Variables
Total Remittances Sent in the Past 12 Months- All Sources, Section D in 100,000 Rs. Total Remittances Sent in the Past 12 Months - Purposes, Section E in 100,000 Rs. Total Remittances Sent in the Past 12 Months - Income, Section A in 100,000 Rs. Total Remittances Sent in the Past 12 Months - Modes, Section G in 100,000 Rs.
Total Non-Resident Indian Account Deposits; Annual Amounts - Reserve Bank of India Data in 100,000 Rs.Total Non-Resident Indian Account Deposits; Annual Amount - Self-Reported Data in 100,000 Rs.
! 22!
Appendix Table 1. US-India Remittance Flows 2006-07 2007-08 2008-09 CBO 2.475 2.975 2.975 RBI 10.02 14.24 13.79 Source: Congressional Budget Office Migrants’ Remittances and Related Economic Flows February 20111, Exhibit 4; RBI Bulletin, Table 6, p. 787, April 2010.