Remedial Algebra - burlington-nj.net
38
1 CITY OF BURLINGTON PUBLIC SCHOOL DISTRICT CURRICULUM Remedial Algebra Revision Date: 7/1/18 Submitted by: Cameron Heines
Transcript of Remedial Algebra - burlington-nj.net

1
CITY OF BURLINGTON PUBLIC SCHOOL DISTRICT CURRICULUM
Remedial Algebra
Revision Date: 7/1/18
Submitted by: Cameron Heines

2
Table of Contents: Course Overview ........................................................................................................................................................................................................... 3
Pacing Chart ................................................................................................................................................................................................................... 4
Unit 1: Relationships between Quantities and Reasoning with Equations Overview At-a-Glance ............................................................................... 5
Unit #1: Relationships between Quantities and Reasoning with Equations Targeted Instructional Planning to Address Central Unit Standards: ...... 9
Unit 2: Systems, Linear, and Exponential Relationships Overview At-a-Glance ............................................................................................... 13
Unit #2: Systems, and Linear and Exponential Relationships Targeted Instructional Planning to Address Central Unit Standards: ................. 18
Unit 3: Descriptive Statistics Overview At-a-Glance ..................................................................................................................................... 23
Unit #3: Descriptive Statistics Targeted Instructional Planning to Address Central Unit Standards: ............................................................ 27
Unit 4: Quadratic Functions and Modeling Overview At-a-Glance ................................................................................................................ 31
Unit #4: Investigate Bivariate Data Targeted Instructional Planning to Address Central Unit Standards: ..................................................... 35

3
Course Overview The New Jersey Student Learning Standards provide a consistent, clear understanding of what students are expected to learn, so
teachers and parents know what they need to do to help them. The standards are designed to be robust and relevant to the real world,
reflecting the knowledge and skills that our young people need for success in college and careers. With American students fully
prepared for the future, our communities will be best positioned to compete successfully in the global economy.
The curriculum guide has been generated to not only help students achieve the New Jersey Student Learning Standards and
demonstrate proficiency on State assessments, but to also ensure that students will be prepared for college and career opportunities
following high school graduation.
Primary Resource(s)
Textbooks
Title: Envision Algebra 1; Publisher: Pearson Education Inc.; Copyright: 2018
Title: Algebra 1 Common Core; Publisher: Pearson Education Inc.; Copyright: 2012
Supplemental Materials (including various level of texts at each grade level)
Title: NJ Center for Teaching and Learning: Worksheets, Activities, and Assessments
www.njctl.org
Title: Desmos Labs
https://teacher.desmos.com/
Title: EdCite
https://www.edcite.com
Title: Mathematics Assessment Project – Mathematics Assessment Resource Services
http://map.mathshell.org/materials/tasks.php?taskid=381&subpage=apprentice

4
Pacing Chart Unit # & Title Pacing
(must equal 165 days for full-year or
83 days for
half-year course)
Unit 1 – Relationships between Quantities and Reasoning with Equations 23 days
Unit 2 – Systems, and Linear and Exponential Relationships 25 days
Unit 3 – Descriptive Statistics 19 days
Unit 4 – Quadratic Functions and Modeling 16 days

5
Unit 1: Relationships between Quantities and Reasoning with Equations
Overview At-a-Glance Unit #1 – Relationships between Quantities and Reasoning with Equations
Unit Description: By the end of Algebra, students have learned to solve linear equations in one variable and have applied graphical and
algebraic methods to analyze and solve systems of linear equations in two variables. This unit builds on these earlier experiences by
asking students to analyze and explain the process of solving an equation. Students develop fluency in writing, interpreting, and
translating between various forms of linear equations and inequalities, and using them to solve problems. They master the solution of
linear equations and apply related solution techniques and the laws of exponents to the creation and solution of simple exponential
equations. All of this work is grounded on understanding quantities and on relationships between them.
Essential Skills:
Interpret the structure of expressions.
Understand solving equations as a process of reasoning and explain the reasoning.
Solve equations and inequalities in one variable.
Create equations that describe numbers or relationships.
Reason quantitatively and use units to solve problems.
Standards Addressed within this Unit
Central Unit Standards- This unit will focus primarily on
learning goals aligned with the following standards:
Supporting Unit Standards- This unit will also include activities aligned
with the following standards:
A.SSE.1
A.REI.1
A.REI.3
N.Q.1
N.Q.2
N.Q.3
A.CED.1
A.CED.2
A.CED.3
A.CED.4
Math Standards
NJSLS 8.EE.B.5
NJSLS 8.EE.B.6
NJSLS 8.EE.C.7a
NJSLS 8.EE.C.7b
NGSS Standards
HS.PS2.A
HS.PS2.B
HS.ETS1.A
HS.ETS1.C
ELA Standards
RST.11-12.1
SL.11-12.5
WHST.11-12.7
WHST.11-12.8
WHST.11-12.9

6
Unit Details
Modifications for Special Education Students, English
Language Learners, Students at Risk of Failure, and Gifted
Students- Modify instructional approach and/or assignments and
evaluations as needed based for students with IEPs, 504s, ELLs
and gifted and talented students including but not limited to:
Increased integration of higher order thinking processes,
creative and critical thinking activities, problem-solving,
and open-ended tasks
Advanced pacing levels Greater opportunities for freedom of choice and
independent study that encourage independent and intrinsic
learning The student is located close to where the teacher is
providing instruction, in addition to being able to receive
peer assistance.
Visual cues such as linear models are provided on the wall.
Teachers utilize concrete models such as Algebra tiles for
an extended period of time
Students verbalize what they are doing through words,
pictures, and numbers
Students are encouraged to justify their thinking using
targeted mathematical vocabulary
Students are encouraged to restate word problems in their
own words
Students are provided opportunities to teach the concept to
each other.
An abstract concept is represented in a variety of ways,
such as concrete examples, words, symbols, drawings, and
acting it out
Students are placed in heterogeneous groups for peer
assistance and modeling
Integration of 21st century skills through NJSLS 9 and Career
Education:
9.2.12.C.2
Career Ready Practice
CRP 1, 2, 4, 6, 8, 10, 11, 12
Lessons, activities, and assessments require creativity and
innovation on the part of the students. They are required to
create projects and products as examples of mastery in each
unit.
Critical thinking and problem-solving skills are a core
component of learning and assessment throughout this
curriculum. Students are required, in each unit, to advance
their learning through all levels of Bloom’s Taxonomy to
address the evaluation, synthesis, and creation of products
using learning at the highest levels. Problem-solving is a
recurring theme in the curriculum as students must seek
ways to creatively apply the concepts to solve problems
rather than simply remember the material.
Learning advocates for health literacy as a critical
component of a healthy lifestyle and the ability to make
good health-related decisions.
Students explore areas that support environmental literacy,
including society’s impact on the environment and what can
be done to support environmental solutions.
Lessons, where appropriate, incorporate multiple
perspectives to infuse cultural and global awareness.
Students must be information literate, i.e. they must be able
to find and use information effectively, in order to succeed
in class as learning activities require independent research
of relevant information outside of the provided textbook
and/or resources.

7
Assessments- including benchmarks, formative, summative,
and alternative assessments
Formative
Fluency Practice Activities
EDCITE Lesson Quizzes
Topic Readiness Assessment
Mid-Topic Assessment
Mid-Topic Performance Task
(ExamView®) Lesson and Checkpoint Quizzes
PARCC Review Questions
Summative
Modified PARCC Review Questions
STEM Project
Topic Assessment
Topic Performance Task
Suggested Interdisciplinary Activities for this Unit
Career Education- On a business trip, you rent a car. The rental
company charges $24.95 plus $.05 per mile for each mile you
drive. Write a function rule to describe the relationship between
the cost of the rental, r, and the number of miles you drove, m.
Health/PE – Use mathematical formulas to justify the concept of
an efficient diet.
English Language Arts & Literacy – Daily warm-ups and journal
entries will integrate writing and will reinforce prewriting, editing,
and self-evaluating.
Art – Students model fraction multiplication by creating shaded
grids representing fractional values and overlapping with another
grid. The resulting area will illustrate the product of the two
fractions.
Science – Balance chemical equations by applying the law of
conservation of mass.
History/Social Studies – Utilize the Work Backward strategy to
solve problems that only give a final result and ask students to find
the initial value. This can be related to reverse map reading when
directions are given to a location and must be followed in reverse
to find the original starting point.
Technical Subjects- Students interpret linear and exponential
equations that model simple and compound interest investments.
Students will be able to explain the difference between simple
interest and compound interest. They will also be able to
understand multiple representations of the same model, including

8
descriptive, algebraic and tabular data, and graphical
representations of the equations.
World Languages- Using a map of Spain, find the coordinates to
three major cities.
Unit Resources
Teachers should utilize school resources available in our Media Center to infuse alternate sources, perspectives, and approaches.
Resources should include textual support but also span multimedia options to engage multiple modalities. In addition, to support
struggling readers and increase rigor for advanced readers, the coursework may also draw on additional developmentally appropriate
resources to facilitate challenging levels of work for all students.
Leveled Supplemental Materials and Media/School Library
Resources
Various leveled texts available via text, supplemental text, and
in the appendices of the curriculum document
Additional supplemental resources: Learnzillion, Khan
Academy, Math TV, BetterLesson, Kuta Software, Math
Worksheets Land
Informational Text resources from EdHelper, Scholastic Math
Digital Resources: CC Stations, CSI Math Projects, and CCSS
Mathematics Warm-ups
Integration of the Technology Standard
8.1.12.A.3
8.1.12.D.5
Use of Microsoft Excel spreadsheets
Graphing Calculators
Google Classroom to share assignments, problems, explanations
Desmos activities to communicate and collaborate on math tasks

9
Unit #1: Relationships between Quantities and Reasoning with Equations
Targeted Instructional Planning to Address Central Unit Standards: Central Unit
Standard
and Student
Learning
Objective
Suggested Instructional Activities Suggested Student Output Formative Assessments
(Portfolios, Projects,
Tasks, Evaluations, &
Rubrics)
A.SSE.1
A.REI.1
A.REI.3
MARS Tasks: Solving Equation in One Variable
SWBAT solve linear equations in one variable
with rational number coefficients, collect like
terms, expand expressions using the distributive
property, and categorize linear equations in one
variable as having one, none, or infinitely many
solutions. It also aims to encourage discussion
on some common misconceptions about
algebra.
Sorting Equations and Identities
SWBAT interpret exponential and linear
functions and, in particular, to identify and help
students who have the following difficulties:
Translating between descriptive, algebraic,
tabular, and graphical representation of the
functions.
Recognizing how and why a quantity changes
per unit interval.
Defining Regions of Inequalities
SWBAT use linear inequalities to create a set of
solutions.
Teaching Channel: Using Stations to Explore Algebra Expressions
Solving Linear Equations in One
Variable
Students will solve linear equations in one
variable. Given a linear equation in one
variable, students will determine if it has
one, none, or infinitely many solutions.
Students will collaboratively create posters
displaying their justifications and they will
critique each other’s reasoning.
Calling Plans
Students will explore a real-world problem
to determine which is the best deal on a cell
phone plan. Students will create a table,
draw a graph, and write an equation to
model the situation and to assist them in
finding the best deal.
Reasoning with Linear Inequalities
Students will critique a peer’s solution to a
linear inequality and find the mathematical
errors the student made. Students will
explain why some of the steps in the
solution are mathematically incorrect.
Formative
Fluency Practice
Activities
EDCITE Lesson
Quizzes
Topic Readiness
Assessment
Mid-Topic
Assessment
Mid-Topic
Performance Task
(ExamView®)
Lesson and
Checkpoint
Quizzes
PARCC Review
Questions
Summative
Modified PARCC
Review Questions
STEM Project
Topic Assessment
Topic Performance
Task

10
Student groups rotate among tasks to make
sense of expressions
Collaborate to Solve Compound
Inequalities
Transform students into teachers using a jigsaw
to solve inequalities
Algebra Tiles
Use tiles to represent variables and constants,
learn how to represent and solve algebra
problem. Solve equations, substitute in variable
expressions, and expand and factor. Flip tiles,
remove zero pairs, copy and arrange, and make
your way toward a better understanding of
algebra.
Mathematics Vision Project: Module 1: Getting Ready
In preparation for back to school, the school
administration has planned to replace the tile in
the cafeteria. They would like to have a
checkerboard pattern of tiles two rows wide as a
surrounding frame for the tables and serving
carts.
Notebooks will have notes on one side of
the page and visual representations of the
material on the other
Journal entries written about the usage of
linear equations in the real world
Open-ended responses to questions
involving the usage of linear equations for
real world data
Student-led discussion of key points of
linear equations and their transformations
Presentations using technology for a
children’s storybook
Collected Homework
Notebook Checks
N.Q.1
N.Q.2
N.Q.3
MARS TASK: Leaky Faucet
How much water might a dripping faucet waste
in a year?
Leaky Faucet Dan Meyer Extension
Achieve the Core: Yogurt Packing
Use and interpret appropriate units of
measurement, estimation and the
appropriate level of precision for
applications
Journal entries written about the usage of
data in the real world and how to represent
data in algebra

11
Students works to solve a real-life problem
involving money made from packaging and
selling tubs of yogurt.
Illustrative Mathematics: How Much is a penny worth
Pennies have a monetary face value of one cent,
but they are made of material that has a market
value that is usually different.
Traffic Jam
Last Sunday, an accident caused traffic jam 12
miles long on a straight stretch of a two-lane
freeway. How many vehicles do you think were
in the traffic jam? Explain your thinking and
show all calculations.
Open-ended responses to real-world
problems talking about data and
measurement
Student-led discussion of key points of
measurement
Presentations using technology on physical
fitness and the measurement of related
formulas
Collected Homework
Notebook Checks
A.CED.1
A.CED.2
A.CED.3
A.CED.4
MARS Tasks: Building and Solving Equations
SWBAT create and solve linear equations.
Optimization Problems: Boomerangs
SWBAT Interpret a situation and represent the
constraints and variables mathematically, select
appropriate mathematical methods to use,
explore the effects of systematically varying the
constraints, interpret and evaluate generated
data and identify the optimum case, and
checking it for confirmation.
Lines and Linear Equations
SWBAT interpret speed as the slope of a linear
graph, and translate between the equation of a
line and its graphical representation.
Students use hands-on techniques to
investigate the meaning of linear equations.
Students will write the equation of line that
models the height of the cups and they will
interpret the meaning of the slope and y-
intercept in relation to the number and size
of the cups.
Students can find the unit rate or ratio in
real-life situations.
Determine the viability of solutions to a
linear equation or inequality in a real world
context

12
Illustrative Mathematics: Dimes and Quarters
This task does not actually require that the
student solve the system but that they recognize
the pairs of linear equations in two variables
that would be used to solve the system.
Equations and Formulas
SWBAT rewrite formulas and solve for a given
variable in a literal equation.
Rewriting Equations
The goal of this task is to manipulate equations
in order to solve for a specified variable.
Teaching Channel Reviewing Linear Equations in
Two Variables
SW Review understanding of linear equations

13
Unit 2: Systems, Linear, and Exponential Relationships
Overview At-a-Glance Unit #2 – Systems, Linear, and Exponential Relationships
Unit Description: Students will learn function notation and develop the concepts of domain and range. They move beyond viewing
functions as processes that take inputs and yield outputs and start viewing functions as objects in their own right. They explore many
examples of functions, including sequences; they interpret functions given graphically, numerically, symbolically, and verbally, translate
between representations, and understand the limitations of various representations. They work with functions given by graphs and tables,
keeping in mind that, depending upon the context, these representations are likely to be approximate and incomplete. Their work
includes functions that can be described or approximated by formulas as well as those that cannot. When functions describe relationships
between quantities arising from a context, students reason with the units in which those quantities are measured. Students explore
systems of equations and inequalities and they find and interpret their solutions. Students build on, and informally extend their
understanding of, integer exponents to consider exponential functions. They compare and contrast linear and exponential functions,
distinguishing between additive and multiplicative change. They interpret arithmetic sequences as linear functions and geometric
sequences as exponential functions.
Essential Skills:
Extend the properties of exponents to rational exponents.
Build a function that models a relationship between two quantities.
Build new functions from existing functions.
Understand the concept of a function notation.
Interpret functions that arise in applications in terms of a context.
Analyze functions using different representations.
Solve systems of equations.
Represent and solve equations and inequalities graphically.

14
Standards Addressed within this Unit
Central Unit Standards- This unit will focus primarily on
learning goals aligned with the following standards:
Supporting Unit Standards- This unit will also include activities
aligned with the following standards:
N.RN.1
N.RN.2
F.BF.1
F.BF.2
F.BF.3
F.IF.1
F.IF.2
F.IF.3
F.IF.4
F.IF.7
F.IF.9
A.REI.5
A.REI.6
A.REI.10
A.REI.11
A.REI.12
Math Standards
8.EE.C.8a
8.EE.C.8b
8.EE.C.8c
8.SP.A.3
8.F.B.4
NGSS Standards
HS.LS4.A
HS.LS4.B
HS.LS4.C
ELA Standards
RST.11-12.1
RST.11-12.8
SL.11-12.4
WHST.11-12.9
WHST.9-12.2
Unit Details
Modifications for Special Education Students, English
Language Learners, Students at Risk of Failure, and Gifted
Students- Modify instructional approach and/or assignments and
evaluations as needed based for students with IEPs, 504s, ELLs
and gifted and talented students including but not limited to:
ELL support materials (eDictionaries, native language
prompts, etc.)
Increased integration of higher order thinking processes,
creative and critical thinking activities, problem-solving,
and open-ended tasks CSI Projects to integrate higher-order thinking skills and
creativity
Create portfolios and Peer Lessons
Graphic organizers
Visual Vocabulary
Use real-word context examples to demonstrate the
meaning of the parts of a system of equations for the
students
Use of visual interactive websites that through the
manipulation of graphs represent inequalities
Integration of 21st century skills through NJSLS 9 and Career
Education:
9.2.12.C.2
Career Ready Practice
CRP 1, 2, 4, 6, 8, 10, 11, 12
Lessons, activities, and assessments require creativity and
innovation on the part of the students. They are required to
create projects and products as examples of mastery in each
unit.
Critical thinking and problem-solving skills are a core
component of learning and assessment throughout this
curriculum. Students are required, in each unit, to advance
their learning through all levels of Bloom’s Taxonomy to
address the evaluation, synthesis, and creation of products
using learning at the highest levels. Problem-solving is a
recurring theme in the curriculum as students must seek
ways to creatively apply the concepts to solve problems
rather than simply remember the material.
Lessons, where appropriate, incorporate multiple
perspectives to infuse cultural and global awareness.

15
Students find it useful through technology to recognize
functions that represents the same relationship
Provide a situation that uses Desmos to demonstrate how to
build a function to model a relationship between two
quantities
Students will design a word problem that reflects the use of
graphing inequalities
Students will write a real-life scenario and explain the
process needed to solve a system of linear equations with
two variables
Student will create a real world problem where students
will build a function that model a relationship between two
quantities
Students will explain the relationship of properties of
exponents to exponential functions
Students will compare and contrast the properties of a
linear equation and linear inequality equation
Students discuss the following question: Which quantity
will grow more rapidly - one that is increasing
exponentially, one that is increasing quadratically or one
that is increasing linearly?
Learning and assessment activities support the push to
make students media literate, as they are often required to
analyze, evaluate, and create messages in a wide variety of
media modes, genres, and formats.
In order to succeed in this course, students must be able to
use technology as a tool in order to research, organize,
evaluate, and communicate information.
Activities in the curriculum help develop life and career
skills in all students by promoting flexibility and
adaptability, requiring initiative and self-direction in the
learning process, supporting social and cross-cultural skills
in both content and teamwork efforts, and measuring
productivity and accountability through independent and
group assignment completion.
Assessments- including benchmarks, formative, summative,
and alternative assessments
Formative
Fluency Practice Activities
EDCITE Lesson Quizzes
Topic Readiness Assessment
Mid-Topic Assessment
Mid-Topic Performance Task
(ExamView®) Lesson and Checkpoint Quizzes
PARCC Review Questions
Suggested Interdisciplinary Activities for this Unit
Career Education – Students use linear functions to analyze and
compare the weekly income for the allowances and summer jobs
for two high schools students. They determine under which
circumstances each student will make the most income and explain
what happens to the functions when hourly rates or allowances are
changed.
Health/PE – Find the amount of heartbeats in 10 seconds.
Estimate the amount of heartbeats in one minute

16
Summative
Modified PARCC Review Questions
STEM Project
Topic Assessment
Topic Performance Task
English Language Arts & Literacy – Jack has already typed 3
pages for a report. Jill hasn’t even started yet. Jack writes ½ page
a day. Jill can write 1 page per day. After how many days will
they have the same number of pages written?
Science – A staff gauge measures the height of the water level in a
river compared to the average water level. At one gauge the river
is 1 ft. below its average water level of 10 ft. it begins to rise by a
constant rate of 1.5 f.t per hour. Graph the linear function to show
the change in water level over time.
History/Social Studies – Find a recursive formula for the height
above the ground of the nth step of the pyramid for Machu Pichu.
Technical Subjects – A fashion designer is designing a patterned
fabric. Complete a table for the amount of rows of squares of
alternating colors and the amount of each color.
World Languages – Find the highest and lowest point in France.
Create inequalities to represent those points and shade the area that
they overlap. What does the overlap represent?
Unit Resources
Teachers should utilize school resources available in our Media Center to infuse alternate sources, perspectives, and approaches.
Resources should include textual support but also span multimedia options to engage multiple modalities. In addition, to support
struggling readers and increase rigor for advanced readers, the coursework may also draw on additional developmentally appropriate
resources to facilitate challenging levels of work for all students.
Leveled Supplemental Materials and Media/School Library
Resources
Various leveled texts available via text, supplemental text,
and in the appendices of the curriculum document
Integration of the Technology Standard
8.1.12.A.2
8.1.12.F.1
Use of Microsoft Excel spreadsheets

17
Additional supplemental resources: Learnzillion, Khan
Academy, Math TV, BetterLesson, Kuta Software, Math
Worksheets Land
Informational Text resources from EdHelper, Scholastic
Math
Digital Resources: CC Stations, CSI Math Projects, and
CCSS Mathematics Warm-ups
Graphing Calculators
Google Classroom to share assignments, problems, explanations
Desmos activities to communicate and collaborate on math tasks
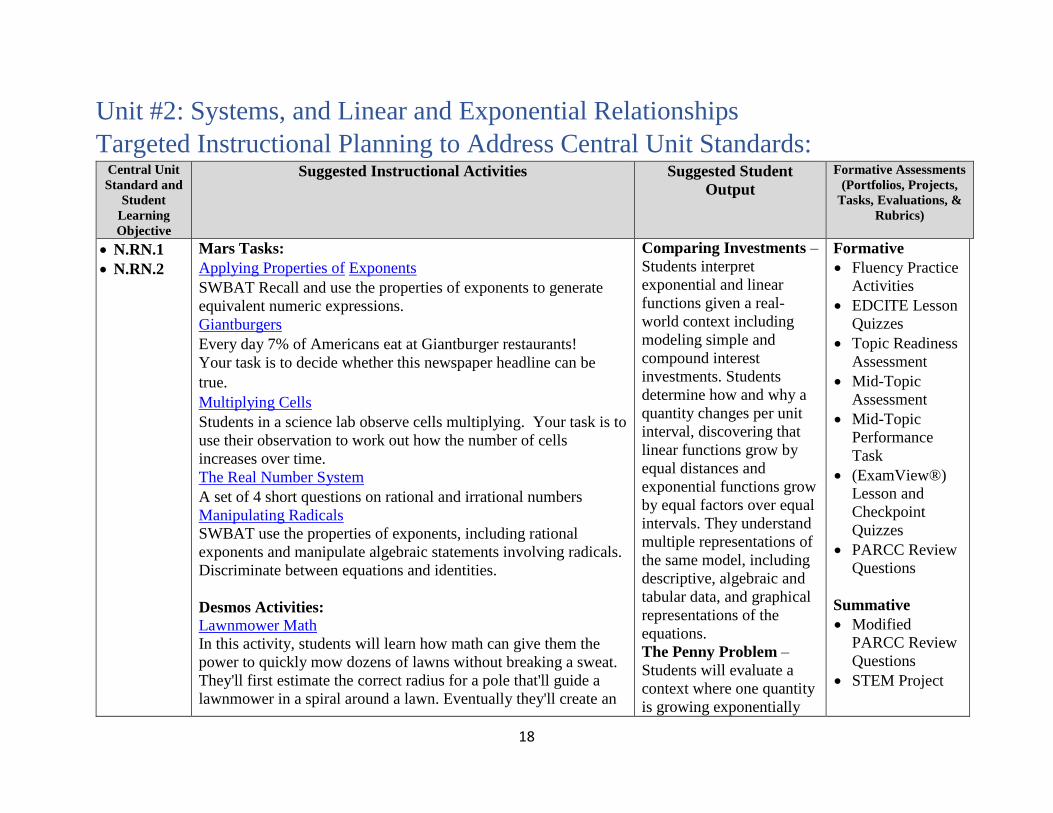
18
Unit #2: Systems, and Linear and Exponential Relationships
Targeted Instructional Planning to Address Central Unit Standards: Central Unit
Standard and
Student
Learning
Objective
Suggested Instructional Activities Suggested Student
Output
Formative Assessments
(Portfolios, Projects,
Tasks, Evaluations, &
Rubrics)
N.RN.1
N.RN.2
Mars Tasks:
Applying Properties of Exponents
SWBAT Recall and use the properties of exponents to generate
equivalent numeric expressions.
Giantburgers
Every day 7% of Americans eat at Giantburger restaurants!
Your task is to decide whether this newspaper headline can be
true.
Multiplying Cells
Students in a science lab observe cells multiplying. Your task is to
use their observation to work out how the number of cells
increases over time.
The Real Number System
A set of 4 short questions on rational and irrational numbers
Manipulating Radicals
SWBAT use the properties of exponents, including rational
exponents and manipulate algebraic statements involving radicals.
Discriminate between equations and identities.
Desmos Activities:
Lawnmower Math
In this activity, students will learn how math can give them the
power to quickly mow dozens of lawns without breaking a sweat.
They'll first estimate the correct radius for a pole that'll guide a
lawnmower in a spiral around a lawn. Eventually they'll create an
Comparing Investments –
Students interpret
exponential and linear
functions given a real-
world context including
modeling simple and
compound interest
investments. Students
determine how and why a
quantity changes per unit
interval, discovering that
linear functions grow by
equal distances and
exponential functions grow
by equal factors over equal
intervals. They understand
multiple representations of
the same model, including
descriptive, algebraic and
tabular data, and graphical
representations of the
equations.
The Penny Problem –
Students will evaluate a
context where one quantity
is growing exponentially
Formative
Fluency Practice
Activities
EDCITE Lesson
Quizzes
Topic Readiness
Assessment
Mid-Topic
Assessment
Mid-Topic
Performance
Task
(ExamView®)
Lesson and
Checkpoint
Quizzes
PARCC Review
Questions
Summative
Modified
PARCC Review
Questions
STEM Project

19
algebraic expression and see how it helps them mow lots of lawns
very quickly.
Pool Boarder Problem
In this Desmos-ified treatment of a classic math problem, students
will first construct expressions with numbers to determine the
number of tiles that border a pool. Then they'll use those numerical
expressions to help them write an expression with VARIABLES.
Then they'll put the algebraic expression to the test, and see if it
helps them find the tiles for lots of pools very quickly.
Pentomino Puzzles
In this activity, students work through a series of "pentomino sum"
puzzles. They begin informally (and rather inefficiently). But later,
they'll develop and apply an algebraic approach, demonstrating the
power and efficiency of mathematics along the way.
and the other is linear.
Students will determine
that a quantity that is
increasing exponentially
will eventually exceed a
quantity that is increasing
linearly.
Topic
Assessment
Topic
Performance
Task
F.BF.1
F.BF.2
F.BF.3
MARS Tasks:
A Golden Crown
Archimedes famously solved a problem for a king who thought his
crown might be a fake. In this task, you must work out whether the
crown is pure gold.
Modeling Situations with Linear Equations
SWBAT find relationships between pairs of unknowns and
express these as tables and graphs. Find general relationships
between several variables and express these in different ways by
rearranging formulas.
Illustrative Mathematics:
Skeleton Tower - This problem is a quadratic function example
A Sum of Functions - The intent of this problem is to have
students think about how function addition works on a
fundamental level
Lake Algae - The purpose of this task is to introduce students to
exponential growth.
Arithmetic and
Geometric Sequences –
Students investigate
arithmetic and geometric
sequences by creating
functions for the two types
of sequences. Students link
arithmetic sequences to
linear functions and
geometric sequences to
exponential functions.
Notebooks will have notes
on one side of the page and
visual representations of
the material on the other
Journal entries written
about how to set up

20
Kim and Jordan - In this task, students may choose a
representation that suits them and then reason from within that
representation.
Campus Flu - The purpose of this problem is to have students
compose functions using tables of values only.
Teaching Channel:
Conjecturing About Functions - Analyze patterns and represent
functions
YouCubed.org:
Patterns and Functions
The goal of this unit is to show students the importance of looking
for patterns and why there is a need to generalize them, especially
if there is a very large figure number.
Desmos Activities:
Charge!
In this activity, students use linear modeling to predict how long it
will take for a smartphone to reach full charge. Students will also
interpret the parameters of their equation in context.
Penny Circle
In this activity, students gather data, build a model, and then use
that model to answer the question, "How many pennies fit in a
large circle?"
Opening Weekend Sales
In this activity, students use previous iPhone sales data to make
predictions about the number of iPhone 6s units sold during its
opening weekend in September 2015. Students choose from linear,
quadratic, or exponential models, or build their own based on a
different function of their choosing.
functions and what purpose
they have in the real world
Open-ended responses to
questions involving
functions and how to enter
them into technology
Student-led discussion
on setting up functions
Technology-based
presentation based around
a game they created:
The students will need to
use google sheets as part of
their game creation
Collected Homework and Notebook Checks

21
F.IF.1
F.IF.2
F.IF.3
F.IF.4
F.IF.7
F.IF.9
Illustrative Mathematics
Foxes and Rabbits
This task emphasizes the importance of the "every input has
exactly one output" clause in the definition of a function, which is
violated in the table of values of the two populations.
Interpreting the Graph
The purpose of this task is to help students learn to read
information about a function from its graph, by asking them to
show the part of the graph that exhibits a certain property of the
function.
Mathematics Vision Project:
Module 5 Features of Functions
This task is designed to develop the ideas of features of functions
using a situation.
Desmos Activities:
Graphing Stories
This activity will help students make the transition from one-
variable representations (eg. number lines) to the TWO-variable
representation of the coordinate plane. Students will watch 15-
second videos and translate them into graphs with your help.
Commuting Times
This activity illustrates the relationship between a dataset (which
is usually not a function) and a model of the data (which—in
algebra—is a function).
Marbleslides: Lines
In this delightful and challenging activity, students will transform
lines so that the marbles go through the stars. Students will test
their ideas by launching the marbles, and have a chance to revise
before trying the next challenge.
Notebooks will have notes
on one side of the page and
visual representations of
the material on the other
Journal entries written
about how to set up
functions and what purpose
they have in the real world
Open-ended responses
involving functions and
how to enter them into
technology
Student-led discussion of
key points of functions
Technology based
presentation about the
length of time to say
tongue twisters. Data will
be recorded and presented
using google slides
Collected Homework and
Notebook Checks

22
A.REI.5
A.REI.6
A.REI.10
A.REI.11
A.REI.11
Mars Tasks:
Defining Regions Using Inequalities
Students will use linear inequalities to create a set of solutions.
Desmos Activities:
Systems of Linear Equations
In this activity, students write and solve a system of two linear
equations to explore the numerical and graphical meaning of
"solution." The activity closes by asking students to apply what
they've learned to similar situations.
Playing Catch-Up
Students will develop their understanding of systems of equations,
particularly as they're represented as tables, equations, and graphs.
They'll apply that understanding to the question, "Will one racer
catch another?”
Wafers and Crème
In this activity, students predict which pack of cookies contains
more calories. Students then learn the number of calories in each
pack and use this new information to calculate the number of
calories in a new pack of cookies.
Polygraph: Linear Systems
This Custom Polygraph is designed to spark vocabulary-rich
conversations about systems of linear equations. Key vocabulary
that may appear in student questions includes: parallel, intersect,
solution, quadrant, axis, vertical, horizontal, slanted, increasing,
and decreasing.
Open-ended responses to
real-world problems
involving systems of linear
equations
Student-led discussion of
the different methods of
solving systems of linear
equations
Presentations using
technology for a Student
Council dinner. Students
will be given different
variables to consider and
they will solve a system of
linear equations to
determine the course of
action that should be
followed
Collected Homework
Notebook Checks

23
Unit 3: Descriptive Statistics
Overview At-a-Glance Unit #3 – Descriptive Statistics
Unit Description: Experience with descriptive statistics began as early as Grade 6. Students were expected to display numerical data
and summarize it using measures of center and variability. By the end of middle school, they were creating scatterplots and recognizing
linear trends in data. This unit builds upon that prior experience, providing students with more formal means of assessing how a model
fits data. Students use regression techniques to describe approximately linear relationships between quantities. They use graphical
representations and knowledge of the context to make judgments about the appropriateness of linear models. With linear models, they
look at residuals to analyze the goodness of fit.
Essential Skills:
Summarize, represent, and interpret data on a single count or measurement variable
Summarize, represent, and interpret data on two categorical and quantitative variables
Interpret linear models
Standards Addressed within this Unit
Central Unit Standards- This unit will focus primarily on
learning goals aligned with the following standards:
Supporting Unit Standards- This unit will also include activities
aligned with the following standards:
S.ID.1
S.ID.2
S.ID.3
S.ID.5
S.ID.6
S.ID.7
S.ID.8
S.ID.9
Math Standards
NJSLS 8.SP.A.1
NJSLS 8.SP.A.2
NJSLS 8.SP.A.3
NJSLS 8.SP.A.4
NJSLS 8.F.A.3
NJSLS 8.F.B.4
NGSS Standards
HS.ESS1.B
HS.ESS2.A HS.ESS2.D
HS-ESS3.D
ELA Standards
RST.11-12.1
RST.11-12.2 RST.11-12.7
SL.11-12.5

24
Unit Details
Modifications for Special Education Students, English
Language Learners, Students at Risk of Failure, and Gifted
Students- Modify instructional approach and/or assignments and
evaluations as needed based for students with IEPs, 504s, ELLs
and gifted and talented students including but not limited to:
Have the students work in groups to generate data from the
internet, such as the CST scores and other data. Have them
construct a table based on the pattern and then graph the
values and explain the relationship observed on the graph
(association). Example: Certain students took two different
tests (Test A and Test B). In the scatter diagram, each
square represents one student and shows the scores that
student got in the two tests.
Use graphs of experiences that are familiar to students to
increase accessibility and supports understanding and
interpretation of proportional relationship. Students are
expected to both sketch and interpret graphs including
scatter plot
Students will explore how the residuals, the differences
between the corresponding coordinates on the least squares
line and the actual data values for each age, reveal
additional information. Students should be able to sketch
each distribution and answer questions about it just from
knowledge of these three facts (shape, center, and spread)
Have students design an experiment (project) where they
would collect data from different sources, make a scatter
plot of the data, and draw a line of best fit modeling the
data. From the plot, students would write the regression
coefficient and the residual to explain the strength of the
association
Integration of 21st century skills through NJSLS 9 and Career
Education:
9.2.12.C.2
Career Ready Practice
CRP 1, 2, 4, 6, 8, 10, 11, 12
Lessons, activities, and assessments require creativity and
innovation on the part of the students. They are required to
create projects and products as examples of mastery in each
unit.
Critical thinking and problem-solving skills are a core
component of learning and assessment throughout this
curriculum. Students are required, in each unit, to advance
their learning through all levels of Bloom’s Taxonomy to
address the evaluation, synthesis, and creation of products
using learning at the highest levels. Problem-solving is a
recurring theme in the curriculum as students must seek
ways to creatively apply the concepts to solve problems
rather than simply remember the material.
Students explore areas that support environmental literacy,
including society’s impact on the environment and what can
be done to support environmental solutions.
Lessons integrate a focus on civic literacy so that student can
better understand the rights and obligations of citizenship.
Learning advocates for health literacy as a critical
component of a healthy lifestyle and the ability to make
good health-related decisions.
Communication and collaboration is crucial for student
success as learners. Throughout this curriculum, students
must be able to communicate deep understanding through
open ended responses (both orally and in writing). In
addition, students are often required to work collaboratively

25
with their peers, which promotes the ability to succeed in
the area of social cooperative work, increases
communication skills, and promotes leadership and
responsibility.
Assessments- including benchmarks, formative, summative,
and alternative assessments
Formative
Fluency Practice Activities
EDCITE Lesson Quizzes
Topic Readiness Assessment
Mid-Topic Assessment
Mid-Topic Performance Task
(ExamView®) Lesson and Checkpoint Quizzes
PARCC Review Questions
Summative
Modified PARCC Review Questions
STEM Project
Topic Assessment
Topic Performance Task
Suggested Interdisciplinary Activities for this Unit
Career Education- A pollster selects 100 people from each town
in a certain candidate’s district to see if they support the candidate.
Decide whether the sampling is random, systematic, or stratified.
Health/PE – Students study historical Super Bowl data to reflect
on average (mean, median, and mode) losing scores, winning
scores, and range of scores. They are asked to judge which of these
central measurements seem the most meaningful and explain their
reasoning.
English Language Arts & Literacy- Create a Venn diagram
comparing traits of two novels by the same author.
Art - Students create three dimensional graphs of survey data
(such as favorite food, movie, sport, etc.).
Science – Students experiment with line of best fit using technology
or an applet. Students will use a scatter graph to investigate a
possible connection between length and width of bird’s eggs. They
will create a scatter plot to compare team salary with team wins and
analyze data in this timely activity. Students can use this data to see
if there is a statistically significant correlation between team salary
and wins.
History/Social Studies–Collect data from various resources about
the population of all countries in South America, calculate both

26
mean and median and use this information as a comparison to
determine which country is the “most popular.”
Technical Subjects – Create PowerPoint presentations to display
data collected about rainfall amounts in NJ over the past 10 years.
World Languages – What is the distribution of languages
throughout the world in terms of population and/or countries?
How is it changing?
Unit Resources
Teachers should utilize school resources available in our Media Center to infuse alternate sources, perspectives, and approaches.
Resources should include textual support but also span multimedia options to engage multiple modalities. In addition, to support
struggling readers and increase rigor for advanced readers, the coursework may also draw on additional developmentally appropriate
resources to facilitate challenging levels of work for all students.
Leveled Supplemental Materials and Media/School Library
Resources
Various leveled texts available via text, supplemental text,
and in the appendices of the curriculum document
Additional supplemental resources: Learnzillion, Khan
Academy, Math TV, BetterLesson, Kuta Software, Math
Worksheets Land
Informational Text resources from EdHelper, Scholastic
Math
Digital Resources: CC Stations, CSI Math Projects, and
CCSS Mathematics Warm-ups
Integration of the Technology Standard
8.1.12.A.5
8.2.12.A.2
Use of Microsoft Excel spreadsheets
Graphing Calculators
Google Classroom to share assignments, problems, explanations
Desmos activities to communicate and collaborate on math tasks

27
Unit #3: Descriptive Statistics
Targeted Instructional Planning to Address Central Unit Standards: Central Unit
Standard
and Student
Learning
Objective
Suggested Instructional Activities Suggested Student
Output
Formative
Assessments
(Portfolios, Projects,
Tasks, Evaluations,
& Rubrics)
S.ID.1
S.ID.2
S.ID.3
MARS Tasks:
Using Frequency Graphs
SWBAT use frequency graphs to identify a range of measures and
make sense of this data in a real-world context.
Using Box Plots
SWBAT interpret data using frequency graphs and box plots. In
particular, this unit aims to identify and help students who have
difficulty figuring out the data points and spread of data from
frequency graphs and box plots.
Illustrative Mathematics:
Haircut Costs
This problem could be used as an introductory lesson to present group
comparisons and to engage students in a question they may find
amusing and interesting.
Speed Trap
SWBAT demonstrate an ability to construct boxplots and to use
boxplots as the basis for comparing distributions.
Understanding the Standard Deviation
SWBAT understand the standard deviation as a measure of variability
in a data distribution. The task is conceptual rather than computational
and does not require students to calculate the standard deviation.
Measuring Variability in a Data Set
Create a scatterplot
from given data and
explain how the two
sets of data are related
and what the trend
appears to be Describe the positive or
negative correlation
between bivariate data
by modeling data with
line. Observe and
explain any outliers. Produce frequency table
of collected bivariate data Make logical
conjectures and
predictions from
scatterplot data
Formative
Fluency Practice
Activities
EDCITE Lesson
Quizzes
Topic Readiness
Assessment
Mid-Topic
Assessment
Mid-Topic
Performance
Task
(ExamView®)
Lesson and
Checkpoint
Quizzes
PARCC Review
Questions
Summative
Modified
PARCC Review
Questions

28
The purpose of this task is to develop students’ understanding of
standard deviation
Mathematics Vision Project:
Module 8-Modeling Data
In this task, students will use prior knowledge to interpret data using a
histogram, and then represent the same data with a box plot. Students
will also discuss the similarities/differences of these representations
and surface ideas relating to effects of extreme data points (outliers)
and data that is bimodal.
Journal entries (from
teacher provided prompts) Notebook activities Open-ended responses Practice Worksheets
STEM Project
Topic
Assessment
Topic
Performance
Task
S.ID.5
S.ID.6
MARS Tasks:
Interpreting and Using a Graph: Taxi Fares
SWBAT select and use mathematical ideas to solve a problem and
then compare and critique alternative approaches. The lesson presents
students with a distance-time scatter plot representing journeys made
by a taxi cab. They use this to decide upon a suitable rate at which the
driver should charge passengers.
Devising a Measure for Correlation
SWBAT understand the notion of positive correlation. In particular,
this unit aims to identify and help students who have difficulty in
understanding correlation as the degree of fit between two variables and making a mathematical model of a situation.
Illustrative Mathematics:
Musical Preference
The basic idea is for students to demonstrate that they know what it
means for two variables to be associated: that if we knew someone
were in one group (for example, they like rap), we now know more
about their preferences for rock than if we knew nothing at all.
Support for a Longer School Day
Notebooks will have
notes on one side of the
page and visual
representations of the
material on the other
Journal entries written
about how to data and
where it can be found in
the real world.
Open-ended responses
to questions involving
data and how to enter it
into technology
Student-led discussion
on the different ways to
present data
Technology-based
presentation about
gathered data. The

29
The purpose of this task is to provide students with an opportunity to
calculate and interpret joint, marginal and relative frequencies using
data in a two-way table
Coffee and Crime
This task addresses many standards regarding the description and
analysis of bivariate quantitative data, including regression and
correlation.
Laptop Battery Charge
This task uses a situation that is familiar to students to solve a problem
they probably have all encountered before: How long will it take until
an electronic device has a fully charged battery? A linear model can
be used to solve this problem.
Restaurant Bill and Party Size
The purpose of this task is to assess student understanding of residuals
and residual plots (S.ID.6). Students see a residual plot in a context
where a linear model is appropriate and also see a residual plot in a
context where a linear model is not appropriate.
Desmos Activities:
Scatter Plot Capture
In this activity, students use observations about scatterplot
relationships to make predictions about future points in the plot. In
particular, students focus on linear vs nonlinear association, strong vs weak association, and increasing vs decreasing plots.
Polygraph: Scatter Plots
This Custom Polygraph is designed to spark vocabulary-rich conversations about scatter plots.
Line of Best Fit
In this activity, students visualize a line to fit a data set, then graph that line with sliders, and use it to make a prediction.
students will determine
what information they
would like to gather
from other students and
then they will go collect
it. They will also need
to present the data and
analysis to the class.
Collected Homework
and Notebook Checks
Student-constructed
written summaries of
key points and
applications of
essential topics and/or
essential questions

30
S.ID.7
S.ID.8
S.ID.9
Illustrative Mathematics:
Texting and Grades II
The purpose of this task is to assess ability to interpret the slope and intercept of the line of best fit in context.
Olympic Men’s 100meter Dash
The task asks students to identify when two quantitative variables
show evidence of a linear association, and to describe the strength and
direction of that association. Students then utilize a least-squares
regression line to make predictions, and to make conjectures about the
limitations of the model.
Golf and Divorce
This is a simple task addressing the distinction between correlation
and causation. Students are given information indicating a correlation
between two variables, and are asked to reason out whether or not a
causation can be inferred.
High Blood Pressure
The purpose of this task is to assess understanding of how study
design dictates whether a conclusion of causation is warranted.
Math Test Grades
The goal of this task is twofold. For part (a) since we are not given
how large each of the groups in the table are, the best we can do is to
apply reasoning about ratios (in the form of percents) to give a range
of possible answers. For part (b), the goal is to recognize a misuse of
statistical reasoning. Of the three groups, the one with the highest
percentage of A's is the group whose studies were limited to less than
3 hours a week.
Desmos Activities:
Alligator Investigation
An enormous alligator lurks in the swamp. Can scatterplots and least-
squares regression tell you if you have enough animal tranquilizer to
stay safe?
Notebooks will have
notes on one side of the
page and visual
representations of the
material on the other
Journal entries written
about how to data and
where it can be found in
the real world
Open-ended responses
to questions involving
data and how to enter it
into technology
Student-led discussion
on the different ways to
present data
Technology-based
presentation about
gathered data. The
students will determine
what information they
would like to gather
from other students and
then they will go collect
it. They will also need
to present the data and
analysis to the class.
Collected Homework
and Notebook Checks

31
Unit 4: Quadratic Functions and Modeling
Overview At-a-Glance Unit #4 – Quadratic Functions and Modeling
Unit Description: In preparation for work with quadratic relationships, students explore distinctions between rational and irrational
numbers. They consider quadratic functions, comparing the key characteristics of quadratic functions to those of linear and
exponential functions. They select from among these functions to model phenomena. Students learn to anticipate the graph of a
quadratic function by interpreting various forms of quadratic expressions. In particular, they identify the real solutions of a quadratic
equation as the zeros of a related quadratic function.
Essential Skills:
Use properties of rational and irrational numbers.
Interpret functions that arise in applications in terms of a context.
Analyze functions using different representations.
Build a function that models a relationship between two quantities.
Build new functions from existing functions.
Construct and compare linear, quadratic, and exponential models and solve problems.
Interpret expressions for functions in terms of the situation they model.
Standards Addressed within this Unit
Central Unit Standards- This unit will focus primarily on
learning goals aligned with the following standards:
Supporting Unit Standards- This unit will also include activities
aligned with the following standards:
F.IF.4
F.IF.5
F.IF.6
F.IF.7
F.IF.8
F.IF.9
F.BF.1
F.BF.3
F.BF.4
Math Standards
N.RN.3
F.LE.1
F.LE.2
F.LE.3
F.LE.5
NGSS Standards
HS.PS1.A HS.PS1.B
HS.ETS1.C
ELA Standards
RST.11-12.1 SL.11-12.5 WHST.11-12.7
WHST.9-12.2

32
Unit Details
Modifications for Special Education Students, English
Language Learners, Students at Risk of Failure, and Gifted
Students- Modify instructional approach and/or assignments and
evaluations as needed based for students with IEPs, 504s, ELLs
and gifted and talented students including but not limited to:
Advance/Guided Notes Teacher Modeling (non-verbal teacher communication in
addition to spoken instructions)
Simplified written and verbal instructions ELL support materials (eDictionaries, native language
prompts, etc.)
Increased integration of higher order thinking processes,
creative and critical thinking activities, problem-solving,
and open-ended tasks Advanced pacing levels CSI Projects to integrate higher-order thinking skills and
creativity
Create portfolios and Peer Lessons
Reteaching worksheets
Graphic organizers
Visual Vocabulary
Graph paper to produce visual representations of
transformations
Have students evaluate different functions (linear,
quadratics, and exponential) for a given variable. Then
engage the students in identifying appropriate domain for
the functions.
Help students take the "function machine" that they learned
in the earlier grades and turn it into a deeper understanding
of relating the situation, table, and rule (formula) of
Integration of 21st century skills through NJSLS 9 and Career
Education:
9.2.12.C.2
Career Ready Practice
CRP 1, 2, 4, 6, 8, 10, 11, 12
Lessons, activities, and assessments require creativity and
innovation on the part of the students. They are required to
create projects and products as examples of mastery in each
unit.
Critical thinking and problem-solving skills are a core
component of learning and assessment throughout this
curriculum. Students are required, in each unit, to advance
their learning through all levels of Bloom’s Taxonomy to
address the evaluation, synthesis, and creation of products
using learning at the highest levels. Problem-solving is a
recurring theme in the curriculum as students must seek
ways to creatively apply the concepts to solve problems
rather than simply remember the material.
Learning advocates for health literacy as a critical
component of a healthy lifestyle and the ability to make
good health-related decisions.
In order to succeed in this course, students must be able to
use technology as a tool in order to research, organize,
evaluate, and communicate information.
Learning incorporates skills focusing on financial,
economic, business, and entrepreneurial literacy.
Students must be information literate, i.e. they must be able
to find and use information effectively, in order to succeed
in class as learning activities require independent research
of relevant information outside of the provided textbook
and/or resources.

33
functions. The goal here is to help students make the
connections
Understanding and use the formal mathematical language
of functions
Provide students an opportunity to compare two functions
(quadratic and exponential), represented in different ways
(table, graph, or situation)
Provide the students several opportunities to collect data to
model different situations related to linear, quadratic,
exponential functions, and trigonometric functions
Students explore areas that support environmental literacy,
including society’s impact on the environment and what can
be done to support environmental solutions.
Assessments- including benchmarks, formative, summative,
and alternative assessments
Formative
Fluency Practice Activities
EDCITE Lesson Quizzes
Topic Readiness Assessment
Mid-Topic Assessment
Mid-Topic Performance Task
(ExamView®) Lesson and Checkpoint Quizzes
PARCC Review Questions
Summative
Modified PARCC Review Questions
STEM Project
Topic Assessment
Topic Performance Task
Unit 1-4 Cumulative/Benchmark Assessment
Suggested Interdisciplinary Activities for this Unit
Career Education – A cell phone company sells about 500 phones
each week when it charges $75 per phone. It sells 20 more phones
per week for each $1 decrease in price. The company’s revenue is
the product of the number of phones sold and the price of each
phone. What price should the company charge to maximize its
revenue?
Health/PE – What function can be used to track a ball in flight?
Students compare properties of two functions represented in
different ways - algebraically, graphically, or in numerical tables.
Using tables and graphs, students determine which function has the
greatest maximum and the greatest non-negative root.
English Language Arts & Literacy – How can you use the
discriminant to write a quadratic equation and to determine the
number of solutions? Write an instruction set that could be used
by a non- mathematician. Art – Either create a bowl or bring a bowl in. Measure three
coplanar points on the inside of the bowl. Then create an equation

34
for the parabola on the inside of the bowl by using those three
points.
Science – Temperature Conversions - Students write a function
that describes a relationship between two quantities. They explore
unit conversion as composition of two functions (when several
successive conversions are required) and the inverses of those
functions (units can always be converted in either of two
directions).
History/Social Studies – Population and Food Supply – Students
construct linear/ exponential functions from verbal descriptions
and explore the idea of the dominance of exponential over linear
functions. They construct/ compare linear and exponential
functions and find the intersections of their graphs. Using graphs
and tables students observe that an exponential increase eventually
exceeds a linear or quadratic increase in quantities.
Technology – Use Excel to generate quadratic lines of best fit.
Discuss correlation coefficients. Using phone data from prior
activities, use a spreadsheet to find a line of best fit. Compare this
to the line of best fit from a graphing utility.
World Language – Translate the key words: parabola, vertex,
point, curve, quadratic, and polynomial. Then write a brief
explanation of each word in [insert world language].
Unit Resources
Teachers should utilize school resources available in our Media Center to infuse alternate sources, perspectives, and approaches.
Resources should include textual support but also span multimedia options to engage multiple modalities. In addition, to support
struggling readers and increase rigor for advanced readers, the coursework may also draw on additional developmentally appropriate
resources to facilitate challenging levels of work for all students.

35
Leveled Supplemental Materials and Media/School Library
Resources
Various leveled texts available via text, supplemental text,
and in the appendices of the curriculum document
Additional supplemental resources: Learnzillion, Khan
Academy, Math TV, BetterLesson, Kuta Software, Math
Worksheets Land
Informational Text resources from EdHelper, Scholastic
Math
Digital Resources: CC Stations, CSI Math Projects, and
CCSS Mathematics Warm-ups
Integration of the Technology Standard
8.1.12.C.1 8.1.12.A.1
Use of Microsoft Excel spreadsheets
Graphing Calculators
Google Classroom to share assignments, problems, explanations
Desmos activities to communicate and collaborate on math tasks
Unit #4: Investigate Bivariate Data
Targeted Instructional Planning to Address Central Unit Standards: Central Unit
Standard
and Student
Learning
Objective
Suggested Instructional Activities Suggested Student Output Formative
Assessments
(Portfolios, Projects,
Tasks, Evaluations,
& Rubrics)
F.IF.4
F.IF.5
F.IF.6
Illustrative Mathematics:
Influenza Epidemic
The principal purpose of this task is to probe students' ability to
correlate symbolic statements about a function using function
notation with a graph of the function, and to interpret their
answers in terms of the quantities between which the function
describes a relationship.
Warming and Cooling
This task is meant to be a straight-forward assessment task of graph reading and interpreting skills.
How is the Weather?
Notebooks will have notes
on one side of the page and
visual representations of the
material on the other
Journal entries written about
how to find the domain and
range of a quadratic
function
Open-ended responses to
questions involving the
Formative
Fluency Practice
Activities
EDCITE Lesson
Quizzes
Topic Readiness
Assessment
Mid-Topic
Assessment

36
Match each graph to the corresponding description of
the weather during the day.
Logistic Growth Model, Explicit Version
This problem introduces a logistic growth model in the concrete
setting of estimating the population of the U.S.
The Canoe Trip, Variation 1
The purpose of this task is to give students practice constructing
functions that represent a quantity of interest in a context, and
then interpreting features of the function in the light of that
context.
The High School Gym
Calculate and interpret the average rate of change of a function
(presented symbolically or as a table) over a specified interval.
Estimate the rate of change from a graph.
Temperature Change
This task gives an easy context to introduce the idea of average
rate of change.
Average Cost
John makes DVDs of his friend’s shows. He has realized that,
because of his fixed costs, his average cost per DVD depends
on the number of DVDs he produces. The cost of producing x
DVDs is given by a function.
different parts of a quadratic
and their purposes
Student-led discussion of
key points of quadratic
graphs
Technology-based
presentation about the
different parts of a
quadratic. Students will be
split into groups and each
group will be given a
different part of a quadratic
graph. Students will report
out the importance of their
part.
Collected Homework and
Notebook Checks
Mid-Topic
Performance
Task
(ExamView®)
Lesson and
Checkpoint
Quizzes
PARCC Review
Questions
Summative
Modified
PARCC Review
Questions
STEM Project
Topic
Assessment
Topic
Performance
Task
Unit 1-4
Cumulative /
Benchmark
Assessment
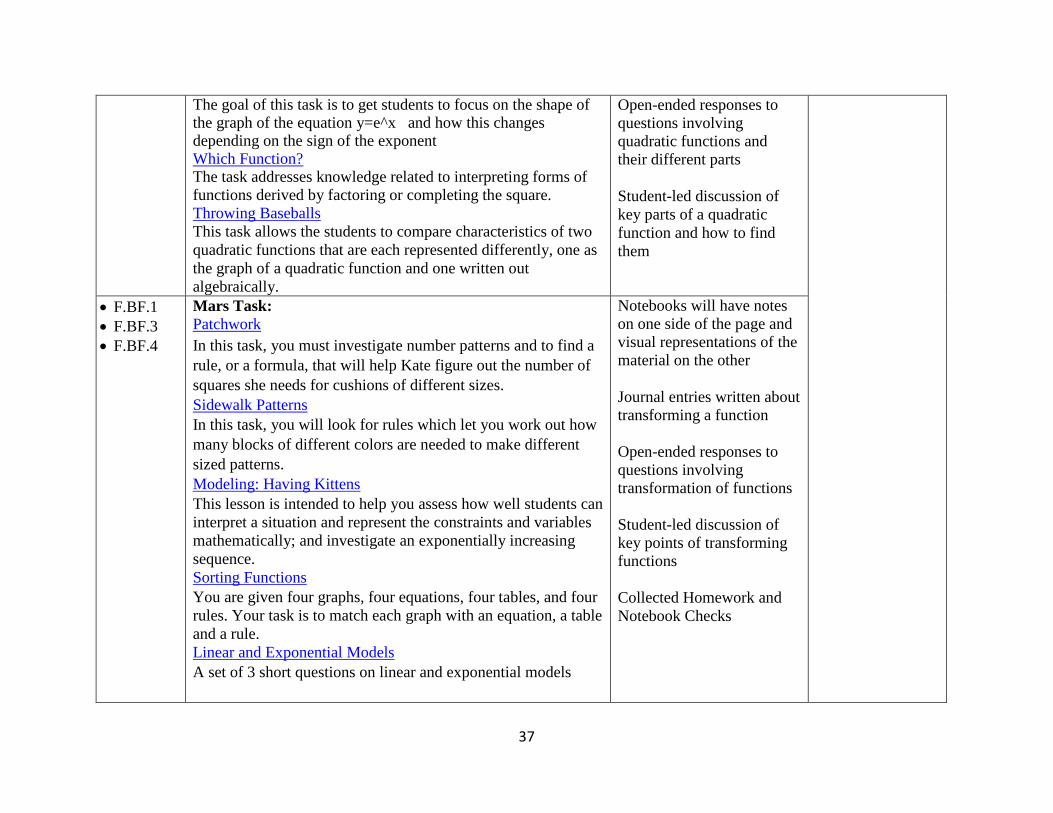
F.IF.7
F.IF.8
F.IF.9
MARS Tasks:
Functions and Everyday Situations
This lesson is intended to help you assess how well students are
able to articulate verbally the relationships between variables
arising in everyday contexts.
Illustrative Mathematics:
Identifying Graphs of Functions
Notebooks will have notes
on one side of the page and
visual representations of the
material on the other
Journal entries written about
how to find the vertex of a
quadratic when given in
standard form
37
The goal of this task is to get students to focus on the shape of the graph of the equation y=e^x and how this changes depending on the sign of the exponent Which Function? The task addresses knowledge related to interpreting forms of
functions derived by factoring or completing the square.
Throwing Baseballs
This task allows the students to compare characteristics of two
quadratic functions that are each represented differently, one as
the graph of a quadratic function and one written out
algebraically.
Open-ended responses to
questions involving
quadratic functions and
their different parts
Student-led discussion of
key parts of a quadratic
function and how to find
them
F.BF.1
F.BF.3
F.BF.4
Mars Task:
Patchwork
In this task, you must investigate number patterns and to find a
rule, or a formula, that will help Kate figure out the number of
squares she needs for cushions of different sizes.
Sidewalk Patterns
In this task, you will look for rules which let you work out how
many blocks of different colors are needed to make different
sized patterns.
Modeling: Having Kittens
This lesson is intended to help you assess how well students can
interpret a situation and represent the constraints and variables
mathematically; and investigate an exponentially increasing
sequence.
Sorting Functions
You are given four graphs, four equations, four tables, and four
rules. Your task is to match each graph with an equation, a table
and a rule.
Linear and Exponential Models
A set of 3 short questions on linear and exponential models
Notebooks will have notes
on one side of the page and
visual representations of the
material on the other
Journal entries written about
transforming a function
Open-ended responses to
questions involving
transformation of functions
Student-led discussion of
key points of transforming
functions
Collected Homework and
Notebook Checks

38
Mathematics Vision Project:
Arithmetic and Geometric Sequence
The purpose of this task is to develop representations for
arithmetic sequences that
students can draw upon throughout the unit.
Linear and Exponential Functions
This task builds upon students’ experiences with arithmetic and
geometric sequences to extend to the broader class of linear and
exponential functions with continuous domains.