
Rely on us. - N-biz
12
Rely on us. APLUS The system for heavy-current analysis Monitoring System state Remote control Communication Data display Power quality ty Operating resources ing g ing g Energy management
Transcript of Rely on us. - N-biz
Rely on us.
APLUS
The system for
heavy-current analysis
Monitoring
Sys
tem
sta
teRemote contro
l
Communication
Data displayPower qualityty
Operatingresources
ingg
ing
gggEnergy
management

2
The APLUS is a powerful platform for measuring, monitoring and
analyzing power systems. The focus is on highest Swiss quality and
maximum customer benefi t.
This universal measurement device can be easily integrated into the
process environment on site. It provides a wide functionality, which
may be further extended by means of optional components.
The connection of the process environment may be performed by
means of the communication interface, via digital I/Os or via analog
outputs.
Application
The APLUS is designed for applications in power distribution, in
strongly distorted industrial environments and in building automation.
Nominal voltages up to 690 V can directly be connected.
The APLUS is the ideal device for demanding measurement tasks
where fast, accurate and insensitive analysis of power systems or
loads is required. In addition it can also replace fault or limit monito-
ring devices, small control systems and summation stations of energy
management systems.
One device – A variety of functions
System state acquisition
• High updating rate
• Precise and uninterrupted
• For any power systems
Remote control and maintenance
• Remote I/O
• Remote data acquisition and parameterization
• Changeover local/remote operation
Open communication
• Free defi nable process image
• Modbus/RTU via RS485
• Modbus/TCP via Ethernet
• Profi bus DP up to 12 MBaud
Data display
• Measurements and meters
• Limit states
• Plain text alarming
• Alarm acknowledge and reset
• Free confi gurable display
Long-term data storage
• Measurement progressions
• Disturbance information
• Events/alarms/system events
• Automatic meter readings
Power quality analysis
• Harmonic analysis
• Extended reactive power analysis
• Variance of short/long term load
• Power system imbalance
• Nominal condition monitoring
Monitoring operating resources
• Operating times
• Service intervals
• Durations of overload situations
• Operation feedbacks
Energy management
• Active and reactive meters
• Load profi les, load curves
• Trend analysis
• Variance of system load
• Connection of external meters
Universal process I/O
• State, pulse and synchronization inputs
• State and pulse outputs
• Relay outputs
• Analog outputs ±20 mA
Monitoring unit
• Universal analysis of limit values
• Combination of limit values
• Analysis of internal / external states

3
The APLUS can be adapted fast and easily to the measurement task
by means of the CB-Manager software. The universal measurement
system of the device may be used directly for any system, from single
phase up to 4-wire unbalanced networks, without hardware modifi ca-
tions. Independent of measurement task and outer infl uences always
the same high performance is achieved.
The measurement is performed uninterrupted in all four quadrants
and can be adapted to the system to monitor in an optimal way.
The measurement time as well as the expected system load can be
parameterized.
The device can provide more than 1100 different measured
quantities, which may be grouped as follows:
The measurement system
Measured quantities Measurement uncertainty
Voltage, current ± 0.1%
Power, imbalance ± 0.2%
Harmonics, THD, TDD ± 0.5%
Frequency ± 0.01Hz
Load factors ± 0.1°
Active energy Cl. 0.5S (EN 62 053-22)
Reactive energy Cl. 2 (EN 62 053-23)
The supplied CB-Manager software provides the following functions
to the user:
• Complete parameterization of the APLUS (also offl ine)
• Acquisition and recording of measured quantities
• Archiving of confi guration and measurement fi les
• Setting or resetting of meter contents
• Selective reset of extreme values
• Setting of interface parameters
• Simulation of logic module or outputs functions
• Comprehensive help system
A security system can be activated to restrict the access to device
data. This way e.g. changing a limit value via display can be locked,
but a setting via confi guration could still be possible.
Parameterization, service and measurement acquisition
Measurement group Refreshing interval Application
Instantaneous values Confi gurable measurement interval
(2…1024 cycles)
• Monitoring present system state
• Unbalance monitoring
• Earth fault monitoring
Harmonic analysis Approx. 2 times per second, depending on
system frequency
• Rating the thermal load of resources
• Analysis of system feedback and load structure
Extended reactive power analysis • Reactive power compensation
Voltage/current imbalance • Protection of operating resources
• Earth fault monitoring
Energy meters Same as measurement interval • Billing purposes
• Energy effi ciency monitoring
• Summation of external meter pulses
Power mean-values Confi gurable, 1s…60 min • Load profi ling for energy management
User-defi ned mean value quantities • Short-term fl uctuations
Overview of APLUS measurement uncertainty
4
The APLUS provides all functions needed to collect fast and effi cient
load data for an energy management system. A system composed of
APLUS devices promises maximum accuracy and highest performance
for each individual measurement point when used in power distribu-
tions. It can satisfy the following basic requirements:
• Recording load curves (Energy consumption over time)
• Acquisition of energy consumption summaries
• Automatic meter readings (calendric)
• Peak-load monitoring
• Trend analysis of present demand
• Load switch-off to prevent penalties
An energy optimization system can be composed of one device only
and connecting already installed meters to it. The APLUS monitors then
for example the main incoming supply and serves as well as a data
summator station, which not only accumulates the contents of up to
7 meters of any kind of energy, but from the corresponding pulse rate
can also derive their course in time – the load curve.
The collected energy data can also be recorded for years by means of
the optional data logger. For the tabular or graphical analysis of these
data the CB-Analyzer software is provided, which is in the scope of
supply. This software collects data via Ethernet and stores them in a
data base.
The sum of all these measures allows to achieve the following topics:
• Optimization of internal operating procedures
• Reduction of the total energy consumption
• Peak-load reduction
The cost savings achieved this way not only increases the profi tability
of the own company but also its competitiveness.
Energy management
The supplied CB-Analyzer software allows to read and analyze the
data of the APLUS data logger. It provides the following functions to
the user:
• Reading logger data (load curves, meter readings, min/max-cour-
ses, event lists, disturbance recordings)
• Data storage in a data base (Access, SQLClient)
• Graphical analysis of collected data
• Concurrent analysis of multiple devices
• Report generation in form of lists or graphics
• Selectable time range in report preparation
• Export of report data as Excel, PDF or WORD fi le
The CB-Analyzer software provides a comprehensive help
functionality, which describes in detail the operation of the software.
Data analysis using the CB-Analyzer
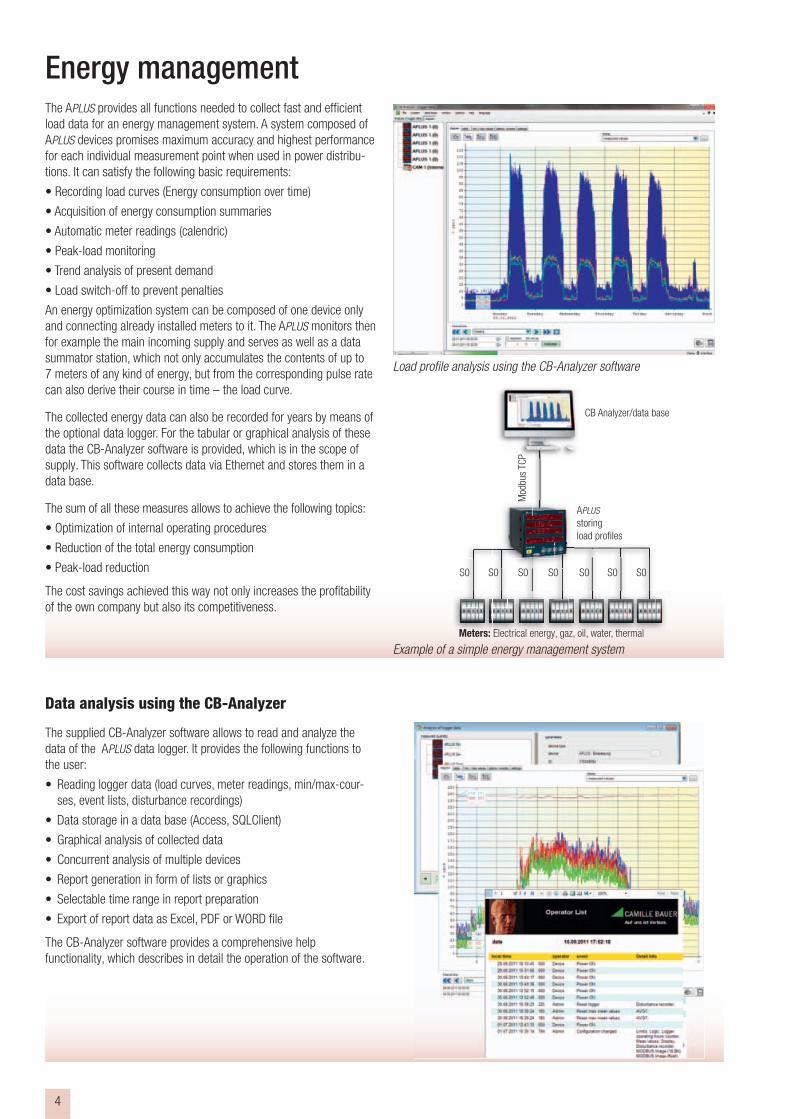
Load profi le analysis using the CB-Analyzer software
Example of a simple energy management system
CB Analyzer/data base
Meters: Electrical energy, gaz, oil, water, thermal
S0 S0 S0 S0 S0 S0 S0
Mod
bus
TCP
APLUS
storing
load profi les
5
In the world of standards the quality of a grid is defi ned using statis-
tical deviations from a desired standard behaviour. But what’s really
needed when monitoring power quality is a statement if the used
operating resources will work undisturbed under the real existing
conditions.
The APLUS therefore does not work with statistics, but examines the
real environment, to allow performing a corresponding immunity
analysis. Almost all important aspects of power quality can be
investigated and interpreted.
Variation of the system load
The absolute minimum/maximum values with timestamp are available
for instantaneous and mean values. They
indicate the bandwith of the variations
of the system parameters.
Using the extreme value data logger
also short-term variations within an
interval can be acquired. This way e.g.
a load profi le can be recorded, where
along with the mean power also the
highest and lowest short-term demand
will be shown.
Additional load by harmonics
Harmonics originate from non-linear loads in the grid - a homemade
pollution most of the time. They may induce an additional thermal
stress to operational resources or cables and disturb the operation of
sensitive loads.
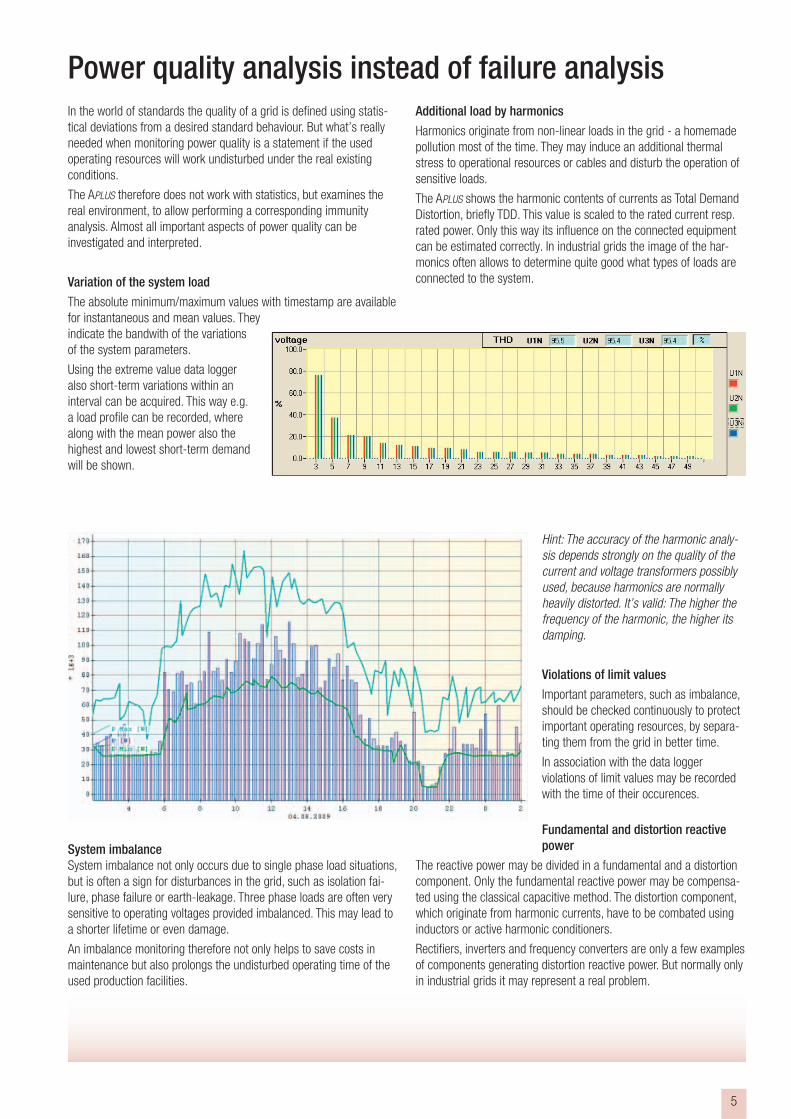
The APLUS shows the harmonic contents of currents as Total Demand
Distortion, briefl y TDD. This value is scaled to the rated current resp.
rated power. Only this way its infl uence on the connected equipment
can be estimated correctly. In industrial grids the image of the har-
monics often allows to determine quite good what types of loads are
connected to the system.
Hint: The accuracy of the harmonic analy-
sis depends strongly on the quality of the
current and voltage transformers possibly
used, because harmonics are normally
heavily distorted. It’s valid: The higher the
frequency of the harmonic, the higher its
damping.
Violations of limit values
Important parameters, such as imbalance,
should be checked continuously to protect
important operating resources, by separa-
ting them from the grid in better time.
In association with the data logger
violations of limit values may be recorded
with the time of their occurences.
Fundamental and distortion reactive
power
The reactive power may be divided in a fundamental and a distortion
component. Only the fundamental reactive power may be compensa-
ted using the classical capacitive method. The distortion component,
which originate from harmonic currents, have to be combated using
inductors or active harmonic conditioners.
Rectifi ers, inverters and frequency converters are only a few examples
of components generating distortion reactive power. But normally only
in industrial grids it may represent a real problem.
Power quality analysis instead of failure analysis
System imbalance
System imbalance not only occurs due to single phase load situations,
but is often a sign for disturbances in the grid, such as isolation fai-
lure, phase failure or earth-leakage. Three phase loads are often very
sensitive to operating voltages provided imbalanced. This may lead to
a shorter lifetime or even damage.
An imbalance monitoring therefore not only helps to save costs in
maintenance but also prolongs the undisturbed operating time of the
used production facilities.
6
&
&=1
=1
=1
=1
=1
=1
Monitoring service intervals
Many operating resources must be maintained regularly. Their service
intervals often depend also on the prevailing operating conditions. For
monitoring these intervals three operating hour counters are provided,
which by means of limit values, digital feedback signals or a suitable
combination of the same may be used to determine the
• loads operating time under normal conditions
• loads operating time under overload conditions
Another operating hour counter is used to measure the time the
APLUS itself has been switched on.
Protection of operating resources
To prevent malfunction or failure of equipment, such as generators,
motors, heaters, cooling or computer systems, the permissible ope-
rating conditions are often tightly restricted. In order to protect such
resources effectively you therefore have to examine if certain system
quantities remain within the allowed range. For that quite often a
combination of multiple limit values is necessary.
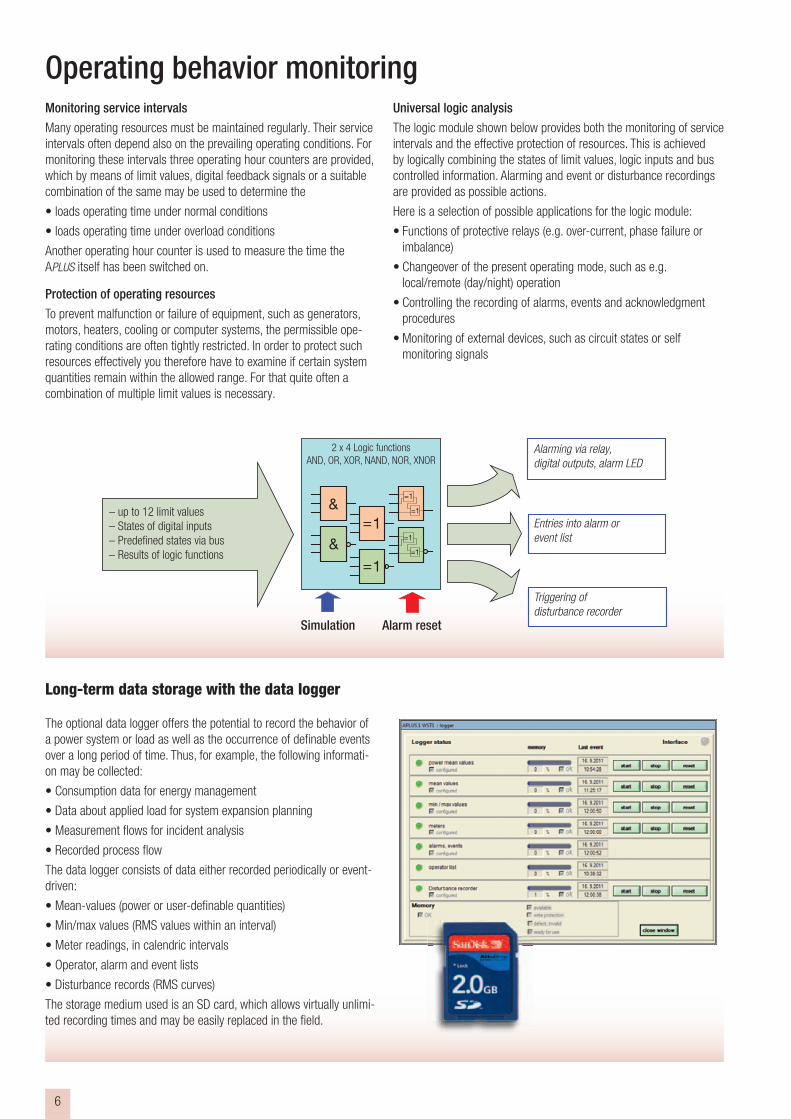
Universal logic analysis
The logic module shown below provides both the monitoring of service
intervals and the effective protection of resources. This is achieved
by logically combining the states of limit values, logic inputs and bus
controlled information. Alarming and event or disturbance recordings
are provided as possible actions.
Here is a selection of possible applications for the logic module:
• Functions of protective relays (e.g. over-current, phase failure or
imbalance)
• Changeover of the present operating mode, such as e.g.
local/remote (day/night) operation
• Controlling the recording of alarms, events and acknowledgment
procedures
• Monitoring of external devices, such as circuit states or self
monitoring signals
Operating behavior monitoring
The optional data logger offers the potential to record the behavior of
a power system or load as well as the occurrence of defi nable events
over a long period of time. Thus, for example, the following informati-
on may be collected:
• Consumption data for energy management
• Data about applied load for system expansion planning
• Measurement fl ows for incident analysis
• Recorded process fl ow
The data logger consists of data either recorded periodically or event-
driven:
• Mean-values (power or user-defi nable quantities)
• Min/max values (RMS values within an interval)
• Meter readings, in calendric intervals
• Operator, alarm and event lists
• Disturbance records (RMS curves)
The storage medium used is an SD card, which allows virtually unlimi-
ted recording times and may be easily replaced in the fi eld.
Long-term data storage with the data logger
Alarming via relay,
digital outputs, alarm LED
Entries into alarm or
event list
Triggering of
disturbance recorder
– up to 12 limit values
– States of digital inputs
– Predefi ned states via bus
– Results of logic functions
Simulation Alarm reset
2 x 4 Logic functions
AND, OR, XOR, NAND, NOR, XNOR

7
THE DISPLAY The optional display of the APLUS offers everything what is demanded
of an indicating device:
• Excellent readability, even from a distance and almost every angle
• Clear and explicit display of measured data
• Free composition of measurement displays
• Free allocation of alarms to status LED’s
• Free defi nable plaintext display for alarming
• Preference display and roll mode
Operating the display is performed using multi-function keys. Their
functionality depends on the active operating mode and the time a key
is pressed.
MEASUREMENT DISPLAY-MODES
The measurement display can be optimally tailored to the needs of the
user. Depending on the information needs you may select one from
the following four display modes:
FULL: All measurement displays in a matrix representation, selected
via arrow keys. Fourth line used for meter display.
REDUCED: Same as FULL mode but with facility to hide individual
measurement displays.
USER: Up to 20 free composable measurement displays, selected with
and . The fourth line may be used to display meter contents
or a power, voltage or current quantity.
LOOP: Measurement displays of the USER mode will be displayed
successively for a defi nable time.
PROGRAMMING MENU
Via the programming menu of the device the following device parame-
ters may be changed
• Type of system
• Voltage and current transformer ratios
• Parameters of the interfaces Modbus, Profi bus or Ethernet
• Limit value thresholds
• Time and date
• Parameters of the display
A full parameterization of all functions of the device can be performed
using the CB-Manager software only.
During operation the following settings may be performed:
• Changing the measurement display mode
• Selectively reset of min/max values
• Selectively reset of meter values
SECURITY SYSTEM
All programming functions may be locked selectively by means of the
PC software. They then are not at the user’s disposal when operating
the display unit.
Also for the access via programming interface the alteration of device
data may be granted or locked per group.
Meter reading mode
To read the contents of up to 38
meters you have to press the info
button for a long time (>2s) and
then you may scroll through the
values using the arrow keys. When
changing the displayed meter con-
tent the abbreviation of the meter
newly to display will be shown fi rst.
Measurement display mode
In accordance with the selected
measurement display mode the
measured values are displayed
on four lines. When changing the
measurement image by means of
the arrow keys, for a short time
the abbreviation of the measu-
rements is shown first before
the new values will be displayed.
Alarm display mode
Occurring alarms are displayed via
the yellow LEDs. After pressing the
info button on line 4 the user-defi ned
text of the fi rst active alarm is dis-
played. Active alarms can be ack-
nowledged and induced actions (e.g.
the switching of a relay) may be reset.
Meter reading and alarm display mode will be fi nished using the key ESC, or automatically after 30s.
OPERATING DISPLAY MODES
8
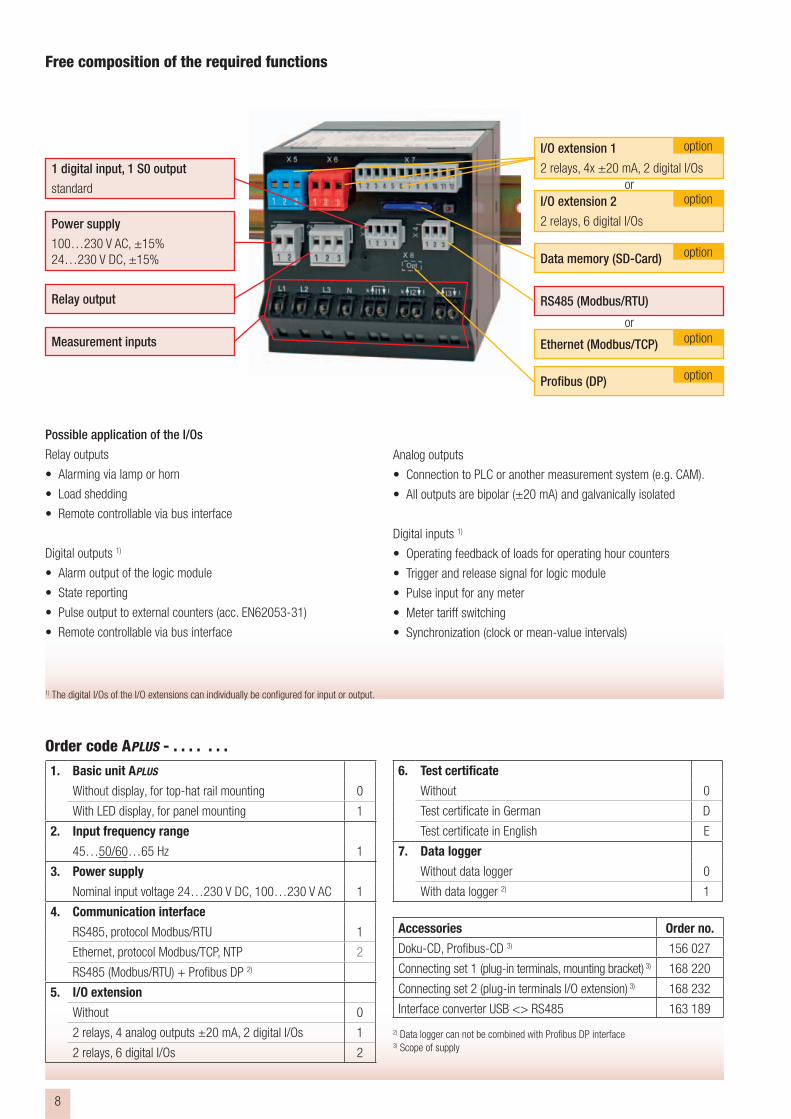
Possible application of the I/Os
Relay outputs
• Alarming via lamp or horn
• Load shedding
• Remote controllable via bus interface
Digital outputs 1)
• Alarm output of the logic module
• State reporting
• Pulse output to external counters (acc. EN62053-31)
• Remote controllable via bus interface
Analog outputs
• Connection to PLC or another measurement system (e.g. CAM).
• All outputs are bipolar (±20 mA) and galvanically isolated
Digital inputs 1)
• Operating feedback of loads for operating hour counters
• Trigger and release signal for logic module
• Pulse input for any meter
• Meter tariff switching
• Synchronization (clock or mean-value intervals)
Free composition of the required functions
1) The digital I/Os of the I/O extensions can individually be confi gured for input or output.
Order code APLUS - . . . . . . .
1. Basic unit APLUS
Without display, for top-hat rail mounting 0
With LED display, for panel mounting 1
2. Input frequency range
45…50/60…65 Hz 1
3. Power supply
Nominal input voltage 24…230 V DC, 100…230 V AC 1
4. Communication interface
RS485, protocol Modbus/RTU 1
Ethernet, protocol Modbus/TCP, NTP 2
RS485 (Modbus/RTU) + Profi bus DP 2)
5. I/O extension
Without 0
2 relays, 4 analog outputs ±20 mA, 2 digital I/Os 1
2 relays, 6 digital I/Os 2
6. Test certifi cate
Without 0
Test certifi cate in German D
Test certifi cate in English E
7. Data logger
Without data logger 0
With data logger 2) 1
Accessories Order no.
Doku-CD, Profi bus-CD 3) 156 027
Connecting set 1 (plug-in terminals, mounting bracket) 3) 168 220
Connecting set 2 (plug-in terminals I/O extension) 3) 168 232
Interface converter USB <> RS485 163 189
2) Data logger can not be combined with Profi bus DP interface3) Scope of supply
I/O extension 1
2 relays, 4x ±20 mA, 2 digital I/Os
I/O extension 2
2 relays, 6 digital I/Os
Data memory (SD-Card)
RS485 (Modbus/RTU)Relay output
Measurement inputs
1 digital input, 1 S0 output
standard
Power supply
100…230 V AC, ±15%
24…230 V DC, ±15%
Ethernet (Modbus/TCP)
Profi bus (DP)
or
or
option
option
option
option
option
9
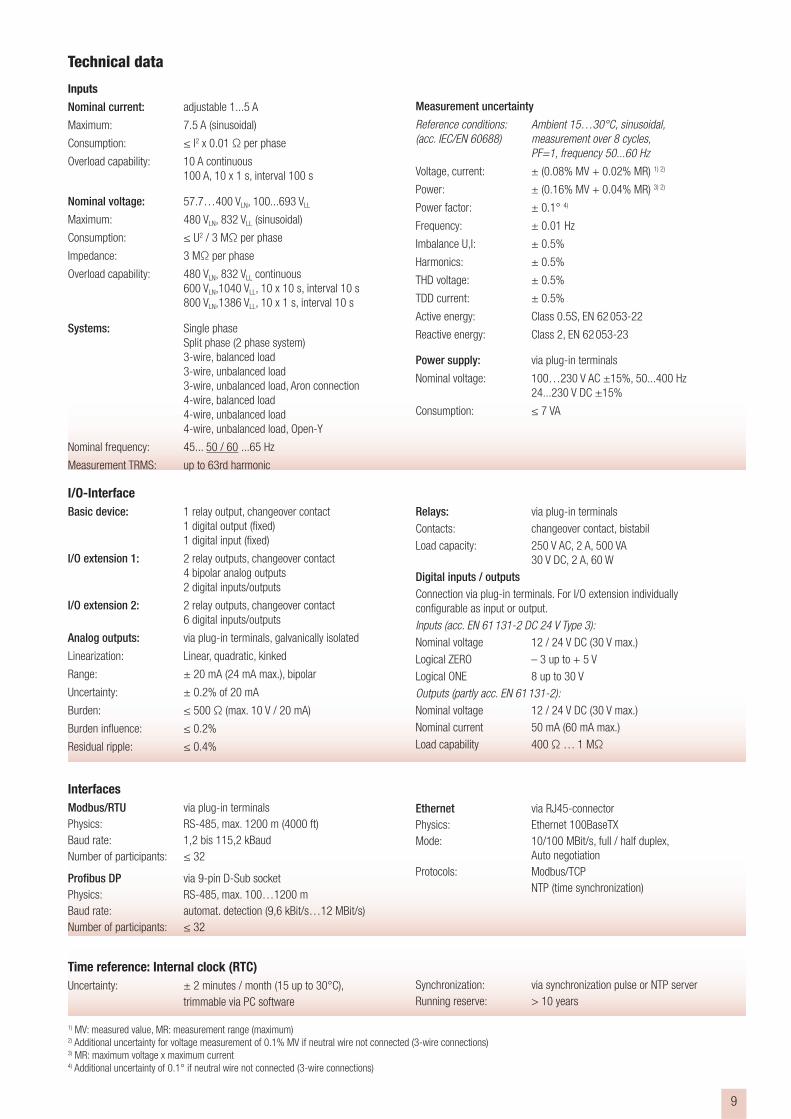
Technical data
Inputs
Nominal current: adjustable 1...5 A
Maximum: 7.5 A (sinusoidal)
Consumption: ≤ I2 x 0.01 Ω per phase
Overload capability: 10 A continuous
100 A, 10 x 1 s, interval 100 s
Nominal voltage: 57.7…400 VLN, 100...693 VLL
Maximum: 480 VLN, 832 VLL (sinusoidal)
Consumption: ≤ U2 / 3 MΩ per phase
Impedance: 3 MΩ per phase
Overload capability: 480 VLN, 832 VLL continuous
600 VLN,1040 VLL, 10 x 10 s, interval 10 s
800 VLN,1386 VLL, 10 x 1 s, interval 10 s
Systems: Single phase
Split phase (2 phase system)
3-wire, balanced load
3-wire, unbalanced load
3-wire, unbalanced load, Aron connection
4-wire, balanced load
4-wire, unbalanced load
4-wire, unbalanced load, Open-Y
Nominal frequency: 45... 50 / 60 ...65 Hz
Measurement TRMS: up to 63rd harmonic
Measurement uncertainty
Reference conditions: Ambient 15…30°C, sinusoidal,
(acc. IEC/EN 60688) measurement over 8 cycles,
PF=1, frequency 50...60 Hz
Voltage, current: ± (0.08% MV + 0.02% MR) 1) 2)
Power: ± (0.16% MV + 0.04% MR) 3) 2)
Power factor: ± 0.1° 4)
Frequency: ± 0.01 Hz
Imbalance U,I: ± 0.5%
Harmonics: ± 0.5%
THD voltage: ± 0.5%
TDD current: ± 0.5%
Active energy: Class 0.5S, EN 62 053-22
Reactive energy: Class 2, EN 62 053-23
Power supply: via plug-in terminals
Nominal voltage: 100…230 V AC ±15%, 50...400 Hz
24...230 V DC ±15%
Consumption: ≤ 7 VA
I/O-Interface
Basic device: 1 relay output, changeover contact
1 digital output (fi xed)
1 digital input (fi xed)
I/O extension 1: 2 relay outputs, changeover contact
4 bipolar analog outputs
2 digital inputs/outputs
I/O extension 2: 2 relay outputs, changeover contact
6 digital inputs/outputs
Analog outputs: via plug-in terminals, galvanically isolated
Linearization: Linear, quadratic, kinked
Range: ± 20 mA (24 mA max.), bipolar
Uncertainty: ± 0.2% of 20 mA
Burden: ≤ 500 Ω (max. 10 V / 20 mA)
Burden infl uence: ≤ 0.2%
Residual ripple: ≤ 0.4%
Relays: via plug-in terminals
Contacts: changeover contact, bistabil
Load capacity: 250 V AC, 2 A, 500 VA
30 V DC, 2 A, 60 W
Digital inputs / outputs
Connection via plug-in terminals. For I/O extension individually
confi gurable as input or output.
Inputs (acc. EN 61 131-2 DC 24 V Type 3):
Nominal voltage 12 / 24 V DC (30 V max.)
Logical ZERO – 3 up to + 5 V
Logical ONE 8 up to 30 V
Outputs (partly acc. EN 61 131-2):
Nominal voltage 12 / 24 V DC (30 V max.)
Nominal current 50 mA (60 mA max.)
Load capability 400 Ω … 1 MΩ
Interfaces
Modbus/RTU via plug-in terminals
Physics: RS-485, max. 1200 m (4000 ft)
Baud rate: 1,2 bis 115,2 kBaud
Number of participants: ≤ 32
Profi bus DP via 9-pin D-Sub socket
Physics: RS-485, max. 100…1200 m
Baud rate: automat. detection (9,6 kBit/s…12 MBit/s)
Number of participants: ≤ 32
Time reference: Internal clock (RTC)
Uncertainty: ± 2 minutes / month (15 up to 30°C),
trimmable via PC software
1) MV: measured value, MR: measurement range (maximum)2) Additional uncertainty for voltage measurement of 0.1% MV if neutral wire not connected (3-wire connections)3) MR: maximum voltage x maximum current4) Additional uncertainty of 0.1° if neutral wire not connected (3-wire connections)
Ethernet via RJ45-connector
Physics: Ethernet 100BaseTX
Mode: 10/100 MBit/s, full / half duplex,
Auto negotiation
Protocols: Modbus/TCP
NTP (time synchronization)
Synchronization: via synchronization pulse or NTP server
Running reserve: > 10 years

10
Disposable measured quantities
Basic measured quantities
These measured quantities are determined using the confi gured measurement time (2...1024 cycles, in steps of 2 cycles). The display refresh-
ment takes place with the refresh rate set.
Power quality analysis
These values are calculated about twice a second, depending on the system frequency.
Meters
Measured quantity
pres
ent
max
min
Voltage per phase, system • • •
Mean value of voltages Umean •
Zero displacement voltage UNE • •
Maximum ΔU <> Umean 1) • • •
Phase angle of voltages •
Current per phase, system • •
Mean value of phase currents •
Neutral current IN • •
Maximum ΔI <> Imean 2) • •
Measured quantity
Harmonic analysis pres
ent
max
min
THD voltage per phase • •
TDD current per phase • •
Harmonics voltage 2nd – 50th per phase • •
Harmonics current 2nd – 50th per phase • •
Distortion reactive power per phase, system • •
Fundamental reactive power per phase, system • •
cosϕ fundamental per phase, system • •
Measured quantity
pres
ent
HT LT
Active energy incoming: per phase, system • • •
Active energy outgoing system • • •
Reactive energy incoming: per phase, system • • •
Measured quantity
pres
ent
max
min
Bimetal current per phase, system • •
Active power per phase, system • •
Reactive power per phase, system • •
Apparent power per phase, system • •
Frequency • • •
Power factor per phase, system • •
Power factor per quadrant •
Reactive power factor per phase, system •
LF factor per phase, system •
Measured quantity
Imbalance currents / voltages pres
ent
max
min
Symmetrical components [V] •
Symmetrical components [A] •
Imbalance voltage: negative/positive sequence • •
Imbalance voltage: zero/positive sequence4) • •
Imbalance current: negative/positive sequence •
Imbalance current: zero/positive sequence4) • •
Measured quantity
pres
ent
HT LT
Reactive energy outgoing system • • •
Reactive energy inductive, capacitive system • • •
I/O meters 1…7 3) • • •
Mean-values
As a standard the mean-values of the system power quantities are determined over the same programmable interval time t1. The interval time
t2 of the selectable mean-value quantities may be different but equal for all 12 quantities.
Measured quantity
pres
ent
tren
d
max
min
hist
ory
Active power incoming 1 s…60 min • • • • 5
Active power outgoing 1 s…60 min • • • • 5
Reactive power incoming 1 s…60 min • • • • 5
Reactive power outgoing 1 s…60 min • • • • 5
Measured quantity
pres
ent
tren
d
max
min
hist
ory
Reactive power induct. 1 s…60 min • • • • 5
Reactive power capac. 1 s…60 min • • • • 5
Apparent power 1 s…60 min • • • • 5
Mean-value quant. 1-12 1 s…60 min4) • • • • 1
1) Maximum deviation from the mean-value of the 3 phase voltages
2) Maximum deviation from the mean-value of the 3 phase currents
3) Possible meters of the digital pulse inputs – any measurand and unit
4) Available via communication interface only, no indication on display
11
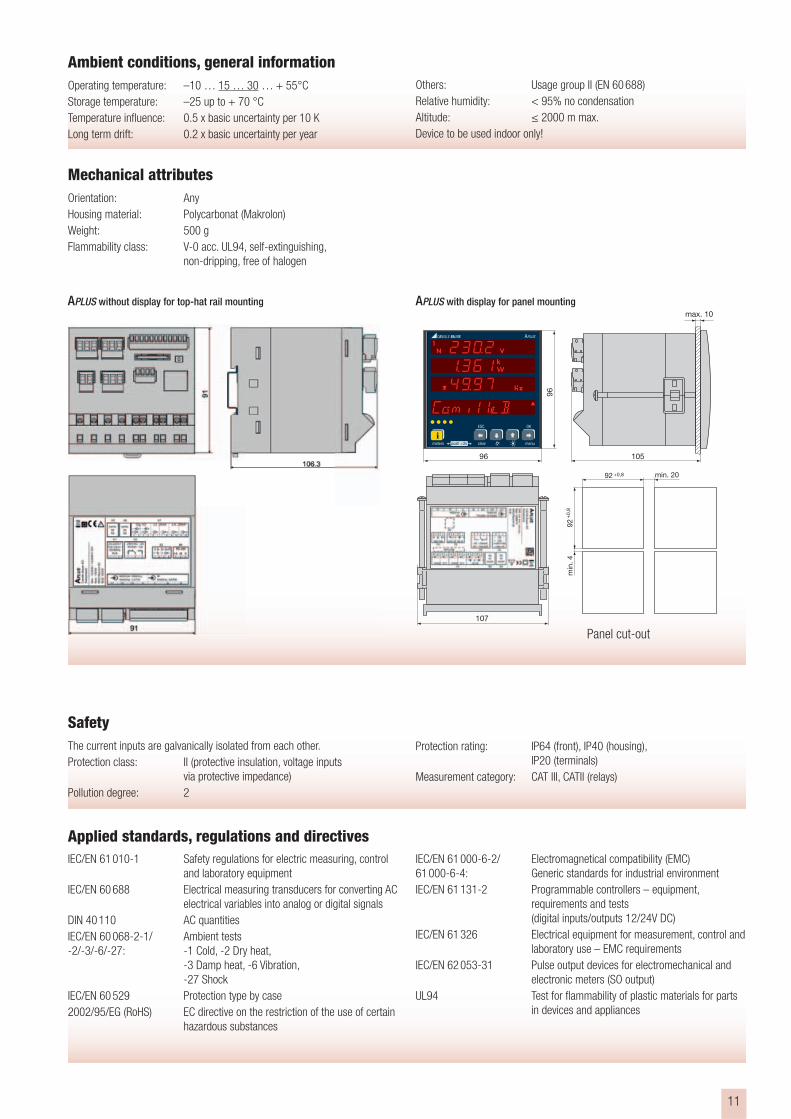
92 min. 20+0,8
92+
0,8
min
. 4
107
10596
96
max. 10
APLUS
ESC
iOK
clearpush >2s menumeters
Mechanical attributes Orientation: Any
Housing material: Polycarbonat (Makrolon)
Weight: 500 g
Flammability class: V-0 acc. UL94, self-extinguishing,
non-dripping, free of halogen
Panel cut-out
APLUS without display for top-hat rail mounting APLUS with display for panel mounting
Ambient conditions, general informationOperating temperature: –10 … 15 … 30 … + 55°C
Storage temperature: –25 up to + 70 °C
Temperature infl uence: 0.5 x basic uncertainty per 10 K
Long term drift: 0.2 x basic uncertainty per year
Others: Usage group II (EN 60 688)
Relative humidity: < 95% no condensation
Altitude: ≤ 2000 m max.
Device to be used indoor only!
SafetyThe current inputs are galvanically isolated from each other.
Protection class: II (protective insulation, voltage inputs
via protective impedance)
Pollution degree: 2
IEC/EN 61 010-1 Safety regulations for electric measuring, control
and laboratory equipment
IEC/EN 60 688 Electrical measuring transducers for converting AC
electrical variables into analog or digital signals
DIN 40 110 AC quantities
IEC/EN 60 068-2-1/ Ambient tests
-2/-3/-6/-27: -1 Cold, -2 Dry heat,
-3 Damp heat, -6 Vibration,
-27 Shock
IEC/EN 60 529 Protection type by case
2002/95/EG (RoHS) EC directive on the restriction of the use of certain
hazardous substances
Protection rating: IP64 (front), IP40 (housing),
IP20 (terminals)
Measurement category: CAT III, CATII (relays)
IEC/EN 61 000-6-2/ Electromagnetical compatibility (EMC)
61 000-6-4: Generic standards for industrial environment
IEC/EN 61 131-2 Programmable controllers – equipment,
requirements and tests
(digital inputs/outputs 12/24V DC)
IEC/EN 61 326 Electrical equipment for measurement, control and
laboratory use – EMC requirements
IEC/EN 62 053-31 Pulse output devices for electromechanical and
electronic meters (SO output)
UL94 Test for fl ammability of plastic materials for parts
in devices and appliances
Applied standards, regulations and directives
L1
L2
L3
N
Rely on us.
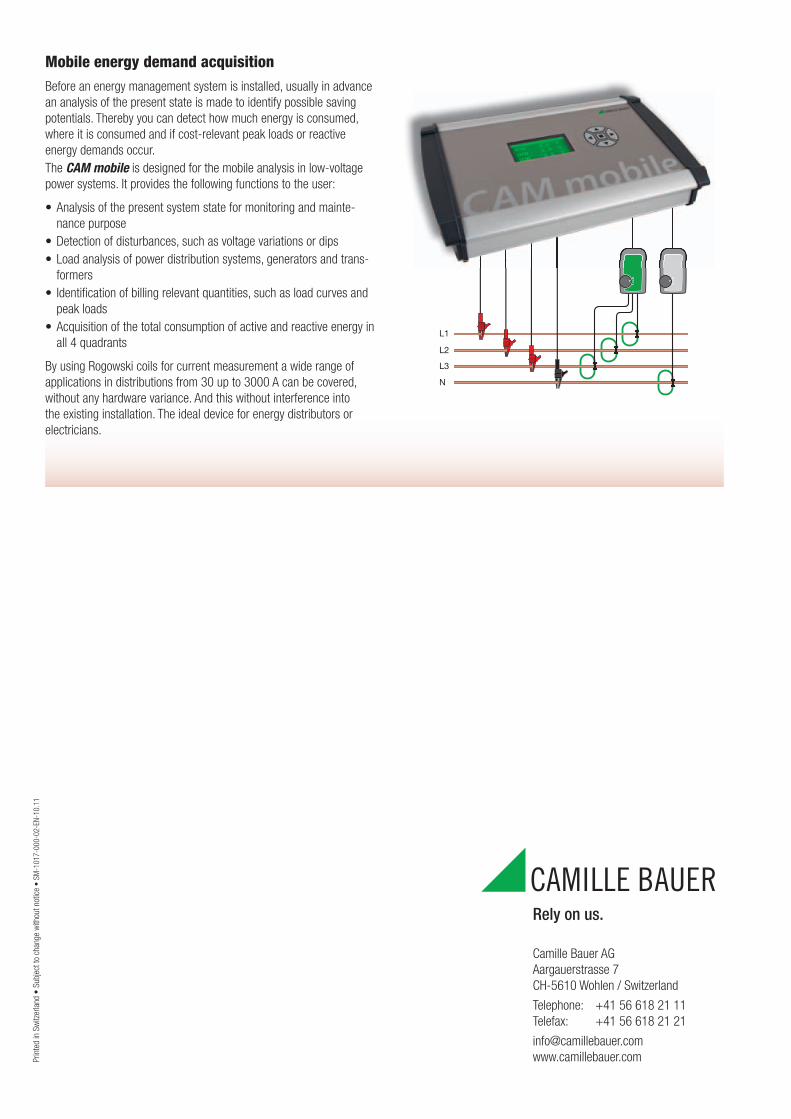
Mobile energy demand acquisitionBefore an energy management system is installed, usually in advance
an analysis of the present state is made to identify possible saving
potentials. Thereby you can detect how much energy is consumed,
where it is consumed and if cost-relevant peak loads or reactive
energy demands occur.
The CAM mobile is designed for the mobile analysis in low-voltage
power systems. It provides the following functions to the user:
• Analysis of the present system state for monitoring and mainte-
nance purpose
• Detection of disturbances, such as voltage variations or dips
• Load analysis of power distribution systems, generators and trans-
formers
• Identifi cation of billing relevant quantities, such as load curves and
peak loads
• Acquisition of the total consumption of active and reactive energy in
all 4 quadrants
By using Rogowski coils for current measurement a wide range of
applications in distributions from 30 up to 3000 A can be covered,
without any hardware variance. And this without interference into
the existing installation. The ideal device for energy distributors or
electricians.
Camille Bauer AG
Aargauerstrasse 7
CH-5610 Wohlen / Switzerland
Telephone: +41 56 618 21 11
Telefax: +41 56 618 21 21
www.camillebauer.comPrin
ted
in S
witz
erla
nd •
Sub
ject
to
chan
ge w
ithou
t no
tice
• S
M-1
01
7-0
00
-02
-EN
-10
.11