reliv international - AnnualReports.com · part of the Reliv compensation plan. This letter will go...
78
reliv international 2013 ANNUAL REPORT
Transcript of reliv international - AnnualReports.com · part of the Reliv compensation plan. This letter will go...

reliv international2013 A N N UA L R E P O R T
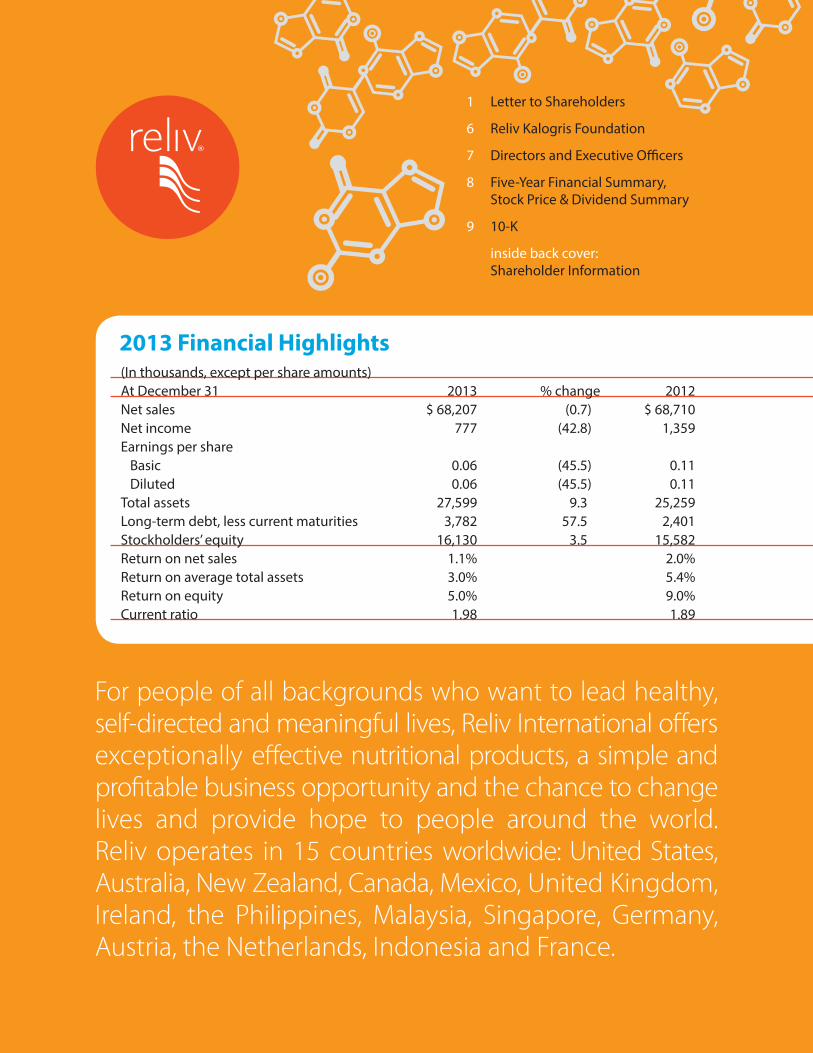
2013 Financial Highlights(In thousands, except per share amounts)At December 31 2013 % change 2012Net sales $ 68,207 (0.7) $ 68,710 Net income 777 (42.8) 1,359 Earnings per share Basic 0.06 (45.5) 0.11 Diluted 0.06 (45.5) 0.11Total assets 27,599 9.3 25,259Long-term debt, less current maturities 3,782 57.5 2,401 Stockholders’ equity 16,130 3.5 15,582Return on net sales 1.1% 2.0%Return on average total assets 3.0% 5.4%Return on equity 5.0% 9.0%Current ratio 1.98 1.89
1 Letter to Shareholders
6 Reliv Kalogris Foundation
7 Directors and Executive Officers
8 Five-Year Financial Summary, Stock Price & Dividend Summary
9 10-K
inside back cover: Shareholder Information
For people of all backgrounds who want to lead healthy, self-directed and meaningful lives, Reliv International offers exceptionally effective nutritional products, a simple and profitable business opportunity and the chance to change lives and provide hope to people around the world. Reliv operates in 15 countries worldwide: United States, Australia, New Zealand, Canada, Mexico, United Kingdom, Ireland, the Philippines, Malaysia, Singapore, Germany, Austria, the Netherlands, Indonesia and France.

2013 was a landmark year for Reliv International. We marked our 25th anniversary in business with a year-long celebration of all that we have accomplished over the last quarter-century. More importantly, Reliv took major, unprec-edented steps toward moving the company forward for the next 25 years and beyond.
In July Reliv acquired exclusive rights to the intellectual property of Soy Labs, LLC related to the soy peptide lunasin. Lunasin is one of the first nutritional compounds identified to affect gene expression and promote optimal health at the epigenetic level. With lunasin-packed LunaRich®, Reliv now owns an ingredient in its entirety, from the extraction process to the patented epigenetic mechanisms of action within the body. We have thus positioned ourselves as “The Nutritional Epigenetics Company.”
U.S. sales increased following the lunasin acquisition — fueled by promotions that reduced distributor profit level qualifications. The new qualifications made it easier for new and existing distributors to reach higher profit levels, facilitating distributor advancement. Net sales in the United States increased 9.0% in the third quarter and 4.1% in the fourth quarter compared to the same periods in 2012. By popular demand, those profit level qualifications are now a permanent part of the Reliv compensation plan.
This letter will go into greater detail on these updates and the many exciting initiatives now underway at Reliv. First, I’ll report on our 2013 financial results.
2013 ResultsReliv reported net income of $777,000 for 2013, a decrease from net income of $1.36 million in 2012. Earnings per diluted share were $0.06 for 2013, compared with $0.11 for 2012. We recorded net sales of $68.2 million in 2013, compared with net sales of $68.7 in 2012.
Europe once again led all markets with a 22.7% increase in net sales from 2012 to 2013. This marks four straight years of sustained growth in Europe, where we opened our newest market, France, in May 2013.
U.S. net sales decreased 0.3% in 2013 compared with U.S. net sales in 2012. As noted above, the United States reported sales gains in both the third and fourth quarters of 2013, the first year-over-year quarterly gains in the United States in more than six years at Reliv. U.S. growth led to an increase in net sales worldwide in the third and fourth quarters, up 8.3% and 2.8% respectively, over the same periods in 2012. We believe that an updated compensation plan, sustained expansion in Europe and Reliv’s position as a pioneer in the field of nutritional epigenetics create a solid foundation for growth.
Our financial condition remains solid. We had $6.7 million in cash and cash equivalents as of December 31, 2013, compared to $5.8 million a year ago. We generated cash from operating activities of $2.6 million during 2013 compared with $2.5 million in 2012. Our long-term debt at the end of 2013 increased by $1.4 million to $3.8 million in conjunction with the lunasin licensing agreement with Soy Labs, LLC but remains at a very manageable level.
2013 Financial Highlights(In thousands, except per share amounts)At December 31 2013 % change 2012Net sales $ 68,207 (0.7) $ 68,710 Net income 777 (42.8) 1,359 Earnings per share Basic 0.06 (45.5) 0.11 Diluted 0.06 (45.5) 0.11Total assets 27,599 9.3 25,259Long-term debt, less current maturities 3,782 57.5 2,401 Stockholders’ equity 16,130 3.5 15,582Return on net sales 1.1% 2.0%Return on average total assets 3.0% 5.4%Return on equity 5.0% 9.0%Current ratio 1.98 1.89
1
Dear Fellow Reliv Shareholder
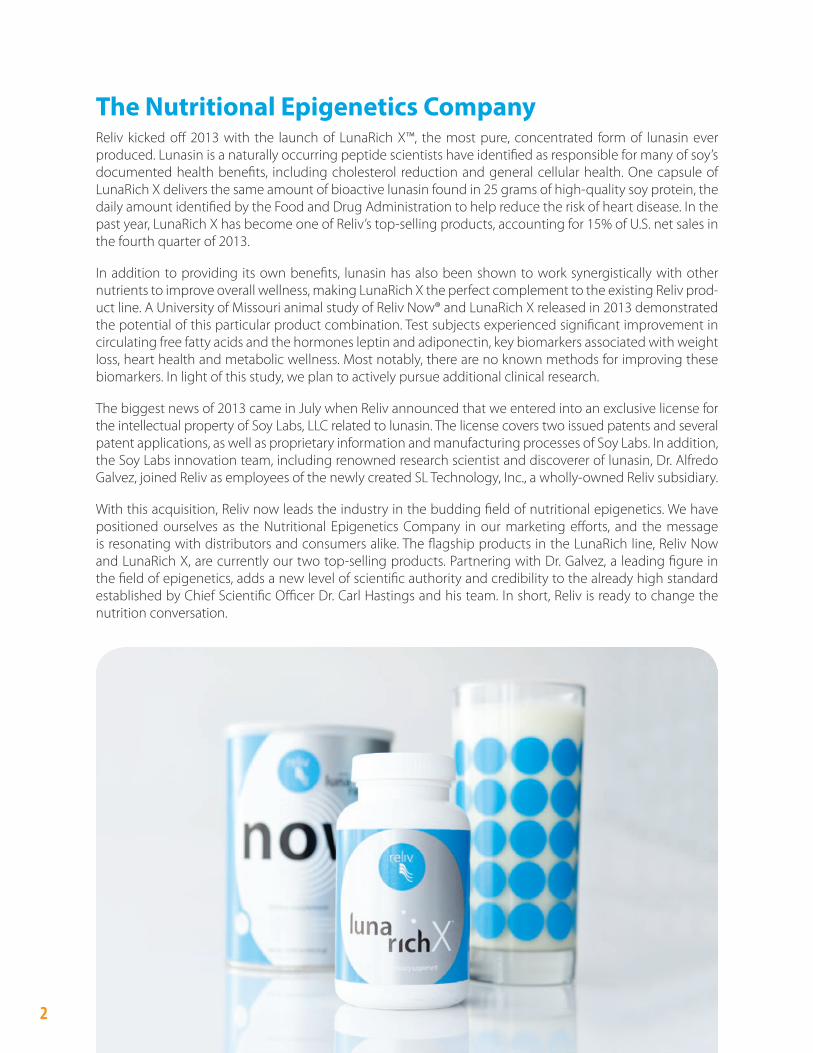
The Nutritional Epigenetics CompanyReliv kicked off 2013 with the launch of LunaRich X™, the most pure, concentrated form of lunasin ever produced. Lunasin is a naturally occurring peptide scientists have identified as responsible for many of soy’s documented health benefits, including cholesterol reduction and general cellular health. One capsule of LunaRich X delivers the same amount of bioactive lunasin found in 25 grams of high-quality soy protein, the daily amount identified by the Food and Drug Administration to help reduce the risk of heart disease. In the past year, LunaRich X has become one of Reliv’s top-selling products, accounting for 15% of U.S. net sales in the fourth quarter of 2013.
In addition to providing its own benefits, lunasin has also been shown to work synergistically with other nutrients to improve overall wellness, making LunaRich X the perfect complement to the existing Reliv prod-uct line. A University of Missouri animal study of Reliv Now® and LunaRich X released in 2013 demonstrated the potential of this particular product combination. Test subjects experienced significant improvement in circulating free fatty acids and the hormones leptin and adiponectin, key biomarkers associated with weight loss, heart health and metabolic wellness. Most notably, there are no known methods for improving these biomarkers. In light of this study, we plan to actively pursue additional clinical research.
The biggest news of 2013 came in July when Reliv announced that we entered into an exclusive license for the intellectual property of Soy Labs, LLC related to lunasin. The license covers two issued patents and several patent applications, as well as proprietary information and manufacturing processes of Soy Labs. In addition, the Soy Labs innovation team, including renowned research scientist and discoverer of lunasin, Dr. Alfredo Galvez, joined Reliv as employees of the newly created SL Technology, Inc., a wholly-owned Reliv subsidiary.
With this acquisition, Reliv now leads the industry in the budding field of nutritional epigenetics. We have positioned ourselves as the Nutritional Epigenetics Company in our marketing efforts, and the message is resonating with distributors and consumers alike. The flagship products in the LunaRich line, Reliv Now and LunaRich X, are currently our two top-selling products. Partnering with Dr. Galvez, a leading figure in the field of epigenetics, adds a new level of scientific authority and credibility to the already high standard established by Chief Scientific Officer Dr. Carl Hastings and his team. In short, Reliv is ready to change the nutrition conversation.
2

More Sales Records in EuropeReliv Europe has recorded 17 straight quarters of year-over-year sales growth and we expect this sales growth in Europe to continue in 2014. 2013 was a big year in Europe in many ways. In January, Reliv Europe relocated its headquarters, quadrupling its office and warehouse space and doubling its staff. In May, Reliv opened in France, the sixth country of operation in Europe. In October, Paris hosted the biggest conference in Reliv Europe history. We intend to continue to provide the resources necessary to build on this success.
In other international news, new leadership in Reliv Mexico initiated a series of operational changes to increase efficiency and productivity, including relocating our Mexico office from Mexico City to Guadalajara to be closer to the majority of distributors. In Reliv Asia-Pacific we continue to implement a strategic plan specific to the region that includes streamlining the business to make it easier to become a successful Reliv distributor.
Indonesia, a country that had previously allowed the sale of only one Reliv product (Innergize!®), recently approved the introduction of three more: Reliv Now, FibRestore® and ReversAge®. We are actively investing in office space and staffing to take advantage of this expansion opportunity.
Speeding Up Business Reliv’s long-term strategic objective to simplify our business and increase efficiency took major steps forward in 2013. On March 1st, Reliv implemented a new pricing structure in the United States, pairing a modest price increase with increased servings per unit and reduced shipping costs. The resulting cost per serving was only pennies higher for most products, and the change was well received by distributors and consumers in the field. Adjusting servings per unit to provide a full month’s supply helped facilitate regular monthly sales, and the reduced shipping eliminated a common point-of-sale objection.
33
The network marketing industry is seeing e-commerce become as important as in-person sales, and Reliv is taking steps to stay in front of this shift in our business model. We completed two vital steps in this process in 2013: creating a custom content management system (CMS) and launching a new online shopping cart. The new CMS makes it easier to manage our websites and provides the platform to pursue additional online upgrades. The upgraded shopping cart facilitates shopping online and saves Reliv the transaction fees we had been paying a third-party provider.
We invested significantly in accelerating additional web-based technology upgrades moving forward. In fact, Reliv doubled the size of its web team in early 2014. Before the year is out, we plan to announce exciting new online tools for our distributors to more quickly build their businesses.
The most significant acceleration of our business resulted from reduced profit level qualifications for distributors. First introduced as a promotion for the months of August-October and then extended through December, the lower qualifications had an immediate impact, increasing both distributor sign-ups and product sales. The number of new Master Affiliates in the United States, the level at which distributors are eligible to earn generation royalties, increased by 144% in the third quarter and by 125% in the fourth quarter of 2013 compared to the number of new Master Affiliates added during those same quarters in 2012.
At the beginning of 2014, Reliv announced that the reduced qualifications would remain as a permanent update to Reliv’s compensation plan. We believe that this update will make the Reliv business opportunity more accessible to new people and accelerate distributor advancement moving forward.
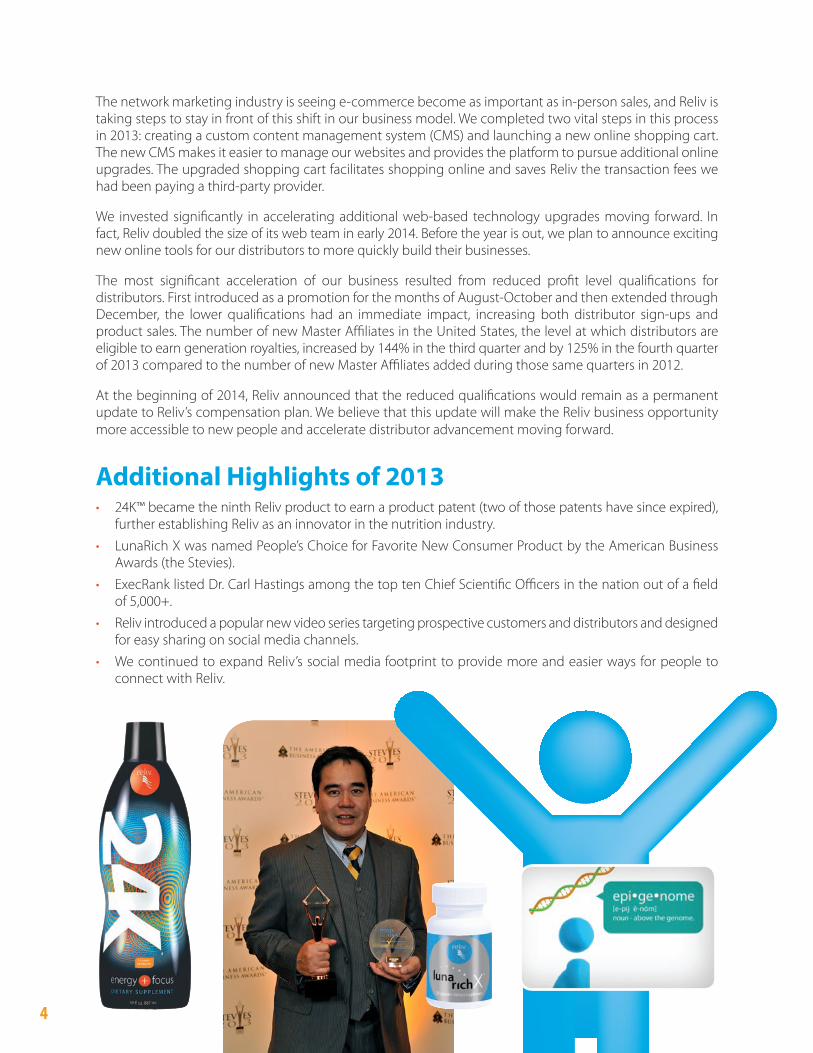
Additional Highlights of 2013• 24K™ became the ninth Reliv product to earn a product patent (two of those patents have since expired),
further establishing Reliv as an innovator in the nutrition industry.
• LunaRich X was named People’s Choice for Favorite New Consumer Product by the American Business Awards (the Stevies).
• ExecRank listed Dr. Carl Hastings among the top ten Chief Scientific Officers in the nation out of a field of 5,000+.
• Reliv introduced a popular new video series targeting prospective customers and distributors and designed for easy sharing on social media channels.
• We continued to expand Reliv’s social media footprint to provide more and easier ways for people to connect with Reliv.
4
The Next Level“Next Level” is Reliv’s theme for 2014, and it reflects where we are as a company in many ways:
• Reliv’s new generation of executives, led by President Ryan Montgomery, is implementing strategies to take us to the next level of success in our second quarter-century.
• LunaRich, a Reliv-exclusive ingredient, and the epigenetic science behind it take nutrition to the next level.
• New distributor profit level qualifications make it easier for distributors to advance to the next level in their businesses.
• Investment in web-based technology upgrades will take the way Reliv distributors build business to the next level.
We are focusing on new people in 2014 — getting them started and getting them equipped for success. Already this year we introduced new distributor kits filled with our top tools to help new distributors take immediate action. New “Get Started” pages on reliv.com complement the new kits with easy access to our most popular and effective tools and resources. In addition, a new Rookie Bonus provides added incentive in the form of cash bonuses available only to new distributors in their first three months.
Reliv has much to offer potential distributors. The science of epigenetics is hitting the mainstream, and nutritional epigenetics will soon follow. In an era when preventive health care is exploding, directing your DNA naturally through nutrition holds the potential for mass appeal. No other products are poised to fill this market need like Reliv’s LunaRich line. With Dr. Galvez now part of Reliv’s innovation team, we anticipate additional nutritional breakthroughs and new product opportunities in the years ahead.
This product innovation will be matched by innovation in the way Reliv operates. We simplified our business and streamlined our operations to make it easier for new distributors to start earning right away. The good news is we are just getting started. We expect to continue to speed up business and make it easier than ever to get Reliv products — and everything Reliv offers — into the hands of as many people as possible.
I thank our shareholders, distributors, customers and employees who made 2013 such a landmark year for Reliv. I cannot wait to see where we go from here.
Here’s to a profitable and prosperous 2014,
Robert L. Montgomery Chairman and Chief Executive Officer
5

6
Reliv Kalogris FoundationDonations to the Reliv Kalogris Foundation topped $1 million again in 2013 — the fourth straight year we reached this benchmark. Total 2013 donations came in at $1,045,000 compared to $1,014,000 in 2012, a 3% increase.
In May the RKF dedicated the Welfareville Nutrition Center in a depressed area of Mandaluyong City, Philippines. This building is used for the distribution of daily Reliv shakes, two hot meals per week, choir practice, worship services, day care, life skills training and as a clinic for visiting doctors. The Foundation raised funds for the project through the Rally for the Mission at the 2012 Reliv International Conference. The feeding center earned the RKF its third Communitas Award for “Making a Difference.”
In December the RKF opened St. John the Baptist National School of Petite-Anse, Haiti. The school building, damaged in the 2010 earthquake, had been declared unsafe and the Foundation provided funds for neces-sary upgrades. The school now serves more than 200 children, grades K-6, and plans are in place to expand the facility to serve more than 500 students, including a trade school for older youth. The school is located just steps away from the RKF’s children’s home, opened in May 2011.
In the wake of Typhoon Haiyan in the Philippines, the RKF contributed more than $600,000 in nutritional products and cash to support victims of the disaster. The relief work continues and our own distributors are playing a key role in helping those in need. This includes providing clean drinking water, mosquito nets, building supplies and food packs, as well as distribution of Reliv nutrition shakes.
The Reliv Kalogris Foundation, created in 1995, has provided more than $38 million in free nutritional supple-ments to malnourished people since its founding. Today, it feeds more than 43,000 people, mostly children, daily through 270 feeding centers in nine countries.
For further information on the Reliv Kalogris Foundation, please visit relivkalogrisfoundation.org. Or join our Facebook community at facebook.com/relivkalogrisfoundation.

Board of DirectorsRobert L. Montgomery
Chairman and Chief Executive Officer Reliv International, Inc.
Carl W. Hastings, Ph.D. Vice Chairman
Reliv International, Inc.
John B. Akin Retired Vice President,
A. G. Edwards, Inc.
John M. Klimek Managing Director
HFR Asset Management
Robert M. Henry Private Investor and Consultant
Corporate OfficersRobert L. Montgomery Chairman and Chief Executive Officer
Carl W. Hastings, Ph.D. Vice Chairman Chief Scientific Officer
Ryan A. Montgomery President, Reliv International
R. Scott Montgomery President, Reliv Asia-Pacific
Steven G. Hastings Executive Vice President Sales & Marketing
Steven D. Albright Senior Vice President, Finance Chief Financial Officer
Brett M. Hastings Senior Vice President and Chief Operating Officer
Stephen M. Merrick Senior Vice President, General Counsel and Secretary
Debra P. Hellweg Vice President, Operations
Ronald W. McCain Vice President, Sales Development
Joseph J. Wojcik Vice President, International
Kurt C. Wulff Vice President, Marketing
7
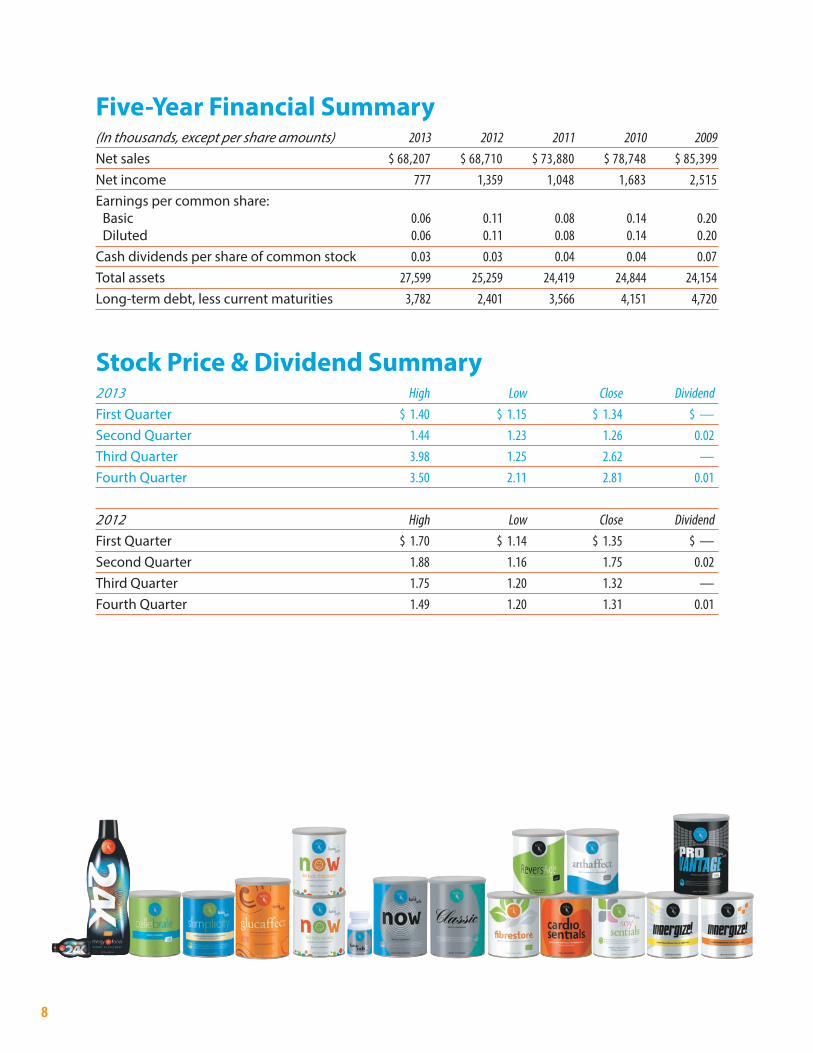
Five-Year Financial Summary(In thousands, except per share amounts) 2013 2012 2011 2010 2009 Net sales $ 68,207 $ 68,710 $ 73,880 $ 78,748 $ 85,399Net income 777 1,359 1,048 1,683 2,515Earnings per common share: Basic 0.06 0.11 0.08 0.14 0.20 Diluted 0.06 0.11 0.08 0.14 0.20 Cash dividends per share of common stock 0.03 0.03 0.04 0.04 0.07 Total assets 27,599 25,259 24,419 24,844 24,154Long-term debt, less current maturities 3,782 2,401 3,566 4,151 4,720
Stock Price & Dividend Summary2013 High Low Close DividendFirst Quarter $ 1.40 $ 1.15 $ 1.34 $ — Second Quarter 1.44 1.23 1.26 0.02 Third Quarter 3.98 1.25 2.62 —Fourth Quarter 3.50 2.11 2.81 0.01
2012 High Low Close DividendFirst Quarter $ 1.70 $ 1.14 $ 1.35 $ — Second Quarter 1.88 1.16 1.75 0.02 Third Quarter 1.75 1.20 1.32 —Fourth Quarter 1.49 1.20 1.31 0.01
8
UNITED STATESSECURITIES AND EXCHANGE COMMISSION
WASHINGTON, D.C. 20549____________
FORM 10-KANNUAL REPORT PURSUANT TO
SECTION 13 OR 15(d) OF THE SECURITIESEXCHANGE ACT OF 1934
For the Fiscal Year Ended December 31, 2013(Mark One)
ANNUAL REPORT PURSUANT TO SECTION 13 OR 15 (d) OF THE SECURITIESEXCHANGE ACT OF 1934
For the fiscal year ended December 31, 2013
OR
TRANSITION REPORT PURSUANT TO SECTION 13 OR 15 (d) OF THE SECURITIESEXCHANGE ACT OF 1934
For the transition period from _________to_________
Commission File Number000-19932
RELIV’ INTERNATIONAL, INC.(Exact name of Registrant as specified in its charter)
Delaware 371172197(State or other jurisdiction of (I.R.S. Employer Identification Number)incorporation or organization)
136 Chesterfield Industrial BoulevardChesterfield, Missouri 63005
(Address of principal executive offices) (Zip Code)
(636) 537-9715Registrant’s telephone number, including area code
Securities registered pursuant to Sections 12(b) of the Act:
Title of Each Class Name of Each Exchange on Which Registered
Common Stock, par value $0.001 NASDAQ Global Select Market
Securities registered pursuant to Section 12(g) of the Act: None
Indicate by check mark if the registrant is a well-known seasoned issuer, as defined in Rule 405 of theSecurities Act. Yes No
Indicate by check mark if the registrant is not required to file reports pursuant to Section 13 orSection 15(d) of the Act. Yes No
Indicate by check mark whether the registrant (1) has filed all reports required to be filed by Section 13 or15(d) of the Securities Exchange Act of 1934 during the preceding 12 months (or for such shorter period that the
registrant was required to file such reports), and (2) has been subject to such filing requirements for the past90 days. Yes No
Indicate by check mark whether the registrant has submitted electronically and posted on its corporate Website, if any, every Interactive Data File required to be submitted and posted pursuant to Rule 405 of Regulation S-T(§ 232.405 of this chapter) during the preceding 12 months (or for such shorter period that the registrant wasrequired to submit and post such files). Yes No
Indicate by check mark if disclosure of delinquent filers pursuant to Item 405 of Regulation S-K (§229.405of this chapter) is not contained herein, and will not be contained, to the best of registrant’s knowledge, in definitiveproxy or information statements incorporated by reference in Part III of this Form 10-K or any amendment to thisForm 10-K.
Indicate by check mark whether the registrant is a large accelerated filer, an accelerated filer, or a non-accelerated filer. See definition of “large accelerated filer,” “accelerated filer” and “smaller reporting company” inRule 12b-2 of the Exchange Act. (Check one):
Large accelerated filer Accelerated filer Non-accelerated filer Smaller Reporting Company
Indicate by check mark whether registrant is a shell company (as defined in Rule 12b-2 of the ExchangeAct). Yes No
Based upon the closing price of $1.26 per share of the registrant’s common stock as reported on theNASDAQ Global Select Market on June 28, 2013, the aggregate market value of the common stock held by non-affiliates of the registrant was approximately $10.0 million. (The determination of stock ownership by non-affiliateswas made solely for the purpose of responding to the requirements of the Form and the registrant is not bound bythis determination for any other purpose.)
The number of shares outstanding of the registrant’s common stock as of March 3, 2014 was 12,665,632(excluding treasury shares).
DOCUMENTS INCORPORATED BY REFERENCE
DocumentPart of Form 10-K into Which
Document Is Incorporated
Sections of the registrant’s definitive Proxy Statement for the AnnualMeeting of Stockholders to be held on May 22, 2014, which is expectedto be filed no later than 120 days after December 31, 2013
Part III
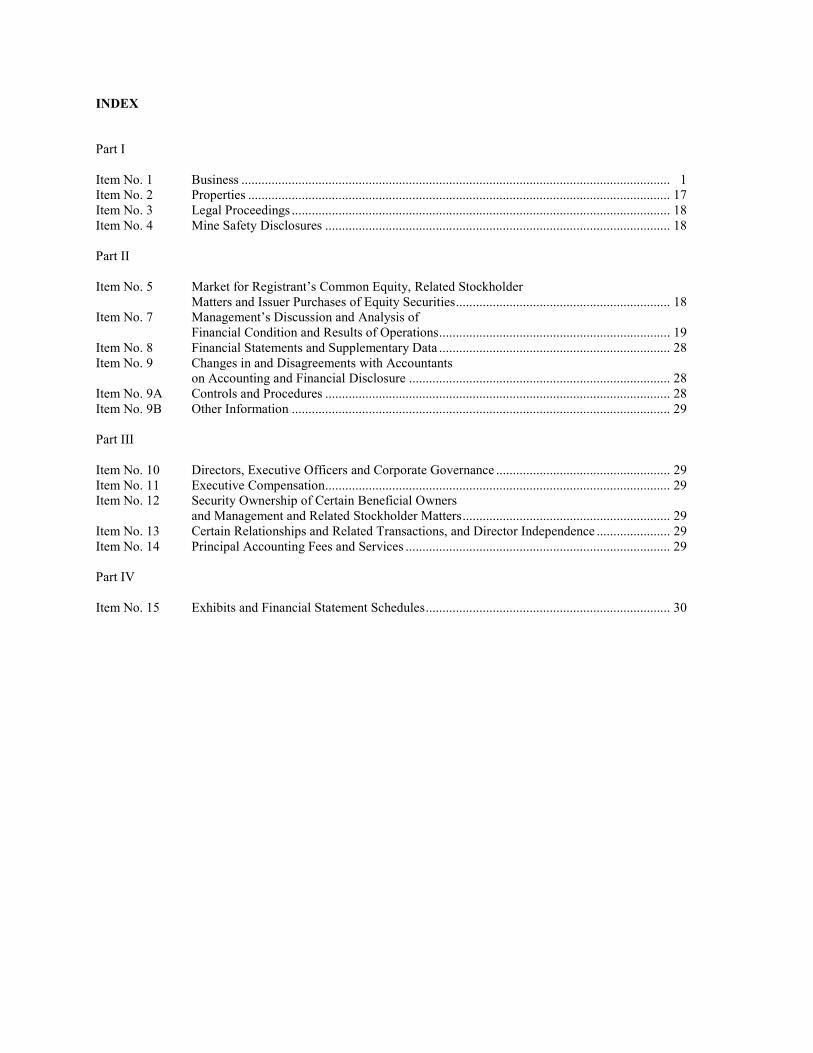
INDEX
Part I
Item No. 1 Business ................................................................................................................................ 1Item No. 2 Properties .............................................................................................................................. 17Item No. 3 Legal Proceedings ................................................................................................................. 18Item No. 4 Mine Safety Disclosures ....................................................................................................... 18
Part II
Item No. 5 Market for Registrant’s Common Equity, Related StockholderMatters and Issuer Purchases of Equity Securities................................................................ 18
Item No. 7 Management’s Discussion and Analysis ofFinancial Condition and Results of Operations..................................................................... 19
Item No. 8 Financial Statements and Supplementary Data ..................................................................... 28Item No. 9 Changes in and Disagreements with Accountants
on Accounting and Financial Disclosure .............................................................................. 28Item No. 9A Controls and Procedures ....................................................................................................... 28Item No. 9B Other Information ................................................................................................................. 29
Part III
Item No. 10 Directors, Executive Officers and Corporate Governance .................................................... 29Item No. 11 Executive Compensation....................................................................................................... 29Item No. 12 Security Ownership of Certain Beneficial Owners
and Management and Related Stockholder Matters.............................................................. 29Item No. 13 Certain Relationships and Related Transactions, and Director Independence ...................... 29Item No. 14 Principal Accounting Fees and Services ............................................................................... 29
Part IV
Item No. 15 Exhibits and Financial Statement Schedules......................................................................... 30
1
FORWARD-LOOKING STATEMENTS
This annual report includes both historical and “forward-looking statements” within the meaning of Section21E of the Securities Exchange Act of 1934, as amended. We have based these forward-looking statements on ourcurrent expectations and projections about future results. Words such as “may,” “should,” “could,” “would,”“expect,” “plan,” “anticipate,” “believe,” “estimate,” “predict,” “potential,” “continue,” or similar words areintended to identify forward-looking statements, although not all forward-looking statements contain these words.Although we believe that our opinions and expectations reflected in the forward-looking statements are reasonable,we cannot guarantee future results, levels of activity, performance or achievements, and our actual results may differsubstantially from the views and expectations set forth in this annual report. We disclaim any intent or obligation toupdate any forward-looking statements after the date of this annual report to conform such statements to actualresults or to changes in our opinions or expectations.
PART I
Item No. 1 - Business
Overview
We are a developer, manufacturer and marketer of a proprietary line of nutritional supplements addressingbasic nutrition, specific wellness needs, weight management and sports nutrition. We sell our products through aninternational network marketing system using independent distributors. We have sold products in the United Statessince 1988 and in selected international markets since 1991.
We currently offer 18 nutritional supplements, a line of 5 skin care products and an all-natural sweetener.We have selectively evolved our product offering over our history. Traditionally, our core line of nutritionalsupplements, which represented 52.5% of net product sales for the year ended December 31, 2013, included thefollowing four products:
• Reliv Classic and Reliv NOW — two basic nutritional supplements containing a full and balancedblend of vitamins, minerals, proteins and herbs
• Innergize! — an isotonic sports supplement in two flavors• FibRestore — a high-fiber and antioxidant supplement
However, in 2013 we experienced a gradual shift in our product sales mix reflecting an increasing emphasison Reliv NOW and LunaRich X capsules. Historically, Reliv Classic had been our best-selling product but for theyear ended December 31, 2012, for the first time in our history, Reliv NOW became our best-selling product as aresult of adding LunaRich soy flour to Reliv NOW. For the year ended December 31, 2013, Reliv NOW constituted18.8% of net product sales and Reliv Classic constituted 11.4%. While LunaRich X capsules represented only 8.7%of net product sales for the year ended December 31, 2013, sales of LunaRich X capsules as a percentage of netproduct sales increased steadily after their introduction and we expect that trend to continue into 2014 as thecombination of Reliv NOW and LunaRich X capsules increasingly became the focus of our product strategy.
We periodically refine our products and introduce related new products and product categories. Ourinternal research and development team has developed most of our products, and we hold U.S. patents on seven ofthese products —FibRestore, Arthaffect, ReversAge, Cellebrate, GlucAffect, ProVantage and 24K. In addition, wehave applied for a U.S. patent on our CardioSentials product. We also hold the exclusive license to patents andpatent applications related to the nutritional ingredient lunasin through a Technology License Agreement we enteredinto in July 2013.
We believe that our network marketing model is the best method for the marketing and sale of our productsbecause it utilizes ongoing personal contact among our distributors and their retail customers. This enables ourdistributors to communicate directly regarding the products, the business opportunity we offer and their personalexperiences with both. We provide our distributors with a financially rewarding and entrepreneurial businessopportunity, affording them the ability to earn compensation both from the direct sale of products and from salesvolume generated by distributors they sponsor. We actively support our distributors by providing marketingmaterials, a dependable product fulfillment system and frequent educational, training and motivational programs.
2
The majority of our sales traditionally has been, and is expected to continue to be, made through ourdistributors in the United States. We also currently generate sales through distributor networks in Australia, Austria,Canada, France, Germany, Indonesia, Ireland, Malaysia, Mexico, the Netherlands, New Zealand, the Philippines,Singapore and the United Kingdom. In each country in which we conduct business, our distributors operate under auniform business and compensation model that maintains consistent marketing, sales, fulfillment, and complianceprocedures. As of December 31, 2013, our network consisted of approximately 53,070 distributors — 39,270 in theUnited States and 13,800 across our international markets.
We manufacture all of our powdered nutritional supplements at our facility in Chesterfield, Missouri. Webelieve our ability to formulate and manufacture all but two of our own nutritional supplements enables us toproduce our products efficiently while maintaining our high standards of quality assurance and proprietary productcomposition.
Industry Overview
Nutritional Supplement Market
We operate primarily in the $32.5 billion U.S. nutritional supplement market, which is part of the broader$117 billion U.S. nutrition industry according to 2011 data published by the Nutrition Business Journal, or NBJ, andan estimated $320.0 billion global nutrition industry, also according to the NBJ. Additionally, more than 150 millionAmericans take dietary supplements annually according to the Council for Responsible Nutrition.
A combination of demographic, healthcare and lifestyle trends are expected to drive continued growth inthe nutritional supplement market. These trends include:
Aging Population: The older population (persons 65 years or older) numbered 41.3 million in 2011according to the Department of Health and Human Services. They represented 13.25% of the U.S.population, about one in every eight Americans. By 2050, there will be approximately 89 million olderpersons living in the U.S., more than twice their number in 2011. In 2011, the leading edge of babyboomers reached aged 65. When the last baby boomer reaches age 65 in 2030, one out of every fiveAmericans-about 72 million people- will be considered older adults according to the CDC. We believethis ever-growing population, living longer lives than in previous decades, will continue to focus ontheir nutritional needs as they age.
Rising Healthcare Costs and Use of Preventative Maintenance: The costs of healthcare in the UnitedStates continue to increase rapidly each year and it grew at an annual rate of 4.1% in 2013 according tothe Alatrum Institute. National health care spending is expected to accelerate in 2014, jumping to a 6.1percent growth rate. Additionally, national health care spending reached $2.8 trillion in 2012, or$8,915 per person, according to the Centers for Medicare and Medicaid Services (CMS). As a share ofthe nation's Gross Domestic Product, health spending accounted for 17.2 percent. Spending shouldreach $4.5 trillion by 2019 according to the National Coalition on Health Care, or NCHC. In addition,as measured by the 2013 Milliman Medical Index (MMI), the total 2013 medical costs for a typicalAmerican family of four covered by a preferred plan provider (PPO) topped out at $22,030, with out ofpocket expenses exceeding $9,100. The pharmacy costs for a family of four exceeded $3,290 in 2013.In order to maintain quality of life as well as reduce medical costs, many consumers take preventativemeasures to improve their general health, including the use of nutritional supplements.
Increasing Focus on Weight Management: According to a report published by the National Center forHealth Statistics in January 2012, more than 35%, or more than one-third of U.S. men and womenwere obese in 2009-2010 as was almost 17% of youth. It is estimated that 86.3% of Americans will beoverweight or obese by 2030. Related health care costs to obesity are expected to grow between $860.7billion to $956.9 billion by 2030 and currently account for almost 21% of U.S. health care costsaccording to a 2012 report by Cornell University. Being overweight can lead to more serious healthconcerns such as diabetes, heart disease and other chronic illnesses and individuals who are obese havea 10% to 50% increased risk of death from all causes, compared with healthy weight individuals.

3
Bearing these facts in mind, we believe that there will be an increased need not only for weight lossproducts but for wellness products as well.
Direct Selling Market
Health and nutrition products are distributed through various market means, including retailers such assupermarkets, drugstores, mass merchants and specialty retailers; direct marketers such as mail order companies andInternet retailers; and direct sellers such as network marketers and healthcare practitioners. We distribute ourproducts through the direct selling channel via our network marketers.
Direct selling involves the marketing of products and services directly to consumers in a person-to-personmanner. Direct selling is a significant global industry largely utilized for the sale of a wide range of consumerproducts from companies such as Avon Products Inc., Alticor Inc. (Amway Corp.) and Tupperware BrandsCorporation. According to the World Federation of Direct Selling Associations, or WFDSA, the 2012 global directselling market (for all product categories) was estimated to be $169 billion, an increase from $153.7 billion in 2011.The WFDSA estimates that the number of individuals engaged in direct selling more than doubled between 1999and 2012, from 35.9 million sellers to 89.7 million in 2012. The U.S. had 15.9 million direct sellers in 2012, themost of any country. Globally, wellness products came in as the 2nd top selling category, just a mere 10% behindcosmetics and personal care.
While the United States is currently the largest direct selling market with $31.6 billion in annual sales in2012, international markets account for 80% of the entire industry, according to the WFDSA. Twenty-two countries(including the United States) have annual direct sales revenue of at least $1 billion and another twenty-sevencountries have annual direct sales revenue of at least $100 million, according to the WFDSA.
We believe that we are well positioned to capitalize on the world-wide growth trends in direct sales, as botha developer and manufacturer of proprietary nutritional products, utilizing our network marketing distributionsystem.
Our Competitive Strengths
We believe that we possess a number of competitive strengths that are our key to growth and profitabilityin the future.
Complete, Simple Nutrition. We focus on the completeness, balance and simplicity of our basic nutritionalsupplements — Reliv Classic and Reliv NOW. Because these two basic nutritional supplements each contain a fulland balanced blend of vitamins, minerals, proteins and herbs, supplementation is made simple for the consumer,who does not have to select and purchase several supplements for his or her basic nutritional needs. For morespecific individual needs, we provide 15 additional supplements. We believe that our two basic nutritionalsupplements, together with our additional supplements and other products, enhance the ability of our distributors tobuild their businesses by providing a comprehensive, simple product offering.
Nutritional Supplements Consumed in Liquid Form. We believe that our nutritional supplements which areconsumed in liquid form, except for our LunaRich X capsules, provide a competitive advantage over othersupplements such as vitamins, minerals and herbs in pill or tablet form. Our powder-based nutritional products areconsumed with water, milk or juice and 24K, is a ready-to-drink product. Our products provide an effective meansof delivering nutrients to the body. We believe nutrients taken orally in liquid form lead to better absorption at thecellular level, or “bioavailability.” Where serving sizes mandate, as with our LunaRich X capsules, we will useeasily digestible capsules as a convenient and effective way of delivering small serving sizes of our powderednutritional supplements.
In-House Development and Production. We have developed substantially all of our nutritional supplementand food products utilizing nutrition science as the basis for product formulation. We maintain an ongoing researchand development effort led by Carl W. Hastings, Ph.D., our Chief Scientific Officer and Vice Chairman. Inaddition, we consult regularly with other industry professionals with respect to developments in nutritional science,product enhancements and new products. Since 1993, we have manufactured substantially all of our nutritionalproducts at our facility in Chesterfield, Missouri. Currently, we outsource two nutritional supplement products, our
4
24K and LunaRich X capsules. We believe our ability to formulate and manufacture all but two of our ownnutritional supplement products enables us to maintain our high standards of quality assurance and proprietaryproduct composition.
Experienced Ambassador Team. Our Ambassador corps consists of distributors who have achieved thelevel of Master Director, have earned royalty payments of at least $4,000 in consecutive months and meet ourleadership and character criteria necessary to garner our invitation to be an Ambassador. Our Ambassadors generallyare our most productive distributors and are essential in recruiting, motivating and training our entire distributornetwork. We, and our Ambassadors, lead hundreds of annual events throughout all of our markets to motivate andtrain distributors, including regular recruiting meetings, trainings, conference calls, training schools for MasterAffiliates and higher levels and regional, national and international distributor conferences. As of December 31,2013, we had approximately 374 Ambassadors. The top 10 distributors at the Ambassador level have been with usfor an average of 19 years, which provides consistency in training new distributors and contributes to a stablesalesforce.
Uniform Distributor Business Model. Our distributor compensation system is essentially uniformthroughout our domestic and international markets. The compensation plan is “seamless” in that distributors in eachmarket all receive discounts and commissions on relatively the same terms, subject to a few variances to addressmarket conditions and cultural preferences. We also provide consistent distributor documentation and trainingthroughout our system and in all of our markets. We believe this uniform model is effective in motivating andtraining distributors to build their businesses and enter new markets.
Experienced and Incentivized Management Team. Our management team is led by our founder, Robert L.Montgomery, who has been our Chief Executive Officer since the inception of our company in 1985. Our executiveofficers have been employed by our company for an average of 17 years and are experienced in their areas of focus,which include manufacturing, sales, finance, marketing and operations. As of March 3, 2014, our directors andexecutive officers beneficially own approximately 37.4% of our common stock.
Our Business Strategy
Our basic objective is to increase our net sales by increasing the number and productivity of our distributorsand by periodically improving our existing products and introducing new products. We also intend to invest in ourinfrastructure to improve our operating efficiencies, provide better service to our distributors and leverage ourcurrent operating facilities to improve our profitability. We seek to accomplish these objectives by employing thefollowing strategic initiatives:
Leverage and Expand our Existing Distributor Base Throughout the United States. The United States hasbeen and will continue to be our largest market. Our growth strategy in the United States involves multipleinitiatives, such as continued investment in company-sponsored events and distributor training and better utilizationof our upper-level distributors across different geographical areas to increase our distributor base.
Expand in Existing and New International Markets. We believe there is a significant opportunity toincrease our net sales in international markets. We have a uniform business model across all of our markets andencourage our distributors to pursue their business in multiple markets. We believe this uniform business modelwill encourage expansion of our distributors in our existing international markets and will provide a framework thatfacilitates our entry into new international markets. To that end, we continue to monitor business conditions inpotential new markets and will selectively expand as timing and conditions are appropriate.
Invest in Improved and New Products. As a developer of nutritional supplements, it is vital to continue toinvest in the research and development of new and innovative products. Additionally, we will continue to improveand validate the efficacy of our existing product line. For example, in February 2011 we launched 24K, our firstready-to-drink product, to support energy production and mental focus and in January 2013 we launched LunaRichX capsules containing concentrated lunasin to support heart health and overall wellness. In addition, since February2012 we added LunaRich soy powder, which contains elevated levels of lunasin compared to standard soy powders,to six of our products: Reliv NOW, Reliv NOW for Kids, ProVantage, SoySentials, GlucAffect and Slimplicity.These types of investments should facilitate customer and distributor retention, as well as the recruitment of newdistributors.
5
Expand and Improve our Manufacturing and Distribution Capabilities. We currently manufacture all ofour powdered nutritional supplements at our facility in Chesterfield, Missouri. This allows us to precisely controlproduct composition and quality assurance as well as better manage inventory levels. Periodically, we makeappropriate investments that enhance our manufacturing capabilities and capacity to further leverage our existingfacilities and trained production staff. We expect to continue to make appropriate investments in our manufacturingand fulfillment facilities.
Increase Appeal to Broader Demographic. Traditionally, our customer and distributor demographic hasskewed towards baby boomers and older individuals searching for nutritional solutions to supplement their diet andsupport overall wellness. While continuing to maintain our focus on the needs of this important segment, we believethere is an opportunity to expand our sales and distributor base by increasing our appeal to younger generationsinterested in nutrition and an active healthy lifestyle. We believe the nutritional aspects and convenience of 24K,our healthy energy and mental focus drink, will attract health conscious on-the-go individuals, many of whom fallwithin the under-40 demographic. Further, we maintain an active presence on popular social media sites includingFacebook, Twitter, YouTube and several other social networks that are popular with younger generations. Ourinternal social media team is comprised of Gen X and Gen Y staffers who regularly interact with distributors,customers and prospects. We plan to continue to develop products and programs, and expand our technologyofferings in an effort to further appeal to younger generations interested in healthy active lifestyles and a vibrantevolving business opportunity.
Our Products
Product Overview
Our product line includes nutritional supplements that address basic nutrition, specific wellness needs,weight management and sports nutrition. We combine ingredients from science and nature in targeted, well-balanced, easy-to-use formulas that are specifically designed to enhance wellness and increase performance andenergy in specific applications. All but two of our supplements are in powdered form that the consumer mixes withwater, juice or other liquid. 24K is a ready-to-drink nutritional supplement and LunaRich X is available in capsuleform.
We currently offer 18 nutritional supplements. In addition, we offer 5 skin care products and a sweetener.Our basic nutritional supplements are formulated to provide a balanced and complete level of supplementation forthe consumer. For more specific needs, we provide other focused product formulations. We have purposely beenselective in the number and types of products that we offer. By providing a line of targeted products, we make itsimple for our distributors and consumers to choose products appropriate for their objectives. We consider four ofour oldest and best selling products — Reliv Classic, Reliv NOW, Innergize!, and FibRestore — along withLunaRich X capsules, our newest product, to be our primary or “core” products.
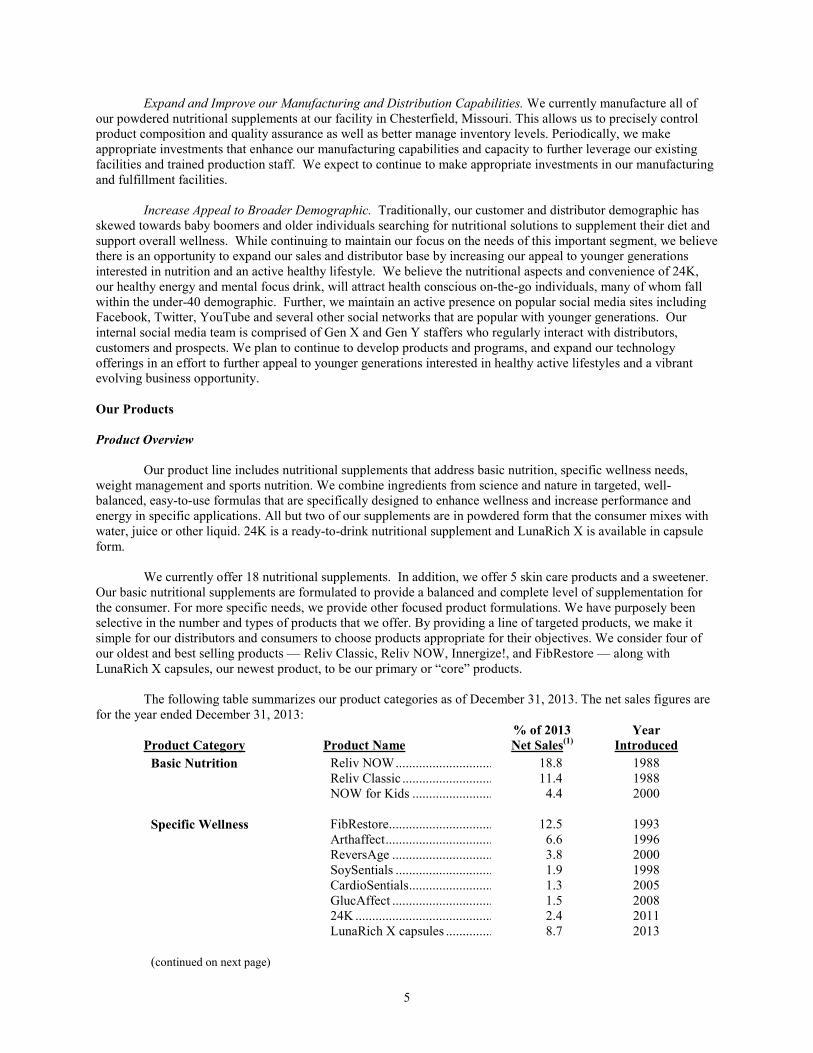
The following table summarizes our product categories as of December 31, 2013. The net sales figures arefor the year ended December 31, 2013:
Product Category Product Name% of 2013Net Sales(1)
YearIntroduced
Basic Nutrition Reliv NOW................................ 18.8 1988Reliv Classic ................................ 11.4 1988NOW for Kids ................................ 4.4 2000
Specific Wellness FibRestore................................ 12.5 1993Arthaffect................................ 6.6 1996ReversAge ................................ 3.8 2000SoySentials ................................ 1.9 1998CardioSentials................................ 1.3 2005GlucAffect ................................ 1.5 200824K ................................................................2.4 2011LunaRich X capsules ................................8.7 2013
(continued on next page)
6
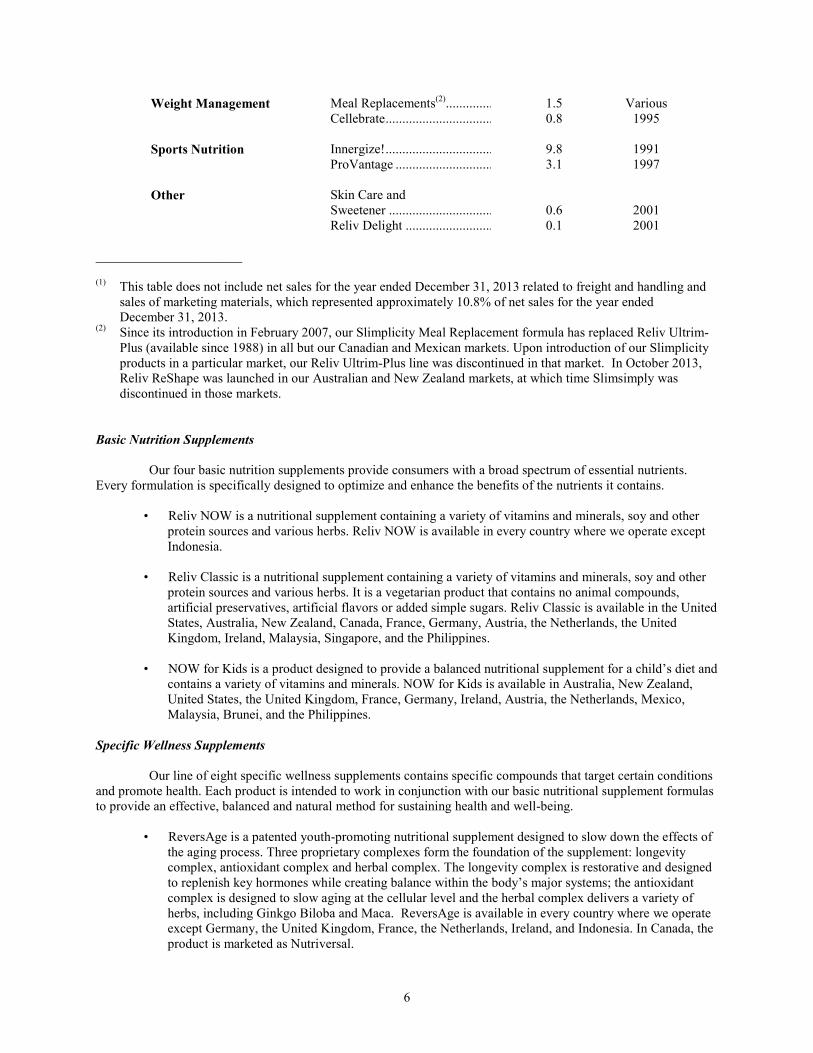
Weight Management Meal Replacements(2)................................1.5 VariousCellebrate................................ 0.8 1995
Sports Nutrition Innergize!................................ 9.8 1991ProVantage ................................ 3.1 1997
Other Skin Care andSweetener ................................ 0.6 2001Reliv Delight ................................ 0.1 2001
______________________
(1) This table does not include net sales for the year ended December 31, 2013 related to freight and handling andsales of marketing materials, which represented approximately 10.8% of net sales for the year endedDecember 31, 2013.
(2) Since its introduction in February 2007, our Slimplicity Meal Replacement formula has replaced Reliv Ultrim-Plus (available since 1988) in all but our Canadian and Mexican markets. Upon introduction of our Slimplicityproducts in a particular market, our Reliv Ultrim-Plus line was discontinued in that market. In October 2013,Reliv ReShape was launched in our Australian and New Zealand markets, at which time Slimsimply wasdiscontinued in those markets.
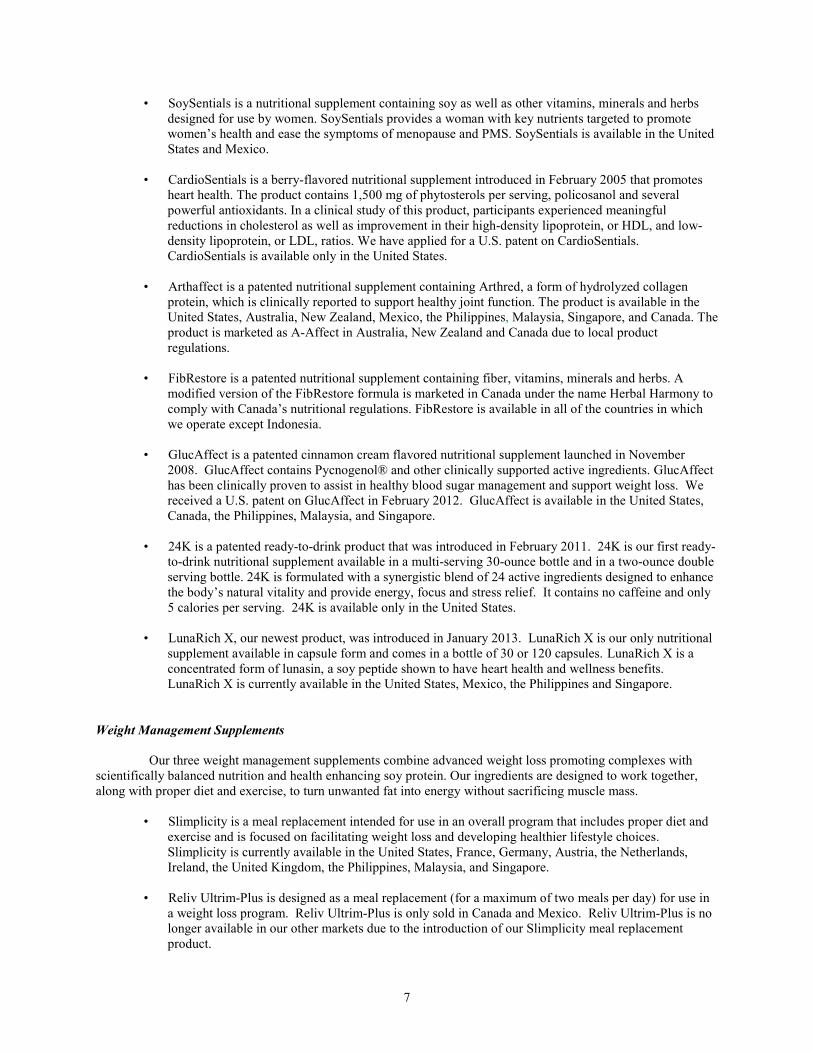
Basic Nutrition Supplements
Our four basic nutrition supplements provide consumers with a broad spectrum of essential nutrients.Every formulation is specifically designed to optimize and enhance the benefits of the nutrients it contains.
• Reliv NOW is a nutritional supplement containing a variety of vitamins and minerals, soy and otherprotein sources and various herbs. Reliv NOW is available in every country where we operate exceptIndonesia.
• Reliv Classic is a nutritional supplement containing a variety of vitamins and minerals, soy and otherprotein sources and various herbs. It is a vegetarian product that contains no animal compounds,artificial preservatives, artificial flavors or added simple sugars. Reliv Classic is available in the UnitedStates, Australia, New Zealand, Canada, France, Germany, Austria, the Netherlands, the UnitedKingdom, Ireland, Malaysia, Singapore, and the Philippines.
• NOW for Kids is a product designed to provide a balanced nutritional supplement for a child’s diet andcontains a variety of vitamins and minerals. NOW for Kids is available in Australia, New Zealand,United States, the United Kingdom, France, Germany, Ireland, Austria, the Netherlands, Mexico,Malaysia, Brunei, and the Philippines.
Specific Wellness Supplements
Our line of eight specific wellness supplements contains specific compounds that target certain conditionsand promote health. Each product is intended to work in conjunction with our basic nutritional supplement formulasto provide an effective, balanced and natural method for sustaining health and well-being.
• ReversAge is a patented youth-promoting nutritional supplement designed to slow down the effects ofthe aging process. Three proprietary complexes form the foundation of the supplement: longevitycomplex, antioxidant complex and herbal complex. The longevity complex is restorative and designedto replenish key hormones while creating balance within the body’s major systems; the antioxidantcomplex is designed to slow aging at the cellular level and the herbal complex delivers a variety ofherbs, including Ginkgo Biloba and Maca. ReversAge is available in every country where we operateexcept Germany, the United Kingdom, France, the Netherlands, Ireland, and Indonesia. In Canada, theproduct is marketed as Nutriversal.
7
• SoySentials is a nutritional supplement containing soy as well as other vitamins, minerals and herbsdesigned for use by women. SoySentials provides a woman with key nutrients targeted to promotewomen’s health and ease the symptoms of menopause and PMS. SoySentials is available in the UnitedStates and Mexico.
• CardioSentials is a berry-flavored nutritional supplement introduced in February 2005 that promotesheart health. The product contains 1,500 mg of phytosterols per serving, policosanol and severalpowerful antioxidants. In a clinical study of this product, participants experienced meaningfulreductions in cholesterol as well as improvement in their high-density lipoprotein, or HDL, and low-density lipoprotein, or LDL, ratios. We have applied for a U.S. patent on CardioSentials.CardioSentials is available only in the United States.
• Arthaffect is a patented nutritional supplement containing Arthred, a form of hydrolyzed collagenprotein, which is clinically reported to support healthy joint function. The product is available in theUnited States, Australia, New Zealand, Mexico, the Philippines, Malaysia, Singapore, and Canada. Theproduct is marketed as A-Affect in Australia, New Zealand and Canada due to local productregulations.
• FibRestore is a patented nutritional supplement containing fiber, vitamins, minerals and herbs. Amodified version of the FibRestore formula is marketed in Canada under the name Herbal Harmony tocomply with Canada’s nutritional regulations. FibRestore is available in all of the countries in whichwe operate except Indonesia.
• GlucAffect is a patented cinnamon cream flavored nutritional supplement launched in November2008. GlucAffect contains Pycnogenol® and other clinically supported active ingredients. GlucAffecthas been clinically proven to assist in healthy blood sugar management and support weight loss. Wereceived a U.S. patent on GlucAffect in February 2012. GlucAffect is available in the United States,Canada, the Philippines, Malaysia, and Singapore.
• 24K is a patented ready-to-drink product that was introduced in February 2011. 24K is our first ready-to-drink nutritional supplement available in a multi-serving 30-ounce bottle and in a two-ounce doubleserving bottle. 24K is formulated with a synergistic blend of 24 active ingredients designed to enhancethe body’s natural vitality and provide energy, focus and stress relief. It contains no caffeine and only5 calories per serving. 24K is available only in the United States.
• LunaRich X, our newest product, was introduced in January 2013. LunaRich X is our only nutritionalsupplement available in capsule form and comes in a bottle of 30 or 120 capsules. LunaRich X is aconcentrated form of lunasin, a soy peptide shown to have heart health and wellness benefits.LunaRich X is currently available in the United States, Mexico, the Philippines and Singapore.
Weight Management Supplements
Our three weight management supplements combine advanced weight loss promoting complexes withscientifically balanced nutrition and health enhancing soy protein. Our ingredients are designed to work together,along with proper diet and exercise, to turn unwanted fat into energy without sacrificing muscle mass.
• Slimplicity is a meal replacement intended for use in an overall program that includes proper diet andexercise and is focused on facilitating weight loss and developing healthier lifestyle choices.Slimplicity is currently available in the United States, France, Germany, Austria, the Netherlands,Ireland, the United Kingdom, the Philippines, Malaysia, and Singapore.
• Reliv Ultrim-Plus is designed as a meal replacement (for a maximum of two meals per day) for use ina weight loss program. Reliv Ultrim-Plus is only sold in Canada and Mexico. Reliv Ultrim-Plus is nolonger available in our other markets due to the introduction of our Slimplicity meal replacementproduct.
8
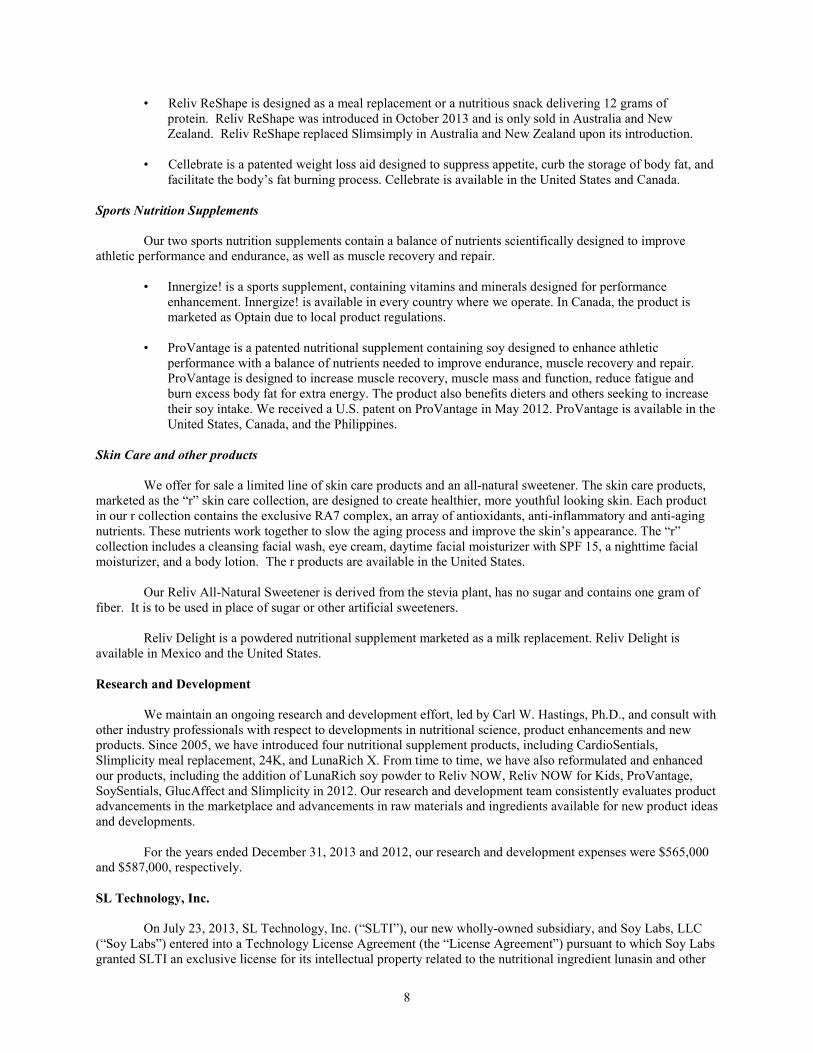
• Reliv ReShape is designed as a meal replacement or a nutritious snack delivering 12 grams ofprotein. Reliv ReShape was introduced in October 2013 and is only sold in Australia and NewZealand. Reliv ReShape replaced Slimsimply in Australia and New Zealand upon its introduction.
• Cellebrate is a patented weight loss aid designed to suppress appetite, curb the storage of body fat, andfacilitate the body’s fat burning process. Cellebrate is available in the United States and Canada.
Sports Nutrition Supplements
Our two sports nutrition supplements contain a balance of nutrients scientifically designed to improveathletic performance and endurance, as well as muscle recovery and repair.
• Innergize! is a sports supplement, containing vitamins and minerals designed for performanceenhancement. Innergize! is available in every country where we operate. In Canada, the product ismarketed as Optain due to local product regulations.
• ProVantage is a patented nutritional supplement containing soy designed to enhance athleticperformance with a balance of nutrients needed to improve endurance, muscle recovery and repair.ProVantage is designed to increase muscle recovery, muscle mass and function, reduce fatigue andburn excess body fat for extra energy. The product also benefits dieters and others seeking to increasetheir soy intake. We received a U.S. patent on ProVantage in May 2012. ProVantage is available in theUnited States, Canada, and the Philippines.
Skin Care and other products
We offer for sale a limited line of skin care products and an all-natural sweetener. The skin care products,marketed as the “r” skin care collection, are designed to create healthier, more youthful looking skin. Each productin our r collection contains the exclusive RA7 complex, an array of antioxidants, anti-inflammatory and anti-agingnutrients. These nutrients work together to slow the aging process and improve the skin’s appearance. The “r”collection includes a cleansing facial wash, eye cream, daytime facial moisturizer with SPF 15, a nighttime facialmoisturizer, and a body lotion. The r products are available in the United States.
Our Reliv All-Natural Sweetener is derived from the stevia plant, has no sugar and contains one gram offiber. It is to be used in place of sugar or other artificial sweeteners.
Reliv Delight is a powdered nutritional supplement marketed as a milk replacement. Reliv Delight isavailable in Mexico and the United States.
Research and Development
We maintain an ongoing research and development effort, led by Carl W. Hastings, Ph.D., and consult withother industry professionals with respect to developments in nutritional science, product enhancements and newproducts. Since 2005, we have introduced four nutritional supplement products, including CardioSentials,Slimplicity meal replacement, 24K, and LunaRich X. From time to time, we have also reformulated and enhancedour products, including the addition of LunaRich soy powder to Reliv NOW, Reliv NOW for Kids, ProVantage,SoySentials, GlucAffect and Slimplicity in 2012. Our research and development team consistently evaluates productadvancements in the marketplace and advancements in raw materials and ingredients available for new product ideasand developments.
For the years ended December 31, 2013 and 2012, our research and development expenses were $565,000and $587,000, respectively.
SL Technology, Inc.
On July 23, 2013, SL Technology, Inc. (“SLTI”), our new wholly-owned subsidiary, and Soy Labs, LLC(“Soy Labs”) entered into a Technology License Agreement (the “License Agreement”) pursuant to which Soy Labsgranted SLTI an exclusive license for its intellectual property related to the nutritional ingredient lunasin and other
9
soy-related peptides and proteins. The license covers an issued patent and several patent applications related tolunasin and soy-related peptides, proprietary information and manufacturing processes of Soy Labs. See Note 6 toour Consolidated Financial Statements for more information on the terms of the License Agreement.
SLTI has agreed to use reasonable commercial efforts to market the products covered by the LicenseAgreement. In addition, SLTI hired Soy Labs staff and we agreed, subject to certain conditions, to purchase all ofour requirements of lunasin from SLTI.
Network Marketing Program
General Overview
We market and sell our products through a network marketing system of independent distributors, whopurchase our products from us, or from other distributors, and who then sell our products directly to consumers. Inaddition to selling our products, our distributors also recruit others to distribute our products. Distributors receivecompensation from both the sale of the products they have purchased at wholesale and, in the case of MasterAffiliates and above, commissions on the volume of products sold by their downline organization. We believenetwork marketing is an effective way to distribute our products because it allows and relies on personal contact,education and endorsement of products which are not as readily available through other distribution channels.
We recognize that our sales growth is based on the continued development and growth of our independentdistributor force and we strive to maintain an active and motivated distributor network through a combination ofquality products, and a business opportunity with distributor discounts, commissions and bonus payments, salesconventions, training, personal recognition and a variety of publications and promotional materials.
Program Structure
Individuals who desire to market and sell our products may become distributors by being sponsored intothe program by an existing distributor, and becoming part of that distributor’s “downline.” We offer a tiereddiscount and commission, or royalty, format that consists of four principal levels and several sub-levels, which aredesigned to compensate and motivate distributors to increase their networks and sales volumes.
Our distributors consist principally of individuals, although we also permit entities such as corporations,partnerships, limited liability companies and trusts to become distributors. A new distributor is required to completea distributor application and, in most areas, to purchase a package of distributor materials (for $25 plus shipping inthe United States) consisting of a Distributor Guide and CD, business forms and promotional materials. TheDistributor Agreement, when accepted by us, becomes the contract between us and the distributor and obligates thedistributor to the terms of the agreement, which includes our Policies and Procedures for conduct of their business.All distributors are independent contractors and are not our employees.
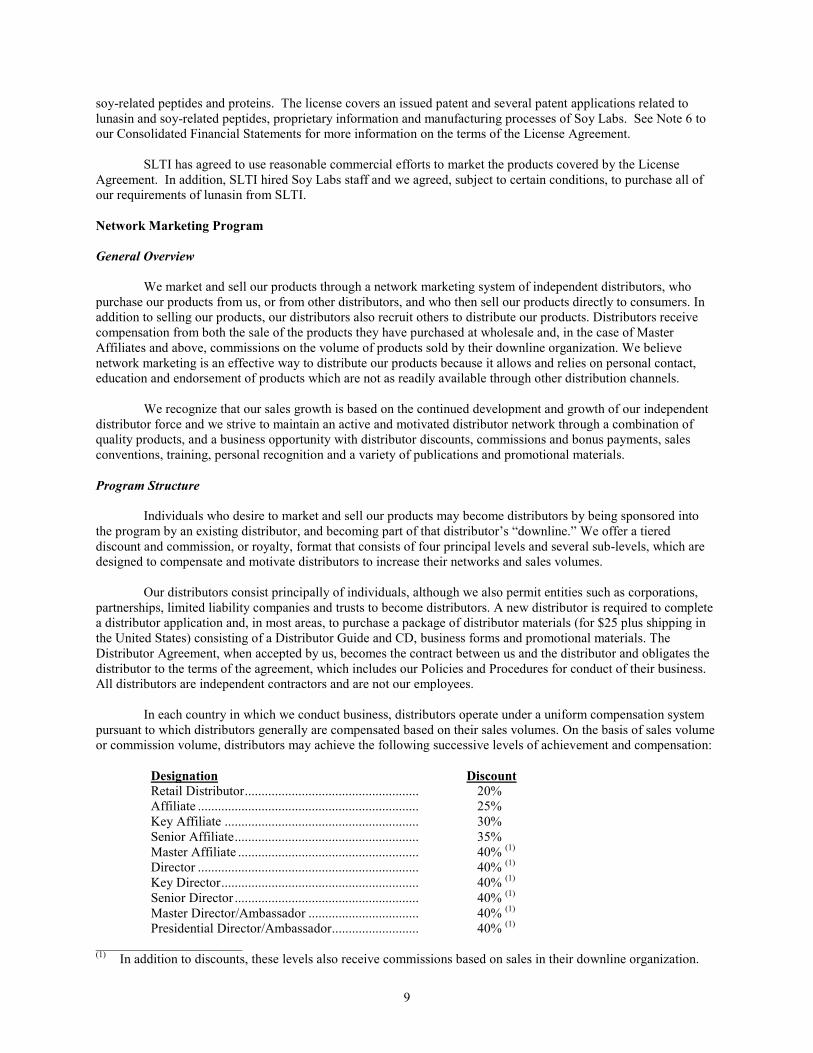
In each country in which we conduct business, distributors operate under a uniform compensation systempursuant to which distributors generally are compensated based on their sales volumes. On the basis of sales volumeor commission volume, distributors may achieve the following successive levels of achievement and compensation:
Designation DiscountRetail Distributor.................................................... 20%Affiliate .................................................................. 25%Key Affiliate .......................................................... 30%Senior Affiliate....................................................... 35%Master Affiliate ...................................................... 40% (1)
Director .................................................................. 40% (1)
Key Director........................................................... 40% (1)
Senior Director ....................................................... 40% (1)
Master Director/Ambassador ................................. 40% (1)
Presidential Director/Ambassador.......................... 40% (1)
______________________(1) In addition to discounts, these levels also receive commissions based on sales in their downline organization.
10
Distributors purchase products from us at a discount from the suggested retail price for the products andthen may sell the product at retail to customers, sell the product to other distributors at wholesale or consume theproduct. The amount of the discount varies depending on the distributor’s level of achievement, as indicated above.
Distributors generate income equal to the difference between the price at which they sell the product tocustomers and the discounted price they pay for the product. Distributors also earn wholesale commissions onproducts purchased by downline distributors in the distributor’s sponsored group equal to the difference between theprice at which the distributor is entitled to purchase product and the price at which downline distributors purchaseproduct. We calculate payments and issue a check directly to the qualified distributor once a month. For example,assume Distributor A is a 40% discount Master Affiliate who signs up Distributor B, a 30% discount Key Affiliate,who signs up Distributor C, a 20% discount Retail Distributor. If Distributor C purchases directly from us, a 10%wholesale profit check will be sent to Distributor A and B.
Upon achieving the level of Master Affiliate, distributors begin to receive additional compensation —“generation royalty” — payments of 8%, 6%, 4%, 3% and 2% of the retail volume of product purchased from us byMaster Affiliates and above (and their personal groups) whom they have sponsored, and for each of five downlinelevels of sponsorship. To qualify for these additional compensation payments, Master Affiliates and above arerequired to maintain certain monthly sales volumes.
Master Affiliates who sponsor other distributors that achieve the level of Master Affiliate are entitled tobecome part of the Director Program. Advancement at the Director level is based upon achieving increasing levelsof royalties based on sales generated by other distributors in the Director’s downline organization. Distributorsachieving each level receive recognition for their achievements at our company-sponsored events and in ourpublications. We also have a Star Director Program under which distributors achieving the level of Director andabove receive additional compensation based on the number of Master Affiliates they have sponsored into theprogram. Directors receive an additional 1% to 3% royalty on the retail sales volume of Master Affiliates in theirdownline organization for an unlimited number of levels of sponsorship, until reaching a level that includes a MasterAffiliate who also has achieved Star Director status.
Master Directors and Presidential Directors may also be invited to participate in the Ambassador Program.As of December 31, 2013, we had approximately 374 Ambassadors. Qualifications to be invited by us to participatein the Ambassador Program include demonstrated competence and leadership qualities. Ambassadors receiverecognition and awards for achieving Ambassador status and can then achieve additional levels of accomplishment.We utilize our Ambassadors to lead meetings and conferences, and to provide training and education to ourdistributors. Ambassadors achieving the level of Silver and higher also participate in the “Reliv Inner Circle,” whichmay entitle them to receive additional compensation, paid participation in our sponsored events, health insuranceand car allowances.
In addition to the levels of compensation described, we also provide a variety of incentives, bonuses,awards and trips to distributors who achieve high sales volumes and who advance in the distributor ranks.
Distributor Training, Motivation and Management
Our marketing efforts are focused on the development, training, motivation and support of our independentdistributors. We support an active training program for our distributors in which our representatives and experienceddistributors, usually Ambassadors, lead group training sessions. We provide distributors with manuals, brochuresand other promotional, training and informational publications. We encourage distributors to hold regular weeklyrecruiting meetings and training sessions. We sponsor weekly training conference calls in which a significantnumber of distributors participate.
Our sponsorship generally includes the following:
• During 2013, we sponsored numerous special events in cities across all of our markets led by corporateexecutives and/or experienced Ambassadors;
• For each market in which we operate, we sponsor an annual conference for distributors; and
11
• In the United States, we sponsor an annual International Conference in summer for all worldwidedistributors and a winter conference for U.S. distributors.
During 2013, we invested approximately $2.49 million in training, conferences and promotional events forour distributors worldwide compared with $2.59 million in 2012.
Distributor Compliance
Our distributor organization and business model are designed and intended to promote the sale of ourproducts to consumers by distributors. Sales training and promotional efforts emphasize that intention. To that end,we monitor purchases by distributors to identify potentially excessive individual purchases and keep detailedinformation regarding customer purchases through our corporate shopping cart and as part of our autoship program.Distributors are not required at any time to purchase product, although Master Affiliates and above are required tomaintain certain minimum sales levels in their personal groups to continue receiving generation royaltycompensation payments.
Distributors may create their own advertising provided that it is within our advertising rules. Unless adistributor is using our designed and approved advertisements, the distributor must submit for approval in writing alladvertising (e.g. brochures, flyers, audio tapes, classified or display ads, radio scripts) to our ComplianceDepartment before placing it or arranging for placement.
Pursuant to our Policies and Procedures, which are incorporated by reference into our DistributorAgreement, distributors are permitted to make only those claims about our products that have been approved by usand/or provided in sales and training materials. Distributors acknowledge that our products are not represented asdrugs and they are not authorized to make any diagnosis of any medical condition, make drug-type claims for, orprescribe our products to treat or cure, any disease or condition. We do not authorize or permit our distributors tomake any express or implied references with regard to our products that they cure, prevent or relieve disease, replaceor augment medication, provide therapy, promote healing, alleviate illnesses or symptoms of illnesses, or make anyother medical claims for specific ailments.
In order to comply with regulations that apply to both us and our distributors, we conduct considerableresearch into the applicable regulatory framework prior to entering any new market to identify all necessary licensesand approvals and applicable limitations on operations in that market. We devote substantial resources to obtainingthe necessary licenses and approvals and maintaining operations that are in compliance with the applicablelimitations. We also research laws applicable to distributor operations and revise or alter distributor materials andproducts, as required by applicable regulations in each market.
Regulations in existing and new markets often are ambiguous and subject to considerable interpretive andenforcement discretion by the responsible regulators. In addition, regulations affecting our business often changeand are subject to varying interpretation and application. We make every effort to monitor and comply with changesin laws and regulations as they occur.
We have a Compliance Department that receives and reviews allegations of distributor misconduct. If wedetermine that a distributor has violated our Policies and Procedures, we may take a number of disciplinary actions.For example, we may impose sanctions such as warnings or suspensions until specific conditions are satisfied, ortake other appropriate actions at our discretion, including termination of the distributor’s agreement.
Geographic Presence
Markets
We currently sell our products throughout the United States and in 14 other countries around the world. Wehave sold products in the United States since 1988 and sold our first product outside of the United States in 1991when we entered Australia. In 2013, approximately 21.3% of our net sales were generated outside of the UnitedStates.
12
The table below shows the countries in which we operate and the year we commenced selling products:
Country Year Entered Country Year EnteredUnited States 1988 Ireland 2003Australia 1991 Singapore 2004New Zealand 1992 Germany 2005Canada 1992 Austria 2006Mexico 1993 Netherlands 2006United Kingdom(1) 1995 Indonesia 2009Philippines 2000 France 2013Malaysia 2003
______________________
(1) Includes Great Britain, Scotland, Wales and Northern Ireland.
Within the United States, we sell our products to distributors in all 50 states. We derived 40.1% of ourdomestic net sales in 2013 in California, Pennsylvania, Illinois, Michigan, Texas, Ohio, and Florida, with each statecontributing at least 4% of net sales. We believe that there is the opportunity to increase the number of ourdistributors in all markets where we sell our products.
We organize all of our international operations under our wholly owned subsidiary, Reliv’ World. As ofDecember 31, 2013, Reliv’ World consisted of the following market-specific entities: Reliv’ Australia, Reliv’ NewZealand, Reliv’ Canada, Reliv’ Mexico, Reliv’ Europe, Reliv’ Philippines, Reliv’ Malaysia, Reliv’ Singapore, andPT Reliv’ Indonesia. We have utilized this method of separate corporations in most of our markets, as local businesslicensing and product approvals require a local legal entity.
We believe that there is a significant opportunity to increase sales in our current international markets, as awhole. We have established a uniform business model and compensation plan across all of our markets, and wecontinue to support our international markets with additional marketing programs and materials.
In addition to increasing sales in current international markets, our expansion strategy targets selected newforeign markets. Our presence in the UK, France, Germany, Austria and the Netherlands, as well as marketperformance, regional interest and distributor activity, have led to an increased focus on expansion in the EuropeanUnion. We opened for business in France in 2013 and are evaluating other expansion opportunities within theEuropean Union.
New Market Entry Process
We constantly evaluate new markets for our products. In order to do so, we perform an analysis ofsynergies between new and existing countries and distributor presence or interest in new markets, market conditions,regulatory conditions, product approval procedures and competition before selecting markets to enter. Once wedecide to enter a new market, we first hire local legal counsel and/or a consultant with appropriate expertise to:
• help ensure that our network marketing system and products comply with all applicable regulations;
• help establish favorable public relations in the new market by acting as an intermediary between us andlocal regulatory authorities, public officials and business people; and
• explain our products and product ingredients to appropriate regulators and, when necessary, to arrangefor local technicians to conduct required ingredient analysis tests of the products.
Where regulatory approval in a foreign market is required, local counsel and/or consultants work withregulatory agencies to confirm that all of the ingredients in our products are permissible within the new market.Where reformulation of one or more of our products is required, we attempt to obtain substitute or replacementingredients. During the regulatory compliance process, we may alter the formulation, packaging, branding orlabeling of our products to conform to applicable regulations as well as local variations in customs and consumer
13
habits, and we may modify some aspects of our network marketing system as necessary to comply with applicableregulations.
Following completion of the regulatory compliance phase, we undertake the steps necessary to meet theoperations requirements of the new market. In the majority of our new markets, we establish a sales center in amajor city and provide for product purchases by telephone and/or pick up. Product is shipped to the purchaser froma warehouse located in the general geographic market or the distributor may walk in to the local office and purchaseproducts, if a pick up center is available. In addition, we initiate plans to satisfy inventory, personnel andtransportation requirements of the new market, and we modify our distributor materials, recordings, videos and othertraining materials as necessary to be suitable for the new market.
In some countries, regulations applicable to the activities of our distributors also may affect our businessbecause in some countries we are, or regulators may assert that we are, responsible for our distributors’ conduct. Inthese countries, regulators may request or require that we take steps to ensure that our distributors comply with localregulations.
Manufacturing
We established a manufacturing line at our headquarters facility in Chesterfield, Missouri and began tomanufacture all of our nutritional supplements in early 1993. We expanded our Chesterfield facility in 1997 to nowinclude 126,000 square feet of total space. At this facility, we manufacture all of our powdered nutritionalsupplements for distribution both domestically and internationally. Our 24K and LunaRich X capsules aremanufactured by a third party, as well as our skin care line.
Our ability to manufacture our powdered nutritional supplements is a competitive advantage overcompetitors not engaged in manufacturing and contributes to our ability to provide high-quality products. Ourproduct manufacturing includes identifying suppliers of raw materials, acquiring the finest quality raw materials,blending exact amounts of raw materials into batches, and canning and labeling the finished products. Since wecarefully select our ingredient suppliers, we are able to control the quality of raw materials and our finishedproducts. We have not experienced any significant difficulty in obtaining supplies of raw materials for ournutritional supplements or finished product of our 24K or LunaRich X. By monitoring and testing products at allstages of the manufacturing process, we precisely control product composition. In addition, we can control costs bymanufacturing our own powdered nutritional supplements.
In 1996, we received approval from the Australian Therapeutic Goods Administration, or TGA, tomanufacture products sold in Australia at our Chesterfield plant. The certification of our Chesterfield site by theAustralian TGA also satisfied Canadian requirements. In 2013, our Chesterfield plant was audited by the AustralianTGA. Our current certification is valid until May 2014 and we expect to be re-certified for an additional three yearsbased on the recently completed TGA audit.
Fulfillment
Distributors order product in case lots of individual quantities and pay for the goods prior to shipment. Weoffer our Direct Advantage for distributors and their retail customers to order product in less than case lots directlyfrom us by phone. Direct Advantage, an automatic monthly reorder program available for distributors andcustomers, provides a simple and convenient ordering process for consumers as well as distributors wanting tosatisfy maintenance requirements. Product is shipped directly to the distributor or customer and upline distributorsearn wholesale profits or, if applicable, a commission on all Direct Advantage sales.
In the United States, our products are warehoused at our Chesterfield facility and shipped by commoncarrier to distributors upon order. Our facility in Chesterfield, Missouri serves all parts of the country. Our productsare also warehoused in, and shipped to local distributors from: Sydney, Australia; Auckland, New Zealand;Oakville, Canada; Guadalajara, Mexico; Redditch (Birmingham) England; Makati (Manila), Philippines; SubangJaya (Kuala Lumpur), Malaysia; Singapore; and Jakarta, Indonesia. With the exception of our Canada, NewZealand, and Singapore subsidiaries, each of our subsidiaries maintains an office and personnel to receive, record,and fill orders from distributors. Distributors in Ireland, France, Germany, Austria, and the Netherlands order andreceive product from our UK-based subsidiary.
14
We maintain a policy that unused product may be returned by a customer to the selling distributor for a fullrefund or exchange within 30 days after purchase. We also maintain a policy that any distributor who terminates hisor her distributorship may return saleable product which was purchased from us within twelve months of thetermination for a refund of 90% of the purchase price less any compensation received relating to the purchase of theproducts. We believe this buyback policy addresses and satisfies a number of regulatory compliance issuespertaining to network marketing systems.
Historically, product returns and buy backs have not been significant. Product returns and buy backs havebeen approximately 0.57% and 0.48% of net sales in 2013 and 2012, respectively.
Information Technology Systems
In order to facilitate growth in the future and support our distributor activities, we continually upgrade ourmanagement information and telecommunication systems, along with increasing our internet-based capabilities.These systems include: (1) a centralized host computer in our Chesterfield headquarters, which is linked to ourinternational offices via secure data connections that provide real-time order entry and information to respond todistributor inquiries, as well as financial and inventory management systems; (2) local area networks of personalcomputers within our markets, serving our local administrative staffs; (3) an international e-mail system throughwhich our employees communicate; and (4) internet capabilities that provide a variety of online services todistributors, including product ordering, product information, event information and other related announcements,and tools to assist distributor leaders in managing their downline distributor group. We continue to pursue initiativesto increase the percentage of distributor orders placed via the internet. To accomplish this goal, we continue to makeimprovements to our shopping cart platform, and we have run periodic incentives to encourage distributors to placetheir orders via the internet. As a result of these initiatives, approximately 50% of our order volume in the UnitedStates is placed via internet.
These systems are designed to provide financial and operating data for management, timely and accurateproduct ordering, generation royalty payment calculation and processing, inventory management, and detaileddistributor records. We intend to continue to invest in our systems in order to help meet our business strategies.
Intellectual Property
Our formulas are protected as trade secrets and, to the extent necessary, by confidentiality agreements. Inaddition, we have obtained U.S. patents on seven products as set forth below:
Product Patent Expiration Date
FibRestore June 2014Cellebrate June 2015Arthaffect March 2018ReversAge May 2021ProVantage April 2025GlucAffect November 202924K February 2032
Currently, we have 22 trademarks registered with the U.S. Patent and Trademark Office, or USPTO,including Reliv and the names of 14 of our 18 nutritional products. Reliv NOW for Kids, 24K, LunaRich X andReShape are not registered with the USPTO. Trademark registrations for selected marks have been issued or appliedfor in Australia, New Zealand, Canada, Mexico, the United Kingdom, Ireland, the Philippines, Malaysia, Singapore,Germany and several other foreign countries that offer network marketing opportunities. We consider ourtrademarks to be an important asset of our business.

15
Regulation
Product Regulation
The formulation, manufacturing, labeling and advertising or promotion of our products are subject toregulation by the Food and Drug Administration, or FDA, which regulates our products under the federal Food,Drug and Cosmetic Act, or FDCA, the Federal Trade Commission, or FTC, and various agencies of the states orcountries into which our products are shipped or sold. FDA regulations include requirements and limitations withrespect to the labeling of our food and cosmetic products and also with respect to the formulation of those products.FDA regulations also limit and control the extent to which health or other claims can be made with respect to theefficacy of any food or cosmetic. The FDCA has been amended several times with respect to dietary supplements,most recently by the Nutrition Labeling and Education Act of 1990, or NLEA, and the Dietary Supplement Healthand Education Act of 1994, or DSHEA, and related regulations. Such legislation governs the formulation,manufacturing, marketing and sale of nutritional supplements, including the content and presentation of health-related information included on the labels or labeling of nutritional supplements.
The majority of the products we market are classified as dietary supplements under the FDCA. Dietarysupplements such as those we manufacture and sell, for which no “drug” claim is made, are not subject to FDAapproval prior to their sale. However, DSHEA established a pre-market notification process for dietary supplementsthat contain a “new dietary ingredient,” or NDI, a term that is defined as “a dietary ingredient that was not marketedin the United States before October 15, 1994,” the date on which DSHEA was signed into law. Certain NDIs thathave been “present in the food supply” are exempt from the notification requirement. For those NDIs that are notexempt, DSHEA requires the manufacturer or distributor of a dietary supplement containing an NDI to submit to theFDA, at least 75 days prior to marketing, a notification containing the basis for concluding that the dietarysupplement containing the NDI will “reasonably be expected to be safe.” Dietary supplement products can beremoved from the market if shown to be unsafe, or if the FDA determines, based on the labeling of products, that theintended use of the product is for the diagnosis, cure, mitigation, treatment or prevention of disease. The FDA canregulate those products as “drugs” and require premarket approval of a “new drug application.” Manufacturers ofdietary supplements that make any claims for dietary supplements, including product performance and health benefitclaims, must have substantiation that the statements are truthful and not misleading.
In January 2000, the FDA published a final rule that defines the types of statements that can be madeconcerning the effect of a dietary supplement on the structure or function of the body pursuant to the DSHEA.Under the DSHEA, dietary supplement labeling may bear “structure/function” claims, which are claims that theproducts affect the structure or function of the body, without prior FDA approval. They may not, without prior FDAapproval, bear a claim that they can prevent, treat, cure, mitigate or diagnose disease, otherwise known as a “drugclaim.” The final rule describes how the FDA will distinguish drug claims from structure/function claims. Dietarysupplements, like conventional foods, are also permitted to make “health claims,” which are claims that are exemptfrom regulation as “drug” claims pursuant to the amendments to the FDCA established by the NLEA in 1990. A“health claim” is a claim, ordinarily approved by FDA regulation, on a food or dietary supplement product’slabeling that “characterizes the relationship of any substance to a disease or health-related condition.” To help assurethat foods, dietary supplements and cosmetics comply with the provisions of the FDCA and FDA’s regulations, theFDA has numerous enforcement tools, including the ability to issue warning letters, initiate product seizures andinjunctions and pursue criminal penalties.
The manufacture of dietary supplements is subject to existing FDA current good manufacturing practice, orcGMP, regulations for food. In June 2007, the FDA issued regulations relating to more detailed cGMP specificallyfor dietary supplements. Under these regulations, we qualify as a small business and became subject to theregulations in June 2009. In September 2009 and in February 2011 our Chesterfield plant was audited by the FDA.We received no notice of deviations from cGMP on Form 483 as a result of those audits. We believe our systemsand facilities in Chesterfield are in full compliance with cGMP.
Advertisements for our products are subject to regulation by the FTC. The FTC prohibits unfair methods ofcompetition and unfair or deceptive acts or practices in or affecting commerce and provides that the dissemination ofany false advertisement pertaining to drugs, cosmetics or foods, including dietary supplements, is an unfair ordeceptive practice. Under the FTC’s substantiation doctrine, an advertiser must have a “reasonable basis” for allclaims made about a product. The failure to be able to adequately substantiate claims may be considered either
16
deceptive or unfair practices. In order to avoid a violation of the FTC standards, we endeavor to assure that we haveadequate substantiation for all advertising claims made for our products. In addition, the FTC has increased itsscrutiny of the use of distributor testimonials. Although it is impossible for us to monitor all the product claimsmade by our independent distributors, we make efforts to monitor distributor testimonials and restrict inappropriatedistributor claims. The FTC has been more aggressive in pursuing enforcement against dietary supplement productssince the passage of DSHEA in 1994, and has brought numerous actions against dietary supplement companies,some resulting in several million dollar civil penalties and/or restitution as well as court-ordered injunctions.
We are aware that, in some of our international markets, there has been recent adverse publicity concerningproducts that contain substances generally referred to as “genetically modified organisms,” or GMOs. In somemarkets, the possibility of health risks thought to be associated with GMOs has prompted proposed or actualgovernmental regulation. When necessary, we have responded to government regulations that forbid productscontaining GMOs by changing certain unacceptable ingredients to non-GMO substitutes. Some of our products incertain markets still contain substances that would be or might be classified as GMOs. We cannot anticipate theextent to which future regulations in these markets will restrict the use of GMOs in our products or the impact of anyregulations on our business in those markets. In response to any applicable future regulations, we intend toreformulate our products to satisfy the regulations. Compliance with regulatory requirements in this area should nothave a material adverse effect on our business.
Sales Program Regulation
Our distribution and sales program is subject to regulation by the FTC and other federal and state regulationas well as regulations in several countries in which we conduct business. Various state agencies regulate multi-leveldistribution services. We are required to register with, and submit information to, certain of such agencies and webelieve we have complied fully with such requirements. We actively strive to comply with all applicable state andfederal laws and regulations affecting our products and our sales and distribution programs. The Attorneys Generalof several states have taken an active role in investigating and prosecuting companies whose compensation plansthey claim violate local anti-pyramid and/or consumer protection statutes. We are unable to predict the effect suchincreased activity will have on our business in the future nor are we able to predict the probability of future laws,regulations or interpretations which may be passed by state or federal regulatory authorities.
Federal and state laws directed at network marketing programs have been adopted throughout the years toprevent the use of fraudulent practices often characterized as “pyramid schemes.” Illegal pyramid schemescompensate participants primarily for the introduction or enrollment of additional participants into the program.Often these schemes are characterized by large up-front entry or sign-up fees, over-priced products of low value,little or no emphasis on the sale or use of products, high-pressure recruiting tactics and claims of huge and quickfinancial rewards with little or no effort. Generally, these laws are directed at ensuring that product sales ultimatelyare made to consumers and that advancement within such sales organizations is based on sales of products.
We believe that our network marketing system satisfies the standards and case law defining a legalmarketing system. It is an ongoing part of our business to monitor and respond to regulatory and legaldevelopments, including those that may affect our network marketing system. However, the regulatory and legalrequirements concerning network marketing systems do not include “bright line” rules and are inherently fact-based.
Competition
The business of developing and distributing nutritional and skin care products such as those we offer ishighly competitive. Numerous manufacturers, distributors and retailers compete for consumers and, in the case ofother network marketing companies, for distributors. Our competitors include both network marketing companiessuch as Alticor Inc. (Amway Corp.), Avon Products Inc., Herbalife Ltd., Mary Kay Inc., Melaleuca, Inc.,Mannatech, Inc., Nature’s Sunshine Products Inc., NuSkin Enterprises Inc. and USANA Health Sciences Inc., aswell as specialty and mass retail establishments. Our ability to remain competitive depends on the underlyingscience and high quality of our products and our success in recruiting and retaining distributors. The pool ofindividuals interested in network marketing tends to be limited in each market and may be reduced to the extentother network marketing companies successfully recruit these individuals into their businesses. We believe that weoffer a rewarding compensation plan with attractive financial benefits to compete for the time, attention andcommitment of distributors. Our compensation plan is seamless, permitting international expansion.
17
Reliv NOW and Reliv Classic compete with numerous supplements that offer multi-vitamin benefits. TheReliv Ultrim-Plus, Slimplicity, ReShape and Cellebrate products compete with other products in the weight lossmarket, including nationally advertised products such as SlimFast. Many companies have entered, or have plans toenter, the sports drink market in which Innergize! and ProVantage compete, a market led by Gatorade. 24Kcompetes with 5-Hour Energy and numerous other liquid energy shots and drinks. With Arthaffect, FibRestore,ReversAge, GlucAffect, CardioSentials, SoySentials, LunaRich X and our skin care products, we are in the specificwellness needs, food and anti-aging markets, which are extremely competitive and led by the major food and skincare companies.
Employees
As of December 31, 2013, we and all of our subsidiaries had approximately 208 full-time employeescompared with 214 such employees at the end of 2012.
Additional Available Information
We make available, free of charge, copies of our annual reports on Form 10-K, quarterly reports on Form10-Q, current reports on Form 8-K, and all amendments to these reports as soon as reasonably practicable after suchmaterial is electronically filed with, or furnished to the SEC pursuant to Section 13(a) or 15(d) of the Exchange Act.This information is available on our corporate web site at www.reliv.com under the “Investor Relations” section.This information may also be obtained from the SEC’s on-line database located at www.sec.gov.
Item No. 2 – Properties
We own approximately six acres of land and a building containing approximately 126,000 square feet ofoffice, manufacturing and warehouse space located in Chesterfield, Missouri, where we maintain our corporateheadquarters and sole manufacturing facility. We believe that our worldwide facilities are suitable and adequate inrelation to our present and immediate future needs.
The following table summarizes information related to our worldwide facilities as of March 1, 2014:
Location Nature of Use Square Feet Owned/Leased
Chesterfield, MO, USA corporate headquarters/callcenter/manufacturing/warehouse
126,000 Owned
Seven Hills (Sydney), Australia central office/warehouse/distribution
5,740 Leased
Oakville, Ontario, Canada warehouse/distribution 2,100 LeasedGuadalajara, Mexico central office/warehouse/call center 3,120 LeasedMakati City (Manila), Philippines central office/
warehouse/distribution2,700 Leased
Redditch (Birmingham), England,UK
central office/warehouse/distribution
11,500 Leased
Subang Jaya (Kuala Lumpur),Malaysia
central office/call center 1,200 Leased
Jakarta, Indonesia central office/warehouse/distribution
1,600 Leased

18
Item No. 3 - Legal Proceedings
From time to time, we are involved in litigation incidental to the conduct of our business. We do notbelieve that any current proceedings will have a material adverse effect on our business, financial condition,results of operations or cash flows.
Item No. 4 – Mine Safety Disclosures
Not applicable.
PART II
Item No. 5 - Market for Registrant’s Common Equity, Related Stockholder Matters and Issuer Purchases ofEquity Securities
Our common stock is listed on the NASDAQ Global Select Market under the symbol: RELV. Thefollowing table sets forth the high and low sales prices of our common stock and the quarterly dividends per sharepaid on our common stock during the years ended December 31, 2013 and 2012.
High Low Dividend
Year Ending December 31, 2013Fourth Quarter $ 3.50 $ 2.11 $ 0.01Third Quarter 3.98 1.25 -Second Quarter 1.44 1.23 0.02First Quarter 1.40 1.15 -
Year Ending December 31, 2012Fourth Quarter $ 1.49 $ 1.20 $ 0.01Third Quarter 1.75 1.20 -Second Quarter 1.88 1.16 0.02First Quarter 1.70 1.14 -
As of March 3, 2014, there were approximately 1,611 holders of record of our common stock and anadditional 3,167 beneficial owners, including shares of common stock held in street name.
19
Item No. 7 - Management’s Discussion and Analysis of Financial Condition and Results of Operations
The following discussion and analysis of our financial condition and results of operations should be read inconjunction with our financial statements and related notes included elsewhere in this Annual Report on Form 10-K. The following discussion and analysis discusses the financial condition and results of our operations on aconsolidated basis, unless otherwise indicated.
Overview
We are a developer, manufacturer and marketer of a proprietary line of nutritional supplements addressingbasic nutrition, specific wellness needs, weight management and sports nutrition. We also offer a line of skin careproducts and an all-natural sweetener. We sell our products through an international network marketing systemutilizing independent distributors. Sales in the United States represented approximately 78.7% of worldwide netsales for the year ended December 31, 2013 compared to approximately 78.3% for the year ended December 31,2012. Our international operations currently generate sales through distributor networks with facilities in Australia,Canada, Indonesia, Malaysia, Mexico, the Philippines, and the United Kingdom. We also operate on a limited basisin Ireland, France, Germany, Austria and the Netherlands from our United Kingdom distribution center, in NewZealand from our Australia office, and in Singapore from our Malaysia office.
We derive our revenues principally through product sales made by our global independent distributor base,which, as of December 31, 2013, consisted of approximately 53,070 distributors. Our sales can be affected byseveral factors, including our ability to attract new distributors and retain our existing distributor base, our ability toproperly train and motivate our distributor base and our ability to develop new products and successfully maintainour current product line.
All of our sales to distributors outside the United States are made in the respective local currency;therefore, our earnings and cash flows are subject to fluctuations due to changes in foreign currency rates ascompared to the U.S. dollar. As a result, exchange rate fluctuations may have an effect on sales and gross margins.Accounting practices require that our results from operations be converted to U.S. dollars for reporting purposes.Consequently, our reported earnings may be significantly affected by fluctuations in currency exchange rates,generally increasing with a weaker U.S. dollar and decreasing with a strengthening U.S. dollar. Productsmanufactured by us for sale to our foreign subsidiaries are transacted in U.S. dollars. From time to time, we enterinto foreign exchange forward contracts to mitigate our foreign currency exchange risk.
Components of Net Sales and Expense
Product sales represent the actual product purchase price typically paid by our distributors, after givingeffect to distributor allowances, which can range from 20% to 40% of suggested retail price, depending on the rankof a particular distributor. Handling and freight income represents the amounts billed to distributors for shippingcosts. We record net sales and the related commission expense when the merchandise is shipped.
Our primary expenses include cost of products sold, distributor royalties and commissions and selling,general and administrative expenses.
Cost of products sold primarily consists of expenses related to raw materials, labor, quality control andoverhead directly associated with production of our products and sales materials, as well as shipping costs relating tothe shipment of products to distributors, and duties and taxes associated with product exports. Cost of products soldis impacted by the cost of the ingredients used in our products, the cost of shipping distributors’ orders, along withour efficiency in managing the production of our products.
Distributor royalties and commissions are monthly payments made to distributors, based on products soldin their downline organization. Based on our distributor agreements, these expenses typically approximate 23% ofsales at suggested retail. In the United States, effective March 1, 2013, we implemented a retail price increase,offset by a reduced shipping charge. After the price change, wholesale pricing discounts on distributor orders arebased on the retail value of the product. Distributor royalties and commissions are paid on an amount referred to asthe business value (“BV”), which was generally equal to the retail price of each product prior to the price increase.Also, we include other sales leadership bonuses, such as Ambassador bonuses, within this caption. Overall,
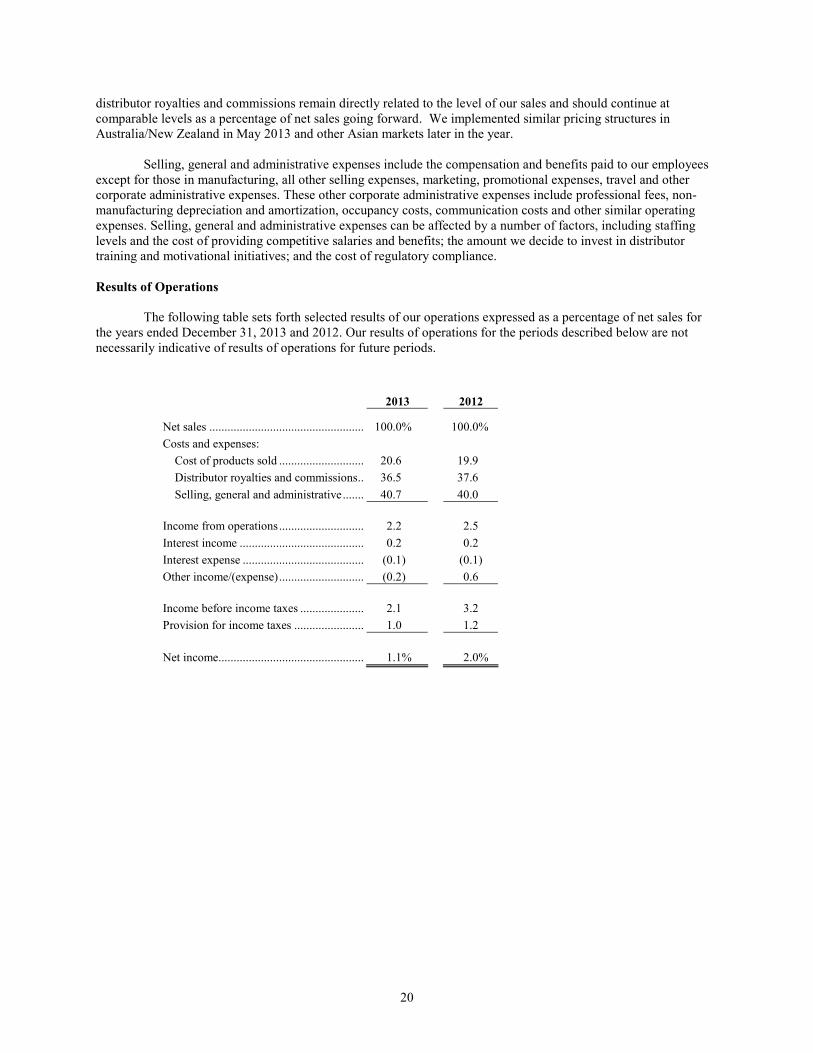
20
distributor royalties and commissions remain directly related to the level of our sales and should continue atcomparable levels as a percentage of net sales going forward. We implemented similar pricing structures inAustralia/New Zealand in May 2013 and other Asian markets later in the year.
Selling, general and administrative expenses include the compensation and benefits paid to our employeesexcept for those in manufacturing, all other selling expenses, marketing, promotional expenses, travel and othercorporate administrative expenses. These other corporate administrative expenses include professional fees, non-manufacturing depreciation and amortization, occupancy costs, communication costs and other similar operatingexpenses. Selling, general and administrative expenses can be affected by a number of factors, including staffinglevels and the cost of providing competitive salaries and benefits; the amount we decide to invest in distributortraining and motivational initiatives; and the cost of regulatory compliance.
Results of Operations
The following table sets forth selected results of our operations expressed as a percentage of net sales forthe years ended December 31, 2013 and 2012. Our results of operations for the periods described below are notnecessarily indicative of results of operations for future periods.
2013 2012
Net sales ................................................... 100.0% 100.0%
Costs and expenses:
Cost of products sold ............................ 20.6 19.9
Distributor royalties and commissions.. 36.5 37.6
Selling, general and administrative....... 40.7 40.0
Income from operations............................ 2.2 2.5
Interest income ......................................... 0.2 0.2
Interest expense ........................................ (0.1) (0.1)
Other income/(expense)............................ (0.2) 0.6
Income before income taxes ..................... 2.1 3.2
Provision for income taxes ....................... 1.0 1.2
Net income................................................ 1.1% 2.0%
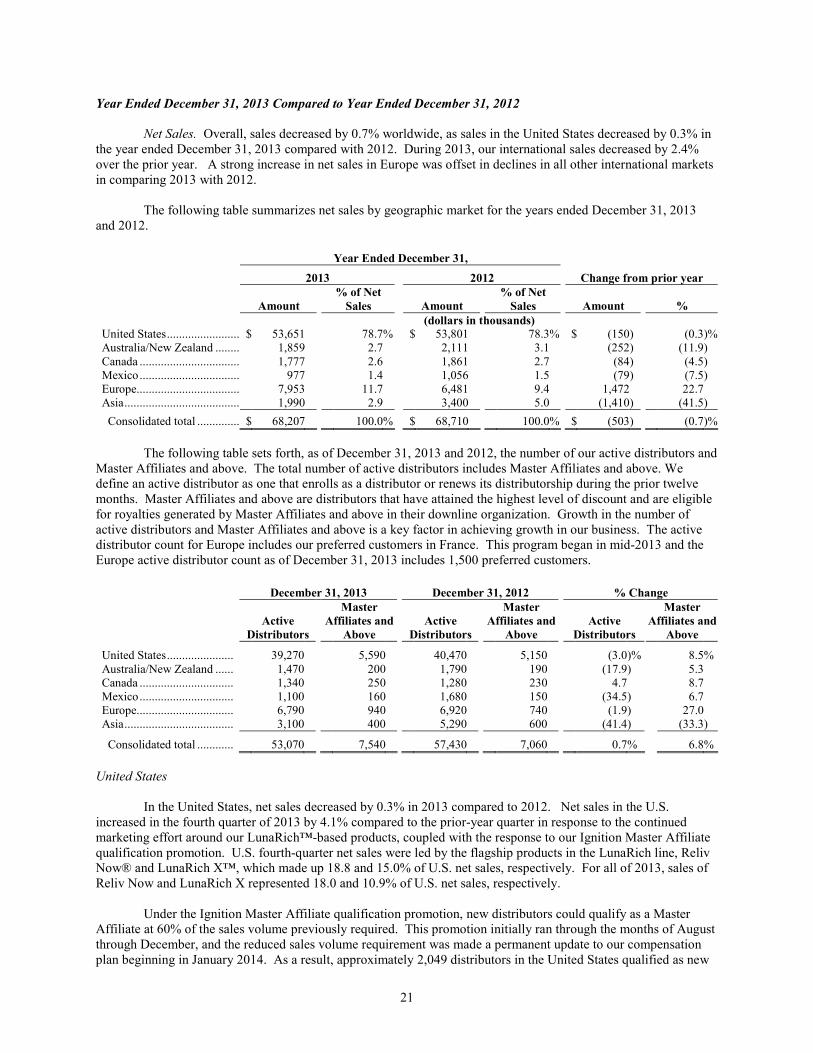
21
Year Ended December 31, 2013 Compared to Year Ended December 31, 2012
Net Sales. Overall, sales decreased by 0.7% worldwide, as sales in the United States decreased by 0.3% inthe year ended December 31, 2013 compared with 2012. During 2013, our international sales decreased by 2.4%over the prior year. A strong increase in net sales in Europe was offset in declines in all other international marketsin comparing 2013 with 2012.
The following table summarizes net sales by geographic market for the years ended December 31, 2013and 2012.
Year Ended December 31,
2013 2012 Change from prior year
Amount% of Net
Sales Amount% of Net
Sales Amount %(dollars in thousands)
United States........................ $ 53,651 78.7% $ 53,801 78.3% $ (150) (0.3)%Australia/New Zealand ........ 1,859 2.7 2,111 3.1 (252) (11.9)Canada ................................. 1,777 2.6 1,861 2.7 (84) (4.5)Mexico................................. 977 1.4 1,056 1.5 (79) (7.5)Europe.................................. 7,953 11.7 6,481 9.4 1,472 22.7Asia...................................... 1,990 2.9 3,400 5.0 (1,410) (41.5)
Consolidated total .............. $ 68,207 100.0% $ 68,710 100.0% $ (503) (0.7)%
The following table sets forth, as of December 31, 2013 and 2012, the number of our active distributors andMaster Affiliates and above. The total number of active distributors includes Master Affiliates and above. Wedefine an active distributor as one that enrolls as a distributor or renews its distributorship during the prior twelvemonths. Master Affiliates and above are distributors that have attained the highest level of discount and are eligiblefor royalties generated by Master Affiliates and above in their downline organization. Growth in the number ofactive distributors and Master Affiliates and above is a key factor in achieving growth in our business. The activedistributor count for Europe includes our preferred customers in France. This program began in mid-2013 and theEurope active distributor count as of December 31, 2013 includes 1,500 preferred customers.
December 31, 2013 December 31, 2012 % Change
ActiveDistributors
MasterAffiliates and
AboveActive
Distributors
MasterAffiliates and
AboveActive
Distributors
MasterAffiliates and
Above
United States...................... 39,270 5,590 40,470 5,150 (3.0)% 8.5%Australia/New Zealand ...... 1,470 200 1,790 190 (17.9) 5.3Canada ............................... 1,340 250 1,280 230 4.7 8.7Mexico............................... 1,100 160 1,680 150 (34.5) 6.7Europe................................ 6,790 940 6,920 740 (1.9) 27.0Asia.................................... 3,100 400 5,290 600 (41.4) (33.3)
Consolidated total ............ 53,070 7,540 57,430 7,060 0.7% 6.8%
United States
In the United States, net sales decreased by 0.3% in 2013 compared to 2012. Net sales in the U.S.increased in the fourth quarter of 2013 by 4.1% compared to the prior-year quarter in response to the continuedmarketing effort around our LunaRich™-based products, coupled with the response to our Ignition Master Affiliatequalification promotion. U.S. fourth-quarter net sales were led by the flagship products in the LunaRich line, RelivNow® and LunaRich X™, which made up 18.8 and 15.0% of U.S. net sales, respectively. For all of 2013, sales ofReliv Now and LunaRich X represented 18.0 and 10.9% of U.S. net sales, respectively.
Under the Ignition Master Affiliate qualification promotion, new distributors could qualify as a MasterAffiliate at 60% of the sales volume previously required. This promotion initially ran through the months of Augustthrough December, and the reduced sales volume requirement was made a permanent update to our compensationplan beginning in January 2014. As a result, approximately 2,049 distributors in the United States qualified as new

22
Master Affiliates in 2013 and 68.8% of the Master Affiliates and above as of December 31, 2012 re-qualified asMaster Affiliates and above during 2013. This compares with approximately 1,331 new Master Affiliates and arequalification rate of 62.8% in 2012. The number of Master Affiliates and above as of December 31, 2013increased by 8.5%, compared with the number as of December 31, 2012.
The net number of active Distributors in the United States as of December 31, 2013 decreased by 3.0% to39,270, compared with the number of active Distributors as of December 31, 2012. In 2013, new distributorenrollments decreased slightly, offset by an improvement in the distributor retention rate. During 2013,approximately 11,130 new distributors were enrolled, compared to 11,748 new distributor enrollments in 2012, adecrease of 5.3%. Distributor retention in the United States improved to approximately 68.2% for 2013 comparedwith a rate of 66.5% for 2012. Distributor retention is determined by the percentage of active distributors from 2012that renewed their distributorships in 2013.
In the United States during 2013, we processed approximately 204,000 orders for products at an averageorder of $362 at suggested retail. In 2012, we processed approximately 217,000 product orders at an average orderof $327 at suggested retail. The increase in the average order amount is attributable to the price increase earlier in2013 coupled with the MA qualification promotion, offset by the decline in the number of orders processed, whichis attributable to the decline in the active distributor base.
In addition to the changes to distributor pricing and freight charges in March 2013, our efforts to increasedistributor activity and ordering in the United States is focused on product innovation. We have continued ourproduct developments on our LunaRich-based products. In January 2013, we launched our latest product, LunaRichX, and a new points-based LunaRich wellness system. LunaRich X is a capsule sold in 30- and 120-count bottlesand contains the most concentrated form of lunasin currently available. Lunasin is the peptide scientists haveidentified as the key to many of soy’s documented health benefits.
In July 2013, we entered into a Technology License Agreement (“TLA”), through a newly-formed, wholly-owned subsidiary, SL Technology, Inc., with Soy Labs, LLC to secure exclusive rights to certain intellectualproperty related to lunasin. The license covers an issued patent and several patent applications related to lunasin andsoy-related peptides, proprietary information, and manufacturing processes of Soy Labs, LLC. This transaction isdescribed in further detail in Note 6 to the Consolidated Financial Statements.
International Operations
During the year ended December 31, 2013, net sales in our international operations decreased in aggregateby 2.4% to $14.56 million compared to $14.91 million for the year ended December 31, 2012. Net sales in Europewere up significantly in 2013 but were offset by varying levels of decline in all other international markets.Currency exchange rates in our foreign markets weakened in the aggregate in 2013. When net sales for the full yearof 2013 are converted using the 2012 exchange rate for both 2013 and 2012, international net sales decreased by0.8% for 2013 compared to the prior year. The average exchange rate for the U.S. dollar for all of 2013 wasstronger versus the currencies in which we conduct business, except for the New Zealand dollar, Mexican peso, andthe Euro when compared with the average exchange rates for all of 2012.
Net sales in the Australia/New Zealand market decreased by 11.9% in 2013 compared with 2012.Excluding the impact of exchange rate fluctuation, net sales in this market decreased by 7.4%. Sales results in thismarket are negatively impacted by a decline in distributor activity, as shown by a decline in new distributorenrollments and order count. New distributor enrollments were 263 in 2013 compared to 476 in 2012. In 2013,approximately 8,236 orders were placed compared to 7,500 in 2012. New Master Affiliate qualifications decreasedin 2013 as 52 distributors qualified as new Master Affiliates, compared with 103 in the prior year. In May 2013, weimplemented pricing and freight charge changes similar to those introduced in the United States, along with apreferred customer program and other initiatives. The net loss for the Australia/New Zealand market was $99,000 in2013, compared to a net income of $19,000 in 2012. In addition to the impact of the decline in sales on profitability,our selling, general and administrative expenses increased by $64,000 as we hired a new regional sales manager inlate 2012.
Net sales in Canada decreased by 4.5% in 2013 compared with 2012. Excluding the impact of exchangerate fluctuation, Canadian net sales decreased by 1.7% in 2013 compared with 2012. In 2013, 109 distributors
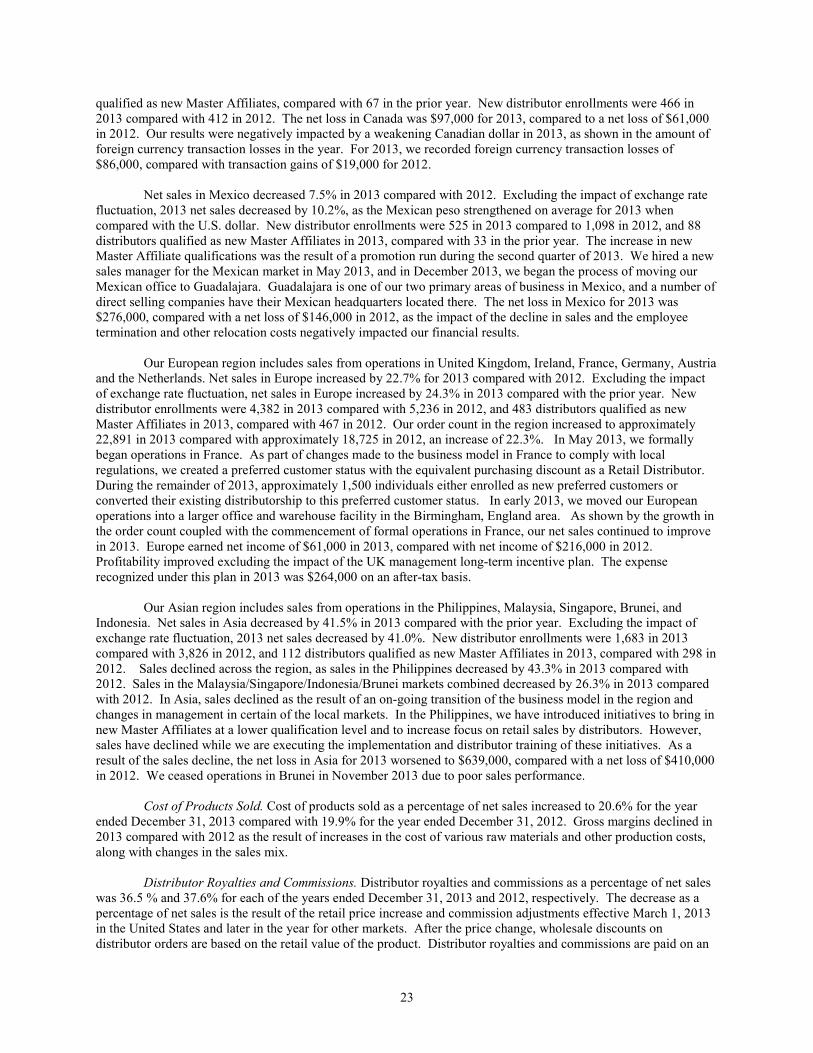
23
qualified as new Master Affiliates, compared with 67 in the prior year. New distributor enrollments were 466 in2013 compared with 412 in 2012. The net loss in Canada was $97,000 for 2013, compared to a net loss of $61,000in 2012. Our results were negatively impacted by a weakening Canadian dollar in 2013, as shown in the amount offoreign currency transaction losses in the year. For 2013, we recorded foreign currency transaction losses of$86,000, compared with transaction gains of $19,000 for 2012.
Net sales in Mexico decreased 7.5% in 2013 compared with 2012. Excluding the impact of exchange ratefluctuation, 2013 net sales decreased by 10.2%, as the Mexican peso strengthened on average for 2013 whencompared with the U.S. dollar. New distributor enrollments were 525 in 2013 compared to 1,098 in 2012, and 88distributors qualified as new Master Affiliates in 2013, compared with 33 in the prior year. The increase in newMaster Affiliate qualifications was the result of a promotion run during the second quarter of 2013. We hired a newsales manager for the Mexican market in May 2013, and in December 2013, we began the process of moving ourMexican office to Guadalajara. Guadalajara is one of our two primary areas of business in Mexico, and a number ofdirect selling companies have their Mexican headquarters located there. The net loss in Mexico for 2013 was$276,000, compared with a net loss of $146,000 in 2012, as the impact of the decline in sales and the employeetermination and other relocation costs negatively impacted our financial results.
Our European region includes sales from operations in United Kingdom, Ireland, France, Germany, Austriaand the Netherlands. Net sales in Europe increased by 22.7% for 2013 compared with 2012. Excluding the impactof exchange rate fluctuation, net sales in Europe increased by 24.3% in 2013 compared with the prior year. Newdistributor enrollments were 4,382 in 2013 compared with 5,236 in 2012, and 483 distributors qualified as newMaster Affiliates in 2013, compared with 467 in 2012. Our order count in the region increased to approximately22,891 in 2013 compared with approximately 18,725 in 2012, an increase of 22.3%. In May 2013, we formallybegan operations in France. As part of changes made to the business model in France to comply with localregulations, we created a preferred customer status with the equivalent purchasing discount as a Retail Distributor.During the remainder of 2013, approximately 1,500 individuals either enrolled as new preferred customers orconverted their existing distributorship to this preferred customer status. In early 2013, we moved our Europeanoperations into a larger office and warehouse facility in the Birmingham, England area. As shown by the growth inthe order count coupled with the commencement of formal operations in France, our net sales continued to improvein 2013. Europe earned net income of $61,000 in 2013, compared with net income of $216,000 in 2012.Profitability improved excluding the impact of the UK management long-term incentive plan. The expenserecognized under this plan in 2013 was $264,000 on an after-tax basis.
Our Asian region includes sales from operations in the Philippines, Malaysia, Singapore, Brunei, andIndonesia. Net sales in Asia decreased by 41.5% in 2013 compared with the prior year. Excluding the impact ofexchange rate fluctuation, 2013 net sales decreased by 41.0%. New distributor enrollments were 1,683 in 2013compared with 3,826 in 2012, and 112 distributors qualified as new Master Affiliates in 2013, compared with 298 in2012. Sales declined across the region, as sales in the Philippines decreased by 43.3% in 2013 compared with2012. Sales in the Malaysia/Singapore/Indonesia/Brunei markets combined decreased by 26.3% in 2013 comparedwith 2012. In Asia, sales declined as the result of an on-going transition of the business model in the region andchanges in management in certain of the local markets. In the Philippines, we have introduced initiatives to bring innew Master Affiliates at a lower qualification level and to increase focus on retail sales by distributors. However,sales have declined while we are executing the implementation and distributor training of these initiatives. As aresult of the sales decline, the net loss in Asia for 2013 worsened to $639,000, compared with a net loss of $410,000in 2012. We ceased operations in Brunei in November 2013 due to poor sales performance.
Cost of Products Sold. Cost of products sold as a percentage of net sales increased to 20.6% for the yearended December 31, 2013 compared with 19.9% for the year ended December 31, 2012. Gross margins declined in2013 compared with 2012 as the result of increases in the cost of various raw materials and other production costs,along with changes in the sales mix.
Distributor Royalties and Commissions. Distributor royalties and commissions as a percentage of net saleswas 36.5 % and 37.6% for each of the years ended December 31, 2013 and 2012, respectively. The decrease as apercentage of net sales is the result of the retail price increase and commission adjustments effective March 1, 2013in the United States and later in the year for other markets. After the price change, wholesale discounts ondistributor orders are based on the retail value of the product. Distributor royalties and commissions are paid on an
24
amount referred to as the business value (“BV”), which is generally equal to the retail price of each product prior tothe price increase.
Selling, General and Administrative Expenses. For 2013, selling, general and administrative (“SGA”)expenses increased by $283,000 compared with 2012. SGA expenses as a percentage of net sales increased to40.7% in 2013 compared with 40.0% in 2012, as a function of the decline in consolidated net sales.
Sales and marketing expenses decreased by $308,000 in 2013. Of that amount, $194,000 represented thedecrease in expenses directly related to sales volume, such as star director bonuses, other sales production bonuses,and credit card fees. Other changes included a decrease of $24,000 for our distributor conferences and other trainingevents, a decrease of $79,000 for promotions expense, offset by an increase in advertising expense of $148,000. Thereduction in expense for distributor conferences and other training events was part of a continued effort to reducethese expenses relative to our current level of sales, and the increase in advertising expense is related to a publicrelations campaign in the first half of 2013.
General and administrative (“G&A”) expenses, excluding salaries and benefits, increased by approximately$177,000 in 2013 compared with 2012. Significant decreases included a decrease in accounting fees of $120,000, adecrease in stock option expense of $60,000, a decrease of $61,000 in business insurance expense, a decrease of$75,000 in product development expenses, and a decrease of $89,000 in legal fees. Increases included an increase inoutsourced data center and consulting services of $124,000, an increase in professional and consulting fees of$114,000, and an increase of $352,000 in compensation expense recognized as part of a long-term incentiveagreement with our management team in our European subsidiary. This incentive agreement is further detailed inNote 13 of the Consolidated Financial Statements.
Salaries, incentive compensation expense, and benefits increased by $440,000 in 2013 compared to 2012.We added 5 staff positions in our SL Technology, Inc. unit in the transfer of staffing from Soy Labs, LLC whichrepresented $211,000 of this increase. We also added key positions in new sales managers in our Mexico andAustralia subsidiaries. General and administrative expenses include staffing and other G&A expenses in the secondhalf of 2013 of our new subsidiary, SL Technology, Inc., which was formed as part of the technology licensingagreement we entered into in July 2013. This transaction is described in further detail in Note 6 to the ConsolidatedFinancial Statements.
Interest Income/Expense. Interest income increased to $149,000 for the year ended December 31, 2013,compared with $129,000 for the same period in 2012. The increase in interest income is the result of a full year’sinterest earned on the note receivable due from a distributor that was entered into in March 2012. Interest expensedecreased to $82,000 for 2013 compared with $100,000 for 2012. The lower interest expense is the result of adecrease in the weighted average amount of debt compared to the prior year.
Other Income/Expense. Other income/expense in 2013 was a net amount of expense of $138,000,compared to a net amount of income of $406,000 in 2012. The 2013 net expense is due to foreign exchangetransaction losses. The 2012 other income is primarily the result of the gain of $410,000 ($247,000 net of tax) inJuly 2012 recognized as the result of the modification to an obligation relating to a prior year purchase of adistributorship. This transaction is described in greater detail in Note 6 of the Consolidated Financial Statements.
Income Taxes. We recorded income tax expense of $655,000 for 2012, representing an effective rate of45.8%. In 2012, we recorded income tax expense of $789,000, representing an effective rate of 36.7%. The highereffective rate in 2013 is the result of non-deductible losses and minimum taxes due in certain foreign subsidiaries.
Net Income. Our net income decreased to $777,000 ($0.06 per share basic and diluted) for the year endedDecember 31, 2013 compared with $1.36 million ($0.11 per share basic and diluted) for 2012. Excluding themodification gain discussed above, sales and profitability in the United States remained relatively constant.Operating losses in international operations increased as the result of declines in sales in all markets except Europe,coupled with additional expenses in Mexico and Australia. Net income in the United States was $1.83 million in2013, compared with $1.74 million in 2012. The net loss from international operations increased to $1.05 million in2013, compared with a net loss of $382,000 in 2012.

25
Financial Condition, Liquidity and Capital Resources
We generated $2.59 million of net cash during 2013 from operating activities, $1.77 million was used ininvesting activities, and financing activities provided $149,000 in net cash. This compares with $2.47 million of netcash provided by operating activities, $2.79 million used in investing activities, and $1.16 million used in financingactivities in 2012. Cash and cash equivalents increased by $856,000 to $6.66 million as of December 31, 2013compared with December 31, 2012.
Significant changes in working capital items consisted of an increase in income taxes payable of $200,000,and an increase in accounts payable, accrued expenses and other non-current liabilities of $509,000 in 2013. Theincrease in income taxes payable is due to our improved performance in the fourth quarter of 2013 compared to theprior year quarter, and the increase in accounts payable, accrued expenses, and other non-current liabilities isprimarily related to the increase in accrued compensation expense due under the European management incentiveagreement.
Our net investing activities included $379,000 and $485,000 in net capital expenditures for the years endedDecember 31, 2013 and 2012, respectively. Payments for key-man life insurance were $320,000 in 2013 and$301,000 in 2012. Investing activities in 2013 also included a payment of $1.15 million related to the acquisition ofthe lunasin technology licensing agreement. Investing activities in 2012 also included a purchase of a note andmortgage for $2 million as discussed in Note 10 of the Consolidated Financial Statements. We received principalpayments of $79,000 on this note in 2013.
Financing activities in 2013 consisted of $1.15 million in proceeds from the revolving line of credit,principal payments of $630,000 on long-term borrowings, $379,000 in cash dividends paid, $14,000 in proceeds onthe exercise of stock warrants, and $5,000 in treasury stock purchased. Financing activities in 2012 consisted of$710,000 in payments on long-term debt, $376,000 in common stock dividends paid, and $71,000 in payments forpurchases of our common stock into treasury.
Stockholders’ equity increased to $16.13 million at December 31, 2013 compared with $15.58 million atDecember 31, 2012. The increase represents our net income of $777,000 for 2013, offset by our cash dividend of$379,000. Other changes to equity include the contribution of treasury shares to our ESOP of $125,000, a favorableadjustment in our cumulative foreign currency translation adjustment of $7,000, the purchase of treasury stock of$5,000, and other transactions related to equity-based compensation with a net increase in equity of $24,000.
Our working capital balance was $6.51 million at December 31, 2013 compared to $5.88 million atDecember 31, 2012. The current ratio at December 31, 2013 was 1.98 compared with 1.89 at the previous year-end.
In September 2012, we entered into a term loan with our primary lender (“the Bank”) in the principalamount of $2.90 million. The loan was renegotiated from a loan that originated with the Bank on November 30,2010. The term of the loan is for a period of three years and two months with interest accruing on the outstandingprincipal balance at a floating interest rate based on the 30-day LIBOR plus 2.0%.
On February 28, 2014, we re-financed the 2012 term loan agreement (and its revolving line of creditagreement) with the Bank. The 2014 re-financed term loan is for a period of twenty-eight months with the samefloating interest rate pricing as the 2012 term loan. The total loan amount of the new 2014 term loan isapproximately $3.48 million and consists of the February 28, 2014 outstanding balances of the 2012 term loan andthe revolving line of credit loan balance of $1.15 million. Upon the completion of this February 28, 2014 re-financing, the revolving line of credit loan balance is zero. The credit agreement has a maturity date of July 1, 2016.The terms of this new credit agreement are described as a subsequent event in Note 6 of the Consolidated FinancialStatements.
The new credit agreement includes a revolving credit facility for $5 million. The credit facility accruesinterest on the outstanding principal balance at a floating interest rate based on 30-day LIBOR plus 1.85% and hasthe same maturity date as the 2014 term loan of July 1, 2016. After the new credit agreement was completed, therewere no outstanding borrowings on the revolving credit facility.

26
The new credit agreement is secured by all our tangible and intangible assets and also by a mortgage on thereal estate of our headquarters. These agreements also include loan covenants requiring us to maintain net tangibleworth of not less than $11 million, and a fixed charge coverage ratio under which EBITDA adjusted for certain non-cash expenses shall exceed the fixed charges, including unfinanced capital expenditures, dividends and otherdistributions, cash taxes paid, and principal and interest due on all debt obligations, by a ratio of at least 1.15 to 1.As of December 31, 2013, we were in compliance with its loan covenants.
Management believes that our cash on hand, cash generated from operating activities and availability ofcredit under the bank loan facilities will be sufficient to meet working capital requirements for the remainder of2014.
Critical Accounting Policies
Our financial statements are based on the selection and application of significant accounting policies, whichrequire management to make significant estimates and assumptions. We believe that the following are some of themore critical judgment areas in the application of our accounting policies that currently affect our financial conditionand results of operations.
Revenue
We receive payment by credit card, personal check, or guaranteed funds for orders from independentdistributors and make related commission payments in the following month. Net sales reflect product sales atsuggested retail price less the distributor discount of 20% to 40%. Sales revenue and commission expenses arerecorded when the merchandise is shipped, as this is the point title and risk of loss pass. In accordance with FASBASC, Topic 650-50, “Revenue Recognition-Customer Payments and Incentives,” we present distributor royalty andcommission expense as an operating expense, rather than a reduction to net sales, as these payments are not made tothe purchasing distributor.
Actual and estimated returns are classified as a reduction of net sales. We estimate and accrue a reserve forproduct returns based on our return policy and historical experience. Our return policy allows for a distributor toreturn product only upon termination of his or her distributorship. Allowable returns are limited to saleable productwhich was purchased within twelve months of the termination for a refund of 90% of the original purchase price lessany distributor royalties and commission received relating to the original purchase of the returned products. Totalreturns have been approximately 0.57% and 0.48% of net sales in 2013 and 2012, respectively. We record handlingand freight income as a component of net sales and record handling and freight costs as a component of cost ofproducts sold. Total revenues do not include sales tax as we consider ourselves a pass-through conduit for collectingand remitting applicable sales taxes.
Inventories
Inventories are valued at the lower of cost or market. Product cost includes raw material, labor andoverhead costs and is accounted for using the first-in, first-out basis. On a periodic basis, we review our inventorylevels in each country for estimated obsolescence or unmarketable items, as compared to future demandrequirements and the shelf life of the various products. Based on this review, we record inventory write-downs whencosts exceed expected net realizable value. Historically, our estimates of obsolete or unmarketable items have beenmaterially accurate.
Sales aids and promotional materials inventories represent distributor kits, product brochures, and othersales and business development materials which are held for sale to distributors. Costs of the sales aids andpromotional materials held for sale are capitalized as inventories and subsequently recorded to cost of goods soldupon recognition of revenue when sold to distributors. All other advertising and promotional costs are expensedwhen incurred.
Amortizable Intangible Assets
We record intangible assets based on management’s determination of the fair value of the respective assetsat the time of acquisition. Determining the fair value of intangible assets is judgmental and involves the use of

27
significant estimates and assumptions of future company operations. We base our fair value estimates and relatedasset lives on assumptions we believe to be reasonable but that are unpredictable and inherently uncertain. Actualfuture results may differ from these estimates.
Intangible assets estimated to have finite estimable lives are amortized over their estimated economic lifeunder the straight-line method; such method correlates to our estimate of the assets’ economic benefit. Based on ourestimates at origination, these lives range from two to seventeen years. Related amortization expense is presentedwithin Selling, General, and Administrative in the accompanying consolidated statements of net income andcomprehensive income. As of December 31, 2013, remaining lives of intangible assets range from three toseventeen years.
Foreign Currency Translation
All balance sheet accounts are translated using the exchange rates in effect at the balance sheet date.Statements of operations amounts are translated using the average exchange rate for the year-to-date periods. Thegains and losses resulting from the changes in exchange rates during the period have been reported in othercomprehensive loss. Foreign currency translation adjustments exclude income tax expense (benefit) given that ourinvestments in non-U.S. subsidiaries are deemed to be reinvested for an indefinite period of time.
Legal Proceedings
In the ordinary course of business, we are subject to various legal proceedings, including lawsuits and otherclaims related to labor, product and other matters. We are required to assess the likelihood of adverse judgments andoutcomes to these matters as well as the range of potential loss. Such assessments are required to determine whethera loss contingency reserve is required under the provisions of FASB ASC Topic 450, “Contingencies,” and todetermine the amount of required reserves, if any. These assessments are subjective in nature. Management makesthese assessments for each individual matter based on consultation with outside counsel and based on priorexperience with similar claims. To the extent additional information becomes available or our strategies orassessments change, our estimates of potential liability for a given matter may change. Changes to estimates ofliability would result in a corresponding additional charge or benefit recognized in the statement of operations in theperiod in which such changes become known. We recognize the costs associated with legal defense in the periodsincurred. Accordingly, the future costs of defending claims are not included in our estimated liability.
Stock-Based Compensation
We have stock-based incentive plans under which we may grant stock option, restricted stock, andunrestricted stock awards. We recognize stock-based compensation expense based on the grant date fair value of theaward and the related vesting terms as proscribed in FASB ASC Topic 718, “Compensation-Stock Compensation.”Based on the nature of the grant, we use either the Black-Scholes option pricing or a binomial model to determinethe fair value of stock options which requires us to estimate certain key assumptions. For the years ended December31, 2013 and 2012, we incurred employee stock-based compensation cost of $36,800 ($35,000 net of tax), and$96,800 ($74,000 net of tax), respectively.
Income Tax Matters
We account for income taxes in accordance with FASB ASC Topic 740, “Income Taxes,” (ASC Topic740) which requires that deferred tax assets and liabilities be recognized using enacted tax rates for the effect oftemporary differences between the book and tax bases of recorded assets and liabilities. ASC Topic 740 alsorequires that deferred tax assets be reduced by a valuation allowance if it is “more likely than not” that some portionor the entire deferred tax asset will not be realized. In our quarterly evaluation of the need for a valuation allowance,we take into account various factors, including the expected level of future taxable income and available taxplanning strategies. If actual results differ from the assumptions made in our previous evaluation of our valuationallowance, we may record a change in valuation allowance through income tax expense in the period thisdetermination is made.
At December 31, 2013, we had deferred tax assets related to net operating loss carryforwards and otherincome tax credits with a tax value of $3.6 million. These net operating loss carryforwards have various expiration
28
dates, depending on the country and period in which they occurred. A valuation allowance of $3.6 million has beenestablished for these deferred tax assets based on projected future taxable income and the expiration dates of thesecarryforwards.
The calculations of our tax liabilities involve dealing with uncertainties in the application of complex taxregulations. We recognize liabilities for uncertain tax positions based on the two-step process prescribed in theguidance under ASC Topic 740. The first step is to evaluate the tax position for recognition by determining if theweight of available evidence indicates that it is more likely than not that the position will be sustained on audit,including resolution of related appeals or litigation processes, if any. The second step requires us to estimate andmeasure the tax benefit as the largest amount that is more than 50% likely to be realized upon ultimate settlement. Itis inherently difficult and subjective to estimate such amounts, as we have to determine the probability of variouspossible outcomes. We reevaluate these uncertain tax positions on a quarterly basis. This evaluation is based onfactors including, but not limited to, changes in facts or circumstances, changes in tax law, effectively settled issuesunder audit, or new audit activity. Such a change in recognition or measurement would result in the recognition of atax benefit or an additional charge to the tax provision.
Item No. 8 - Financial Statements and Supplementary Data
Reference is made to the Consolidated Financial Statements contained in Part IV hereof.
Item No. 9 - Changes in and Disagreements with Accountants on Accounting andFinancial Disclosure
None
Item No. 9A - Controls and Procedures
Evaluation of Disclosure Controls and Procedures
Our management, under the supervision and with the participation of our Chief Executive Officer andChief Financial Officer, has reviewed and evaluated the effectiveness of the design and operation of our disclosurecontrols and procedures as of December 31, 2013. Based on such review and evaluation, our Chief ExecutiveOfficer and Chief Financial Officer have concluded that the disclosure controls and procedures were effective as ofDecember 31, 2013, to ensure that the information required to be disclosed by us in the reports that we file or submitunder the Securities Exchange Act of 1934, as amended, (a) is recorded, processed, summarized and reported withinthe time period specified in the SEC’s rules and forms and (b) is accumulated and communicated to ourmanagement, including the officers, as appropriate to allow timely decisions regarding required disclosure.
Management’s Annual Report on Internal Control over Financial Reporting
Management is responsible for establishing and maintaining adequate internal control over financialreporting. Our management conducted an evaluation of the effectiveness of our internal control over financialreporting based on the 1992 framework in Internal Control – Integrated Framework issued by the Committee ofSponsoring Organizations of the Treadway Commission. This evaluation included review of the documentation ofcontrols, evaluation of the design effectiveness of controls, testing of the operating effectiveness of controls and aconclusion on this evaluation. Although there are inherent limitations in the effectiveness of any system of internalcontrol over financial reporting, based on our evaluation, management has concluded our internal controls overfinancial reporting were effective as of December 31, 2013.
Attestation Report of the Registered Public Accounting Firm
This annual report does not include an attestation report of the company’s registered public accounting firmregarding internal control over financial reporting. Management’s report was not subject to attestation by thecompany’s registered public accounting firm as the company is classified as a “Smaller Reporting Company.”

29
Changes in Internal Control over Financial Reporting
There were no material changes in our internal control over financial reporting during the fourth quarter of2013 that have materially affected or are reasonably likely to materially affect our internal controls over financialreporting.
Item No. 9B - Other Information
None
PART III
Item No. 10 - Directors, Executive Officers and Corporate Goverance
Information called for by Item 10 of Part III is incorporated by reference to the definitive Proxy Statementfor the 2014 Annual Meeting of Shareholders to be held on May 22, 2014, which is expected to be filed with theCommission within 120 days after December 31, 2013.
Item No. 11 - Executive Compensation
Information called for by Item 11 of Part III is incorporated by reference to the definitive Proxy Statementfor the 2014 Annual Meeting of Shareholders to be held on May 22, 2014, which is expected to be filed with theCommission within 120 days after December 31, 2013.
Item No. 12 - Security Ownership of Certain Beneficial Owners and Management and Related StockholderMatters
Information called for by Item 12 of Part III is incorporated by reference to the definitive Proxy Statementfor the 2014 Annual Meeting of Shareholders to be held on May 22, 2014, which is expected to be filed with theCommission within 120 days after December 31, 2013.
Item No. 13 - Certain Relationships and Related Transactions, and Director Independence
Information called for by Item 13 of Part III is incorporated by reference to the definitive Proxy Statementfor the 2014 Annual Meeting of Shareholders to be held on May 22, 2014, which is expected to be filed with theCommission within 120 days after December 31, 2013.
Item No. 14 - Principal Accountant Fees and Services
Information called for by Item 14 of Part III is incorporated by reference to the definitive Proxy Statementfor the 2014 Annual Meeting of Shareholders to be held on May 22, 2014, which is expected to be filed with theCommission within 120 days after December 31, 2013.
30
PART IV
Item No. 15 - Exhibits and Financial Statement Schedules
(a) 1. The Consolidated Financial Statements filed as part of this report on Form 10-K are listed on theaccompanying Index to Consolidated Financial Statements and Consolidated Financial StatementSchedules.
2. Financial schedules required to be filed by Item 8 of this form, and by Item 15(d) below:
All other financial schedules are not required under the related instructions or are inapplicable andtherefore have been omitted.
3. Exhibits: See the Exhibit Index immediately following the signature page of this Annual Reporton Form 10-K.
31
SIGNATURES
Pursuant to the requirements of Section 13 or 15(d) of the Securities Exchange Act of 1934, the registranthas duly caused this report to be signed on its behalf by the undersigned, thereunto duly authorized.
RELIV’ INTERNATIONAL, INC.
By: /s/ Robert L. MontgomeryRobert L. Montgomery, Chairman of the Board of Directors and Chief Executive Officer
Date: March 25, 2014
Pursuant to the requirements of the Securities Act of 1934, this report has been signed by the following persons onbehalf of the registrant and in the capacities and on the dates indicated.
By: /s/ Robert L. MontgomeryRobert L. Montgomery, Chairman of the Board of Directors and Chief Executive Officer
Date: March 25, 2014
By: /s/ Steven D. AlbrightSteven D. Albright, Chief Financial Officer (and accounting officer)
Date: March 25, 2014
By: /s/ Carl W. HastingsCarl W. Hastings, Vice Chairman, Chief Scientific Officer, Director
Date: March 25, 2014
By: /s/ John B. AkinJohn B. Akin, Director
Date: March 25, 2014
By: /s/ Robert M. HenryRobert M. Henry, Director
Date: March 25, 2014
By: /s/ John M. KlimekJohn M. Klimek, Director
Date: March 25, 2014
32
Exhibit Index
ExhibitNumber Document
3.1 Second Amended and Restated Certificate of Incorporation (incorporated by reference toAppendix B of Schedule 14A of the Registrant filed on April 17, 2003).
3.2 By-Laws (incorporated by reference to the Registration Statement on Form S-3 of the Registrantfiled on February 21, 2006).
3.3 Amendment to By-Laws dated March 22, 2001 (incorporated by reference to the RegistrationStatement on Form S-3 of the Registrant filed on February 21, 2006).
3.4 Certificate of Designation to Create a Class of Series A Preferred Stock for Reliv’ International,Inc. (incorporated by reference to Exhibit 3.1 to the Form 10-Q of the Registrant for quarter endedMarch 31, 2003).
4.1 Form of Reliv International, Inc. common stock certificate (incorporated by reference to theRegistration Statement on Form S-3 of the Registrant filed on February 21, 2006).
10.1 Amended Exclusive License Agreement with Theodore P. Kalogris dated December 1, 1991(incorporated by reference to Exhibit 10.1 to the Form 10-K of the Registrant for the year endedDecember 31, 1992).
10.2* Robert L. Montgomery Employment Agreement dated June 19, 2007 (incorporated by reference toExhibit 10.1 to the Form 8-K of the Registrant filed June 25, 2007).
10.3* Carl W. Hastings Employment Agreement dated July 26, 2007 (incorporated by reference toExhibit 10.1 to the Form 8-K of the Registrant filed July 27, 2007).
10.4* Reliv’ International, Inc. Supplemental Executive Retirement Plan dated June 1, 1998(incorporated by reference to Exhibit 10.19 to the Form10-K of the Registrant for year endedDecember 31, 1998).
10.5* Reliv International, Inc. Employee Stock Ownership Plan and Trust dated August 24, 2006(incorporated by reference to Exhibit 10.1 to the Form 8-K of the Registrant filed August 30,2006).
10.6* 2009 Distributor Stock Purchase Plan (incorporated by reference to Appendix 1 of Form S-3Registration Statement the Registrant filed July 1, 2009).
10.7* 2003 Stock Option Plan (incorporated by reference to Exhibit 4 to the Form S-8 RegistrationStatement the Registrant filed August 13, 2003).
10.8* 2009 Incentive Stock Plan (incorporated by reference to Exhibit 10.1 to the Form S-8 RegistrationStatement the Registrant filed December 2, 2010).
10.9* Reliv International, Inc. Incentive Compensation Plan effective January 1, 2007 (incorporated byreference to Exhibit 10.1 to the Form 8-K of the Registrant filed May 31, 2007).
10.10* R. Scott Montgomery Employment Agreement dated January 2, 2008 (incorporated by referenceto Exhibit 10.1 to the Form 8-K of the Registrant filed January 4, 2008).
10.11* Ryan A. Montgomery Employment Agreement dated January 2, 2008 (incorporated by referenceto Exhibit 10.2 to the Form 8-K of the Registrant filed January 4, 2008).
33
10.12* Steven G. Hastings Employment Agreement dated January 2, 2008 (incorporated by reference toExhibit 10.3 to the Form 8-K of the Registrant filed January 4, 2008).
10.13* Steven D. Albright Employment Agreement dated January 2, 2008 (incorporated by reference toExhibit 10.4 to the Form 8-K of the Registrant filed January 4, 2008).
10.14* Brett M. Hastings Employment Agreement dated January 2, 2008 (incorporated by reference toExhibit 10.5 to the Form 8-K of the Registrant filed January 4, 2008).
10.15 Purchase Agreement by and among Michael G. Williams, Julie T. Williams and RelivInternational, Inc. dated August 31, 2009 (incorporated by reference to Exhibit 10.1 to the Form 8-K of the Registrant filed September 3, 2009).
10.16 Loan Sale Agreement between 2010-1 RADC/CADC Venture, LLC and Reliv International, Inc.dated March 16, 2012 (incorporated by reference to Exhibit 10.1 to the Form 10-Q of theRegistrant for the quarter ended March 31, 2012).
10.17 Technology License Agreement by and between SL Technology, Inc. and Soy Labs, LLC datedJuly 23, 2013 (incorporated by reference to Exhibit 10.1 to the Form 8-K of the Registrant filedJuly 25, 2013).
10.18 Agreement by and among Reliv International, Inc., SL Technology, Inc., Soy Labs, LLC and1Soy, Inc. dated July 23, 2013 (incorporated by reference to Exhibit 10.2 to the Form 8-K of theRegistrant filed July 25, 2013).
10.19 Credit Agreement dated February 28, 2014 among Reliv International, Inc., Reliv, Inc., RelivWorld Corporation, and SL Technology, Inc., as Borrowers and BMO Harris Bank N.A.(incorporated by reference to Exhibit 10.1 to the Form 8-K of the Registrant filed March 6, 2014).
11 Statement re: computation of per share earnings (incorporated by reference to Note 8 of theConsolidated Financial Statements contained in Part IV).
21 Subsidiaries of the Registrant (filed herewith).
23 Consent of Ernst & Young LLP, Independent Registered Public Accounting Firm (filed herewith).
31.1 Certification of Chief Executive Officer pursuant to Rule 13a-14(a) and Rule 15d-14(a) of theSecurities Exchange Act, as amended (filed herewith).
31.2 Certification of Chief Financial Officer pursuant to Rule 13a-14(a) and Rule 15d-14(a) of theSecurities Exchange Act, as amended (filed herewith).
32 Certification of Chief Executive Officer and Chief Financial Officer pursuant to 18 U.S.C.1350, as adopted pursuant to Section 906 of the Sarbanes-Oxley Act of 2002 (filed herewith).
101 Interactive Data Files, including the following materials from the Company’s Annual Report onForm 10-K for the year ended December 31, 2013, formatted in XBRL: (i) the ConsolidatedBalance Sheets, (ii) the Consolidated Statements of Net Income and Comprehensive Income,(iii) the Consolidated Statements of Stockholders’ Equity, (iv) the Consolidated Statements ofCash Flows, and (v) the Notes to Consolidated Financial Statements.
*Indicates management compensation plan, contract or arrangement.
Reliv’ International, Inc.and Subsidiaries
Consolidated Financial Statements
Years ended December 31, 2013 and 2012
Contents
Consolidated Financial Statements:Report of Independent Registered Public Accounting Firm.....................................F-1Consolidated Balance Sheets as of December 31, 2013 and 2012 ...........................F-2Consolidated Statements of Net Income and Comprehensive Income for the
years ended December 31, 2013 and 2012 ............................................................F-4Consolidated Statements of Stockholders’ Equity for the years ended
December 31, 2013 and 2012 ................................................................................F-5Consolidated Statements of Cash Flows for the years endedDecember 31, 2013 and 2012 .................................................................................F-6
Notes to Consolidated Financial Statements – December 31, 2013 .........................F-8
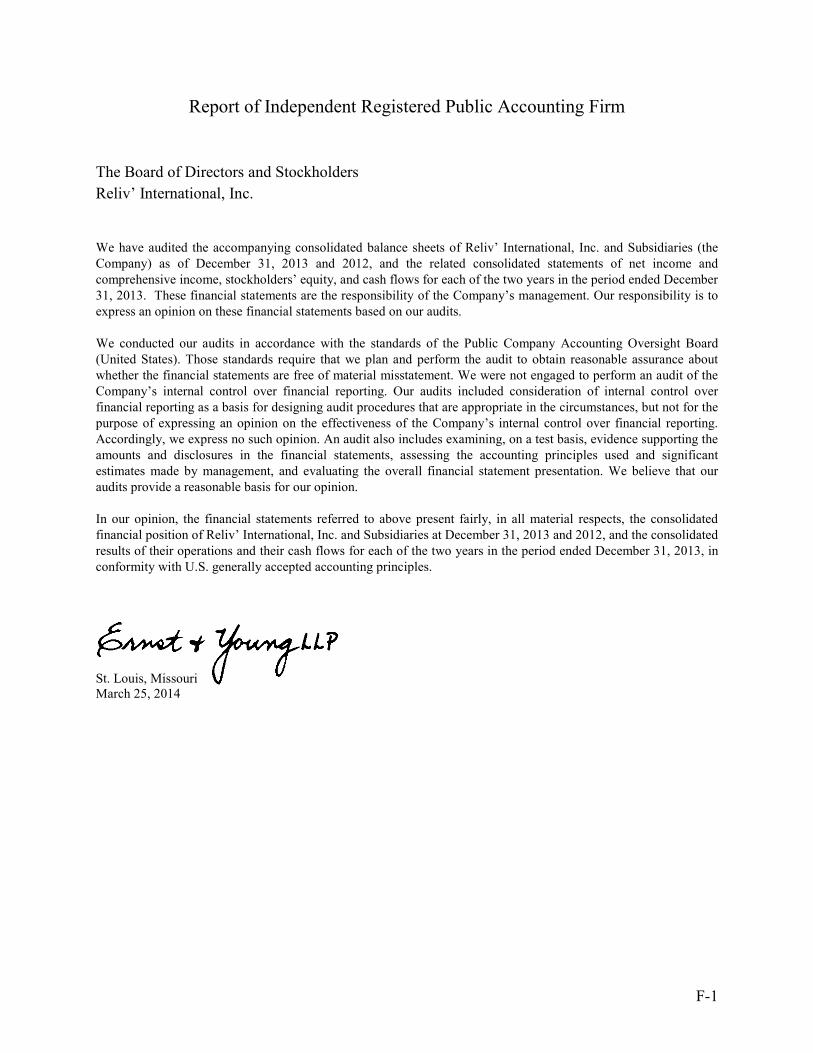
F-1
Report of Independent Registered Public Accounting Firm
The Board of Directors and Stockholders
Reliv’ International, Inc.
We have audited the accompanying consolidated balance sheets of Reliv’ International, Inc. and Subsidiaries (theCompany) as of December 31, 2013 and 2012, and the related consolidated statements of net income andcomprehensive income, stockholders’ equity, and cash flows for each of the two years in the period ended December31, 2013. These financial statements are the responsibility of the Company’s management. Our responsibility is toexpress an opinion on these financial statements based on our audits.
We conducted our audits in accordance with the standards of the Public Company Accounting Oversight Board(United States). Those standards require that we plan and perform the audit to obtain reasonable assurance aboutwhether the financial statements are free of material misstatement. We were not engaged to perform an audit of theCompany’s internal control over financial reporting. Our audits included consideration of internal control overfinancial reporting as a basis for designing audit procedures that are appropriate in the circumstances, but not for thepurpose of expressing an opinion on the effectiveness of the Company’s internal control over financial reporting.Accordingly, we express no such opinion. An audit also includes examining, on a test basis, evidence supporting theamounts and disclosures in the financial statements, assessing the accounting principles used and significantestimates made by management, and evaluating the overall financial statement presentation. We believe that ouraudits provide a reasonable basis for our opinion.
In our opinion, the financial statements referred to above present fairly, in all material respects, the consolidatedfinancial position of Reliv’ International, Inc. and Subsidiaries at December 31, 2013 and 2012, and the consolidatedresults of their operations and their cash flows for each of the two years in the period ended December 31, 2013, inconformity with U.S. generally accepted accounting principles.
St. Louis, MissouriMarch 25, 2014
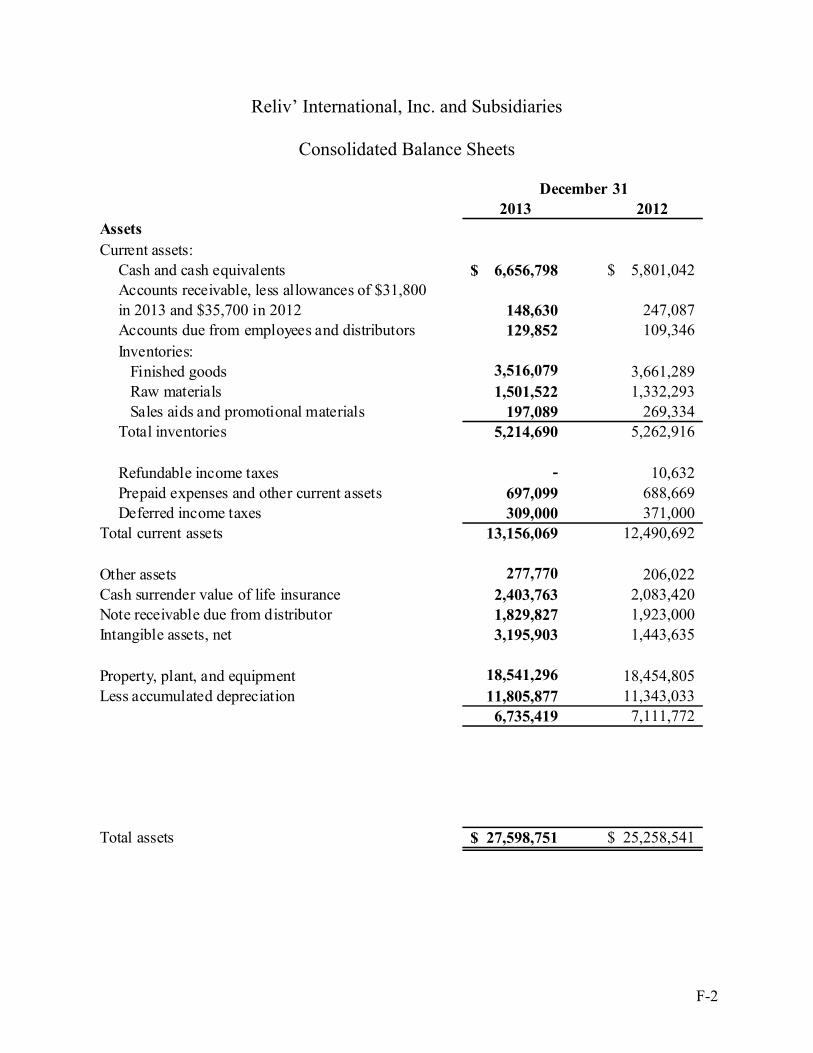
F-2
Reliv’ International, Inc. and Subsidiaries
Consolidated Balance Sheets
2013 2012Assets
Current assets:
Cash and cash equivalents 6,656,798$ 5,801,042$Accounts receivable, less allowances of $31,800
in 2013 and $35,700 in 2012 148,630 247,087Accounts due from employees and distributors 129,852 109,346
Inventories:
Finished goods 3,516,079 3,661,289Raw materials 1,501,522 1,332,293
Sales aids and promotional materials 197,089 269,334Total inventories 5,214,690 5,262,916
Refundable income taxes - 10,632
Prepaid expenses and other current assets 697,099 688,669Deferred income taxes 309,000 371,000
Total current assets 13,156,069 12,490,692
Other assets 277,770 206,022
Cash surrender value of life insurance 2,403,763 2,083,420Note receivable due from distributor 1,829,827 1,923,000
Intangible assets, net 3,195,903 1,443,635
Property, plant, and equipment 18,541,296 18,454,805
Less accumulated depreciation 11,805,877 11,343,033
6,735,419 7,111,772
Total assets 27,598,751$ 25,258,541$
December 31
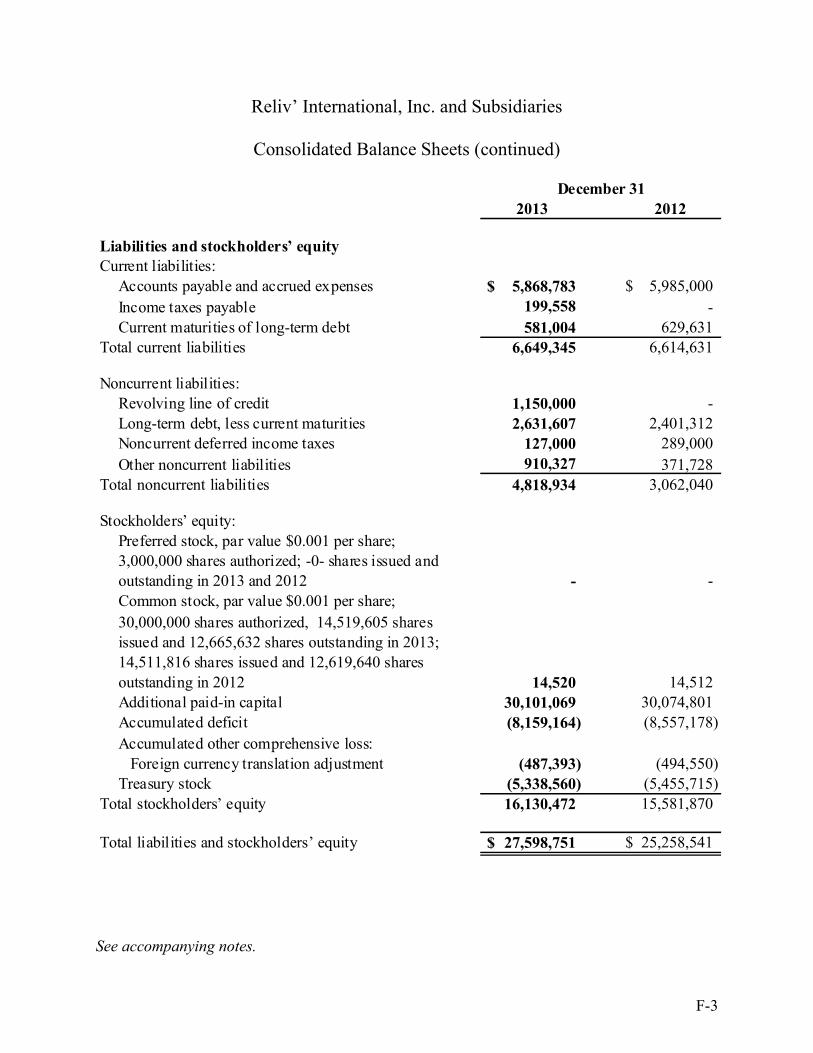
F-3
Reliv’ International, Inc. and Subsidiaries
Consolidated Balance Sheets (continued)
2013 2012
Liabilities and stockholders’ equityCurrent liabilities:
Accounts payable and accrued expenses 5,868,783$ 5,985,000$
Income taxes payable 199,558 -
Current maturities of long-term debt 581,004 629,631Total current liabilities 6,649,345 6,614,631
Noncurrent liabilities:Revolving line of credit 1,150,000 -
Long-term debt, less current maturities 2,631,607 2,401,312Noncurrent deferred income taxes 127,000 289,000
Other noncurrent liabilities 910,327 371,728Total noncurrent liabilities 4,818,934 3,062,040
Stockholders’ equity:
Preferred stock, par value $0.001 per share;3,000,000 shares authorized; -0- shares issued andoutstanding in 2013 and 2012 - -
Common stock, par value $0.001 per share;
30,000,000 shares authorized, 14,519,605 sharesissued and 12,665,632 shares outstanding in 2013;14,511,816 shares issued and 12,619,640 shares
outstanding in 2012 14,520 14,512Additional paid-in capital 30,101,069 30,074,801
Accumulated deficit (8,159,164) (8,557,178)
Accumulated other comprehensive loss:
Foreign currency translation adjustment (487,393) (494,550)Treasury stock (5,338,560) (5,455,715)
Total stockholders’ equity 16,130,472 15,581,870
Total liabilities and stockholders’ equity 27,598,751$ 25,258,541$
December 31
See accompanying notes.
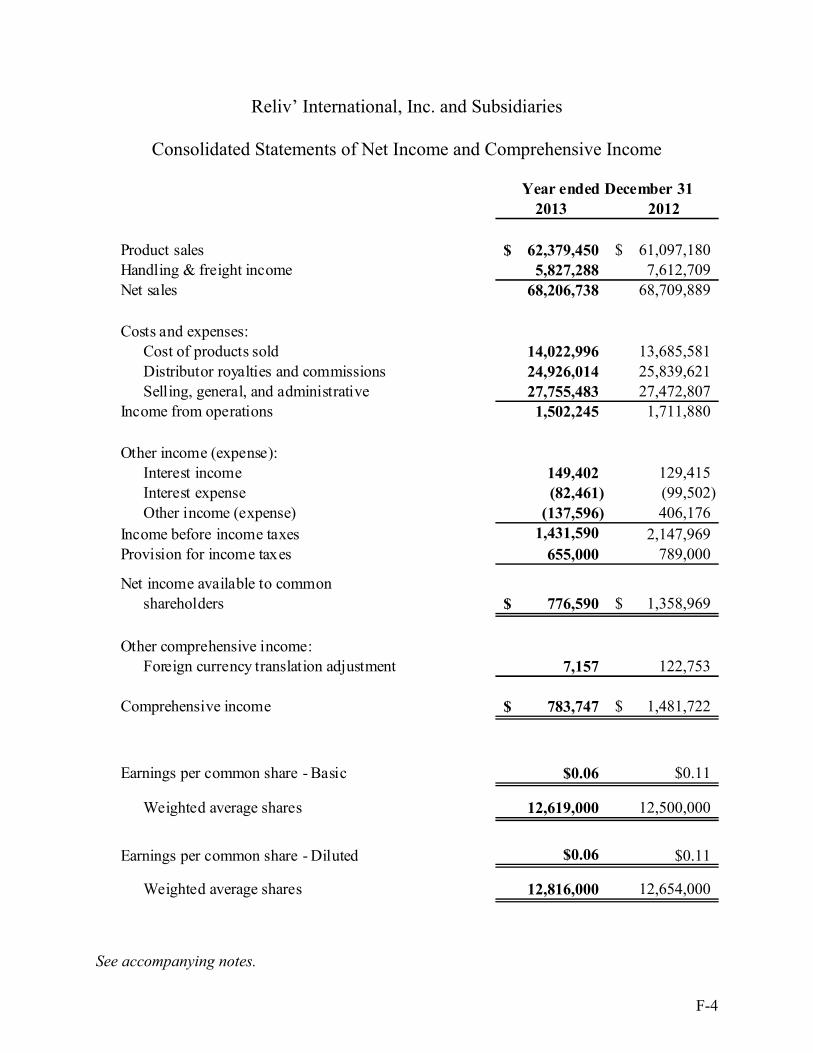
F-4
Reliv’ International, Inc. and Subsidiaries
Consolidated Statements of Net Income and Comprehensive Income
2013 2012
Product sales 62,379,450$ 61,097,180$Handling & freight income 5,827,288 7,612,709
Net sales 68,206,738 68,709,889
Costs and expenses:Cost of products sold 14,022,996 13,685,581
Distributor royalties and commissions 24,926,014 25,839,621Selling, general, and administrative 27,755,483 27,472,807
Income from operations 1,502,245 1,711,880
Other income (expense):Interest income 149,402 129,415Interest expense (82,461) (99,502)
Other income (expense) (137,596) 406,176
Income before income taxes 1,431,590 2,147,969Provision for income taxes 655,000 789,000
Net income available to commonshareholders 776,590$ 1,358,969$
Other comprehensive income:Foreign currency translation adjustment 7,157 122,753
Comprehensive income 783,747$ 1,481,722$
Earnings per common share - Basic $0.06 $0.11
Weighted average shares 12,619,000 12,500,000
Earnings per common share - Diluted $0.06 $0.11
Weighted average shares 12,816,000 12,654,000
Year ended December 31
See accompanying notes.
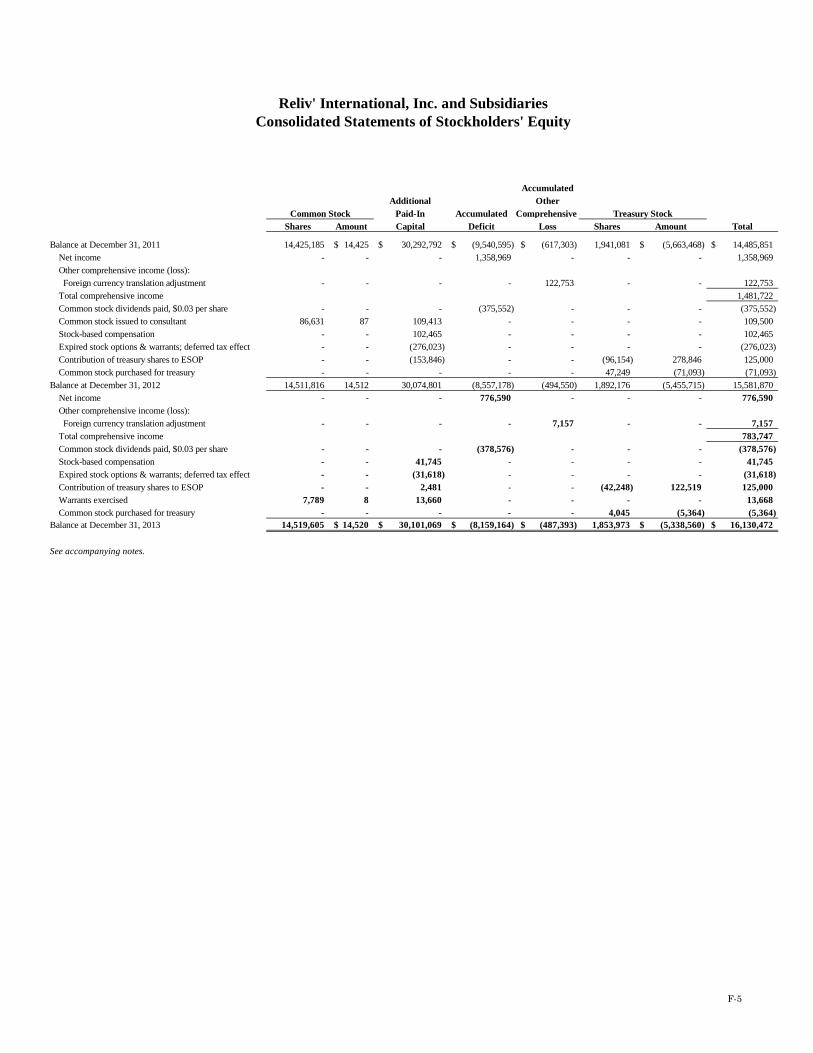
Reliv' International, Inc. and SubsidiariesConsolidated Statements of Stockholders' Equity
Accumulated
Additional Other
Common Stock Paid-In Accumulated Comprehensive Treasury Stock
Shares Amount Capital Deficit Loss Shares Amount Total
Balance at December 31, 2011 14,425,185 14,425$ 30,292,792$ (9,540,595)$ (617,303)$ 1,941,081 (5,663,468)$ 14,485,851$
Net income - - - 1,358,969 - - - 1,358,969
Other comprehensive income (loss):
Foreign currency translation adjustment - - - - 122,753 - - 122,753
Total comprehensive income 1,481,722
Common stock dividends paid, $0.03 per share - - - (375,552) - - - (375,552)
Common stock issued to consultant 86,631 87 109,413 - - - - 109,500
Stock-based compensation - - 102,465 - - - - 102,465
Expired stock options & warrants; deferred tax effect - - (276,023) - - - - (276,023)
Contribution of treasury shares to ESOP - - (153,846) - - (96,154) 278,846 125,000
Common stock purchased for treasury - - - - - 47,249 (71,093) (71,093)
Balance at December 31, 2012 14,511,816 14,512 30,074,801 (8,557,178) (494,550) 1,892,176 (5,455,715) 15,581,870
Net income - - - 776,590 - - - 776,590
Other comprehensive income (loss):
Foreign currency translation adjustment - - - - 7,157 - - 7,157
Total comprehensive income 783,747
Common stock dividends paid, $0.03 per share - - - (378,576) - - - (378,576)
Stock-based compensation - - 41,745 - - - - 41,745
Expired stock options & warrants; deferred tax effect - - (31,618) - - - - (31,618)
Contribution of treasury shares to ESOP - - 2,481 - - (42,248) 122,519 125,000
Warrants exercised 7,789 8 13,660 - - - - 13,668
Common stock purchased for treasury - - - - - 4,045 (5,364) (5,364)
Balance at December 31, 2013 14,519,605 14,520$ 30,101,069$ (8,159,164)$ (487,393)$ 1,853,973 (5,338,560)$ 16,130,472$
See accompanying notes.
F-5
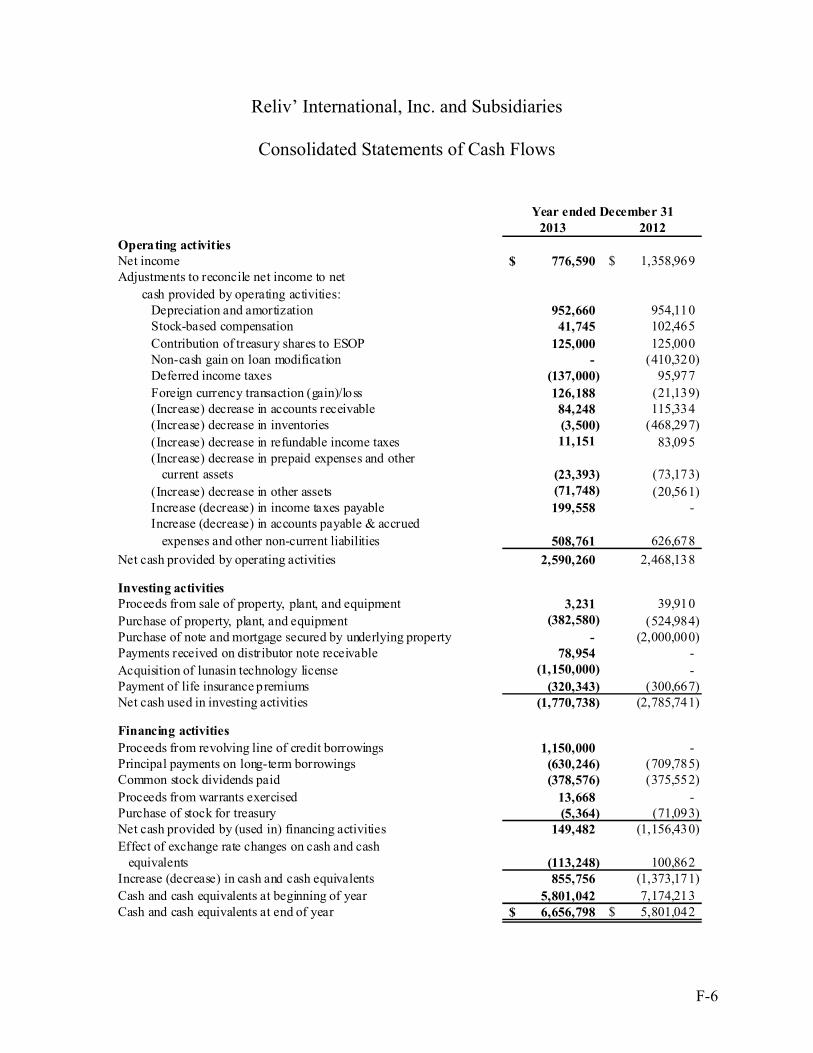
F-6
Reliv’ International, Inc. and Subsidiaries
Consolidated Statements of Cash Flows
2013 2012
Operating activitiesNet income 776,590$ 1,358,969$Adjustments to reconcile net income to net
cash provided by operating activities:Depreciation and amortization 952,660 954,110Stock-based compensation 41,745 102,465
Contribution of treasury shares to ESOP 125,000 125,000Non-cash gain on loan modification - (410,320)Deferred income taxes (137,000) 95,977
Foreign currency transaction (gain)/loss 126,188 (21,139)(Increase) decrease in accounts receivable 84,248 115,334(Increase) decrease in inventories (3,500) (468,297)
(Increase) decrease in refundable income taxes 11,151 83,095(Increase) decrease in prepaid expenses and other
current assets (23,393) (73,173)
(Increase) decrease in other assets (71,748) (20,561)Increase (decrease) in income taxes payable 199,558 -Increase (decrease) in accounts payable & accrued
expenses and other non-current liabilities 508,761 626,678
Net cash provided by operating activities 2,590,260 2,468,138
Investing activitiesProceeds from sale of property, plant, and equipment 3,231 39,910
Purchase of property, plant, and equipment (382,580) (524,984)Purchase of note and mortgage secured by underlying property - (2,000,000)Payments received on distributor note receivable 78,954 -
Acquisition of lunasin technology license (1,150,000) -Payment of life insurance premiums (320,343) (300,667)Net cash used in investing activities (1,770,738) (2,785,741)
Financing activities
Proceeds from revolving line of credit borrowings 1,150,000 -Principal payments on long-term borrowings (630,246) (709,785)Common stock dividends paid (378,576) (375,552)
Proceeds from warrants exercised 13,668 -Purchase of stock for treasury (5,364) (71,093)Net cash provided by (used in) financing activities 149,482 (1,156,430)
Effect of exchange rate changes on cash and cashequivalents (113,248) 100,862
Increase (decrease) in cash and cash equivalents 855,756 (1,373,171)
Cash and cash equivalents at beginning of year 5,801,042 7,174,213Cash and cash equivalents at end of year 6,656,798$ 5,801,042$
Year ended December 31
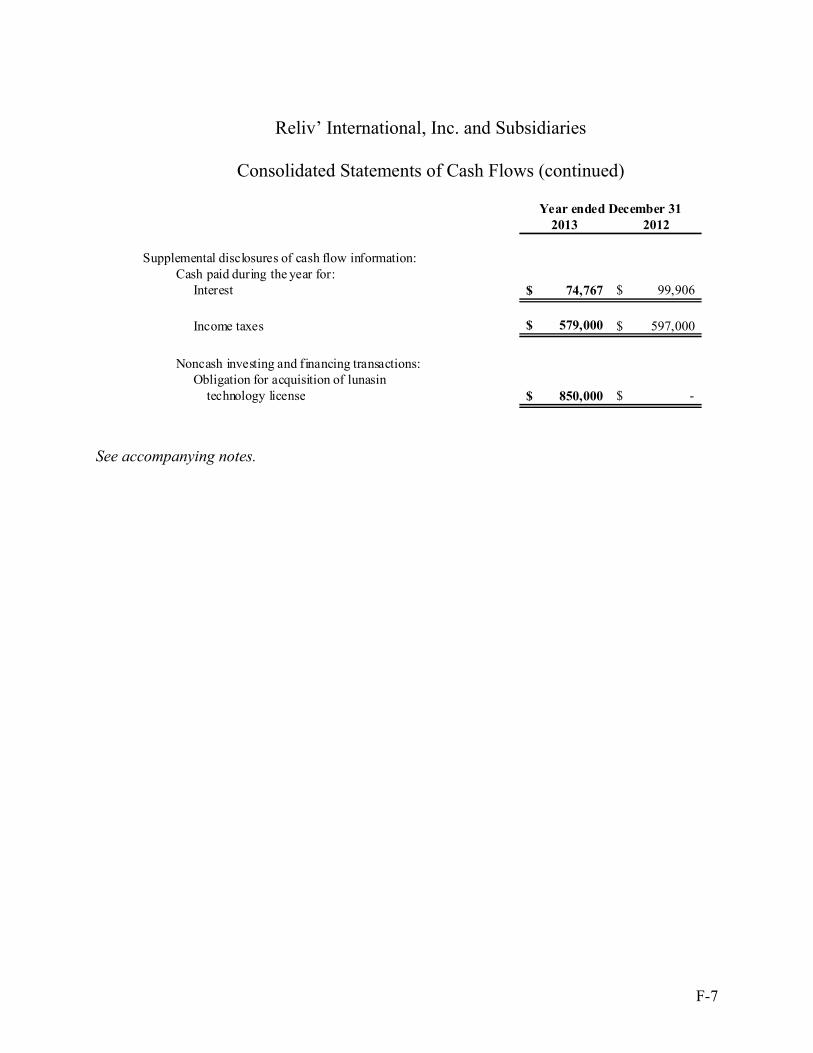
F-7
Reliv’ International, Inc. and Subsidiaries
Consolidated Statements of Cash Flows (continued)
2013 2012
Supplemental disclosures of cash flow information:Cash paid during the year for:
Interest 74,767$ 99,906$
Income taxes 579,000$ 597,000$
Noncash investing and financing transactions:Obligation for acquisition of lunasin
technology license 850,000$ -$
Year ended December 31
See accompanying notes.
Reliv’ International, Inc. and Subsidiaries
Notes to Consolidated Financial Statements
F-8
December 31, 2013
1. Nature of Business and Significant Accounting Policies
Nature of Business
Reliv’ International, Inc. (the Company) produces a proprietary line of nutritional supplementsaddressing basic nutrition, specific wellness needs, weight management, and sports nutrition.These products are sold by subsidiaries of the Company to a sales force of independentdistributors of the Company that sell products directly to consumers. The Company and itssubsidiaries sell products to distributors throughout the United States and in Australia, Austria,Brunei, Canada, France, Germany, Indonesia, Ireland, Malaysia, Mexico, the Netherlands, NewZealand, the Philippines, Singapore, and the United Kingdom.
Principles of Consolidation
The consolidated financial statements include the accounts of the Company and its foreign anddomestic subsidiaries. All significant intercompany accounts and transactions have beeneliminated.
Inventories
Inventories are valued at the lower of cost or market. Product cost includes raw materials, labor,and overhead costs and is accounted for on a first-in, first-out basis. On a periodic basis, theCompany reviews its inventory levels, as compared to future demand requirements and the shelflife of the various products. Based on this review, the Company records inventory write-downswhen necessary.
Sales aids and promotional materials inventories represent distributor kits, product brochures,and other sales and business development materials which are held for sale to distributors. Costof the sales aids and promotional materials held for sale are capitalized as inventories andsubsequently recorded to cost of goods sold upon recognition of revenue when sold todistributors. All other advertising and promotional costs are expensed when incurred.
Property, Plant, and Equipment
Property, plant, and equipment are stated on the cost basis. Depreciation is computed using thestraight-line or an accelerated method over the useful life of the related assets. Generally,computer equipment and software are depreciated over 5 years, office equipment and machineryover 7 years, and real property over 39 years.
Reliv’ International, Inc. and Subsidiaries
Notes to Consolidated Financial Statements
F-9
1. Nature of Business and Significant Accounting Policies (continued)
Foreign Currency Translation and Transaction Gains or Losses
All balance sheet accounts have been translated using the exchange rates in effect at the balancesheet date. Statements of income amounts have been translated using the average exchange ratefor the year. The gains and losses resulting from the changes in exchange rates from year to yearhave been reported in other comprehensive income (loss). The foreign currency translationadjustment is the only component of accumulated other comprehensive loss. If applicable,foreign currency translation adjustments exclude income tax expense (benefit) as certain of theCompany’s investments in non-U.S. subsidiaries are deemed to be reinvested for an indefiniteperiod of time. Transaction gains/(losses) were $(126,188) and $21,139 for 2013 and 2012,respectively.
Revenue Recognition
The Company receives payment by credit card, personal check, or guaranteed funds for ordersfrom independent distributors and makes related commission payments in the following month.Generally, net sales reflect product sales less the distributor discount of 20 percent to 40 percentof the suggested retail price. Sales revenue and commission expenses are recorded when themerchandise is shipped, as this is the point title and risk of loss pass to the distributor. Inaccordance with Financial Accounting Standards Board (“FASB”) Accounting StandardsCodification (“ASC”) Topic 605-50, “Revenue Recognition – Customer Payments andIncentives,” the Company presents distributor royalty and commission expense as an operatingexpense, rather than a reduction to net sales, as these payments are not made to the purchasingdistributor.
Actual and estimated sales returns are classified as a reduction of net sales. The Companyestimates and accrues a reserve for product returns based on the Company’s return policy andhistorical experience. The Company’s return policy allows for distributors to return product onlyupon termination of his or her distributorship. Allowable returns are limited to saleable productwhich was purchased within twelve months of the termination for a refund of 90% of the originalpurchase price less any distributor royalties and commission received relating to the originalpurchase of the returned products. For the years ended December 31, 2013 and 2012, totalreturns as a percent of net sales were approximately 0.57 % and 0.48%, respectively.
The Company records handling and freight income as a component of net sales and recordshandling and freight costs as a component of cost of products sold. Total revenues do notinclude sales tax as the Company considers itself a pass-through conduit for collecting andremitting applicable sales taxes.
Reliv’ International, Inc. and Subsidiaries
Notes to Consolidated Financial Statements
F-10
1. Nature of Business and Significant Accounting Policies (continued)
Basic and Diluted Earnings per Share
Basic earnings per common share are computed using the weighted average number of commonshares outstanding during the year. Diluted earnings per common share are computed using theweighted average number of common shares and potential dilutive common shares that wereoutstanding during the period. Potential dilutive common shares consist of outstanding stockoptions, outstanding stock warrants, and convertible preferred stock. See Note 8 for additionalinformation regarding earnings per share.
Stock-Based Compensation
The Company has stock-based incentive plans under which it may grant stock option, restrictedstock, and unrestricted stock awards. The Company recognizes stock-based compensationexpense based on the grant date fair value of the award and the related vesting terms. The fairvalue of stock-based awards is primarily determined using the Black-Scholes model, whichincorporates assumptions regarding the risk-free interest rate, expected volatility, expectedoption life, and dividend yield. See Note 7 for additional information.
The Company accounts for options granted to non-employees and warrants granted todistributors under the fair value approach required by FASB ASC Topic 505-50, “Equity BasedPayments to Non-Employees.”
Income Taxes
The provision for income taxes is computed using the liability method. The primary differencesbetween financial statement and taxable income result from financial statement accruals andreserves and differences between depreciation and stock options for book and tax purposes.
Unrecognized tax benefits are accounted for as required by FASB ASC Topic 740 whichprescribes a more likely than not threshold for financial statement presentation and measurementof a tax position taken or expected to be taken in a tax return. See Note 11 for further discussion.
Fair Value Measurements
FASB ASC Topic 820, “Fair Value Measurements and Disclosures,” defines fair value,establishes a framework for measuring fair value, and requires disclosures about fair valuemeasurements required under other accounting pronouncements. See Note 5 for furtherdiscussion.
Advertising
Costs of sales aids and promotional materials are capitalized as inventories. All other advertisingand promotional costs are expensed when incurred. The Company recorded $191,800 and$44,000 of advertising expense in 2013 and 2012, respectively.
Reliv’ International, Inc. and Subsidiaries
Notes to Consolidated Financial Statements
F-11
1. Nature of Business and Significant Accounting Policies (continued)
Amortizable Intangible Assets
The Company records intangible assets based on management’s determination of the fair valueof the respective assets at the time of acquisition. Determining the fair value of intangible assetsis judgmental and involves the use of significant estimates and assumptions of future companyoperations. The Company bases its fair value estimates and related asset lives on assumptions itbelieves to be reasonable but that are unpredictable and inherently uncertain. Actual futureresults may differ from these estimates.
Intangible assets estimated to have finite estimable lives are amortized over their estimatedeconomic life under the straight-line method; such method correlates to management’s estimateof the assets’ economic benefit. Based on management’s estimates at origination, these livesrange from two to seventeen years. Related amortization expense is presented within Selling,General, and Administrative in the accompanying consolidated statements of net income andcomprehensive income. As of December 31, 2013, remaining lives of intangible assets rangefrom three to seventeen years.
Research and Development Expenses
Research and development expenses, which are charged to selling, general, and administrativeexpenses as incurred, were $565,000 and $587,000 in 2013 and 2012, respectively.
Cash Equivalents
The Company's policy is to consider the following as cash and cash equivalents: demanddeposits and short-term investments with a maturity of three months or less when purchased.
Use of Estimates
The preparation of financial statements in conformity with accounting principles generallyaccepted in the United States requires management to make estimates and assumptions thataffect the amounts reported in the financial statements and accompanying notes. Actual resultscould differ from those estimates.
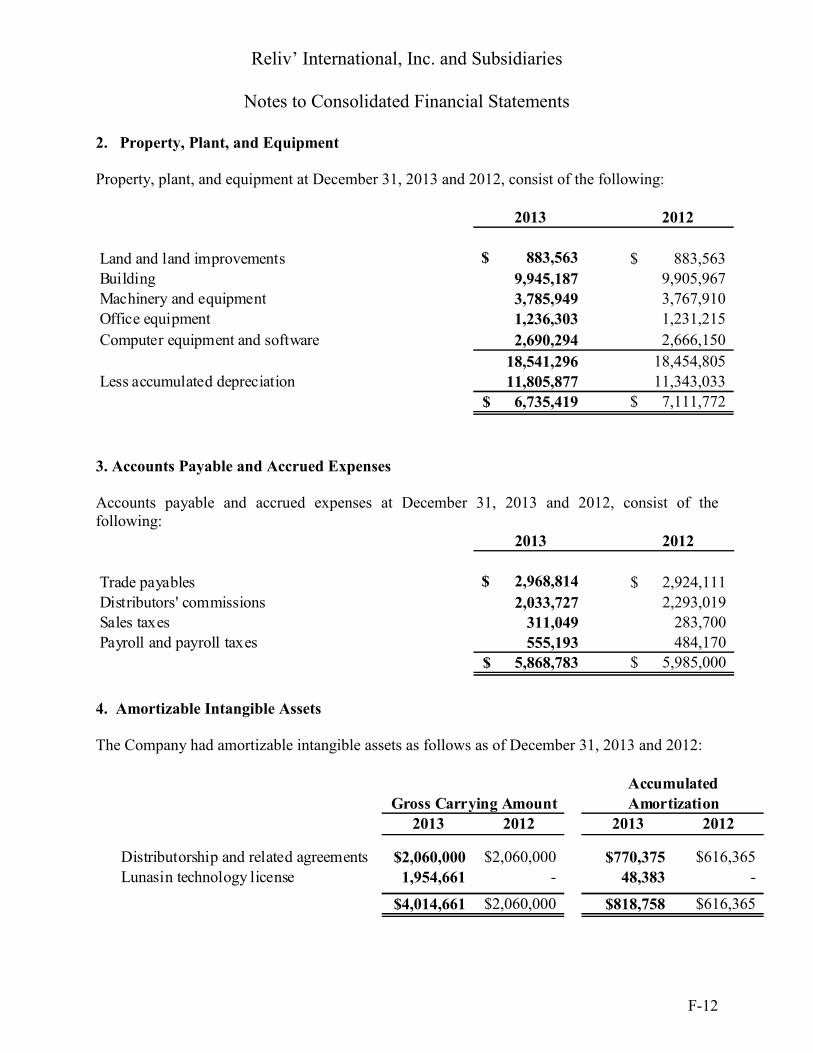
Reliv’ International, Inc. and Subsidiaries
Notes to Consolidated Financial Statements
F-12
2. Property, Plant, and Equipment
Property, plant, and equipment at December 31, 2013 and 2012, consist of the following:
2013 2012
Land and land improvements 883,563$ 883,563$Building 9,945,187 9,905,967
Machinery and equipment 3,785,949 3,767,910
Office equipment 1,236,303 1,231,215
Computer equipment and software 2,690,294 2,666,150
18,541,296 18,454,805
Less accumulated depreciation 11,805,877 11,343,033
6,735,419$ 7,111,772$
3. Accounts Payable and Accrued Expenses
Accounts payable and accrued expenses at December 31, 2013 and 2012, consist of thefollowing:
2013 2012
Trade payables 2,968,814$ 2,924,111$
Distributors' commissions 2,033,727 2,293,019Sales taxes 311,049 283,700
Payroll and payroll taxes 555,193 484,170
5,868,783$ 5,985,000$
4. Amortizable Intangible Assets
The Company had amortizable intangible assets as follows as of December 31, 2013 and 2012:
2013 2012 2013 2012
Distributorship and related agreements $2,060,000 $2,060,000 $770,375 $616,365
Lunasin technology license 1,954,661 - 48,383 -
$4,014,661 $2,060,000 $818,758 $616,365
Gross Carrying Amount Amortization
Accumulated
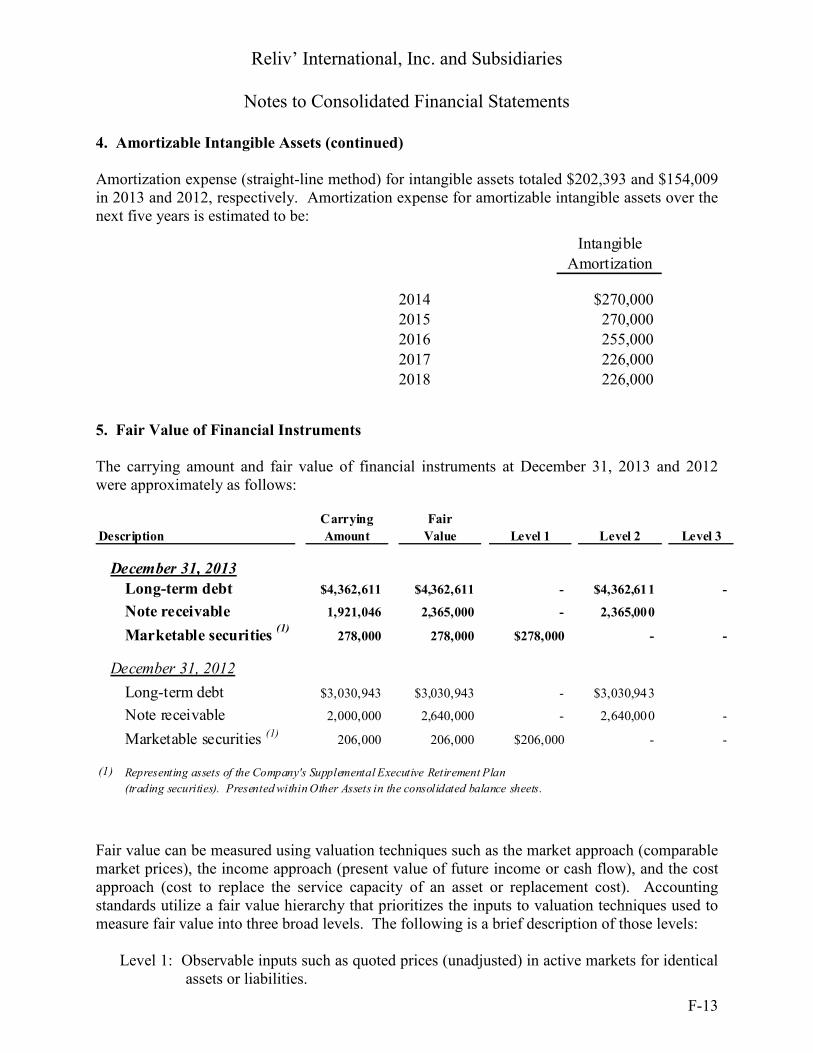
Reliv’ International, Inc. and Subsidiaries
Notes to Consolidated Financial Statements
F-13
4. Amortizable Intangible Assets (continued)
Amortization expense (straight-line method) for intangible assets totaled $202,393 and $154,009in 2013 and 2012, respectively. Amortization expense for amortizable intangible assets over thenext five years is estimated to be:
Intangible
Amortization
2014 $270,0002015 270,0002016 255,000
2017 226,0002018 226,000
5. Fair Value of Financial Instruments
The carrying amount and fair value of financial instruments at December 31, 2013 and 2012were approximately as follows:
Carrying Fair
Description Amount Value Level 1 Level 2 Level 3
December 31, 2013
Long-term debt $4,362,611 $4,362,611 - $4,362,611 -
Note receivable 1,921,046 2,365,000 - 2,365,000
Marketable securities(1)
278,000 278,000 $278,000 - -
December 31, 2012
Long-term debt $3,030,943 $3,030,943 - $3,030,943
Note receivable 2,000,000 2,640,000 - 2,640,000 -
Marketable securities (1)206,000 206,000 $206,000 - -
(1) Representing assets of the Company's Supplemental Executive Retirement Plan
(trading securities). Presented within Other Assets in the consolidated balance sheets.
Fair value can be measured using valuation techniques such as the market approach (comparablemarket prices), the income approach (present value of future income or cash flow), and the costapproach (cost to replace the service capacity of an asset or replacement cost). Accountingstandards utilize a fair value hierarchy that prioritizes the inputs to valuation techniques used tomeasure fair value into three broad levels. The following is a brief description of those levels:
Level 1: Observable inputs such as quoted prices (unadjusted) in active markets for identicalassets or liabilities.

Reliv’ International, Inc. and Subsidiaries
Notes to Consolidated Financial Statements
F-14
5. Fair Value of Financial Instruments (continued)
Level 2: Inputs other than quoted prices that are observable for the asset or liability, eitherdirectly or indirectly. These include quoted prices for similar assets or liabilities inactive markets or similar assets or liabilities in markets that are not active.
Level 3: Unobservable inputs that reflect the reporting entity’s own assumptions.
The carrying value of other financial instruments, including cash, accounts receivable andaccounts payable, and accrued liabilities approximate fair value due to their short maturities orvariable-rate nature of the respective balances.
6. Debt
Debt at December 31, 2013 and 2012 consists of the following:
2013 2012
Term loan 2,400,697$ 2,807,298$Revolving line of credit 1,150,000 -
Obligation for acquisition of technology license, net 811,914 -Obligation for purchase of distributorship, as modified - 223,645
4,362,611 3,030,943
Less current maturities 581,004 629,631
3,781,607$ 2,401,312$
Principal maturities of debt at December 31, 2013, are as follows:
2014 $ 581,004
2015 643,4672016 2,926,226
2017 211,9142018 -
Thereafter -
$ 4,362,611
Revolving loan agreements
Effective October 1, 2011, upon expiration of a previous revolving loan agreement, the Companyentered into a new $5 million one-year revolving loan agreement (2011) with its primary lender.The 2011 agreement expired September 2012.
Reliv’ International, Inc. and Subsidiaries
Notes to Consolidated Financial Statements
F-15
6. Debt (continued)
Revolving loan agreements (continued)
Effective September 30, 2012, the Company entered into a new one-year $5 million revolvingloan agreement (2012) with its primary lender. Similar to the previous agreements, any advancesunder the revolver accrue interest at a variable interest rate based on 30-day LIBOR + 1.85%.Interest, if any, is payable monthly. In August 2013, in conjunction with its acquisition of atechnology license, the Company borrowed $1.15 million under its revolving line of credit andthis balance remained outstanding at December 31, 2013.
On February 28, 2014, the Company and its primary lender amended the revolving line of creditagreement and the term loan agreement. As part of the amendment, the $5 million revolving lineof credit agreement has been extended to July 1, 2016 and the outstanding revolving loan balanceof $1.15 million has been re-financed into the term loan balance. As a result, the Company haspresented the December 31, 2013 revolving line of credit balance of $1,150,000 as non-currentin the accompanying consolidated balance sheets.
Term Loan
On November 30, 2010, the Company re-financed its then-existing term loan agreement with itsprimary lender. The 2010 re-financed term loan was for a period of three years with interestaccruing at a floating interest rate based on the 30-day LIBOR plus 2%. Monthly principal andinterest were based on approximately a nine-year amortization with a balloon payment for theoutstanding balance due and payable on November 30, 2013.
On September 30, 2012, the Company re-financed the 2010 term loan agreement with its primarylender. The 2012 re-financed term loan is for a period of thirty-eight months with interestaccruing at a floating interest rate based on the 30-day LIBOR plus 2%. At December 31, 2013,the term loan’s interest rate was 2.17%. Monthly principal and interest are based onapproximately a seven-year amortization. The aggregate outstanding balance of principal andinterest was due and payable on November 30, 2015.
On February 28, 2014, the Company re-financed the 2012 term loan agreement and its revolvingline of credit agreement with its primary lender. The 2014 re-financed term loan is for a periodof twenty-eight months with the same floating interest rate pricing as the 2012 term loan. Thetotal borrowings on the new 2014 term loan is approximately $3.5 million and consists of theFebruary 28, 2014 outstanding balances of the 2012 term loan and the revolving line of creditloan balance of $1.15 million. Thus, upon the completion of this February 28, 2014 re-financing,the Company had no outstanding borrowings under its revolving line of credit agreement.

Reliv’ International, Inc. and Subsidiaries
Notes to Consolidated Financial Statements
F-16
6. Debt (continued)
Term Loan (continued)
The term loan agreement and revolving line of credit agreement are secured by all tangible andintangible assets of the Company and also by a mortgage on the real estate of the Company’sheadquarters. These agreements also include loan covenants requiring the Company to maintainnet tangible worth of not less than $11 million, and that borrowings under the agreements shallnot exceed EBITDA by a ratio of 2.5 to 1. At December 31, 2013, the Company was incompliance with its loan covenants.
Obligation for Acquisition of Technology License, net
In July 2013, a newly-formed, wholly-owned subsidiary of the Company entered into aTechnology License Agreement (TLA) with a privately-held company. The TLA provides theCompany the exclusive license for certain intellectual property related to the nutritionalingredient lunasin and other soy-related peptides and proteins. In consideration for the TLA, theCompany agreed to pay the licensor a purchase price of $2 million; $1.15 million paid at closing,with the remaining obligation (non-interest bearing) paid over the next four years in a series ofannual payments ranging from $150,000 to $250,000 as stated in the agreement. Subject tocertain minimum and maximum thresholds, the Company may also pay the licensor royalties of5% of sales during the first five years of the TLA and royalties ranging from 1% to 3% of salesduring the remaining life of the TLA. As of December 31, 2013, management’s estimate ofearned but unpaid royalties is zero. The Company has accounted for the TLA as an assetpurchase acquisition consisting of a long-term finite-lived asset to be amortized over the life ofthe associated intellectual property (approximately seventeen years).
Obligation for Purchase of Distributorship, as modified
On August 31, 2009, the Company acquired an independent Reliv distributorship from its owner(“Seller”) which resulted in the Seller financing $1,343,881 of the purchase price over a periodof seven years with monthly payments of principal and interest totaling $18,994.
At June 30, 2012, the Company’s remaining balance due to the Seller under this transaction wasapproximately $856,000. On July 17, 2012, the Company and Seller entered into an Agreementto modify the Company’s remaining obligation to equal twelve consecutive monthly payments ofprincipal and interest of $37,500 with the first payment commencing in July 2012. TheCompany has presented the 2012 non-cash gain of $410,320 relating to this modification asOther Income in the accompanying consolidated statements of net income and comprehensiveincome. As of December 31, 2013, the Company’s obligation for purchase of a distributorshiphas been repaid.
Reliv’ International, Inc. and Subsidiaries
Notes to Consolidated Financial Statements
F-17
7. Stockholders’ Equity
Stock Options
2009 Incentive Stock Plan
The Company sponsors an incentive stock plan (the “2009 Plan”) allowing for a maximum of1,000,000 shares to be granted in the form of either incentive stock options, non-qualified stockoptions, restricted stock awards, or unrestricted stock awards. Employees, directors, advisors,and consultants of the Company are eligible to receive the grants. The plan has been approvedby the stockholders of the Company. The Compensation Committee of the Board of Directorsadministers the plan.
The 2009 Plan provides that options may be issued under the plan at an option price not less thanfair market value of the stock at the time the option is granted. Under the 2009 Plan, restrictedstock of the Company may be granted at no cost to the grantee. The grantees are entitled todividends and voting rights for their respective shares. Restrictions limit the sale or transfer ofthese shares during the requisite service period. In addition, the committee may grant or sellunrestricted stock at a purchase price to be determined by the committee.
Vesting terms and restrictions, if applicable, under the plan, are set by the committee and will be10 years or less. The 2009 Plan expires in 2019.
In January 2012, the Company issued stock option grants totaling 775,000 shares. These optiongrants contain exercise prices ranging from $1.20 to $1.32 per share with a five-year term. Onehalf of the options granted have time vesting provisions ranging from one to 4.8 years while theremainder have vesting provisions that are contingent upon the Company achieving certainfinancial performance measurements. The aggregate estimated compensation cost related to thetime vesting stock option grant is $172,000 recognized on a straight-line basis over the weightedrequisite service periods. The aggregate estimated compensation cost related to the performancebased options is $185,000; however, recognition is contingent upon performance vesting. Thegrant-date fair value of the options range from $0.42 to $0.48 per share and was determinedusing the Black-Scholes option pricing model using an average risk-free rate of 0.82%, anaverage dividend yield of 1.60%, and an average volatility of 49.31%.
In March 2013, the Company issued performance-based stock option grants totaling 230,000shares. These option grants have an exercise price of $1.17 per share with a five-year term. Theoptions’ vesting provisions are contingent upon the Company achieving certain financialperformance measurements. The aggregate estimated compensation cost related to theperformance based options is $110,400; however, recognition is contingent upon performancevesting. The grant-date fair value of the options was $0.48 per share and was determined using abinomial option pricing model using an average risk-free rate of 0.90%, an average dividendyield of 1.60%, and an average volatility of 52.7%.
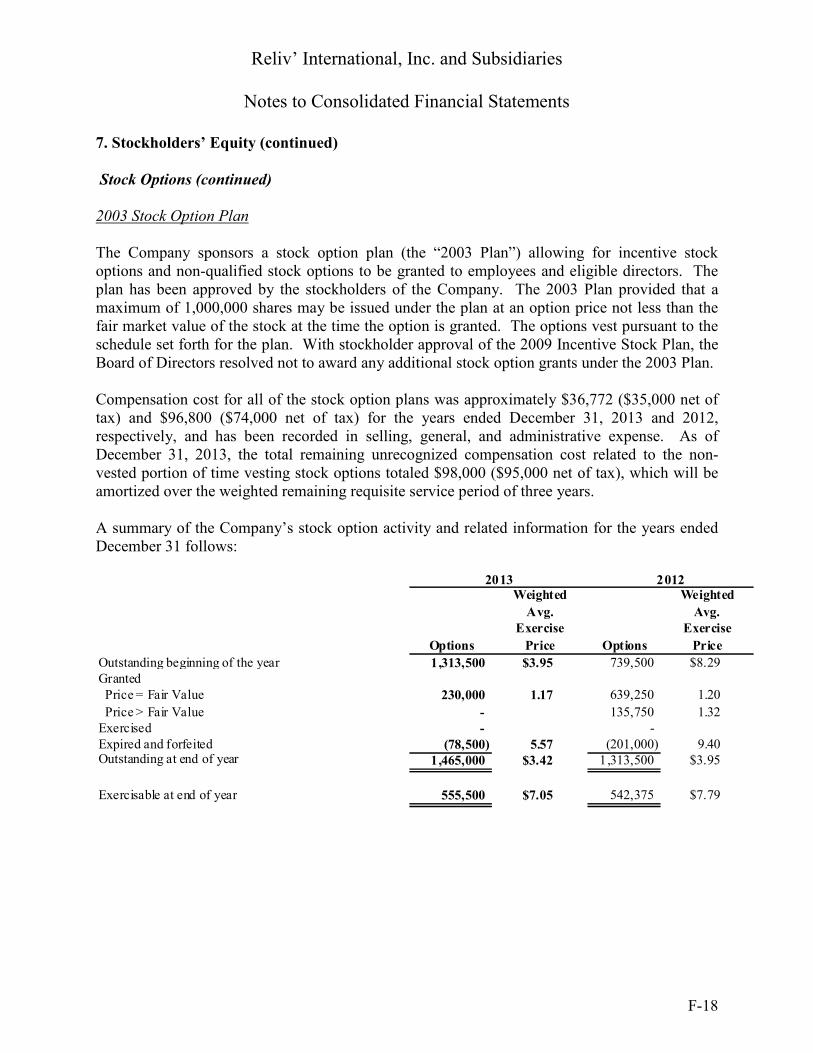
Reliv’ International, Inc. and Subsidiaries
Notes to Consolidated Financial Statements
F-18
7. Stockholders’ Equity (continued)
Stock Options (continued)
2003 Stock Option Plan
The Company sponsors a stock option plan (the “2003 Plan”) allowing for incentive stockoptions and non-qualified stock options to be granted to employees and eligible directors. Theplan has been approved by the stockholders of the Company. The 2003 Plan provided that amaximum of 1,000,000 shares may be issued under the plan at an option price not less than thefair market value of the stock at the time the option is granted. The options vest pursuant to theschedule set forth for the plan. With stockholder approval of the 2009 Incentive Stock Plan, theBoard of Directors resolved not to award any additional stock option grants under the 2003 Plan.
Compensation cost for all of the stock option plans was approximately $36,772 ($35,000 net oftax) and $96,800 ($74,000 net of tax) for the years ended December 31, 2013 and 2012,respectively, and has been recorded in selling, general, and administrative expense. As ofDecember 31, 2013, the total remaining unrecognized compensation cost related to the non-vested portion of time vesting stock options totaled $98,000 ($95,000 net of tax), which will beamortized over the weighted remaining requisite service period of three years.
A summary of the Company’s stock option activity and related information for the years endedDecember 31 follows:
Options
Weighted
Avg.Exercise
Price Options
Weighted
Avg.Exercise
Price
Outstanding beginning of the year 1,313,500 $3.95 739,500 $8.29GrantedPrice = Fair Value 230,000 1.17 639,250 1.20
Price > Fair Value - 135,750 1.32Exercised - -Expired and forfeited (78,500) 5.57 (201,000) 9.40Outstanding at end of year 1,465,000 $3.42 1,313,500 $3.95
Exercisable at end of year 555,500 $7.05 542,375 $7.79
2013 2012
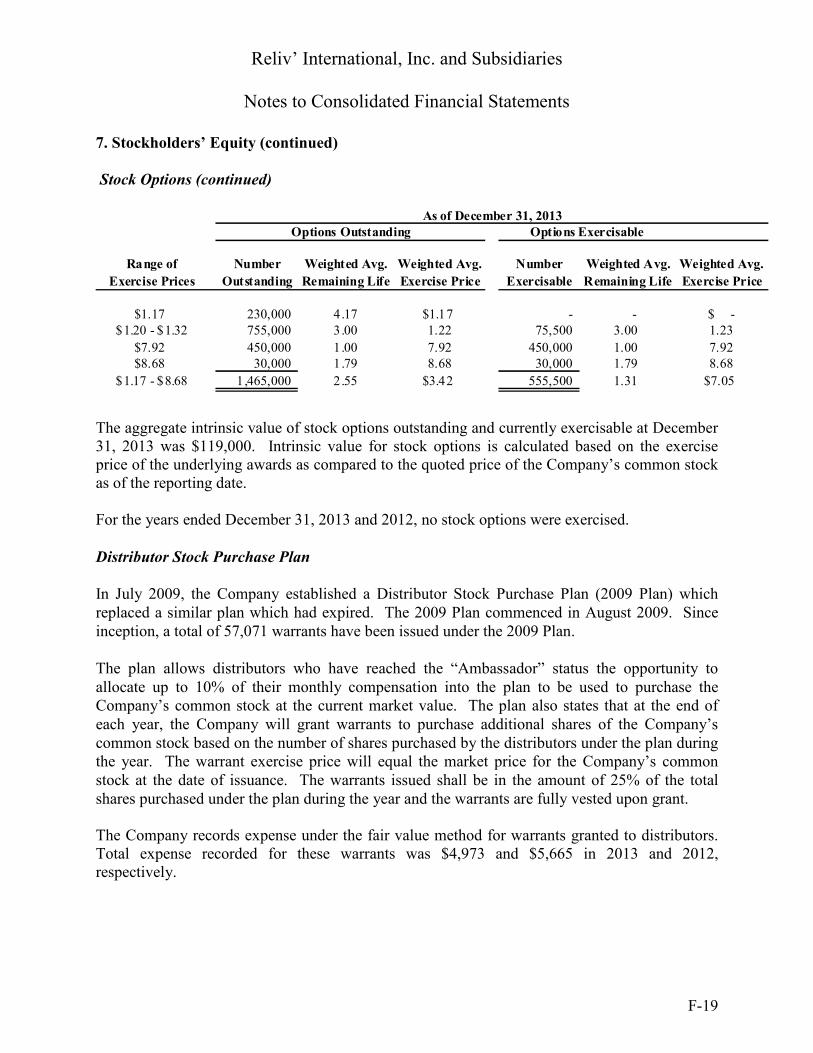
Reliv’ International, Inc. and Subsidiaries
Notes to Consolidated Financial Statements
F-19
7. Stockholders’ Equity (continued)
Stock Options (continued)
Range of
Exercise Prices
Number
Outstanding
Weighted Avg.
Remaining Life
Weighted Avg.
Exercise Price
Number
Exercisable
Weighted Avg.
Remaining Life
Weighted Avg.
Exercise Price
$1.17 230,000 4.17 $1.17 - - $ -$1.20 - $1.32 755,000 3.00 1.22 75,500 3.00 1.23
$7.92 450,000 1.00 7.92 450,000 1.00 7.92$8.68 30,000 1.79 8.68 30,000 1.79 8.68
$1.17 - $8.68 1,465,000 2.55 $3.42 555,500 1.31 $7.05
Options Outstanding Options ExercisableAs of December 31, 2013
The aggregate intrinsic value of stock options outstanding and currently exercisable at December31, 2013 was $119,000. Intrinsic value for stock options is calculated based on the exerciseprice of the underlying awards as compared to the quoted price of the Company’s common stockas of the reporting date.
For the years ended December 31, 2013 and 2012, no stock options were exercised.
Distributor Stock Purchase Plan
In July 2009, the Company established a Distributor Stock Purchase Plan (2009 Plan) whichreplaced a similar plan which had expired. The 2009 Plan commenced in August 2009. Sinceinception, a total of 57,071 warrants have been issued under the 2009 Plan.
The plan allows distributors who have reached the “Ambassador” status the opportunity toallocate up to 10% of their monthly compensation into the plan to be used to purchase theCompany’s common stock at the current market value. The plan also states that at the end ofeach year, the Company will grant warrants to purchase additional shares of the Company’scommon stock based on the number of shares purchased by the distributors under the plan duringthe year. The warrant exercise price will equal the market price for the Company’s commonstock at the date of issuance. The warrants issued shall be in the amount of 25% of the totalshares purchased under the plan during the year and the warrants are fully vested upon grant.
The Company records expense under the fair value method for warrants granted to distributors.Total expense recorded for these warrants was $4,973 and $5,665 in 2013 and 2012,respectively.
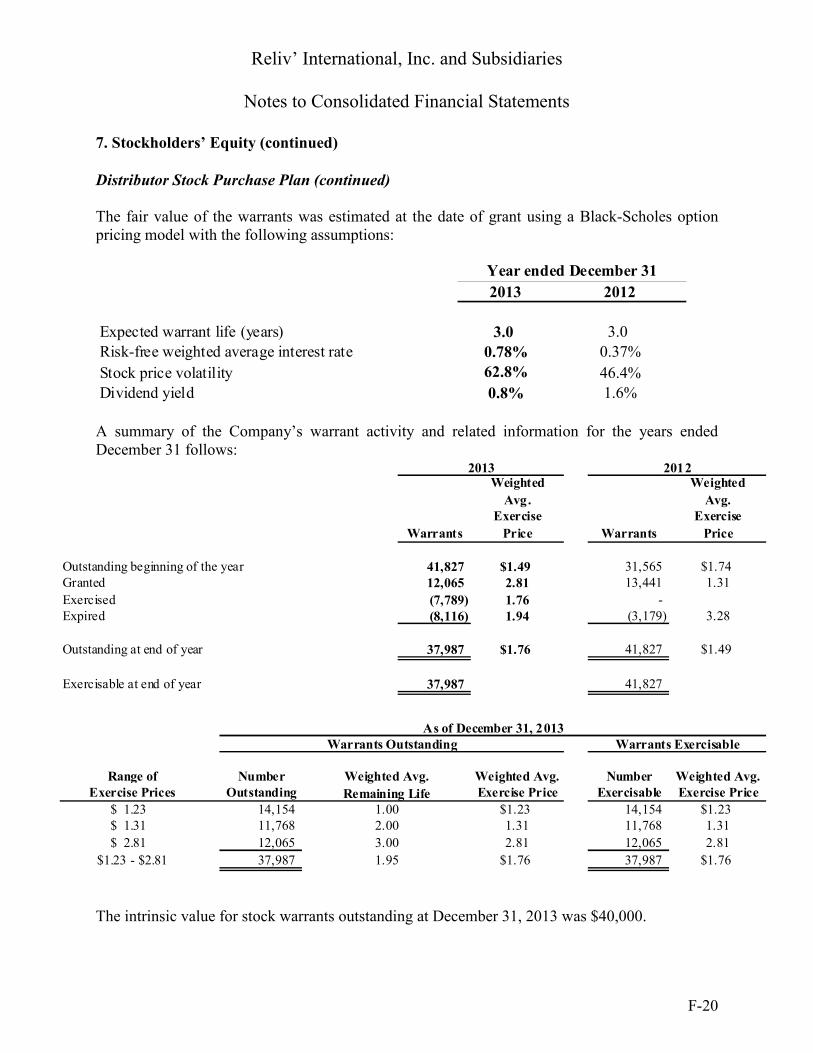
Reliv’ International, Inc. and Subsidiaries
Notes to Consolidated Financial Statements
F-20
7. Stockholders’ Equity (continued)
Distributor Stock Purchase Plan (continued)
The fair value of the warrants was estimated at the date of grant using a Black-Scholes optionpricing model with the following assumptions:
2013 2012
Expected warrant life (years) 3.0 3.0Risk-free weighted average interest rate 0.78% 0.37%
Stock price volatility 62.8% 46.4%Dividend yield 0.8% 1.6%
Year ended December 31
A summary of the Company’s warrant activity and related information for the years endedDecember 31 follows:
Warrants
Weighted
Avg.Exercise
Price Warrants
Weighted
Avg.Exercise
Price
Outstanding beginning of the year 41,827 $1.49 31,565 $1.74Granted 12,065 2.81 13,441 1.31
Exercised (7,789) 1.76 -Expired (8,116) 1.94 (3,179) 3.28
Outstanding at end of year 37,987 $1.76 41,827 $1.49
Exercisable at end of year 37,987 41,827
Range ofExercise Prices
NumberOutstanding
Weighted Avg.Exercise Price
NumberExercisable
Weighted Avg.Exercise Price
$ 1.23 14,154 $1.23 14,154 $1.23$ 1.31 11,768 1.31 11,768 1.31
$ 2.81 12,065 2.81 12,065 2.81
$1.23 - $2.81 37,987 $1.76 37,987 $1.76
2012
1.95
2.001.00
2013
3.00
Weighted Avg.
Remaining Life
As of December 31, 2013Warrants Outstanding Warrants Exercisable
The intrinsic value for stock warrants outstanding at December 31, 2013 was $40,000.
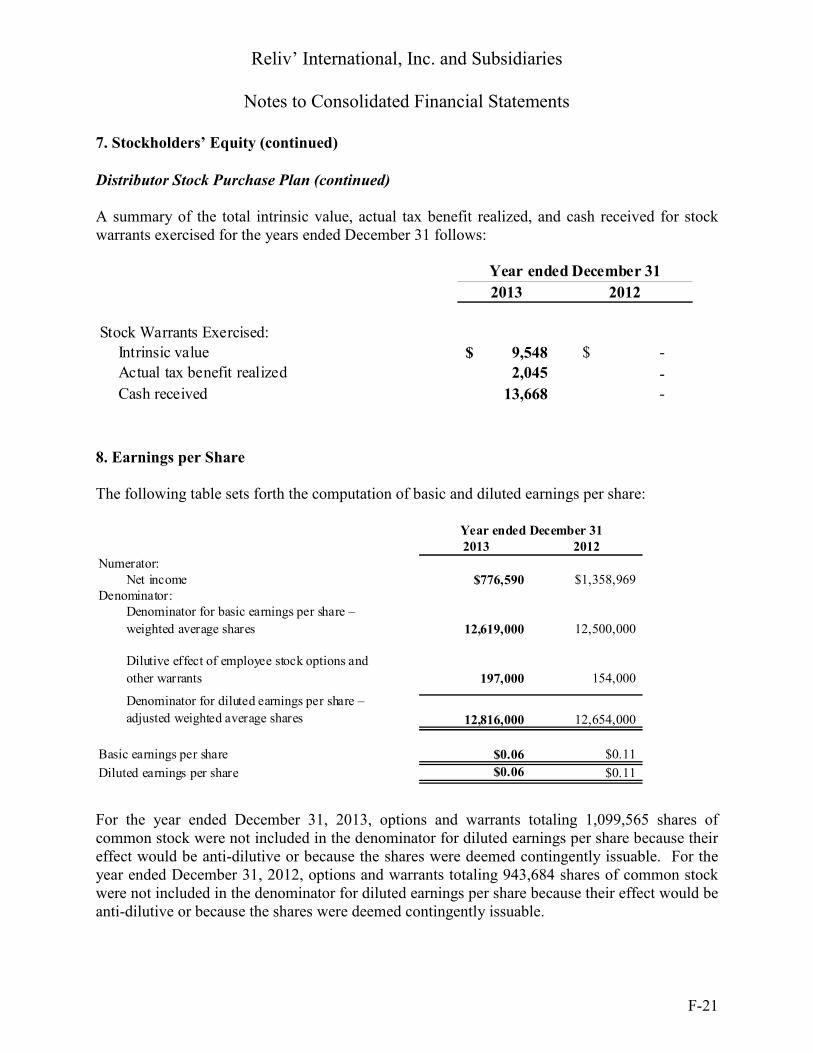
Reliv’ International, Inc. and Subsidiaries
Notes to Consolidated Financial Statements
F-21
7. Stockholders’ Equity (continued)
Distributor Stock Purchase Plan (continued)
A summary of the total intrinsic value, actual tax benefit realized, and cash received for stockwarrants exercised for the years ended December 31 follows:
2013 2012
Stock Warrants Exercised:Intrinsic value 9,548$ -$
Actual tax benefit realized 2,045 -Cash received 13,668 -
Year ended December 31
8. Earnings per Share
The following table sets forth the computation of basic and diluted earnings per share:
2013 2012
Numerator:Net income $776,590 $1,358,969
Denominator:Denominator for basic earnings per share –
weighted average shares 12,619,000 12,500,000
Dilutive effect of employee stock options and
other warrants 197,000 154,000
Denominator for diluted earnings per share –
adjusted weighted average shares 12,816,000 12,654,000
Basic earnings per share $0.06 $0.11
Diluted earnings per share $0.06 $0.11
Year ended December 31
For the year ended December 31, 2013, options and warrants totaling 1,099,565 shares ofcommon stock were not included in the denominator for diluted earnings per share because theireffect would be anti-dilutive or because the shares were deemed contingently issuable. For theyear ended December 31, 2012, options and warrants totaling 943,684 shares of common stockwere not included in the denominator for diluted earnings per share because their effect would beanti-dilutive or because the shares were deemed contingently issuable.
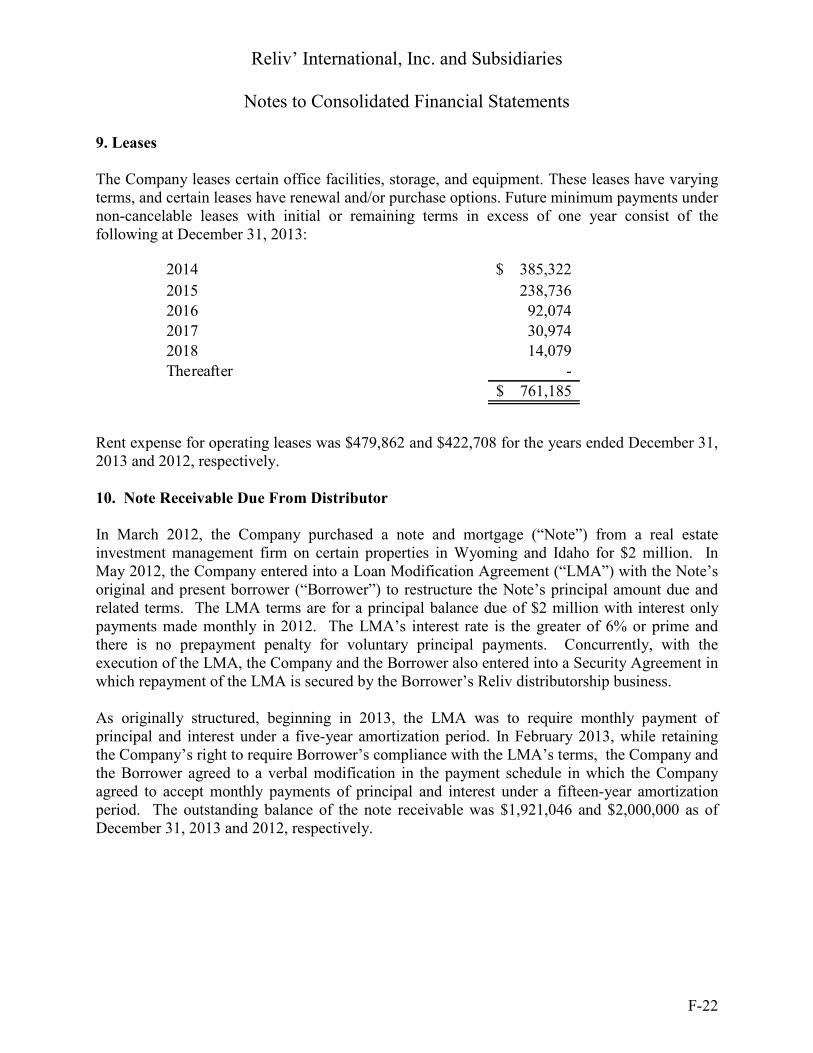
Reliv’ International, Inc. and Subsidiaries
Notes to Consolidated Financial Statements
F-22
9. Leases
The Company leases certain office facilities, storage, and equipment. These leases have varyingterms, and certain leases have renewal and/or purchase options. Future minimum payments undernon-cancelable leases with initial or remaining terms in excess of one year consist of thefollowing at December 31, 2013:
2014 385,322$
2015 238,736
2016 92,074
2017 30,9742018 14,079
Thereafter -
761,185$
Rent expense for operating leases was $479,862 and $422,708 for the years ended December 31,2013 and 2012, respectively.
10. Note Receivable Due From Distributor
In March 2012, the Company purchased a note and mortgage (“Note”) from a real estateinvestment management firm on certain properties in Wyoming and Idaho for $2 million. InMay 2012, the Company entered into a Loan Modification Agreement (“LMA”) with the Note’soriginal and present borrower (“Borrower”) to restructure the Note’s principal amount due andrelated terms. The LMA terms are for a principal balance due of $2 million with interest onlypayments made monthly in 2012. The LMA’s interest rate is the greater of 6% or prime andthere is no prepayment penalty for voluntary principal payments. Concurrently, with theexecution of the LMA, the Company and the Borrower also entered into a Security Agreement inwhich repayment of the LMA is secured by the Borrower’s Reliv distributorship business.
As originally structured, beginning in 2013, the LMA was to require monthly payment ofprincipal and interest under a five-year amortization period. In February 2013, while retainingthe Company’s right to require Borrower’s compliance with the LMA’s terms, the Company andthe Borrower agreed to a verbal modification in the payment schedule in which the Companyagreed to accept monthly payments of principal and interest under a fifteen-year amortizationperiod. The outstanding balance of the note receivable was $1,921,046 and $2,000,000 as ofDecember 31, 2013 and 2012, respectively.
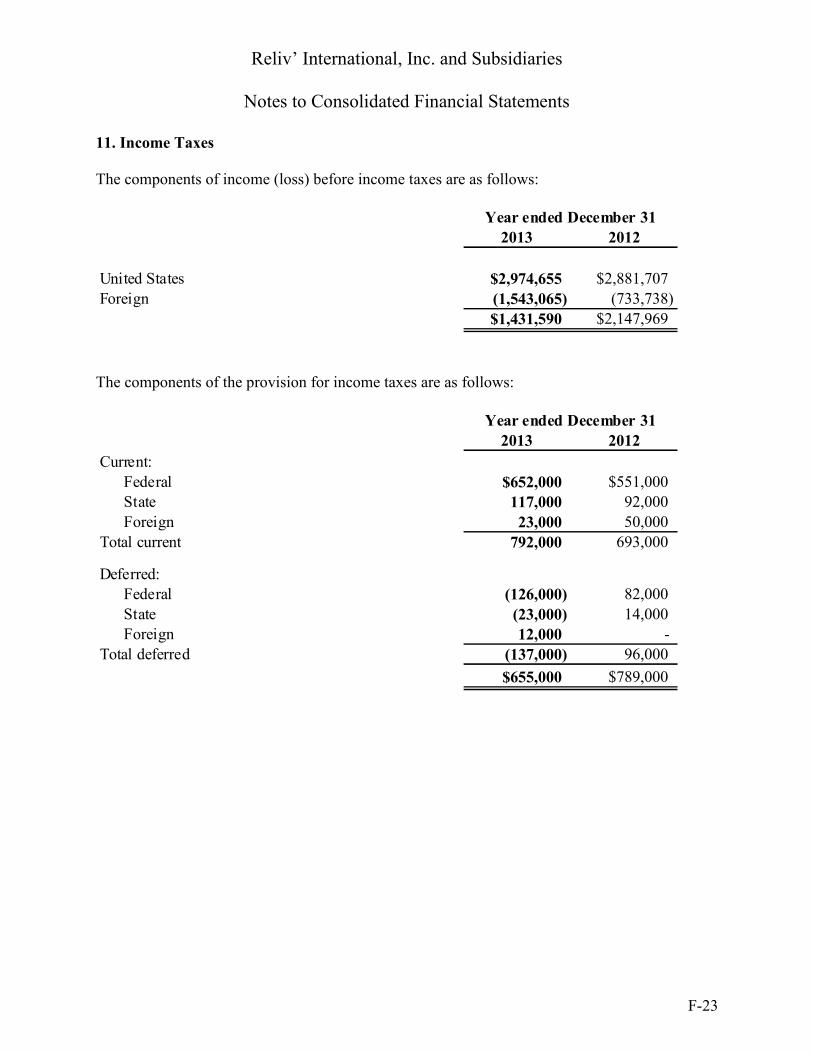
Reliv’ International, Inc. and Subsidiaries
Notes to Consolidated Financial Statements
F-23
11. Income Taxes
The components of income (loss) before income taxes are as follows:
2013 2012
United States $2,974,655 $2,881,707
Foreign (1,543,065) (733,738)
$1,431,590 $2,147,969
Year ended December 31
The components of the provision for income taxes are as follows:
2013 2012
Current:
Federal $652,000 $551,000State 117,000 92,000
Foreign 23,000 50,000
Total current 792,000 693,000
Deferred:Federal (126,000) 82,000
State (23,000) 14,000Foreign 12,000 -
Total deferred (137,000) 96,000
$655,000 $789,000
Year ended December 31
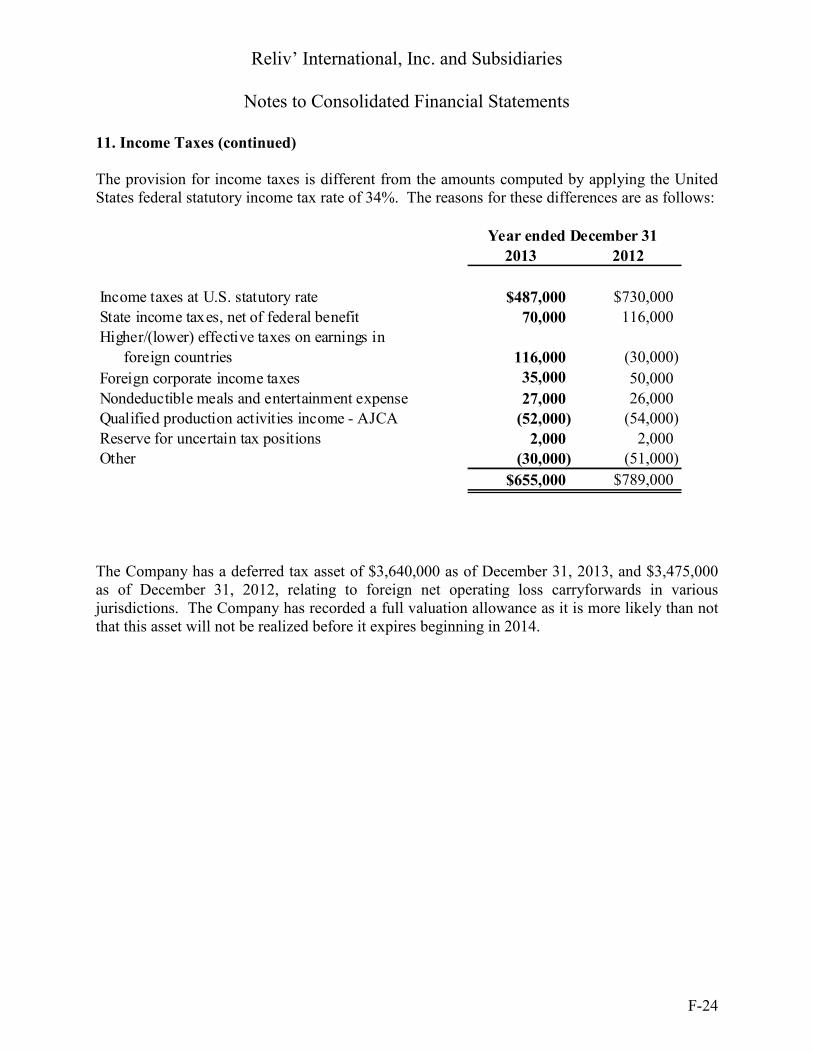
Reliv’ International, Inc. and Subsidiaries
Notes to Consolidated Financial Statements
F-24
11. Income Taxes (continued)
The provision for income taxes is different from the amounts computed by applying the UnitedStates federal statutory income tax rate of 34%. The reasons for these differences are as follows:
2013 2012
Income taxes at U.S. statutory rate $487,000 $730,000
State income taxes, net of federal benefit 70,000 116,000Higher/(lower) effective taxes on earnings in
foreign countries 116,000 (30,000)
Foreign corporate income taxes 35,000 50,000
Nondeductible meals and entertainment expense 27,000 26,000Qualified production activities income - AJCA (52,000) (54,000)
Reserve for uncertain tax positions 2,000 2,000Other (30,000) (51,000)
$655,000 $789,000
Year ended December 31
The Company has a deferred tax asset of $3,640,000 as of December 31, 2013, and $3,475,000as of December 31, 2012, relating to foreign net operating loss carryforwards in variousjurisdictions. The Company has recorded a full valuation allowance as it is more likely than notthat this asset will not be realized before it expires beginning in 2014.
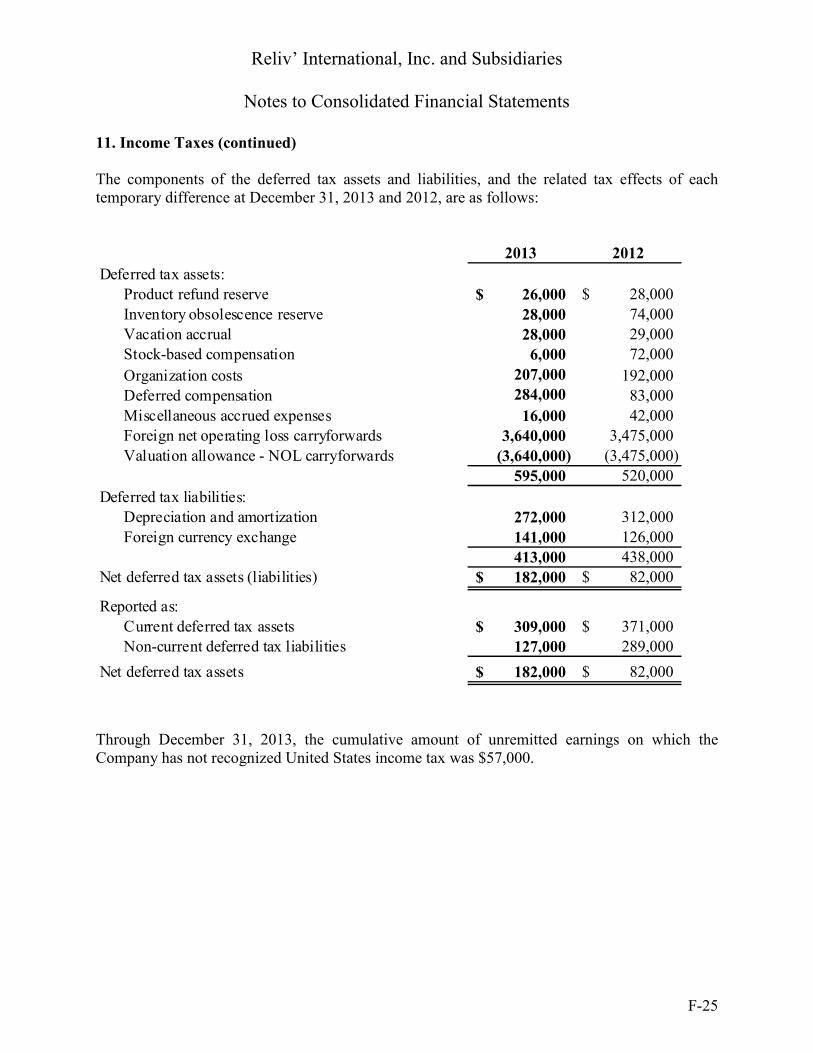
Reliv’ International, Inc. and Subsidiaries
Notes to Consolidated Financial Statements
F-25
11. Income Taxes (continued)
The components of the deferred tax assets and liabilities, and the related tax effects of eachtemporary difference at December 31, 2013 and 2012, are as follows:
2013 2012
Deferred tax assets:Product refund reserve 26,000$ 28,000$
Inventory obsolescence reserve 28,000 74,000Vacation accrual 28,000 29,000Stock-based compensation 6,000 72,000
Organization costs 207,000 192,000Deferred compensation 284,000 83,000
Miscellaneous accrued expenses 16,000 42,000Foreign net operating loss carryforwards 3,640,000 3,475,000
Valuation allowance - NOL carryforwards (3,640,000) (3,475,000)
595,000 520,000
Deferred tax liabilities:Depreciation and amortization 272,000 312,000
Foreign currency exchange 141,000 126,000
413,000 438,000Net deferred tax assets (liabilities) 182,000$ 82,000$
Reported as:
Current deferred tax assets 309,000$ 371,000$Non-current deferred tax liabilities 127,000 289,000
Net deferred tax assets 182,000$ 82,000$
Through December 31, 2013, the cumulative amount of unremitted earnings on which theCompany has not recognized United States income tax was $57,000.
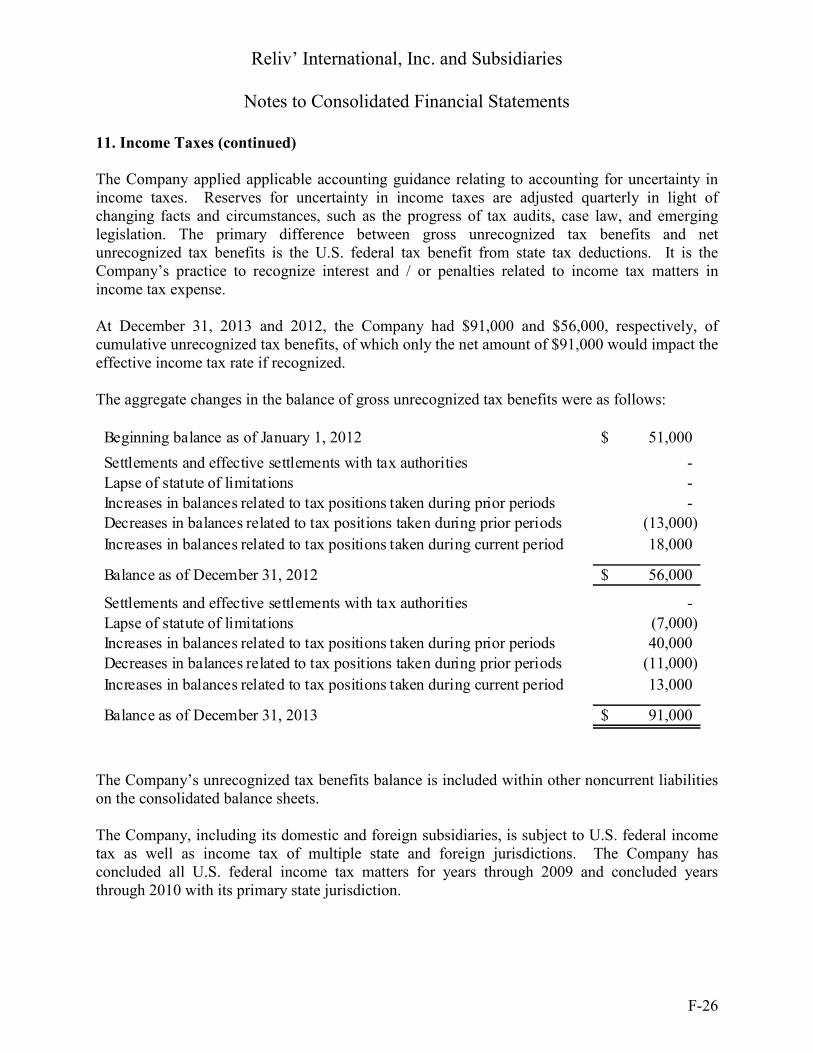
Reliv’ International, Inc. and Subsidiaries
Notes to Consolidated Financial Statements
F-26
11. Income Taxes (continued)
The Company applied applicable accounting guidance relating to accounting for uncertainty inincome taxes. Reserves for uncertainty in income taxes are adjusted quarterly in light ofchanging facts and circumstances, such as the progress of tax audits, case law, and emerginglegislation. The primary difference between gross unrecognized tax benefits and netunrecognized tax benefits is the U.S. federal tax benefit from state tax deductions. It is theCompany’s practice to recognize interest and / or penalties related to income tax matters inincome tax expense.
At December 31, 2013 and 2012, the Company had $91,000 and $56,000, respectively, ofcumulative unrecognized tax benefits, of which only the net amount of $91,000 would impact theeffective income tax rate if recognized.
The aggregate changes in the balance of gross unrecognized tax benefits were as follows:
Beginning balance as of January 1, 2012 51,000$
Settlements and effective settlements with tax authorities -
Lapse of statute of limitations -
Increases in balances related to tax positions taken during prior periods -Decreases in balances related to tax positions taken during prior periods (13,000)
Increases in balances related to tax positions taken during current period 18,000
Balance as of December 31, 2012 56,000$
Settlements and effective settlements with tax authorities -
Lapse of statute of limitations (7,000)Increases in balances related to tax positions taken during prior periods 40,000
Decreases in balances related to tax positions taken during prior periods (11,000)
Increases in balances related to tax positions taken during current period 13,000
Balance as of December 31, 2013 91,000$
The Company’s unrecognized tax benefits balance is included within other noncurrent liabilitieson the consolidated balance sheets.
The Company, including its domestic and foreign subsidiaries, is subject to U.S. federal incometax as well as income tax of multiple state and foreign jurisdictions. The Company hasconcluded all U.S. federal income tax matters for years through 2009 and concluded yearsthrough 2010 with its primary state jurisdiction.
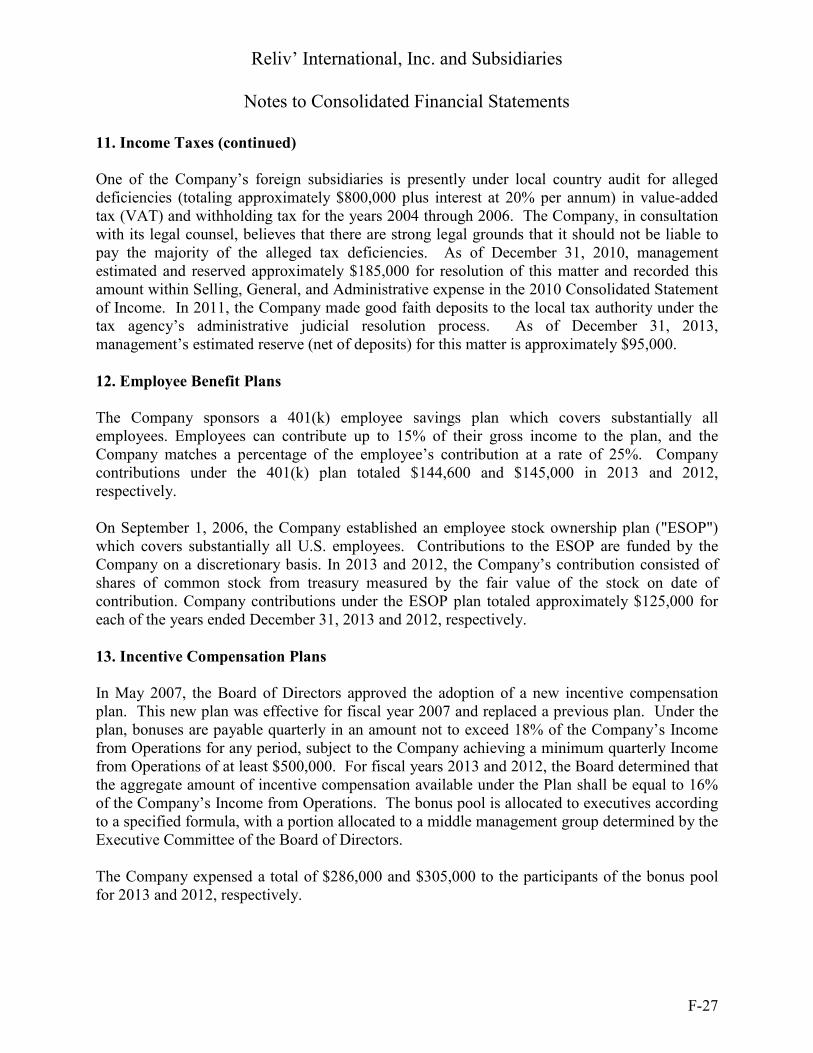
Reliv’ International, Inc. and Subsidiaries
Notes to Consolidated Financial Statements
F-27
11. Income Taxes (continued)
One of the Company’s foreign subsidiaries is presently under local country audit for allegeddeficiencies (totaling approximately $800,000 plus interest at 20% per annum) in value-addedtax (VAT) and withholding tax for the years 2004 through 2006. The Company, in consultationwith its legal counsel, believes that there are strong legal grounds that it should not be liable topay the majority of the alleged tax deficiencies. As of December 31, 2010, managementestimated and reserved approximately $185,000 for resolution of this matter and recorded thisamount within Selling, General, and Administrative expense in the 2010 Consolidated Statementof Income. In 2011, the Company made good faith deposits to the local tax authority under thetax agency’s administrative judicial resolution process. As of December 31, 2013,management’s estimated reserve (net of deposits) for this matter is approximately $95,000.
12. Employee Benefit Plans
The Company sponsors a 401(k) employee savings plan which covers substantially allemployees. Employees can contribute up to 15% of their gross income to the plan, and theCompany matches a percentage of the employee’s contribution at a rate of 25%. Companycontributions under the 401(k) plan totaled $144,600 and $145,000 in 2013 and 2012,respectively.
On September 1, 2006, the Company established an employee stock ownership plan ("ESOP")which covers substantially all U.S. employees. Contributions to the ESOP are funded by theCompany on a discretionary basis. In 2013 and 2012, the Company’s contribution consisted ofshares of common stock from treasury measured by the fair value of the stock on date ofcontribution. Company contributions under the ESOP plan totaled approximately $125,000 foreach of the years ended December 31, 2013 and 2012, respectively.
13. Incentive Compensation Plans
In May 2007, the Board of Directors approved the adoption of a new incentive compensationplan. This new plan was effective for fiscal year 2007 and replaced a previous plan. Under theplan, bonuses are payable quarterly in an amount not to exceed 18% of the Company’s Incomefrom Operations for any period, subject to the Company achieving a minimum quarterly Incomefrom Operations of at least $500,000. For fiscal years 2013 and 2012, the Board determined thatthe aggregate amount of incentive compensation available under the Plan shall be equal to 16%of the Company’s Income from Operations. The bonus pool is allocated to executives accordingto a specified formula, with a portion allocated to a middle management group determined by theExecutive Committee of the Board of Directors.
The Company expensed a total of $286,000 and $305,000 to the participants of the bonus poolfor 2013 and 2012, respectively.
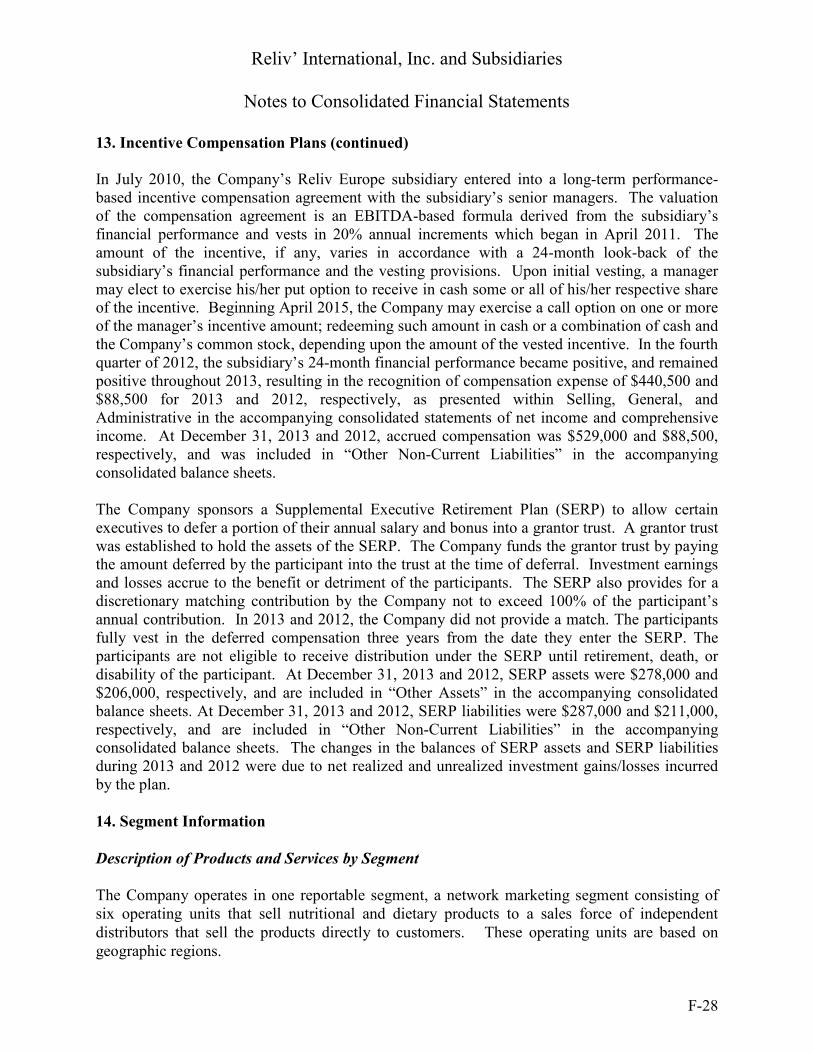
Reliv’ International, Inc. and Subsidiaries
Notes to Consolidated Financial Statements
F-28
13. Incentive Compensation Plans (continued)
In July 2010, the Company’s Reliv Europe subsidiary entered into a long-term performance-based incentive compensation agreement with the subsidiary’s senior managers. The valuationof the compensation agreement is an EBITDA-based formula derived from the subsidiary’sfinancial performance and vests in 20% annual increments which began in April 2011. Theamount of the incentive, if any, varies in accordance with a 24-month look-back of thesubsidiary’s financial performance and the vesting provisions. Upon initial vesting, a managermay elect to exercise his/her put option to receive in cash some or all of his/her respective shareof the incentive. Beginning April 2015, the Company may exercise a call option on one or moreof the manager’s incentive amount; redeeming such amount in cash or a combination of cash andthe Company’s common stock, depending upon the amount of the vested incentive. In the fourthquarter of 2012, the subsidiary’s 24-month financial performance became positive, and remainedpositive throughout 2013, resulting in the recognition of compensation expense of $440,500 and$88,500 for 2013 and 2012, respectively, as presented within Selling, General, andAdministrative in the accompanying consolidated statements of net income and comprehensiveincome. At December 31, 2013 and 2012, accrued compensation was $529,000 and $88,500,respectively, and was included in “Other Non-Current Liabilities” in the accompanyingconsolidated balance sheets.
The Company sponsors a Supplemental Executive Retirement Plan (SERP) to allow certainexecutives to defer a portion of their annual salary and bonus into a grantor trust. A grantor trustwas established to hold the assets of the SERP. The Company funds the grantor trust by payingthe amount deferred by the participant into the trust at the time of deferral. Investment earningsand losses accrue to the benefit or detriment of the participants. The SERP also provides for adiscretionary matching contribution by the Company not to exceed 100% of the participant’sannual contribution. In 2013 and 2012, the Company did not provide a match. The participantsfully vest in the deferred compensation three years from the date they enter the SERP. Theparticipants are not eligible to receive distribution under the SERP until retirement, death, ordisability of the participant. At December 31, 2013 and 2012, SERP assets were $278,000 and$206,000, respectively, and are included in “Other Assets” in the accompanying consolidatedbalance sheets. At December 31, 2013 and 2012, SERP liabilities were $287,000 and $211,000,respectively, and are included in “Other Non-Current Liabilities” in the accompanyingconsolidated balance sheets. The changes in the balances of SERP assets and SERP liabilitiesduring 2013 and 2012 were due to net realized and unrealized investment gains/losses incurredby the plan.
14. Segment Information
Description of Products and Services by Segment
The Company operates in one reportable segment, a network marketing segment consisting ofsix operating units that sell nutritional and dietary products to a sales force of independentdistributors that sell the products directly to customers. These operating units are based ongeographic regions.

Reliv’ International, Inc. and Subsidiaries
Notes to Consolidated Financial Statements
F-29
14. Segment Information (continued)
Description of Products and Services by Segment (continued)
Geographic area data for the years ended December 31, 2013 and 2012 follow:
2013 2012
Net sales to external customers
United States $53,650,647 $53,801,077Australia/New Zealand 1,858,983 2,111,234
Canada 1,776,375 1,860,956Mexico 977,358 1,055,473
Europe(1)
7,953,221 6,480,923
Asia (2) 1,990,154 3,400,226
Total net sales $68,206,738 $68,709,889
Assets by areaUnited States $22,966,040 $20,828,940
Australia/New Zealand 807,336 833,983Canada 753,035 364,082Mexico 531,854 568,868
Europe (1) 1,665,194 1,557,036
Asia (2) 875,292 1,105,632
Total consolidated assets $27,598,751 $25,258,541
(1) Europe consists of United Kingdom, Ireland, France, Germany, Austria, and the Netherlands.(2) Asia consists of Philippines, Malaysia, Singapore, Brunei, and Indonesia.
The Company classifies its sales into three categories of sales products plus handling & freightincome. Net sales by product category data for the years ended December 31, 2013 and 2012,follow:
2013 2012
Net sales by product category
Nutritional and dietary supplements $60,049,651 $58,859,774
Skin care products 417,688 471,576
Sales aids and other 1,912,111 1,765,830
Handling & freight income 5,827,288 7,612,709
Total net sales $68,206,738 $68,709,889

Corporate Headquarters Reliv International, Inc.
136 Chesterfield Industrial Blvd. Chesterfield, Missouri 63005
Phone: 636.537.9715 Fax: 636.537.9753
State & Date of Incorporation Delaware, February 11, 1985
Independent Auditors Ernst & Young LLP
Fiscal Year-End December 31
Dividend Reinvestment, Share Purchase & Sale Program
This Program is available to the general public and current shareholders of the Company.
If you would like to receive information on this Program, please call American Stock Transfer &
Trust Co., toll free, at 888.333.0203.
Stock Exchange Listing Nasdaq Stock Market® under the symbol RELV.
Annual Meeting The annual meeting of shareholders will be held at 9:00 a.m. on Thursday, May 22, 2014, at Reliv Corporate Headquarters, 136 Chesterfield Industrial Blvd. Chesterfield, Missouri 63005
Transfer Agent American Stock Transfer & Trust Co. 59 Maiden Lane, Plaza Level New York, NY 10038 800 .937.5449
Number of Shareholders of Record 1,611 as of March 3, 2014
Shareholder Questions Communications concerning stock transfer requirements, lost certificates, change of address or dividends should be addressed to American Stock Transfer & Trust Co. at 800.937.5449.
Financial Information Reliv International maintains a website at www.reliv.com.

Reliv International, Inc. 136 Chesterfield Industrial Blvd.
Chesterfield, Missouri 63005
reliv.com | 636.537.9715
FSC 100% logo horizontal