
Harris (2001) - Plant Identification Terminology - An Illustrated Glossary 2ed
Barry A. Kosmin, Egon Mayerand Ariela Keysar
RELIGIOUS IDENTIFICATION SURVEY
2 0 0 1
The Graduate Center of the City University of New York
�
�
� ?
?
�
�

AMERICAN RELIGIOUS IDENTIFICATION SURVEY, 2001THE GRADUATE CENTER OF THE CITY UNIVERSITY OF NEW YORK
1
TABLE OF CONTENTS
ACKNOWLEDGEMENTS
LIST OF EXHIBITS
INTRODUCTION
METHODOLOGY
INNOVATIONS BETWEEN NSRI 1990 AND ARIS 2001COVERAGE OF RELIGIOUS GROUPS
RELIGION AND IDENTITY
RELIGION AND ETHNICITY
KEY FINDINGS
- RELIGIOUS IDENTIFICATION AMONG AMERICAN ADULTS
- RELIGIOUS INSTITUTIONAL MEMBERSHIP
- RELIGIOUS OR SECULAR OUTLOOK
- RELIGIOUS SWITCHING
- MARITAL STATUS AMONG SELECTED RELIGIOUS
GROUPS
- MIXED RELIGION HOUSEHOLDS
- AGE AND GENDER PATTERNS AMONG SELECTED
RELIGIOUS GROUPS
- RACE AND ETHNICITY AMONG SELECTED RELIGIOUS
GROUPS
- POLITICAL PARTY PREFERENCE AMONG SELECTED
RELIGIOUS GROUPS
- STATE BY STATE DISTRIBUTION OF SELECTED
RELIGIOUS GROUPS
METHODOLOGICAL APPENDIX

AMERICAN RELIGIOUS IDENTIFICATION SURVEY, 2001THE GRADUATE CENTER OF THE CITY UNIVERSITY OF NEW YORK
2
ACKNOWLEDGEMENTS
The authors wish to acknowledge the dedicated professional collaboration of ICR —International Communications Research Corp. (Media, PA). Our thanks go especiallyto John DeWolf, Christopher Dinardo, Dale Kulp and their associates, who providedmatchless and untiring collegial assistance in all phases of sampling, data collection,and data file preparation, further enhancing the fine reputation for quality researchthey had established in carrying out the National Survey of Religious Identification(NSRI) 1990.
This study was made possible by the generous support of the Posen Foundation.
AMERICAN RELIGIOUS IDENTIFICATION SURVEY, 2001THE GRADUATE CENTER OF THE CITY UNIVERSITY OF NEW YORK
3
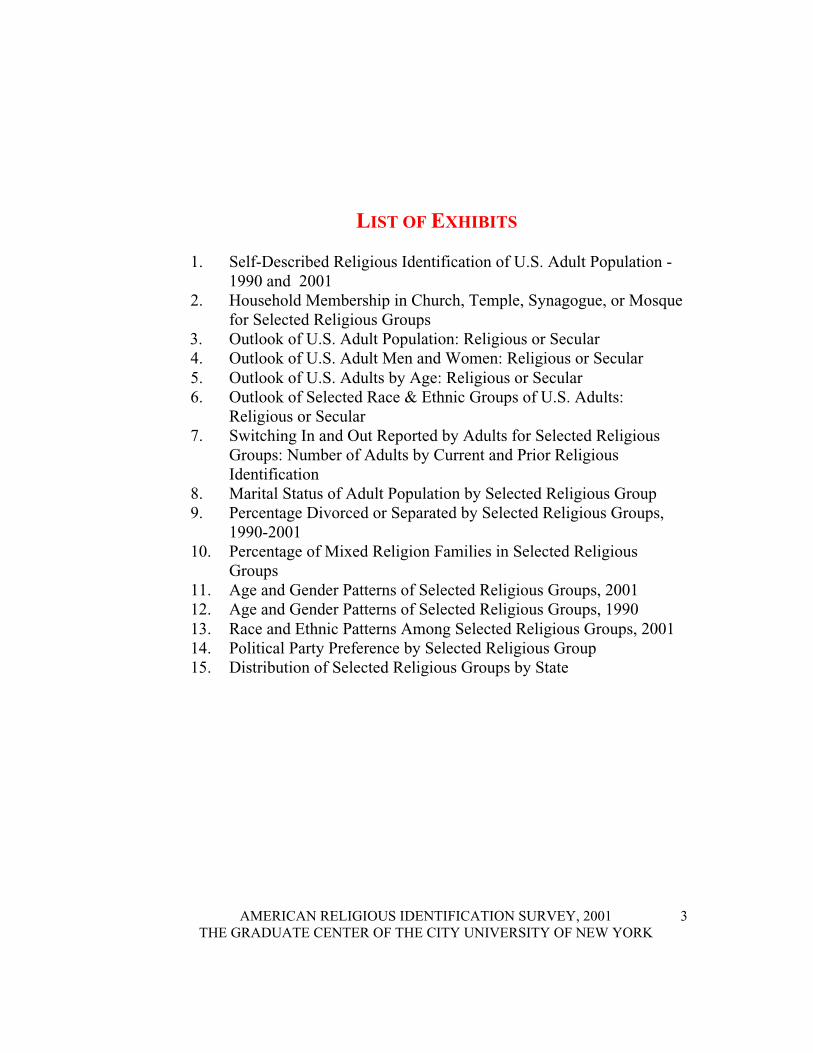
LIST OF EXHIBITS
1. Self-Described Religious Identification of U.S. Adult Population -1990 and 2001
2. Household Membership in Church, Temple, Synagogue, or Mosquefor Selected Religious Groups
3. Outlook of U.S. Adult Population: Religious or Secular4. Outlook of U.S. Adult Men and Women: Religious or Secular5. Outlook of U.S. Adults by Age: Religious or Secular6. Outlook of Selected Race & Ethnic Groups of U.S. Adults:
Religious or Secular7. Switching In and Out Reported by Adults for Selected Religious
Groups: Number of Adults by Current and Prior ReligiousIdentification
8. Marital Status of Adult Population by Selected Religious Group9. Percentage Divorced or Separated by Selected Religious Groups,
1990-200110. Percentage of Mixed Religion Families in Selected Religious
Groups11. Age and Gender Patterns of Selected Religious Groups, 200112. Age and Gender Patterns of Selected Religious Groups, 199013. Race and Ethnic Patterns Among Selected Religious Groups, 200114. Political Party Preference by Selected Religious Group15. Distribution of Selected Religious Groups by State

AMERICAN RELIGIOUS IDENTIFICATION SURVEY, 2001THE GRADUATE CENTER OF THE CITY UNIVERSITY OF NEW YORK
4
AAAMMMEEERRRIIICCCAAANNNRELIGIOUS IDENTIFICATION SURVEY 2001
Barry A. Kosmin, Egon Mayer, and Ariela Keysar
INTRODUCTION
What do adults say in America today when asked about theirreligion? How many belong to a church, temple, synagogue,mosque or some other place of worship? How many change theirreligion in the course of their lives? What is the mix of religiousidentification among American couples? These are among themany probing questions in the first large-scale national survey ofreligious identification conducted among Americans in the twenty-first century.
This report summarizes a follow-up study of religiousidentification among American adults, undertaken for the first timein 1990. Carried out under the auspices of The Graduate Center ofthe City University of New York, the 1990 National Survey ofReligious Identification (NSRI) was the most extensive survey ofreligious identification in the later half of 20th-century America.That study, like the current follow-up, was undertaken because theU.S. Census does not produce a religious profile of the Americanpopulation. Yet, the religious categories into which a populationsorts itself is surely no less important than some of the other social-demographic categories that are enumerated by the decennialcensus.
Writing from the vantage point of an anthropologist of religion,Diana Eck1 has observed that "’We the people of the United Statesnow form the most profusely religious nation on earth." We arealso among the most diverse and the most changing. Often lostamidst the mesmerizing tapestry of faith groups that comprise theAmerican population is also a vast and growing population of thosewithout faith. They adhere to no creed nor choose to affiliate withany religious community. These are the seculars, the unchurched,the people who profess no faith in any religion.
1 Diana L. Eck, A New Religious America: How A "Christian Country" Has Become theWorld’s Most Religious Diverse Nation (HarperSanFrancisco, 2001).

AMERICAN RELIGIOUS IDENTIFICATION SURVEY, 2001THE GRADUATE CENTER OF THE CITY UNIVERSITY OF NEW YORK
5
Since the mid-1960s, when the Harvard theologian Harvey Cox’sbest selling The Secular City2 ushered in a brief era of"secularization," American religion has been widely perceived asleaning toward the more literal, fundamental, and spiritual.Particularly since the election in 1976 of President Jimmy Carter, aself-avowed Born Again Christian, America has been through aperiod of great religious re-awakening. In sharp contrast to thatwidely held perception, the present survey has detected a wide andpossibly growing swath of secularism among Americans. Themagnitude and role of this large secular segment of the Americanpopulation is frequently ignored by scholars and politicians alike.
H owever, the pattern emerging from the present study iscompletely consistent with similar secularizing trends in otherWestern, democratic societies.3 For example, Andrew Greeley hasfound that England is considerably less religious than the USA. Healso notes similarly high levels of secularism in most countries ofthe European continent west of Poland.
METHODOLOGY4
The American Religious Identification Survey (ARIS) 2001 wasbased on a random digit-dialed telephone survey of 50,281American residential households in the continental U.S.A (48states). The methodology largely replicates the widely reportedand pioneering 1990 National Survey of Religious Identification(NSRI) carried out at the Graduate Center of the City University ofNew York. ARIS 2001 thus provides a unique time series ofinformation concerning the religious identification choices ofAmerican adults.
The data were collected over a 17-week period, from February toJune 2001 at the rate of about 3,000 completed interviews a weekby ICR/CENTRIS Survey Research Group of Media, PA as part oftheir national telephone omnibus market research(EXCEL/ACCESS) surveys. The primary question of theinterview was: What is your religion, if any? The religion of thespouse/partner was also asked. If the initial answer was Protestantor Christian further questions were asked to probe whichparticular denomination.
2 Harvey Cox, The Secular City (The Macmillan Co., 1965)
3 For an interesting comparison, see Andrew Greeley, Religion in Britain, Ireland and the USA, in Roger Jowell et al, ed., British Social Attitudes: The 9 th Report (Dartmouth Publishing Co., Aldershot, England, 1992).
4 For a more detailed discussion of the survey methodology, please see Appendix 1.

AMERICAN RELIGIOUS IDENTIFICATION SURVEY, 2001THE GRADUATE CENTER OF THE CITY UNIVERSITY OF NEW YORK
6
INNOVATIONSBETWEEN NSRI 1990 AND ARIS 2001
The NSRI 1990 study was a very large survey in which 113,723persons were questioned about their religious preferences.However, it provided for no further detailed questioning ofrespondents regarding their religious beliefs or involvement or thereligious composition of their household.
In the light of those lacunae in the 1990 survey, ARIS 2001 tooksteps to enhance both the range and the depth of the topics covered.For example, new questions were introduced concerning thereligious identification of spouses. To be sure, budget limitations,have necessitated a reduction in the number of respondents. Thecurrent survey still covers a very large national sample (over50,000 respondents) that provides a high level of confidence forthe results and adequate coverage of most religious groups and keygeographical units such as states and major metropolitan areas.
For the sake of analytic depth, additional questions about religiousbeliefs and affiliation as well as religious change were introducedfor a smaller representative sub-sample of (17,000) households.Even this sample is about ten times greater than most typicalopinion surveys of the US population. This sub-sample as well asthe larger sample were weighted to reflect the total U.S. adultpopulation
These innovations have provided a much richer data set that goesfar beyond the mere question of religious preference. The new dataallow for a much more sophisticated analysis than NSRI 1990.They offer a more nuanced understanding of the complexdynamics of religion in contemporary American society andespecially how religious adherence relates to countervailingsecularizing trends. The information collected is also potentiallymuch more useful for the various national religious bodies.

AMERICAN RELIGIOUS IDENTIFICATION SURVEY, 2001THE GRADUATE CENTER OF THE CITY UNIVERSITY OF NEW YORK
7
COVERAGE OF RELIGIOUS GROUPS
One of the key distinguishing features of this survey, as of itspredecessor in 1990, is that respondents were asked to describethemselves in terms of religion with an open-ended question.Interviewers did not prompt or offer a suggested list of potentialanswers. Moreover, the self-description of respondents was notbased on whether established religious bodies, institutions,churches, mosques or synagogues considered them to be members.Quite the contrary, the survey sought to determine whether therespondents themselves regarded themselves as adherents of areligious community. Subjective rather than objective standards ofreligious identification were tapped by the survey.
The overall refusal rate for the question on religion is very low,only 5.7 per cent. The response categories to this question alsoincluded a "None/No religion option — chosen by 13% -- as well asa generic Christian response chosen by 7% and an unspecifiedProtestant response chosen by 2%.
RELIGION AND IDENTITY: HISPANICS & JEWS
Decades of prior research, by the present scholars as well asothers, has drawn attention to the multi-layered nature of socialidentity, particularly as it relates to religion. For example, thelargest minority group in the US, the Hispanic population, isgrouping based upon a cultural identity. It is a diverse grouping interms of history, national origins and race. The common culturalelements are assumed to be the Spanish language and religion - theRoman Catholic faith - both of which can be related to thea l t e r n a t i v e u s a g e o f L a t i n o / a f o rHispanic. This assumption tends to make the existence of HispanicMethodists or Buddhists appear to be incongruous. Peopleidentified as Hispanic or Latino are automatically presumed to beCatholic because most are and most also hail from countries thathave Catholicism as their established religion.
True to expectations, the present study found that about 57% ofadults who identified themselves as being of Hispanic originsindicated their religion as Catholic. However, about 22% indicatedtheir religion as one of the Protestant denominations, 5% indicated

AMERICAN RELIGIOUS IDENTIFICATION SURVEY, 2001THE GRADUATE CENTER OF THE CITY UNIVERSITY OF NEW YORK
8
some other religious identification and 12% indicated that theyhave no religion.
Among American Jews Jewish identity is likewise an amalgamof religious, ethnic and cultural elements. The present study soughtto ascertain the demographic boundaries of the entire population ofadults in America based on religious self-classification. Thus thereport focuses analysis only upon groups of adults in terms of howthey classified themselves with respect to religion.
In the case of the Jewish population the study probed further intonot only the religious identification of respondents, but also intoparentage, upbringing and whether the respondent consideredhimself or herself Jewish.
We found that the Jewish adult population that identifies withJudaism as a religion represents fifty-three percent of all adultswho can be classified as Jewish. The remaining 47% of the totalconsisted of adults who indicated they are of Jewish parentage orwere raised Jewish or considered themselves Jewish for some otherreason.
Projecting from the present sample, there are about 5.3 millionadults in the American Jewish population: 2.83 million adults areestimated to be adherents of Judaism; 1.08 million are estimated tobe adherents of no religion; and 1.36 million are estimated to beadherents of a religion other than Judaism.
As these examples should make clear, religious identification isoften a highly complex attribute. For that reason, this report haslimited itself to a strict and specific aspect of that identification,namely the classification of people and households on the basis ofhow respondents answered the key question: What is yourreligion, if any?
RELIGION AND ETHNICITY
The question of religious identification among the different racialand ethnic groups in the U.S. is of considerable importancebecause of the way religion and ethnic culture affect each other. Inaddition, the American religious scene has historically been shapedby continuous waves of immigration. The last two decades in

AMERICAN RELIGIOUS IDENTIFICATION SURVEY, 2001THE GRADUATE CENTER OF THE CITY UNIVERSITY OF NEW YORK
9
particular have seen an unusually large influx of immigrants,especially from Asia and Latin America. Thus, many observerswould expect to see the impact of these new populations on thenational profile of American religious groups. Many of thesechanges are reported in the exhibits that follow. However, due tothe size and diversity of the American population, immigrantgroups even in large numbers might have only a marginal effect onthe national picture.
Moreover, this study and the survey methodology of contemporarysocial science does not easily lend itself to capturing all elementsof the newest segments of the population. Because the surveydepends on telephone interviews, overcoming language barriershas proven prohibitively costly. In effect, this survey hasinterviewed only the English-speaking population of the U.S. Inaddition, many new immigrants originate in societies and stateswhere responding to personal questions over the telephone is analien experience, and discussions of one s religious beliefs andidentification are deemed to be risky. Therefore, in the 2001survey the rate of refusal to questions about religion has risen from2.3 percent in 1990 to 5.4 percent. It is interesting to note thatamong Black Americans (a non-immigrant minority) the rate ofrefusal to the religion question has remained at 2.3 percent.
The changing composition of the Asian population has been one ofthe signal features of U.S. immigration. It has drawn newcomersfrom a wide variety of countries and cultures. As a result, between1990-2001 the proportion of the newly enlarged Asian Americanpopulation who are Christian has fallen from 63% to 43%, whilethose professing Asian religions (Buddhism, Hinduism, Islam, etc)has risen from 15% to 28%. Thus, for example, there are morethan three times as many Hindus in the U.S. today as there were in1990. Undoubtedly, due to the limitations of this study, we havenot picked up the full impact of those changes yet.
Turning from the newest Americans to the oldest, the presentsurvey is the first to systematically inquire into the religiouspreferences of a nationally representative sample of NativeAmericans. Although under two percent of the total sample, theirreligious profile is very similar to white, non-Hispanic Americans:20% percent self-identified as Baptist, 17% as Catholic and 17%indicated no religious preference. Only 3% indicated their primaryreligious identification as an Indian or tribal religion.
AMERICAN RELIGIOUS IDENTIFICATION SURVEY, 2001THE GRADUATE CENTER OF THE CITY UNIVERSITY OF NEW YORK
10
KEY FINDINGS
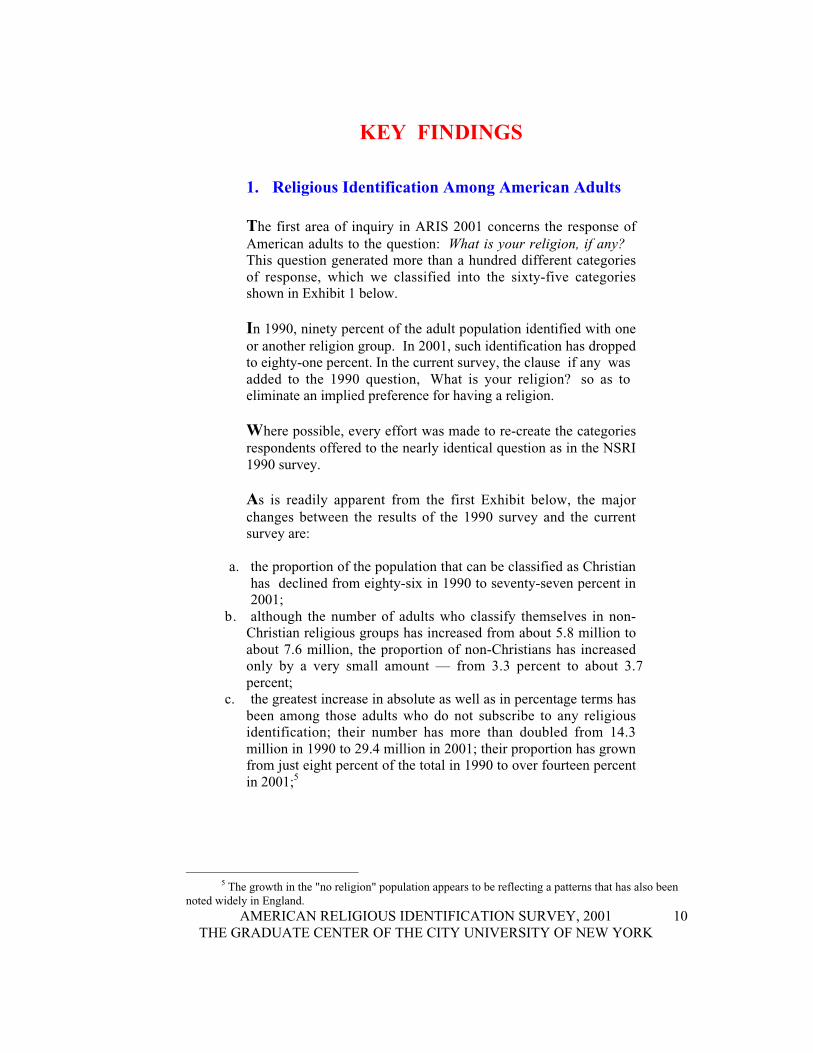
1. Religious Identification Among American Adults
The first area of inquiry in ARIS 2001 concerns the response ofAmerican adults to the question: What is your religion, if any?This question generated more than a hundred different categoriesof response, which we classified into the sixty-five categoriesshown in Exhibit 1 below.
In 1990, ninety percent of the adult population identified with oneor another religion group. In 2001, such identification has droppedto eighty-one percent. In the current survey, the clause if any wasadded to the 1990 question, What is your religion? so as toeliminate an implied preference for having a religion.
Where possible, every effort was made to re-create the categoriesrespondents offered to the nearly identical question as in the NSRI1990 survey.
As is readily apparent from the first Exhibit below, the majorchanges between the results of the 1990 survey and the currentsurvey are:
a. the proportion of the population that can be classified as Christianhas declined from eighty-six in 1990 to seventy-seven percent in2001;
b. although the number of adults who classify themselves in non-Christian religious groups has increased from about 5.8 million toabout 7.6 million, the proportion of non-Christians has increasedonly by a very small amount — from 3.3 percent to about 3.7percent;
c. the greatest increase in absolute as well as in percentage terms hasbeen among those adults who do not subscribe to any religiousidentification; their number has more than doubled from 14.3million in 1990 to 29.4 million in 2001; their proportion has grownfrom just eight percent of the total in 1990 to over fourteen percentin 2001;5
5 The growth in the "no religion" population appears to be reflecting a patterns that has also beennoted widely in England.
AMERICAN RELIGIOUS IDENTIFICATION SURVEY, 2001THE GRADUATE CENTER OF THE CITY UNIVERSITY OF NEW YORK
11
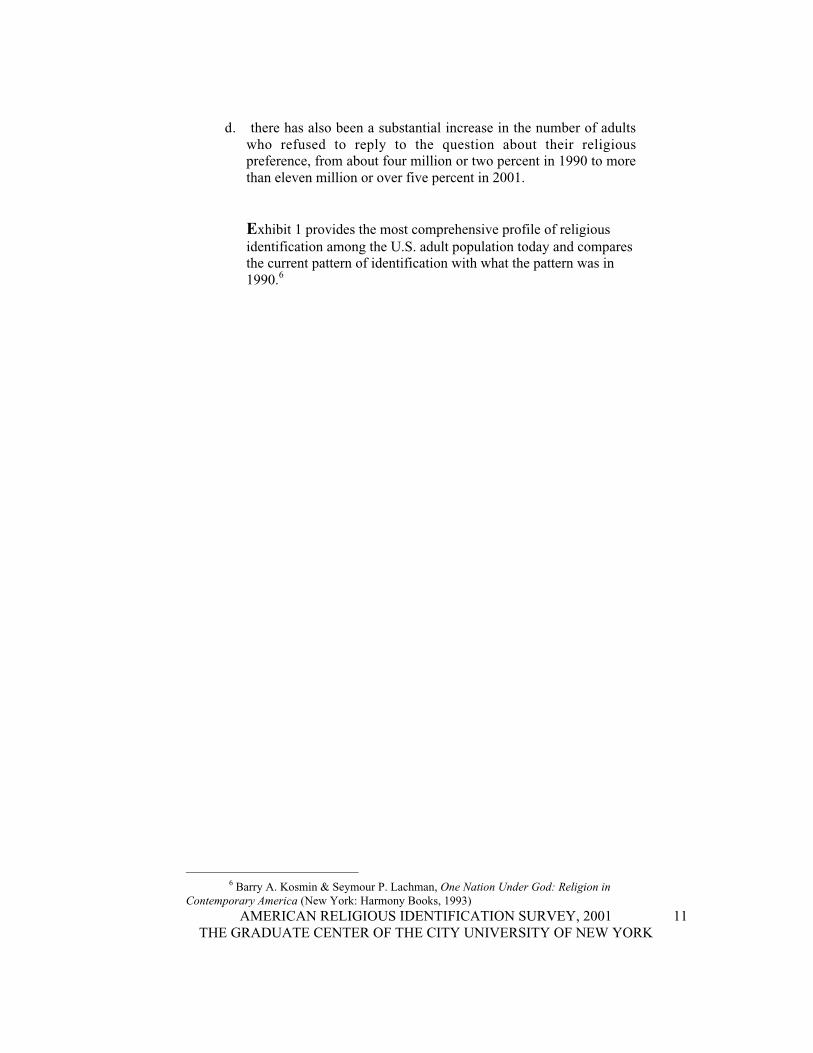
d. there has also been a substantial increase in the number of adultswho refused to reply to the question about their religiouspreference, from about four million or two percent in 1990 to morethan eleven million or over five percent in 2001.
Exhibit 1 provides the most comprehensive profile of religiousidentification among the U.S. adult population today and comparesthe current pattern of identification with what the pattern was in1990.6
6 Barry A. Kosmin & Seymour P. Lachman, One Nation Under God: Religion in
Contemporary America (New York: Harmony Books, 1993)

AMERICAN RELIGIOUS IDENTIFICATION SURVEY, 2001THE GRADUATE CENTER OF THE CITY UNIVERSITY OF NEW YORK
12
Number % Number %Catholic 46,004,000 50,873,000 24.5Baptist 33,964,000 33,830,000 16.3Protestant - no denomination supplied 17,214,000 4,647,000 2.2Methodist/Wesleyan 14,174,000 14,150,000 6.8Lutheran 9,110,000 9,580,000 4.6Christian - no denomination supplied 8,073,000 14,190,000 6.8Presbyterian 4,985,000 5,596,000 2.7Pentecostal/Charismatic 3,191,000 4,407,000 2.1Episcopalian/Anglican 3,042,000 3,451,000 1.7Mormon/Latter-Day Saints 2,487,000 2,697,000 1.3Churches of Christ 1,769,000 2,593,000 1.2Jehovah’s Witness 1,381,000 1,331,000 0.6Seventh-Day Adventist 668,000 724,000 0.3Assemblies of God 660,000 1,106,000 0.5Holiness/Holy 610,000 569,000 0.3Congregational/United Church of Christ 599,000 1,378,000 0.7Church of the Nazarene 549,000 544,000 0.3Church of God 531,000 944,000 0.5Orthodox (Eastern) 502,000 145,000Evangelical 242,000 1,032,000 0.5Mennonite 235,000 346,000Christian Science 214,000 194,000Church of the Brethren 206,000 358,000Born Again 204,000 56,000Nondenominational 195,000 2,489,000 1.2Disciples of Christ 144,000 492,000Reformed/Dutch Reform 161,000 289,000Apostolic/New Apostolic 117,000 254,000Quaker 67,000 217,000Full Gospel 51,000 168,000Christian Reform 40,000 79,000Foursquare Gospel 28,000 70,000Fundamentalist 27,000 61,000Salvation Army 27,000 25,000Independent Christian Church 25,000 71,000Covenant 16,000 47,000Jewish Christians 0 27,000Other 240,000 0Total Christian 151,225,000 86.2 159,030,000 76.5
Self Described Religious Identification of U.S. Adult Population, 1990-2001
(Weighted Estimate)
EXHIBIT 1
TOTAL U.S. ADULT POPULATION 18+ 1990 = 175,440,000 2001=207,980,000
Christian Religious Groups1990 2001

AMERICAN RELIGIOUS IDENTIFICATION SURVEY, 2001THE GRADUATE CENTER OF THE CITY UNIVERSITY OF NEW YORK
13
1990 2001Number % Number %
Jewish 3,137,000 2,831,000 1.3Muslim/Islamic 527,000 1,104,000 0.5Buddhist 401,000 1,082,000 0.5Unitarian/Universalist 502,000 629,000 0.3Hindu 227,000 766,000 0.4Native American 47,000 103,000Scientologist 45,000 55,000Baha’I 28,000 84,000Taoist 23,000 40,000New Age 20,000 68,000Eckankar 18,000 26,000Rastafarian 14,000 11,000Sikh 13,000 57,000Wiccan 8,000 134,000Deity 6,000 49,000Druid 33,000Santeria 22,000Pagan 140,000Spiritualist 116,000Ethical Culture 4,000Other unclassified 837,000 386,000Total Other Religions 5,853,000 3.3 7,740,000 3.7
1990 2001Number % Number %
Atheist 902,000 0.4Agnostic 1186000 991,000 0.5Humanist 29,000 49,000 0Secular 53,000 0No Religion 13,116,000 27,486,000 13.2Total No Religion Specified 14,331,000 8.2 29,481,000 14.1
Refused 4,031,000 2.3 11,246,000 5.4
No Religion Groups
Other Religion Groups
Self Described Religious Identification of U.S. Adult Population, 1990-2001
(Weighted Estimate)

AMERICAN RELIGIOUS IDENTIFICATION SURVEY, 2001THE GRADUATE CENTER OF THE CITY UNIVERSITY OF NEW YORK
14
As is evident from Exhibit 1, with respect to religious self-identification, approximately ninety percent of America s adultsare clustered in twenty-two groups. Therefore, the remainder ofthe analysis in this report focuses on the distribution of adultsacross these twenty-two groups
2. Religious Institutional Membership in SelectedMajor Religious Groups
Closely akin to religions group identification in the minds of mostpeople is membership in or affiliation with a place of worship.Indeed, in his classic definition of religion, the nineteenth centurysociologist Emile Durkheim characterized religions as systems ofbelief that unite a group of adherents into common modes ofworship, which in turn organize adherents into churches (orsynagogues, temples, mosques or whatever else a group may choseto call the place in which a group of kindred spirits come togetherto celebrate, worship and recognize the commonality of theirbeliefs).7
More than half (54%) of the adult population in America reside ina household where either they themselves or someone else belongsto a church, or temple, synagogue or mosque or some other type ofplace of worship. To be sure, the significance of membership (itsimportance, its criteria, and even its definition) varies greatly fromone denomination or faith to another. This study is not in positionto evaluate the meaning or importance of religious institutionalmembership for particular groups.
On the other hand, given that about eighty percent of adultsidentify with some religious group, there appears to be aconsiderable gap between identification with a religion andreported membership or belonging to a an institutionalembodiment of that faith community. That difference betweenreligious identification and belonging could well contain the seedsof a potent cultural shift in which religion means something quitedifferent to those who adhere to one from those who seethemselves as the institutional custodians of one.
7 Emile Durkheim, The Elementary Forms of Religious Life (New York: Free Press, 1955).

AMERICAN RELIGIOUS IDENTIFICATION SURVEY, 2001THE GRADUATE CENTER OF THE CITY UNIVERSITY OF NEW YORK
15
More than thirty years ago, the sociologist Thomas Luckmannanticipated the emergence of an increasingly de-institutionalizedform of religious identification in an incisive analysis of modernreligious life, The Invisible Religion. In that work he concluded:The modern sacred cosmos legitimates the retreat of the
individual into the private sphere and sanctifies his (or her)subjective autonomy. 8
Luckmann s analysis notwithstanding, aggregated survey datafrom the General Social Survey 1972-1994 showed a persistence ofchurch membership among a somewhat larger percentage of U.S.adults than found in the current study. Among a nationallyrepresentative sample of 1,481 American adults surveyed in byGSS between the early 1970s and the early 1990s, 61% hadindicated membership in a church.
The decade of the nineties appears to have been a period in whichreligious institutional membership slid, underscoring whatLuckmann described as the rise of invisible religion.
Exhibit 2 below describes the varied pattern of religiousinstitutional membership among the twenty-two largest religiousgroups — including no religion, which is the choice made by avery large number. Except where otherwise noted, we have limitedour analyses to these twenty-two groups, which encompass nearly190 million adults or nearly 92% of the adult population.
8 Thomas Luckmann, The Invisible Religion (New York: The Macmillan Co., 1967).

AMERICAN RELIGIOUS IDENTIFICATION SURVEY, 2001THE GRADUATE CENTER OF THE CITY UNIVERSITY OF NEW YORK
16
Catholic 59Baptist 69NO RELIGION 19Christian 60Methodist 66Lutheran 68Presbyterian 64Protestant 45Pentecostal 68Episcopalian/Anglican 64Jewish * 53Mormon 75Churches of Christ 71Non-denominational 55Congregational/UCC 69Jehovah’s Witnesses 55Assemblies of God 78Muslim/Islamic 62Buddhist 28Evangelical/Born Again 83Church of God 68Seventh Day Adventist 70
54
EXHIBIT 2
(Weighted Estimate)
*NOTE: This refers only to Jews by religion
Reported Household Membership in Church, Temple, Synagogue or Mosque for Selected Religious Groups
Percent MembersName of Group
US TOTAL

AMERICAN RELIGIOUS IDENTIFICATION SURVEY, 2001THE GRADUATE CENTER OF THE CITY UNIVERSITY OF NEW YORK
17
As Exhibit 2 illustrates, there are notable differences betweenvarious religious groups with respect to the relationship betweenidentification and affiliation. For example, 68% of thoseidentifying themselves as Lutheran report church membership,while only 45% of those who describe themselves as Protestant(without a specific denominational identification) report churchmembership. Nearly 80% of those identifying with the Assembliesof God report church membership. Church membership is reportedby 59% of Catholic adults. About 53% of adults who identify theirreligion as Jewish or Judaism report temple or synagoguemembership. Among those calling themselves Muslim or Islamic,62% report membership in a mosque.
Perhaps, it will come as no surprise to religious leaders, but nearly20% of adults who describe themselves as atheist or agnostic alsoreport that either they themselves or someone else in theirhousehold is a member of a church, temple, synagogue, mosque orsome other religious institution. On the other hand, nearly 40% ofrespondents who identified with a religion indicated that neitherthey themselves nor anyone else in their household belongs to achurch or some other similar institution. It is this group inparticular that best exemplifies the notion of invisible religionfirst proposed by Luckmann.
The obvious difference between the percentage of the total adultpopulation that identifies with one or another religion and thepercentage that report living in a household where either theythemselves or someone else is a member of an organized religiousbody draws attention to the difference between identification as astate of heart and mind and affiliation as a social condition.
The difference in the proportions between identification andaffiliation in each group draws attention to the possible differencesin the value and meaning attached to affiliation within variousreligious movements. For example, it is instructive to note thatamong adults identifying themselves as Buddhist, just 28% reportaffiliation with a temple. Among adults identifying themselveswith native American religion, affiliation with a church ortemple or some other religious institution is just 16%.
AMERICAN RELIGIOUS IDENTIFICATION SURVEY, 2001THE GRADUATE CENTER OF THE CITY UNIVERSITY OF NEW YORK
18
Differences between the percentages of identification andaffiliation also draw attention to differences in meaning associatedwith religion itself. For some, religious identification may well bea social marker as much as a marker designating a specific set ofbeliefs. For others, it may be a reflection of a community or familyanchor point to one s sense of self. For other still, it may simply bethe gut response evoked by the question, What is your religion,if any? without any wider emotional, social or philosophicalramifications.
This survey made no attempt to define for people what themeaning of any religious identification might be. Rather, it soughtto detect what those identifications might mean for those whoclaim them. The survey went beyond the simple questions of self-labeling and institutional membership to inquire about a number ofkey questions such as general outlook (weltanschauung) andbeliefs with respect to God.
3. Religious or Secular Outlook Among AmericanAdults
Apart from identification with one or another of a wide range ofreligions, ARIS 2001 sought to determine whether and to whatextent American adults consider their outlook on life to beessentially religious or secular.
Detecting people s worldview or outlook with respect to religion ispotentially very challenging. Some would argue that it cannot bedone at all with the tools of survey research. Yet, much can begained by asking rather simple questions of a broad andrepresentative spectrum of people. While not much will be learnedabout any one individual or even a single group, great insights canbe gleaned about the mindscape of diversity in the Americanpopulation as a whole.
To that end, this survey asked respondents the following: When itcomes to your outlook, do you regard yours as (1) Secular, (2)Somewhat Secular, (3) Somewhat Religious or (4) Religious?Respondents were also permitted to indicate they were unsure or alittle of both.

AMERICAN RELIGIOUS IDENTIFICATION SURVEY, 2001THE GRADUATE CENTER OF THE CITY UNIVERSITY OF NEW YORK
19
Ninety-three percent of survey respondents were able to reply tothis question without much difficulty. In all, sixteen percent (16%)described their outlook as secular or somewhat secular, whileseventy-five percent (75%) described their outlook as religious orsomewhat religious. Just one percent said they were a little ofboth and two percent said they were unsure. Five percentdeclined to answer the question.
The question yielded the distribution shown below in Exhibit 3,which indicates that at least ten percent of the population clearlyand unambiguously considers itself secular rather thanreligious. Another six percent regard themselves as somewhatsecular.

AMERICAN RELIGIOUS IDENTIFICATION SURVEY, 2001THE GRADUATE CENTER OF THE CITY UNIVERSITY OF NEW YORK
20

AMERICAN RELIGIOUS IDENTIFICATION SURVEY, 2001THE GRADUATE CENTER OF THE CITY UNIVERSITY OF NEW YORK
21
Our interviews on the question of outlook, as our questions onother matters of belief, generated a fair amount of ambivalence,which is reflected in the high proportion of respondents who fallinto the category of somewhat, that is somewhat secular andsomewhat religious. Certainty apparently is the possession ofonly a minority — though, to be sure, a larger minority among thereligious than among the secular.
More interesting still are some of the demographic characteristicsof the adult population, which seem to be associated with thedisposition to be more or less secular, or more or less religious inone s outlook. Exhibits 4, 5 and 6 provide a glimpse at some ofthose associations.
- Women are more likely than men to describe their outlook as religious.- Older Americans are more likely than younger to describe their outlook as
religious.- Black Americans are least likely to describe themselves as secular, Asian
Americans are most likely to do so.

AMERICAN RELIGIOUS IDENTIFICATION SURVEY, 2001THE GRADUATE CENTER OF THE CITY UNIVERSITY OF NEW YORK
22

AMERICAN RELIGIOUS IDENTIFICATION SURVEY, 2001THE GRADUATE CENTER OF THE CITY UNIVERSITY OF NEW YORK
23

AMERICAN RELIGIOUS IDENTIFICATION SURVEY, 2001THE GRADUATE CENTER OF THE CITY UNIVERSITY OF NEW YORK
24

AMERICAN RELIGIOUS IDENTIFICATION SURVEY, 2001THE GRADUATE CENTER OF THE CITY UNIVERSITY OF NEW YORK
25
4. Religious Switching Among Selected ReligiousGroups
More than thirty-three million American adults, about 16% of thetotal U.S. adult population report that they have changed theirreligious preference or identification. Perhaps, this phenomenon ofreligion switching is a reflection of a deeper cultural
phenomenon in contemporary America. In the early 1990s, thesociologist Wade Clark Roof described the increasingly middle-aged baby boomers as a generation of seekers. 9 However, the1990s were also a period of great immigration and great economicboom. Therefore, the religious life of the nation has beeninfluenced by social forces that are wider and more varied thansimply the aging of the boomers.
As will be seen in the Exhibit below, switching has involved notonly the shift of people s spiritual loyalties from one religion toanother -- which could reflect some kind of spiritual seeking -- butalso, and perhaps more importantly, a dropping out of religionaltogether. To be sure, there is no indication in the current datawhether the "religious switching" actually occurred in the 1990s orearlier. Surely, for our older respondents the switching very likelyhad occurred earlier.
Exhibit 7 below describes the patterns of religion switchingamong the twenty-two largest aggregates. As was indicatedearlier, taken together these groups constitute about ninety percentof the entire adult population residing in the U.S. currently.
9 Wade Clark Roof, A Generation of Seekers: The Spiritual Journeys of the Baby Boom Generation(San Francisco: Harper, 1993)

AMERICAN RELIGIOUS IDENTIFICATION SURVEY, 2001THE GRADUATE CENTER OF THE CITY UNIVERSITY OF NEW YORK
26
Catholic 50,873,000 4,282,909 8% 56,084,003 9,493,912 17% -9%Baptist 33,830,000 4,401,587 13% 34,048,066 4,619,653 14% -1%NO RELIGION 29,481,000 6,622,494 23% 23,976,587 1,118,081 5% 23%Christian 14,190,000 2,873,155 20% 12,803,459 1,486,614 12% 11%Methodist 14,140,000 2,631,703 19% 15,284,374 3,776,077 25% -7%Lutheran 9,580,000 1,755,644 18% 9,682,231 1,857,875 19% -1%Presbyterian 5,596,000 1,316,068 24% 5,712,050 1,432,118 25% -2%Protestant 4,647,000 316,587 7% 5,418,822 1,088,409 20% -14%Pentecostal 4,407,000 1,340,583 30% 3,796,957 730,540 19% 16%Episcopalian/Anglican 3,451,000 899,908 26% 3,296,468 745,376 23% 5%Jewish* 2,831,000 171,447 6% 2,950,943 291,390 10% -4%Mormon 2,697,000 427,068 16% 2,701,624 431,692 16% 0%Churches of Christ 2,593,000 302,633 12% 2,648,550 358,183 14% -2%Non-denominational 2,489,000 721,683 29% 1,810,865 43,548 2% 37%Congregational/UCC 1,378,000 183,916 13% 1,463,860 269,776 18% -6%Jehovah’s Witnesses 1,331,000 517,540 39% 1,194,443 380,983 32% 11%Assemblies of God 1,105,000 221,398 20% 1,028,116 144,514 14% 7%Muslim/Islamic 1,104,000 182,859 17% 1,019,474 98,333 10% 8%Buddhist 1,082,000 340,523 33% 962,512 221,035 23% 12%Evangelical/Born Again 1,032,000 384,339 37% 725,710 78,049 11% 42%Church of God 944,000 241,296 26% 898,437 195,733 22% 5%Seventh Day Adventist 724,000 247,780 34% 653,855 177,635 27% 11%
EXHIBIT 7
Number of Adults by Current and Prior Religious Identification, 2001
** Net Gain
(Loss)Current Number
% Switched
in Switched OutSwitched In
% Switched
Out
**This percentage is calculated by taking the difference between the number (not the percent) that switched in minus the number that switched out as numerator, over the total pre-switch number in each group.
*NOTE: Only Jews by religion are included in the analysis.
Prior Religion
(Weighted Estimate)
Name of Group

AMERICAN RELIGIOUS IDENTIFICATION SURVEY, 2001THE GRADUATE CENTER OF THE CITY UNIVERSITY OF NEW YORK
27
The top three gainers in America s vast religious market placeappear to be Evangelical Christians, those describing themselves asNon-Denominational Christians and those who profess no religion.Looking at patterns of religious change from this perspective, theevidence points as much to the to the rejection of faith as to theseeking of faith among American adults. Indeed, among those whopreviously had no religion, just 5% report current identificationwith one or another of the major religions.
Some groups such as Mormons and Jehovah s Witnesses appear toattract a large number of converts ( in-switchers ), but also nearlyas large a number of apostates ( out-switchers ). It is alsointeresting to note that Buddhists also fall into this category ofwhat one might call high-turnover religious groups.
5. Marital Status Among Selected Religious Groups
In most people s minds there is a close association betweenreligious belonging and family values, though to be sure that latterconcept is often quite vague as to its meaning. For bothdemographic and sociological reasons, the present study alsofocused on household structure, marital status and the religiouscomposition of households.
As context for a discussion of the marital status patterns ofdifferent religious groups, it should be noted that the U.S. Censusreports the following distribution for the marital status ofAmericans aged fifteen or older.
US CENSUS 2000 FACT BOX 1- Married 115,580,691 54%- Single, never married 58,049,225 27%- Separated 4,795,275 2%- Divorced 21,365,741 10%- Widowed 13,887,524 7%
TOTAL 213,678,456 100%
Source: USCensus QT-02 Profile of Selected Social Characteristics: 2000(American Fact Finder)

AMERICAN RELIGIOUS IDENTIFICATION SURVEY, 2001THE GRADUATE CENTER OF THE CITY UNIVERSITY OF NEW YORK
28
Because ARIS 2001 has defined its survey population as adults18 or over its distribution varies slightly from that of the USCensus, which recorded marital status information for all peopleaged fifteen or older. In addition, as the fact box below shows,ARIS also included an additional category for single, living withpartner. It also recorded those who refused to supply maritalstatus information.
ARIS 2001 FACT BOX 2 (Weighted Estimate)- Married 122,053,785 59%- Single, never married 40,914,395 20%- Single, living with partner 11,101,951 5%- Separated 3,431,149 2%- Divorced 15,005,207 7%- Widowed 12,502,674 6%- Refused info 2,959,032 1%
TOTAL 207,968,192 100%
Exhibit 8 below draws attention to the variations among thedifferent religious groups with regard to household structure.

AMERICAN RELIGIOUS IDENTIFICATION SURVEY, 2001THE GRADUATE CENTER OF THE CITY UNIVERSITY OF NEW YORK
29
Catholic 50,873,000 20 5 60 9 6Baptist 33,830,000 17 5 58 12 8NO RELIGION 29,481,000 33 22 19 9 6Christian 14,190,000 26 6 56 9 3Methodist 14,140,000 12 3 64 9 12Lutheran 9,580,000 12 4 68 7 9Presbyterian 5,596,000 12 3 64 9 12Protestant 4,647,000 11 3 66 9 10Pentecostal 4,407,000 18 4 58 14 6Episcopalian/Anglican 3,451,000 12 6 59 12 11Jewish * 2,831,000 18 5 60 7 11Mormon 2,697,000 16 2 68 8 6Churches of Christ 2,593,000 12 3 63 9 13Non-denominational 2,489,000 22 19 27 9 7Congregational/UCC 1,378,000 12 3 62 8 14Jehovah’s Witnesses 1,331,000 27 3 57 6 8Assemblies of God 1,105,000 9 3 73 10 5Muslim/Islamic 1,104,000 37 6 49 7 1Buddhist 1,082,000 47 7 35 8 3Evangelical/Born Again 1,032,000 13 4 74 7 3Church of God 944,000 11 3 60 7 19Seventh Day Adventist 724,000 17 5 61 11 5
TOTAL US ADULTS 208,000,000 20 5 59 9 6
EXHIBIT 8
Marital Status by Selected Religious Group, 2001
Number of Adults
Percent Single
Name of Group
Percent Single/Co-
HabitingPercent Married
Percent Divorced/ Separated
Percent Widowed
(Weighted Data)
** NOTE: Some rows do not sum to 100% as "Refusals" were excluded.
*NOTE: Only Jews by religion were tabulated.

AMERICAN RELIGIOUS IDENTIFICATION SURVEY, 2001THE GRADUATE CENTER OF THE CITY UNIVERSITY OF NEW YORK
30
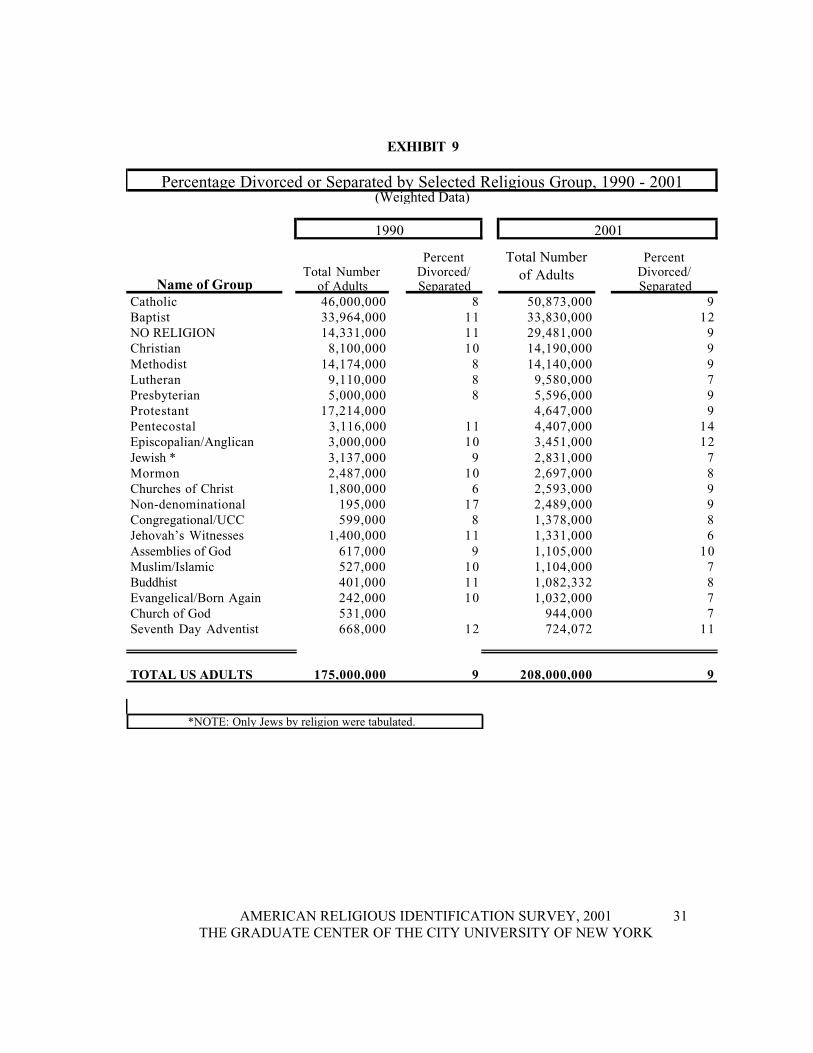
The data in Exhibit 8 underscore the accuracy of conventionalwisdom in the main: those who identify with one or another of themain religious groups are considerably more likely to be marriedthan those who have no religion. Particularly the no religiongroup was far more likely to be either single, never married orsingle, living with a partner than any other group. Indeed, the noreligion group shows the lowest incidence of marriage (just 19%)of all twenty-two groups. In sharp contrast, those identifying withthe Assemblies of God or Evangelical/Born Again Christians showthe highest proportions married, 73% and 74% respectively.
The percent currently divorced or separated varies considerablyless, from a low of six percent (Jehovah s Witnesses) to a high offourteen percent (Pentecostals).
In Exhibit 9 the study looks at the patterns of divorce andseparation between 1990-2001 across the twenty-two religiousself-identification groups. While this comparison offers nodramatic changes over the past eleven years, it does underscore theconstancy of most of the patterns.
AMERICAN RELIGIOUS IDENTIFICATION SURVEY, 2001THE GRADUATE CENTER OF THE CITY UNIVERSITY OF NEW YORK
31
Catholic 46,000,000 8 50,873,000 9Baptist 33,964,000 11 33,830,000 12NO RELIGION 14,331,000 11 29,481,000 9Christian 8,100,000 10 14,190,000 9Methodist 14,174,000 8 14,140,000 9Lutheran 9,110,000 8 9,580,000 7Presbyterian 5,000,000 8 5,596,000 9Protestant 17,214,000 4,647,000 9Pentecostal 3,116,000 11 4,407,000 14Episcopalian/Anglican 3,000,000 10 3,451,000 12Jewish * 3,137,000 9 2,831,000 7Mormon 2,487,000 10 2,697,000 8Churches of Christ 1,800,000 6 2,593,000 9Non-denominational 195,000 17 2,489,000 9Congregational/UCC 599,000 8 1,378,000 8Jehovah’s Witnesses 1,400,000 11 1,331,000 6Assemblies of God 617,000 9 1,105,000 10Muslim/Islamic 527,000 10 1,104,000 7Buddhist 401,000 11 1,082,332 8Evangelical/Born Again 242,000 10 1,032,000 7Church of God 531,000 944,000 7Seventh Day Adventist 668,000 12 724,072 11
TOTAL US ADULTS 175,000,000 9 208,000,000 9
Percentage Divorced or Separated by Selected Religious Group, 1990 - 2001
EXHIBIT 9
(Weighted Data)
20011990
Name of Group
*NOTE: Only Jews by religion were tabulated.
Percent Divorced/ Separated
Total Number of AdultsTotal Number
of Adults
Percent Divorced/ Separated

AMERICAN RELIGIOUS IDENTIFICATION SURVEY, 2001THE GRADUATE CENTER OF THE CITY UNIVERSITY OF NEW YORK
32
6. Mixed Religion Families Among Selected ReligiousGroups
Much as normative marriage patterns serve as a sociologicalbuttress to traditional religious identification and belonging, theymay also mask underlying change. As we noted earlier, ARIS2001shows substantial shifts toward secularism among a large numberof American adults.
Therefore in this section of the report we look at the incidence ofmarriage across religious lines. We should add that ARIS2001 isthe first national survey that has looked at the religiouscomposition of marriage and domestic partners in large enoughnumbers to be able to make generalizations among differentgroups. Because of the size of our sample and the nature of ourquestions, this survey has generated a wealth of data that willrequire much further mining with regard to issues pertaining tointerfaith households.
ARIS2001 found that of all households that contained either amarried or domestic partner couple, 22% percent reported amixture of religious identification amongst the couple. At the lowend there are the Mormon adults who are found in mixed religionfamilies at 12% and such other groups as Baptists, those adheringto the Churches of Christ, Assemblies of God, the Evangelicals andthose adhering to the Church of God (all at about 18%). At thehigh end we find the Episcopalians at 42% and Buddhists at 39%living in mixed religion families. In all, about 28 millionAmerican married or otherwise "coupled" adults live in a mixedreligion household.

AMERICAN RELIGIOUS IDENTIFICATION SURVEY, 2001THE GRADUATE CENTER OF THE CITY UNIVERSITY OF NEW YORK
33
Catholic 23Baptist 18NO RELIGION 28Christian 21Methodist 24Lutheran 28Presbyterian 27Protestant 33Pentecostal 24Episcopalian/Anglican 42Jewish* 27Mormon 12Churches of Christ 18Non-denominational 32Congregational/UCC 24Jehovah’s Witnesses 30Assemblies of God 18Muslim/Islamic 21Buddhist 39Evangelical/Born Again 18Church of God 18Seventh Day Adventist 24
22 **
28,400,000
(Weighted Estimate)
EXHIBIT 10
*NOTE: Category refers only to Jews by religion
Percentage of Adults in Mixed Religion Families for Selected Religious Groups, 2001
**NOTE: Base includes adults married or living with a partner; where the religious self-identification reported by respondent did not match that reported for spouse/partner.
Mixed Households
Respondent’s Religious Group
Percent in Mixed Households
Total Adults in Mixed Religion Couples

AMERICAN RELIGIOUS IDENTIFICATION SURVEY, 2001THE GRADUATE CENTER OF THE CITY UNIVERSITY OF NEW YORK
34
7. Age and Gender Patterns Among SelectedReligious Groups
It is difficult to overestimate the importance of age and sex eitherin the life of the individual or in the life of any group. Personaloutlook is often deeply influenced by these two rather obviouspersonal attributes. The future of a group is also often shaped bythe relative distribution of the old and the young and the relativeproportions of males and females. Therefore Exhibits 11 and 12explore these demographic patterns in the current survey, and forcomparison purposes in NSRI 1990.

AMERICAN RELIGIOUS IDENTIFICATION SURVEY, 2001THE GRADUATE CENTER OF THE CITY UNIVERSITY OF NEW YORK
35
Catholic 50,873,000 24 14 53Baptist 33,830,000 21 16 54NO RELIGION 29,481,000 35 8 41Christian 14,190,000 35 7 48Methodist 14,140,000 12 27 57Lutheran 9,580,000 15 22 52Presbyterian 5,596,000 10 29 55Protestant 4,647,000 13 30 50Pentecostal 4,407,000 24 9 59Episcopalian/Anglican 3,451,000 10 28 59Jewish* 2,831,000 14 28 51Mormon 2,697,000 29 15 54Churches of Christ 2,593,000 17 25 55Non-denominational 2,489,000 23 12 53Congregational/UCC 1,378,000 11 35 49Jehovah’s Witnesses 1,331,000 24 10 71Assemblies of God 1,105,000 21 10 51Muslim/Islamic 1,104,000 58 38Buddhist 1,082,332 56 3 39Evangelical/Born Again 1,032,000 19 9 57Church of God 944,000 16 19 64Seventh Day Adventist 724,072 10 26 38
TOTAL US ADULTS 208,000,000 23 16 52
*NOTE: Only Jews by religion are tabulated.
AGE & GENDER PATTERNS IN SELECTED GROUPS, 2001 (Weighted Data)
EXHIBIT 11
Percent FemaleNAME OF GROUP
Percent 18-29
Percent 65+
Number of Adults

AMERICAN RELIGIOUS IDENTIFICATION SURVEY, 2001THE GRADUATE CENTER OF THE CITY UNIVERSITY OF NEW YORK
36
Catholic 46,000,000 32 13 54Baptist 34,000,000 25 16 55NO RELIGION 14,000,000 35 9 39Christian 8,000,000 36 11 54Methodist 14,000,000 18 23 55Lutheran 9,000,000 22 20 54Presbyterian 5,000,000 16 25 53Protestant 17,000,000 15 21 51Pentecostal 3,100,000 29 11 58Episcopalian/Anglican 3,000,000 19 21 56Jewish* 3,100,000 23 22 49Mormon 2,500,000 27 13 54Churches of Christ 1,800,000 15 23 55Non-denominational 200,000 28 14 60Congregational/UCC 400,000 8 30 54Jehovah’s Witnesses 1,400,000 29 11 60Assemblies of God 600,000 16 18 58Muslim/Islamic 500,000 53 1 34Buddhist 400,000 35 8 35Evangelical/Born Again 500,000 18 19 58Church of God 400,000 17 21 56Seventh Day Adventist 700,000 25 23 59
TOTAL US ADULTS 175,000,000 26 16 53
*NOTE: Only Jews by religion are tabulated.
Source: NSRI 1990
AGE & GENDER PATTERNS IN SELECTED RELIGIOUS GROUPS, 1990
EXHIBIT 12
(Weighted Data)
Percent FemaleNAME OF GROUP
Percent 18-29
Percent 65+
Number of Adults
AMERICAN RELIGIOUS IDENTIFICATION SURVEY, 2001THE GRADUATE CENTER OF THE CITY UNIVERSITY OF NEW YORK
37
As in 1990 so too in the current study, the Buddhist and Muslimpopulation appears to have the highest proportion of young adultsunder age thirty, and the lowest percentage of females. A numberof the major Christian groups have aged since 1990, most notablythe Catholics, Methodists, and Lutherans. Congregationalist/UnitedChurch of Christ and Presbyterian adherents show an older agestructure with three times as many over age 65 as under age 35.Baptists also have fewer young adults than they had in 1990.Among Jews the ratio of the over-65 to those under-thirty hasshifted from nearly even in 1990 to about 2:1 in the current study.It should be noted, again, that this survey has focused only uponadult adherents. The observations about age structure do notinclude the children who may be present in the household of adultadherents.
8. Race and Ethnicity Among Selected ReligiousGroups
Although the ideals faith are supposed unite people across thegreat chasms carved by race and ethnicity, social scientists havelong noted the in a manner of speaking Sunday morning service isthe most segregated hour in America. ARIS2001 addressed theinterplay between faith, ethnicity and race by inquiring into eachcomponent of those who were surveyed.

AMERICAN RELIGIOUS IDENTIFICATION SURVEY, 2001THE GRADUATE CENTER OF THE CITY UNIVERSITY OF NEW YORK
38
TOTAL
Catholic 50,873,000 64 3 3 29 2 100Baptist 33,830,000 64 29 1 3 2 100NO RELIGION 29,481,000 73 8 5 11 4 100Christian 14,190,000 67 12 3 14 3 100Methodist 14,140,000 86 11 1 1 1 100Lutheran 9,580,000 96 1 0 1 1 100Presbyterian 5,596,000 91 3 2 3 1 100Protestant 4,647,000 87 4 0 6 3 100Pentecostal 4,407,000 58 22 0 17 3 100Episcopalian/Anglican 3,451,000 89 9 1 0 1 100Jewish* 2,831,000 92 1 1 5 1 100Mormon 2,697,000 91 0 0 8 1 100Churches of Christ 2,593,000 89 6 1 2 2 100Non-denominational 2,489,000 73 11 1 13 2 100Congregational/UCC 1,378,000 93 0 0 5 2 100Jehovah’s Witnesses 1,331,000 46 37 0 14 3 100Assemblies of God 1,105,000 80 5 5 8 2 100Muslim/Islamic 1,104,000 15 27 34 10 14 100Buddhist 1,082,000 32 4 61 2 1 100Evangelical/Born Again 1,032,000 77 3 0 20 0 100Church of God 944,000 84 12 0 4 0 100Seventh Day Adventist 724,000 67 26 0 7 0 100
TOTAL US ADULTS 208,000,000 70 10 3 12 5 100
Percent Hispanic
NON-HISPANIC
*NOTE:This category refers only to Jews by religion.
Percent Other
RACE AND/OR ETHNIC MAKE-UP OF SELECTED RELIGIOUS GROUPS, 2001
EXHIBIT 13
(Weighted Estimate)
Percent AsianNAME OF GROUP
Number of Adults
Percent White
Percent Black
AMERICAN RELIGIOUS IDENTIFICATION SURVEY, 2001THE GRADUATE CENTER OF THE CITY UNIVERSITY OF NEW YORK
39
Exhibit 13 describes the make-up of each of the twenty-two majorreligious groups in terms of proportion non-Hispanic White, non-Hispanic Black, Asian or Hispanic or something else. It should benoted that these characterizations were provided by respondents asanswers to fairly straight forward objective questions.
- Would you consider yourself to be White, Black, or of some other race?- Are you of Hispanic origin or background?
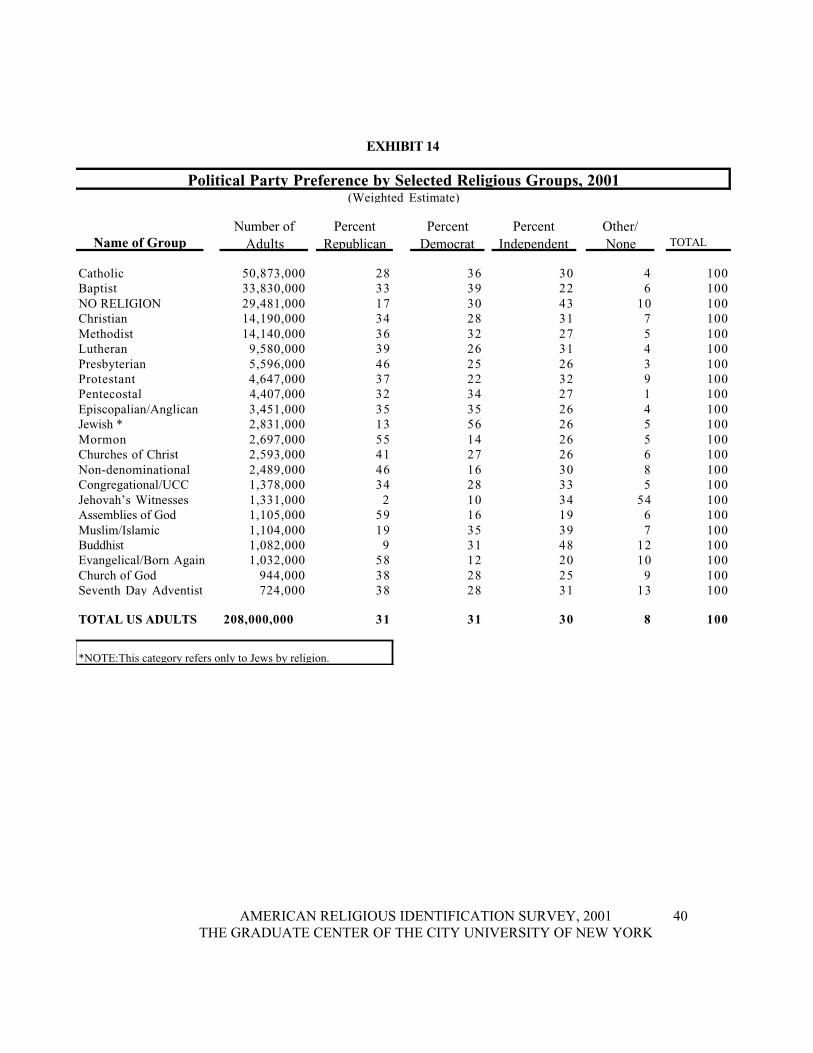
9. Political Party Preference Among Selected ReligiousGroups
Given the current debates over a wide variety of public policyissues in which religious convictions and principles are thought tobe of some consequence, this study sought to determine withgenerally broad brushstrokes to what extent religious groups mightdiffer with respect to the political party preferences of theiradherents. Exhibit 14 below describes that pattern.
AMERICAN RELIGIOUS IDENTIFICATION SURVEY, 2001THE GRADUATE CENTER OF THE CITY UNIVERSITY OF NEW YORK
40
TOTAL
Catholic 50,873,000 28 36 30 4 100Baptist 33,830,000 33 39 22 6 100NO RELIGION 29,481,000 17 30 43 10 100Christian 14,190,000 34 28 31 7 100Methodist 14,140,000 36 32 27 5 100Lutheran 9,580,000 39 26 31 4 100Presbyterian 5,596,000 46 25 26 3 100Protestant 4,647,000 37 22 32 9 100Pentecostal 4,407,000 32 34 27 1 100Episcopalian/Anglican 3,451,000 35 35 26 4 100Jewish * 2,831,000 13 56 26 5 100Mormon 2,697,000 55 14 26 5 100Churches of Christ 2,593,000 41 27 26 6 100Non-denominational 2,489,000 46 16 30 8 100Congregational/UCC 1,378,000 34 28 33 5 100Jehovah’s Witnesses 1,331,000 2 10 34 54 100Assemblies of God 1,105,000 59 16 19 6 100Muslim/Islamic 1,104,000 19 35 39 7 100Buddhist 1,082,000 9 31 48 12 100Evangelical/Born Again 1,032,000 58 12 20 10 100Church of God 944,000 38 28 25 9 100Seventh Day Adventist 724,000 38 28 31 13 100
TOTAL US ADULTS 208,000,000 31 31 30 8 100
EXHIBIT 14
*NOTE:This category refers only to Jews by religion.
Political Party Preference by Selected Religious Groups, 2001(Weighted Estimate)
Name of GroupNumber of
AdultsPercent
RepublicanPercent
DemocratPercent
IndependentOther/ None

AMERICAN RELIGIOUS IDENTIFICATION SURVEY, 2001THE GRADUATE CENTER OF THE CITY UNIVERSITY OF NEW YORK
41
To be sure, political party preferences probably fluctuate morethan do religious preferences. It is especially difficult to determinefrom survey data the extent to which political party preferences areinfluenced by the heat of the most recent elections. Those caveatsaside, the data in Exhibit 14 point to some important continuities aswell as shifts.
Jews, Muslims, Buddhists and those with no religion continue tohave a greater preference for the Democratic party over theRepublican — much as they did in 1990. Evangelical or Born AgainChristians and Mormons are the most apt to identify asRepublicans. Buddhists and those with no religion are most likelyto be political independents. In keeping with their theology,Jehovah s Witnesses disavow political involvement.
10. State and Faith
The final section of this report pays due recognition to the fact thatAmerica is also the United States — a name which often masks asmuch diversity as it portrays unity. With respect to religion inparticular, states differ considerably in the religious make-up oftheir populace. That diversity is likely to contribute as much asany other source of social variation to differences in their culturaland political climate.

AMERICAN RELIGIOUS IDENTIFICATION SURVEY, 2001THE GRADUATE CENTER OF THE CITY UNIVERSITY OF NEW YORK
42
% % % % % % % % % % % % % % % % % % % % % % %AL 15 41 7 6 10 3 3 1 3 2 1 2 2 1 1 1 0 0 0 2 1 100AKAZ 32 8 19 11 6 5 2 3 2 1 1 6 1 2 0 0 0 0 1 0 100AR 7 39 14 5 9 1 2 1 7 0 0 7 3 0 1 3 0 1 0 100CA 36 7 21 12 2 3 3 3 1 2 2 2 1 2 0 1 0 1 2 1 1 100CO 25 9 23 10 6 6 3 3 2 3 2 2 2 1 0 1 0 0 1 1 1 100CT 36 11 14 7 5 4 1 5 1 7 1 2 1 1 3 0 1 2 0 0 0 100DE 10 2 20 4 22 5 3 0 4 2 1 1 1 0 2 2 100DC 29 21 14 6 1 5 1 1 9 3 1 0 2 0 2 5 1 100FL 29 20 14 6 7 3 4 2 3 3 3 1 1 1 0 1 0 0 1 1 1 1 100GA 9 40 13 8 12 2 3 1 3 2 0 1 1 2 0 1 0 1 1 0 1 0 100HIID 16 10 21 10 10 3 3 2 1 1 0 16 1 1 1 1 0 2 0 1 100IL 31 12 16 7 6 8 3 3 2 2 2 0 1 2 1 0 0 1 1 2 0 0 100IN 22 15 17 11 10 6 2 4 3 1 2 0 2 1 1 1 0 0 1 1 100IA 26 5 14 6 14 18 4 2 2 0 0 0 1 1 2 0 1 0 1 0 100KS 23 15 17 10 13 5 3 2 1 1 1 1 3 2 0 1 1 0 1 0 0 100
KY 16 37 15 9 6 3 1 1 5 1 0 3 1 0 1 1 0 1 1 100LA 31 38 10 4 5 2 1 1 3 1 0 1 2 0 0 1 0 0 0 1 100ME 25 15 17 8 10 4 1 7 2 1 0 3 2 1 2 0 1 1 0 100MD 24 18 15 6 12 5 3 2 3 3 3 1 1 1 0 2 0 1 0 0 1 0 100MA 50 5 18 4 3 1 1 4 2 4 2 0 1 0 4 1 0 1 1 0 0 0 100MI 25 15 17 6 10 8 3 3 2 1 1 0 1 2 1 1 1 1 0 0 1 1 100
MN 27 6 15 7 5 26 3 2 1 1 0 1 1 1 2 0 0 1 2 0 0 100MS 6 59 7 4 10 1 3 1 4 1 2 1 1 1 0 0 2 0 100
MO 21 24 17 9 7 5 2 2 5 0 1 1 2 1 1 1 1 0 0 0 0 100M T 25 5 19 10 7 16 4 1 1 1 4 1 1 1 1 2 1 100NE 30 9 10 4 11 17 4 4 1 1 0 1 3 0 2 1 0 3 0 100
NV 25 16 21 9 5 3 2 4 1 1 2 9 1 1 0 100NH 39 6 19 5 4 1 1 11 1 4 1 0 7 1 100NJ 41 9 16 4 6 3 4 3 2 3 5 1 0 1 0 1 0 1 1 0 0 0 100
NM 43 11 18 6 2 3 4 1 3 1 0 3 2 2 0 0 0 0 100NY 42 8 15 4 6 3 2 3 2 3 6 0 1 1 0 1 1 2 1 1 0 0 100NC 11 42 11 7 10 3 4 2 3 1 1 1 1 2 1 0 1 0 0 0 1 1 100ND 33 6 4 2 8 38 0 1 0 0 1 1 1 3 2 1 0 100OH 21 16 17 7 12 6 4 5 4 1 0 1 2 2 1 0 0 1 0 1 1 0 100OK 7 33 15 9 12 2 3 1 4 2 0 0 4 2 1 3 0 1 1 100OR 16 6 28 14 5 6 3 2 2 3 0 4 2 3 1 1 1 0 1 2 1 1 100PA 30 10 13 6 10 9 6 4 1 2 1 1 1 1 2 1 1 0 0 1 1 0 100RI 55 7 17 4 1 0 1 1 1 8 1 2 1 1 1 100SC 7 46 8 6 15 2 5 1 3 2 0 0 0 1 0 1 1 0 0 0 0 0 100SD 26 4 8 4 13 29 4 3 2 2 0 0 1 3 0 0 1 100
TN 7 42 9 8 11 2 3 1 2 2 1 0 6 1 0 0 1 0 0 0 2 1 100TX 30 22 12 7 8 3 2 2 3 1 1 1 3 2 0 1 1 1 0 0 1 0 100UT 6 3 18 3 1 1 1 1 0 4 0 54 6 0 0 0 0 1 1 100VT 43 4 24 4 6 0 2 5 0 1 1 6 0 1 1 0 2 100VA 15 33 13 8 8 3 3 2 2 4 1 1 1 2 1 1 1 1 0 0 0 0 100
WA 22 7 27 12 5 7 4 3 2 1 2 3 1 1 1 1 1 1 0 0 1 100WV 9 33 15 7 17 1 4 4 4 1 0 0 1 1 0 1 0 0 0 2 0 100WI 30 7 15 5 8 24 2 2 1 1 0 0 1 1 2 1 0 0 1 0 0 100
WY 19 9 21 9 5 9 4 4 0 4 2 7 2 3 1 1 0 100
Total
Religious Groups
*NOTE: Only Jews by religion are included in this tabulation. As such, the category represents only 53% of the total population of American adults who may regard themselves as Jewish by virtue of parentage, upbringing or self-identification.
Catholic BaptistNo
Religion ChristianMethodist
Lutheran
Presbyterian
Protestant
Catholic BaptistNo
Religion ChristianProtest
ant
State by State Comparison of Selected Religious Groups
(Weighted Estimate)
Congregational/UCC
State Methodist
Lutheran
Presbyterian
Assemblies of God
Buddhist
Evangelical
Church of God
Churches of Christ
Episcopalian/Anglican
Pentecostal
Episcopalian/Anglican *Jewish
Mormon
Churches of Christ
Pentecostal
Mormon*Jewish
Non-denomina
TotalMuslim/Islam
Jehovah’s Witness
Assemblies of God
Muslim/Islam
Buddhist
Evangelical
Seventh Day Adventist
Jehovah’s Witness
Church of God
Seventh Day Adventist
Non-denomina
tion l
Congregational/UCC

AMERICAN RELIGIOUS IDENTIFICATION SURVEY, 2001THE GRADUATE CENTER OF THE CITY UNIVERSITY OF NEW YORK
43
Despite the growing diversity nationally, some religious groupsclearly occupy a dominant demographic position in particularstates. For instance, Catholics are the majority of the population inMassachusetts and Maine as are Mormons in Utah and Baptists inMississippi. Catholics comprise over 40% of Vermont, NewMexico, New York and New Jersey, while Baptists are over 40%in a number of southern states such as South Carolina, Tennessee,North Carolina, Alabama and Georgia.
Historical traces of the Bible belt in the South and an irreligiousWest are still evident. Those with "no religion" constitute thelargest group in Oregon, Washington, Idaho and Wyoming. Incontrast, the percentage of adults who adhere to "no religion" isbelow 10 percent in North and South Dakota, the Carolinas,Alabama, Mississippi and Tennessee.
Such religious concentrations might well have significant impacton host of public policy issues as well as on such matters asreligious-based philanthropy.
It remains the challenge of further explorations of these and relateddata to discover the complex ways in which the religiousidentification patterns of the American populace shapes the cultureand fate of the United States.

AMERICAN RELIGIOUS IDENTIFICATION SURVEY, 2001THE GRADUATE CENTER OF THE CITY UNIVERSITY OF NEW YORK
44
APPENDIX
DEMOGRAPHICS
The respondent in this survey was a randomly chosen (based on lastbirthday) adult over 18 years. In addition, the survey inquired about twentyother characteristics of persons and households, enabling us to develop afairly nuanced demographic profile of each religious group. Those questionsincluded the following:
For Respondent
1.Age 5.Race/ Hispanic origin/Jewish origin2.Marital status 6.Political party affiliation3.Employment status 7.Sex4.Level of education 8.Head of household or not
9.Registered voter
For Household
10. Own or rent home 15.Number & sex of children (0-6)11. Total number living in household 16.Total household income12. Number & sex of adults 18+ 17.Number of telephones13. Number & sex of children 12-17 18.Metro/rural status14. Number & sex of children 6-11 19.State
20.U.S. region
POPULATION ESTIMATES
In order to accurately reflect a true statistical portrait of the United States theraw survey data are weighted by ICR Survey Research Group using the latestCensus Bureau statistics, to reflect the known composition of U.S. householdsand the total population. The weighting that is incorporated into each recordtakes into account the disproportionate probabilities of household projectiondue to the number of separate telephone lines and the probability associatedwith the random selection of an individual household member. Followingapplication of the above weights, the sample is post-stratified and balanced bykey demographics such as age, sex, region and education. However, weightingcannot compensate for characteristics that are neither geographic nordemographic in nature. The most obvious is an inability to communicate in

AMERICAN RELIGIOUS IDENTIFICATION SURVEY, 2001THE GRADUATE CENTER OF THE CITY UNIVERSITY OF NEW YORK
45
English. This means there may be a tendency to underestimate some of thesmaller religious groups that contain a high proportion of recent immigrants.Nevertheless, the range of error will not be very large even in these cases. Thesampling error in the survey is 0.5% for the overall sample of 50,000 and 1%for the sub-sample of 17,000.
Another way to express the power of the results is to look at confidenceintervals within religious groups. At the 95% confidence level (i.e. that resultswill fall within the stated range in 95 samples out of 100 sample drawn fromthe population) the percentage of adult Catholics who are women is 54% +/-1.2% -- namely between 52.85% - 55.2%.
QUESTIONS PERTAINING TO RELIGION, ETHNICITY,RELIGION IN THE FAMILY AND TECHNOLOGY
Religious Affiliation and switching
Three questions were introduced to assess the extent of religious switchingamong different segments of the American adult population.
1. Household membership of a church, temple synagogue or mosque.2. Change of religious preference by respondent3. Current and previous religious preference
Secularism
A series of questions were introduced to determine the nature and extent ofbasic religious faith among the adherents of various religious groups.
Questions: 1. A religious- secular outlook self-grading by the respondent 2. A battery of three agree/disagree questions on the Divine.
Inter-faith Families
ARIS 2000 constitutes the first national survey that has probed the extent towhich American households are divided by religion (i.e. spouses do notprofess the same religious identification).
AMERICAN RELIGIOUS IDENTIFICATION SURVEY, 2001THE GRADUATE CENTER OF THE CITY UNIVERSITY OF NEW YORK
46
Questions:1. Religion of both spouses recorded.2. Year of marriage3. Religion in which raising/will raise children
Hispanics
Given the significant growth in America s Hispanic population, ARIS 2001 is thefirst to probe on a survey basis the religious proclivities and affiliations of this largeand growing minority.
Questions: (to be associated with religious items)1. Country of birth (incl. Puerto Rico).2. Year of entry to US if foreign-born.
Communications Technology
Finally, in light of the communications revolution of the past decade, ARIS 2001probes the extent of utilization of the new media among different religious groups.
Questions:1. Use of Cable/satellite/PPV. 3. Use of audio equipment2. Use of PC/Internet 4. Use of VCR/ Laser discs


