RELIGIOUS EMPLOYMENT IN NORTH DAKOTAlibrary.nd.gov/statedocs/JobService/religemp20090811.pdfbecoming...
46
RELIGIOUS EMPLOYMENT IN NORTH DAKOTA 2000 A proud member of America’s Workforce Network.
Transcript of RELIGIOUS EMPLOYMENT IN NORTH DAKOTAlibrary.nd.gov/statedocs/JobService/religemp20090811.pdfbecoming...

RELIGIOUS EMPLOYMENT
IN NORTH DAKOTA
2000
A proud member of America’s Workforce Network.
RELIGIOUS EMPLOYMENT
IN NORTH DAKOTA
2000
Governor John Hoeven
1000 E Divide AvePO Box 5507Bismarck, ND 58506-5507
Primary ResearcherCraig Koch
Executive Director Maren L. Daley
Prepared by Labor Market Information Center
Director of Employment Statistics & Workforce Programs
Korrine Lang
Labor Market Information Manager Duane Broschat
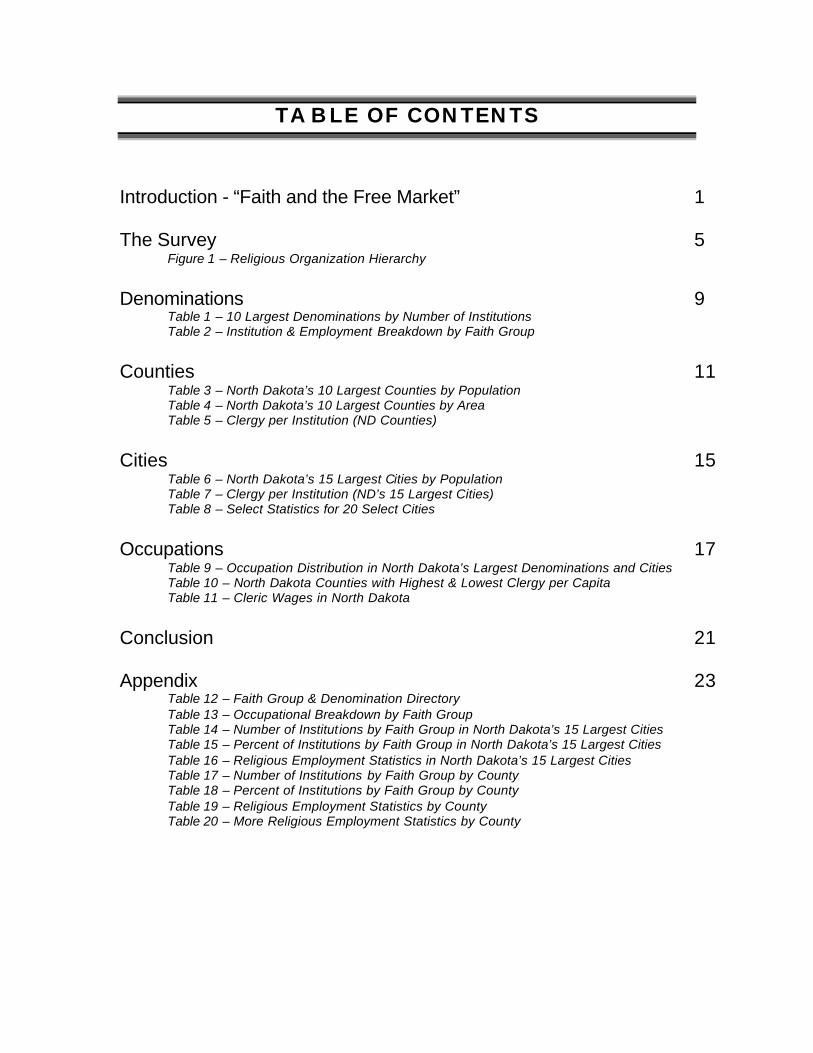
TABLE OF CONTENTS
Introduction - “Faith and the Free Market” 1
The Survey 5 Figure 1 – Religious Organization Hierarchy
Denominations 9 Table 1 – 10 Largest Denominations by Number of Institutions Table 2 – Institution & Employment Breakdown by Faith Group
Counties 11 Table 3 – North Dakota’s 10 Largest Counties by Population Table 4 – North Dakota’s 10 Largest Counties by Area Table 5 – Clergy per Institution (ND Counties)
Cities 15 Table 6 – North Dakota’s 15 Largest Cities by Population Table 7 – Clergy per Institution (ND’s 15 Largest Cities) Table 8 – Select Statistics for 20 Select Cities
Occupations 17 Table 9 – Occupation Distribution in North Dakota’s Largest Denominations and CitiesTable 10 – North Dakota Counties with Highest & Lowest Clergy per CapitaTable 11 – Cleric Wages in North Dakota
Conclusion 21
Appendix 23 Table 12 – Faith Group & Denomination DirectoryTable 13 – Occupational Breakdown by Faith GroupTable 14 – Number of Institutions by Faith Group in North Dakota’s 15 Largest CitiesTable 15 – Percent of Institutions by Faith Group in North Dakota’s 15 Largest CitiesTable 16 – Religious Employment Statistics in North Dakota’s 15 Largest CitiesTable 17 – Number of Institutions by Faith Group by CountyTable 18 – Percent of Institutions by Faith Group by CountyTable 19 – Religious Employment Statistics by CountyTable 20 – More Religious Employment Statistics by County

FAITH AND THE FREE MARKET
While not officially recognized as such, religion has become a worldwide industry generating billions of dollars annually, through both donations and commercial ventures. Americans alone contributed over $100 billion dollars to religious organizations in the past year, most going to churches. But like every industry, it is prone to trends and challenges. Membership growth is stagnant at best, congregations in rural areas continue to struggle, and alternative options to traditional practices are prevalent. Is traditionalism in trouble? If it is, will commercialization be its salvation?
Today, religion is dramatically increasing its economic influence, using modern capitalist means to expand its reach. Marketing is a prime example. Churches are constructing and implementing marketing plans using demographic trend information (birth rates, marriage trends, migration patterns) to attract and retain adherents. The “megachurch” phenomenon is a result. Large metropolitan institutions are mimicking marketing techniques employed by major corporate entities, resulting in increasingly larger numbers of congregants. While achieving higher numbers is desirable and often necessary for survival, some conclude it may overtake the importance of the church itself. Yet others argue, if utilized properly, demographic information can lead to increased church development and sponsorship of localized programs that benefit those most in need today and beyond.
Who is more likely to attend church in any given week?
Over 65 57% Under 30 30%
Female 46% Male 36%
Rural 47% Urban 33%
Source: Gallup Poll April 2001
Commercialism has not only changed the way religion promotes itself, but the religious experience is also evolving and taking on broader meaning. As a generation raised on practicality and convenience, teens and younger adults are shaking off ritual and tradition and embracing alternatives. These alternatives collectively form the multibillion-dollar
“experience” industry, masking personal enrichment as religion. Seminars, retreats, and continuing education classes are substituting for traditional religious practices, thereby filling a supposed spiritual void felt by younger and older adults alike. Church affiliation seems less of a concern.
Worldwide Religion Membership
Christianity 2 billion Islam 1.3 billion Hinduism 900 million Nonreligious 850 million Buddhism 360 million Sikhism 23 million Judaism 14 million
Source: Adherents.com August 2001
Religion is taking a more proactive, some would say aggressive, approach in marketing their message. To get the word out to a new generation of potential worshippers, all media formats – books, music, movies, television, radio – have been utilized by the largest religions, especially
Christians, and it has been quite successful. In 2000, nationwide sales of Christian related media materials, one of the fastest growing segments of the media industry, totaled over three billion dollars and sales continue to grow. Christian rock festivals are
1

becoming increasingly popular, Christian movies have been extremely profitable, and Christian books are flying off the shelves. A Christian Wrestling Federation? It exists. Even billboards, customarily used to sell commercial products to an increasingly mobile public, have posted advertisements with a message - “attention deficit sermons” - yet another example of religion trying to get the word out. Some say these are necessary moves by religions to tailor their message through multiple mediums in the hopes of attracting the youth population, a critical future success factor. As competition for this demographic intensifies, so do marketing efforts. Like any second language, if taught early enough, it becomes second nature, and marketing is a second language of sorts commonly cognized by today’s seemingly fractured youth segment. Again, marketing has become a way to reach a generation raised on an endless diet of sales pitches, testimonials, and advertising campaigns.
With a large segment of adherents on- line, the Internet has also become an integral marketing tool used by religious organizations to sell salvation and generate revenue. Major media advertising is nothing new for congregations, but worldwide acceptance of the Internet has pushed many to the development and maintenance of their own websites. The Internet is being touted as the next frontier in the religious experience, but will it live up to the declaration? It remains to be seen. There is little doubt that churches use the Internet to advertise their services, but will the “experience” translate via the Internet? While only 16 percent of teens say the Internet will substitute for their current church-based religious experience in the next five years, the seemingly non-existent physical and spiritual boundaries disproportionately appeal to younger generations. Whether virtual faith becomes a working reality is unclear, but the omnipotent nature of the Internet makes it almost an inevitable.
Even though 71 percent of Americans never doubted the existence of God, fewer are attending church on a consistent basis. About half attend religious services once a month or never. Fueled by feelings of spiritual disenfranchisement, people are becoming intrigued with the idea of customizing their religion to fit their tastes and lifestyles. While teens’ beliefs are stable over time, reported church attendance continues to fall. Teens cite that most traditional churches do
not help people find the meaning in life. If church attendance is no longer a cornerstone of religious or spiritual celebration, where are people turning to get spiritual guidance?
Spirituality and the Internet
¤ 10 percent of non-Christians and 14 percent of Christians seek spiritual input via the Internet
¤ 4 percent of teens use the Internet for religious experiences.
Source: 2000 Barna Research Group October
Religious organizations have a history of business affiliations, most notably health care, education, and social services, and we still see many of these affiliations in North Dakota. Regionally, religion’s demands have generated
A Virtual Congregation?
¤ Presently, 8 percent of adults and 12 percent of teenagers use the Internet for religious purposes.
¤ Less than 1 percent of all adults and 2 percent of teens currently use the Internet as a substitute for a physical-church.
Source: h Group May 2001 Barna Researc
economic development opportunities. Traditionally, kosher foods play an important role
2

in the Jewish religion, spawning an entire U.S. industry that grew over 10 percent in the last decade. With that in mind, another religion, Islam, poised to become the second largest religion in the United States, echoes this trend as it has become necessary to provide foods that adhere to a Muslim’s strict religious diet. In order to satisfy the growing national demand, and due to the close proximity of the raw input, a manufacturing facility has been established in rural North Dakota to produce acceptable beef products for practicing Muslims across the country. Business is expected to be brisk. Even the clothing business is not immune to religion’s impact. A couple of North Dakota entrepreneurs will market a clothing line with a Christian theme. It will be more or less directed to a younger generation of worshippers looking for cool, hip clothes with
Tithing in Trouble?
¤ 78 percent of all adults donated money to a non-profit organization or church in 2000.
¤ The average giving per person dropped 15 percent in 2000; dropped more than one-third since 1998.
¤ Six out of every ten dollars given to non-profit organizations went to churches.
¤ The average church donor contributed $649 to churches in 2000, down from $806 in 1999.
¤ One of every six adults (17%) claims to tithe, but when comparing incomes only 6% actually donated one-tenth of their earnings.
Source: Barna Research Group June 2001
a message. The initial marketing focus will target Christian music festivals, Christian bookstores, and the Internet. Just a few examples of how religion affects North Dakota’s economic and entrepreneurial spirit.
In an effort to share scarce and critical resources, traditional denominations have started to merge many of their commonalties, but doctoral conflicts continue to hinder completion. The Evangelical Lutheran Church in America (ELCA) and Episcopalian denominations disagree over such a
proposed combination, which would initiate the sharing of clergy and communion. These actions are seen as critical for the survival of many isolated, financially challenged rural churches. Closure may be the only option faced by many rural churches without pooling of such resources. Recently, the National Trust for Historic Preservation declared a large number of North Dakota’s prairie churches endangered places. There is now a push to rescue these social and spiritual landmarks from deterioration and destruction.
Religion is more than a debatable concept, an institution, critics say, whose time has passed. Religion has been a building block for many, rooting itself in community, culture, and society as a whole. Religion plays an influential role in modern day choices relating to school selection, political affiliation, and even consumer products. The line between commercialistic and traditionalistic sects is becoming increasingly blurred. But while religion’s survival could hinge on underutilized, unorthodox concepts long deemed unacceptable to traditional practices, for better or for worse, it continues to be mankind’s most polarizing concept.
3

4
THE SURVEY
Between 1890 and 1946, the U.S. Census Bureau intermittently collected religious data. However, due to strong objections in the aftermath of World War II by many groups, particularly the Jewish community, the religious census was suspended and never resumed. This survey deals specifically with religious institutions and employment in North Dakota. We did not seek information regarding congregant populations or religious affiliations.
In the three years since the last religious employment survey, North Dakota’s religious employment picture remains fairly static. The most compelling finding concerns population shifts and religion’s adaptability. But underlying the stable institutional and employment numbers is a struggle to keep the identity, social connection, and soul of small communities alive.
In order to fully understand the findings, it is important to define certain terms and concepts within this publication.
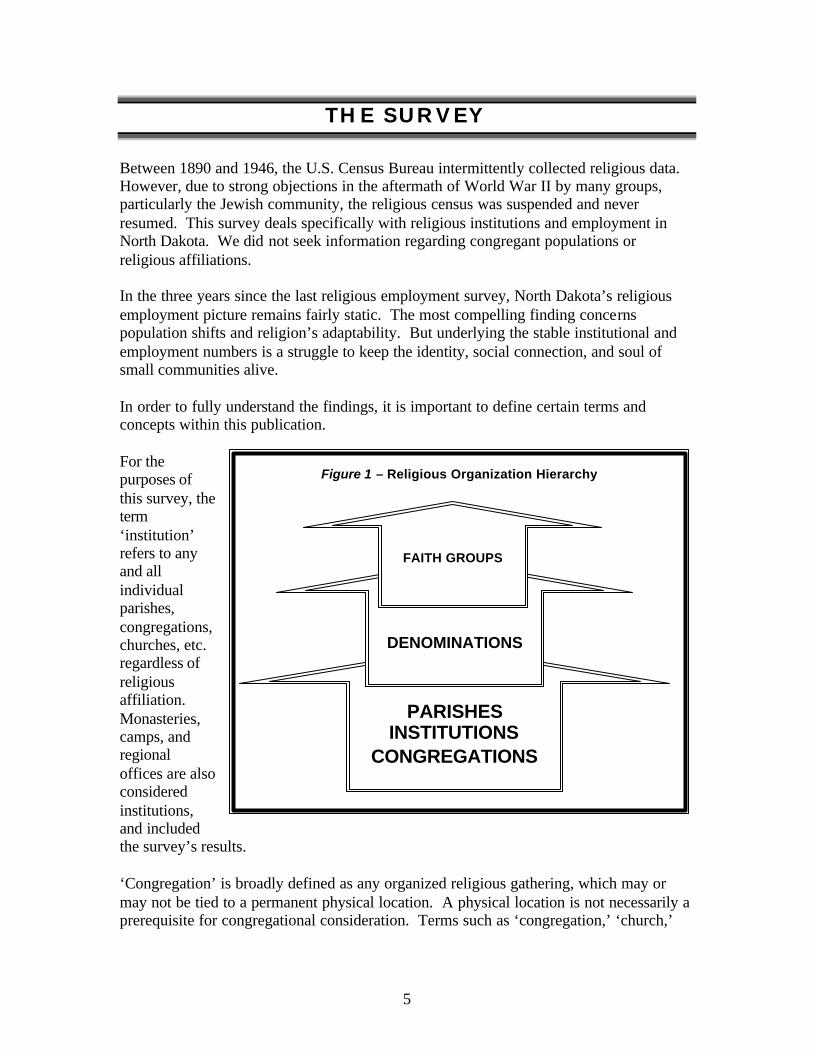
For the purposes of this survey, the term ‘institution’ refers to any and all individual parishes, congregations, churches, etc. regardless of religious affiliation. Monasteries, camps, and regional offices are also considered institutions, and included the survey’s results.
Figure 1 – Religious Organization Hierarchy
PARISHES INSTITUTIONS
CONGREGATIONS
DENOMINATIONS
FAITH GROUPS
‘Congregation’ is broadly defined as any organized religious gathering, which may or may not be tied to a permanent physical location. A physical location is not necessarily a prerequisite for congregational consideration. Terms such as ‘congregation,’ ‘church,’
5
and ‘parish’ are used interchangeably throughout this publication, which should not be construed as an endorsement of one religion over another.
A denomination is a collection of institutions with a specified religious affiliation. A faith group is a grouping of denominations, whose categories reflect theological, religious commonalties. The purpose of a ‘faith group’ is to include those denominations that might otherwise be excluded in the statistical analysis. For a breakout of the faith group and denomination structure used in this report, turn to page 25 for further detail.
Our religious institutions are exempt from participating in the state’s unemployment insurance program, thus limiting the ability to monitor religious institution and religious employment levels. So every few years, the Labor Market Information Center of Job Service conducts a religious employment survey. The survey has been an infrequent tool used over the past 20 years, but in 1997 the survey and subsequent publication were overhauled to include detailed state denominational and occupational information. Specific wage and membership information was not requested.
Religious institutions were asked to provide the number of employees belonging to one of ten occupational categories. The only requirement was that the employee (either part-time or full- time) earned at least $50 during the survey period. The institutions were also asked to omit any casual labor not usually done in the course of the religious organization’s activities, contractual workers, pensioners, and unpaid volunteers. Religiously affiliated hospitals, schools, and nursing homes were not to be included in this survey. Youth camps were once again counted, but not included in the their respective religious denomination totals. Instead, they were placed in a ‘CAMP’ denominational category under the faith group ‘OTHER.’
Institutional existence was verified through rosters obtained by contacting the appropriate regional offices. Institutions were initially contacted via a mail survey and two subsequent follow-ups. Telephone calls were also placed to improve the response rate. Of the 1,691 religious institutions in the state, 1,428 completed and returned the survey, resulting in an 84 percent response rate. Employment was conservatively estimated for the remaining institutions, based on historical patterns and demographic similarities.
A growing trend in rural North Dakota is the sharing of resources, most notably clergy, by two or more institutions, resulting in the formation of congregational networks. In these instances, even though resource sharing is occurring, each congregation is counted independently regardless of network affiliation. Again, if an employee works for more than one institution, that employee is represented in the employment counts of each institution where he or she earns at least $50 a month. This is consistent with the method used to determine covered employment. Jobs are counted, not workers.
There has been a revision in the way institutions are assigned their geographic location, affecting mostly rural congregations. In the 1997 survey, geographic locations were assigned based on an institution’s mailing address, but the institution’s mailing address is not always its physical location. Many of the aforementioned congregation networks
6

perform administrative duties from one location leading to possible geographic misrepresentation. For the 2000 survey, a field was added to distinguish between the two variables, thus placing institutions in a more accurate geographic location category.
There are five dually affiliated denominations represented by 12 institutions and 30 employees. To avoid institutional double counting, these dual affiliations were treated separately and not included in final tallies of either affiliated denomination; instead, they were treated as unique denominational entities. Their institutional and employment counts were lumped together and added to the final totals. This should ensure accurate tracking in future surveys of a growing segment in North Dakota’s religious landscape.
This religious employment survey is the first to use 2000 Census population data, resulting in a more accurate and timely snapshot of the demographics affecting religion activity in North Dakota. The 1997 survey was limited to 1990 Census information.
7

8

DENOMINATIONS
North Dakota currently houses 70 denominational categories, each adhering to one of eight faith group categories. Those institutions not affiliated with any religious organization are considered ‘non-denominational,’ and as such constitute their own denominational category. Due to the increased interest in such groups, it is important to be able to track this religious segment.
North Dakota’s ten largest denominations make up 76.5 percent of the institution total and 82.7 percent of the religious employment total. Since the 1997 survey, the state realized a 1.5 percent increase in the number of institutions with equal increases occurring among the state’s largest and smallest denominations. The state also saw an aggregate increase in religious employment of 5 percent, limited mostly to the largest denominations in the most populated areas. Over the last survey period, the ten largest denominations slightly strengthened their presence in the state, increasing institution counts by 1.4 percent and employment levels 8 percent, while all other denominations combined gained 1.5 percent and lost 7.2 percent, respectively. Of note in the 2000 survey, there are three religious denominations tied for ninth place in the top ten listing, resulting in a representation of eleven denominations and lopsided 1997 comparisons. When looking strictly at 1997’s top ten denominations and their respective activity in 2000, we find a decrease in the ins titution count (-17 institutions, -1.3 percent), but an increase in employment (+226 employees, +6.5 percent).
Table 1 – 10 Largest Denominations by Number of Institutions
Number Percent Total Percent Employment of of Religious of per
Religious Denomination Institutions Total Employment Total Institution
Evangelical Lutheran Church in America 467 27.6% 1,478 32.8% 3.2
Roman Catholic 287 17.0% 1,139 25.3% 4.0
United Methodist Church 118 7.0% 274 6.1% 2.3
Missouri Synod Lutheran 94 5.6% 231 5.1% 2.5
Assembly of God 64 3.8% 172 3.8% 2.7
Presbyterian Church, USA 60 3.5% 141 3.1% 2.4
United Church of Christ 49 2.9% 88 2.0% 1.8
Southern Baptist Church 47 2.8% 59 1.3% 1.3
Seventh Day Adventists 36 2.1% 28 0.6% 0.8
Association of Free Lutheran Congregations 36 2.1% 71 1.6% 2.0
Non-denominational 36 2.1% 52 1.2% 1.4
All Other Denominations 397 23.5% 777 17.2% 2.0
Statewide Total 1,691 4,510 2.7
Of the nearly 1,700 religious institutions, 27.6 percent are Evangelical Lutheran Church in America (ELCA) parishes. This denomination also claims the largest percent of the state’s religious employment with close to 33 percent, which averages out to 3.2
9

employees per institution. The next largest denomination, Roman Catholic, captures 17 percent of the state’s religious institutions and 25.3 percent of religious employment. Roman Catholics hold the distinction of having the highest average employment per institution (4.0) among the state’s largest denominations. Together, the ELCA and Roman Catholic denominations account for 44.5 percent of the state’s religious institutions and 58 percent of the state’s religious employment. The remaining denominations in the top ten each account for 7 percent or less of the state’s religious institutions and religious employment. The remaining 60 denominations account for less than 25 percent of the state’s total religious institutions and 17.2 percent of total religious employment.
Approximately 73 percent of North Dakota’s denominations each account for less than 1 percent of the state’s religious institutions and employment. Due to the relatively small share of religious institutions and employment contributed by most of North Dakota’s denominations, faith groups were created to make broader statistical comparisons and protect confidentiality. For a breakdown of the faith group structure, please refer to the Faith Group and Denomination Directory on page 25. The faith groups contain all of the state’s 70 denominations and over 4,500 religious employees. The largest faith group is also home to North Dakota’s largest denomination (ELCA). Lutherans have 37.7 percent of the state’s religious institutions and 41.4 percent of religious employment. Other Reformation Churches have the second highest concentration of religious institutions (18.2
Table 2 – Institution and Employment Breakdown by Faith Group
Number Percent Total Percent Employment of of Religious of per
Faith Group Institutions Total Employment Total Institution
LUTH 638 37.7% 1,865 41.4% 2.9
CA TH 293 17.3% 1,142 25.3% 3.9
REFORM 307 18.2% 653 14.5% 2.1
BAPT 128 7.6% 230 5.1% 1.8
NONDE 36 2.1% 52 1.2% 1.4
EVAN 113 6.7% 219 4.9% 1.9
PENT 107 6.3% 238 5.3% 2.2
OTHER 69 4.1% 111 2.5% 1.6
TOTAL 1,691 4,510 2.7
(See the Faith Group and Denomination Directory on page 25 for further detail.)
percent), whereas Catholics hold the second highest concentration of religious employment (25.3 percent). The large denominations are driving the state’s religious employment.
10

COUNTIES
Compared to the 1997 religious employment survey, North Dakota’s ten most populous counties experienced a 2.4 percent increase in religious institutions and a 7.7 percent increase in religious employment. The balance of state climbed 0.8 percent in religious institutions and 1.5 percent in religious employment. Overall, the state climbed 1.5 percent and 5 percent, respectively. The same ten counties show a 6.1 percent increase in population over 1990, whereas the rest of the state experienced a collective 9.6 percent drop. These statistics bear out the migration trends to the North Dakota’s population centers and the related shift in religious employment.
Looking at North Dakota’s five most populous counties, the four that gained population did so because of their largest cities. Between 67 and 231 percent of a county’s increase was the result of substantial gains in its largest city. Grand Forks was the only county in the top five to lose population, but the city of Grand Forks only contributed 2 percent to the county’s overall 6.5 percent decline.
North Dakota’s religious institutions and religious employment are not consolidating as quickly as its population. The ten largest counties account for 69.4 percent of the state’s population, 42.6 percent of the religious institution total, and 58.5 percent of religious employment.
Population per institution is a measurement of the average number of potential and current parishioners served by any single institution. Institutions in the largest counties serve the most people and, according to 2000 Census results, numbers are on the rise. The five counties with the highest populations per institution all serve 500 or more people. These are also the most heavily populated counties, with the anomaly being
Table 3 – North Dakota’s 10 Largest Counties by Population
Percent Number Percent Total Percent Employment of of of Religious of per
County Population Total Institutions Total Employment Total Institution
Cass 123,138 19.2% 153 9.0% 681 15.1% 4.5
Burleigh 69,416 10.8% 85 5.0% 425 9.4% 5.0
Grand Forks 66,109 10.3% 94 5.6% 340 7.5% 3.6
Ward 58,795 9.2% 101 6.0% 314 7.0% 3.1
Morton 25,303 3.9% 49 2.9% 146 3.2% 3.0
Stark 22,636 3.5% 47 2.8% 139 3.1% 3.0
Stutsman 21,908 3.4% 56 3.3% 165 3.7% 2.9
Williams 19,761 3.1% 54 3.2% 156 3.5% 2.9
Richland 17,998 2.8% 49 2.9% 198 4.4% 4.0
Rolette 13,674 2.1% 32 1.9% 71 1.6% 2.2
Balance of state 203,462 31.6% 971 57.4% 1,875 41.5% 1.9
ND Statew ide 642,200 1,691 4,510 2.7
11

Oliver County. This county has an extremely low religious ins titution and employment count, resulting in amplified levels. Not surprisingly, counties with low populations per institution generally have low population counts; counties with large populations report the highest number of people per institution. In general, low population counts, and not an abundance of institutions, contribute to low institutional population densities. This affords institutions in the largest counties the opportunity to serve five times as many people as those in the smallest countie s.
Cass County is the “religious” center of North Dakota led by the city of Fargo. It has the largest number of religious institutions and religious employment. Cass County accounts for 9 percent of the state’s religious institutions and 15 percent of the state’s religious employment.
An important accessibility measurement of available services is location of and distance between parishes, especially as populations consolidate. Five of North Dakota’s ten largest counties in terms of square mileage are also the most populated. North Dakota’s most populated counties (Cass, Burleigh, Grand Forks, and Ward) also have some of the
Table 4 – North Dakota’s 10 Largest Counties by Area
Number Sq Miles Total Employment Sq Miles Population Square of per Religious per Total per
Rank County Miles Institutions Institution Employment Institution Clergy Clergy
24 McKenzie 2,742.0 30 91.4 53 1.8 23 119.2
7 Stutsman 2,221.4 56 39.7 165 2.9 52 42.7
14 McLean 2,110.0 43 49.1 106 2.5 38 55.5
8 Williams 2,070.5 54 38.3 156 2.9 69 30.0
4 Ward 2,012.9 101 19.9 314 3.1 99 20.3
34 Dunn 2,009.6 10 201.0 20 2.0 9 223.3
5 Morton 1,926.3 49 39.3 146 3.0 48 40.1
21 McHenry 1,874.1 31 60.5 44 1.4 26 72.1
20 Mountrail 1,823.9 31 58.8 45 1.5 24 76.0
1 Cass 1,765.2 153 11.5 681 4.5 193 9.1
lowest average number of miles between institutions. The odds for greater denominational diversity increase in areas with a lower number of square miles per institution. The lower a county’s average square miles between institutions, the chances are greater that religious services will be available within a reasonable distance. Again, North Dakota’s most populous counties have the advantage. Cass, Grand Forks, Burleigh, and Ward Counties average less than 20 square miles per institution. Conversely, the five counties with the highest average miles between institutions average between 111 and 406. The state average is just under 41 miles. Forty-three percent of North Dakota’s counties do better than the state average. Adherents in counties with a larger number of miles between institutions may experience difficulty in readily locating a parish that fits their needs. These counties are also the least densely populated in the state.
12

- Table 5 -Clergy per Institution
(ND Counties)
Williams 1.28 Divide 0.89
Cass 1.26 Walsh 0.89
Richland 1.22 Dickey 0.89
Burleigh 1.22 McLean 0.88
Steele 1.13 Burke 0.88
Bowman 1.07 McIntosh 0.88
Grand Forks 1.06 Pembina 0.88
Stark 1.04 Cavalier 0.86
Traill 1.03 Bottineau 0.84
Oliver 1.00 McHenry 0.84
Ward 0.98 Eddy 0.83
Morton 0.98 Emmons 0.83
ND Statewide 0.97 Nelson 0.83
Griggs 0.95 Kidder 0.80
Renville 0.94 Sheridan 0.80
Ramsey 0.94 Hettinger 0.79
Foster 0.93 Mountrail 0.77
Stutsman 0.93 Sargent 0.77
Towner 0.92 Pierce 0.77
Barnes 0.92 McKenzie 0.77
LaMoure 0.92 Adams 0.76
Benson 0.91 Wells 0.76
Ransom 0.91 Golden Valley 0.67
Grant 0.90 Slope 0.67
Dunn 0.90 Sioux 0.60
Logan 0.90 Rolette 0.59
Mercer 0.90 Billings 0.50
Statewide, only eight counties have lower square miles per clergy averages, when compared to their institutional square mileage average. All but two of these eight counties have the distinction of also being one of the ten most populated in North Dakota. This measurement can be important when looking at clergy shortages. The higher the average square miles per clergy, the more likely it is that an area is experiencing a shortage and the more likely it is to be a less densely populated county (exceptions are those counties with lower square mileage and higher than average religious institution and employment levels). Technological advancements could render this measurement, as well as many others, useless. Rural connectivity may encourage options like the Internet or other interactive mediums.
Religious institutions may not be aggressively following the statewide trend of consolidation, but those institutions that remain open are finding it more difficult to employ the clergy necessary to perform the needed services. Only 19 percent of North Dakota’s 53 counties have at least a 1:1 ratio between institutions and clergy, and only 23 percent have ratios above the state average of 0.97. This once again emphasizes the problem the state faces in attracting clergy to isolated areas of the state. Going forward, clergy, an already rapidly aging occupational category, will become harder to replace as large urban centers compete for the same highly- in-demand professionals that many rural areas crave.
13

14

CITIES
The ten most populous cities account for 49.2 percent of the state’s total population, 24.1 percent of the state’s religious institutions, and 42.2 percent of religious employment.
Table 6 – North Dakota’s 15 Largest Cities by Population
Percent Number Percent Total Percent Percent of of of Religious of Total of
City Population Total Institutions Total Employment Total Clergy Total
Fargo 90,599 14.1% 85 5.0% 493 10.9% 127 7.8%
Bismarck 55,532 8.6% 69 4.1% 395 8.8% 90 5.5%
Grand Forks 49,321 7.7% 53 3.1% 253 5.6% 63 3.8%
Minot 36,567 5.7% 65 3.8% 245 5.4% 66 4.0%
Mandan 16,718 2.6% 22 1.3% 89 2.0% 24 1.5%
Dickinson 16,010 2.5% 27 1.6% 72 1.6% 22 1.3%
Jamestown 15,527 2.4% 29 1.7% 133 2.9% 30 1.8%
West Fargo 14,940 2.3% 16 0.9% 65 1.4% 18 1.1%
Williston 12,512 1.9% 28 1.7% 102 2.3% 42 2.6%
Wahpeton 8,586 1.3% 15 0.9% 57 1.3% 28 1.7%
Devils Lake 7,222 1.1% 16 0.9% 45 1.0% 16 1.0%
Valley City 6,826 1.1% 19 1.1% 95 2.1% 19 1.2%
Grafton 4,516 0.7% 14 0.8% 47 1.0% 14 0.9%
Beulah 3,152 0.5% 13 0.8% 33 0.7% 13 0.8%
Rugby 2,939 0.5% 15 0.9% 30 0.7% 14 0.9%
Balance of state 301,233 46.9% 1,205 71.3% 2,356 52.2% 1,051 64.2%
ND Statewide 642,200 1,691 4,510 1,637
The five largest cities account for 38.7 percent of the state’s population, yet they account for only 17.3 percent of the institutions and 32.7 percent of religious employment. Fargo employs 11 percent of the state’s religious employees and houses 5 percent of the state’s religious institutions. Only five of the ten largest cities had any population growth since the 1990 Census. Consistent with county growth patterns, four of the ten most populous cities posted increases of 10 percent or higher; all four tied to North Dakota’s MSAs (Metropolitan Statistical Areas). All but two of North Dakota’s largest cities account for more than 60 percent of their home county’s population; five cities account for over 70 percent. The city of Bismarck houses 80 percent of Burleigh County’s population (Bismarck holds 81 percent of Burleigh’s religious institutions and 92.9 percent of its religious
- Table 7 -
Clergy per Institution
(ND's 15 Largest Cities)
Wahpeton 1.87 Minot 1.02
Williston 1.50 Devils Lake 1.00
Fargo 1.49 Valley City 1.00
Bismarck 1.30 Grafton 1.00
Grand Forks 1.19 Beulah 1.00
West Fargo 1.13 ND Statewide 0.97
Mandan 1.09 Rugby 0.93
Jamestown 1.03 Dickinson 0.81
employment). Consolidation is accelerating more quickly in North Dakota counties housing the state’s largest cities, becoming beacons of religious breadth and diverseness.
15

In the 1997 survey, a sample of twenty select North Dakota cities and towns varying in population and geographic location were chosen to make assorted collective comparisons. For this publication, we have included a follow-up look at these cities and
Table 8 – Select Statistics for 20 Select Cities
Population Population Population Denominations per per per
City County Population Present Denomination Institution Clergy
Beulah Mercer 3,152 13 242.5 242.5 242.5
Bismarck Burleigh 55,532 39 1,423.9 804.8 617.0
Bottineau Bottineau 2,336 10 233.6 194.7 212.4
Bowman Bowman 1,600 6 266.7 266.7 228.6
Cando Towner 1,342 5 268.4 268.4 268.4
Carrington Foster 2,268 10 226.8 206.2 226.8
Cooperstown Griggs 1,053 6 175.5 150.4 150.4
Crosby Divide 1,089 5 217.8 155.6 181.5
Devils Lake Ramsey 7,222 14 515.9 451.4 451.4
Dickinson Stark 16,010 21 762.4 593.0 727.7
Elgin Grant 659 6 109.8 94.1 94.1
Ellendale Dickey 1,559 8 194.9 173.2 194.9
Fargo Cass 90,599 38 2,384.2 1,065.9 713.4
Hankinson Richland 1,058 4 264.5 151.1 151.1
Harvey Wells 1,989 9 221.0 165.8 221.0
Linton Emmons 1,321 5 264.2 264.2 220.2
Mohall Renville 812 4 203.0 203.0 203.0
Underwood McLean 812 7 116.0 101.5 101.5
Velva McHenry 1,049 3 349.7 349.7 349.7
Walhalla Pembina 1,057 6 176.2 176.2 176.2
towns, a cross section comparison using updated census numbers. Overall, the twenty select cities enjoyed an 11.5 percent jump in population, close to a net gain of 20,000 people (largely skewed by Fargo’s and Bismarck’s population contribution of close to 23,000 people). There was an overall gain (+0.9 percent) in denominations present, inversely pushing down the population per denomination ratio. There was considerable strength in the population per institution (+9.9 percent) and per clergy (+13.5 percent) ratios, but this is attributed to stronger population growth in only four of the twenty select cities.
16
OCCUPATIONS
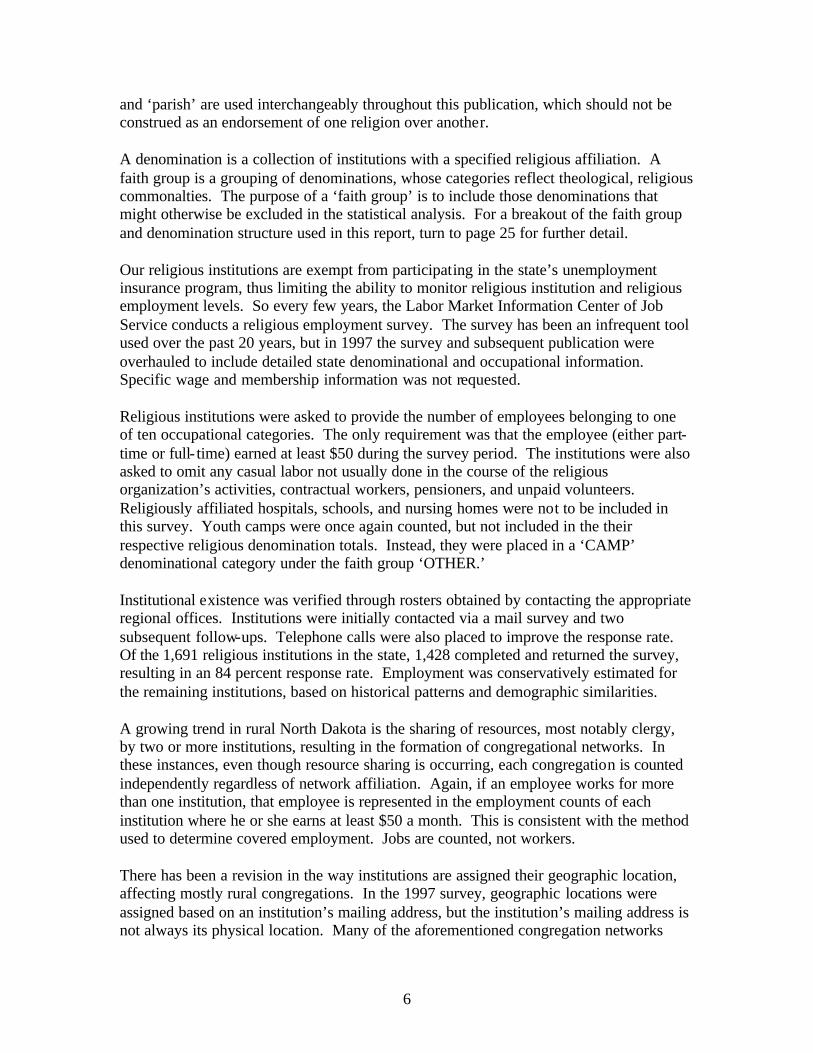
The top five denominations account for 76.2 percent of all religious employment. Alternately, North Dakota’s top five cities hold 32.7 percent. The five largest denominations account for 69.6 percent of all clergy in the state. The top five cities house just 22.6 percent of cleric employment. Consolidation is not necessarily encouraging
institutional growth in large cities, though a higher proportion of religious employment occurs there. The largest denominations, rather than the largest cities, dominate North Dakota’s religious employment. The Lutheran faith group
dominates employment in six of the nine religious occupational categories. Catholics dominate the remaining three categories.
Table 9 – Occupation Distribution in North Dakota’s Largest Denominations and Cities
Top Percent Top Percent Total Five of Five of
Occupation Employees Denominations Total Cities Total
Clergy 1,637 1,139 69.6% 370 22.6%
Secretary 710 549 77.3% 246 34.6%
Housekeeper 131 115 87.8% 34 26.0%
Bookkeeper 194 159 82.0% 81 41.8%
Musician 525 464 88.4% 188 35.8%
Custodian 592 443 74.8% 185 31.3%
Youth Director 144 106 73.6% 83 57.6%
Religious Ed Director 154 142 92.2% 76 49.4%
Lay Ministry Director 46 35 76.1% 31 67.4%
Other 377 283 75.1% 181 48.0%
Total 4,510 3,435 76.2% 1,475 32.7%
The Roman Catholic denomination not only employs the highest number of people per institution, they also employ 41.9 percent of employees classified as “Other” (not belonging to one of the nine occupational choices). ELCA has the second highest concentration of “Other” employees with 17.5 percent. Business and/or office managers were cited most frequently. These specialized religious occupations are highly concentrated in the larger cities.
Clergy are the most common religious occupation in North Dakota, accounting for 36.3 percent of all religious employment in the state, followed by secretaries with 15.7 percent. Custodians and musicians are not far behind. Non-clergy religious employment is disproportionately higher in the state’s largest cities and denominations, particularly the specialized religious occupations. North Dakota’s religious employment is highly, but not overly, concentrated in a few populous areas. The clergy shortage is not strictly a rural small town issue. North Dakota’s largest cities are also experiencing the shortfall. The ten largest cities in North Dakota house almost 50 percent of the state’s population, but only attract 31.1 percent of the total clergy. Clergy consolidation is progressing at a slower pace than the population at large.
17
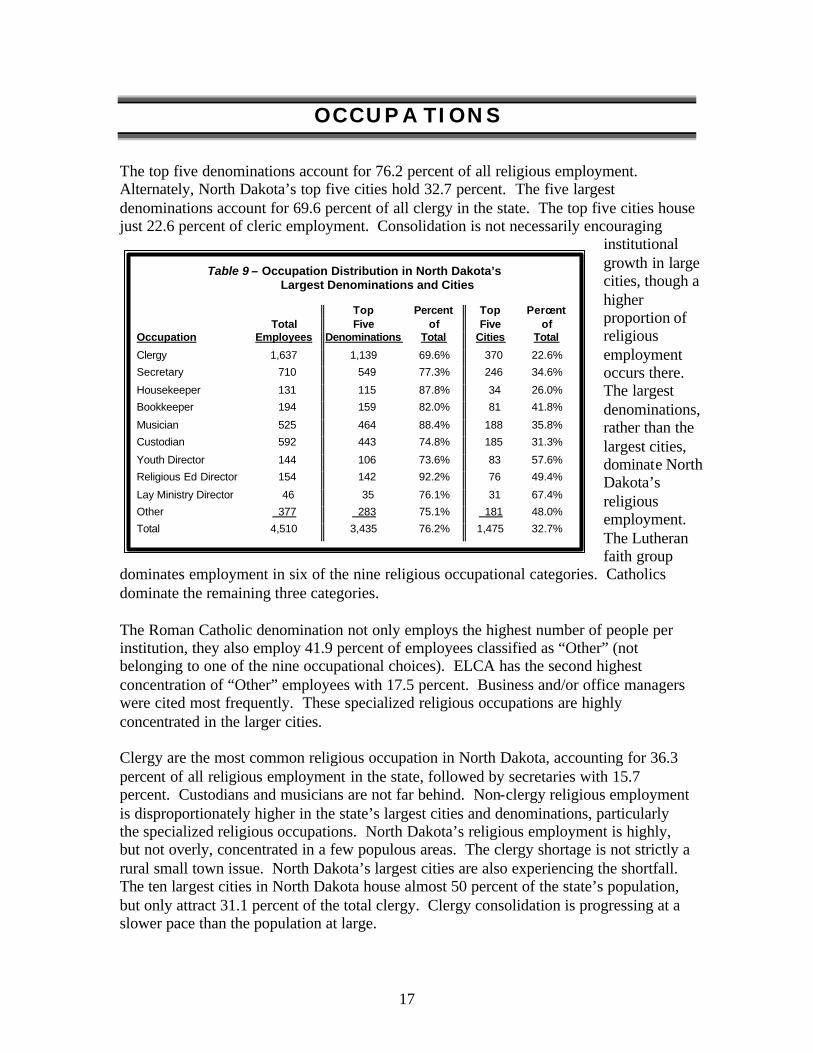
Due to a decline in the largest segment of religious employment, clergy are called to serve a larger number of parishioners. The number of cleric staff in the state dropped 1.4 percent from 1997 to 2000. The average number of people a rural clergyman serves is generally larger than the institution average; the inverse is true for urban areas. This situation encourages small towns to share clergy, a growing trend in rural North Dakota. Institutions in rural areas outnumber clergy, therefore the dependence on lay personnel
Table 10 – North Dakota Counties with Highest and Lowest Clergy per Capita
Number Population Population Sq Miles Clergy Square of per Total per per per
County Population Miles Institutions Institution Clergy Clergy Clergy Institution
Logan 2,308 992.6 20 115.4 18 128.2 55.1 0.90
Steele 2,258 712.4 15 150.5 17 132.8 41.9 1.13
Divide 2,283 1,259.5 19 120.2 17 134.3 74.1 0.89
LaMoure 4,701 1,147.2 36 130.6 33 142.5 34.8 0.92
Sheridan 1,710 971.8 15 114.0 12 142.5 81.0 0.80
Cass 123,138 1,765.2 153 804.8 193 638.0 9.1 1.26
Grand Forks 66,109 1,437.8 94 703.3 100 661.1 14.4 1.06
Burleigh 69,416 1,633.1 85 816.7 104 667.5 15.7 1.22
Oliver 2,065 723.5 3 688.3 3 688.3 241.2 1.00
Rolette 13,674 902.5 32 427.3 19 719.7 47.5 0.59
continues to increase in churches and communities around the state. The five counties with the highest cleric densities still have five times more parishioners per clergyman than the five lowest counties. Urban populations are increasing at a faster rate than religious employment in these communities.
As North Dakota’s retired and elderly increase their presence in the state, the need for religious services increases, resulting in a need for new and replacement clergy, which will undoubtedly become critical in the next 25 years. In general, cleric workers are older than the entire workforce. In 1998, roughly 57 percent of the nation’s clergy were 45 years of age and older, whereas the average among all workers was 33.7 percent (farmers had the highest percentage at 68.5). Even more telling: 12 percent of the nation’s clergy were older than 65, compared to just 3 percent of the entire workforce. While the future job outlook for most clergy is competitive, the largest cities will continue to have the easiest time in attracting prospective workers. According to North Dakota’s ten-year employment projections through 2008, it is forecasted that the need for clergy workers will increase 10.5 percent. But with an aging cleric workforce, filling upcoming vacancies becomes critical.
The mean is a mathematical average, while the median is the 50th percentile of a set of values, basically the middle value. Together, these tools paint a troubling wage picture for North Dakota’s clergy. Wages for clergy in the state further solidify the differences in serving rural communities versus the state’s population centers. The annual and hourly wage information tells us that when the median is higher than the mean, more than 50
18

percent of cleric workers are earning wages higher than the respective average. Such is the case in Fargo. But when the median is lower than the mean, which is the case in statewide and balance of state scenarios, this informs us that more than 50 percent of North Dakota’s clergy earn below average wages. Once again, this emphasizes the link between population, pay, and opportunity, and further illustrates the struggle small towns face when it comes to the retaining and attracting clergy. Clergy wage information for the Bismarck MSA and Grand Forks MSA was not available, but the general consensus is that these areas would follow the general pattern of the state’s largest MSA (Fargo).
Table 11 – Cleric Wages in North Dakota
Annual Annual Hourly Hourly
Mean Median Mean Median
Statewide - North Dakota 27,380 24,350 13.17 11.71
Fargo MSA* 29,800 32,250 14.33 15.50
Balance of State** 26,910 23,290 12.94 11.20
*Cass County, ND & Clay County, MN. **Excludes the MSA counties of Cass, Burleigh, Grand Forks, and Morton.
Source: Occupational Wages & Employment 2001
19

20
CONCLUSION
Religious institutions in North Dakota employ over 4,500 people, roughly 24 percent1
more than the mining industry. Rural church infrastructure deterioration, declining parishioner populations, and clergy retention in rural areas are just a few of the numerous and, some say, critical challenges facing our religious institutions.
Whether recognized for its involved social past, subtle economic present, or visionary spiritual future, religion continues to exert influence and sometimes controversy. As the new millennium gains momentum, so will the modern-day political, cultural, and economic power of an institution reared by history and tradition.
1 North Dakota Employment and Wages: 2000
21

22

APPENDIX
23

24

Table 12 – Faith Group and Denomination Directory
Faith Group ABBREV. Denomination
Lutheran LUTH Evangelical EVAN American Assoc. of Lutheran Churches AALC Christian & Missionary Alliance ALLI
American Lutheran Church ALC Church of the Brethren BRETH
Association of Free Lutheran Congregations AFLC Church of the Nazarene NAZA
Church of the Lutheran Confession LCONF Evangelical Church of North America EVAN
Evangelical Lutheran Church in America ELCA Evangelical Covenant Church ECOV
Laestadian Congregation LAES Evangelical Free Church of America EFREE
Lutheran LUTH Salvation Army SALV
Lutheran Brethren Church LBC Seventh Day Adventists SDA
Missouri Synod Lutheran MSYNOD
Wisconsin Evangelical Lutheran Synod WELS Pentecostal PENT Assembly of God AG
Other Reformation Churches REFORM Assembly of God (German District) AGGER
Christian Reformed CHREF Church of God GOD
Church of Christ CHRIST Church of God (Anderson) GODAND
Episcopal Church EPISC Church of God - General Conference GODGC
Free Methodist Church FMETH Church of God & Christ - Mennonite GCMEN
Great Plains Congregational Fellowship CONG Church of God in Christ GODCH
Independent Congregational Churches INDCON Church of God of Prophecy PROPH
Mennonite MENN Church of God Seventh Day GOD7
Mennonite Brethren MENBR Foursquare Gospel Church 4SQU
Moravian Church MORAV Full Gospel FGOSP
Orthodox Presbyterian Church ORTHP United Pentecostal Church PENT
Plymouth Brethren PLYBR
Presbyterian Church, USA PRESB Non-Denominational NONDE Presbyterian Church in America PRESAM
Reformed Church in America RCA Other OTHER Reformed Church in the United States REFUS Baha'i Faith BAHAI
Religious Society of Friends FRIEND Camps CAMP
United Church of Christ UCC Christian Science CSCI
United Methodist Church UMETH Church of Jesus Christ of Latter Day Saints LDS
Wesleyan Church WESLY Islam ISLAM
Jehovah's Witnesses JEH
Catholic CATH Jewish - Orthodox ORTHJ
Orthodox Church ORTH Jewish - Reformed REFJ
Roman Catholic Church CATH Open Bible Standard OBS
Ukrainian Catholic Church UKR Reorganized Church of Jesus Christ of Latter Day Saints REORG
Unitarian Universalist Church UNIT
Baptist BAPT American Baptist Church ABAPT
Baptist - General Conference GCBAP
Conservative Baptist Assoc. of America CBAA
Independent Baptist Churches IBAPT
North American Baptist Church NABC
Southern Baptist Church SBAPT
25

26

Table 13 - Occupational Breakdown by Faith Group
House- Book- Youth Religious Ed. Lay Ministry Faith Group Clergy Secretary keeper keeper Musician Custodian Director Director Director Other
Percent of
Total Total
LUTH
CATH
REFORM
BAPT
NONDE
EVAN
PENT
OTHER
653 326 13 86 336 260 61 27 11 92
314 160 101 58 72 126 29 102 22 158
296 94 4 18 92 78 15 15 8 33
119 33 1 4 5 44 7 2 2 13
25 10 1 1 4 2 5 2 0 2
99 39 4 10 4 33 10 3 0 17
114 36 2 14 8 29 16 2 2 15
17 12 5 3 4 20 1 1 1 47
1,865 41.4%
1,142 25.3%
653 14.5%
230 5.1%
52 1.2%
219 4.9%
238 5.3%
111 2.5%
TOTAL 1,637 710 131 194 525 592 144 154 46 377 4,510 100.0%
See the Faith Group and Denomination Directory on page 25 for further detail.

Table 14 - Number of Institutions by Faith Group in North Dakota's 15 Largest Cities
City Population * LUTH CATH REFORM BAPT NONDE EVAN PENT OTHER TOTAL
90,599
55,532
49,321
36,567
16,718
16,010
15,527
14,940
12,512
8,586
7,222
6,826
4,516
3,152
2,939
PERCENT OF STATE TOTAL
Fargo
Bismarck
Grand Forks
Minot
Mandan
Dickinson
Jamestown
West Fargo
Williston
Wahpeton
Devils Lake
Valley City
Grafton
Beulah
Rugby
21 12 18 10 5 7 3 9
16 7 12 10 1 7 10 6
13 6 5 6 4 5 7 7
15 8 9 10 5 6 6 6
6 4 4 3 1 2 1 1
4 7 5 3 1 2 3 2
8 1 6 4 0 6 2 2
4 2 3 2 2 1 2 0
10 2 4 3 0 4 2 3
2 3 3 1 0 2 3 1
5 1 3 1 1 2 1 2
6 2 4 1 1 3 2 0
5 1 0 2 0 2 3 1
3 1 1 2 0 3 2 1
8 1 1 0 0 1 2 2
85
69
53
65
22
27
29
16
28
15
16
19
14
13
15
5.0%
4.1%
3.1%
3.8%
1.3%
1.6%
1.7%
0.9%
1.7%
0.9%
0.9%
1.1%
0.8%
0.8%
0.9%
* Census 2000 FiguresSee the Faith Group and Denomination Directory on page 25 for further detail.

Table 15 - Percent of Institutions by Faith Group in North Dakota's 15 Largest Cities
City Population * LUTH CATH REFORM BAPT NONDE EVAN PENT OTHER TOTAL
90,599
55,532
49,321
36,567
16,718
16,010
15,527
14,940
12,512
PERCENT OF STATE TOTAL
Fargo
Bismarck
Grand Forks
Minot
Mandan
Dickinson
Jamestown
West Fargo
Williston
Wahpeton
Devils Lake
Valley City
Grafton
Beulah
Rugby
8,586
7,222
6,826
4,516
3,152
2,939
25% 14% 21% 12% 6% 8% 4% 11%
23% 10% 17% 14% 1% 10% 14% 9%
25% 11% 9% 11% 8% 9% 13% 13%
23% 12% 14% 15% 8% 9% 9% 9%
27% 18% 18% 14% 5% 9% 5% 5%
15% 26% 19% 11% 4% 7% 11% 7%
28% 3% 21% 14% 0% 21% 7% 7%
25% 13% 19% 13% 13% 6% 13% 0%
36% 7% 14% 11% 0% 14% 7% 11%
13% 20% 20% 7% 0% 13% 20% 7%
31% 6% 19% 6% 6% 13% 6% 13%
32% 11% 21% 5% 5% 16% 11% 0%
36% 7% 0% 14% 0% 14% 21% 7%
23% 8% 8% 15% 0% 23% 15% 8%
53% 7% 7% 0% 0% 7% 13% 13%
85
69
53
65
22
27
29
16
28
15
16
19
14
13
15
5.0%
4.1%
3.1%
3.8%
1.3%
1.6%
1.7%
0.9%
1.7%
0.9%
0.9%
1.1%
0.8%
0.8%
0.9%
* Census 2000 Figures
See the Faith Group and Denomination Directory on page 25 for further detail.

Table 16 - Religious Employment Statistics in North Dakota's 15 Largest Cities
Percent Number Percent Population Total Percent Employment Percent Population of of of per Religious of per Total of per
City Population * Total Institutions Total Institution Employment Total Institution Clergy Total Clergy Denominations
Present
Fargo 90,599 14.1%
Bismarck 55,532 8.6%
Grand Forks 49,321 7.7%
Minot 36,567 5.7%
Mandan 16,718 2.6%
Dickinson 16,010 2.5%
Jamestown 15,527 2.4%
West Fargo 14,940 2.3%
Williston 12,512 1.9%
Wahpeton 8,586 1.3%
Devils Lake 7,222 1.1%
Valley City 6,826 1.1%
Grafton 4,516 0.7%
Beulah 3,152 0.5%
Rugby 2,939 0.5%
85 5.0% 1,065.9
69 4.1% 804.8
53 3.1% 930.6
65 3.8% 562.6
22 1.3% 759.9
27 1.6% 593.0
29 1.7% 535.4
16 0.9% 933.8
28 1.7% 446.9
15 0.9% 572.4
16 0.9% 451.4
19 1.1% 359.3
14 0.8% 322.6
13 0.8% 242.5
15 0.9% 195.9
493 10.9% 5.8
395 8.8% 5.7
253 5.6% 4.8
245 5.4% 3.8
89 2.0% 4.0
72 1.6% 2.7
133 2.9% 4.6
65 1.4% 4.1
102 2.3% 3.6
57 1.3% 3.8
45 1.0% 2.8
95 2.1% 5.0
47 1.0% 3.4
33 0.7% 2.5
30 0.7% 2.0
38
39
32
37
14
21
23
13
21
13
14
14
12
13
10
127 7.8% 713.4
90 5.5% 617.0
63 3.8% 782.9
66 4.0% 554.0
24 1.5% 696.6
22 1.3% 727.7
30 1.8% 517.6
18 1.1% 830.0
42 2.6% 297.9
28 1.7% 306.6
16 1.0% 451.4
19 1.2% 359.3
14 0.9% 322.6
13 0.8% 242.5
14 0.9% 209.9
* Census 2000 Figures

Table 17 - Number of Institutions by Faith Group by County
County Population * LUTH CATH REFORM BAPT NONDE EVAN PENT OTHER
Adams
Barnes
Benson
Billings
Bottineau
Bowman
Burke
Burleigh
Cass
Cavalier
Dickey
Divide
Dunn
Eddy
Emmons
Foster
Golden Valley
Grand Forks
Grant
Griggs
Hettinger
Kidder
LaMoure
Logan
McHenry
McIntosh
2,593
11,775
6,964
888
7,149
3,242
2,242
69,416
123,138
4,831
5,757
2,283
3,600
2,757
4,331
3,759
1,924
66,109
2,841
2,754
2,715
2,753
4,701
2,308
5,987
3,390
8 2 3 1 0 1 1 1
17 6 6 1 1 3 3 0
18 9 2 1 0 2 2 1
2 1 1 0 0 0 0 0
17 4 3 1 1 2 0 4
5 3 3 1 0 1 1 0
8 3 2 1 0 0 2 1
20 10 18 11 1 8 11 6
48 22 40 12 7 8 6 10
7 8 9 1 0 2 1 0
8 3 5 2 1 4 3 2
13 2 2 0 0 0 2 0
4 4 0 2 0 0 0 0
8 1 2 0 0 1 0 0
3 7 6 1 0 0 1 0
4 2 1 2 0 3 1 2
4 2 0 0 0 2 0 1
35 9 13 10 5 6 9 7
7 3 8 1 0 1 1 0
12 2 1 0 1 2 1 0
4 3 4 0 0 1 2 0
7 4 7 0 1 1 0 0
12 6 11 1 1 3 2 0
5 3 4 4 0 2 2 0
15 6 6 3 0 0 0 1
4 3 4 3 0 0 2 0
* Census 2000 Figures
See the Faith Group and Denomination Directory on page 25 for further detail.
TOTAL
17
37
35
4
32
14
17
85
153
28
28
19
10
12
18
15
9
94
21
19
14
20
36
20
31
16

Table 17 - Number of Institutions by Faith Group by County
County Population * LUTH CATH REFORM BAPT NONDE EVAN PENT OTHER
5,737
9,311
8,644
McKenzie
McLean
Mercer
Morton
Mountrail
Nelson
Oliver
Pembina
Pierce
Ramsey
Ransom
Renville
Richland
Rolette
Sargent
Sheridan
Sioux
Slope
Stark
Steele
Stutsman
Towner
Traill
Walsh
Ward
Wells
25,303
6,631
3,715
2,065
8,585
4,675
12,066
5,890
2,610
17,998
13,674
4,366
1,710
4,044
767
22,636
2,258
21,908
2,876
8,477
12,389
58,795
5,102
13 5 6 2 0 3 1 0
17 6 8 5 1 2 3 1
12 2 4 4 0 3 4 1
10 13 14 5 1 2 2 2
16 4 3 2 1 1 3 1
15 6 2 0 1 0 0 0
2 1 0 0 0 0 0 0
16 9 17 1 0 2 3 0
10 5 2 0 0 1 2 2
14 4 6 1 1 2 1 2
10 3 4 1 0 2 1 1
9 3 2 1 0 1 0 0
24 10 8 1 0 2 3 1
9 10 4 2 0 1 4 2
8 6 5 1 0 0 1 1
3 1 5 3 0 2 1 0
0 5 2 5 0 0 1 2
1 1 0 0 1 0 0 0
8 18 7 5 2 2 3 2
9 2 2 0 0 0 1 1
15 8 14 5 0 9 3 2
5 3 3 0 0 1 1 0
28 4 2 0 0 1 0 1
19 12 5 3 1 2 3 2
32 13 14 15 6 9 6 6
11 5 2 3 2 7 3 0
* Census 2000 Figures
See the Faith Group and Denomination Directory on page 25 for further detail.
TOTAL
30
43
30
49
31
24
3
48
22
31
22
16
49
32
22
15
15
3
47
15
56
13
36
47
101
33

Table 17 - Number of Institutions by Faith Group by County
County Population * LUTH CATH REFORM BAPT NONDE EVAN PENT OTHER
19,761Williams 27 6 5 4 0 5 4 3
TOTAL
54
1,691ND Statewide 642,200 638 293 307 128 36 113 107 69
* Census 2000 FiguresSee the Faith Group and Denomination Directory on page 25 for further detail.

Table 18 - Percent of Institutions by Faith Group by County
County Population * LUTH CATH REFORM BAPT NONDE EVAN PENT OTHER
Adams
Barnes
Benson
Billings
Bottineau
Bowman
Burke
Burleigh
Cass
Cavalier
Dickey
Divide
Dunn
Eddy
Emmons
Foster
Golden Valley
Grand Forks
Grant
Griggs
Hettinger
Kidder
LaMoure
Logan
McHenry
McIntosh
2,593
11,775
6,964
888
7,149
3,242
2,242
69,416
123,138
4,831
5,757
2,283
3,600
2,757
4,331
3,759
1,924
66,109
2,841
2,754
2,715
2,753
4,701
2,308
5,987
3,390
47% 12% 18% 6% 0% 6% 6% 6%
46% 16% 16% 3% 3% 8% 8% 0%
51% 26% 6% 3% 0% 6% 6% 3%
50% 25% 25% 0% 0% 0% 0% 0%
53% 13% 9% 3% 3% 6% 0% 13%
36% 21% 21% 7% 0% 7% 7% 0%
47% 18% 12% 6% 0% 0% 12% 6%
24% 12% 21% 13% 1% 9% 13% 7%
31% 14% 26% 8% 5% 5% 4% 7%
25% 29% 32% 4% 0% 7% 4% 0%
29% 11% 18% 7% 4% 14% 11% 7%
68% 11% 11% 0% 0% 0% 11% 0%
40% 40% 0% 20% 0% 0% 0% 0%
67% 8% 17% 0% 0% 8% 0% 0%
17% 39% 33% 6% 0% 0% 6% 0%
27% 13% 7% 13% 0% 20% 7% 13%
44% 22% 0% 0% 0% 22% 0% 11%
37% 10% 14% 11% 5% 6% 10% 7%
33% 14% 38% 5% 0% 5% 5% 0%
63% 11% 5% 0% 5% 11% 5% 0%
29% 21% 29% 0% 0% 7% 14% 0%
35% 20% 35% 0% 5% 5% 0% 0%
33% 17% 31% 3% 3% 8% 6% 0%
25% 15% 20% 20% 0% 10% 10% 0%
48% 19% 19% 10% 0% 0% 0% 3%
25% 19% 25% 19% 0% 0% 13% 0%
* Census 2000 Figures
See the Faith Group and Denomination Directory on page 25 for further detail.
TOTAL
17
37
35
4
32
14
17
85
153
28
28
19
10
12
18
15
9
94
21
19
14
20
36
20
31
16
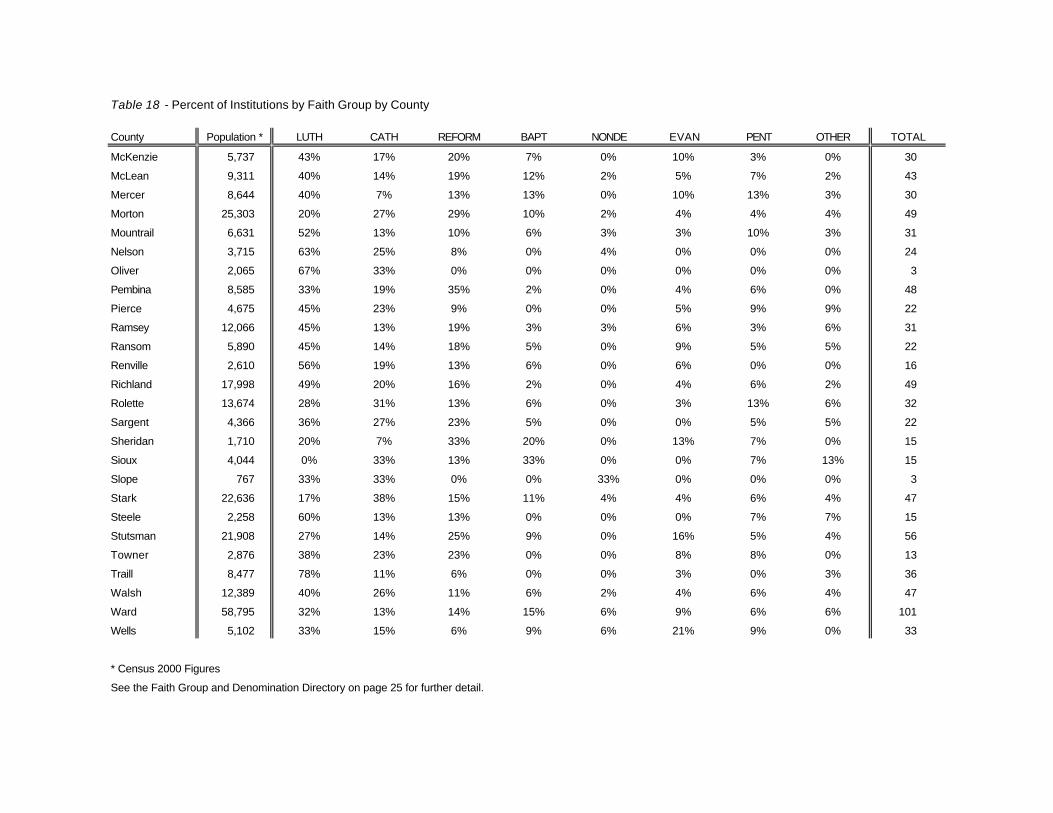
Table 18 - Percent of Institutions by Faith Group by County
County Population * LUTH CATH REFORM BAPT NONDE EVAN PENT OTHER
5,737
9,311
8,644
McKenzie
McLean
Mercer
Morton
Mountrail
Nelson
Oliver
Pembina
Pierce
Ramsey
Ransom
Renville
Richland
Rolette
Sargent
Sheridan
Sioux
Slope
Stark
Steele
Stutsman
Towner
Traill
Walsh
Ward
Wells
25,303
6,631
3,715
2,065
8,585
4,675
12,066
5,890
2,610
17,998
13,674
4,366
1,710
4,044
767
22,636
2,258
21,908
2,876
8,477
12,389
58,795
5,102
43% 17% 20% 7% 0% 10% 3% 0%
40% 14% 19% 12% 2% 5% 7% 2%
40% 7% 13% 13% 0% 10% 13% 3%
20% 27% 29% 10% 2% 4% 4% 4%
52% 13% 10% 6% 3% 3% 10% 3%
63% 25% 8% 0% 4% 0% 0% 0%
67% 33% 0% 0% 0% 0% 0% 0%
33% 19% 35% 2% 0% 4% 6% 0%
45% 23% 9% 0% 0% 5% 9% 9%
45% 13% 19% 3% 3% 6% 3% 6%
45% 14% 18% 5% 0% 9% 5% 5%
56% 19% 13% 6% 0% 6% 0% 0%
49% 20% 16% 2% 0% 4% 6% 2%
28% 31% 13% 6% 0% 3% 13% 6%
36% 27% 23% 5% 0% 0% 5% 5%
20% 7% 33% 20% 0% 13% 7% 0%
0% 33% 13% 33% 0% 0% 7% 13%
33% 33% 0% 0% 33% 0% 0% 0%
17% 38% 15% 11% 4% 4% 6% 4%
60% 13% 13% 0% 0% 0% 7% 7%
27% 14% 25% 9% 0% 16% 5% 4%
38% 23% 23% 0% 0% 8% 8% 0%
78% 11% 6% 0% 0% 3% 0% 3%
40% 26% 11% 6% 2% 4% 6% 4%
32% 13% 14% 15% 6% 9% 6% 6%
33% 15% 6% 9% 6% 21% 9% 0%
* Census 2000 Figures
See the Faith Group and Denomination Directory on page 25 for further detail.
TOTAL
30
43
30
49
31
24
3
48
22
31
22
16
49
32
22
15
15
3
47
15
56
13
36
47
101
33

Table 18 - Percent of Institutions by Faith Group by County
County Population * LUTH CATH REFORM BAPT NONDE EVAN PENT OTHER
19,761Williams 50% 11% 9% 7% 0% 9% 7% 6%
TOTAL
54
1,691ND Statewide 642,200 38% 17% 18% 8% 2% 7% 6% 4%
* Census 2000 Figures
See the Faith Group and Denomination Directory on page 25 for further detail.

Table 19 - Religious Employment Statistics by County
Number Population Total Employment Population Pop. of per Religious per Total per
County Population * Rank Institutions Institution Employment Institution Clergy Clergy
Area Sq Miles Sq Miles in Population per per
Sq Miles* Density Institution Clergy
Adams 2,593 44
Barnes 11,775 13
Benson 6,964 19
Billings 888 52
Bottineau 7,149 18
Bowman 3,242 36
Burke 2,242 48
Burleigh 69,416 2
Cass 123,138 1
Cavalier 4,831 26
Dickey 5,757 23
Divide 2,283 46
Dunn 3,600 34
Eddy 2,757 39
Emmons 4,331 30
Foster 3,759 32
Golden Valley 1,924 50
Grand Forks 66,109 3
Grant 2,841 38
Griggs 2,754 40
Hettinger 2,715 42
Kidder 2,753 41
LaMoure 4,701 27
Logan 2,308 45
13 199.517 152.5
37 318.2
35 199.0
4 222.0
32 223.4
14 231.6
17 131.9
85 816.7
153 804.8
28 172.5
28 205.6
19 120.2
10 360.0
12 229.8
18 240.6
15 250.6
9 213.8
94 703.3
21 135.3
19 144.9
14 193.9
20 137.7
36 130.6
20 115.4
34 346.3
25 1.5
128 3.5
51 1.5
17 4.3
75 2.3
35 2.5
29 1.7
425 5.0
681 4.5
45 1.6
59 2.1
32 1.7
20 2.0
17 1.4
40 2.2
35 2.3
25 2.8
340 3.6
31 1.5
38 2.0
21 1.5
25 1.3
53 1.5
33 1.7
32 217.6
2 444.0
27 264.8
15 216.1
15 149.5
104 667.5
193 638.0
24 201.3
25 230.3
17 134.3
9 400.0
10 275.7
15 288.7
14 268.5
6 320.7
100 661.1
19 149.5
18 153.0
11 246.8
16 172.1
33 142.5
18 128.2
987.9 2.6 58.1 76.0
1,491.6 7.9 40.3 43.9
1,380.6 5.0 39.4 43.1
1,151.4 0.8 287.9 575.7
1,668.6 4.3 52.1 61.8
1,162.0 2.8 83.0 77.5
1,103.5 2.0 64.9 73.6
1,633.1 42.5 19.2 15.7
1,765.2 69.8 11.5 9.1
1,488.5 3.2 53.2 62.0
1,131.0 5.1 40.4 45.2
1,259.5 1.8 66.3 74.1
2,009.6 1.8 201.0 223.3
630.1 4.4 52.5 63.0
1,509.9 2.9 83.9 100.7
635.2 5.9 42.3 45.4
1,002.0 1.9 111.3 167.0
1,437.8 46.0 15.3 14.4
1,659.5 1.7 79.0 87.3
708.5 3.9 37.3 39.4
1,132.3 2.4 80.9 102.9
1,350.8 2.0 67.5 84.4
1,147.2 4.1 31.9 34.8
992.6 2.3 49.6 55.1
* Census 2000 Figures

Table 19 - Religious Employment Statistics by County
Number Population Total Employment Population Pop. of per Religious per Total per
County Population * Rank Institutions Institution Employment Institution Clergy Clergy
Area County Sq Miles Sq Miles in Population per per
Sq Miles* Density Institution Clergy
McHenry 5,987 21
McIntosh 3,390 35
McKenzie 5,737 24
McLean 9,311 14
Mercer 8,644 15
Morton 25,303 5
Mountrail 6,631 20
Nelson 3,715 33
Oliver 2,065 49
Pembina 8,585 16
Pierce 4,675 28
Ramsey 12,066 12
Ransom 5,890 22
Renville 2,610 43
Richland 17,998 9
Rolette 13,674 10
Sargent 4,366 29
Sheridan 1,710 51
Sioux 4,044 31
Slope 767 53
Stark 22,636 6
Steele 2,258 47
Stutsman 21,908 7
26 230.331 193.1
16 211.9
30 191.2
43 216.5
30 288.1
49 516.4
31 213.9
24 154.8
3 688.3
48 178.9
22 212.5
31 389.2
22 267.7
16 163.1
49 367.3
32 427.3
22 198.5
15 114.0
15 269.6
3 255.7
47 481.6
15 150.5
56 391.2
14 242.1
44 1.4
32 2.0
53 1.8
106 2.5
68 2.3
146 3.0
45 1.5
43 1.8
17 5.7
79 1.6
34 1.5
68 2.2
49 2.2
24 1.5
198 4.0
71 2.2
30 1.4
18 1.2
23 1.5
3 1.0
139 3.0
26 1.7
165 2.9
23 249.4
38 245.0
27 320.1
48 527.1
24 276.3
20 185.8
3 688.3
42 204.4
17 275.0
29 416.1
20 294.5
15 174.0
60 300.0
19 719.7
17 256.8
12 142.5
9 449.3
2 383.5
49 462.0
17 132.8
52 421.3
1,874.1 3.2 60.5 72.1
975.2 3.5 60.9 69.7
2,742.0 2.1 91.4 119.2
2,110.0 4.4 49.1 55.5
1,045.5 8.3 34.8 38.7
1,926.3 13.1 39.3 40.1
1,823.9 3.6 58.8 76.0
981.6 3.8 40.9 49.1
723.5 2.9 241.2 241.2
1,118.8 7.7 23.3 26.6
1,017.8 4.6 46.3 59.9
1,184.8 10.2 38.2 40.9
862.7 6.8 39.2 43.1
874.8 3.0 54.7 58.3
1,436.7 12.5 29.3 23.9
902.5 15.2 28.2 47.5
858.8 5.1 39.0 50.5
971.8 1.8 64.8 81.0
1,094.1 3.7 72.9 121.6
1,217.9 0.6 406.0 609.0
1,338.2 16.9 28.5 27.3
712.4 3.2 47.5 41.9
2,221.4 9.9 39.7 42.7
* Census 2000 Figures

Table 19 - Religious Employment Statistics by County
Number Population Total Employment Population Pop. of per Religious per Total per
County Population * Rank Institutions Institution Employment Institution Clergy Clergy
Area County Sq Miles Sq Miles in Population per per
Sq Miles* Density Institution Clergy
Towner 2,876 37
Traill 8,477 17
Walsh 12,389 11
Ward 58,795 4
Wells 5,102 25
Williams 19,761 8
12 239.713 221.2
36 235.5
47 263.6
101 582.1
33 154.6
54 365.9
37 229.1
31 2.4
84 2.3
109 2.3
314 3.1
55 1.7
156 2.9
42 295.0
99 593.9
25 204.1
69 286.4
1,024.6 2.8 78.8 85.4
861.9 9.8 23.9 23.3
1,281.7 9.7 27.3 30.5
2,012.9 29.2 19.9 20.3
1,271.3 4.0 38.5 50.9
2,070.5 9.5 38.3 30.0
ND Statewide 642,200 1,691 379.8 4,510 2.7 1,637 392.3 68,975.9 9.3 40.8 42.1
* Census 2000 Figures
Denominations Present
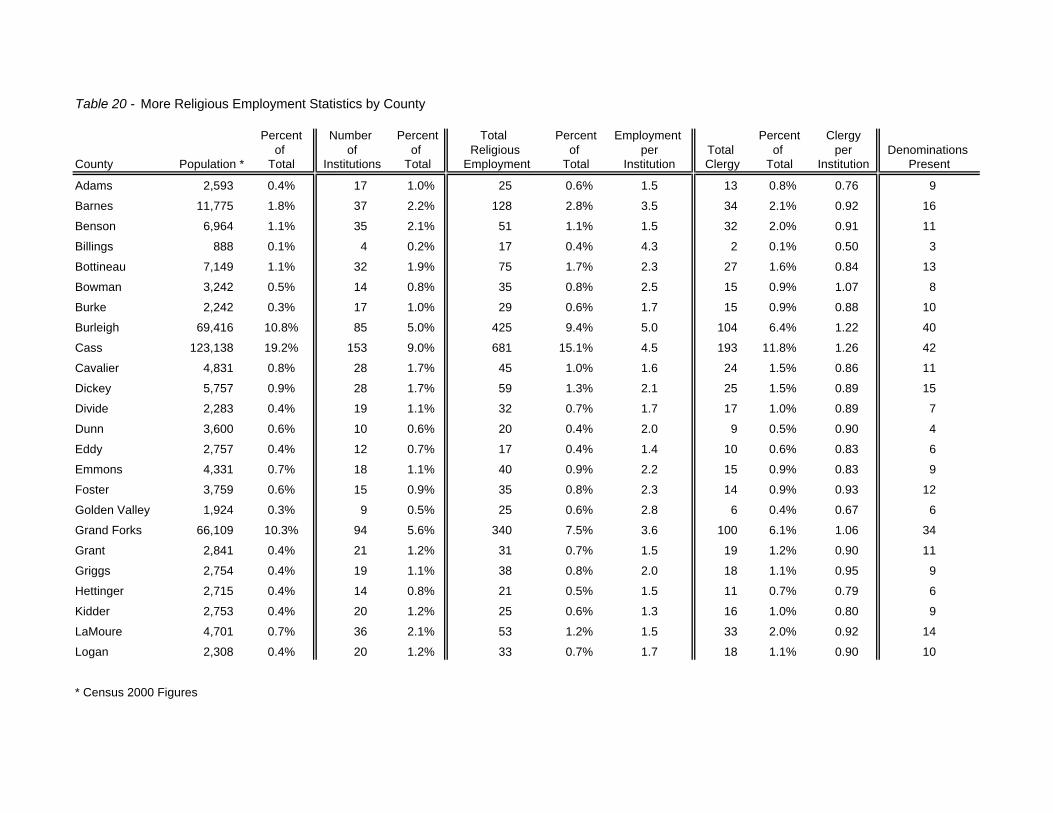
Table 20 - More Religious Employment Statistics by County
Percent Number Percent Total Percent Employment Percent Clergy of of of Religious of per Total of per
County Population * Total Institutions Total Employment Total Institution Clergy Total Institution
Adams 2,593 0.4%
Barnes 11,775 1.8%
Benson 6,964 1.1%
Billings 888 0.1%
Bottineau 7,149 1.1%
Bowman 3,242 0.5%
Burke 2,242 0.3%
Burleigh 69,416 10.8%
Cass 123,138 19.2%
Cavalier 4,831 0.8%
Dickey 5,757 0.9%
Divide 2,283 0.4%
Dunn 3,600 0.6%
Eddy 2,757 0.4%
Emmons 4,331 0.7%
Foster 3,759 0.6%
Golden Valley 1,924 0.3%
Grand Forks 66,109 10.3%
Grant 2,841 0.4%
Griggs 2,754 0.4%
Hettinger 2,715 0.4%
Kidder 2,753 0.4%
LaMoure 4,701 0.7%
Logan 2,308 0.4%
17 1.0%
37 2.2%
35 2.1%
4 0.2%
32 1.9%
14 0.8%
17 1.0%
85 5.0%
153 9.0%
28 1.7%
28 1.7%
19 1.1%
10 0.6%
12 0.7%
18 1.1%
15 0.9%
9 0.5%
94 5.6%
21 1.2%
19 1.1%
14 0.8%
20 1.2%
36 2.1%
20 1.2%
25 0.6% 1.5
128 2.8% 3.5
51 1.1% 1.5
17 0.4% 4.3
75 1.7% 2.3
35 0.8% 2.5
29 0.6% 1.7
425 9.4% 5.0
681 15.1% 4.5
45 1.0% 1.6
59 1.3% 2.1
32 0.7% 1.7
20 0.4% 2.0
17 0.4% 1.4
40 0.9% 2.2
35 0.8% 2.3
25 0.6% 2.8
340 7.5% 3.6
31 0.7% 1.5
38 0.8% 2.0
21 0.5% 1.5
25 0.6% 1.3
53 1.2% 1.5
33 0.7% 1.7
13 0.8% 0.76
34 2.1% 0.92
32 2.0% 0.91
2 0.1% 0.50
27 1.6% 0.84
15 0.9% 1.07
15 0.9% 0.88
104 6.4% 1.22
193 11.8% 1.26
24 1.5% 0.86
25 1.5% 0.89
17 1.0% 0.89
9 0.5% 0.90
10 0.6% 0.83
15 0.9% 0.83
14 0.9% 0.93
6 0.4% 0.67
100 6.1% 1.06
19 1.2% 0.90
18 1.1% 0.95
11 0.7% 0.79
16 1.0% 0.80
33 2.0% 0.92
18 1.1% 0.90
9
16
11
3
13
8
10
40
42
11
15
7
4
6
9
12
6
34
11
9
6
9
14
10
* Census 2000 Figures

Denominations Present
Table 20 - More Religious Employment Statistics by County
Percent Number Percent Total Percent Employment Percent Clergy of of of Religious of per Total of per
County Population * Total Institutions Total Employment Total Institution Clergy Total Institution
McHenry 5,987 0.9%
McIntosh 3,390 0.5%
McKenzie 5,737 0.9%
McLean 9,311 1.4%
Mercer 8,644 1.3%
Morton 25,303 3.9%
Mountrail 6,631 1.0%
Nelson 3,715 0.6%
Oliver 2,065 0.3%
Pembina 8,585 1.3%
Pierce 4,675 0.7%
Ramsey 12,066 1.9%
Ransom 5,890 0.9%
Renville 2,610 0.4%
Richland 17,998 2.8%
Rolette 13,674 2.1%
Sargent 4,366 0.7%
Sheridan 1,710 0.3%
Sioux 4,044 0.6%
Slope 767 0.1%
Stark 22,636 3.5%
Steele 2,258 0.4%
Stutsman 21,908 3.4%
Towner 2,876 0.4%
31 1.8%
16 0.9%
30 1.8%
43 2.5%
30 1.8%
49 2.9%
31 1.8%
24 1.4%
3 0.2%
48 2.8%
22 1.3%
31 1.8%
22 1.3%
16 0.9%
49 2.9%
32 1.9%
22 1.3%
15 0.9%
15 0.9%
3 0.2%
47 2.8%
15 0.9%
56 3.3%
13 0.8%
44 1.0% 1.4
32 0.7% 2.0
53 1.2% 1.8
106 2.4% 2.5
68 1.5% 2.3
146 3.2% 3.0
45 1.0% 1.5
43 1.0% 1.8
17 0.4% 5.7
79 1.8% 1.6
34 0.8% 1.5
68 1.5% 2.2
49 1.1% 2.2
24 0.5% 1.5
198 4.4% 4.0
71 1.6% 2.2
30 0.7% 1.4
18 0.4% 1.2
23 0.5% 1.5
3 0.1% 1.0
139 3.1% 3.0
26 0.6% 1.7
165 3.7% 2.9
31 0.7% 2.4
26 1.6% 0.84
14 0.9% 0.88
23 1.4% 0.77
38 2.3% 0.88
27 1.6% 0.90
48 2.9% 0.98
24 1.5% 0.77
20 1.2% 0.83
3 0.2% 1.00
42 2.6% 0.88
17 1.0% 0.77
29 1.8% 0.94
20 1.2% 0.91
15 0.9% 0.94
60 3.7% 1.22
19 1.2% 0.59
17 1.0% 0.77
12 0.7% 0.80
9 0.5% 0.60
2 0.1% 0.67
49 3.0% 1.04
17 1.0% 1.13
52 3.2% 0.93
12 0.7% 0.92
10
9
12
15
16
20
12
7
3
11
11
14
11
7
14
15
8
8
6
3
22
7
25
7
* Census 2000 Figures
Denominations Present
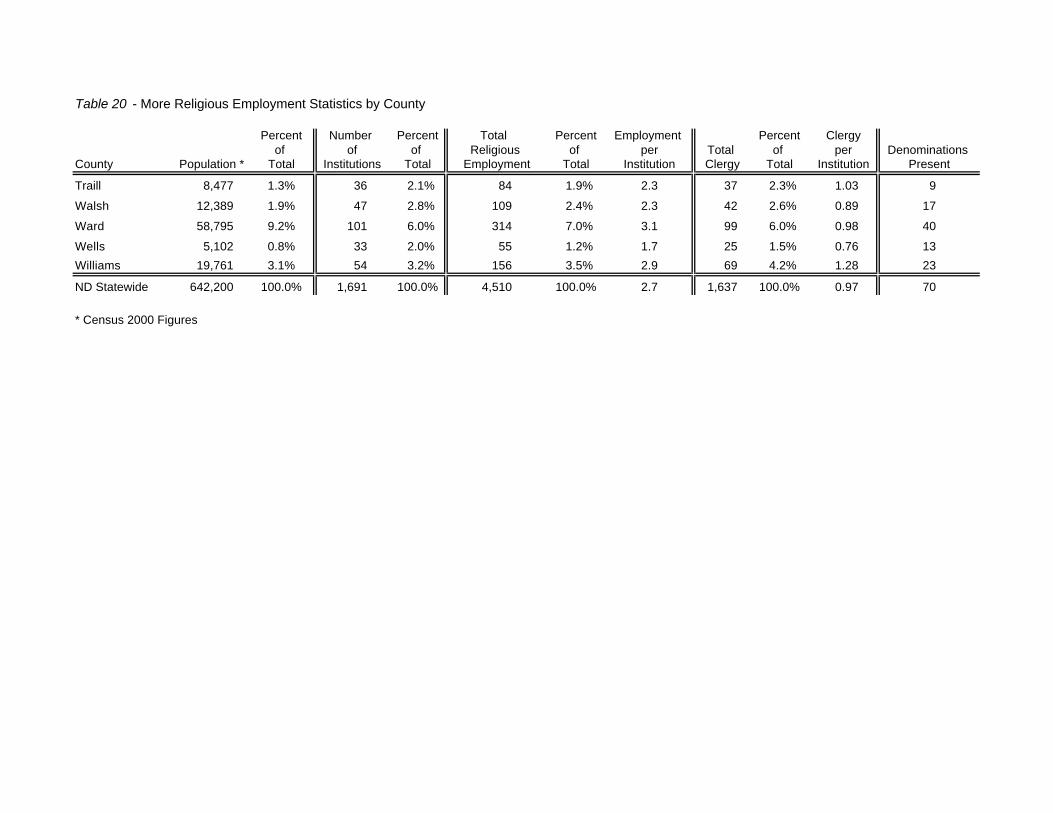
Table 20 - More Religious Employment Statistics by County
Percent Number Percent Total Percent Employment Percent Clergy of of of Religious of per Total of per
County Population * Total Institutions Total Employment Total Institution Clergy Total Institution
Traill 8,477 1.3%
Walsh 12,389 1.9%
Ward 58,795 9.2%
Wells 5,102 0.8%
Williams 19,761 3.1%
36 2.1%
47 2.8%
101 6.0%
33 2.0%
54 3.2%
84 1.9% 2.3
109 2.4% 2.3
314 7.0% 3.1
55 1.2% 1.7
156 3.5% 2.9
37 2.3% 1.03
42 2.6% 0.89
99 6.0% 0.98
25 1.5% 0.76
69 4.2% 1.28
9
17
40
13
23
ND Statewide 642,200 100.0% 1,691 100.0% 4,510 100.0% 2.7 1,637 100.0% 0.97 70
* Census 2000 Figures
Job Service North Dakota
Labor Market Information Center1000 East Divide AvenuePO Box 5507Bismarck, ND 58506-5507
Official BusinessPenalty for Private Use - $300
Change Service Requested
PRESORTED STANDARD
POSTAGE & FEES PAID
U.S. DEPT. OF LABOR PERMIT NO. G-12
Bound Printed Matter
RELIGIOUS EMPLOYMENT IN NORTH DAKOTA
Inquiries should be made to the Labor Market Information Center at Job Service North Dakota at the address above or telephone number 701-328-2868.
This document can be found on the Internet at:
www.state.nd.us/jsnd/docs/lmi/rel2000.pdf
A proud member of America’s Workforce Network.
Job Service North Dakota is an equal opportunity employer/program provider. Auxiliary aids and services are available upon request to individuals with disabilities.
If you:
• Do not wish to receive this publication in the future, please check here ______
• Wish to be removed from all our mailing lists, please check here ______
• Need to report an address change, please make the change on the address label above.
For all of the above, please return this page to the above address, fax it to 701–328–4193, or call 1– 800– 732–9787 (TTY 1-800–366–6888).