Reliance Industries Ltd - India...
12
Sector: Oil & Gas Sector view: Neutral Sensex: 28,442 52 Week h/l (Rs): 1145 / 796 Market cap (Rscr) : 299,924 6m Avg vol (‘000Nos): 3,380 Bloomberg code: RIL IS BSE code: 500325 NSE code: RELIANCE FV (Rs): 10 Price as on April 17, 2015 Share price trend 50 70 90 110 130 150 Apr‐14 Aug‐14 Dec‐14 Apr‐15 RELIANCE Sensex Share holding pattern Jun‐14 Sep‐14 Dec‐14 Promoters 45.3 45.3 45.2 Institutions 30.8 30.8 30.9 Others 23.9 24.0 23.9 Change in Estimates Rating Target Rating: BUY Target (2‐year): Rs1,300 CMP: Rs927 Upside: 40.3% Result Update Reliance Industries Ltd Q4 FY15 April 20, 2015 Research Analyst: Prayesh Jain [email protected] This report is published by IIFL ‘India Private Clients’ research desk. IIFL has other business units with independent research teams separated by 'Chinese walls' catering to different sets of customers having varying objectives, risk profiles, investment horizon, etc. The views and opinions expressed in this document may at times be contrary in terms of rating, target prices, estimates and views on sectors and markets. Revenues at Rs. 56,043cr, lower by 41.1% yoy driven by sharp fall in crude oil prices causing weak refining and petchem segment sales OPM improves by 665bps yoy and 641bps qoq; yoy improvement was led by 521bps increase in petchem segment EBIT margins, sequential improvement was led by 535bps rise in petchem EBIT margins GRMs at US$10.1/bbl was higher than expectations, GRMs saw 8.6% yoy and 38.4% qoq surge and was substantially higher than the benchmarks Shale gas revenues and EBIDTA declined qoq owing to fall in gas prices PAT at Rs. 6,243cr was higher than our estimates owing to better than expected refining segment performance Cut estimates to factor in lower crude oil prices, we maintain BUY rating with 2‐year price target of Rs1,300 Result table (standalone) (Rs . cr) Q4 FY15 Q4 FY14 % yoy Q3 FY15 % qoq Net sales 56,043 95,193 (41.1) 80,196 (30.1) Material costs (37,370) (79,859) (53.2) (63,450) (41.1) Purchases (1,731) (13) ‐ (1,951) (11.3) Personnel costs (993) (948) 4.7 (832) 19.4 Other overheads (7,320) (6,042) 21.2 (6,755) 8.4 Operating profit 8,629 8,331 3.6 7,208 19.7 OPM (%) 15.4 8.8 665 bps 9.0 641 bps Depreciation (2,132) (2,275) (6.3) (2,105) 1.3 Interest (404) (799) (49.4) (881) (54.1) Other income 2,133 2,036 4.8 2,402 (11.2) PBT 8,226 7,293 12.8 6,624 24.2 Tax (1,983) (1,662) 19.3 (1,539) 28.8 Effective tax rate (%) 24.1 22.8 23.2 Adjusted PAT 6,243 5,631 10.9 5,085 22.8 Adj. PAT margin (%) 11.1 5.9 522 bps 6.3 480 bps Ann. EPS (Rs) 77.2 69.7 10.7 62.9 22.7 Source: Company, India Infoline Research Segmental performance Revenues (Rs. cr) Q4 FY15 Q4 FY14 % yoy Q3 FY15 % qoq Petrochemical 20,056 24,343 (17.6) 21,306 (5.9) Refining 48,639 87,624 (44.5) 73,152 (33.5) Oil and gas 1,223 1,417 (13.7) 1,347 (9.2) EBIT margins (%) Q4 FY15 Q4 FY14 bps yoy Q3 FY15 bps qoq Petrochemical 10.6 8.6 197 10.3 27 Refining 9.7 4.5 521 4.4 535 Oil and gas 13.4 26.7 (1,327) 19.8 (641) Revenue contribution (%) Q4 FY15 Q4 FY14 bps yoy Q3 FY15 bps qoq Petrochemical 28.5 21.4 714 22.2 638 Refining 69.2 77.0 (781) 76.1 (686) Oil and gas 1.7 1.2 49 1.4 34 EBIT contribution (%) Q4 FY15 Q4 FY14 bps yoy Q3 FY15 bps qoq Petrochemical 29.7 31.6 (190) 38.3 (856) Refining 66.2 59.7 657 55.8 1,047 Oil and gas 2.3 5.7 (341) 4.7 (236) Source: Company, India Infoline Research
Transcript of Reliance Industries Ltd - India...

Sector: Oil & Gas
Sector view: Neutral
Sensex: 28,442
52 Week h/l (Rs): 1145 / 796
Market cap (Rscr) : 299,924
6m Avg vol (‘000Nos): 3,380
Bloomberg code: RIL IS
BSE code: 500325
NSE code: RELIANCE
FV (Rs): 10
Price as on April 17, 2015
Share price trend
50
70
90
110
130
150
Apr‐14 Aug‐14 Dec‐14 Apr‐15
RELIANCE Sensex
Share holding pattern Jun‐14 Sep‐14 Dec‐14
Promoters 45.3 45.3 45.2
Institutions 30.8 30.8 30.9
Others 23.9 24.0 23.9
Change in Estimates Rating Target
Rating: BUY Target (2‐year): Rs1,300
CMP: Rs927
Upside: 40.3%
Result Update
Reliance Industries Ltd
Q4 FY15
April 20, 2015
Research Analyst: Prayesh Jain
This report is published by IIFL ‘India Private Clients’ research desk. IIFL has other business units with independent research teams separated by 'Chinese walls' catering to different sets of customers having varying objectives, risk profiles, investment horizon, etc. The views and opinions expressed in this document may at times be contrary in terms of rating, target prices, estimates and views on sectors and markets.
Revenues at Rs. 56,043cr, lower by 41.1% yoy driven by sharp fall in crude oil prices causing weak refining and petchem segment sales
OPM improves by 665bps yoy and 641bps qoq; yoy improvement was led by 521bps increase in petchem segment EBIT margins, sequential improvement was led by 535bps rise in petchem EBIT margins
GRMs at US$10.1/bbl was higher than expectations, GRMs saw 8.6% yoy and 38.4% qoq surge and was substantially higher than the benchmarks
Shale gas revenues and EBIDTA declined qoq owing to fall in gas prices
PAT at Rs. 6,243cr was higher than our estimates owing to better than expected refining segment performance
Cut estimates to factor in lower crude oil prices, we maintain BUY rating with 2‐year price target of Rs1,300
Result table (standalone) (Rs . cr) Q4 FY15 Q4 FY14 % yoy Q3 FY15 % qoq
Net sales 56,043 95,193 (41.1) 80,196 (30.1)
Material costs (37,370) (79,859) (53.2) (63,450) (41.1)
Purchases (1,731) (13) ‐ (1,951) (11.3)
Personnel costs (993) (948) 4.7 (832) 19.4
Other overheads (7,320) (6,042) 21.2 (6,755) 8.4
Operating profit 8,629 8,331 3.6 7,208 19.7
OPM (%) 15.4 8.8 665 bps 9.0 641 bps
Depreciation (2,132) (2,275) (6.3) (2,105) 1.3
Interest (404) (799) (49.4) (881) (54.1)
Other income 2,133 2,036 4.8 2,402 (11.2)
PBT 8,226 7,293 12.8 6,624 24.2
Tax (1,983) (1,662) 19.3 (1,539) 28.8
Effective tax rate (%) 24.1 22.8 23.2
Adjusted PAT 6,243 5,631 10.9 5,085 22.8
Adj. PAT margin (%) 11.1 5.9 522 bps 6.3 480 bps
Ann. EPS (Rs) 77.2 69.7 10.7 62.9 22.7
Source: Company, India Infoline Research
Segmental performance Revenues (Rs. cr) Q4 FY15 Q4 FY14 % yoy Q3 FY15 % qoq
Petrochemical 20,056 24,343 (17.6) 21,306 (5.9)
Refining 48,639 87,624 (44.5) 73,152 (33.5)
Oil and gas 1,223 1,417 (13.7) 1,347 (9.2)
EBIT margins (%) Q4 FY15 Q4 FY14 bps yoy Q3 FY15 bps qoq
Petrochemical 10.6 8.6 197 10.3 27
Refining 9.7 4.5 521 4.4 535
Oil and gas 13.4 26.7 (1,327) 19.8 (641)
Revenue contribution (%) Q4 FY15 Q4 FY14 bps yoy Q3 FY15 bps qoq
Petrochemical 28.5 21.4 714 22.2 638
Refining 69.2 77.0 (781) 76.1 (686)
Oil and gas 1.7 1.2 49 1.4 34
EBIT contribution (%) Q4 FY15 Q4 FY14 bps yoy Q3 FY15 bps qoq
Petrochemical 29.7 31.6 (190) 38.3 (856)
Refining 66.2 59.7 657 55.8 1,047
Oil and gas 2.3 5.7 (341) 4.7 (236)
Source: Company, India Infoline Research

Reliance Industries (Q4 FY15)
2
E&P segment KG‐D6 gas production continued to fall and during Q4 FY15, the production averaged 11.5mmscmd as compared to 12.1mmscmd in Q3 FY15. On yoy basis the volumes were lower by 15.9%. While crude oil production at the Pannna‐Mukta field was lower by 5.9% yoy, gas production increased by 20.7% yoy on the back of production coming in from the infill wells completed in H1 FY15. Tapti field however continued to see natural decline and the production is expected to cease over the next six months. Revenues from the segment (standalone) were lower by 13.7% yoy owing to fall in production, steep fall in crude oil prices and were offset by higher gas prices and rupee depreciation. EBIT margins for the segment were at 13.4% as compared to 26.7% in Q4 FY14 and 19.8% in Q3 FY15. Post the declaration of higher gas prices from November 01, 2014 the company has been accounting for higher gas prices in the books and the difference between the new and the old prices are shown as receivables. Going ahead, the company has planned to arrest the decline in production but awaits key approvals from the government including budget approvals for capital expenditure.
Trend in KG‐D6 gas production Trend EBIT margins of E&P segment
0
10
20
30
40
50
60
Q4 FY11
Q1 FY12
Q2 FY12
Q3 FY12
Q4 FY12
Q1 FY13
Q2 FY13
Q3 FY13
Q4 FY13
Q1 FY14
Q2 FY14
Q3 FY14
Q4 FY14
Q1 FY15
Q2 FY15
Q3 FY15
Q4 FY15
KG‐D6 productionmmscmd
0.0%5.0%10.0%15.0%20.0%25.0%30.0%35.0%40.0%45.0%50.0%
0
200
400
600
800
1,000
1,200
1,400
1,600
1,800
Q4 FY11
Q1 FY12
Q2 FY12
Q3 FY12
Q4 FY12
Q1 FY13
Q2 FY13
Q3 FY13
Q4 FY13
Q1 FY14
Q2 FY14
Q3 FY14
Q4 FY14
Q1 FY15
Q2 FY15
Q3 FY15
Q4 FY15
EBIT EBIT Margin
Rs. cr
Source: Company, India Infoline Research
Update on E&P fields KG‐D6 Commissioned 2 OTBC units in 4Q FY15
Extend the life of the wells/recovery from the wells
Opportunity to revive ceased wells that were shut in due to high water influx
MEG free operations alleviating water handling constraints One side track (5H well) in MA has been completed in 4Q FY15 and put to production KG‐D6 Field Development Update
Source: Company, India Infoline Research
Reliance Industries (Q4 FY15)
3
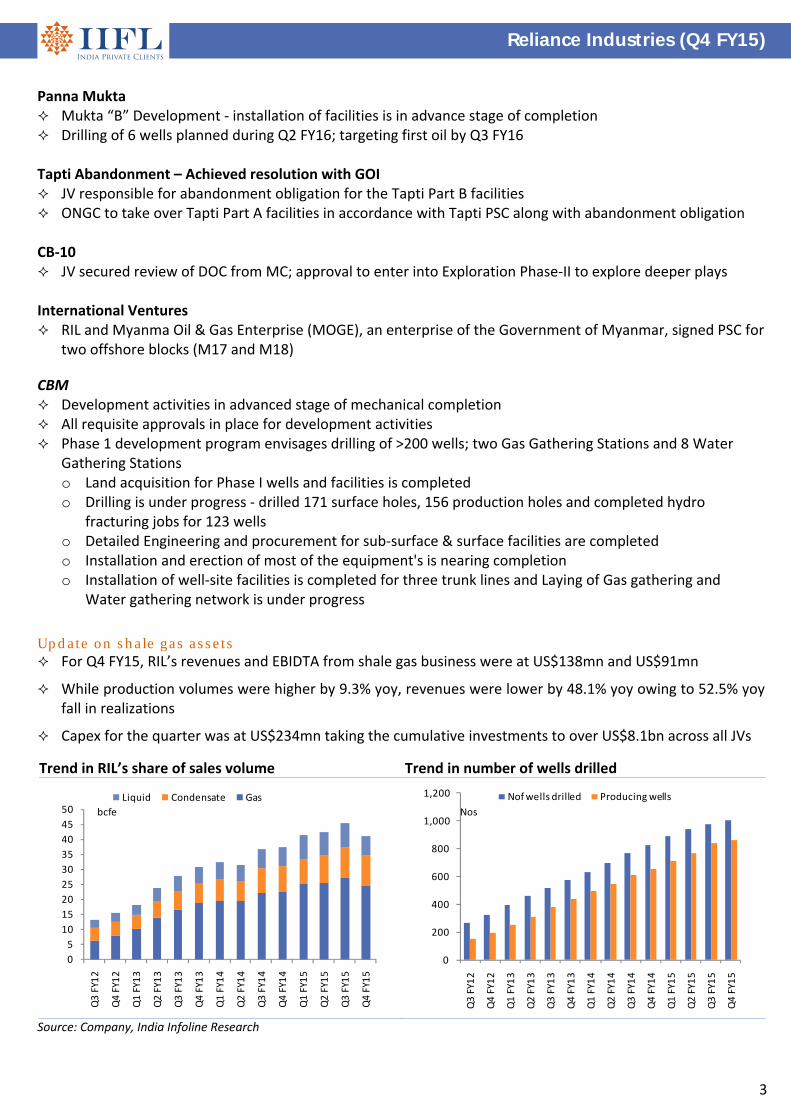
Panna Mukta Mukta “B” Development ‐ installation of facilities is in advance stage of completion Drilling of 6 wells planned during Q2 FY16; targeting first oil by Q3 FY16 Tapti Abandonment – Achieved resolution with GOI JV responsible for abandonment obligation for the Tapti Part B facilities ONGC to take over Tapti Part A facilities in accordance with Tapti PSC along with abandonment obligation CB‐10 JV secured review of DOC from MC; approval to enter into Exploration Phase‐II to explore deeper plays International Ventures RIL and Myanma Oil & Gas Enterprise (MOGE), an enterprise of the Government of Myanmar, signed PSC for
two offshore blocks (M17 and M18)
CBM Development activities in advanced stage of mechanical completion All requisite approvals in place for development activities Phase 1 development program envisages drilling of >200 wells; two Gas Gathering Stations and 8 Water
Gathering Stations o Land acquisition for Phase I wells and facilities is completed o Drilling is under progress ‐ drilled 171 surface holes, 156 production holes and completed hydro
fracturing jobs for 123 wells o Detailed Engineering and procurement for sub‐surface & surface facilities are completed o Installation and erection of most of the equipment's is nearing completion o Installation of well‐site facilities is completed for three trunk lines and Laying of Gas gathering and
Water gathering network is under progress
Update on shale gas assets For Q4 FY15, RIL’s revenues and EBIDTA from shale gas business were at US$138mn and US$91mn
While production volumes were higher by 9.3% yoy, revenues were lower by 48.1% yoy owing to 52.5% yoy fall in realizations
Capex for the quarter was at US$234mn taking the cumulative investments to over US$8.1bn across all JVs Trend in RIL’s share of sales volume Trend in number of wells drilled
0
5
10
15
20
25
30
35
40
45
50
Q3 FY12
Q4 FY12
Q1 FY13
Q2 FY13
Q3 FY13
Q4 FY13
Q1 FY14
Q2 FY14
Q3 FY14
Q4 FY14
Q1 FY15
Q2 FY15
Q3 FY15
Q4 FY15
Liquid Condensate Gas
bcfe
0
200
400
600
800
1,000
1,200
Q3 FY12
Q4 FY12
Q1 FY13
Q2 FY13
Q3 FY13
Q4 FY13
Q1 FY14
Q2 FY14
Q3 FY14
Q4 FY14
Q1 FY15
Q2 FY15
Q3 FY15
Q4 FY15
Nof wells drilled Producing wells
Nos
Source: Company, India Infoline Research

Reliance Industries (Q4 FY15)
4
Status of individual shale gas assets Pioneer JV
Carrizo JV
Chevron JV
Source: Company
Efforts to counter the difficult price environment in Shale gas business
Reduce activity levels across all JVs
o Pioneer JV: 6 rig operations in 2015, compared to 9‐10 rig operation in 2014
o Chevron JV: restricted to 1 rig operations
o Carrizo JV: Delay development/completion activities to 2016
High grading of development plan and acreage portfolio
Drilling focused on sweet spots, augment cost effective leasing of acreage in identified core areas
Reduce D&C Costs further
o Reduce service costs, taking advantage of market conditions
o Continue well design improvements: 2‐string casing, longer laterals and shared infrastructure.
Continue emphasis on reducing Opex / Lease Operating Expenses
Improve efficiencies, costs and cycle time
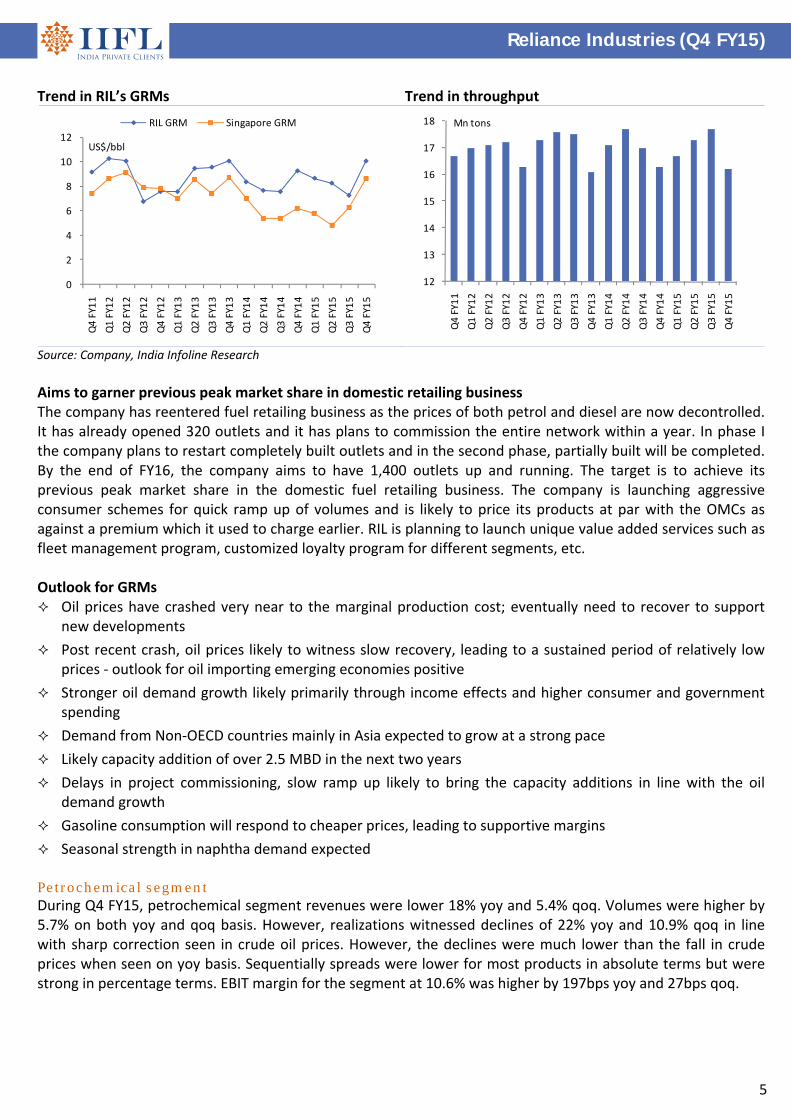
Thrust on net back optimization Refining segment RIL reported GRMs of US$10.1/bbl in Q4 FY15 as against US$9.3/bbl in Q4 FY14 and US$7.3/bbl in Q3 FY15. The GRMs were higher than our estimates. Benchmark Singapore GRMS were higher on a sequential basis as fall in product prices was much lower than crude oil prices. Gasoline, gasoil and Jet Kero cracks were very strong during the quarter. RIL outperformed the increase in benchmark GRMs owing to 1) flexibility in production, 2) flexibility in crude processing with the refinery processing 13 new crudes during the year and 3) low energy costs. Revenue for the segment was lower by 44.5% yoy owing to lower product prices. EBIT margins for the segment were at 9.7%, more than doubled on both yoy and qoq basis.
Reliance Industries (Q4 FY15)
5
Trend in RIL’s GRMs Trend in throughput
0
2
4
6
8
10
12
Q4 FY11
Q1 FY12
Q2 FY12
Q3 FY12
Q4 FY12
Q1 FY13
Q2 FY13
Q3 FY13
Q4 FY13
Q1 FY14
Q2 FY14
Q3 FY14
Q4 FY14
Q1 FY15
Q2 FY15
Q3 FY15
Q4 FY15
RIL GRM Singapore GRM
US$/bbl
12
13
14
15
16
17
18
Q4 FY11
Q1 FY12
Q2 FY12
Q3 FY12
Q4 FY12
Q1 FY13
Q2 FY13
Q3 FY13
Q4 FY13
Q1 FY14
Q2 FY14
Q3 FY14
Q4 FY14
Q1 FY15
Q2 FY15
Q3 FY15
Q4 FY15
Mn tons
Source: Company, India Infoline Research
Aims to garner previous peak market share in domestic retailing business The company has reentered fuel retailing business as the prices of both petrol and diesel are now decontrolled. It has already opened 320 outlets and it has plans to commission the entire network within a year. In phase I the company plans to restart completely built outlets and in the second phase, partially built will be completed. By the end of FY16, the company aims to have 1,400 outlets up and running. The target is to achieve its previous peak market share in the domestic fuel retailing business. The company is launching aggressive consumer schemes for quick ramp up of volumes and is likely to price its products at par with the OMCs as against a premium which it used to charge earlier. RIL is planning to launch unique value added services such as fleet management program, customized loyalty program for different segments, etc. Outlook for GRMs Oil prices have crashed very near to the marginal production cost; eventually need to recover to support
new developments
Post recent crash, oil prices likely to witness slow recovery, leading to a sustained period of relatively low prices ‐ outlook for oil importing emerging economies positive
Stronger oil demand growth likely primarily through income effects and higher consumer and government spending
Demand from Non‐OECD countries mainly in Asia expected to grow at a strong pace
Likely capacity addition of over 2.5 MBD in the next two years
Delays in project commissioning, slow ramp up likely to bring the capacity additions in line with the oil demand growth
Gasoline consumption will respond to cheaper prices, leading to supportive margins
Seasonal strength in naphtha demand expected
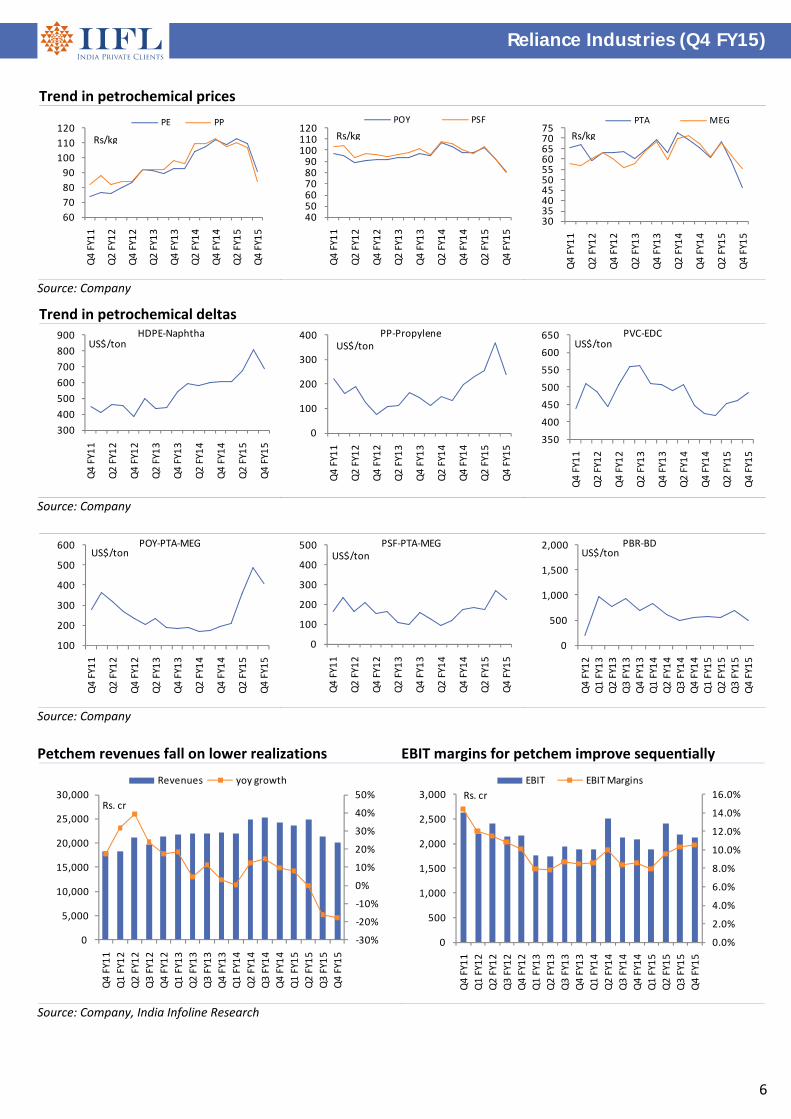
Petrochemical segment During Q4 FY15, petrochemical segment revenues were lower 18% yoy and 5.4% qoq. Volumes were higher by 5.7% on both yoy and qoq basis. However, realizations witnessed declines of 22% yoy and 10.9% qoq in line with sharp correction seen in crude oil prices. However, the declines were much lower than the fall in crude prices when seen on yoy basis. Sequentially spreads were lower for most products in absolute terms but were strong in percentage terms. EBIT margin for the segment at 10.6% was higher by 197bps yoy and 27bps qoq.
Reliance Industries (Q4 FY15)
6
Trend in petrochemical prices
60
70
80
90
100
110
120
Q4 FY11
Q2 FY12
Q4 FY12
Q2 FY13
Q4 FY13
Q2 FY14
Q4 FY14
Q2 FY15
Q4 FY15
PE PP
Rs/kg
405060708090
100110120
Q4 FY11
Q2 FY12
Q4 FY12
Q2 FY13
Q4 FY13
Q2 FY14
Q4 FY14
Q2 FY15
Q4 FY15
POY PSF
Rs/kg
30354045505560657075
Q4 FY11
Q2 FY12
Q4 FY12
Q2 FY13
Q4 FY13
Q2 FY14
Q4 FY14
Q2 FY15
Q4 FY15
PTA MEG
Rs/kg
Source: Company
Trend in petrochemical deltas
300
400
500
600
700
800
900
Q4 FY11
Q2 FY12
Q4 FY12
Q2 FY13
Q4 FY13
Q2 FY14
Q4 FY14
Q2 FY15
Q4 FY15
HDPE‐NaphthaUS$/ton
0
100
200
300
400Q4 FY11
Q2 FY12
Q4 FY12
Q2 FY13
Q4 FY13
Q2 FY14
Q4 FY14
Q2 FY15
Q4 FY15
PP‐PropyleneUS$/ton
350
400
450
500
550
600
650
Q4 FY11
Q2 FY12
Q4 FY12
Q2 FY13
Q4 FY13
Q2 FY14
Q4 FY14
Q2 FY15
Q4 FY15
PVC‐EDCUS$/ton
Source: Company
100
200
300
400
500
600
Q4 FY11
Q2 FY12
Q4 FY12
Q2 FY13
Q4 FY13
Q2 FY14
Q4 FY14
Q2 FY15
Q4 FY15
POY‐PTA‐MEGUS$/ton
0
100
200
300
400
500
Q4 FY11
Q2 FY12
Q4 FY12
Q2 FY13
Q4 FY13
Q2 FY14
Q4 FY14
Q2 FY15
Q4 FY15
PSF‐PTA‐MEGUS$/ton
0
500
1,000
1,500
2,000
Q4 FY12
Q1 FY13
Q2 FY13
Q3 FY13
Q4 FY13
Q1 FY14
Q2 FY14
Q3 FY14
Q4 FY14
Q1 FY15
Q2 FY15
Q3 FY15
Q4 FY15
PBR‐BDUS$/ton
Source: Company
Petchem revenues fall on lower realizations EBIT margins for petchem improve sequentially
‐30%
‐20%
‐10%
0%
10%
20%
30%
40%
50%
0
5,000
10,000
15,000
20,000
25,000
30,000
Q4 FY11
Q1 FY12
Q2 FY12
Q3 FY12
Q4 FY12
Q1 FY13
Q2 FY13
Q3 FY13
Q4 FY13
Q1 FY14
Q2 FY14
Q3 FY14
Q4 FY14
Q1 FY15
Q2 FY15
Q3 FY15
Q4 FY15
Revenues yoy growth
Rs. cr
0.0%
2.0%
4.0%
6.0%
8.0%
10.0%
12.0%
14.0%
16.0%
0
500
1,000
1,500
2,000
2,500
3,000
Q4 FY11
Q1 FY12
Q2 FY12
Q3 FY12
Q4 FY12
Q1 FY13
Q2 FY13
Q3 FY13
Q4 FY13
Q1 FY14
Q2 FY14
Q3 FY14
Q4 FY14
Q1 FY15
Q2 FY15
Q3 FY15
Q4 FY15
EBIT EBIT Margins
Rs. cr
Source: Company, India Infoline Research

Reliance Industries (Q4 FY15)
7
Outlook for petrochemical segment
In the near term, naphtha demand expected to be lower with schedule cracker turnarounds
Higher use of gas as feedstock is likely to support product spread
Global ethylene operating rates expected to sustain at high levels ~89% in 2015‐2017
Ethylene availability likely to remain tight, supporting prices
Supply shortage in region & improved demand to support regional PE/PP markets
PVC prices are supported by seasonal demand in India
Domestic polymer demand to remain healthy with projected growth in Indian economy
Focus on ‘Make in India’ and renewed infrastructure spend
RIL to focus on capacity additions, new application development and provide solutions to drive material substitution
Outlook for polyester and fibre intermediates
Supply disruption in PX to improve overall chain prices, likely to spur demand in near term
Margins likely to be healthy, boosting chain economics
To increase competitiveness of integrated players such as RIL
Polyester markets demand to improve in 1Q FY16 with seasonal pick up.
Price strength would boost volumes and replenishment
PTA industry to witness further consolidation, lower operating rates and slower capacity growth
MEG operations to remain healthy, suitability of new Chinese capacities to be tested for optimal fibre quality
India poised to capture a larger share of the global growth amidst an improving economy, and also serve as an advantaged manufacturing base
Consolidated results – strong performance Financial results (Rs. cr) Q4 FY15 Q4 FY14 % yoy Q3 FY15 % qoq
Net sales 67,470 103,428 (34.8) 93,528 (27.9)
Material costs (39,868) (82,065) (51.4) (68,430) (41.7)
Purchases (6,817) (3,115) 118.8 (5,050) 35.0
Personnel costs (1,659) (1,575) 5.3 (1,548) 7.2
Other overheads (9,258) (7,247) 27.7 (9,811) (5.6)
Operating profit 9,868 9,426 4.7 8,689 13.6
OPM (%) 14.6 9.1 551 bps 9.3 534 bps
Depreciation (2,787) (2,910) (4.2) (2,954) (5.7)
Interest (677) (978) (30.8) (1,137) (40.5)
Other income 2,172 2,097 3.6 2,340 (7.2)
PBT 8,576 7,635 12.3 6,938 23.6
Tax (2,080) (1,759) 18.2 (1,747) 19.1
Effective tax rate (%) 24.3 23.0 25.2
Other provisions / minority etc (115) 5 (2,400.0) 65 (276.9)
Adjusted PAT 6,381 5,881 8.5 5,256 21.4
Adj. PAT margin (%) 9.5 5.7 377 bps 5.6 384 bps
Ann. EPS (Rs) 78.9 72.8 8.4 65.0 21.4 Source: Company, India Infoline Research

Reliance Industries (Q4 FY15)
8
Segmental performance Revenues (Rs. cr) Q4 FY15 Q4 FY14 % yoy Q3 FY15 % qoq
Petrochemical 21,754 26,541 (18.0) 23,001 (5.4)
Refining 56,442 96,668 (41.6) 81,777 (31.0)
Oil and gas 2,513 2,798 (10.2) 2,841 (11.5)
Organized retail 4,788 3,653 31.1 4,686 2.2
Others 2,833 1,804 57.0 3,447 (17.8)
EBIT (Rs. cr) Q4 FY15 Q4 FY14 % yoy Q3 FY15 % qoq
Petrochemical 2,003 2,150 (6.8) 2,064 (3.0)
Refining 4,902 3,962 23.7 3,267 50.0
Oil and gas 489 762 (35.8) 832 (41.2)
Organized retail 104 24 333.3 133 (21.8)
Others 322 313 2.9 248 29.8
EBIT margins (%) Q4 FY15 Q4 FY14 bps yoy Q3 FY15 bps qoq
Petrochemical 9.2 8.1 111 9.0 23
Refining 8.7 4.1 459 4.0 469
Oil and gas 19.5 27.2 (777) 29.3 (983)
Organized retail 2.2 0.7 152 2.8 (67)
Others 11.4 17.4 (598) 7.2 417 Source: Company, India Infoline Research
Retail segment performance continues to improve Retail segment revenues for Q4 FY15 were higher by 31.1% yoy. In terms of profitability the segment reported an EBIT of Rs. 104cr as compared to Rs. 24cr in Q4 FY14. EBIDTA was at Rs. 200cr up 117% yoy. The improvement was on the back of better gross margins across the segments. The company has focused on enhancing its inventory management and has also been able to increase the penetration of its own brands. Benefits of operating leverage and higher contribution of better margin digital and fashion segment provided additional boost to the margins. Contribution of Digital and fashion increase
0%
10%
20%
30%
40%
50%
60%
70%
80%
90%
100%
Q1 FY15 Q2 FY15 Q3 FY15 Q4FY15
Brands
Jewellery
Fashion & lifestyle
Digital
Value & others
Source: Company, India Infoline Research
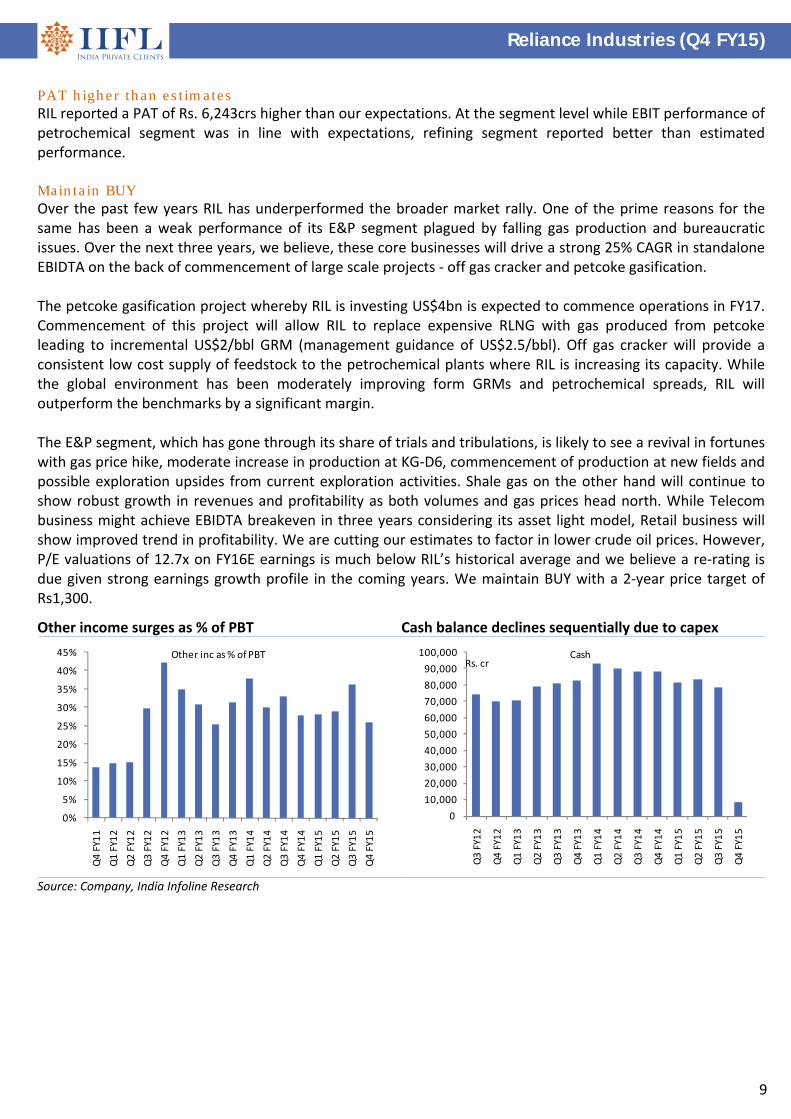
Interest lower than expectations For Q4 FY15, RIL reported other income of Rs.2,133crs a growth of 4.8% yoy but decline of 11.2% qoq. While available cash balance was lower yields were better. Other income accounted for 26% of PBT as compared to 28% in Q4 FY14. Company currently has Rs. 84,472cr of cash and cash equivalents on a consolidated basis. Depreciation was lower on a yoy basis owing to implementation of new rules in the new companies act whereby the depreciable life of certain assets has been increased. Interest expenses were much lower than our expectations and came in at Rs. 404crs a decline of 49% yoy and 54% qoq.
Reliance Industries (Q4 FY15)
9
PAT higher than estimates RIL reported a PAT of Rs. 6,243crs higher than our expectations. At the segment level while EBIT performance of petrochemical segment was in line with expectations, refining segment reported better than estimated performance. Maintain BUY Over the past few years RIL has underperformed the broader market rally. One of the prime reasons for the same has been a weak performance of its E&P segment plagued by falling gas production and bureaucratic issues. Over the next three years, we believe, these core businesses will drive a strong 25% CAGR in standalone EBIDTA on the back of commencement of large scale projects ‐ off gas cracker and petcoke gasification. The petcoke gasification project whereby RIL is investing US$4bn is expected to commence operations in FY17. Commencement of this project will allow RIL to replace expensive RLNG with gas produced from petcoke leading to incremental US$2/bbl GRM (management guidance of US$2.5/bbl). Off gas cracker will provide a consistent low cost supply of feedstock to the petrochemical plants where RIL is increasing its capacity. While the global environment has been moderately improving form GRMs and petrochemical spreads, RIL will outperform the benchmarks by a significant margin. The E&P segment, which has gone through its share of trials and tribulations, is likely to see a revival in fortunes with gas price hike, moderate increase in production at KG‐D6, commencement of production at new fields and possible exploration upsides from current exploration activities. Shale gas on the other hand will continue to show robust growth in revenues and profitability as both volumes and gas prices head north. While Telecom business might achieve EBIDTA breakeven in three years considering its asset light model, Retail business will show improved trend in profitability. We are cutting our estimates to factor in lower crude oil prices. However, P/E valuations of 12.7x on FY16E earnings is much below RIL’s historical average and we believe a re‐rating is due given strong earnings growth profile in the coming years. We maintain BUY with a 2‐year price target of Rs1,300.
Other income surges as % of PBT Cash balance declines sequentially due to capex
0%
5%
10%
15%
20%
25%
30%
35%
40%
45%
Q4 FY11
Q1 FY12
Q2 FY12
Q3 FY12
Q4 FY12
Q1 FY13
Q2 FY13
Q3 FY13
Q4 FY13
Q1 FY14
Q2 FY14
Q3 FY14
Q4 FY14
Q1 FY15
Q2 FY15
Q3 FY15
Q4 FY15
Other inc as % of PBT
0
10,000
20,000
30,000
40,000
50,000
60,000
70,000
80,000
90,000
100,000
Q3 FY12
Q4 FY12
Q1 FY13
Q2 FY13
Q3 FY13
Q4 FY13
Q1 FY14
Q2 FY14
Q3 FY14
Q4 FY14
Q1 FY15
Q2 FY15
Q3 FY15
Q4 FY15
CashRs. cr
Source: Company, India Infoline Research
Reliance Industries (Q4 FY15)
10
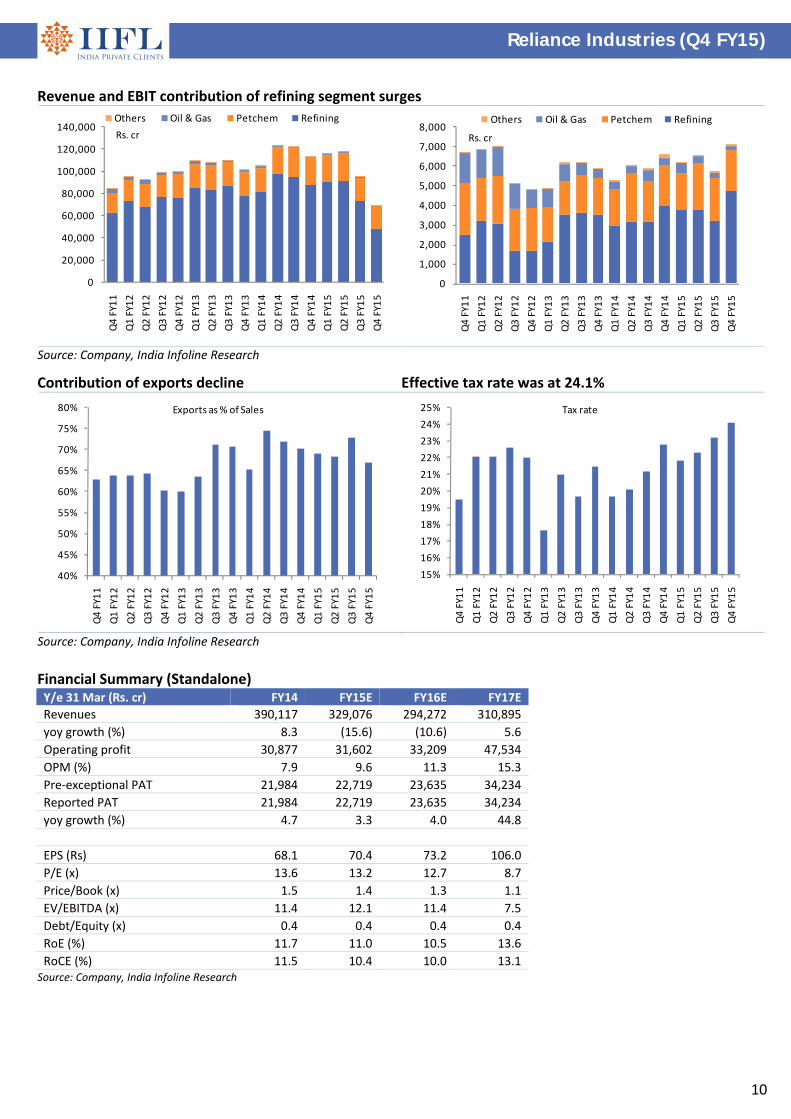
Revenue and EBIT contribution of refining segment surges
0
20,000
40,000
60,000
80,000
100,000
120,000
140,000
Q4 FY11
Q1 FY12
Q2 FY12
Q3 FY12
Q4 FY12
Q1 FY13
Q2 FY13
Q3 FY13
Q4 FY13
Q1 FY14
Q2 FY14
Q3 FY14
Q4 FY14
Q1 FY15
Q2 FY15
Q3 FY15
Q4 FY15
Others Oil & Gas Petchem Refining
Rs. cr
0
1,000
2,000
3,000
4,000
5,000
6,000
7,000
8,000
Q4 FY11
Q1 FY12
Q2 FY12
Q3 FY12
Q4 FY12
Q1 FY13
Q2 FY13
Q3 FY13
Q4 FY13
Q1 FY14
Q2 FY14
Q3 FY14
Q4 FY14
Q1 FY15
Q2 FY15
Q3 FY15
Q4 FY15
Others Oil & Gas Petchem Refining
Rs. cr
Source: Company, India Infoline Research
Contribution of exports decline Effective tax rate was at 24.1%
40%
45%
50%
55%
60%
65%
70%
75%
80%
Q4 FY11
Q1 FY12
Q2 FY12
Q3 FY12
Q4 FY12
Q1 FY13
Q2 FY13
Q3 FY13
Q4 FY13
Q1 FY14
Q2 FY14
Q3 FY14
Q4 FY14
Q1 FY15
Q2 FY15
Q3 FY15
Q4 FY15
Exports as % of Sales
15%
16%
17%
18%
19%
20%
21%
22%
23%
24%
25%
Q4 FY11
Q1 FY12
Q2 FY12
Q3 FY12
Q4 FY12
Q1 FY13
Q2 FY13
Q3 FY13
Q4 FY13
Q1 FY14
Q2 FY14
Q3 FY14
Q4 FY14
Q1 FY15
Q2 FY15
Q3 FY15
Q4 FY15
Tax rate
Source: Company, India Infoline Research
Financial Summary (Standalone) Y/e 31 Mar (Rs. cr) FY14 FY15E FY16E FY17E
Revenues 390,117 329,076 294,272 310,895
yoy growth (%) 8.3 (15.6) (10.6) 5.6
Operating profit 30,877 31,602 33,209 47,534
OPM (%) 7.9 9.6 11.3 15.3
Pre‐exceptional PAT 21,984 22,719 23,635 34,234
Reported PAT 21,984 22,719 23,635 34,234
yoy growth (%) 4.7 3.3 4.0 44.8
EPS (Rs) 68.1 70.4 73.2 106.0
P/E (x) 13.6 13.2 12.7 8.7
Price/Book (x) 1.5 1.4 1.3 1.1
EV/EBITDA (x) 11.4 12.1 11.4 7.5
Debt/Equity (x) 0.4 0.4 0.4 0.4
RoE (%) 11.7 11.0 10.5 13.6
RoCE (%) 11.5 10.4 10.0 13.1 Source: Company, India Infoline Research

‘Best Broker of the Year’ – by Zee Business for contribution to brokingNirmal Jain, Chairman, IIFL, received the award for The Best Broker of the Year (for contribution to broking in India) at India's Best Market Analyst Awards 2014 organised by the Zee Business in Mumbai. The award was presented by the guest of Honour Amit Shah, president of the Bharatiya Janata Party and Piyush Goel, Minister of state with independent charge for power, coal new and renewable energy.
'Best Equity Broker of the Year' – Bloomberg UTV, 2011IIFL was awarded the 'Best Equity Broker of the Year' at the recently held Bloomberg UTV Financial Leadership Award, 2011. The award presented by the Hon'ble Finance Minister of India, Shri Pranab Mukherjee. The Bloomberg UTV Financial Leadership Awards acknowledge the extraordinary contribution of India's financial leaders and visionaries from January 2010 to January 2011.
'Best Broker in India' – Finance Asia, 2011IIFL has been awarded the 'Best Broker in India' by Finance Asia. The award is the result of Finance Asia's annual quest for the best financial services firms across Asia, which culminated in the Country Awards 2011
Other awards
2012BEST BROKING HOUSE WITH
GLOBAL PRESENCE
2009, 2012 & 2013BEST MARKET
ANALYSTBEST BROKERAGE,
INDIAMOST IMPROVED,
INDIABEST BROKER,
INDIA
2009FASTEST GROWING
LARGE BROKING HOUSE
Recommendation parameters for fundamental reports:
Buy – Absolute return of over +15%
Accumulate – Absolute return between 0% to +15%
Reduce – Absolute return between 0% to ‐10%
Sell – Absolute return below ‐10%
Call Failure ‐ In case of a Buy report, if the stock falls 20% below the recommended price on a closing basis, unless otherwise specified by the analyst; or, in case of a Sell report, if the stock rises 20% above the recommended price on a closing basis, unless otherwise specified by the analyst
India Infoline Group (hereinafter referred as IIFL) is engaged in diversified financial services business including equity broking, DP services, merchant banking, portfolio management services, distribution of Mutual Fund, insurance products and other investment products and also loans and finance business. India Infoline Ltd (“hereinafter referred as IIL”) is a part of the IIFL and is a member of the National Stock Exchange of India Limited (“NSE”) and the BSE Limited (“BSE”). IIL is also a Depository Participant registered with NSDL & CDSL, a SEBI registered merchant banker and a SEBI registered portfolio manager. IIL is a large broking house catering to retail, HNI and institutional clients. It operates through its branches and authorised persons and sub‐brokers spread across the country and the clients are provided online trading through internet and offline trading through branches and Customer Care. Terms & Conditions and Other Disclosures:‐ a) This research report (“Report”) is for the personal information of the authorised recipient(s) and is not for public distribution and should not be
reproduced or redistributed to any other person or in any form without IIL’s prior permission. The information provided in the Report is from publicly available data, which we believe, are reliable. While reasonable endeavors have been made to present reliable data in the Report so far as it relates to current and historical information, but IIL does not guarantee the accuracy or completeness of the data in the Report. Accordingly, IIL or any of its connected persons including its directors or subsidiaries or associates or employees shall not be in any way responsible for any loss or damage that may arise to any person from any inadvertent error in the information contained, views and opinions expressed in this publication.
b) Past performance should not be taken as an indication or guarantee of future performance, and no representation or warranty, express or implied, is
made regarding future performance. Information, opinions and estimates contained in this report reflect a judgment of its original date of publication by IIFL and are subject to change without notice. The price, value of and income from any of the securities or financial instruments mentioned in this report can fall as well as rise. The value of securities and financial instruments is subject to exchange rate fluctuation that may have a positive or adverse effect on the price or income of such securities or financial instruments.
c) The Report also includes analysis and views of our research team. The Report is purely for information purposes and does not construe to be
investment recommendation/advice or an offer or solicitation of an offer to buy/sell any securities. The opinions expressed in the Report are our current opinions as of the date of the Report and may be subject to change from time to time without notice. IIL or any persons connected with it do not accept any liability arising from the use of this document.
d) Investors should not solely rely on the information contained in this Report and must make investment decisions based on their own investment
objectives, judgment, risk profile and financial position. The recipients of this Report may take professional advice before acting on this information.

e) IIL has other business segments / divisions with independent research teams separated by 'chinese walls' catering to different sets of customers having varying objectives, risk profiles, investment horizon, etc and therefore, may at times have, different and contrary views on stocks, sectors and markets.
f) This report is not directed or intended for distribution to, or use by, any person or entity who is a citizen or resident of or located in any locality, state,
country or other jurisdiction, where such distribution, publication, availability or use would be contrary to local law, regulation or which would subject IIL and its affiliates to any registration or licensing requirement within such jurisdiction. The securities described herein may or may not be eligible for sale in all jurisdictions or to certain category of investors. Persons in whose possession this Report may come are required to inform themselves of and to observe such restrictions.
g) As IIL along with its associates, are engaged in various financial services business and so might have financial, business or other interests in other entities
including the subject company/ies mentioned in this Report. However, IIL encourages independence in preparation of research report and strives to minimize conflict in preparation of research report. IIL and its associates did not receive any compensation or other benefits from the subject company/ies mentioned in the Report or from a third party in connection with preparation of the Report. Accordingly, IIL and its associates do not have any material conflict of interest at the time of publication of this Report.
h) As IIL and its associates are engaged in various financial services business, it might have:‐
(a) received any compensation (except in connection with the preparation of this Report) from the subject company in the past twelve months; (b) managed or co‐managed public offering of securities for the subject company in the past twelve months; (c) received any compensation for investment banking or merchant banking or brokerage services from the subject company in the past twelve months; (d) received any compensation for products or services other than investment banking or merchant banking or brokerage services from the subject company in the past twelve months; (e) engaged in market making activity for the subject company.
i) IIL and its associates collectively do not own (in their proprietary position) 1% or more of the equity securities of the subject company/ies mentioned in the report as of the last day of the month preceding the publication of the research report.
j) The Research Analyst/s engaged in preparation of this Report or his/her relative
(a) does not have any financial interests in the subject company/ies mentioned in this report; (b) does not own 1% or more of the equity securities of the subject company mentioned in the report as of the last day of the month preceding the publication of the research report; (c) does not have any other material conflict of interest at the time of publication of the research report.
k) The Research Analyst/s engaged in preparation of this Report:‐ (a) has not received any compensation from the subject company in the past twelve months; (b) has not managed or co‐managed public offering of securities for the subject company in the past twelve months; (c) has not received any compensation for investment banking or merchant banking or brokerage services from the subject company in the past twelve months; (d) has not received any compensation for products or services other than investment banking or merchant banking or brokerage services from the subject company in the past twelve months; (e) has not received any compensation or other benefits from the subject company or third party in connection with the research report; (f) has not served as an officer, director or employee of the subject company; (g) is not engaged in market making activity for the subject company.
We submit that no material disciplinary action has been taken on IIL by any regulatory authority impacting Equity Research Analysis. A graph of daily closing prices of securities is available at http://www.nseindia.com/ChartApp/install/charts/mainpage.jsp, www.bseindia.com and http://economictimes.indiatimes.com/markets/stocks/stock‐quotes. (Choose a company from the list on the browser and select the “three years” period in the price chart).
Published in 2015. © India Infoline Ltd 2015 India Infoline Limited (Formerly “India Infoline Distribution Company Limited”), CIN No.: U99999MH1996PLC132983, Corporate Office – IIFL Centre, Kamala City, Senapati Bapat Marg, Lower Parel, Mumbai – 400013 Tel: (91‐22) 4249 9000 .Fax: (91‐22) 40609049, Regd. Office – IIFL House, Sun Infotech Park, Road No. 16V, Plot No. B‐23, MIDC, Thane Industrial Area, Wagle Estate, Thane – 400604 Tel: (91‐22) 25806650. Fax: (91‐22) 25806654 E‐mail: [email protected] Website: www.indiainfoline.com, Refer www.indiainfoline.com for detail of Associates. National Stock Exchange of India Ltd. SEBI Regn. No. : INB231097537/ INF231097537/ INE231097537, Bombay Stock Exchange Ltd. SEBI Regn. No.:INB011097533/ INF011097533/ BSE‐Currency, MCX Stock Exchange Ltd. SEBI Regn. No.: INB261097530/ INF261097530/ INE261097537, United Stock Exchange Ltd. SEBI Regn. No.: INE271097532, PMS SEBI Regn. No. INP000002213, IA SEBI Regn. No. INA000000623, SEBI RA Regn.: INH000000248
For Research related queries, write to: Amar Ambani, Head of Research at [email protected] For Sales and Account related information, write to customer care: [email protected] or call on 91‐22 4007 1000