Reliability of Conservation Actions Based on Elasticity ... · 08/05/1998 · (Wootton & Bell...
15
815 Conservation Biology, Pages 815–829 Volume 13, No. 4, August 1999 Reliability of Conservation Actions Based on Elasticity Analysis of Matrix Models L. SCOTT MILLS,* DANIEL F. DOAK,† AND MICHAEL J. WISDOM‡ *Wildlife Biology Program, School of Forestry, University of Montana, Missoula, MT 59812, U.S.A., email [email protected] †Department of Environmental Studies, University of California, Santa Cruz, CA 95064, U.S.A. ‡U.S. Forest Service, Forestry and Range Sciences Lab, 1401 Gekeler Lane, La Grande, OR 97850, U.S.A. Abstract: Matrix population models have entered the mainstream of conservation biology, with analysis of proportional sensitivities (elasticity analysis) of demographic rates becoming important components of con- servation decision making. We identify areas where management applications using elasticity analysis po- tentially conflict with the mathematical basis of the technique, and we use a hypothetical example and three real data sets (Prairie Chicken [ Tympanuchus cupido ], desert tortoise [ Gopherus agassizii ], and killer whale [ Orcinus orca ]) to evaluate the extent to which conservation recommendations based on elasticities might be misleading. First, changes in one demographic rate can change the qualitative ranking of the elasticity val- ues calculated from a population matrix, a result that dampens enthusiasm for ranking conservation actions based solely on which rates have the highest elasticity values. Second, although elasticities often provide accu- rate predictions of future changes in population growth rate under management perturbations that are large or that affect more than one rate concurrently, concordance frequently fails when different rates vary by dif- ferent amounts. In particular, when vital rates change to their high or low values observed in nature, predic- tions of future growth rate based on elasticities of a mean matrix can be misleading, even predicting popula- tion increase when the population growth rate actually declines following a perturbation. Elasticity measures will continue to be useful tools for applied ecologists, but they should be interpreted with consider- able care. We suggest that studies using analytical elasticity analysis explicitly consider the range of variation possible for different rates and that simulation methods are a useful tool to this end. Confiabilidad de las Acciones de Conservación Basadas en Análisis de Elasticidad de Modelos de Matríces Resumen: Los modelos de matrices de poblaciones han incursionado en el medio de la biología de la conser- vación, con el análisis de sensitividades proporcionales (análisis de elasticidad) de tasas demográficas volviéndose un componente importante del proceso de toma de decisiones en la conservación. Identificamos áreas donde las aplicaciones de manejo utilizando análisis de elasticidad potencialmente conflictúan con las bases matemáticas de la técnica y utilizamos un ejemplo hipotético y tres juegos de datos reales (la gallineta de pradera [ Tympanuchus cupido ], la tortuga del desierto [ Gopherus agassizii ] y la orca [ Orcinus orca ]) para evaluar la extensión a la cual las recommendaciones basadas en elasticidades pueden ser mal interpretadas. Primero, los cambios en una tasa demográfica pueden cambiar el valor de rangos de los valores de elasti- cidad calculados de una matriz poblacional, un resultado que empantana el entusiasmo por asignar rangos a acciones de conservación basados unicamente en las tasas que tienen los valores de elasticidad más altos. Segundo, aunque las elasticidades frecuentemente proveen predicciones precisas de cambios a futuro en las tasas de crecimeinto poblacional bajo perturbaciones de manejo grandes o que afectan más que una tasa concurrente, la concordancia frecuentemente falla cuando tasas diferentes varían en diferentes cantidades. En particular, cuando las tasas vitales cambian a sus valores más altos o más bajos observados en la natu- raleza, las predicciones de crecimiento a futuro basadas en elasticidades de una matriz promedio pueden conducir a errores, hasta llegar a predecirse un incremento cuando la tasa de crecimiento poblacional real- mente disminuye después de una perturbación. Las medidas de elasticidad seguirán siendo herramientas Paper submitted May 8, 1998; revised manuscript accepted December 24, 1998.
Transcript of Reliability of Conservation Actions Based on Elasticity ... · 08/05/1998 · (Wootton & Bell...

815
Conservation Biology, Pages 815–829Volume 13, No. 4, August 1999
Reliability of Conservation Actions Based on Elasticity Analysis of Matrix Models
L. SCOTT MILLS,* DANIEL F. DOAK,† AND MICHAEL J. WISDOM‡
*Wildlife Biology Program, School of Forestry, University of Montana, Missoula, MT 59812, U.S.A., email [email protected]†Department of Environmental Studies, University of California, Santa Cruz, CA 95064, U.S.A.‡U.S. Forest Service, Forestry and Range Sciences Lab, 1401 Gekeler Lane, La Grande, OR 97850, U.S.A.
Abstract:
Matrix population models have entered the mainstream of conservation biology, with analysis ofproportional sensitivities (elasticity analysis) of demographic rates becoming important components of con-servation decision making. We identify areas where management applications using elasticity analysis po-tentially conflict with the mathematical basis of the technique, and we use a hypothetical example and threereal data sets (Prairie Chicken [
Tympanuchus cupido
], desert tortoise [
Gopherus agassizii
], and killer whale[
Orcinus orca
]) to evaluate the extent to which conservation recommendations based on elasticities might bemisleading. First, changes in one demographic rate can change the qualitative ranking of the elasticity val-ues calculated from a population matrix, a result that dampens enthusiasm for ranking conservation actionsbased solely on which rates have the highest elasticity values. Second, although elasticities often provide accu-rate predictions of future changes in population growth rate under management perturbations that are largeor that affect more than one rate concurrently, concordance frequently fails when different rates vary by dif-ferent amounts. In particular, when vital rates change to their high or low values observed in nature, predic-tions of future growth rate based on elasticities of a mean matrix can be misleading, even predicting popula-tion increase when the population growth rate actually declines following a perturbation. Elasticitymeasures will continue to be useful tools for applied ecologists, but they should be interpreted with consider-able care. We suggest that studies using analytical elasticity analysis explicitly consider the range of variationpossible for different rates and that simulation methods are a useful tool to this end.
Confiabilidad de las Acciones de Conservación Basadas en Análisis de Elasticidad de Modelos de Matríces
Resumen:
Los modelos de matrices de poblaciones han incursionado en el medio de la biología de la conser-vación, con el análisis de sensitividades proporcionales (análisis de elasticidad) de tasas demográficasvolviéndose un componente importante del proceso de toma de decisiones en la conservación. Identificamosáreas donde las aplicaciones de manejo utilizando análisis de elasticidad potencialmente conflictúan con lasbases matemáticas de la técnica y utilizamos un ejemplo hipotético y tres juegos de datos reales (la gallinetade pradera [
Tympanuchus cupido
], la tortuga del desierto [
Gopherus agassizii
] y la orca [
Orcinus orca
]) paraevaluar la extensión a la cual las recommendaciones basadas en elasticidades pueden ser mal interpretadas.Primero, los cambios en una tasa demográfica pueden cambiar el valor de rangos de los valores de elasti-cidad calculados de una matriz poblacional, un resultado que empantana el entusiasmo por asignar rangosa acciones de conservación basados unicamente en las tasas que tienen los valores de elasticidad más altos.Segundo, aunque las elasticidades frecuentemente proveen predicciones precisas de cambios a futuro en lastasas de crecimeinto poblacional bajo perturbaciones de manejo grandes o que afectan más que una tasaconcurrente, la concordancia frecuentemente falla cuando tasas diferentes varían en diferentes cantidades.En particular, cuando las tasas vitales cambian a sus valores más altos o más bajos observados en la natu-raleza, las predicciones de crecimiento a futuro basadas en elasticidades de una matriz promedio puedenconducir a errores, hasta llegar a predecirse un incremento cuando la tasa de crecimiento poblacional real-mente disminuye después de una perturbación. Las medidas de elasticidad seguirán siendo herramientas
Paper submitted May 8, 1998; revised manuscript accepted December 24, 1998.

816
Predicting Populaton Growth Mills et al.
Conservation BiologyVolume 13, No. 4, August 1999
muy útiles para la ecología aplicada, pero deberán ser interpretadas con extrema cautela. Sugerimos que losestudios que utilizan análisis de elasticidad explícitamente consideren el rango de variación posible para ta-
sas diferentes y que los métodos de simulación son una herramienta útil para este fin.
Introduction
The use of mathematical tools to analyze population via-bility has increased rapidly over the last decade, andmodeling efforts have focused on two overlapping goals:estimating extinction times or probabilities and target-ing the best ways to improve population growth. For thelatter goal, one of the most effective and popular tools isthe analysis of matrix population models. Although ma-trix models can be used in many ways, most recent ap-plications include the calculation of age- or stage-specificsensitivities or elasticities to indicate factors that most af-fect population growth (Caswell 1978; 1989
a
). Theseapproaches have shown us that demographic vital ratesdiffer in their effects on population growth and have be-come an elegant way to evaluate and prioritize conserva-tion research and management (Wootton & Bell 1992;Crowder et al. 1994; Doak et al. 1994; Escos et al. 1994;Heppell et al. 1994; Olmsted & Alvarez-Buylla 1995; Mar-schall & Crowder 1996; Ratsirarson et al. 1996; Silver-town et al. 1996). Furthermore, these analyses of matrixmodels have served as the foundation for increasinglycomplex methods of exploring aspects of demographicchange (van Groenendael et al. 1994; van Tienderen1995; Caswell 1996; Horvitz et al. 1997).
Unfortunately, the precise mathematical definitions ofsensitivities and elasticities are in sharp contrast to theways these quantities are often used and interpreted inapplied ecology. Many authors have noted the mismatchbetween the mathematical basis and potential interpre-tations of analytical sensitivity analyses for management(Crouse et al. 1987; Doak et al. 1994; Olmsted & Alvarez-Buylla 1995; Burgman et al. 1996; Horvitz et al. 1997;Wisdom & Mills 1997), but there remains a pressing needfor a systematic evaluation of the extent to which theseapproaches provide robust predictions for conservationactions (Dixon et al. 1997; Ehrlén & van Groenendael1998; Matos & Silva Matos 1998).
We investigated potential concerns arising from themismatch between the definition and use of analyticalsensitivity analysis by evaluating whether the most com-monly used form of sensitivity analysis—elasticities—arerobust in the same sense that many statistical tests arerobust: can these metrics be used and interpreted withconfidence over a wide range of realistic situations, eventhough their derivation relies upon narrow, restrictivedefinitions? To this end, we reviewed both the mathe-matical properties of analytical sensitivity analyses and
how ecologists use and interpret elasticities for conser-vation. We then used a simple hypothetical example toelucidate some of the potential problems in applyingthis technique to real-world situations. Finally, usingdata from field studies on three vertebrate taxa with dif-ferent life histories, we explored the seriousness ofthese concerns for biologically realistic situations.
Definitions and Common Use of Sensitivities and Elasticities
The sensitivity of a population’s finite growth rate (
l
) to achange in matrix element
a
ij
is defined as the partial de-rivative of
l
with respect to
a
ij
(Caswell 1978, 1989
a
):
,
where
v
i
and
w
j
refer to the
i
th and
j
th elements of thestage-specific reproductive value (
v
) and stable stage dis-tribution (
w
) vectors, respectively, and where
,
w,v
.
isthe scalar product of
w
and
v
. The elasticity,
e
ij
, of
l
toelement
a
ij
is simply the sensitivity rescaled to accountfor the magnitude of both
l
and the matrix element(Caswell 1989
a
):
Thus, elasticities predict the proportional change ingrowth rate given a proportional, infinitesimal change ina matrix element, while all other elements remain con-stant. The growth rate,
l
, is the dominant eigenvalue ofthe matrix.
For many problems in applied ecology, it is notenough to focus on the sensitivities and elasticities ofthe matrix elements; rather, it is more appropriate toconsider the actual vital rates that underlie each element(Wootton & Bell 1992; Brault & Caswell 1993; Doak etal. 1994). In stage-based models, for example, annualsurvival for most stages is not itself a matrix element butrather a part of at least two elements, that for survivingwithin a stage and that for surviving and growing to thenext stage. Similarly, in age-based Leslie matrices, repro-duction elements must contain some aspect of survival(Jenkins 1988; Caswell 1989
a
), so management for sur-vival will affect not only survival but also reproduction.Using the chain rule, the elasticity of an underlying vitalrate
x
can be expressed as (Caswell 1989
a
)
∂λ∂aij---------
viwj
w,v⟨ ⟩---------------=
eij
aij
λ------ ∂λ
∂aij---------=

Conservation BiologyVolume 13, No. 4, August 1999
Mills et al. Predicting Populaton Growth
817
Analogous approaches for calculating elasticities of un-derlying rates include small perturbations instead of analyt-ical solutions (Crowder et al. 1994; Heppell et al. 1994) orrescaling the partial derivatives directly calculated from amatrix characteristic equation. (This method, however, isquite difficult for larger and more complicated matrices.)
Because elasticities are partial derivatives, they predictthe effect on
l
of infinitesimally small and linear changes.Elasticities of matrix elements can be added together toobtain combined effects of multiple changes in vitalrates because their proportional nature means that theelasticities of all elements in a matrix sum to one (deKroon et al. 1986; Mesterton-Gibbons 1993). Elasticitiesof component vital rates need not sum to one (Caswell1989
a
:136) but may still be added to determine a rela-tive net effect on
l
.Applications of elasticity analysis to conservation prob-
lems represent a laudable increase in quantitative ap-proaches to management. In this case, however, the appli-cations may not conform to the underlying mathematicalassumptions. Elasticities, and consequent managementrecommendations, are usually calculated from a singlepopulation matrix constructed from average, or even“best guess” vital rates. The demographic rate in the meanmatrix with the highest elasticity is then recommendedfor highest management or research priority, with corre-spondingly less emphasis recommended for managementof low elasticity rates (Crowder et al. 1994; Heppell et al.1994; Maguire et al. 1995; Olmsted & Alvarez-Buylla1995). Similarly, specific changes in
l
, or extinction prob-ability, are inferred from each rate’s sensitivity or elastic-ity, as implied by the mathematics (e.g., Doak et al. 1994;Escos et al. 1994). Finally, the joint consequence of man-agement of multiple rates is often evaluated by adding elas-ticities to project change in growth rate (Kalisz & McPeek1992; Silvertown et al. 1993, 1996; van Groenendael et al.1994). Thus, in applying elasticities to population man-agement, the presumption is that the instantaneous,one-change-at-a-time basis of the elasticity analysis willstill give robust insights into the effects of larger, multiplechanges in specific vital rates resulting from managementof rare or endangered species.
The difference between the mathematical definitionsand the conservation applications of elasticity analysisraises several potential concerns. It is not clear whethersubstantial changes in vital rates induced by manage-ment, measurement error, or natural spatial and tempo-ral variation will yield new matrices with the same rank-ing of elasticities as the original. If not, the identificationof optimal interventions will be complicated at best(Benton & Grant 1996). Even if the ranking of elasticitiesis unaffected, real changes in vital rates may result inpopulation growth rates that are poorly predicted by the
xλ---∂λ
∂x------
xλ--- ∂λ
∂aij---------
i j,∑
∂aij
∂x---------.=
infinitesimal perturbations assumed by the mathematics(for initial consideration of this problem see Caswell1996). Both of these inferences—the stability of relativeranking of elasticities and their ability to predict changein population growth when vital rate changes are largerthan infinitesimal—depend crucially on the linearity ofresponses of
l
to changes in vital rates over the relevantrange of values being considered.
When more than one rate changes simultaneously, aswill typically be the case, the assumption of additivity ofelasticities becomes critical for correct prediction of fu-ture growth rate. Also, even if effects are additive, differ-ent vital rates are likely to be highly correlated in theirfluctuations due to life-history tradeoffs or common re-sponses to environmental effects, which can also affectpredictions of changes in growth rate based on summedelasticities (van Tienderen 1995).
A final concern has to do with the relationship be-tween the sensitivity or elasticity of vital rates and thelikely range of variation in these rates (Brault & Caswell1993; Silvertown et al. 1996; Horvitz et al. 1997; Gaillardet al. 1998). Many studies using analytical sensitivityanalysis focus exclusively on elasticities because they al-low comparison of responses to a certain proportionalchange in demographic rates measured on differentscales. Different vital rates, however, are not equally sus-ceptible to change. The averages for some rates arecloser to biological limits, for example, and some ratesare simply less plastic in their response to environmen-tal or management perturbations. Pfister (1998) hasfound that vital rates with low elasticities tend to havehigh variance, and Gaillard et al. (1998) notes that vitalrates with high variation can have larger effects on pop-ulation growth than rates with high elasticity. Given thatthere are rate-specific constraints, how well do elasticityvalues alone predict the effects on population growth ofrealistic changes in vital rates?
Several methods have been developed to deal with theproblem of rate-specific range of variation and the corre-lation between variation in different rates. Probably themost common of these methods involves “life table re-sponse experiment” (LTRE) approaches (Caswell 1989
b
;Brault & Caswell 1993; Horvitz et al. 1997; Ehrlén & vanGroenendael 1998). These methods lead to predictionsof proportional change in
l
based upon both elasticitiesof the changed rate and the proportional change in therate. Although these extensions of sensitivity analysiscan incorporate information on the amount, form, andcorrelations of changes in different vital rates, all incor-porate the assumptions of linear, additive effects inher-ent in the use of elasticities. Thus, although they usemore extensive data to overcome some problems of sim-ple elasticity predictions, they may still be subject tosome of the same potential limitations.
These concerns led us to use realistic matrix formula-tions to evaluate the following potential questions in the
818
Predicting Populaton Growth Mills et al.
Conservation BiologyVolume 13, No. 4, August 1999
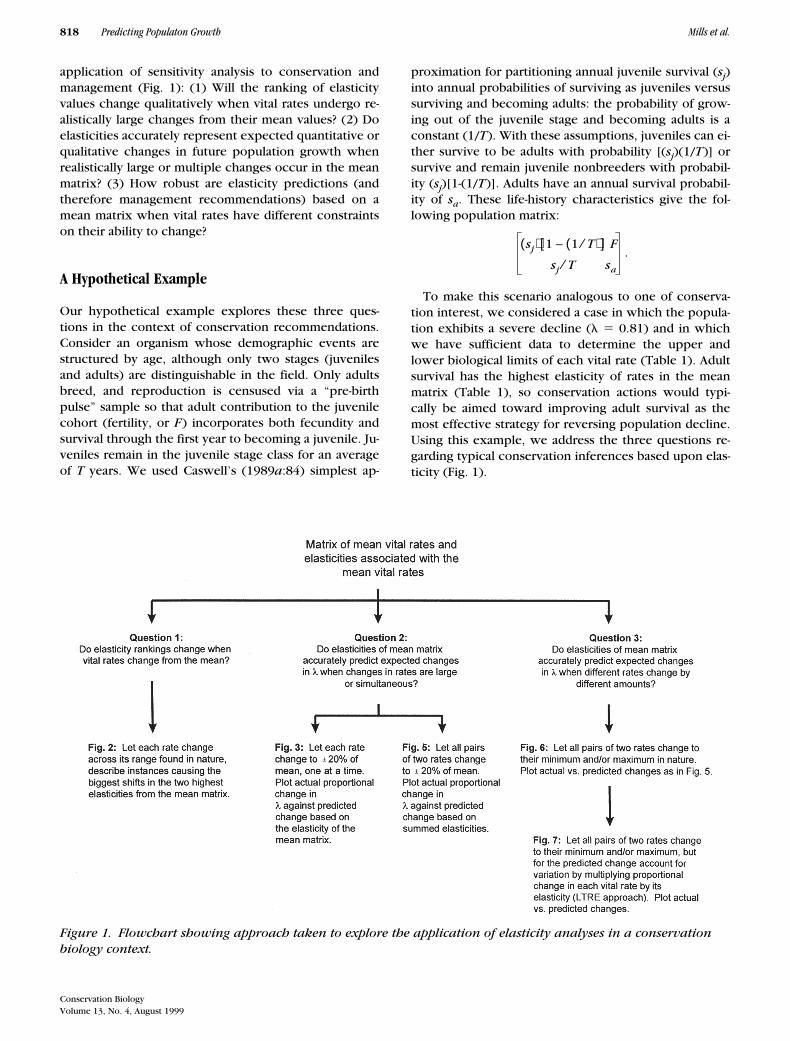
application of sensitivity analysis to conservation andmanagement (Fig. 1): (1) Will the ranking of elasticityvalues change qualitatively when vital rates undergo re-alistically large changes from their mean values? (2) Doelasticities accurately represent expected quantitative orqualitative changes in future population growth whenrealistically large or multiple changes occur in the meanmatrix? (3) How robust are elasticity predictions (andtherefore management recommendations) based on amean matrix when vital rates have different constraintson their ability to change?
A Hypothetical Example
Our hypothetical example explores these three ques-tions in the context of conservation recommendations.Consider an organism whose demographic events arestructured by age, although only two stages (juvenilesand adults) are distinguishable in the field. Only adultsbreed, and reproduction is censused via a “pre-birthpulse” sample so that adult contribution to the juvenilecohort (fertility, or
F
) incorporates both fecundity andsurvival through the first year to becoming a juvenile. Ju-veniles remain in the juvenile stage class for an averageof
T
years. We used Caswell’s (1989
a
:84) simplest ap-
proximation for partitioning annual juvenile survival (
s
j
)into annual probabilities of surviving as juveniles versussurviving and becoming adults: the probability of grow-ing out of the juvenile stage and becoming adults is aconstant (1/
T
). With these assumptions, juveniles can ei-ther survive to be adults with probability [(
s
j
)(1/
T
)] orsurvive and remain juvenile nonbreeders with probabil-ity (
s
j
)[1-(1/
T
)]. Adults have an annual survival probabil-ity of
s
a
. These life-history characteristics give the fol-lowing population matrix:
.
To make this scenario analogous to one of conserva-tion interest, we considered a case in which the popula-tion exhibits a severe decline (
l
5
0.81) and in whichwe have sufficient data to determine the upper andlower biological limits of each vital rate (Table 1). Adultsurvival has the highest elasticity of rates in the meanmatrix (Table 1), so conservation actions would typi-cally be aimed toward improving adult survival as themost effective strategy for reversing population decline.Using this example, we address the three questions re-garding typical conservation inferences based upon elas-ticity (Fig. 1).
sj( ) 1 1 T⁄( )–[ ] F
sj T sa⁄
Figure 1. Flowchart showing approach taken to explore the application of elasticity analyses in a conservationbiology context.

Conservation BiologyVolume 13, No. 4, August 1999
Mills et al. Predicting Populaton Growth
819
Changes in Ranking of Elasticity Values when OneVital Rate Changes
Suppose that management intervention, or natural varia-tion, changes a vital rate relative to that used in the meanmatrix. For example, imagine that the mean time spentas juveniles (
T
) varies (Table 1), perhaps because the tran-sition to breeding is altered by weather or changes inavailable habitat for territories or nesting sites (Heppell etal. 1994). For our example life history, the qualitative rank-ing of the elasticity values changes as
T
decreases fromthe mean of 7.0; below about
T
5
5.5, juvenile survivalreplaces adult survival as the vital rate with the highestelasticity (Fig. 2a). Thus, both the absolute value of elastic-ity and the “highest ranked” elasticity can shift with theparticular values used to construct a matrix, implying thatmanagement-induced changes in one rate or simple un-certainty in estimates of a mean rate can alter conclusionsdrawn from elasticities. To test if these shifts in the im-portance of different rates were exaggerated by the low
l
in this example (Meats 1971), we also performed thisanalysis with an altered matrix with
l
5
1.01 (all ratesexcept
T
increased by 25%); the result was unchanged.
Predicting Changes in Population Growth with Large or Multiple Changes in Vital Rates
How well do elasticities based on infinitesimal changes inthe mean matrix predict the proportional change in
l
when a single vital rate changes by a large amount? For ourhypothetical organism, all vital rates were changed one ata time to
6
20% of the mean, and predicted proportionalchanges in
l
(either the elasticity or negative elasticity, de-pending on whether the rate is increased or decreased, ofeach rate in the mean matrix) were plotted against theactual proportional change in
l
after changing that rate:(
lmodified matrix 2 lmean matrix)/(lmean matrix). If the elasticityof the mean matrix were a perfect predictor of change inpopulation growth rate, the points would correspond to astraight line. Deviation from a straight line would indicatea mismatch between the predictions of simple elasticitiesand the actual changes in growth rate after the vital rateswere modified. In this case, the correspondence betweenpredicted and observed changes was excellent for these
equal 20% changes (Fig. 3a). (The numerical values of thepredicted and actual change do not necessarily correspondbecause the predictions are for infinitesimal changes,whereas each rate was changed by 20%).
Deviations between predicted and observed changes inl may increase as the magnitude of the changes increasebecause of nonlinearities in the relationships between land underlying vital rates. For example, the actual l formatrices with decreasing T values increased more thanpredicted based on the linear proportional changes as-sumed by elasticities (Fig. 4). This occurred mostly forchanges in T larger than the 20% used in Fig. 3a. Figure 4emphasizes that l can change nonlinearly as a vital ratechanges, so that the linear, proportional changes pre-dicted by elasticities of the mean matrix can be mislead-ing when the underlying relationships are nonlinear andchanges in vital rates are realistically large in size.
We next extended the question of accuracy of quanti-tative predictions of population growth changes to morethan one rate changing simultaneously, as would be thecase with conservation management or any inclusion ofenvironmental variability. If two rates change by thesame proportional amount (20%), the predicted propor-tional change in l is obtained by adding or subtractingelasticities of the mean matrix according to whether vi-tal rates are altered up or down (Silvertown et al. 1993;van Groenendael et al. 1994), and the actual change isagain calculated from (lmodified matrix 2 lmean matrix)/(lmean
matrix). As an example, if adult survival and juvenile sur-vival were both decreased by 20%, the expected propor-tional change in growth rate (from elasticities of themean matrix in Table 1) would be (20.395 2 0.359) 520.754, whereas the actual proportional change wouldbe (0.686 2 0.81)/0.81 5 20.153. Although in this casesummed elasticities did not precisely reflect the actualchange in population growth rate, the qualitative predic-tions were still quite good (Fig. 5a).
Predicting Changes in Population Growth when Vital Rates Change by Different Amounts
We again considered all combinations of two vital rateschanging simultaneously, but in this case the rates changed
Table 1. Definitions of vital rates and their associated elasticities for a hypothetical declining population (l 5 0.81).
Vital rate description Mean vital rateVital rate elasticity given
the mean matrix 620% of meanaHypothetical range
of variationb
sa 5 adult survival 0.5 0.395 0.4–0.6 0.4–0.7sj 5 juvenile survival 0.3 0.359 0.24–0.36 0.20–0.35T 5 mean time spent as juveniles 7 20.226 5.6–8.4 3.5–10.0F 5 production of 1 year olds 4 0.245 3.2–4.8 2.0–6.0aValues used for large but proportionately equal changes to vital rates.bValues used to represent “natural” minimum and maximum values for each vital rate. As is likely to be the case in field studies, the mean doesnot necessarily fall in the middle between the high and low values.

820 Predicting Populaton Growth Mills et al.
Conservation BiologyVolume 13, No. 4, August 1999
not by the same amount but to the minimum and maxi-mum found in “nature” for our hypothetical species (Ta-ble 1). Thus, we emulated the common case in whichpredictions of change in future growth rates are madeon the basis of elasticities from the mean matrix, despitethe fact that different vital rates change by differentamounts due to life-history or logistical and political fea-
sibility constraints. In this case, elasticities can be quitemisleading (Fig. 6a). In fact, in several cases the predic-tions from the summed elasticities were positive, pre-dicting an increase in l if certain rates were changed,but the actual change in growth rate was negative; thereverse also occurred (Fig. 6a). Thus, not only was therequantitative disparity in predicted and actual changes
Figure 2. Effect of changes in one vital rate on the rankings of the two highest ranked elasticities calculated from the mean matrix. The vital rate on the x-axis is the one whose variation resulted in the greatest change in relative values of the two largest elasticities. Data used for calculations are (a) hypothetical example; (b) Prairie Chicken; (c) desert tortoise; (d) killer whale.

Conservation BiologyVolume 13, No. 4, August 1999
Mills et al. Predicting Populaton Growth 821
in growth rates, but the actual direction of predictedpopulation change—the qualitative prediction—couldbe wrong.
Can this problem be solved by incorporating knowl-edge of the limits of change into elasticity predictions?We consider LTRE-type approaches (Caswell 1989b;Brault & Caswell 1993; van Tienderen 1995; Horvitz etal. 1997; Ehrlén & van Groenendael 1998) as a best-casescenario in which not only elasticities but also thechange in rates are known. For all combinations of two
rates changing to their highs and lows, we plotted theactual proportional change in growth rate versus thepredicted proportional change under LTRE: (elasticity ofmean rate)(proportional change in that rate) summedfor the altered two rates. We called these the LTREgraphs (Fig. 7) and noted that this is analogous to anLTRE approach that multiplies the sensitivity of meanrates times the absolute change in the rate (Ehrlén & vanGroenendael 1998). To give a numerical example for thecase of adult and juvenile survival going from their mean
Figure 3. Relationship between predicted proportional change in growth rate (based on elasticity of each vital rate in the mean matrix) and actual change when each vital rate was changed one at a time by relatively large but pro-portionally equal amounts. Predicted changes in growth rate (elasticities) on the x-axis are symmetrical around zero according to whether the vital rate is increased or decreased; when the change would exceed biological limits (0 or 1 for survival, for example), that point was deleted. Data and extent of perturbation are (a) hypothetical ex-ample (620%); (b) Prairie Chicken (620%); (c) desert tortoise (620%); (d) killer whale (60.5%; see text).

822 Predicting Populaton Growth Mills et al.
Conservation BiologyVolume 13, No. 4, August 1999
values to their minimum (a change of 0.1 in this case; Ta-ble 1), the predicted proportional change would be(20.395)(0.1)/0.5) 1 (20.359)(0.1)/(0.3) 5 20.199. Theactual proportional change would be (0.643 2 0.81)/0.81 5 20.206. In the LTRE comparison for the hypo-thetical data, the predictions were qualitatively cor-rect—and much better than for the simple elasticity pre-diction—with some imperfect fit between predictedand actual proportional change in l but only two predic-tions that were wrong in sign (Fig. 7a).
For this hypothetical example, both the ranking andthe qualitative predictions of elasticities alone hold uprather well, giving roughly accurate estimates of mostpopulation changes in the face of variation and simulta-neous changes. It is also clear, however, that whether ornot elasticity analysis produces qualitatively correct in-sights into population growth in the hypothetical exam-ple depends on how much vital rates change. If usersmake predictions of growth without accounting for therange of variation (Fig. 6a), the predictions can be sub-stantially wrong. If the user is lucky enough to know therange of variation and takes steps to incorporate it intothe predictions (Fig. 7a), the predictions improve con-siderably. Given these conflicting possibilities for theutility of analytical sensitivity analysis, it is important toextend the examination to actual case histories.
Analytical Elasticity Analysis for Three Vertebrate Species
To extend the analysis of limitations of elasticity analysisbeyond the hypothetical example, we addressed howwell elasticities predict the effect of demographic pertur-bations on the matrix growth rate using data from threefield studies that span a range of vertebrate life histories:Prairie Chicken (Tympanuchus cupido), desert tortoise(Gopherus agassizii), and killer whale (Orcinus orca).We reevaluated the performance of elasticity in thesecases under conditions typically used in conservation ap-plications, whereby a single matrix is constructed frommean or “best guess” vital rates and inferences based onthat matrix are assumed to be robust to the sometimeslarge and/or concurrent changes in vital rates. As in thehypothetical example, we considered changes to underly-ing vital rates and not to matrix elements. This allowed usto examine, in a practical setting, the importance of eachof the three main questions identified above. Mean vitalrates, as well as reasonable upper and lower bounds forvital rates, were extracted from published matrix analysesof field data (Appendix). For each set of empirical data,we changed vital rates using the same approaches out-lined for the hypothetical example (Fig. 1).
To address the question of the stability of elasticityrankings with changes in vital rates, we varied the valuesfor each vital rate across its observed range (Appendix).As a worst-case scenario, we report only the case thatled to the biggest change in the rankings of the twohighest elasticities for each species. For the secondquestion, the accuracy of predicted changes in l as vitalrates change by equal but large amounts, we changedeach vital rate one at a time to 620% of the mean (or tothe specified biological limits for that species) and weevaluated the relationship between the predicted pro-portional change in population growth (determinedfrom the elasticity in the mean matrix) and the actualproportional change in l following the change in that vi-tal rate. The effects of simultaneous changes in the tworates were evaluated, as in the hypothetical example, bychanging all rates two at a time 620% and comparingthe expected additive proportional change in l (fromsummed elasticities of the mean matrix) to the actualchange (lmodified matrix 2 lmean matrix)/(lmean matrix). Fi-nally, to evaluate the effects of different ranges of varia-tion in different vital rates, we used changed combina-tions of two rates but allowed vital rates to vary to themaximum or minimum observed in nature for each spe-cies (Appendix). Again, we plotted the actual propor-tional change in growth rate in separate graphs againstpredicted growth rates based on either summed elastici-ties of the two rates altered to their high or low values(Fig. 6) or the summed elasticities weighted by the pro-portional change in the rate (Fig. 7; the LTRE scenario).
Figure 4. A demonstration of nonlinearities between l and changes in one vital rate ( T 5 mean time spent as juveniles) for the hypothetical example. A linear change in l (as assumed by elasticity analysis) is shown for comparison. The values of T used in Fig. 3a (620% of the mean) are shown by an asterisk, indi-cating that nonlinearities would more substantially decrease the good fit shown in Fig. 3a if changes were .20%.
Conservation BiologyVolume 13, No. 4, August 1999
Mills et al. Predicting Populaton Growth 823
Prairie Chicken
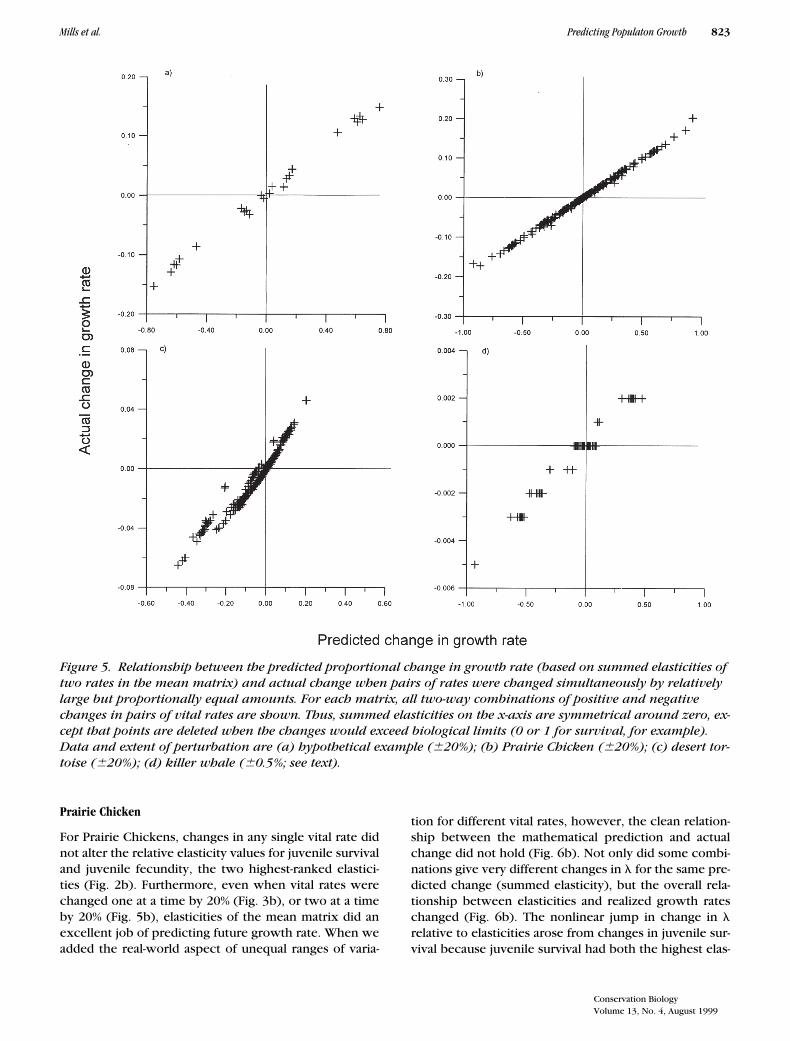
For Prairie Chickens, changes in any single vital rate didnot alter the relative elasticity values for juvenile survivaland juvenile fecundity, the two highest-ranked elastici-ties (Fig. 2b). Furthermore, even when vital rates werechanged one at a time by 20% (Fig. 3b), or two at a timeby 20% (Fig. 5b), elasticities of the mean matrix did anexcellent job of predicting future growth rate. When weadded the real-world aspect of unequal ranges of varia-
tion for different vital rates, however, the clean relation-ship between the mathematical prediction and actualchange did not hold (Fig. 6b). Not only did some combi-nations give very different changes in l for the same pre-dicted change (summed elasticity), but the overall rela-tionship between elasticities and realized growth rateschanged (Fig. 6b). The nonlinear jump in change in lrelative to elasticities arose from changes in juvenile sur-vival because juvenile survival had both the highest elas-
Figure 5. Relationship between the predicted proportional change in growth rate (based on summed elasticities of two rates in the mean matrix) and actual change when pairs of rates were changed simultaneously by relatively large but proportionally equal amounts. For each matrix, all two-way combinations of positive and negative changes in pairs of vital rates are shown. Thus, summed elasticities on the x-axis are symmetrical around zero, ex-cept that points are deleted when the changes would exceed biological limits (0 or 1 for survival, for example). Data and extent of perturbation are (a) hypothetical example (620%); (b) Prairie Chicken (620%); (c) desert tor-toise (620%); (d) killer whale (60.5%; see text).

824 Predicting Populaton Growth Mills et al.
Conservation BiologyVolume 13, No. 4, August 1999
ticity and the widest range of variation. When the rangesof different vital rates were incorporated by the LTREapproach, combining elasticities with range of variation,the actual change in growth rate was much closer tothat expected (Fig. 7b).
Desert Tortoise
Elasticity metrics based on the mean matrix were moreproblematic for the desert tortoise. Changes across a real-istic range of variation in the transition from class 6 to class7 almost changed the ranking of the two highest elastici-
ties (Fig. 2c). Changes in growth rate correspondedclosely to elasticity predictions when single rates changedby 20% (Fig. 3c), and proportionally equal changes in anytwo rates also retained a fairly predictable relationshipbetween summed elasticities and proportional change inl (Fig. 5c). There were instances, however, in whichchanges in vital rates with nearly equal combined elastici-ties resulted in quite different proportional changes in l(Fig. 5c). This became more striking when simultaneouschanges occurred across the unequal ranges of variationfor different vital rates (Fig. 6c). Many changes led to qual-itatively wrong predictions, whereby the summed elastic-
Figure 6. Relationship between predicted proportional change in growth rate (based on summed elasticities of two rates in the mean matrix) and actual change when pairs of rates were changed simultaneously to the minimum or maximum found in nature. Data are for (a) hypothetical example; (b) Prairie Chicken; (c) desert tortoise; (d) killer whale.

Conservation BiologyVolume 13, No. 4, August 1999
Mills et al. Predicting Populaton Growth 825
ities predicted increases (or decreases) in l, yet the actualchange was the opposite. In fact, the sign of the expectedchange in l was incorrectly predicted in 15% of the cases.The cluster of points with strongly negative changes in l(,20.08) in Fig. 6c contains vital rates for growth ofstage 2 or stage 3, both of which have moderate elasticityvalues and large ranges of variation (.100% difference be-tween the mean and the maximum or minimum). Thus,the pairing of a large range of variation with a relativelylarge elasticity gave stages 2 and 3 unexpectedly largenegative effects on population growth. When range of
variation was explicitly incorporated into the elasticityanalysis (LTRE scenario), scatter was reduced but somecombinations of changes still led to qualitatively wrongpredictions (Fig. 7c).
Killer Whales
The two highest elasticity values (survival for stage 3[S3] and stage 2 [S2]) converged as the probability ofmaturing from stage 3 to stage 4 [G3] increased, but thetiny range for G3 limited the crossover potential (Fig.
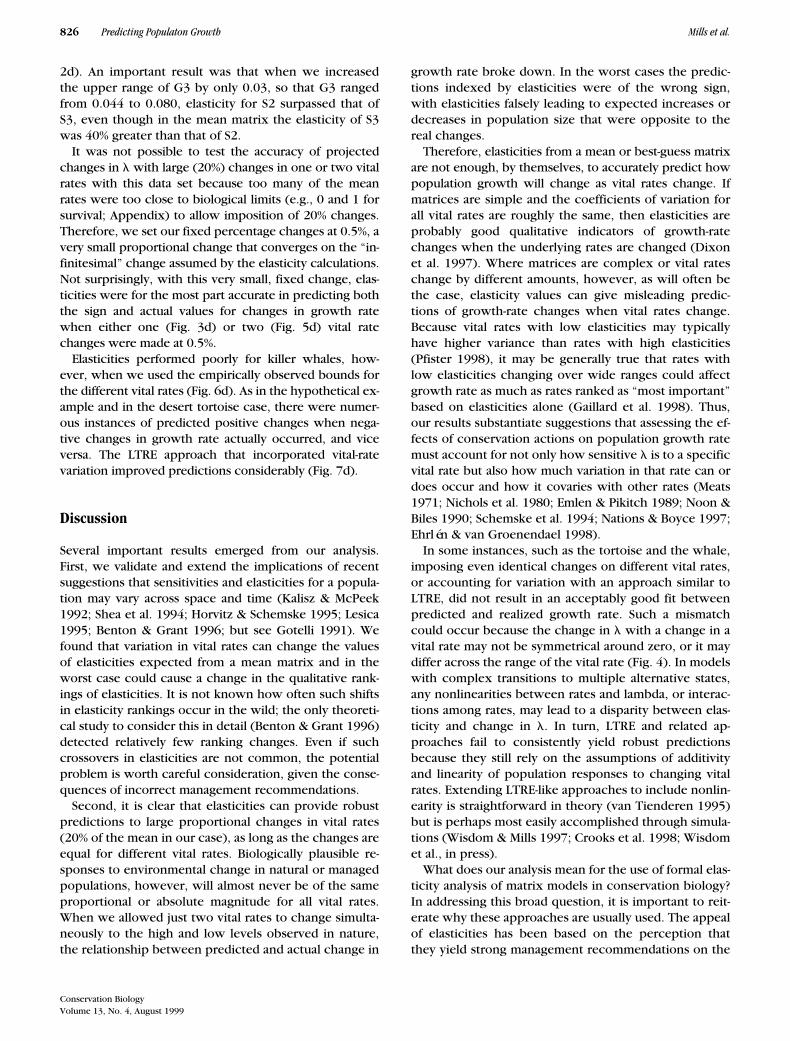
Figure 7. Relationship between predicted proportional change in growth rate (based on LTRE approach) and ac-tual change when pairs of rates were changed simultaneously to the maximum or minimum value observed in nature. Data are for (a) hypothetical example; (b) Prairie Chicken; (c) desert tortoise; (d) killer whale.
826 Predicting Populaton Growth Mills et al.
Conservation BiologyVolume 13, No. 4, August 1999
2d). An important result was that when we increasedthe upper range of G3 by only 0.03, so that G3 rangedfrom 0.044 to 0.080, elasticity for S2 surpassed that ofS3, even though in the mean matrix the elasticity of S3was 40% greater than that of S2.
It was not possible to test the accuracy of projectedchanges in l with large (20%) changes in one or two vitalrates with this data set because too many of the meanrates were too close to biological limits (e.g., 0 and 1 forsurvival; Appendix) to allow imposition of 20% changes.Therefore, we set our fixed percentage changes at 0.5%, avery small proportional change that converges on the “in-finitesimal” change assumed by the elasticity calculations.Not surprisingly, with this very small, fixed change, elas-ticities were for the most part accurate in predicting boththe sign and actual values for changes in growth ratewhen either one (Fig. 3d) or two (Fig. 5d) vital ratechanges were made at 0.5%.
Elasticities performed poorly for killer whales, how-ever, when we used the empirically observed bounds forthe different vital rates (Fig. 6d). As in the hypothetical ex-ample and in the desert tortoise case, there were numer-ous instances of predicted positive changes when nega-tive changes in growth rate actually occurred, and viceversa. The LTRE approach that incorporated vital-ratevariation improved predictions considerably (Fig. 7d).
Discussion
Several important results emerged from our analysis.First, we validate and extend the implications of recentsuggestions that sensitivities and elasticities for a popula-tion may vary across space and time (Kalisz & McPeek1992; Shea et al. 1994; Horvitz & Schemske 1995; Lesica1995; Benton & Grant 1996; but see Gotelli 1991). Wefound that variation in vital rates can change the valuesof elasticities expected from a mean matrix and in theworst case could cause a change in the qualitative rank-ings of elasticities. It is not known how often such shiftsin elasticity rankings occur in the wild; the only theoreti-cal study to consider this in detail (Benton & Grant 1996)detected relatively few ranking changes. Even if suchcrossovers in elasticities are not common, the potentialproblem is worth careful consideration, given the conse-quences of incorrect management recommendations.
Second, it is clear that elasticities can provide robustpredictions to large proportional changes in vital rates(20% of the mean in our case), as long as the changes areequal for different vital rates. Biologically plausible re-sponses to environmental change in natural or managedpopulations, however, will almost never be of the sameproportional or absolute magnitude for all vital rates.When we allowed just two vital rates to change simulta-neously to the high and low levels observed in nature,the relationship between predicted and actual change in
growth rate broke down. In the worst cases the predic-tions indexed by elasticities were of the wrong sign,with elasticities falsely leading to expected increases ordecreases in population size that were opposite to thereal changes.
Therefore, elasticities from a mean or best-guess matrixare not enough, by themselves, to accurately predict howpopulation growth will change as vital rates change. Ifmatrices are simple and the coefficients of variation forall vital rates are roughly the same, then elasticities areprobably good qualitative indicators of growth-ratechanges when the underlying rates are changed (Dixonet al. 1997). Where matrices are complex or vital rateschange by different amounts, however, as will often bethe case, elasticity values can give misleading predic-tions of growth-rate changes when vital rates change.Because vital rates with low elasticities may typicallyhave higher variance than rates with high elasticities(Pfister 1998), it may be generally true that rates withlow elasticities changing over wide ranges could affectgrowth rate as much as rates ranked as “most important”based on elasticities alone (Gaillard et al. 1998). Thus,our results substantiate suggestions that assessing the ef-fects of conservation actions on population growth ratemust account for not only how sensitive l is to a specificvital rate but also how much variation in that rate can ordoes occur and how it covaries with other rates (Meats1971; Nichols et al. 1980; Emlen & Pikitch 1989; Noon &Biles 1990; Schemske et al. 1994; Nations & Boyce 1997;Ehrlén & van Groenendael 1998).
In some instances, such as the tortoise and the whale,imposing even identical changes on different vital rates,or accounting for variation with an approach similar toLTRE, did not result in an acceptably good fit betweenpredicted and realized growth rate. Such a mismatchcould occur because the change in l with a change in avital rate may not be symmetrical around zero, or it maydiffer across the range of the vital rate (Fig. 4). In modelswith complex transitions to multiple alternative states,any nonlinearities between rates and lambda, or interac-tions among rates, may lead to a disparity between elas-ticity and change in l. In turn, LTRE and related ap-proaches fail to consistently yield robust predictionsbecause they still rely on the assumptions of additivityand linearity of population responses to changing vitalrates. Extending LTRE-like approaches to include nonlin-earity is straightforward in theory (van Tienderen 1995)but is perhaps most easily accomplished through simula-tions (Wisdom & Mills 1997; Crooks et al. 1998; Wisdomet al., in press).
What does our analysis mean for the use of formal elas-ticity analysis of matrix models in conservation biology?In addressing this broad question, it is important to reit-erate why these approaches are usually used. The appealof elasticities has been based on the perception thatthey yield strong management recommendations on the

Conservation BiologyVolume 13, No. 4, August 1999
Mills et al. Predicting Populaton Growth 827
relative importance of different demographic rates withminimal data requirements. Management priorities arethen ranked based on an assumption that elasticities pro-vide a robust and consistent index of life-stage impor-tance. Our results call for caution in such use of elastici-ties: certain changes may alter the relative elasticities ascalculated from a mean matrix, and, if the relativeamount of change in each rate is not specified, elastici-ties can give inaccurate predictions of the response of l.
In an attempt to clarify the appropriate use of elastici-ties, Horvitz et al. (1997) distinguished between pro-spective and retrospective analyses, defining prospec-tive analysis as an evaluation of life-stage importancethat addresses the potential effects of future changes invital rates on population growth. Horvitz et al. (1997)identified elasticity analysis as a prospective techniquebecause perturbations to vital rates are hypothetical anddo not address past effects of empirical or experimen-tally induced variation. By contrast, they defined retro-spective analysis as an evaluation of life-stage impor-tance that measures the response of population growthto observed variation and covariation in vital rates, suchas is done under LTREs.
These definitions of prospective versus retrospectiveanalyses further emphasize the severe limitations of elas-ticities as a “stand-alone” measure of life-stage impor-tance in an applied setting. If, in fact, elasticities are ac-curate only under a very constrained scenario (i.e., withequal and small levels of variation, occurring one rate ata time), then they offer little advantage over simply cal-culating the actual growth rates predicted by each alteredmatrix. If data on variation are available (Nichols et al.1992), an alternative approach may be to simply calculateexpected changes in growth rate or extinction probabil-ity using simulations that include the distribution andrange of variation and any known correlations among vi-tal rates (McCarthy et al. 1995; Ferrière et al. 1996). Forexample, Wisdom and Mills (1997) describe a simula-tion-based procedure to examine how frequently therankings of elasticities change when vital rates fluctuatewithin reasonable bounds of field data. If certain vitalrates always have the highest elasticity across the range ofvital rates simulated, then confidence in the relative “qual-itative importance” for different vital rates increases. Sucha simulation approach goes beyond the strict use of elas-ticities by directly calculating l for a wide range of possi-ble matrices associated with a given population and evalu-ating how much variation in growth rate is accounted forby variation in each vital rate (Wisdom et al., in press). Tothe extent that covariation or correlations between ratesare known (van Tienderen 1995), moreover, these couldalso be incorporated into a simulation-based approach.
One difficulty with any of these analytical or simulation-based methods is the need to use estimated ranges of vitalrates to infer the biological range for each rate. Wide con-fidence limits can be generated by poor data or by real
variation. Conversely, a limited range of conditions duringsampling may not accurately reflect the possible scopefor a rate. Furthermore, ranking the “importance” of vitalrates by means of any of these matrix-based tools does notaccount for the many complexities of nature that could al-ter the effects of vital rates on population growth (such asdensity dependence or deviation from stable age distribu-tion) nor does it indicate the factors causing populationdecline (Beissinger & Westphal 1998) or incorporate fac-tors such as the logistics or politics of modifying differentrates (Goodman 1980; Nichols et al. 1980; Silvertown et al.1996; Citta & Mills 1999). Any of these complications musttherefore be explicitly examined during the process ofevaluating and interpreting the results of a matrix analysis.
Finally, although elasticities may give misleading infor-mation over realistic ranges of changes in vital rates, weare not dismissing all uses of this elegant technique. Ourpurpose is to present an evaluation of the somewhat ob-vious, often overlooked, and seldom carefully analyzedlimitations to the interpretations of formal sensitivityanalysis in applied contexts (Silvertown et al. 1996).Such complications are to be expected in the use of eco-logical tools to address applied questions (e.g., Doak &Mills 1994; Royama 1996). Elasticity values are surpris-ingly robust under some circumstances and can be a use-ful first step in establishing qualitative guides to popula-tion dynamics. Nevertheless, they can also give quitemisleading results if interpreted without a clear under-standing of their assumptions and limitations.
Acknowledgments
We appreciate comments on versions of the manuscriptfrom S. Beissinger, J. Citta, H. de Kroon, J. Emlen, K. Lair, P.Lesica, S. Louda, B. Morris, J. D. Nichols, B. Noon, C. Pfis-ter, M. Schwartz, and D. Tallmon. The software used forthese analyses (“Elas13”) is available from the authors. Par-tial support for this work came from a National ScienceFoundation (NSF) grant DEB-9424566 to D.F.D., U.S. ForestService funding to M. J. W., and grants from NSF MontanaEPSCOR Program (291835), the Boone and Crockett Club,and the National Resources Institute Competitive GrantProgram/U.S. Department of Agriculture (97-35101-4355)to L.S.M. This is a contribution of the Montana Forest andConservation Experiment Station.
Literature Cited
Beissinger, S. R., and M. I. Westphal. 1998. On the use of demographicmodels of population viability in endangered species management.Journal of Wildlife Management 62:821–841.
Benton, T. G., and A. Grant. 1996. How to keep fit in the real world:elasticity analyses and selection pressures on life histories in a vari-able environment. American Naturalist 147:115–139.
Brault, S., and H. Caswell. 1993. Pod-specific demography of killerwhales (Orcinus orca). Ecology 74:1444–1454.

828 Predicting Populaton Growth Mills et al.
Conservation BiologyVolume 13, No. 4, August 1999
Burgman, M. A., S. Ferson, and H. R. Akçakaya. 1996. Risk assessmentin conservation biology. Chapman and Hall, New York.
Caswell, H. 1978. A general formula for the sensitivity of populationgrowth rate to changes in life history parameters. Theoretical Pop-ulation Biology 14:215–230.
Caswell, H. 1989a. Matrix population models. Sinauer Publishers, Sun-derland, Massachusetts.
Caswell, H. 1989b. Analysis of life table response experiments I. De-composition of effects on population growth rate. Ecological Mod-elling 46:221–237.
Caswell, H. 1996. Second derivatives of population growth rate: calcu-lation and applications. Ecology 77:870–879.
Citta, J. J., and L. S. Mills. 1999. What do demographic sensitivity analy-ses tell us about brown-headed cowbirds. Studies in Avian Biology.180:121–134.
Crooks, K. R., M. A. Sanjayan, and D. F. Doak. 1998. New insights oncheetah conservation through demographic modeling. Conserva-tion Biology 12:889–895.
Crouse, D. T., L. B. Crowder, and H. Caswell. 1987. A stage-based pop-ulation model for loggerhead sea turtles and implications for con-servation. Ecology 68:1412–1423.
Crowder, L. B., D. T. Crouse, S. S. Heppell, and T. H. Martin. 1994. Pre-dicting the impact of turtle excluder devices on loggerhead sea tur-tle populations. Ecological Applications 4:437–445.
de Kroon, H., A. Plaisier, J. van Groenendael, and H. Caswell. 1986.Elasticity: the relative contribution of demographic parameters topopulation growth rate. Ecology 67:1427–1431.
de Matos, M. B., and D. M. Silva Matos. 1998. Mathematical constraintson transition matrix elasticity analysis. Journal of Ecology 86:706–708.
Dixon, P., N. Friday, P. Ang, S. Heppell, and M. Kshatriya. 1997. Sensi-tivity analysis of structured-population models for management andconservation. Pages 471–513 in S. Tuljapurkar and H. Caswell, edi-tors. Structured-population models in marine, terrestrial, and fresh-water systems. Chapman and Hall, New York.
Doak, D. F., and L. S. Mills. 1994. A useful role for theory in conserva-tion. Ecology 75:615–626.
Doak, D. F., P. Kareiva, and B. Klepetka. 1994. Modeling population vi-ability for the desert tortoise in the western Mojave Desert. Ecolog-ical Applications 4:446–460.
Ehrlén, J., and J. van Groenendael. 1998. Direct perturbation analysisfor better conservation. Conservation Biology 12:470–474.
Emlen, J. M., and E. K. Pikitch. 1989. Animal population dynamics: iden-tification of critical components. Ecological Modelling 44:253–273.
Escos, J., C. L. Alados, and J. M. Emlen. 1994. Application of the stage-projection model with density-dependent fecundity to the popula-tion dynamics of Spanish Ibex. Canadian Journal of Zoology 72:731–737.
Ferrière, R., F. Sarrazin, S. Legendre, and J.-P. Baron. 1996. Matrix popu-lation models applied to viability analysis and conservation: theoryand practice using the ULM software. Acta Oecologica 17:629–656.
Gaillard, J.-M., M. Festa-Bianchet, and N. G. Yoccoz. 1998. Populationdynamics of large herbivores: variable recruitment with constantadult survival. Trends in Ecology and Evolution 13:58–63.
Goodman, D. 1980. Demographic intervention for closely managed pop-ulations. Pages 171–195 in M. E. Soulé and B. Wilcox, editors. Con-servation biology: an evolutionary-ecological perspective. Sinauer,Sunderland, Massachusetts.
Gotelli, N. J. 1991. Demographic models for Leptogorgia virgulata, ashallow-water gorgonian. Ecology 72:457–467.
Heppell, S. S., J. R. Walters, and L. B. Crowder. 1994. Evaluating man-agement alternatives for Red-cockaded Woodpeckers: a modelingapproach. Journal of Wildlife Management 58:479–487.
Horvitz, C. C., and D. W. Schemske. 1995. Spatiotemporal variation indemographic transitions of a tropical understory herb: projectionmatrix analysis. Ecological Monograph 65:155–192.
Horvitz, C. S., D. W. Schemske, and H. Caswell. 1997. The relative “im-
portance” of life-history stages to population growth: prospectiveand retrospective analyses. Pages 247–272 in S. Tuljapurkar and H.Caswell, editors. Structured-population models in marine, terres-trial, and freshwater systems. Chapman and Hall, New York.
Jenkins, S. H. 1988. Use and abuse of demographic models of populationgrowth. Bulletin of the Ecological Society of America 69:201–207.
Kalisz, S., and M. A. McPeek. 1992. Demography of an age-structuredannual: resampled projection matrices, elasticity analyses, and seedbank effects. Ecology 73:1082–1093.
Lesica, P. 1995. Demography of Astragalus scaphoides and effects ofherbivory on population growth. Great Basin Naturalist 55:142–150.
Maguire, L. A., G. F. Wilhere, and Q. Dong. 1995. Population viabilityanalysis for Red-cockaded Woodpeckers in the Georgia Piedmont.Journal of Wildlife Management 59:533–542.
Marschall, E. A., and L. B. Crowder. 1996. Assessing population re-sponses to multiple anthropogenic effects: a case study with brooktrout. Ecological Applications 6:152–167.
McCarthy, M. A., M. A. Burgman, and S. Ferson. 1995. Sensitivity analy-sis for models of population viability. Biological Conservation 73:93–100.
Meats, A. 1971. The relative importance to population increase of fluc-tuations in mortality, fecundity and the time variables of the repro-ductive schedule. Oecologia 6:223–237.
Mesterton-Gibbons, M. 1993. Why demographic elasticities sum toone: a postscript to de Kroon et al. Ecology 74:2467–2468.
Nations, C. S., and M. S. Boyce. 1997. Stochastic demography for con-servation biology. Pages 451–470 in S. Tuljapurkar and H. Caswell,editors. Structured-population models in marine, terrestrial, andfreshwater systems. Chapman and Hall, New York.
Nichols, J. D., G. L. Hensler, and P. W. Sykes Jr. 1980. Demography ofthe everglade kite: implications for population management. Eco-logical Modelling 9:215–232.
Nichols, J. D., J. R. Sauer, K. H. Pollock, and J. B. Hestbeck. 1992. Esti-mating transition probabilities for stage-based population projec-tion matrices using capture-recapture data. Ecology 73:306–312.
Noon, B. R., and C. M. Biles. 1990. Mathematical demography of Spot-ted Owls in the Pacific Northwest. Journal of Wildlife Management54:18–27.
Olmsted, I., and E. R. Alvarez-Buylla. 1995. Sustainable harvesting oftropical trees: demography and matrix models of two palm speciesin Mexico. Ecological Applications 5:484–500.
Pfister, C. A. 1998. Patterns of variance in stage-structured popula-tions: evolutionary predictions and ecological implications. Pro-ceedings of the National Academy of Sciences 95:213–218.
Ratsirarson, J., J. A. Silander Jr., and A. F. Richard. 1996. Conservationand management of a threatened Madagascar palm species,Neodypsis decaryi, Jumelle. Conservation Biology 10:40–52.
Royama, T. 1996. A fundamental problem in key factor analysis. Ecol-ogy 77:87–93.
Schemske, D. W., B. C. Husband, M. H. Ruckelshaus, C. Goodwillie,I. M. Parker, and J. G. Bishop. 1994. Evaluating approaches to theconservation of rare and endangered plants. Ecology 75:584–606.
Shea, K., M. Rees, and S. N. Wood. 1994. Trade-offs, elasticities, andthe comparative method. Journal of Ecology 82:951–957.
Silvertown, J., M. Franco, I. Pisanty, and A. Mendoza. 1993. Compara-tive plant demography: relative importance of life-cycle compo-nents to the finite rate of increase in woody and herbaceous peren-nials. Journal of Ecology 81:465–476.
Silvertown, J., M. Franco, and E. Menges. 1996. Interpretation of elas-ticity matrices as an aid to the management of plant populations forconservation. Conservation Biology 10:591–597.
van Groenendael, J., H. de Kroon, S. Kalisz, and S. Tuljapurkar. 1994.Loop analysis: evaluating life history pathways in population pro-jection matrices. Ecology 75:2410–2415.
van Tienderen, P. H. 1995. Life cycle trade-offs in matrix populationmodels. Ecology 76:2482–2489.

Conservation BiologyVolume 13, No. 4, August 1999
Mills et al. Predicting Populaton Growth 829
Wisdom, M. J., and L. S. Mills. 1997. Using sensitivity analysis to guidepopulation recovery: Prairie-Chickens as an example. Journal ofWildlife Management 61:302–312.
Wisdom, M. J., L. S. Mills, and D. F. Doak. 1999. Life-stage simulationanalysis: estimating vital rate effects on population growth for spe-cies conservation. Ecology. In press.
Wootton, J. T., and D. A. Bell. 1992. A metapopulation model for thePeregrine Falcon in California: viability and management strategies.Ecological Applications 2:307–321.
Appendix: Sources of Vital Rates forMatrix Examples
Prairie Chicken (Tympanuchus cupido)
Estimates for Prairie Chicken demography came from Wisdom andMills (1997; see Tables 1 and 2). Vital rates for eight age classes wereparameterized into a Leslie Matrix under a post-birth pulse formulation(Caswell 1989a). Mean vital-rate estimates follow (age classes are 1–8,survival and reproduction respectively follow age class, and numbersin parentheses are lower and upper limits recorded in published stud-ies [Wisdom & Mills 1997]): 1, 0.158 (0.012–0.304), 3.858 (2.8028–4.914); 2, 0.445 (0.38–0.51), 6.905 (5.96–7.85); 3, 0.51 (0.45–0.57),6.905 (5.96–7.85); 4, 0.42 (0.38–0.46), 6.905 (5.96–7.85); 5, 0.34(0.24–0.44), 6.905 (5.96–7.85); 6, 0.345 (0.24–0.45), 6.905 (5.96–7.85); 7, 0.17 (0.00–0.34), 6.905 (5.96–7.85); 8, 0.145 (0.00–0.29),6.905 (5.96–7.85).
Wisdom and Mills (1997) use the following notation for these ageclasses: survival of the first age class is S0 (age-zero survival), secondage class is S1, and so on. Reproduction of the first age class, post-birthpulse, is R1, second age class is R2, and so on. This notation is in keep-ing with that for a post-birth pulse matrix model.
Desert Tortoise (Gopherus agassizii )
Our estimates of vital rates for desert tortoises came from Doak et al.(1994). For growth and survival we used the means provided in theirTable 3, and we used the standard deviations listed there to calculatestandard errors and thus the 95% confidence limits around the means(61.96 SE). We used these limits as our high and low parameter esti-mates for growth and survival. Some lower growth rates calculated inthis way were negative, so we set these lower rates equal to 0.001.
We treated reproduction somewhat differently. Doak et al. (1994)provided four estimates for each reproductive rate. We used their lowand high estimates as our low and high values. To have a mean esti-mate, we calculated the simple mean of the four values provided foreach reproductive rate. This mean value was not the same as the onein Doak et al. (1994); so our mean matrix provides somewhat differentresults than shown in their work.
In matrix construction, we followed Doak et al. (1994; Table 5), witheight size classes (Table 2) and with the elements for continued pres-ence in class x equal to sx(1 2 gx) and the probability of making a tran-sition to a larger class equal to sxgx. Reproductive elements in the firstrow are equal to reproductive rates because these rates are calculatedas the production of surviving yearling tortoises. Although Doak et al.(1994) denote the eight size classes as 0–7, in this as in our other exam-ples we begin numbering classes at 1 and thus refer to classes 1–8.
Mean vital rate estimates follow (age classes are 1–8; survival,growth, and reproduction respectively follow age class; and numbersin parentheses are lower and upper limits recorded in Doak et al.[1994]): 1, 0.716 (0.555–0.877); 2, 0.716 (0.555–0.877), 0.208 (0.001–0.422); 3, 0.716 (0.555–0.877), 0.208 (0.001–0.422); 4, 0.839 (0.717–0.961), 0.280 (0.187–0.373); 5, 0.785 (0.683–0.887), 0.287 (0.117–0.458); 6, 0.927 (0.878–0.976), 0.269 (0.153–0.385), 0.996 (0.042–2.22); 7, 0.867 (0.778–0.956), 0.018 (0.001–0.035), 1.530 (0.069–3.38); 8, 0.860 (0.775–0.945), 1.927 (0.069–4.38).
Killer Whale (Orcinus orca)
We took estimates for orca demography from Brault and Caswell(1993). We followed these authors in matrix form and construction ofmatrix elements from the underlying vital rates that we varied (Brault& Caswell 1993).
To estimate means and ranges for vital rates, we first calculated themean and standard error for vital rates contributing to matrix ele-ments, using the sample of 18 pods listed in Brault and Caswell’s Ap-pendix and their equations (p. 1446). Thus, we first calculated thepod-specific vital rates and then determined their mean and SE values(we used a simple average and did not weight by within-pod samplesizes). As estimates of high and low values for each vital rate, we usedthe 95% confidence limits of the mean for each rate (61.96 SE). Twohigh survival rates calculated in this way were .1; we set these equalto 0.9999.
Because we used pod-specific means, our mean values are not iden-tical with those listed in Brault and Caswell (1993:1447) or those listedin van Tienderen (1995, his Table 1), which are mean values of all ani-mals surveyed, regardless of pod. (This is especially confusing in vanTienderen’s table because his means over all animals are followed bypod-specific standard deviations over pods). Our means, however, arequite close to those used by these authors.
In all, this matrix is based upon seven vital rates, as follows (themean is followed by the upper and lower limit): annual probability ofyearling survival, 0.9848 (0.9643–0.9999); annual probability of juve-nile survival, 0.9883 (0.9807–0.9958); annual probability of reproduc-tive adult survival, 0.9996 (0.9989–0.9999); annual probability of post-reproductive adult survival, 0.9817 (0.9756–0.9876); annual probabil-ity of maturation from class 2 to class 3, given survival, 0.0746(0.0723–0.0770); annual probability of maturation from class 3 to class4, given survival, 0.04726 (0.0437–0.0509); mean annual reproductiveoutput of reproductive females, 0.1186.
No variance estimate is provided for reproduction, so we treated itas a constant in the orca analyses.