Reliability Importance
26
37 Getting It Right Every Time Reliability and Its Importance Difficulty Index (Tougher than most) ☺☺ R eliability is pretty easy to figure out. It’s simply whether a test, or whatever you use as a measurement tool, measures something consistently. It’s all about the consistency of scores for the same set of people. If you administer a test of per- sonality before a special treatment occurs, will the administration of that same test 4 months later be reliable? Or, if you have two forms of the same test, will the results be comparable relative to the two different testings? Those, my friend, are some of the questions. Cindy Woods, in her dissertation work, demonstrated the impor- tance of interrater reliability (one of several kinds we will discuss in this chapter). She performed an analysis of 18 studies where she examined parent-child coercive interactions that involved parenting practices and punishment and the impact of those interactions on the development of boys’ aggression. Aggression, the primary vari- able of interest, was studied directly and indirectly, and interrater reliability was established using indirect or secondhand occur- rences. She found that unskilled parenting had the most significant effect on the later development of aggression in boys. Want to know more? Take a look at Woods, C. (2004). Unskilled parenting practices and their effect on the development of aggres- sion in boys: A meta-analysis of coercion theory based studies. Dissertation Abstracts International: Section B: The Sciences and Engineering, 64(11B), 5808. We’ll get to the various forms of reliability and how they are computed, but first a bit about how reliability works and why it is such a cool idea. 3 03-Salkind (Tests) 4749.qxd 7/5/2005 10:04 PM Page 37
-
Upload
isaac-ortega -
Category
Documents
-
view
567 -
download
0
description
Importancia de la Confiabilidad
Transcript of Reliability Importance
37
Getting It Right Every TimeReliability and Its Importance
Difficulty Index (Tougher than most) ☺☺
R eliability is pretty easy to figure out. It’s simply whether atest, or whatever you use as a measurement tool, measuressomething consistently. It’s all about the consistency of
scores for the same set of people. If you administer a test of per-sonality before a special treatment occurs, will the administrationof that same test 4 months later be reliable? Or, if you have twoforms of the same test, will the results be comparable relative to thetwo different testings? Those, my friend, are some of the questions.
Cindy Woods, in her dissertation work, demonstrated the impor-tance of interrater reliability (one of several kinds we will discuss inthis chapter). She performed an analysis of 18 studies where sheexamined parent-child coercive interactions that involved parentingpractices and punishment and the impact of those interactions onthe development of boys’ aggression. Aggression, the primary vari-able of interest, was studied directly and indirectly, and interraterreliability was established using indirect or secondhand occur-rences. She found that unskilled parenting had the most significanteffect on the later development of aggression in boys.
Want to know more? Take a look at Woods, C. (2004). Unskilledparenting practices and their effect on the development of aggres-sion in boys: A meta-analysis of coercion theory based studies.Dissertation Abstracts International: Section B: The Sciences andEngineering, 64(11B), 5808.
We’ll get to the various forms of reliability and how they arecomputed, but first a bit about how reliability works and why it issuch a cool idea.
3
03-Salkind (Tests) 4749.qxd 7/5/2005 10:04 PM Page 37
Why aren’t true and error scores equal to one another? Well,they would be if the test (and the resulting observed score) is a per-fect (and we mean absolutely perfect) reflection of what’s beingmeasured, time after time after time.
But the Yankees don’t always win, the bread mostly falls on thebuttered side, and Murphy’s Law tells us that the world is not yet per-fect. So, what you see as an observed score may come close to thetrue score, but rarely (almost never) are they the same. Rather, thedifference as you see here is in the amount of error that is introduced.
TEST SCORES: TRUTH OR DARE
What really is so cool about the whole notion of reliability is thatit is based on the separation of the different components of whatmakes up any test score. When you take a test in this class, youmay get a score such as 89 (good for you) or 65 (back to thebooks!). That test score consists of several different elements: theobserved score (or what you actually get on the test, such as 89 or65); a true score (the true, 100% accurate reflection of what youreally know); and an error score, or that which accounts forday-to-day differences between the true and error score. We can’tdirectly measure true score because it is a theoretical reflection ofthe actual amount of the trait or characteristic possessed by theindividual. But it’s a terrific idea nonetheless and the cornerstoneof understanding reliability.
Nothing about this tests and measurements stuff is clear cut, and thistrue score stuff surely qualifies. Here’s why. We just defined true scoreas an accurate reflection of whatever is being measured, independentof any error. So far, so good. But there’s another point of view as well.Some psychometricians (the people who do tests and measurementsfor a living) believe that true score has nothing to do with whether theconstruct of interest is really being reflected. Rather, true score is theaverage score an individual would get if he or she took a test an infi-nite number of times, and it represents the theoretical typical level ofperformance on a given test. Now, one would hope that the typicallevel of performance would reflect the construct of interest, but that’sanother question (one about validity, at that). The distinction here isthat a test is reliable if it consistently produces whatever score a personwould get on average, regardless of whatever it is the test is measuring.In fact, a perfectly reliable test might not produce a score that has any-thing to do with the construct of interest, such “what you really know.”
38—— Part II ♦ The Psychology of Psychometrics
03-Salkind (Tests) 4749.qxd 7/5/2005 10:04 PM Page 38

What might be the source of such error? Well, perhaps the roomin which the test is taken is so warm that it’s easy for you to fallasleep. That would certainly have an impact on your test score. Or,perhaps you didn’t study for the test as much as you should have.Ditto. How about the test instructions being unclear? Or, yourattitude just isn’t right that day to undertake a 4-hour final.
These are all sources of error that can contribute to the unrelia-bility of an instrument because these sources mask the true perfor-mance or true score, which would be measured if the sources oferror were not present.
GETTING CONCEPTUAL
The less error, the more reliability—it’s that simple.So, what we know up to this point is that the score we observe
(the results of, let’s say, a spelling test) are composed of an individ-ual’s actual score (true score) and something we call error score.The formula shown here gives you an idea as to how these tworelate to one another:
Observed score = true score + error score
Now, let’s take a moment and go one step further.
THINGS TO REMEMBER
Error is the difference between one’s observed score and one’stheoretical true score.
Error? Yes—in all its glory. For example, let’s suppose for amoment that someone gets an 89 on his or her tests and measure-ments test, but their true score (which we never really know) is 80.That means that the 9-point difference (the amount of error) is dueto error, or the reason why individual test scores vary from being a100% true reflection of that individual’s understanding or knowl-edge of what he or she is being tested on.
Chapter 3 ♦ Getting It Right Every Time: Reliability and Its Importance 39
03-Salkind (Tests) 4749.qxd 7/5/2005 10:04 PM Page 39
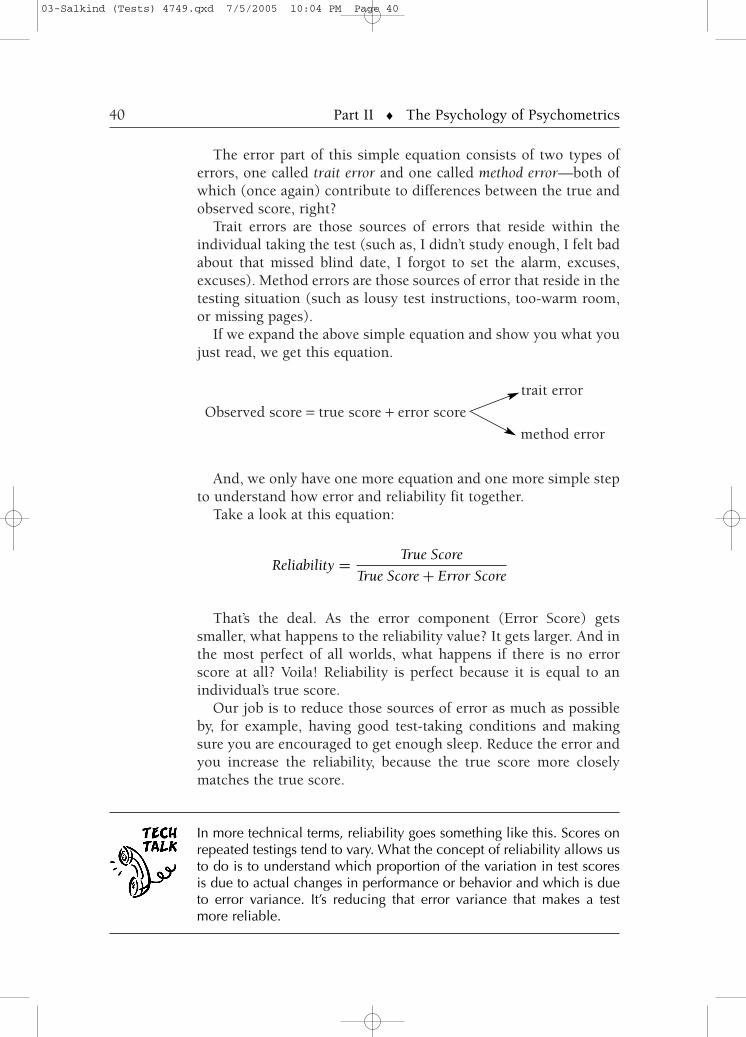
The error part of this simple equation consists of two types oferrors, one called trait error and one called method error—both ofwhich (once again) contribute to differences between the true andobserved score, right?
Trait errors are those sources of errors that reside within theindividual taking the test (such as, I didn’t study enough, I felt badabout that missed blind date, I forgot to set the alarm, excuses,excuses). Method errors are those sources of error that reside in thetesting situation (such as lousy test instructions, too-warm room,or missing pages).
If we expand the above simple equation and show you what youjust read, we get this equation.
trait error
Observed score = true score + error score
method error
And, we only have one more equation and one more simple stepto understand how error and reliability fit together.
Take a look at this equation:
That’s the deal. As the error component (Error Score) getssmaller, what happens to the reliability value? It gets larger. And inthe most perfect of all worlds, what happens if there is no errorscore at all? Voila! Reliability is perfect because it is equal to anindividual’s true score.
Our job is to reduce those sources of error as much as possibleby, for example, having good test-taking conditions and makingsure you are encouraged to get enough sleep. Reduce the error andyou increase the reliability, because the true score more closelymatches the true score.
40—— Part II ♦ The Psychology of Psychometrics
In more technical terms, reliability goes something like this. Scores onrepeated testings tend to vary. What the concept of reliability allows usto do is to understand which proportion of the variation in test scoresis due to actual changes in performance or behavior and which is dueto error variance. It’s reducing that error variance that makes a testmore reliable.
Reliability = True Score
True Score + Error Score
03-Salkind (Tests) 4749.qxd 7/5/2005 10:04 PM Page 40
IF YOU KNOW ABOUTRXY, SKIP THIS SECTION . . .
But if you don’t know about rxy, then read on a bit.As we said earlier, reliability reflects the consistency of test per-
formance upon additional testings—and those testings can takeplace at different times, as different forms of the same test, or somecombination.
The way that reliability is measured is through the computationof a correlation coefficient. You can learn a lot more about correla-tion coefficients in Appendix A, but we’ll give you a bit of a reviewhere.
A short review will tell us that a correlation coefficient isa numerical index that tells us how closely two variables (such astwo administrations of the same test) are related to one another—more accurately, how much the variables share or have in common.For reliability purposes, correlation coefficients tend to rangebetween .00 and +1.00. The higher the number, the more reliablethe test.
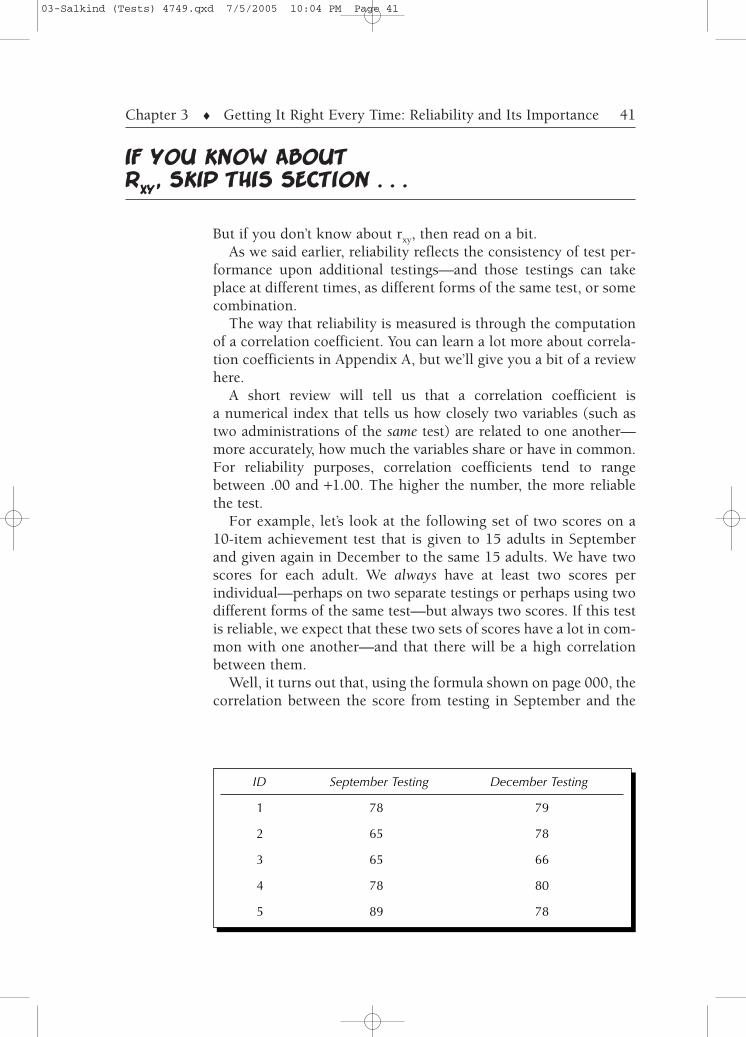
For example, let’s look at the following set of two scores on a10-item achievement test that is given to 15 adults in Septemberand given again in December to the same 15 adults. We have twoscores for each adult. We always have at least two scores perindividual—perhaps on two separate testings or perhaps using twodifferent forms of the same test—but always two scores. If this testis reliable, we expect that these two sets of scores have a lot in com-mon with one another—and that there will be a high correlationbetween them.
Well, it turns out that, using the formula shown on page 000, thecorrelation between the score from testing in September and the
Chapter 3 ♦ Getting It Right Every Time: Reliability and Its Importance 41
ID September Testing December Testing
1 78 79
2 65 78
3 65 66
4 78 80
5 89 78
03-Salkind (Tests) 4749.qxd 7/5/2005 10:04 PM Page 41
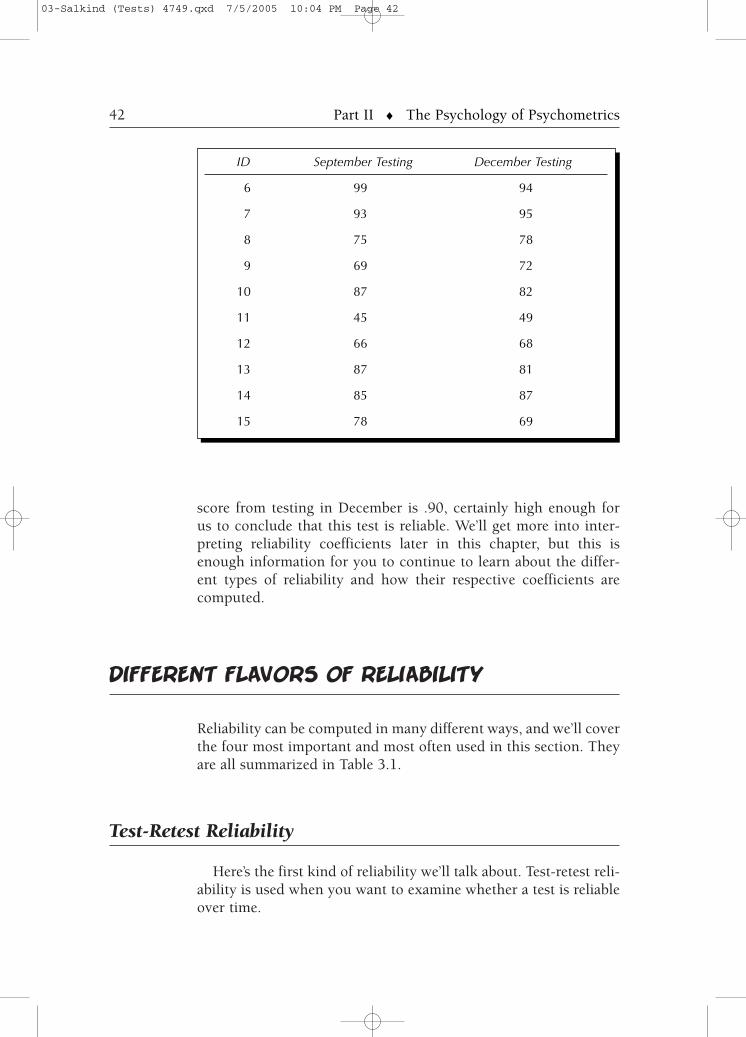
score from testing in December is .90, certainly high enough forus to conclude that this test is reliable. We’ll get more into inter-preting reliability coefficients later in this chapter, but this isenough information for you to continue to learn about the differ-ent types of reliability and how their respective coefficients arecomputed.
DIFFERENT FLAVORS OF RELIABILITY
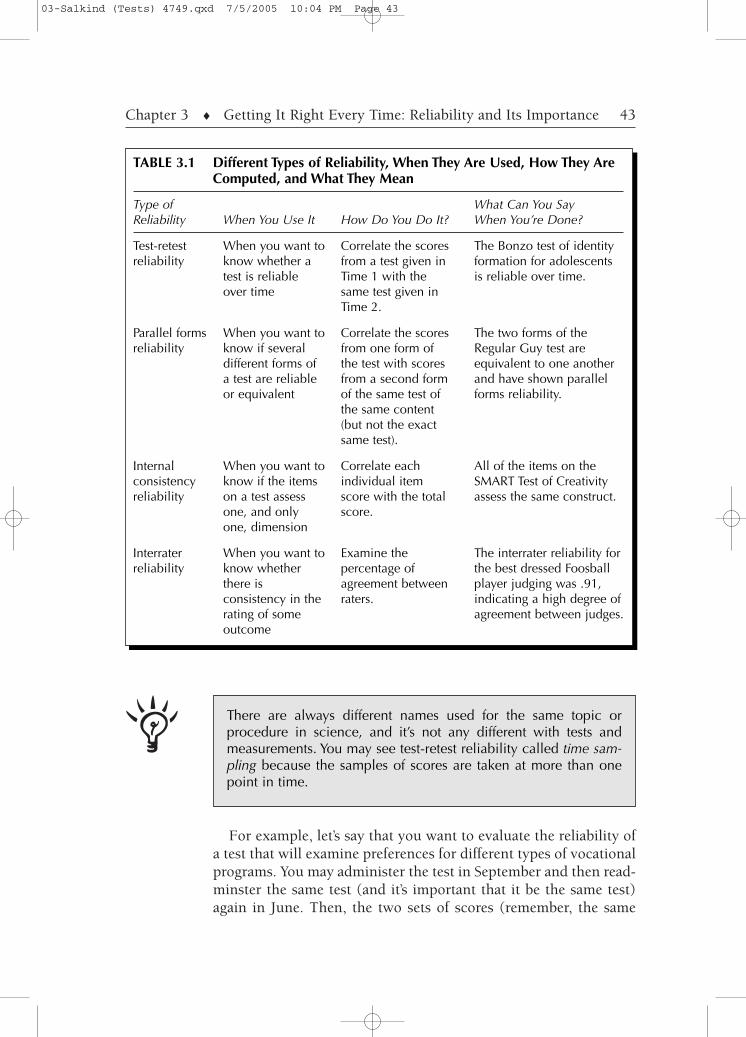
Reliability can be computed in many different ways, and we’ll coverthe four most important and most often used in this section. Theyare all summarized in Table 3.1.
Test-Retest Reliability
Here’s the first kind of reliability we’ll talk about. Test-retest reli-ability is used when you want to examine whether a test is reliableover time.
42—— Part II ♦ The Psychology of Psychometrics
ID September Testing December Testing
6 99 94
7 93 95
8 75 78
9 69 72
10 87 82
11 45 49
12 66 68
13 87 81
14 85 87
15 78 69
03-Salkind (Tests) 4749.qxd 7/5/2005 10:04 PM Page 42
For example, let’s say that you want to evaluate the reliability ofa test that will examine preferences for different types of vocationalprograms. You may administer the test in September and then read-minster the same test (and it’s important that it be the same test)again in June. Then, the two sets of scores (remember, the same
Chapter 3 ♦ Getting It Right Every Time: Reliability and Its Importance 43
TABLE 3.1 Different Types of Reliability, When They Are Used, How They AreComputed, and What They Mean
Type ofReliability
Test-retestreliability
Parallel formsreliability
Internalconsistencyreliability
Interraterreliability
When You Use It
When you want toknow whether atest is reliableover time
When you want toknow if severaldifferent forms ofa test are reliableor equivalent
When you want toknow if the itemson a test assessone, and onlyone, dimension
When you want toknow whetherthere isconsistency in therating of someoutcome
How Do You Do It?
Correlate the scoresfrom a test given inTime 1 with thesame test given inTime 2.
Correlate the scoresfrom one form ofthe test with scoresfrom a second formof the same test ofthe same content(but not the exactsame test).
Correlate eachindividual itemscore with the totalscore.
Examine thepercentage ofagreement betweenraters.
What Can You SayWhen You’re Done?
The Bonzo test of identityformation for adolescentsis reliable over time.
The two forms of theRegular Guy test areequivalent to one anotherand have shown parallelforms reliability.
All of the items on theSMART Test of Creativityassess the same construct.
The interrater reliability forthe best dressed Foosballplayer judging was .91,indicating a high degree ofagreement between judges.
There are always different names used for the same topic orprocedure in science, and it’s not any different with tests andmeasurements. You may see test-retest reliability called time sam-pling because the samples of scores are taken at more than onepoint in time.
03-Salkind (Tests) 4749.qxd 7/5/2005 10:04 PM Page 43
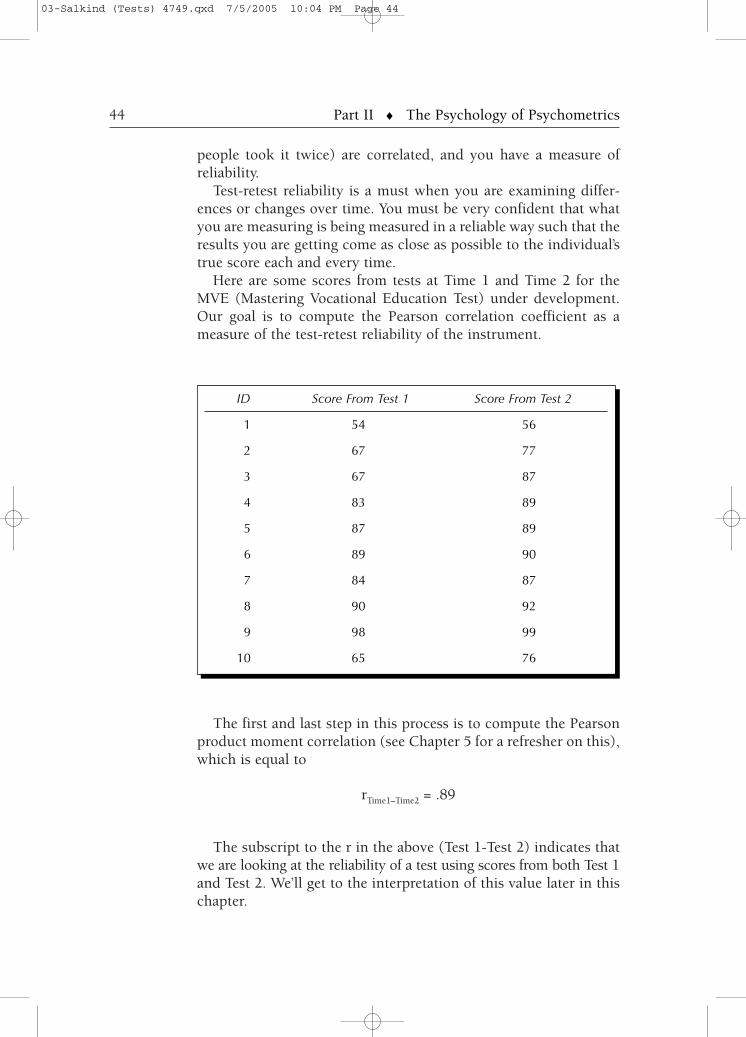
The first and last step in this process is to compute the Pearsonproduct moment correlation (see Chapter 5 for a refresher on this),which is equal to
rTime1–Time2 = .89
The subscript to the r in the above (Test 1-Test 2) indicates thatwe are looking at the reliability of a test using scores from both Test 1and Test 2. We’ll get to the interpretation of this value later in thischapter.
people took it twice) are correlated, and you have a measure ofreliability.
Test-retest reliability is a must when you are examining differ-ences or changes over time. You must be very confident that whatyou are measuring is being measured in a reliable way such that theresults you are getting come as close as possible to the individual’strue score each and every time.
Here are some scores from tests at Time 1 and Time 2 for theMVE (Mastering Vocational Education Test) under development.Our goal is to compute the Pearson correlation coefficient as ameasure of the test-retest reliability of the instrument.
44—— Part II ♦ The Psychology of Psychometrics
ID Score From Test 1 Score From Test 2
1 54 56
2 67 77
3 67 87
4 83 89
5 87 89
6 89 90
7 84 87
8 90 92
9 98 99
10 65 76
03-Salkind (Tests) 4749.qxd 7/5/2005 10:04 PM Page 44
For example, let’s say that you are doing a study on memory, andpart of the Remember Everything Test (RET) task is to look at 10different words, memorize them as best as you can, and then recitethem back after 20 seconds of study and 10 seconds of rest. As with
Oops! The Problem With Test-Retest Reliability
You might have thought about these shortcomings already. Thebiggest critique of test-retest reliability is that when you administerthe same test in succession, you run the risk of practice effects(also called carryover effects). This occurs when the first testinginfluences the second—in other words, on the first testing, the testtakers may remember the questions, ideas, concepts, and so on,and that may have an impact on the second testing and their score.
Another problem might be with the interaction between theamount of time between tests and the nature of the sample beingtested. For example, suppose you are working with an instrumentthat assesses some aspect of growth and development in youngchildren. Because individual differences at young ages are so pro-found, waiting 3 or 6 months to retest motor skills might result inan inaccurate correlation, not because the test is unreliable, butbecause dramatic changes in behavior occur at that age over thatperiod of time. It’s like trying to hit a moving target, and indeed, ifthe change is that rapid (and if there is that much variability amongthose being tested), there may be no way to establish test-retestreliability.
Parallel Forms Reliability
Parallel forms reliability is used when you want to examinethe equivalence or similarity between two different forms of thesame test.
Chapter 3 ♦ Getting It Right Every Time: Reliability and Its Importance 45
You already have seen how test-retest reliability can appear undera different name (time sampling); well, it’s the same with parallelforms reliability. You may see parallel forms reliability be calleditem sampling because the samples of scores are taken usingdifferent sets of items.
03-Salkind (Tests) 4749.qxd 7/5/2005 10:04 PM Page 45
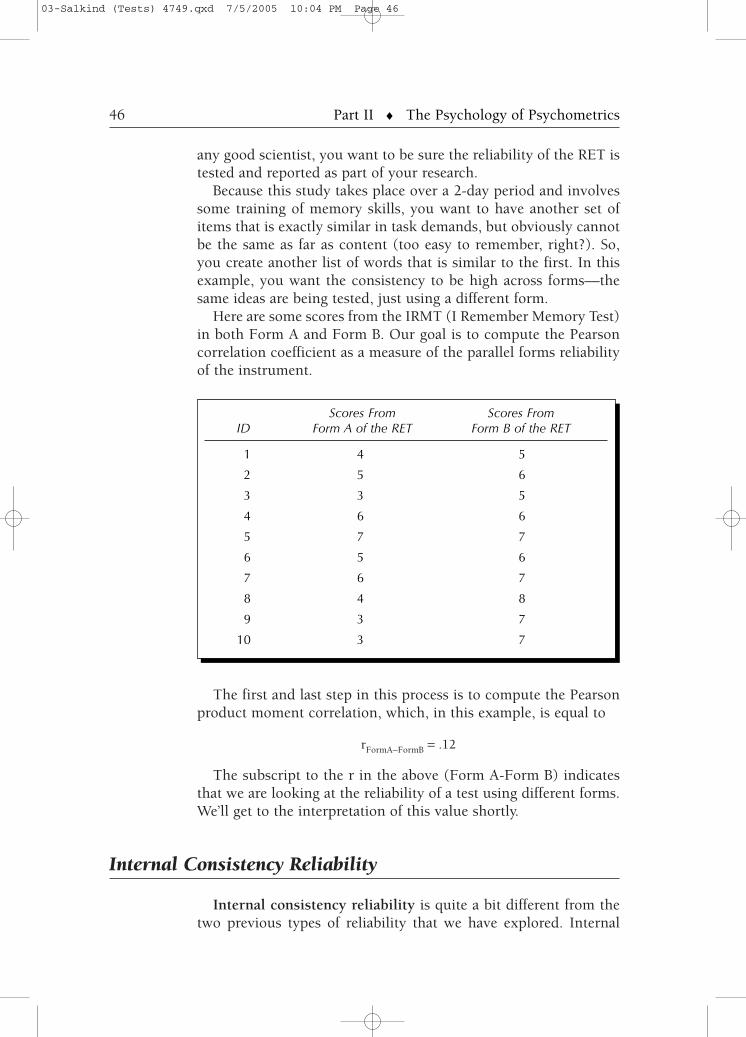
The first and last step in this process is to compute the Pearsonproduct moment correlation, which, in this example, is equal to
rFormA−FormB = .12
The subscript to the r in the above (Form A-Form B) indicatesthat we are looking at the reliability of a test using different forms.We’ll get to the interpretation of this value shortly.
Internal Consistency Reliability
Internal consistency reliability is quite a bit different from thetwo previous types of reliability that we have explored. Internal
any good scientist, you want to be sure the reliability of the RET istested and reported as part of your research.
Because this study takes place over a 2-day period and involvessome training of memory skills, you want to have another set ofitems that is exactly similar in task demands, but obviously cannotbe the same as far as content (too easy to remember, right?). So,you create another list of words that is similar to the first. In thisexample, you want the consistency to be high across forms—thesame ideas are being tested, just using a different form.
Here are some scores from the IRMT (I Remember Memory Test)in both Form A and Form B. Our goal is to compute the Pearsoncorrelation coefficient as a measure of the parallel forms reliabilityof the instrument.
46—— Part II ♦ The Psychology of Psychometrics
Scores From Scores From ID Form A of the RET Form B of the RET
1 4 5
2 5 6
3 3 5
4 6 6
5 7 7
6 5 6
7 6 7
8 4 8
9 3 7
10 3 7
03-Salkind (Tests) 4749.qxd 7/5/2005 10:04 PM Page 46

consistency is used when you want to know whether the items ona test are consistent with one another in that they represent one,and only one, dimension, construct, or area of interest throughoutthe test.
Let’s say that you are developing the Attitude Toward HealthCare Test (the ATHCT), and you want to make sure that the set of20 items (with individuals responding on a scale from 1 = stronglyagree to 5 = strongly disagree) measures just that, and nothing else.You would look at the score for each item (for a group of test tak-ers) and see if individual scores correlate with the total score. Youwould expect that people who scored high on certain items (e.g., “Ilike my HMO”) would have scored low on others (e.g., “I don’t likeanything other than private health insurance”) and that this wouldbe consistent across all the people who took the test.
Split Half Reliability
The first and most simple way to establish internal consis-tency of a test is by “splitting” the test into two halves and com-puting what is affectionately called split half reliability. Here,the scores on one half of the test are compared with scores on thesecond half of the test to see if there is a strong relationshipbetween the two. If so, then we can conclude that the test hasinternal consistency.
THINGS TO REMEMBER: SPLIT ITIN TWO! (BUT YOU’RE NOT DONE YET)
An easy way to estimate internal consistency of a test is through theuse of split half reliability. But remember to apply the Spearman-Brown correction (sometimes called the Spearman-Brown correla-tion or prophecy formula).
But like King Solomon, we have a decision to make here. Howdo you split the test? If it’s a 20-item test, do we take the first 10items and correlate them with the last 10 items for the group? Or,do we take every other item to form an odd group (such as Items
Chapter 3 ♦ Getting It Right Every Time: Reliability and Its Importance 47
03-Salkind (Tests) 4749.qxd 7/5/2005 10:04 PM Page 47
1, 3, 5, and 7) and an even grouping (such as Items 2, 4, 6, and8)? It’s easier to do the first half-second half method, but danger-ous. Why? Because if items tend to be grouped (inadvertently bysubject matter or by difficulty), it is less likely that the groups ofitems will be deemed equal to one another. Potential trouble inparadise.
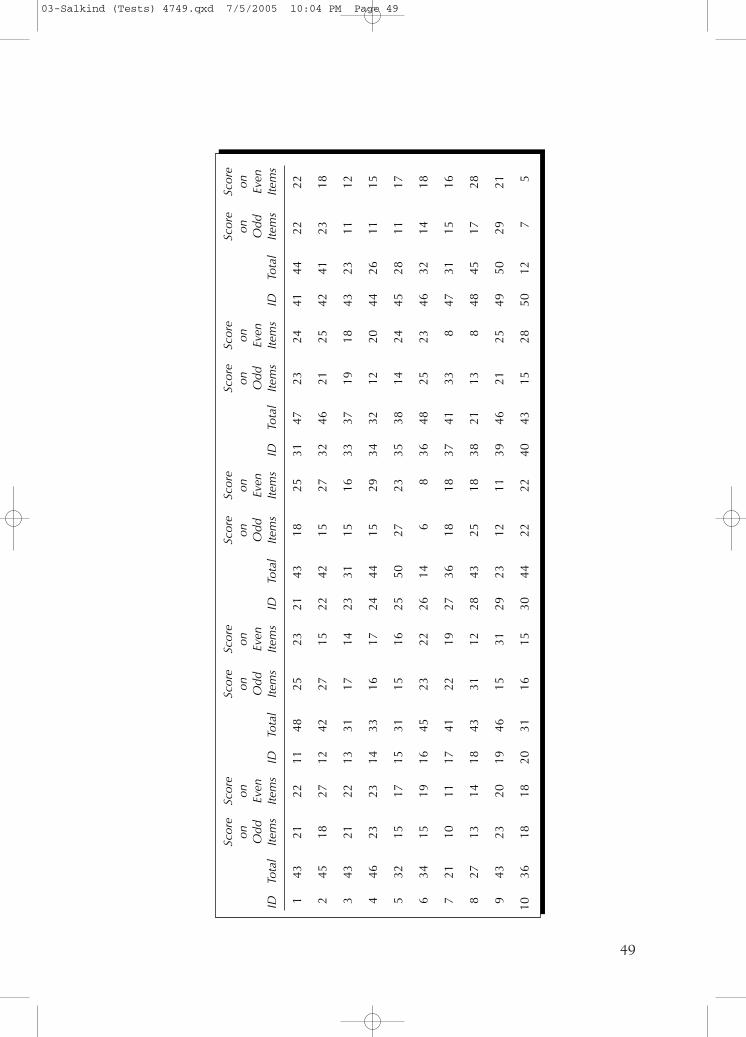
So, for our purposes here (and maybe for your purposes there),it’s best to select all the odd items for one grouping and all the evensfor another, and then turn to computing the correlation coefficient.Here are 50 such scores. We can see
• ID for each participant
• Total score on each test
• Total score on only the odd items
• Total score on only the even items
To compute the split half reliability coefficient as an indicator ofhow well integrated or how internally consistent the test is, wesimple correlate the score of each person on the odd half of his orher test with the score on the even half. The result? rodd-even = .2428.Internally consistent? We’ll get there soon.
King Solomon Might Have Been Off by Half, or Correct Me If I AmWrong
The big “Oops!” of computing split half reliabilities is that, ineffect, you cut the test in half, and because shorter tests are lessreliable, the real degree of reliability is constrained. SpearmanBrown to the rescue!
The Spearman Brown formula makes that correction. It’s simpleand straightforward:
where
rt = equals the simple Pearson product moment correlation (seeAppendix A)
rh = equals the half correlation
48—— Part II ♦ The Psychology of Psychometrics
rt = 2rh
1 + rh
03-Salkind (Tests) 4749.qxd 7/5/2005 10:04 PM Page 48
49
Scor
eSc
ore
Scor
e Sc
ore
Scor
e Sc
ore
Scor
eSc
ore
Scor
e Sc
ore
onon
on
on
onon
on
onon
onO
ddEv
enO
ddEv
enO
ddEv
enO
ddEv
enO
ddEv
enID
Tota
lIte
ms
Item
sID
Tota
lIte
ms
Item
sID
Tota
lIte
ms
Item
sID
Tota
lIte
ms
Item
sID
Tota
lIte
ms
Item
s
143
2122
1148
2523
2143
1825
3147
2324
4144
2222
245
1827
1242
2715
2242
1527
3246
2125
4241
2318
343
2122
1331
1714
2331
1516
3337
1918
4323
1112
446
2323
1433
1617
2444
1529
3432
1220
4426
1115
532
1517
1531
1516
2550
2723
3538
1424
4528
1117
634
1519
1645
2322
2614
68
3648
2523
4632
1418
721
1011
1741
2219
2736
1818
3741
338
4731
1516
827
1314
1843
3112
2843
2518
3821
138
4845
1728
943
2320
1946
1531
2923
1211
3946
2125
4950
2921
1036
1818
2031
1615
3044
2222
4043
1528
5012
75
03-Salkind (Tests) 4749.qxd 7/5/2005 10:04 PM Page 49
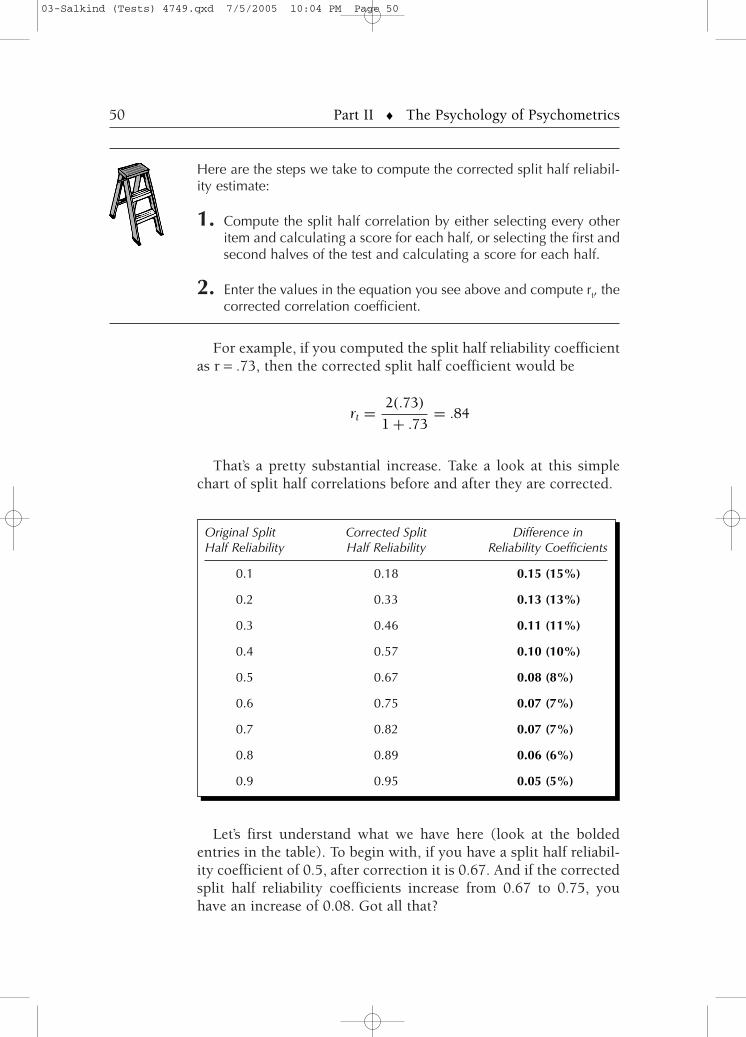
That’s a pretty substantial increase. Take a look at this simplechart of split half correlations before and after they are corrected.
Let’s first understand what we have here (look at the boldedentries in the table). To begin with, if you have a split half reliabil-ity coefficient of 0.5, after correction it is 0.67. And if the correctedsplit half reliability coefficients increase from 0.67 to 0.75, youhave an increase of 0.08. Got all that?
Here are the steps we take to compute the corrected split half reliabil-ity estimate:
1. Compute the split half correlation by either selecting every otheritem and calculating a score for each half, or selecting the first andsecond halves of the test and calculating a score for each half.
2. Enter the values in the equation you see above and compute rt, thecorrected correlation coefficient.
For example, if you computed the split half reliability coefficientas r = .73, then the corrected split half coefficient would be
50—— Part II ♦ The Psychology of Psychometrics
Original Split Corrected Split Difference in Half Reliability Half Reliability Reliability Coefficients
0.1 0.18 0.15 (15%)
0.2 0.33 0.13 (13%)
0.3 0.46 0.11 (11%)
0.4 0.57 0.10 (10%)
0.5 0.67 0.08 (8%)
0.6 0.75 0.07 (7%)
0.7 0.82 0.07 (7%)
0.8 0.89 0.06 (6%)
0.9 0.95 0.05 (5%)
rt = 2(.73)
1 + .73= .84
03-Salkind (Tests) 4749.qxd 7/5/2005 10:04 PM Page 50
Now, here’s what’s really, really interesting. If you look at thetable, you can see that the amount of increase for corrected splithalf reliability coefficients decreases as the original split half relia-bility coefficient increases, right? Why? Simple—the more reliablethe original estimate (the first column), the less room for improve-ment when corrected. In other words, as a test is more reliable, theless room it has for change.
Chapter 3 ♦ Getting It Right Every Time: Reliability and Its Importance 51
King Solomon was wise in his decision, but splitting a test in halfmeans half as long a test, and that can create a problem. Why?Shorter tests are less reliable than longer ones in general becauseshorter tests are less representative than longer ones of theuniverse of all possible items. For example, if you are preparing ahistory achievement test on the American Civil War, 20 itemswould surely cover some information, but 100 would cover muchmore—a much more representative sample of what could betested that greatly increases chances that the test is consistent.
Cronbach’s Alpha (or α)
Now here’s our second way of computing internal consistencyestimates for a test, (Lee) Cronbach’s Alpha (also referred to ascoefficient alpha) symbolized by the cool little Greek letter alpha,which looks like this: α.
Here are some sample data for 10 people on a five-item attitudetest (the I♥HMO test), where scores are between 1 (strongly dis-agree) and 5 (strongly agree) on each item. Cronbach’s alpha isespecially useful when you are looking at the reliability of a testthat doesn’t have right or wrong answers, such as a personality orattitude test. It is used to evaluate the reliability of tests with rightanswers as well.
When you compute Cronbach’s Alpha (named after Lee Cronbach),you are actually correlating the score for each item with the total scorefor each individual and then comparing that to the variability presentfor all individual item scores. The logic is that any individual test takerwith a high(er) total test score should have a high(er) score on eachitem (such as 5, 5, 3, 5, 3, 4, 4, 2, 4, 5) for a total score of 40, and thatany individual test taker with a low(er) total test score should have alow(er) score on each individual item (such as 5, 1, 5, 1, 5, 5, 1, 5, 5,1, 5, 1) for a total score of 40 as well.
03-Salkind (Tests) 4749.qxd 7/5/2005 10:04 PM Page 51
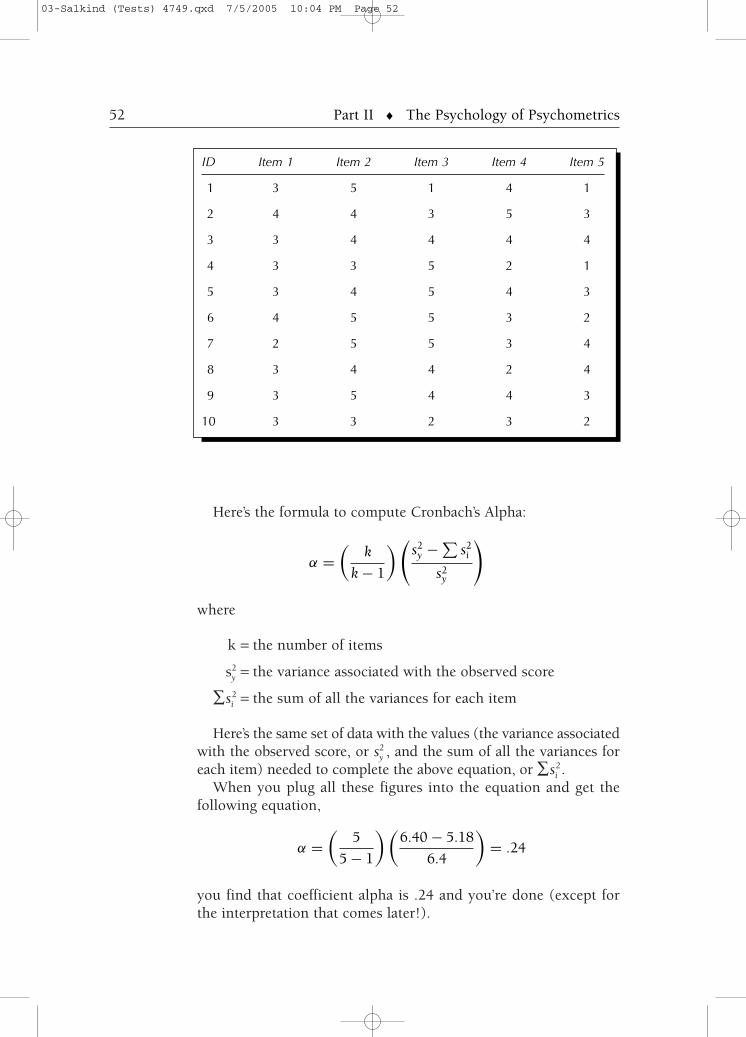
Here’s the formula to compute Cronbach’s Alpha:
where
k = the number of items
s2y = the variance associated with the observed score
∑si2 = the sum of all the variances for each item
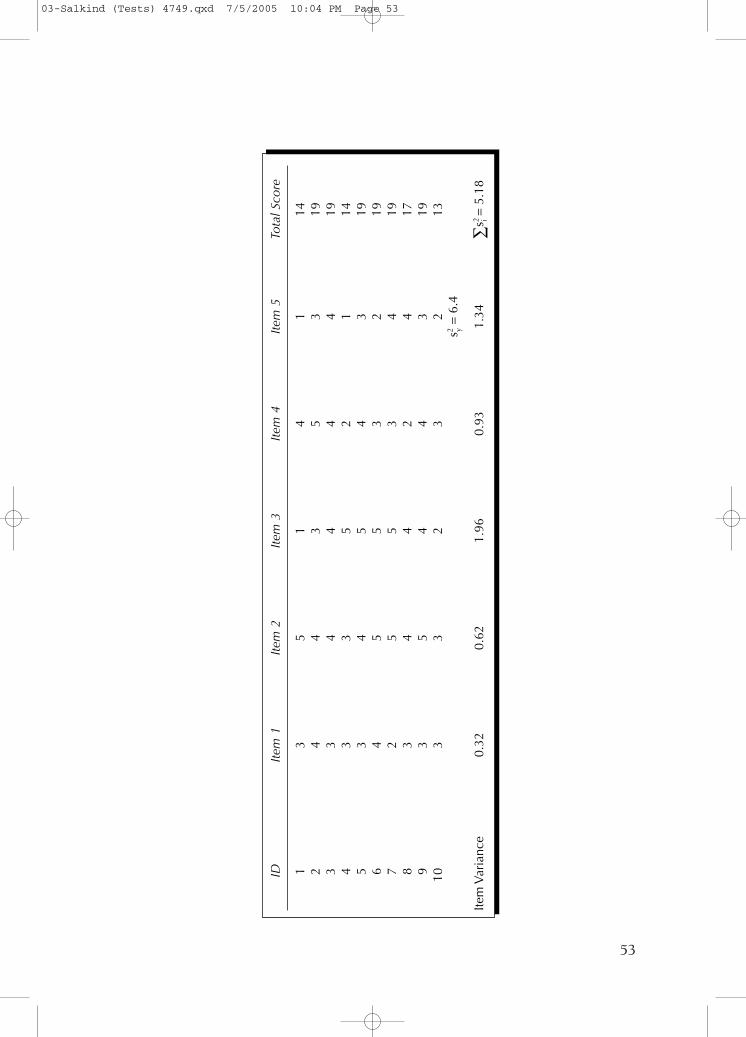
Here’s the same set of data with the values (the variance associatedwith the observed score, or s2
y , and the sum of all the variances foreach item) needed to complete the above equation, or ∑si
2.When you plug all these figures into the equation and get the
following equation,
you find that coefficient alpha is .24 and you’re done (except forthe interpretation that comes later!).
52—— Part II ♦ The Psychology of Psychometrics
ID Item 1 Item 2 Item 3 Item 4 Item 5
1 3 5 1 4 1
2 4 4 3 5 3
3 3 4 4 4 4
4 3 3 5 2 1
5 3 4 5 4 3
6 4 5 5 3 2
7 2 5 5 3 4
8 3 4 4 2 4
9 3 5 4 4 3
10 3 3 2 3 2
α =(
k
k − 1
) (s2
y − ∑s2
i
s2y
)
α =(
5
5 − 1
) (6.40 − 5.18
6.4
)= .24
03-Salkind (Tests) 4749.qxd 7/5/2005 10:04 PM Page 52
53
IDIte
m 1
Item
2Ite
m 3
Item
4Ite
m 5
Tota
l Sco
re
13
51
41
142
44
35
319
33
44
44
194
33
52
114
53
45
43
196
45
53
219
72
55
34
198
34
42
417
93
54
43
1910
33
23
213
s2 y=
6.4
Item
Var
ianc
e0.
320.
621.
960.
931.
34∑
s2 i=
5.18
03-Salkind (Tests) 4749.qxd 7/5/2005 10:04 PM Page 53
where
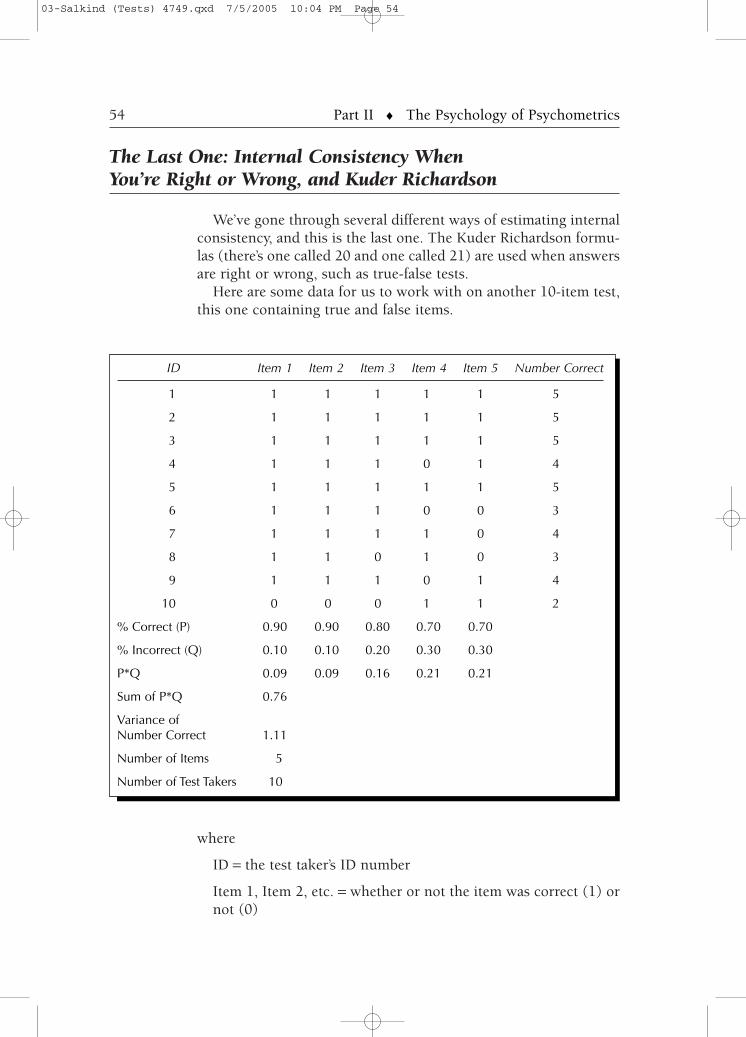
ID = the test taker’s ID number
Item 1, Item 2, etc. = whether or not the item was correct (1) ornot (0)
The Last One: Internal Consistency WhenYou’re Right or Wrong, and Kuder Richardson
We’ve gone through several different ways of estimating internalconsistency, and this is the last one. The Kuder Richardson formu-las (there’s one called 20 and one called 21) are used when answersare right or wrong, such as true-false tests.
Here are some data for us to work with on another 10-item test,this one containing true and false items.
54—— Part II ♦ The Psychology of Psychometrics
ID Item 1 Item 2 Item 3 Item 4 Item 5 Number Correct
1 1 1 1 1 1 5
2 1 1 1 1 1 5
3 1 1 1 1 1 5
4 1 1 1 0 1 4
5 1 1 1 1 1 5
6 1 1 1 0 0 3
7 1 1 1 1 0 4
8 1 1 0 1 0 3
9 1 1 1 0 1 4
10 0 0 0 1 1 2
% Correct (P) 0.90 0.90 0.80 0.70 0.70
% Incorrect (Q) 0.10 0.10 0.20 0.30 0.30
P*Q 0.09 0.09 0.16 0.21 0.21
Sum of P*Q 0.76
Variance ofNumber Correct 1.11
Number of Items 5
Number of Test Takers 10
03-Salkind (Tests) 4749.qxd 7/5/2005 10:04 PM Page 54
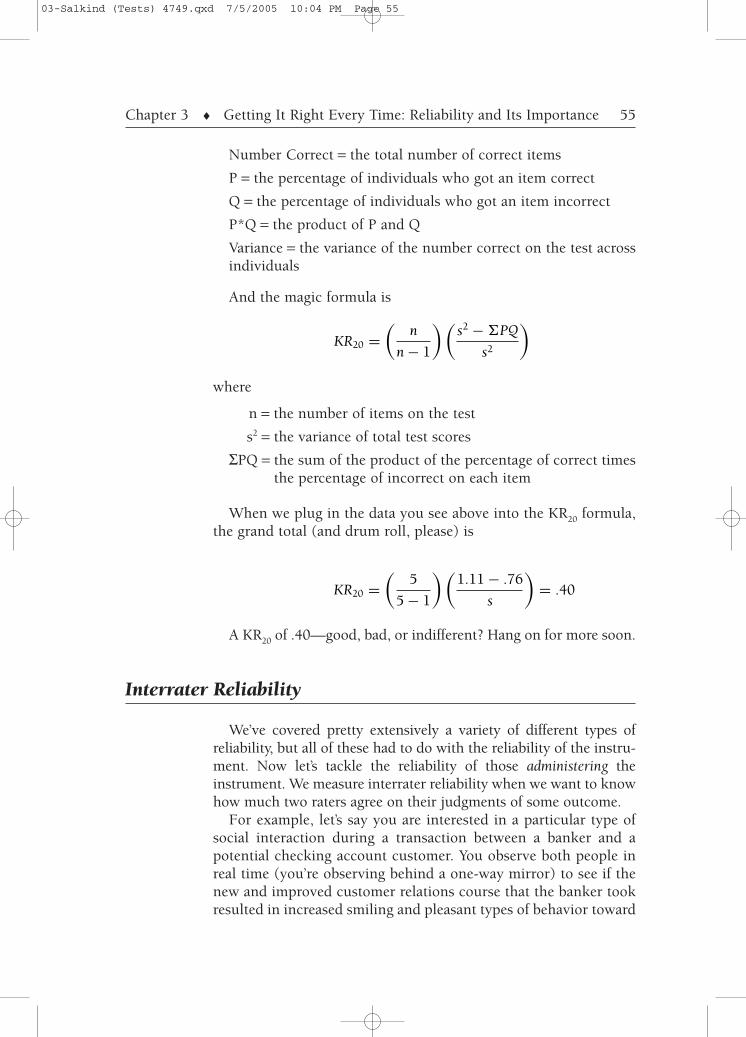
Number Correct = the total number of correct items
P = the percentage of individuals who got an item correct
Q = the percentage of individuals who got an item incorrect
P*Q = the product of P and Q
Variance = the variance of the number correct on the test acrossindividuals
And the magic formula is
where
n = the number of items on the test
s2 = the variance of total test scores
ΣPQ = the sum of the product of the percentage of correct timesthe percentage of incorrect on each item
When we plug in the data you see above into the KR20 formula,the grand total (and drum roll, please) is
A KR20 of .40—good, bad, or indifferent? Hang on for more soon.
Interrater Reliability
We’ve covered pretty extensively a variety of different types ofreliability, but all of these had to do with the reliability of the instru-ment. Now let’s tackle the reliability of those administering theinstrument. We measure interrater reliability when we want to knowhow much two raters agree on their judgments of some outcome.
For example, let’s say you are interested in a particular type ofsocial interaction during a transaction between a banker and apotential checking account customer. You observe both people inreal time (you’re observing behind a one-way mirror) to see if thenew and improved customer relations course that the banker tookresulted in increased smiling and pleasant types of behavior toward
Chapter 3 ♦ Getting It Right Every Time: Reliability and Its Importance 55
KR20 =(
n
n − 1
) (s2 − �PQ
s2
)
KR20 =(
5
5 − 1
) (1.11 − .76
s
)= .40
03-Salkind (Tests) 4749.qxd 7/5/2005 10:04 PM Page 55
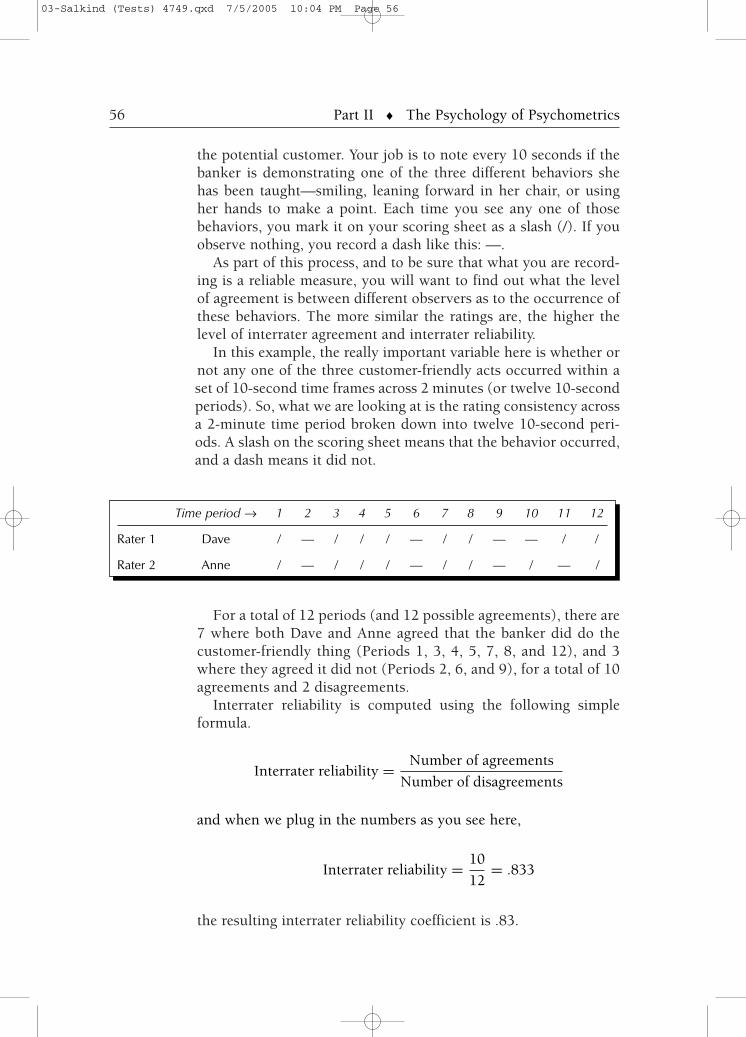
the resulting interrater reliability coefficient is .83.
For a total of 12 periods (and 12 possible agreements), there are7 where both Dave and Anne agreed that the banker did do thecustomer-friendly thing (Periods 1, 3, 4, 5, 7, 8, and 12), and 3where they agreed it did not (Periods 2, 6, and 9), for a total of 10agreements and 2 disagreements.
Interrater reliability is computed using the following simpleformula.
the potential customer. Your job is to note every 10 seconds if thebanker is demonstrating one of the three different behaviors shehas been taught—smiling, leaning forward in her chair, or usingher hands to make a point. Each time you see any one of thosebehaviors, you mark it on your scoring sheet as a slash (/). If youobserve nothing, you record a dash like this: —.
As part of this process, and to be sure that what you are record-ing is a reliable measure, you will want to find out what the levelof agreement is between different observers as to the occurrence ofthese behaviors. The more similar the ratings are, the higher thelevel of interrater agreement and interrater reliability.
In this example, the really important variable here is whether ornot any one of the three customer-friendly acts occurred within aset of 10-second time frames across 2 minutes (or twelve 10-secondperiods). So, what we are looking at is the rating consistency acrossa 2-minute time period broken down into twelve 10-second peri-ods. A slash on the scoring sheet means that the behavior occurred,and a dash means it did not.
56—— Part II ♦ The Psychology of Psychometrics
Time period → 1 2 3 4 5 6 7 8 9 10 11 12
Rater 1 Dave / — / / / — / / — — / /
Rater 2 Anne / — / / / — / / — / — /
and when we plug in the numbers as you see here,
Interrater reliability = Number of agreements
Number of disagreements
Interrater reliability = 10
12= .833
03-Salkind (Tests) 4749.qxd 7/5/2005 10:04 PM Page 56
Chapter 3 ♦ Getting It Right Every Time: Reliability and Its Importance 57
Notice in the case of interrater reliability, the coefficient that we useis an actual proportion. This is not the case with the correlations usedto describe other types of reliability. Even though they may look likeproportions, they are not.
HOW BIG IS BIG? INTERPRETINGRELIABILITY COEFFICIENTS
OK—now we get down to the business of better understanding justhow big a reliability coefficient, regardless of its flavor (test-retest,etc.), has to be in order to be “acceptable.”
We want only two things here:
• We want reliability coefficients to be positive.
• We want reliability coefficients that are as large as possible(between +.00 and +1.00).
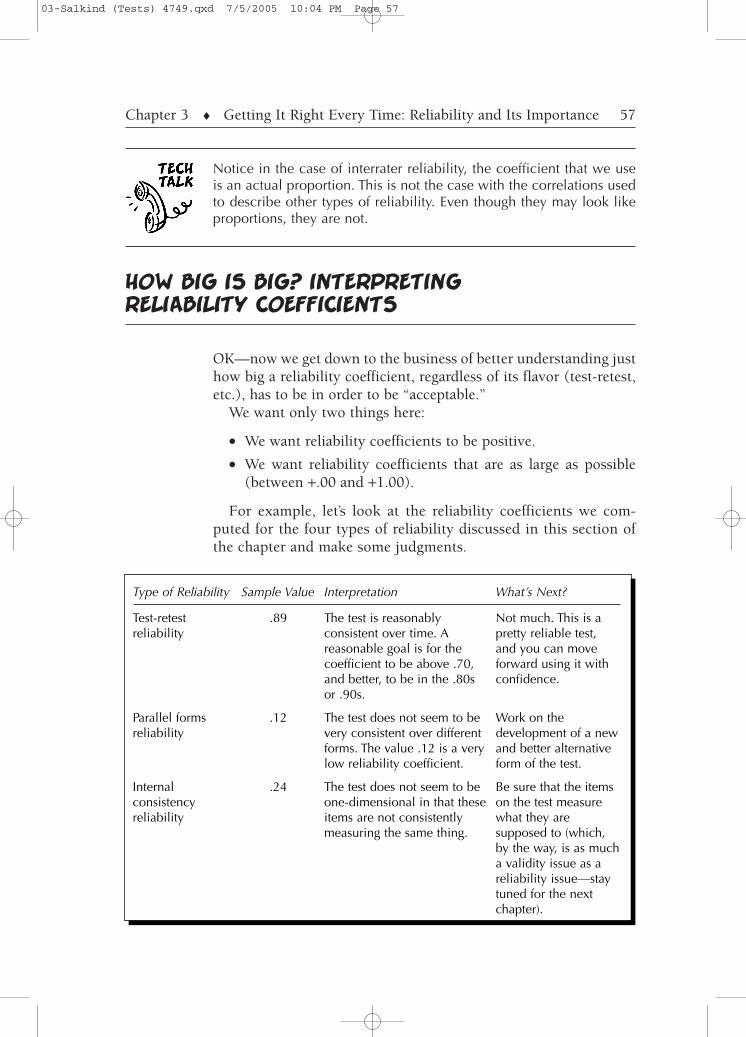
For example, let’s look at the reliability coefficients we com-puted for the four types of reliability discussed in this section ofthe chapter and make some judgments.
Type of Reliability
Test-retestreliability
Parallel formsreliability
Internalconsistencyreliability
Sample Value
.89
.12
.24
Interpretation
The test is reasonablyconsistent over time. Areasonable goal is for thecoefficient to be above .70,and better, to be in the .80sor .90s.
The test does not seem to bevery consistent over differentforms. The value .12 is a verylow reliability coefficient.
The test does not seem to beone-dimensional in that theseitems are not consistentlymeasuring the same thing.
What’s Next?
Not much. This is apretty reliable test,and you can moveforward using it withconfidence.
Work on thedevelopment of a newand better alternativeform of the test.
Be sure that the itemson the test measurewhat they aresupposed to (which,by the way, is as mucha validity issue as areliability issue—staytuned for the nextchapter).
03-Salkind (Tests) 4749.qxd 7/5/2005 10:04 PM Page 57
In general, an acceptable reliability coefficient is .70 or above,but much more acceptable is .8 and above. It’s rare to see valuesmuch larger than that. However, when it comes to interrater relia-bility, we should really expect nothing less than 90%. It’s so easilyraised (just have the judges do more training, given that the termson the test are good ones) that there is no reason why this higherlevel should not be reached.
THINGS TO REMEMBER
OK, here’s the big warning. If you’re reading along in a journalarticle and realize, “Hey—there’s nothing here about the reliability ofthe instruments they used,” then a little flag should go up. There areusually two reasons for this. The first is that the test being used is sowell known and so popular that it is common knowledge in the field.That would be true for such tests as the Wechsler Intelligence Scalefor Children, the Stanford Achievement Tests, or the MinnesotaMultiphasic Personality Inventory. The second reason would be thatthe original designers of the test never collected the kind of data theyneeded to make a judgment about the reliability of the test—a verydangerous and unproductive situation. If someone is gong to go tothe effort of establishing the reliability of a test, and not use it unlessit is reliable, they are surely going to brag about it a bit. If the infor-mation isn’t there, and it is not because of reason #1 above, look fortrouble in River City beginning with a U (for unreliable).
AND IF YOU CAN’T ESTABLISHRELIABILITY . . . THEN WHAT?
The road to establishing the reliability of a test is not a smooth oneat all, and not one that does not take a good deal of work. What ifthe test is not reliable?
Here are a few things to keep in mind. Remember that reliabilityis a function of how much error contributes to the observed score.Lower that error and you increase the reliability.
• Make sure that the instructions are standardized across allsettings when the test is administered.
• Increase the number of items or observations, because thelarger the sample from the universe of behaviors you are
58—— Part II ♦ The Psychology of Psychometrics
03-Salkind (Tests) 4749.qxd 7/5/2005 10:04 PM Page 58

investigating, the more likely the sample is representative andreliable. This is especially true for achievement tests.
• Delete unclear items, because some people will respond inone way and others will respond in a different fashion, regard-less of their knowledge, ability level, or individual traits.
• For achievement tests especially (such as spelling or historytests), moderate the easiness and difficulty of tests, becauseany test that is too difficult or too easy does not reflect anaccurate picture of one’s performance.
• Minimize the effects of external events and standardize direc-tions. If a particularly important event—such as Mardi Grasor graduation—occurs near the time of testing, postpone anyassessment.
JUST ONE MORE THING (AND IT’S A BIG ONE)
The first step in creating or using an instrument that has soundpsychometric (how’s that for a big word?) properties is to establishits reliability (and we just spent some good time on that).
Why? Well, if a test or measurement instrument is not reliable,is not consistent, and does not do the same thing time after timeafter time, it does not matter what it measures (and that’s themother of all validity questions), right?
But the real reasoning is as follows.Let’s say you are looking at the effects of X on Y and you create
some test to measure Y. If the test that you create is not reliable,how can you ever know that X actually caused any change you seein Y? Perhaps the change was just due to random variation anderror and nothing related to X. And, if there is no change in Y, howdo you know it’s not due to a poorly constructed and developedtest rather than the fact that X has no effect?
This is not easy stuff and takes thoughtfulness on the part of thepractitioner as well as the consumer. Know whether or not yourtest is unreliable, what kind of reliability is important given thepurpose of the test, and how to increase it if necessary.
SUMMARY
Reliability of test instruments is essential to good science no matterwhat you are studying. You’ve learned about several ways that
Chapter 3 ♦ Getting It Right Every Time: Reliability and Its Importance 59
03-Salkind (Tests) 4749.qxd 7/5/2005 10:04 PM Page 59
reliability can be established. Now it’s time to move on and look atreliability’s first cousin, validity, and discuss what validity is essen-tial and how it is established.
TIME TO PRACTICE
1. Go the library and find five articles from journals in your field or discipline that doempirical research where data are collected and hypotheses are stated. Nowanswer these questions:a. What types of reliability coefficients are appropriate for each of the five articles?b. How many of these articles discuss the reliability of the measures that are being
used?c. If information about the reliability of the measures is not discussed, why do you
think this is the case?
2. Dr. Stu has already created an ability personality test that he finds to be highlyunreliable, and he knows that unreliability is usually due to method or trait error.Name three potential sources of each of these kinds of error and speculate on howthey might be eliminated or decreased.
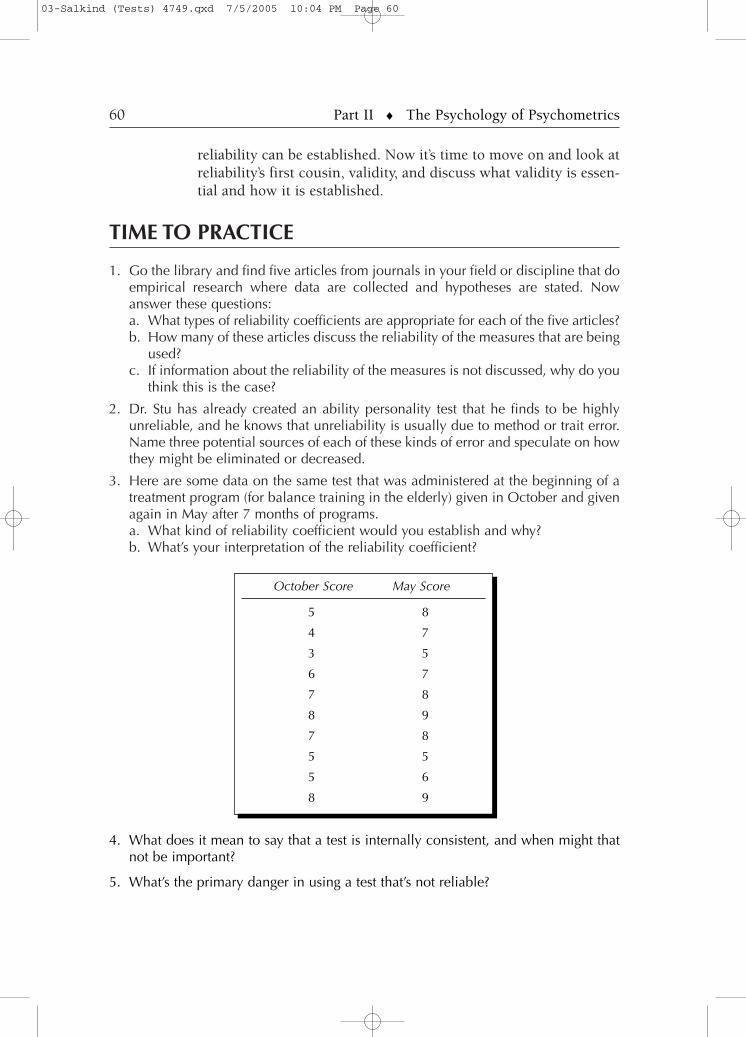
3. Here are some data on the same test that was administered at the beginning of atreatment program (for balance training in the elderly) given in October and givenagain in May after 7 months of programs.a. What kind of reliability coefficient would you establish and why?b. What’s your interpretation of the reliability coefficient?
60—— Part II ♦ The Psychology of Psychometrics
October Score May Score
5 8
4 7
3 5
6 7
7 8
8 9
7 8
5 5
5 6
8 9
4. What does it mean to say that a test is internally consistent, and when might thatnot be important?
5. What’s the primary danger in using a test that’s not reliable?
03-Salkind (Tests) 4749.qxd 7/5/2005 10:04 PM Page 60
ANSWERS TO PRACTICE QUESTIONS
1. You’re on your own on this one, but be sure to find articles in your own disciplineand those you find of interest.
2. For method error, we mighta. have a poorly reproduced test (change the toner in the copy machine)b. be in a room that’s too cold (raise the thermostat)c. be trying to work on a computer that won’t boot (use a different computer)
For trait error, we might
a. party too late for too long (don’t)b. fail to study (don’t)c. study with the wrong study group (duh!)
3.a. Test-retest reliabilityb. The resulting coefficient is .82, pretty high and certainly indicating that there is
a significant and strong correlation between the two testings and, hence, test-retest reliability.
4. A test is internally consistent when it “speaks with one voice.” That is, the itemstend to measure the same construct, idea, or information. It is important when thegoal of the test is to measure one, and only one, idea, construct, or thing.
5. If the test that you use is unreliable, you’ll never know if it’s valid (how can some-thing do what it is supposed to do if it cannot do it consistently?). And, yourhypothesis is never fairly tested. You never know if the hypothesis is supportedbecause the instrument you use is unreliable and the results are untrustworthy.
WANT TO KNOW MORE?
Further Readings
• Winstanley, M. R. (2004). The relationship between intimacyand later parenting behaviors in adolescent fathers. DissertationAbstracts International: Section B: The Sciences and Engineering,64(11B), 5822.
This study demonstrates how the lack of reliability threatensthe value of a study’s results.
Chapter 3 ♦ Getting It Right Every Time: Reliability and Its Importance 61
03-Salkind (Tests) 4749.qxd 7/5/2005 10:04 PM Page 61
• Eckstein, D., & Cohen, L. (1998). The Couple’s RelationshipSatisfaction Inventory (CR51): 21 points to help enhance and builda winning relationship. Family Journal of Counseling and Therapyfor Couples and Families, 6(2), 155-158.
A hands-on example of using an instrument with establishedreliability.
And on the Internet
• You can find a discussion of the reliability, validity, and fairnessof classroom testing at http://www.ncrel.org/sdrs/areas/issues/methods/assment/as5relia.htm.
• And as a construct, reliability is very important as well whenapplied to different areas, such as the reliability of childwitnesses. Read more at http://abcnews.go.com/Technology/story?id=97726&page=1.
62—— Part II ♦ The Psychology of Psychometrics
03-Salkind (Tests) 4749.qxd 7/5/2005 10:04 PM Page 62